Article

Fundamental Characteristics and Kinetic Analysis of Lignocellulosic Woody and Herbaceous Biomass Fuels

1
School of Mechanical Engineering, Pusan National University, Busan 46241, Korea
2
Pusan Clean Coal Center, Pusan National University, Busan 46241, Korea
*
Author to whom correspondence should be addressed.
Energies 2019, 12(6), 1008; https://doi.org/10.3390/en12061008
Submission received: 8 January 2019 / Revised: 7 March 2019 / Accepted: 11 March 2019 / Published: 15 March 2019
(This article belongs to the Special Issue Biomass Chars: Elaboration, Characterization and Applications III)

Abstract

:
Biomass fuels are increasingly being viewed as viable alternatives for energy production in biomass-fired power plants and coal-fired power plants, which aim to employ co-firing technologies to achieve CO2 emission reductions. In this study, wood pellets (woody biomass) and kenaf (herbaceous biomass) were fully characterized in terms of their elemental compositions, pyrolysis, and char oxidation kinetics. Kinetic parameters were obtained through the application of the multi-Gaussian distributed activation energy model (DAEM) and Kissinger equation. Analyses of the ash indicated that, unlike coal, the biomass fuel is mostly composed of metal oxide ash. The calorific values of wood pellets were slightly higher than those of kenaf. Detailed kinetic analyses are presented so that steps can be taken to combust the biomass fuels in power plants. The kinetic data suggested that the mechanism for the char oxidation of wood pellets may be more complex than that for kenaf. In summary, these torrefied and pyrolyzed materials were found to represent potentially useful biomass fuels.

1. Introduction

Recent energy policy developments in Korea have been focused on decommissioning nuclear power plants and phasing out coal. The coal phase-outs involve the decommissioning of old power plants and re-powering projects rather than the complete elimination of coal power plants, and investments are being made in regard to fuel conversion technology that will enable the utilization of renewable energy from the perspective of economic base loads. As of 2017, coal-fired power plants in Korea continue to represent the most crucial means of power generation, and these plants contribute to 31.6% (36.9 GW) of the total power generation capacity. Compared to 2015 when coal-fired power plants were responsible for over 40% of the power generation, the enforcement of the Renewable Energy Portfolio Standard (RPS) enacted in 2012 has driven many of the domestic coal-fired power plants to switch to a partially mixed form of coal and biomass for the acquisition of renewable energy certificates (REC), in following the Paris Agreement and its goal of CO2 emission reductions; presently, the use of biomass in coal-fired power plants is anticipated to increase further [1,2]. In other words, it seems inevitable that the use of biomass fuel in coal-fired power plants will expand, and thus, there is a need to investigate the characteristics of biomass fuel.
To illustrate, the Korea South-East Power Co. (KOEN) (Jinju, Korea) replaced YeongDong unit #1 (YD #1) (Yeongdong, Korea), a 200 MW anthracite coal power plant that has been in operation for 44 years since its establishment in May 1973, with a 125 MW biomass-fired boiler. As such, KOEN carried out the replacement of the old facility and the fuel conversion process so as to increase the installed life and be responsive to the RPS system while preparing a response framework for CO2 emission rights, thereby setting an example for the fuel conversion of coal-fired power plants in Korea. Nonetheless, biomass-fired boilers, including the system at YD #1, inevitably have experienced problems caused by the characteristics of biomass, the most common ones being the low calorific values due to the high inherent moisture of biomass and the low pulverization potential; moreover, considerable difficulty is associated with predicting the combustibility of biomass because of its unique characteristics that differ from carbonaceous solid fuels, exhibiting a high degree of carbonization [3,4].
To improve fuels with high inherent moisture, low calorific values, and low pulverization potentials, recent trends in biomass research have focused on torrefaction technology, which may provide a solution to some extent. Torrefaction is also referred to as mild pyrolysis as it takes into account the pyrolysis temperature range for the three main polymers, namely, cellulose, hemicellulose, and lignin, that make up the chemical components of biomass, and it involves carrying out pretreatment steps for each component at its respective pyrolysis temperature to facilitate the production of torrefied fuel. Through torrefaction, the surface of biomass with a pronounced distribution of hydrophilic functional groups turns hydrophobic, thus making it difficult for moisture adsorption to occur, which decreases the inherent moisture. The pretreatment process also assists with biomass pulverization via the destruction of its organic structure for higher effectiveness, and it mediates the devolatilization of a certain amount of volatile gases to increase the fixed carbon, thus resulting in increased calorific values [5,6,7]. Since torrefaction technology fundamentally depends on the pretreatment process under pyrolysis conditions for the production of carbon-rich fuels, it is essential that the basic pyrolysis characteristics of the biomass fuel are thoroughly understood through in-depth analyses of the biomass pyrolysis [8,9,10,11].
In an ideal pulverization scenario, the pulverized coal takes on a form approximating a sphere with fine porosity. The microporous structure is negligible in graphite with a high degree of carbonization, but as the carbonization degree decreases from anthracite coal to bituminous coal, subbituminous coal, then to lignite, the microporous structure exhibits a more evolved form, and when devolatilization is complete, the microporous structure in char exhibits an even more evolved form that makes a substantial contribution to the specific surface reactivity. As such, in contrast to coal, with a solid fuel with a spherical, porous structure, the biomass fuel is composed of fibers whose characteristics of specific surface development deviate from coal with a high degree of carbonization. Thus, the results of analyses with such fuels may differ greatly from the characteristics of char oxidation obtained with conventional carbon-based solid fuels [12,13].
In this study, a type of lignocellulosic woody biomass that has been widely used, an available form of biomass, and a type of herbaceous biomass whose use has recently soared were selected for further analyses. To help to widen the scope for application of the lignocellulosic woody and herbaceous biomass in the field of power generation, the pyrolysis behaviors of the biomass were analyzed in detail by focusing on the basic physical properties and thermal reaction characteristics of the biomass and applying the multi-Gaussian distributed activation energy model (DAEM). Furthermore, by examining the char oxidation rate, the fundamental characteristics and thermal behaviors of the biomass were comprehensively analyzed with the Kissinger equation.

2. Materials and Methods

2.1. Biomass Sample Preparation

To compare the characteristics of the lignocellulosic woody and herbaceous biomass, wood pellets were selected as the representative woody biomass material, and kenaf was selected as the representative herbaceous biomass material. For wood pellets, the ones produced in Vietnam that account for over 70% of wood pellet imports in Korea were used. Virtually all imported amounts of wood pellets are consumed as fuel in Korean power plants. Kenaf (Hibiscus cannabinus L.) is a subtropical plant with a large scope of use as an industrial material. It is also the most widely used plant in phytoremediation applications, as it exhibits over 5 times greater CO2 absorption rates than general crops [14].
The biomass used in this study was dried and pulverized using a vibratory disc mill (RS 200, Retsch GmbH, Haan, Germany), after which it was separated using a sieve shaker (AS 200, Retsch GmbH, Haan, Germany) for particle sizes of 75–90 μm. The biomass char was prepared under a nitrogen atmosphere and heated up to 950 °C with a 10 °C/min heating rate using a commercial thermogravimetric analyzer (TGA 701, LECO Co., St. Joseph, MI, USA) and maintaining the material under the preparation conditions until the weight loss rate measured at a level below 1%/min.

2.2. Biomass Sample Analysis

Approximately 5 g of sample was analyzed in the proximate analysis carried out with the thermogravimetric analyzer (TGA 701) (LECO Co., St. Joseph, MI, USA) based on the American Society for Testing and Materials (ASTM) D3172 method. The values of the ultimate analysis were obtained using a commercially available device (Leco-TruSpec Micro CHNS, LECO Co., St. Joseph, MI, USA). For the oxide analysis, the biomass ash was measured using an X-ray fluorescence (XRF) spectrometer (S8 TIGER, Bruker, Karlsruhe, Germany) based on the ASTM D4326 method.
The ash fusion temperature (AFT) was measured using the thermomechanical analysis (TMA) device designed and produced by the Pusan Clean Coal Center (PC3) at Pusan National University [15]. A schematic diagram of the TMA device is given in Figure 1. The TMA device is composed of a heating chamber and a penetrating rod, as well as a ram, crucible, linear variable differential transformer (LVDT), and thermocouple. An ash sample can be heated up to 1600 °C through the vertical tube heating furnace that controls the specific calorific value. The amount of ash used in each experiment was approximately 200 mg. The 60 g penetrating rod was connected to a weight in order to maintain the weight balance between the rod and the sample weight. In this study, the wood pellet and kenaf ash samples were heated from room temperature up to 1600 °C with a 5 °C/min heating rate. The temperature at which 25% of the total displacement variation occurred was defined as T25, and based on the same logic, T50, T75 and T90 temperatures were also measured.
To detect the elements in the biomass samples, a commercially available analyzer (Optima 8300, Perkin-Elmer, Norwalk, CT, USA) was used in conjunction with an inductively coupled plasma-optical emission spectrometer (ICP-OES; KBSI Gwangju Center). The prepared sample was mixed with 5 mL nitric acid and 5 mL hydrogen peroxide, and then, the mixture was placed in a microwavable container for pretreatment in equipment set at 800 W of power and 180 °C; this involved two consecutive runs of 15 min and 10 min. Next, the mixture was washed with distilled water, and 0.3–0.35 g of sample was mixed with 4 mL hydrogen peroxide and left overnight. Then, 7 mL of 70% nitric acid was added for microwave digestion, followed by pretreatment at 800 W, 200 °C for two consecutive runs of 15 min and 15 min. Next, 50 μL of 49% hydrofluoric acid was added, and lastly, the sample was washed with distilled water to make it ready for the analyses.

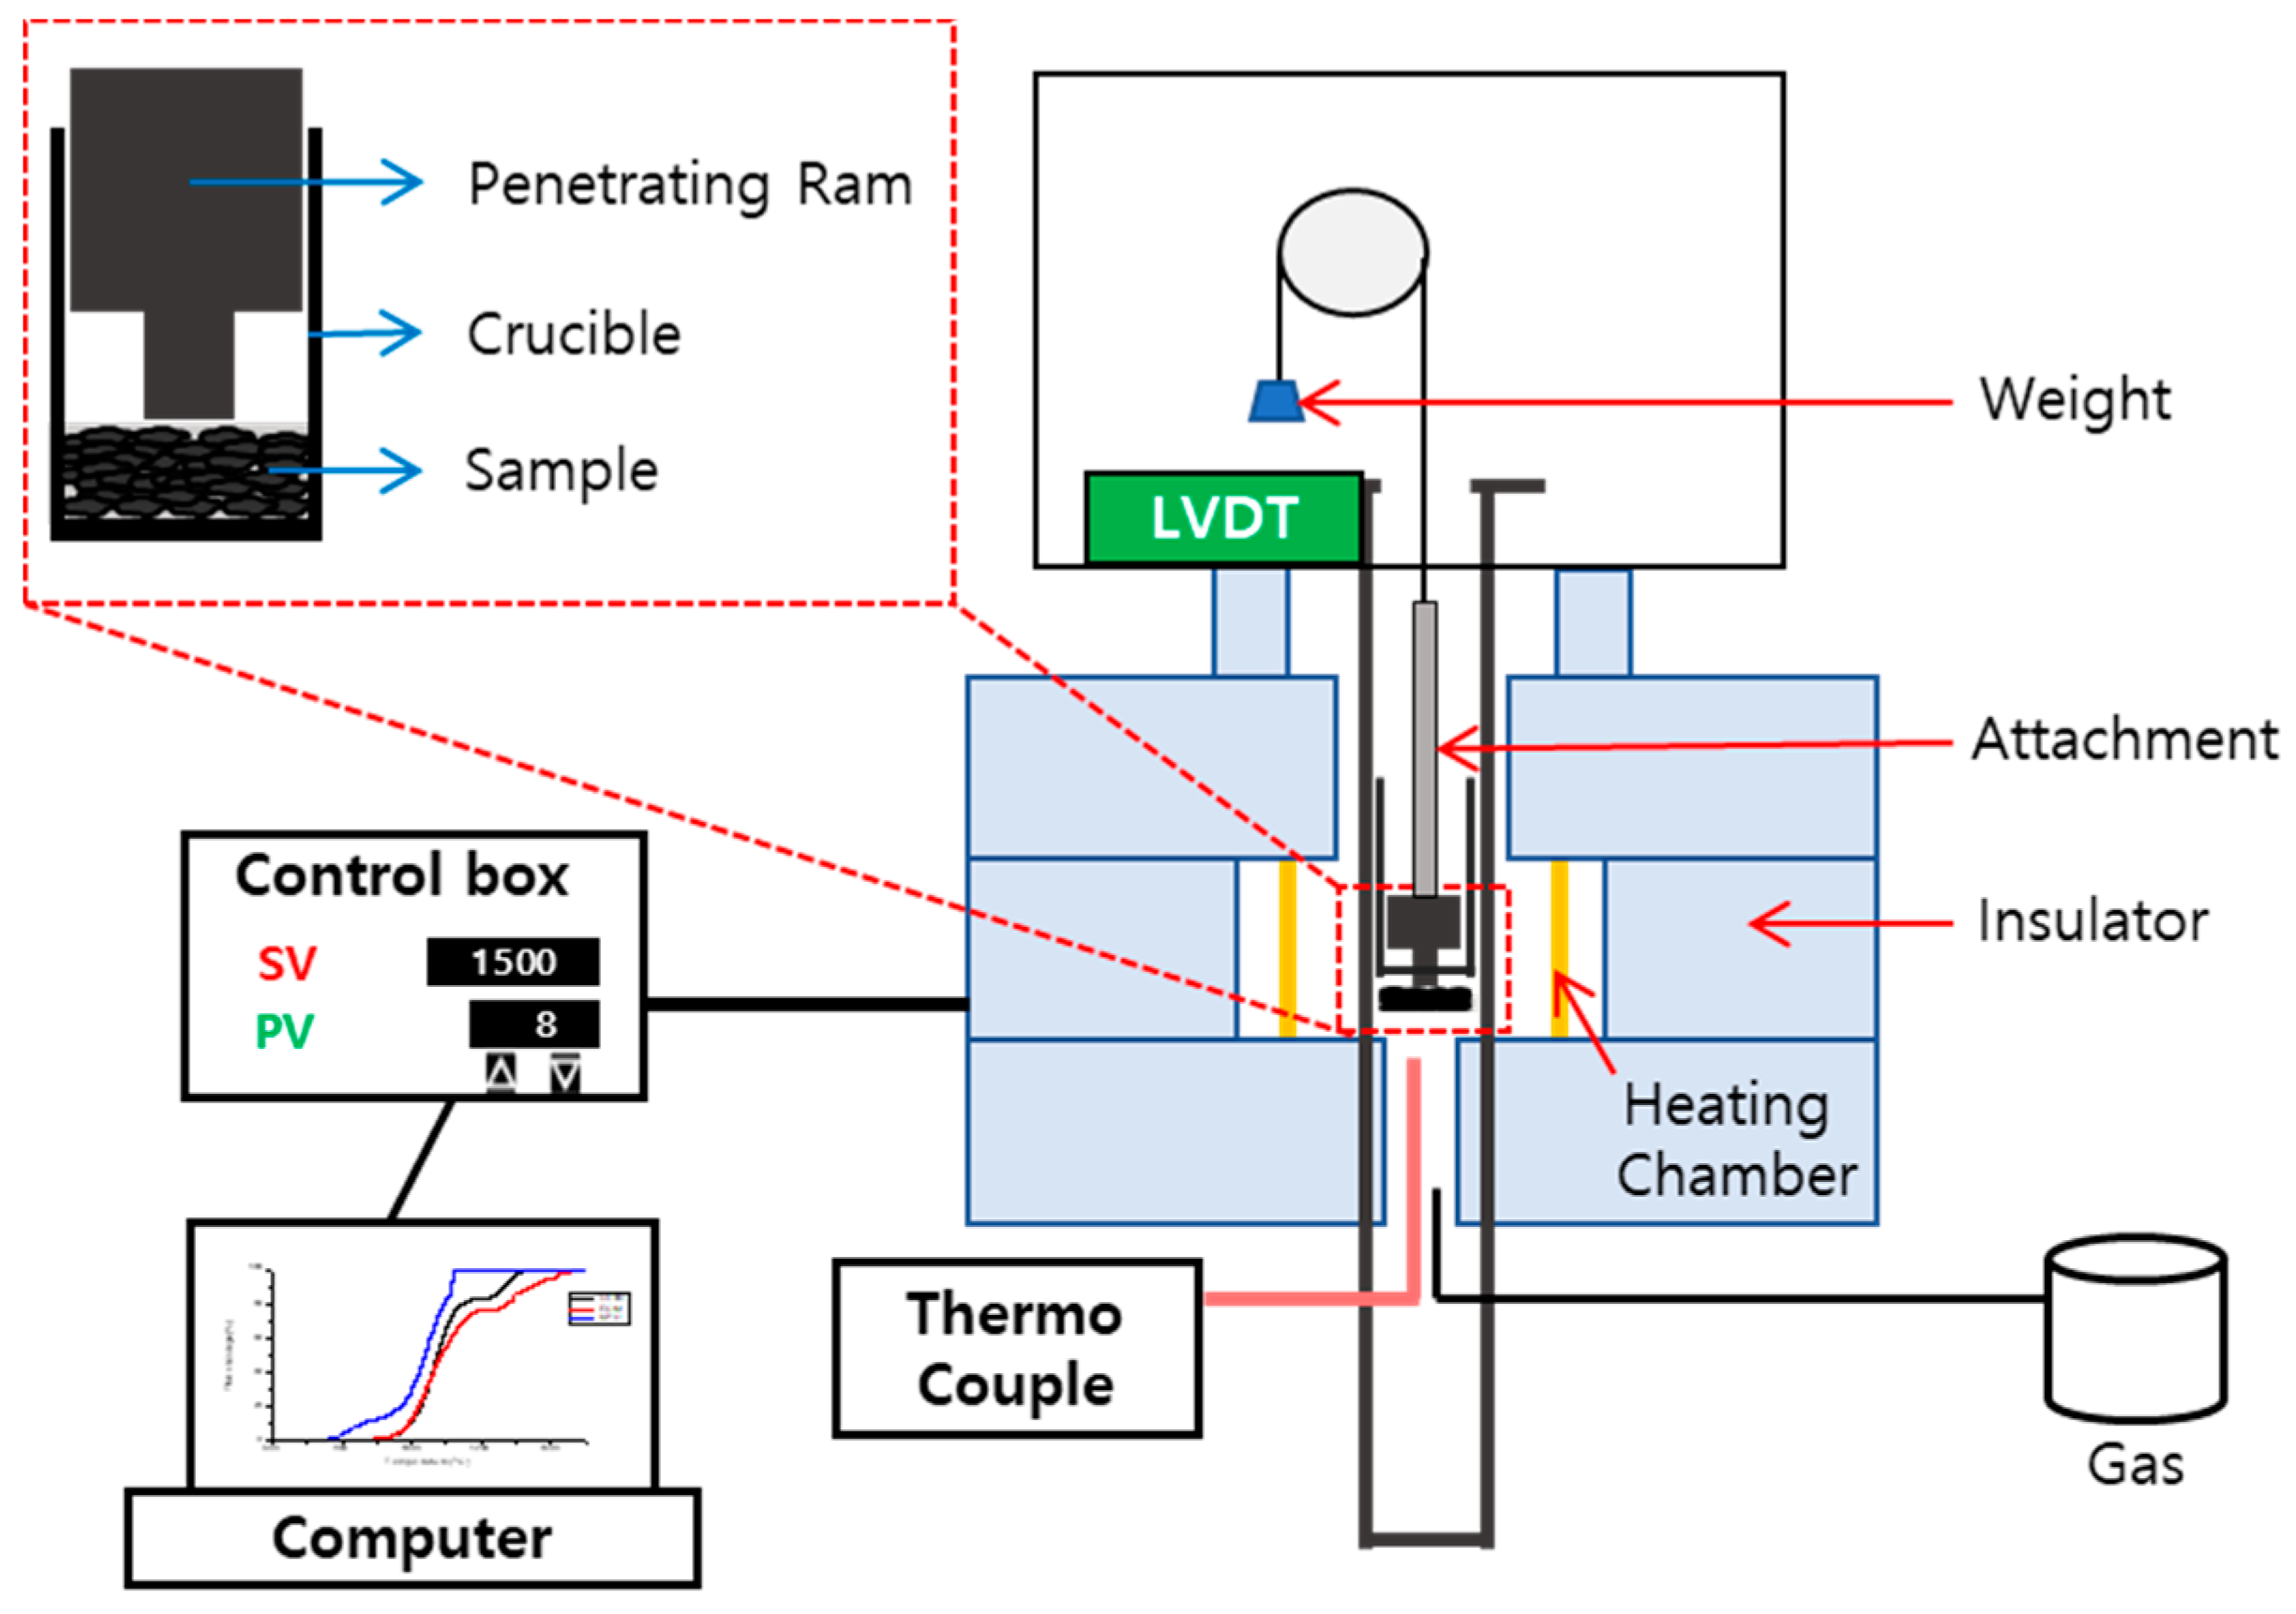
2.3. Thermogravimetric Analysis

To investigate the pyrolysis behaviors of the biomass, a commercially available thermogravimetric analysis (TGA) system (SDT Q600, TA Instruments, New Castle, DE, USA) was used, and the mass reduction curves for biomass pyrolysis were obtained. This experiment used approximately 15 mg of biomass, and by introducing nitrogen at a 100 mL/min flow rate, an inert atmosphere was created. The temperature was raised up to 950 °C with a 10 °C/min heating rate to complete the experiment. The biomass pyrolysis domains were divided into separate intervals to reflect the characteristics of each biomass sample, and for estimating the simple kinetics for each interval, a single first-order reaction model was used to deduce the activation energy and frequency factor [16]. Under non-isothermal conditions, the equation for estimating the solid fuel pyrolysis kinetics can be expressed as:
d α d T = A β exp ( E R T ) f ( α ) ,
where T is the absolute temperature, α is the extent of biomass conversion, β is the heating rate, R is the universal gas constant, E is the activation energy, and A is the frequency factor.
The conversion extent α of the biomass fuel can be determined based on:
α = w 0 w t w 0 w f = Δ w Δ w f ,
where w 0 is the initial weight of the biomass sample, w t is the weight of the biomass sample at time t, and w f is the final weight at the end of the reaction.
The differential conversion function is expressed as:
f ( α ) = ( 1 α ) n ,
where n is the reaction order; n = 1 was assumed in this study.
By using the simplifying temperature integral function with the Doyle integral approximate, Equation (1) can be rewritten as Equation (4) [17]:
ln ( 1 α ) = A E β R 0.00484 exp ( 1.0516 E R T ) .
The linear regression form of Equation (4) is given as:
ln ( ln ( 1 α ) ) = ln ( A E β R ) 5.3308 1.0516 E R T .
By using the above linear regression form, the activation energy and the frequency factor can each be deduced based on the gradient and the intercept of Y axis.

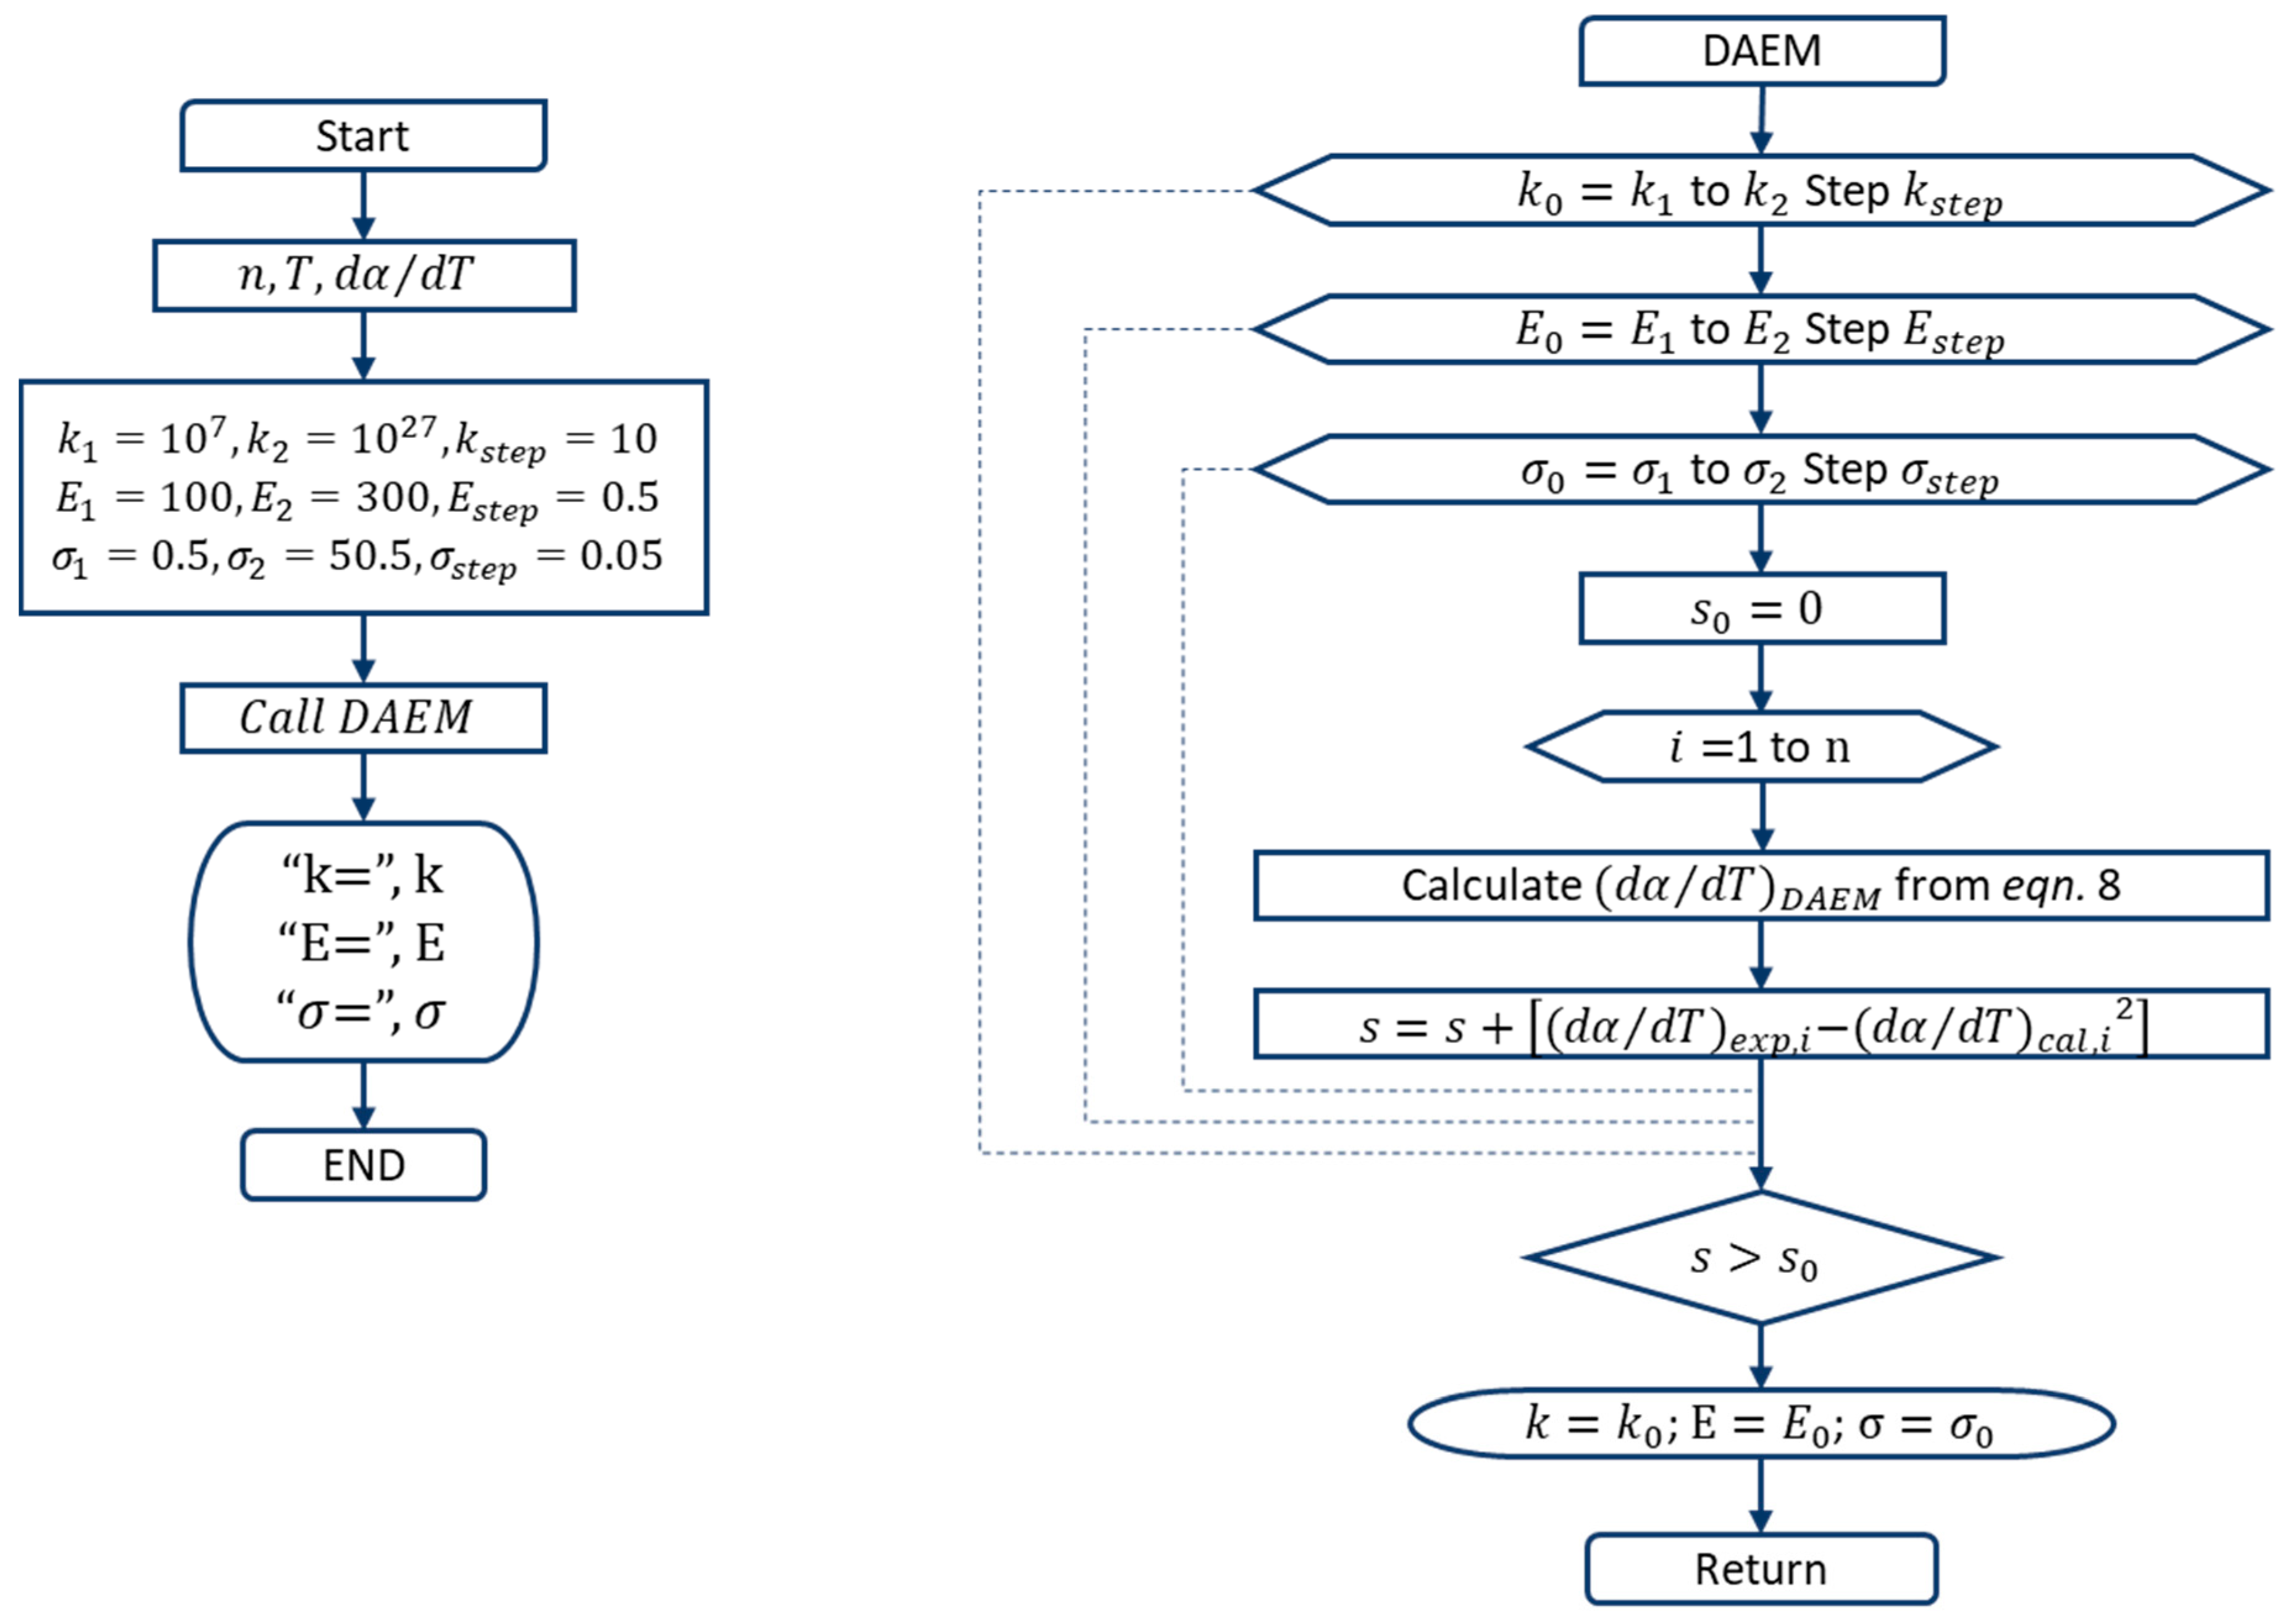
2.4. Multi-Gaussian Distributed Activation Energy Model

The DAEM involves a multiple parallel reaction process based on the assumption that the pyrolysis mechanism of solid fuels comprises a myriad of independent and parallel first-order reactions, each with its own activation energy. The components deduced from the pyrolysis behaviors were expressed by the parallel Gaussian distribution model, and the DAEM equation suggested in the work of Miura and coauthors is as shown below [18,19].
α ( T ) = 0 { 1 e x p [ k 0 β 0 T e x p ( E R T ) d T ] } f ( E ) d E .
Here, α is the extent of conversion, T is the absolute temperature, k 0 is the pre-frequency factor, β is the heating rate, E is the activation energy, and f(E) is a function of the activation energy distribution.
To estimate the kinetic parameters, the activation energy distribution was calculated using the equation for the Gaussian distribution based on the mean activation energy E 0 and standard deviation σ.
f ( E ) = 1 σ 2 π e x p [ ( E E 0 ) 2 2 σ 2 ] .
The derivative of Equation (1) obtained by applying Equation (7) is as shown below.
d α ( T ) d T = 1 σ 2 π 0 k 0 β e x p [ E R T k 0 β 0 T exp ( E R T ) d T ( E E 0 ) 2 2 σ 2 ] d E .
To deduce the optimal values for the kinetic parameters ( k 0 , E 0 , etc.), an objective function was defined as shown in Equations (9) and (10) below. By using the algorithm given in Figure 2, the DAEM of each biomass parameter was calculated.
F i t ( % ) = 100 × s n d ( d α d T ) m a x .
s = i = 1 n d [ ( d α d T ) e x p , i ( d α d T ) c a l , i ] 2 .

2.5. Char Oxidation Kinetics

To deduce the reaction rate for biomass char, the non-isothermal mass reduction curve was obtained according to the combustion reaction of biomass char up to 950 °C while changing the heating rate from 5, 10, 20 and 30 °C/min in the air. Here, the reaction rate of char oxidation was taken into account by using the Kissinger equation that assumes the activation energy can be obtained regardless of the reaction order when an appropriate linearity emerges during TGA while changing the heating rate [20].
d x d t = A c exp ( E c R T ) f ( x ) ,
ln ( q T p 2 ) = E c R ( 1 T p ) + ln ( R A c E c ) .
In Equation (11), x is the carbon conversion and E c is the activation energy for char oxidation. In Equation (12), q is the heating rate and T p is the temperature at which the reaction rate is the highest. Thus, the Kissinger equation produces a result from which a valid analysis can be drawn if the graph of ln ( q / T p 2 ) against 1 / T p displays appropriate linearity. Thus, the Kissinger analysis allows for the estimation of the mean activation energy for the overall reaction process regardless of the reaction order when T p for each different heating rate is known.

3. Results and Discussion

3.1. Biomass Sample Analysis

Table 1 summarizes the proximate, ultimate, and oxide analysis results, as well as the calorific values that were obtained using the methods described previously in Section 2.2. In the proximate analysis, the two biomass samples showed a prominent difference in ash content. The ash content of kenaf was approximately 2-fold that of wood pellets, whereas the moisture, volatiles, and fixed carbon did not show any significant differences. A similar trend was observed in the ultimate analysis results, where the two biomass samples displayed similar compositions except for the nitrogen content; specifically, the nitrogen content of kenaf was approximately 2-fold that of wood pellets. Analyses of the ash indicated that, unlike coal, the biomass fuel is mostly composed of metal oxide ash. In the case of wood pellets, a considerably high level of CaO was measured. In the case of kenaf, a considerably high level of Fe2O3 was measured, followed by a high level of CaO. Among the solid fuel ash, the total amount of the components with acidity (SiO2, Al2O3 and TiO2) was 3.61% and 8.05% for wood pellets and kenaf, respectively. The B/A ratio (Base to Acid ratio), an indicator of ash slagging, showed that the base ash component was present in higher amounts than the acid ash component so that the risk of slagging may be determined to be more serious. From this, it can be inferred that the ash of biomass has its point of fusion at a low temperature. Both the lower heating value (LHV) and higher heating value (HHV) were measured at higher levels for wood pellets than kenaf, and the calorific value of wood pellets was approximately 320 kcal/kg higher than that of kenaf based on the HHV.
Among the values measured by the TMA device, T25 indicates the temperature at which 25% shrinkage appears, i.e., the temperature where ash softening and sintering produces a liquid phase amounting to approximately 25%. T50 indicates the temperature at which ash fusion results in 50% shrinkage, where approximately 60% (±15%) of the fusion occurs. At the temperature T75, over 80% of the fusion occurs, and this is considered to represent the point of complete fusion. T90 represents the temperature where the last step of fusion occurs (molten phase >90%), and it is indicative of flow (fluid flow) behavior during ash slagging. Table 2 summarizes the ash fusion behavior in the biomass samples analyzed by the TMA device. In line with the inferences drawn from the results of the oxide analysis, the temperature at which the fusion began was considerably low for biomass fuel compared to that for the ash of coal, a solid fuel.
Table 3 presents the results for the detection of 19 elements in the biomass samples by the ICP-OES analysis, and the wavelength selections are also summarized in this table. The results of the oxide analysis were deduced by using the previously described XRF analysis material, where the ash powder was simply used in a nondestructive assay. By contrast, the ICP-OES analysis used samples after the steps of dissolution and dilution, which may have resulted in the incurrence of errors [21]. The ICP-OES analysis results depend on the characteristics of the pretreated samples, where the acid solubilities of the elements in the biomass samples not only display inconsistency, but also pose difficulty for analyzing the levels of dissolution, and this may have thus produced some negative errors. Nevertheless, the ICP-OES analysis was needed to detect the trace elements that cannot be detected using the XRF technique, and among the trace elements with toxicity, namely, Pb, As, Cd, and Hg, neither As nor Cd was detected by the XRF analysis in the two biomass samples. For wood pellets subjected to the ICP-OES analysis, however, Pb was not detected, whereas for kenaf, a relatively high value of 25.8 ppm was detected. Although not shown in the table, in the case of mercury, Hg, wood pellets contain 6.8 ppb and kenaf contains 10.2 ppb. All elements detected by the ICP-OES analysis showed identical trends with the results of the oxide analysis.

3.2. Thermogravimetric Analysis

Thermogravimetry (TG) and derivative thermogravimetry (DTG) curves at pyrolysis conditions are shown in Figure 3. What can be inferred from the mass reduction curves is that although the trend in mass reduction was similar for both wood pellets and kenaf, the overall pyrolysis tended to occur more rapidly at a lower temperature for kenaf. The DTG curves show that several components in each biomass sample had undergone decomposition at pyrolysis conditions. Such components in the TGA were assumed to be pseudocomponents, as their chemical identity could not be determined accurately. For wood pellets, the DTG curve revealed peaks for three pseudocomponents, while for kenaf, four pseudocomponents were assumed from the peaks. According to a previous study, it is known that for the woody biomass of wood pellets, the first pseudocomponent pertains to the main peak of hemicellulose with a small amount of devolatilized lignin; the second pseudocomponent corresponds to the main peak of cellulose; and the third pseudocomponent corresponds to the main peak of lignin, in order from the lowest temperature [22,23,24,25]. Meanwhile, for the herbaceous biomass of kenaf, the first pyrolysis pseudocomponent pertains to the main peak of the devolatilized components of extractives, most of them being known as arabinoxylans [22,25]; the second pseudocomponent corresponds to the main peak of hemicellulose with a small amount of devolatilized lignin; the third pseudocomponent corresponds to the main peak of cellulose; and the fourth pseudocomponent corresponds to the main peak of lignin. In addition, each temperature domain was divided into intervals from 150 °C to the DTG peak temperature for each pseudocomponent, where the pyrolysis single first-order reaction model was applied up to 875 °C. The kinetic parameters deduced from the pyrolysis single first-order reaction model are presented in Table 4. In the low temperature domain, the activation energy and frequency factor for the pyrolysis were found to be higher than those for the high temperature domain, which could be expected because most pyrolysis occurs predominantly at a relatively low temperature across all comparatively set temperature domains. In the DTG graph, the largest value was obtained from the stage including Tmax with the highest mass reduction rate, as this is where the largest mass reduction occurred in regard to the frequency factor.

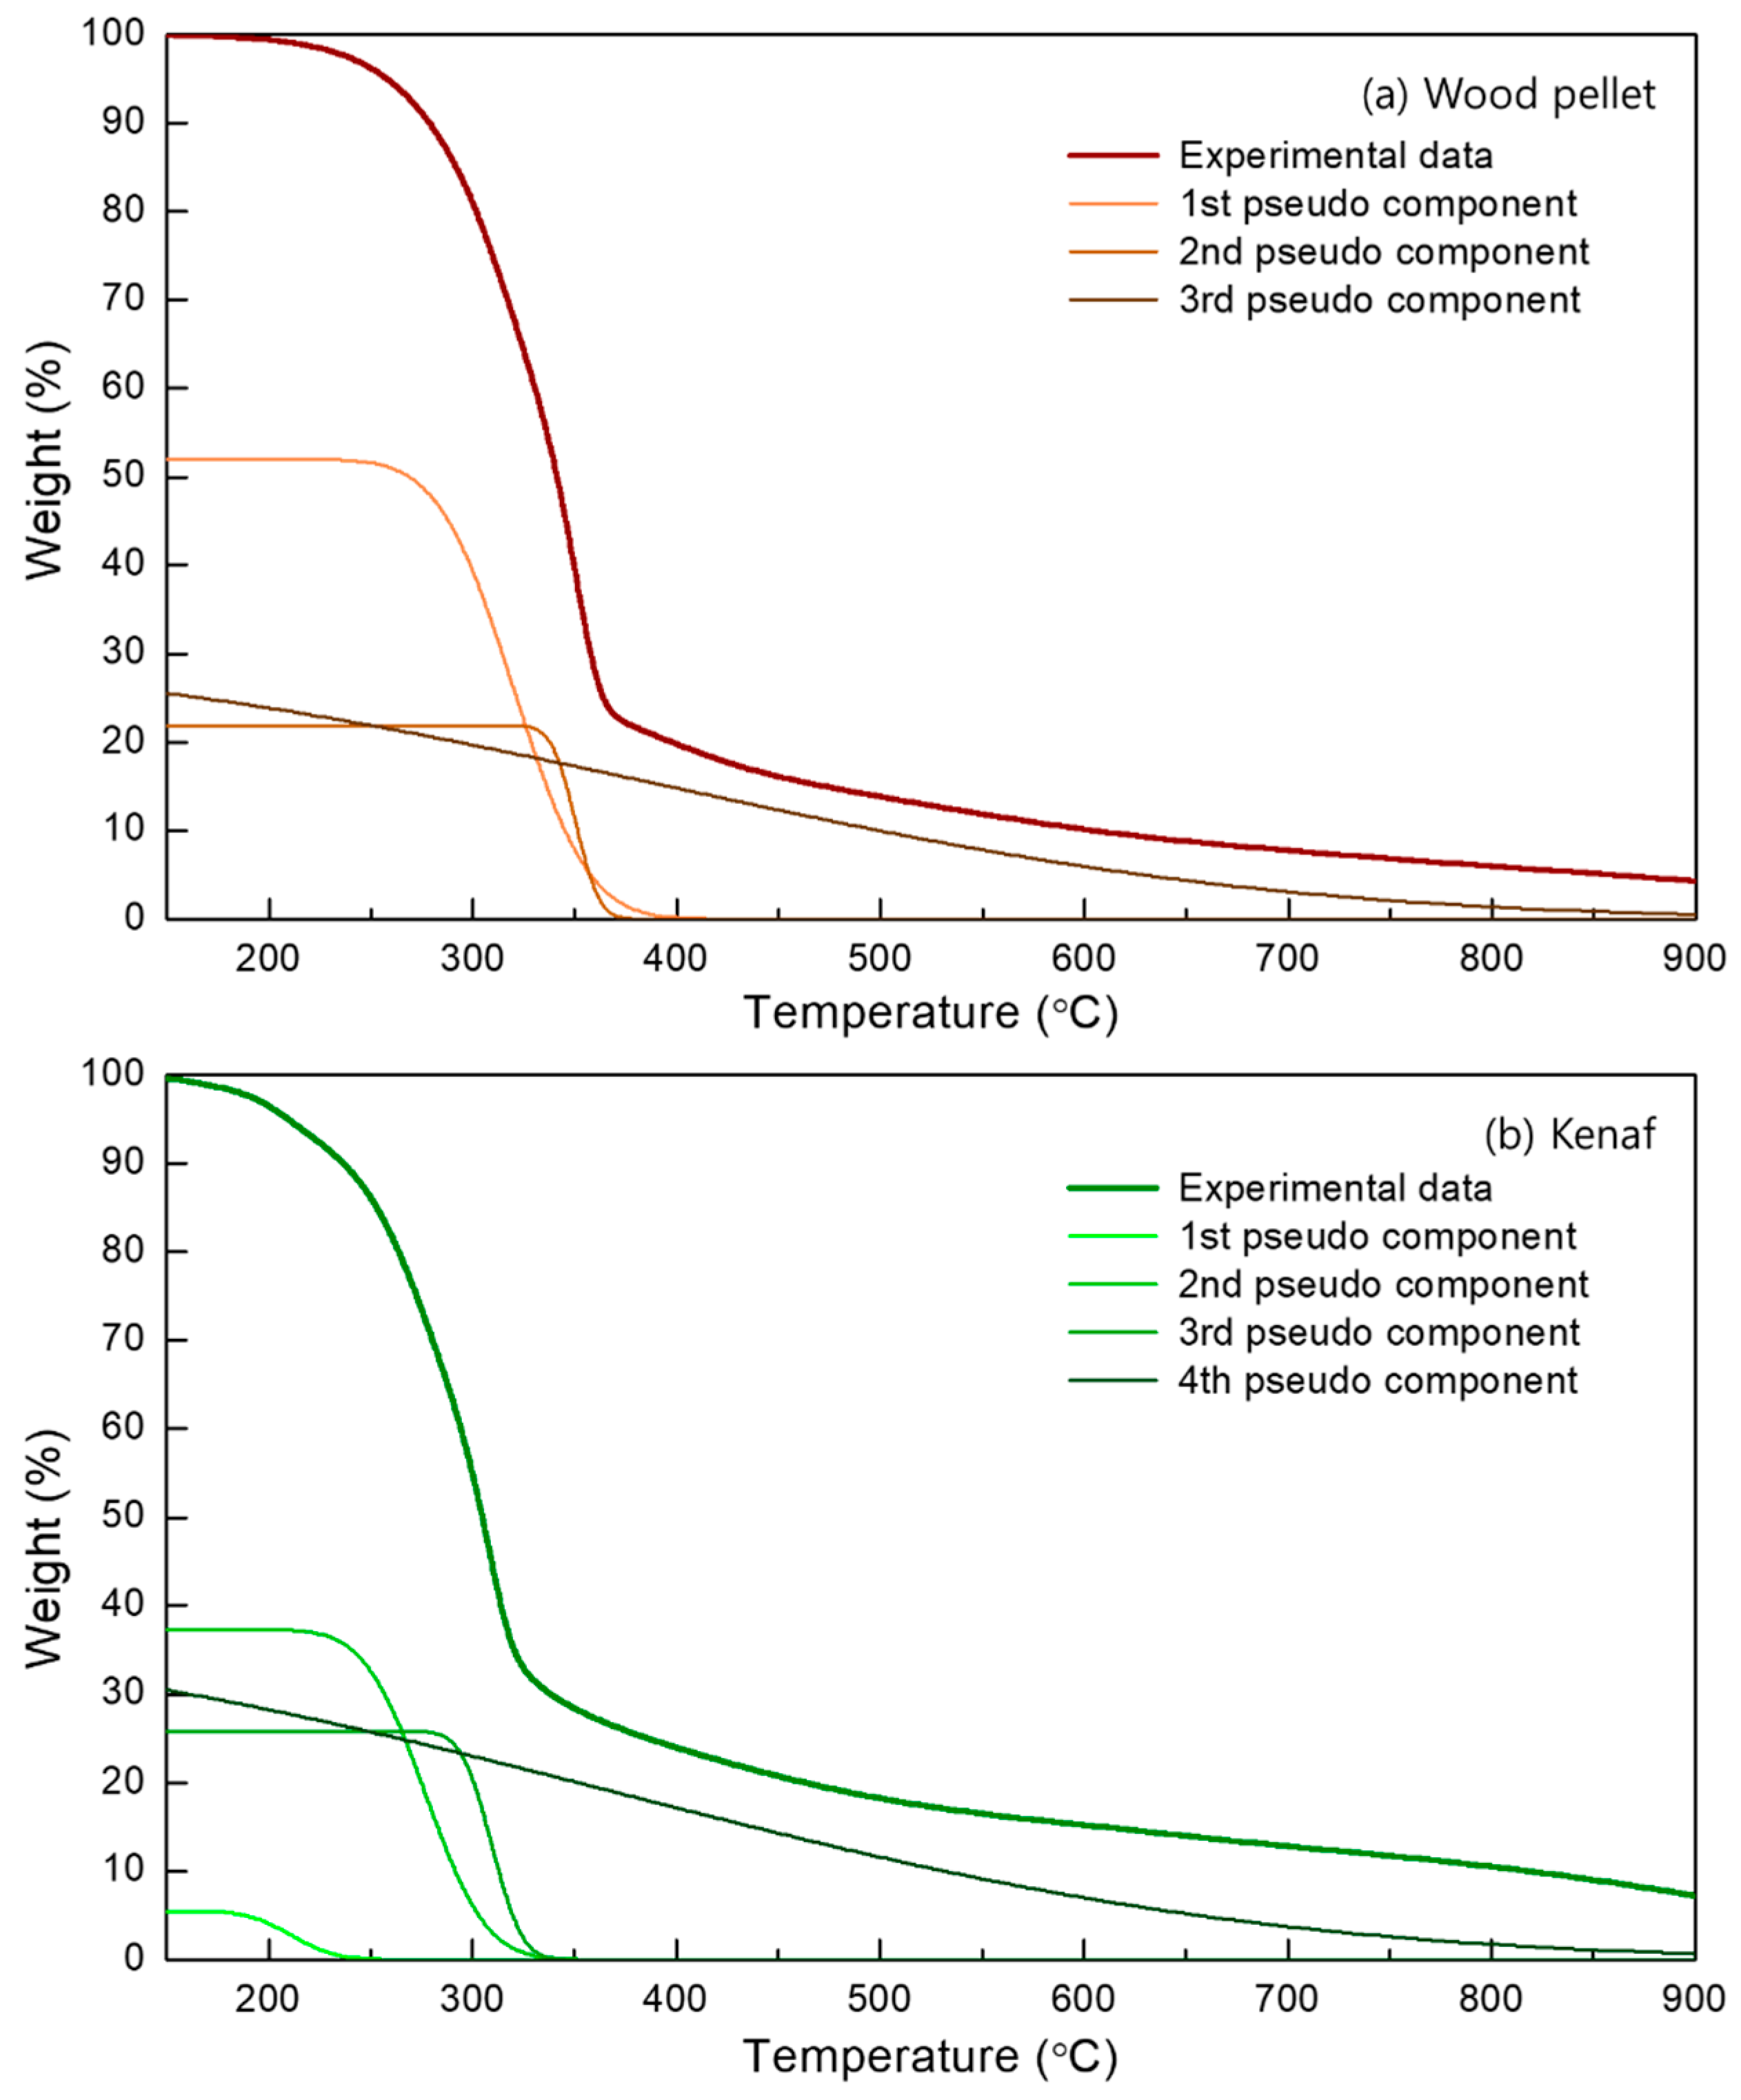
3.3. DAEM for Biomass Pyrolysis Kinetics

The DAEM was applied to the pseudocomponents previously mentioned in Section 3.2 in order to obtain the parallel descriptions of each independent pyrolysis reaction [26]. As shown in Figure 4, the pseudocomponents were calculated based on the DTG curves and, based on the reaction rate of each calculated pseudocomponent, the weight loss of the pseudocomponents was determined, as shown in Figure 5. For the pyrolysis reaction rate, an appropriate fit was observed between the calculated results and the experimental results, and the correlation coefficients for both wood pellets and kenaf were found to be greater than or equal to 0.99. In the case of the woody biomass of wood pellets, cellulose exhibited rapid decomposition at a relatively narrow temperature, while hemicellulose exhibited decomposition of a large amount at a lower temperature than cellulose. For lignin, an overall even decomposition across the temperatures from low to high was shown, and in terms of proportions, the weight undergoing pyrolysis for the first pseudocomponent (hemicellulose) was approximately 52%; that for the second pseudocomponent (cellulose) was approximately 21.8%; and that for the third pseudocomponent (lignin) was approximately 26.2%. In the case of the herbaceous biomass of kenaf, the results were different from those for wood pellets, as the four pseudocomponents were separated as discussed in Section 3.2. The first pseudocomponent (extractives) showed decomposition in a small amount prior to the decomposition of hemicellulose, and although a similar trend of decomposition to wood pellets was displayed by hemicellulose, cellulose, and lignin, the overall pyrolysis temperature range was lower. For kenaf, the proportion of weight undergoing pyrolysis was approximately 5.5% for the first pseudocomponent (extractives); approximately 37.3% for the second pseudocomponent (hemicellulose); approximately 25.8% for the third pseudocomponent (cellulose); and approximately 31.4% for the fourth pseudocomponent (lignin).
The f(E) for each pseudocomponent curve is shown in Figure 6, and the estimated component descriptions are summarized in Table 5. Notably, the activation energy seemed to range between 130 and 275 kJ/mol. According to a previous study, it is known that the activation energy of the solid fuel pyrolysis reaction as deduced by DAEM acquires reasonable significance within the range of 50 and 350 kJ/mol, thus lending support to the interpretation that the results in this study were reasonable. As Table 5 shows, the mean activation energy of each wood pellet component was 181.8, 190.7, and 203.2 kJ/mol for the main peaks of hemicellulose, cellulose, and lignin, respectively, and the mean activation energy of each kenaf component was 149.8, 169.2, 178.7 and 196.4 kJ/mol for the main peaks of extractives, hemicellulose, cellulose, and lignin, respectively; the σ of each component was 8.2, 0.8, and 32 kJ/mol for wood pellets, while for kenaf, it was 3.2, 6.4, 1.4, and 3.8 kJ/mol, respectively. The increase in σ signifies that the components were undergoing decomposition across a larger distribution of temperatures, and that the interval of the activation energy was greater for extractives than that for cellulose, followed by that for hemicellulose and lignin.

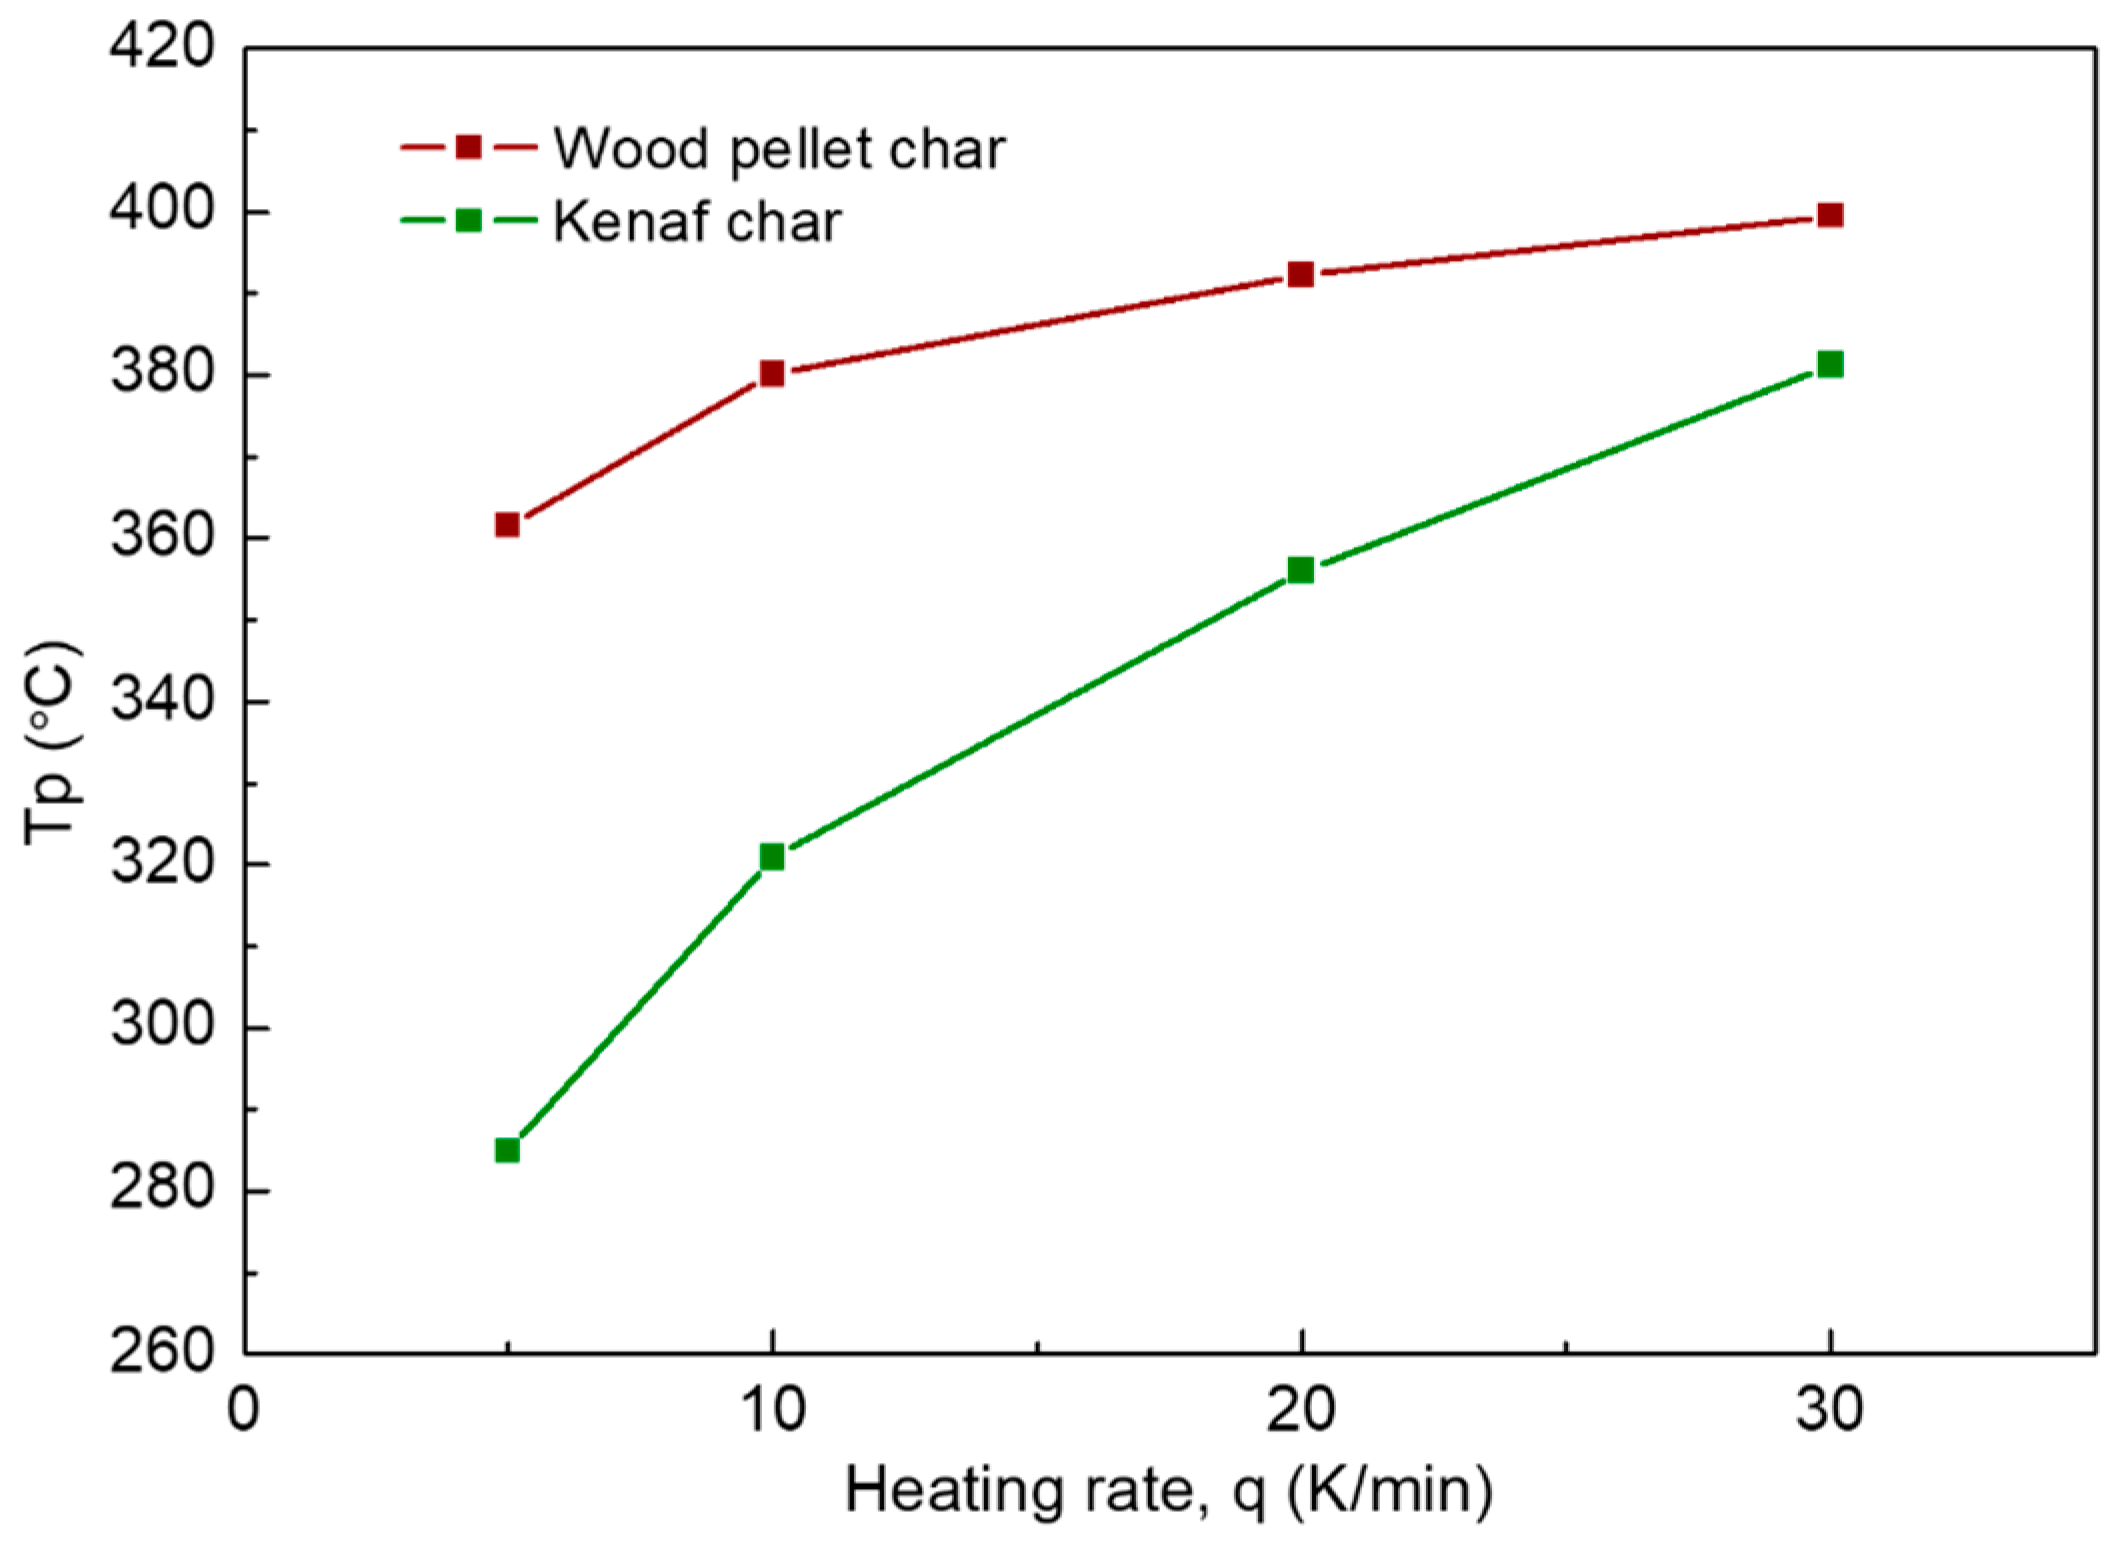
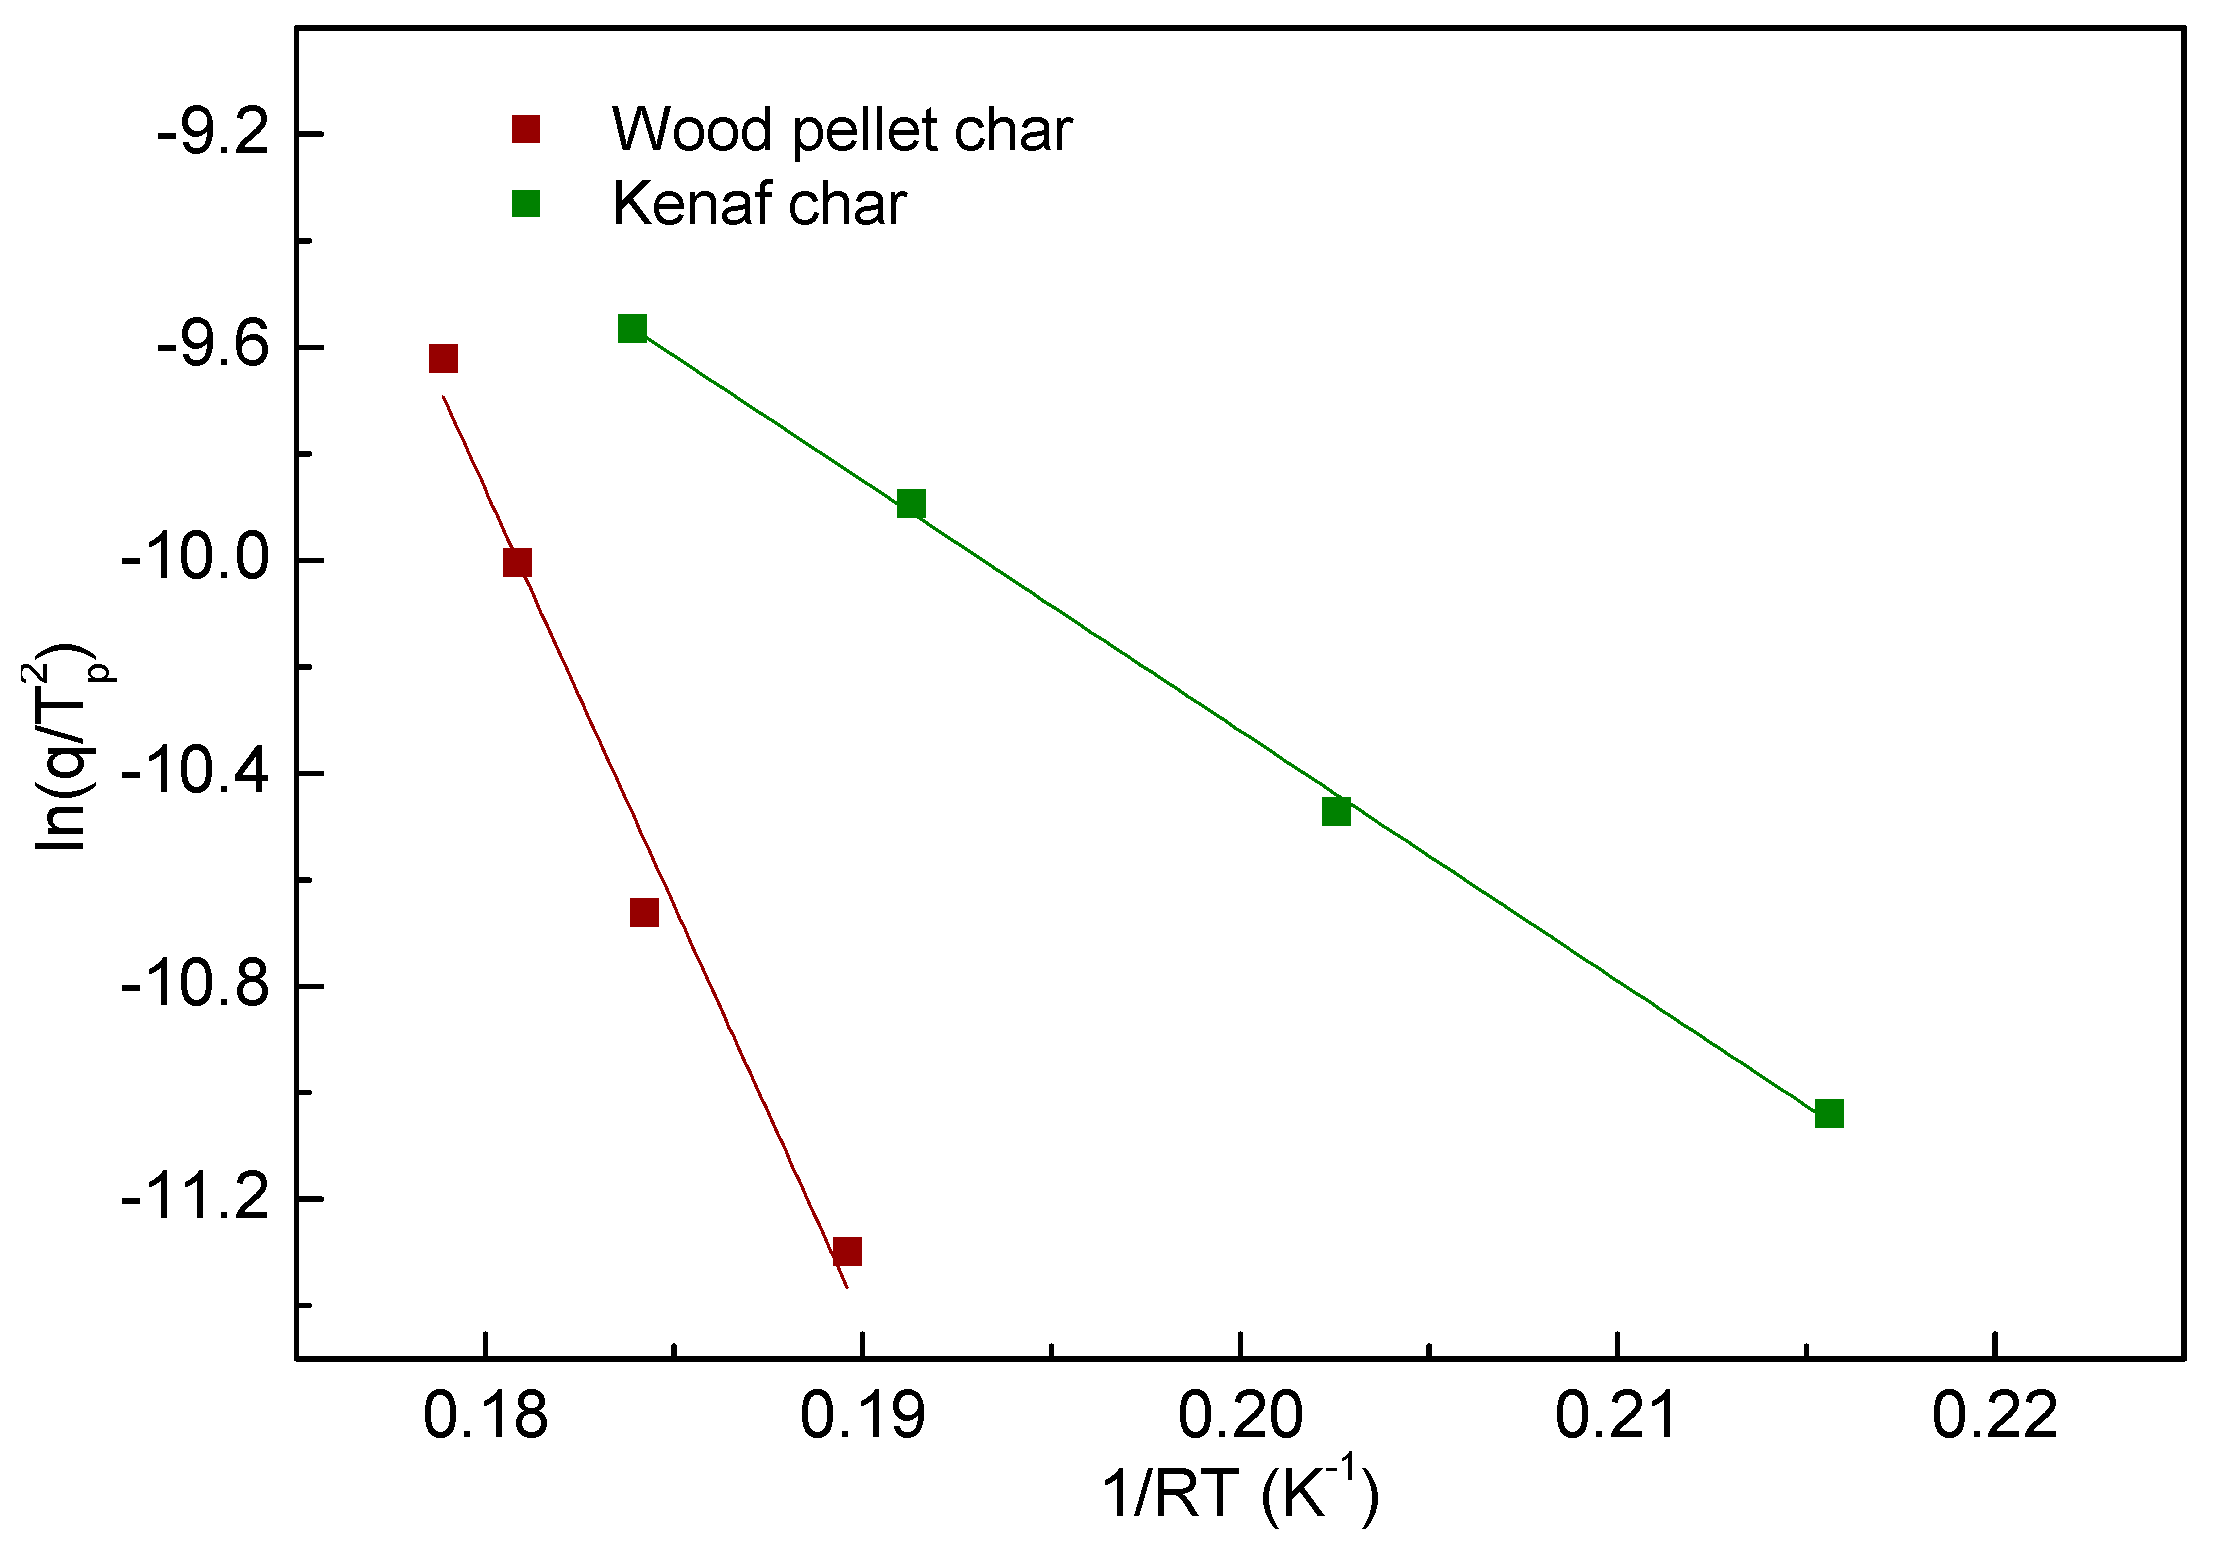
3.4. Kinetics Study of Biomass Char Oxidation

A graph showing the peak temperatures at the maximum reaction rate according to the heating rate obtained in the TGA is given in Figure 7. As shown, the peak temperature of the reaction rate for wood pellet char was higher than that for kenaf char overall, and the difference was reduced as the heating rate increased. In the case of wood pellet char, the char oxidation peak temperature showed reaction peak temperatures at 361.6, 380.1, 392.3 and 399.5 °C, in order from the lowest heating rate. In the case of kenaf char, the reaction peak temperatures occurred at 285.0, 320.9, 356.0 and 381.2 °C. The peak temperature of the reaction rate per set heating rate (5, 10, 20 and 30 °C/min) was used to produce plots of char conversion based on Equation (12), and the evidence for the valid analysis involving the Kissinger kinetic equation is provided by Figure 8, where appropriate linearity is shown between ln ( q / T p 2 ) and 1/RT for both wood pellet char (R2 = 0.9738) and kenaf char (R2 = 0.9983). These results can be seen in Figure 9 and Figure 10. The activation energy deduced from Figure 8 was 156.2 kJ/mol for wood pellets and 46.9 kJ/mol for kenaf, where wood pellets exhibited a significantly higher energy than kenaf. This is presumed to have been due to the physical structure of kenaf char, which was likely more accessible for the reactions than wood pellet char.
As Table 6 shows, the changes in activation energy were in agreement with the changes in char conversion. To examine the consequent differences in activation energy, char conversion values of 0.1, 0.3, 0.5, 0.7 and 0.9 were selected for estimating the activation energy. The changes in activation energy in the 0.1–0.3 char conversion range were the largest, followed by the rate of change immediately before the reaction was complete. In contrast to the mean activation energy deduced in Figure 8 as 156.2 kJ/mol and 46.9 kJ/mol for the wood pellets and kenaf, respectively, the mean activation energy for the set char conversion interval was 91.2 kJ/mol and 59.9 kJ/mol for the wood pellets and kenaf, respectively. This may lead to the conclusion that the reaction mechanism of char oxidation cannot be quantified as a single mechanism, and it implies that there is the potential for a more sophisticated mechanism for the char oxidation of wood pellets than that for kenaf.

4. Conclusions

The following conclusions can be drawn:
(1).
The proximate, ultimate, and oxide analysis results as well as the calorific values of the wood pellets and kenaf were obtained using the ASTM methods. Additionally, ash fusion temperatures of the biomass samples were successfully derived using TMA. The results for the detection of 19 elements in the biomass samples were observed by ICP-OES analysis.
(2).
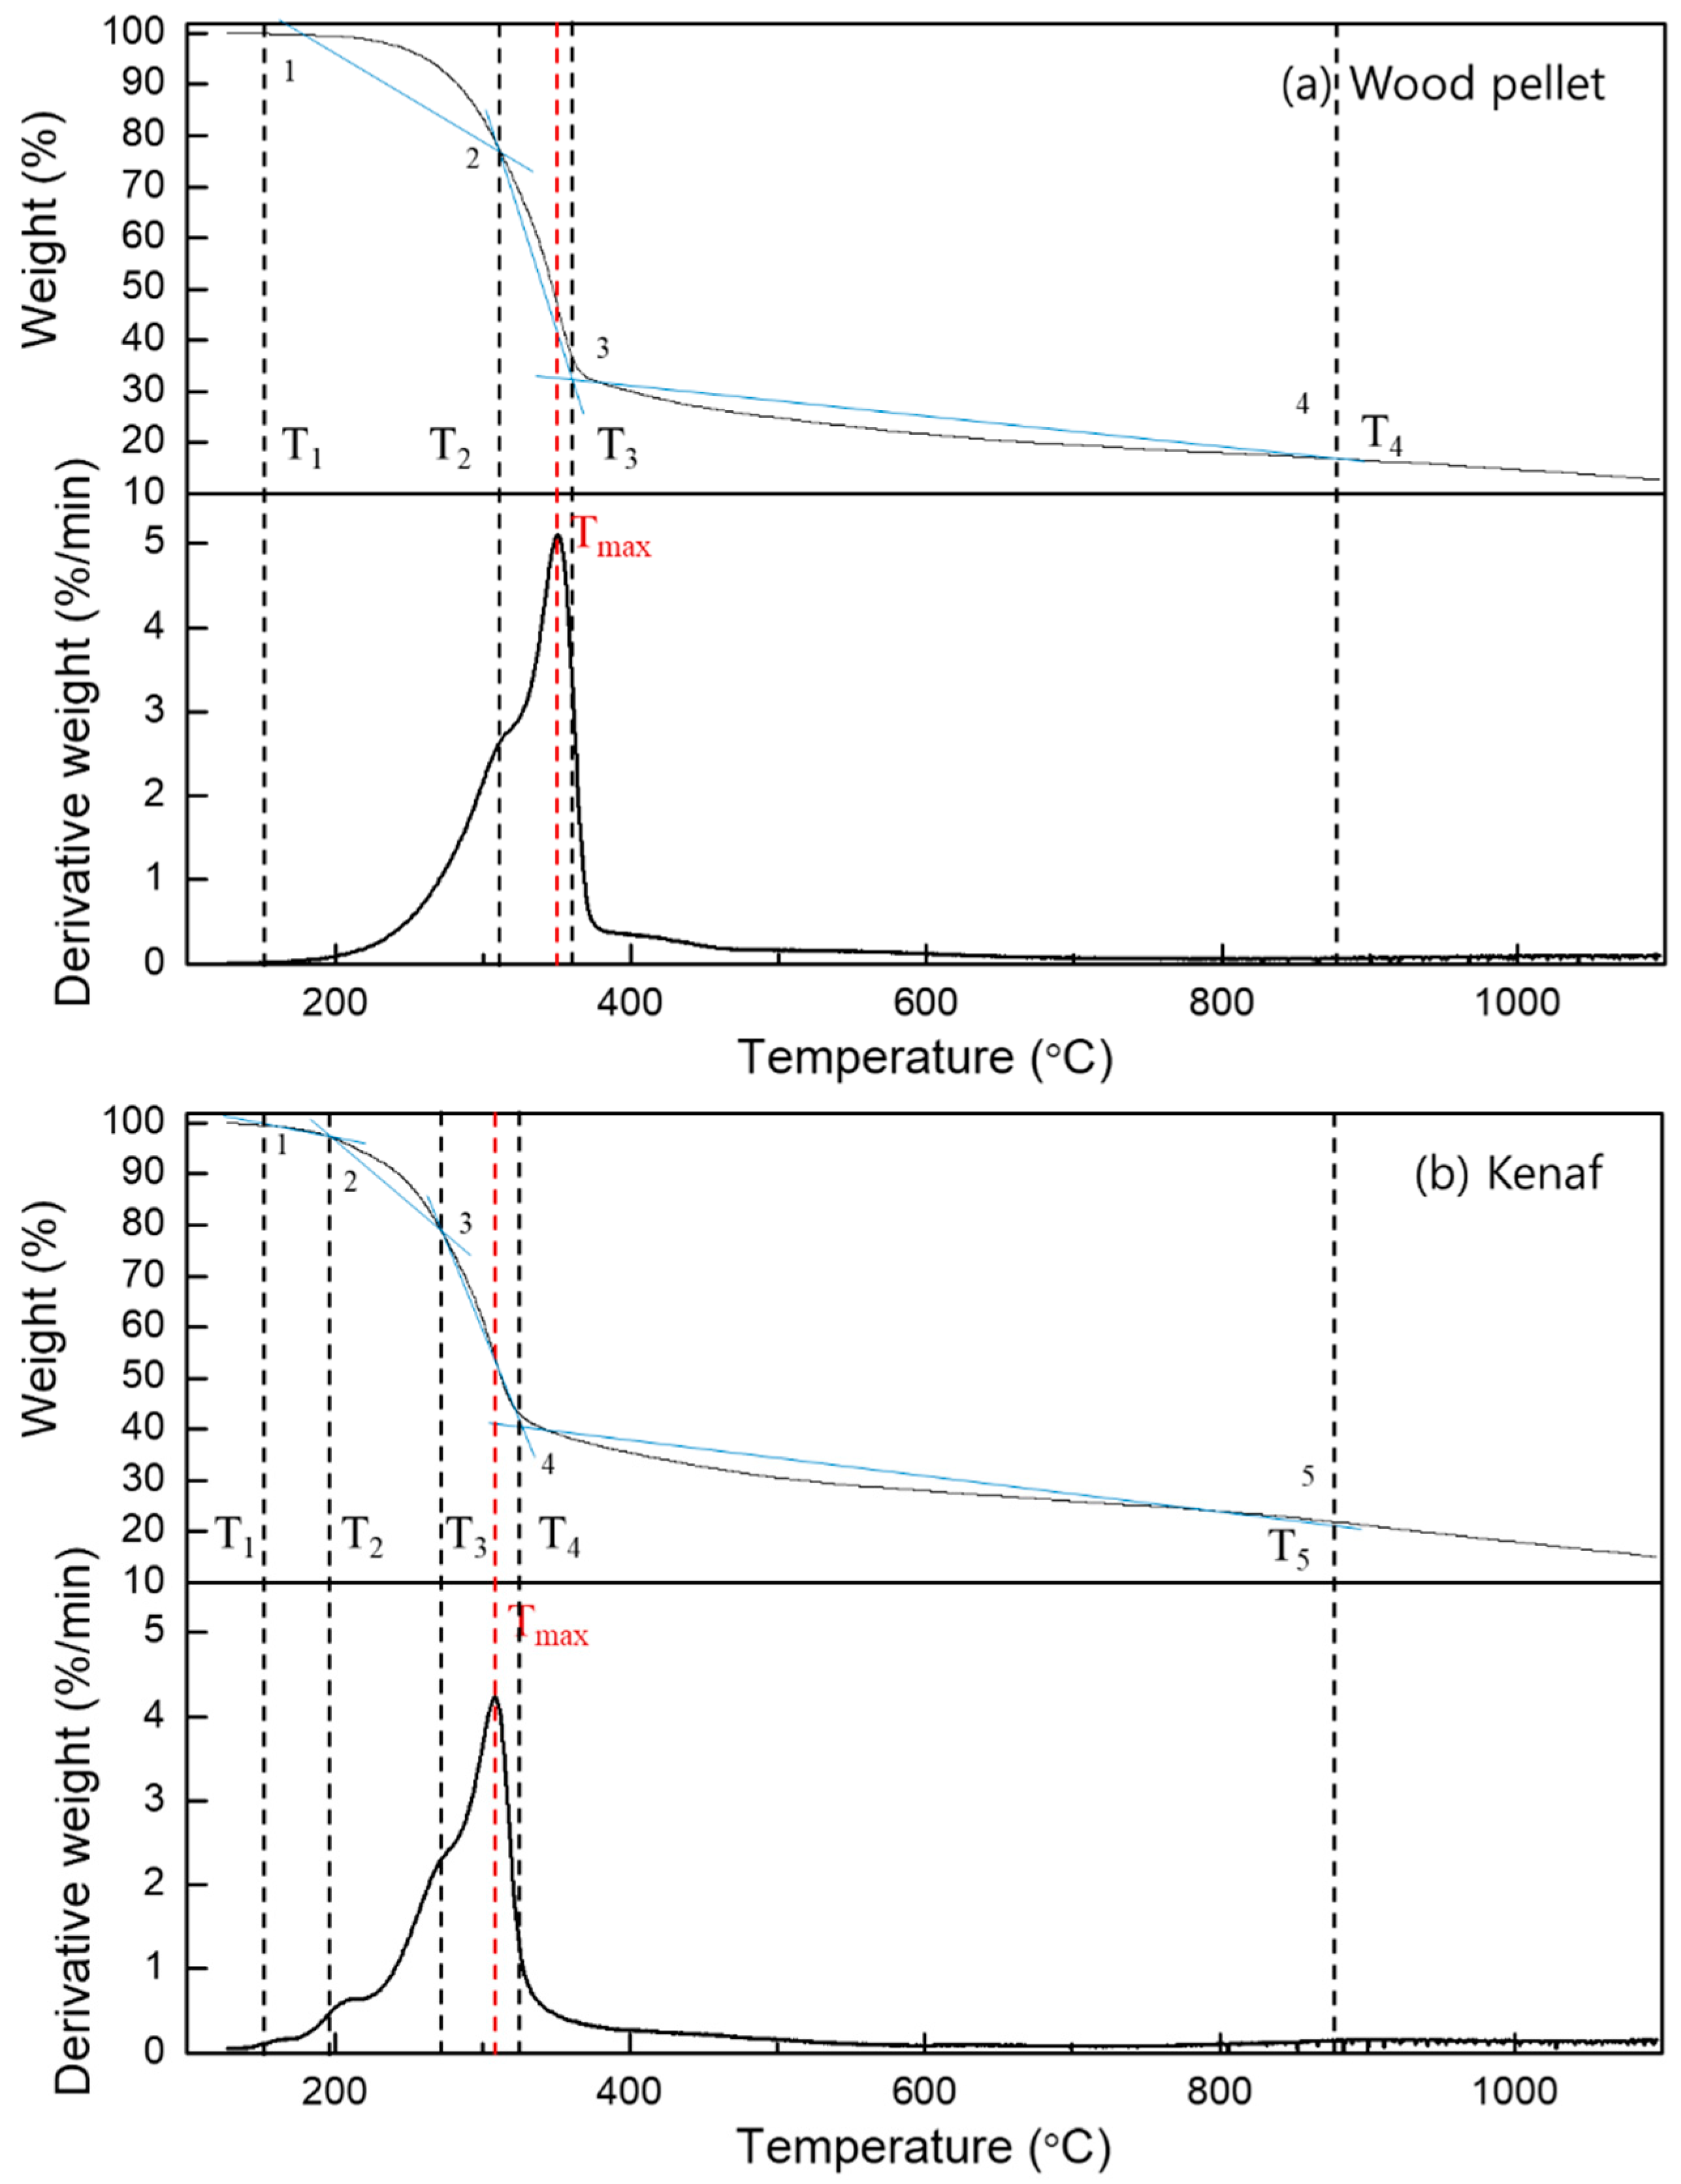
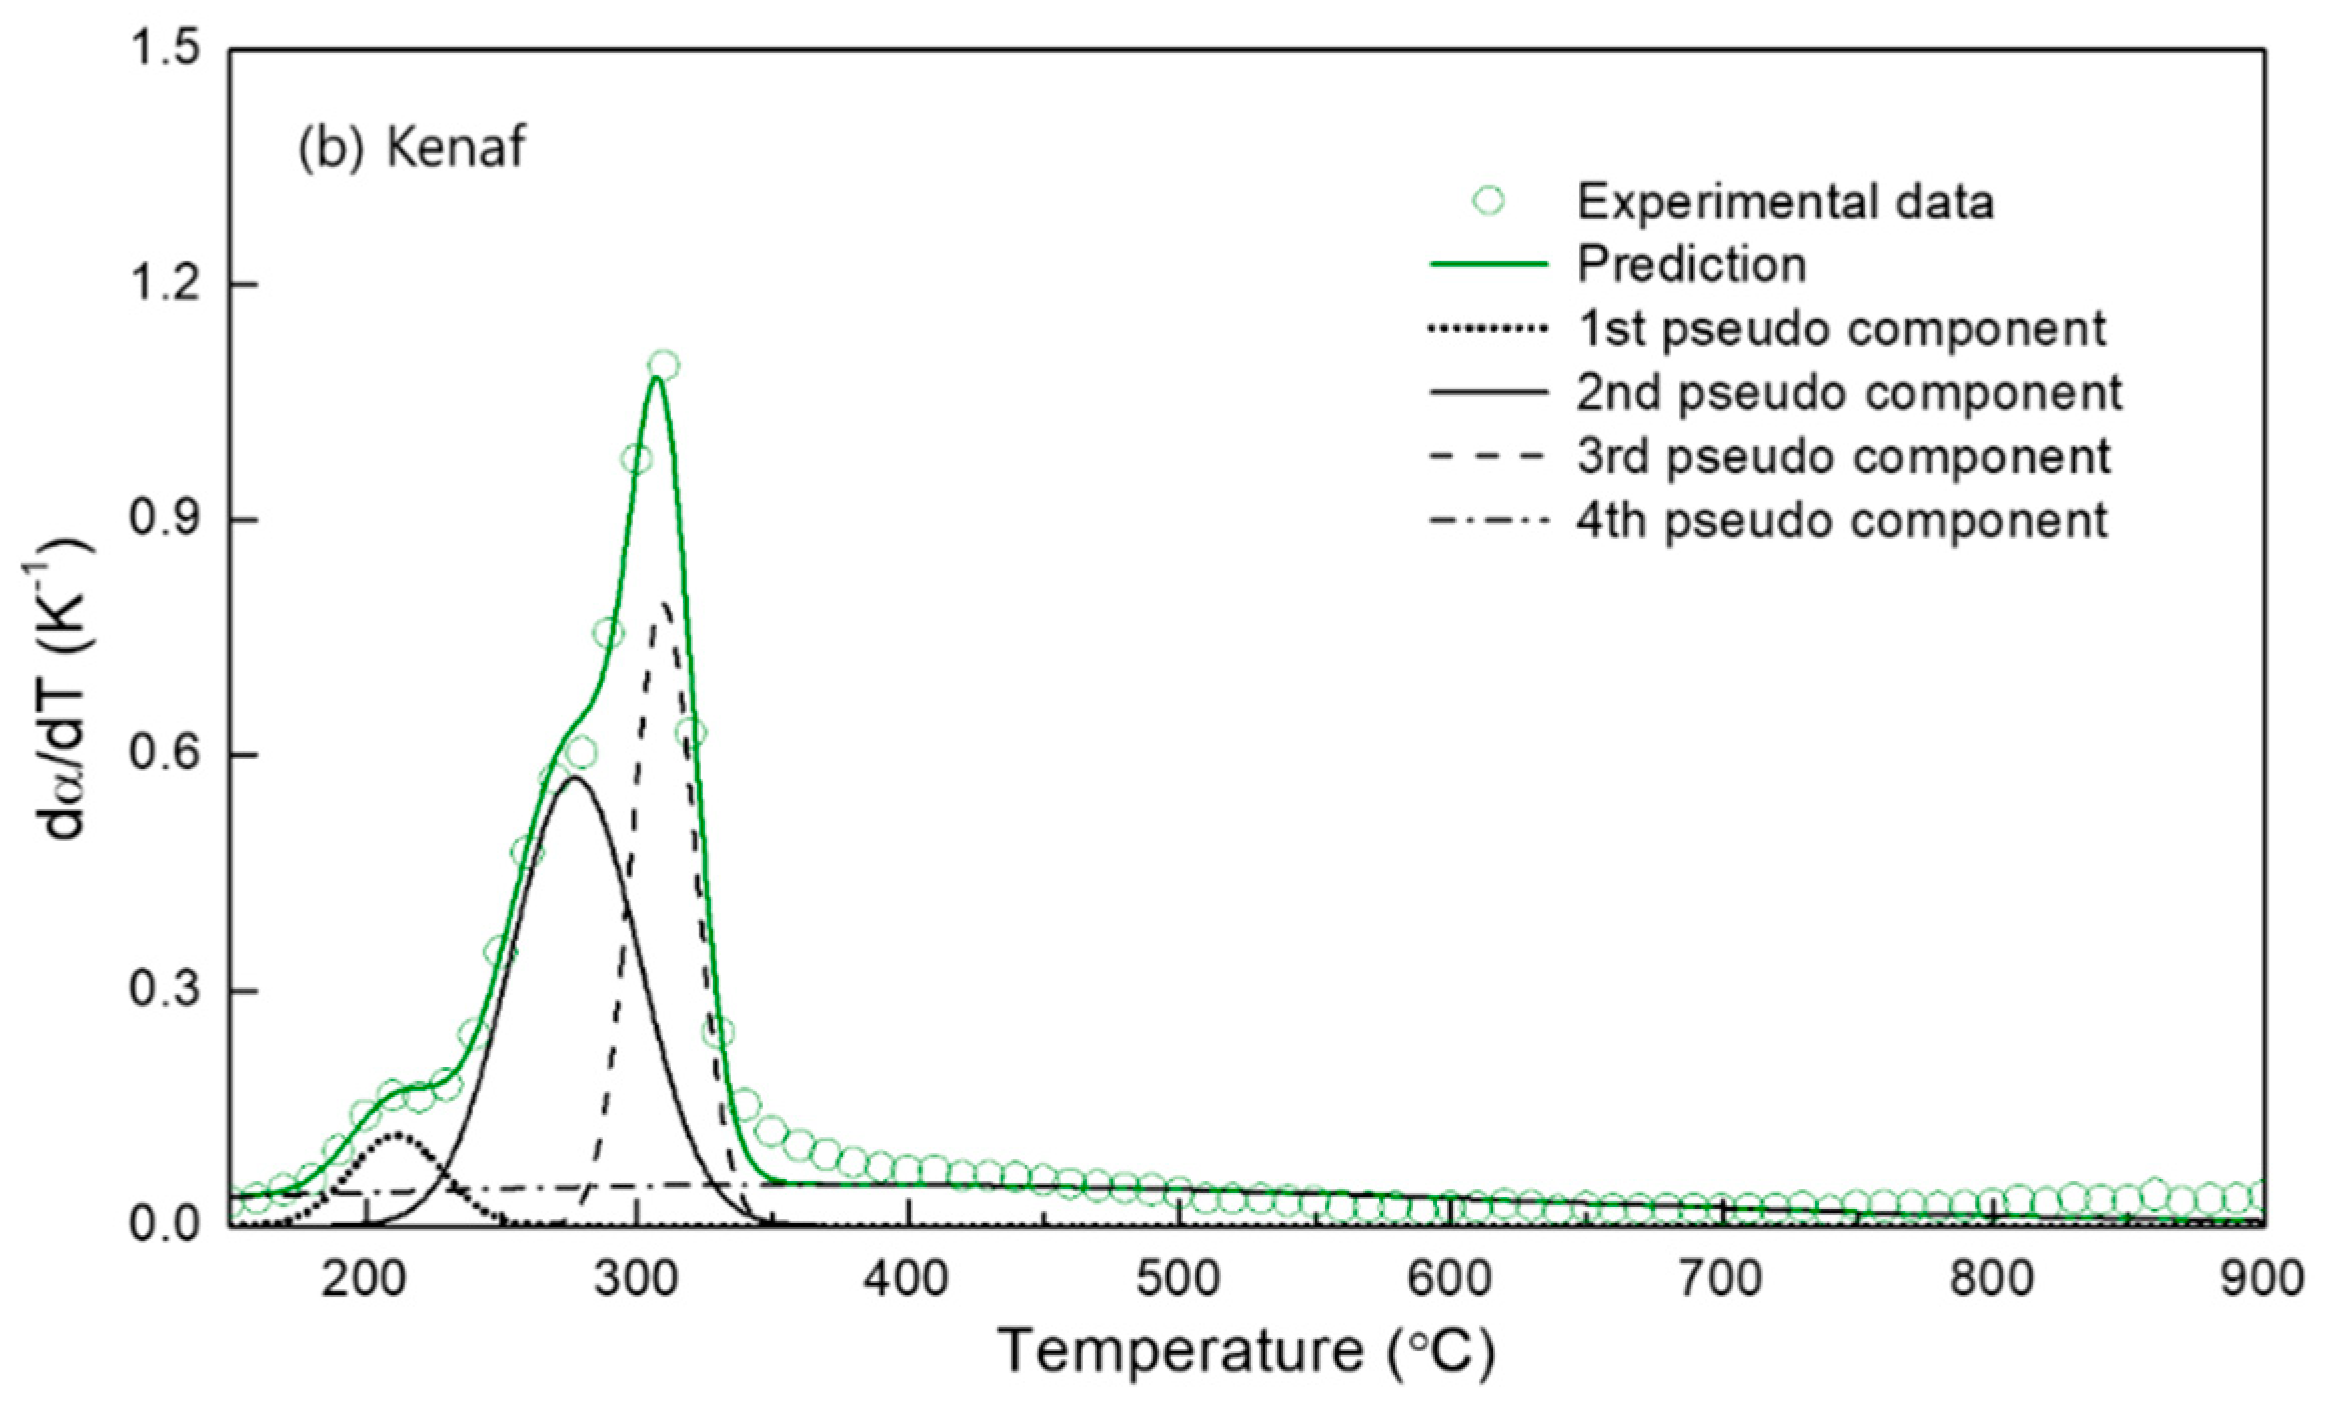
Thermogravimetry (TG) and derivative thermogravimetry (DTG) curves at pyrolysis conditions were performed, and the trend in mass reduction was similar for both wood pellets and kenaf; the overall pyrolysis tended to occur more rapidly at a lower temperature for kenaf.
(3).
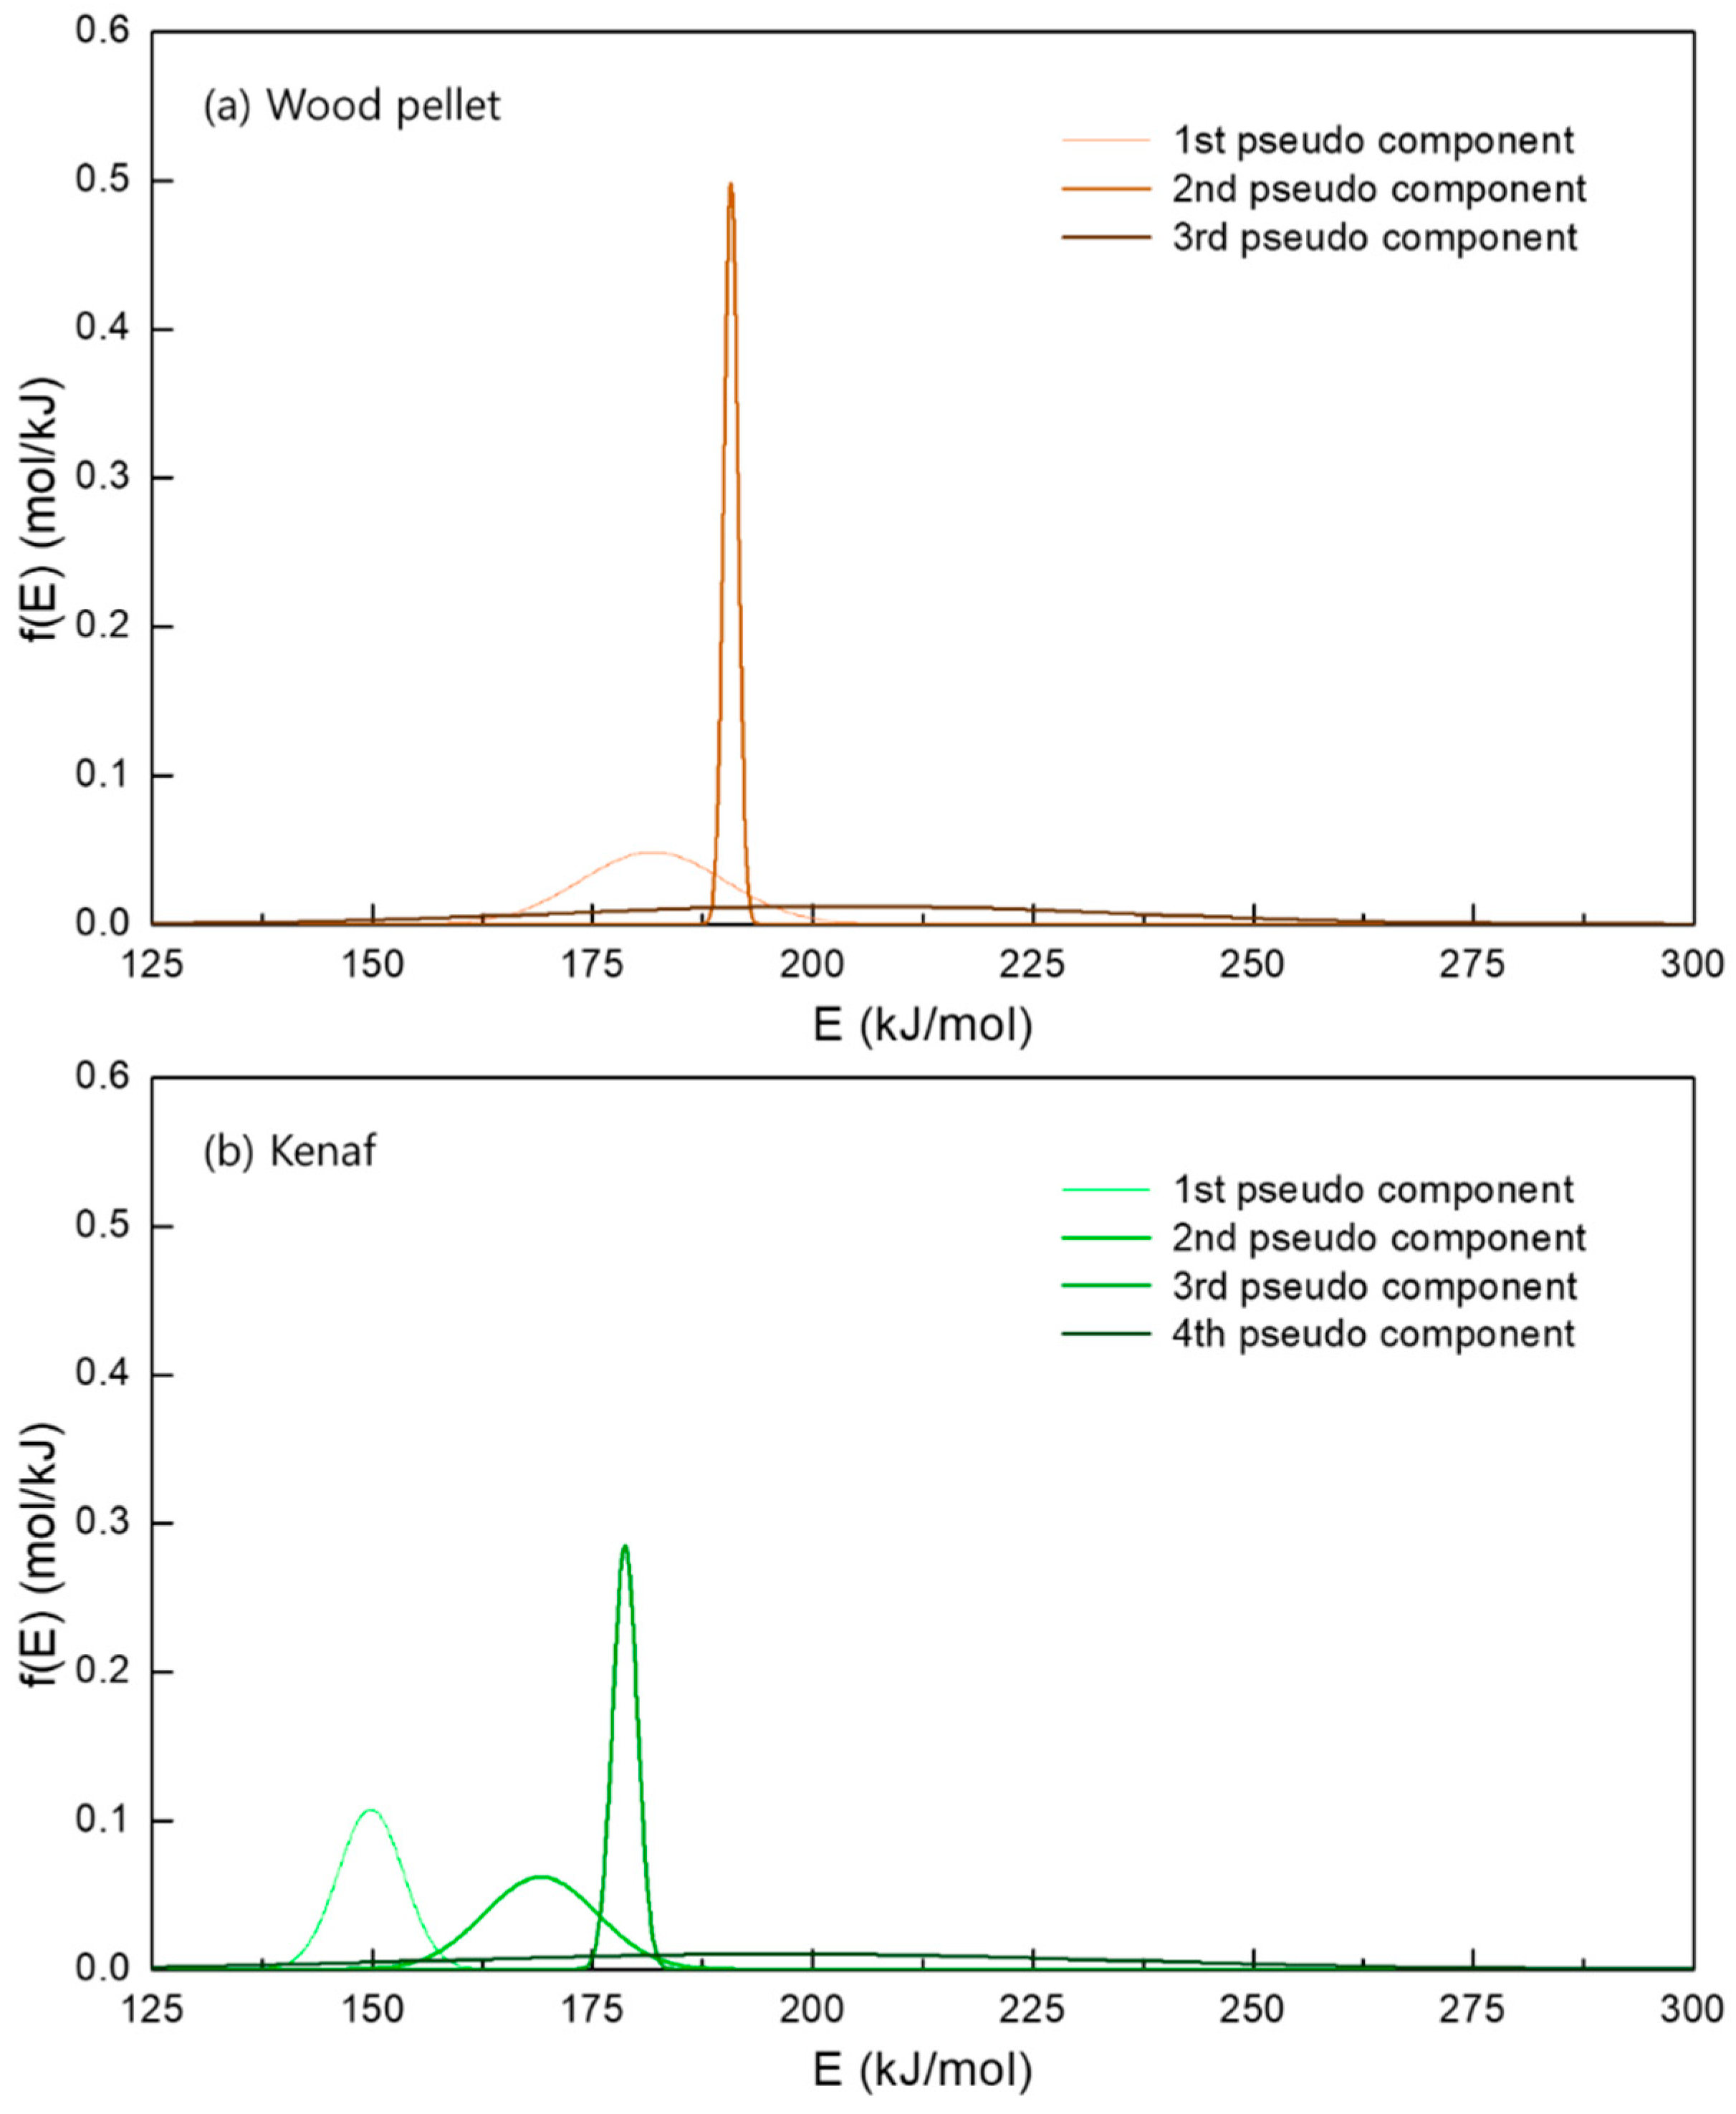
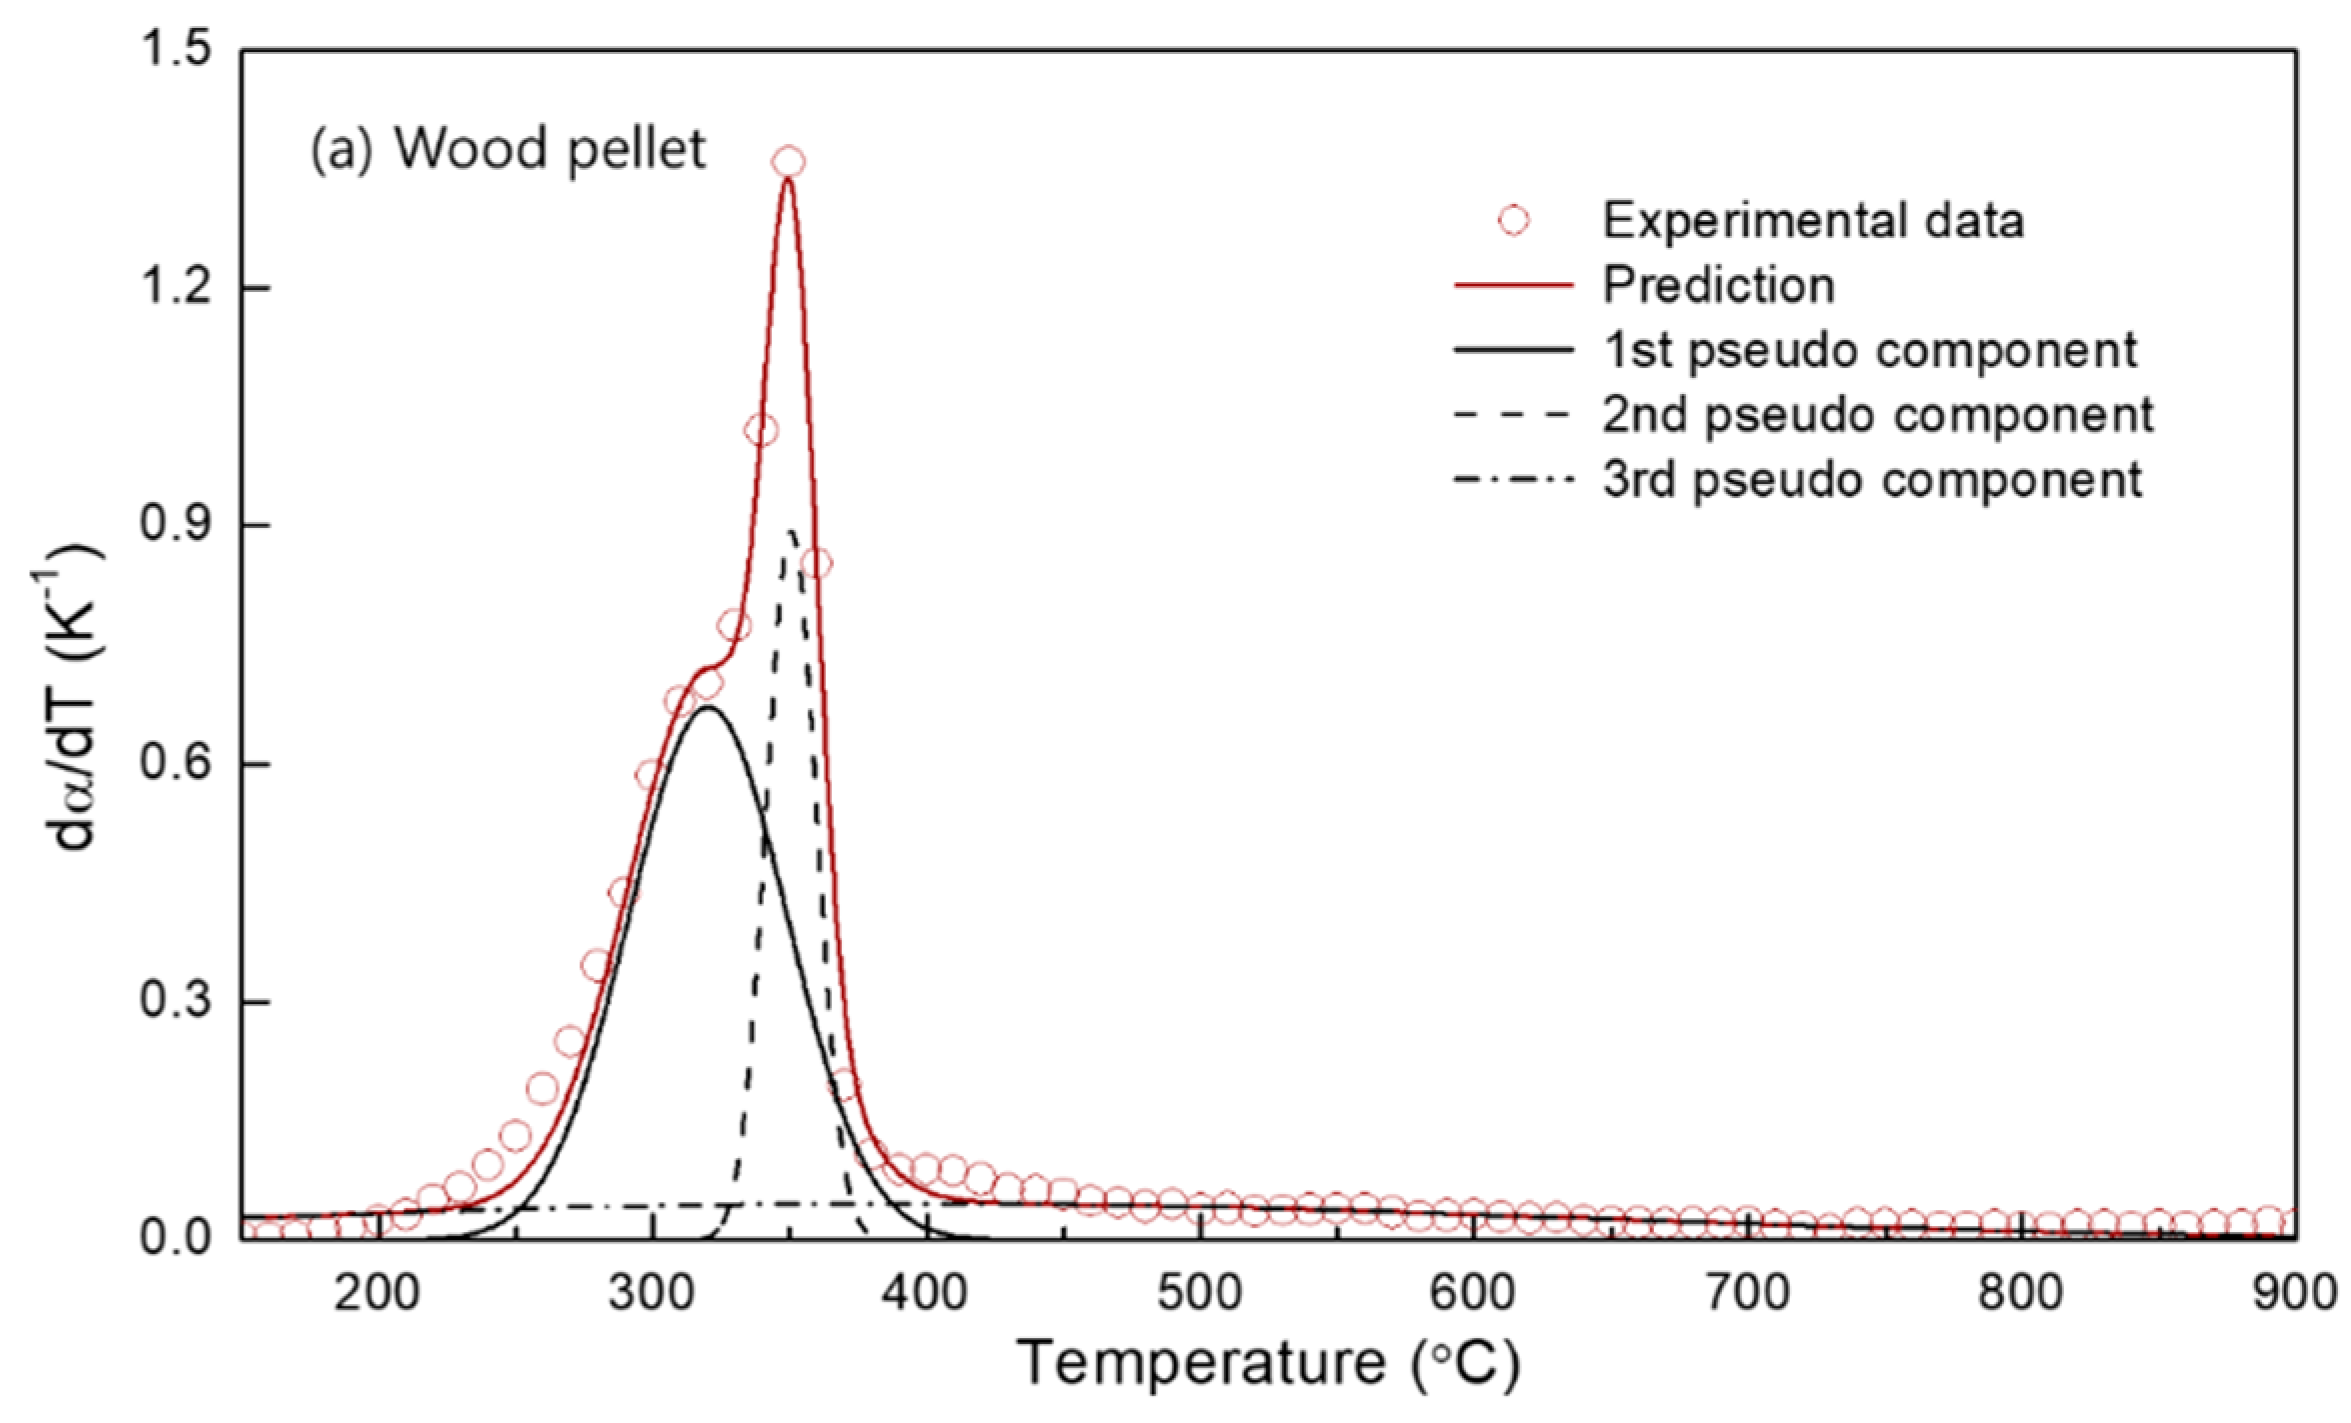
The multi-gaussian DAEM was successfully applied to the 3 or 4 pseudocomponents for the biomass samples in order to obtain the parallel descriptions of each independent pyrolysis reaction.
(4).
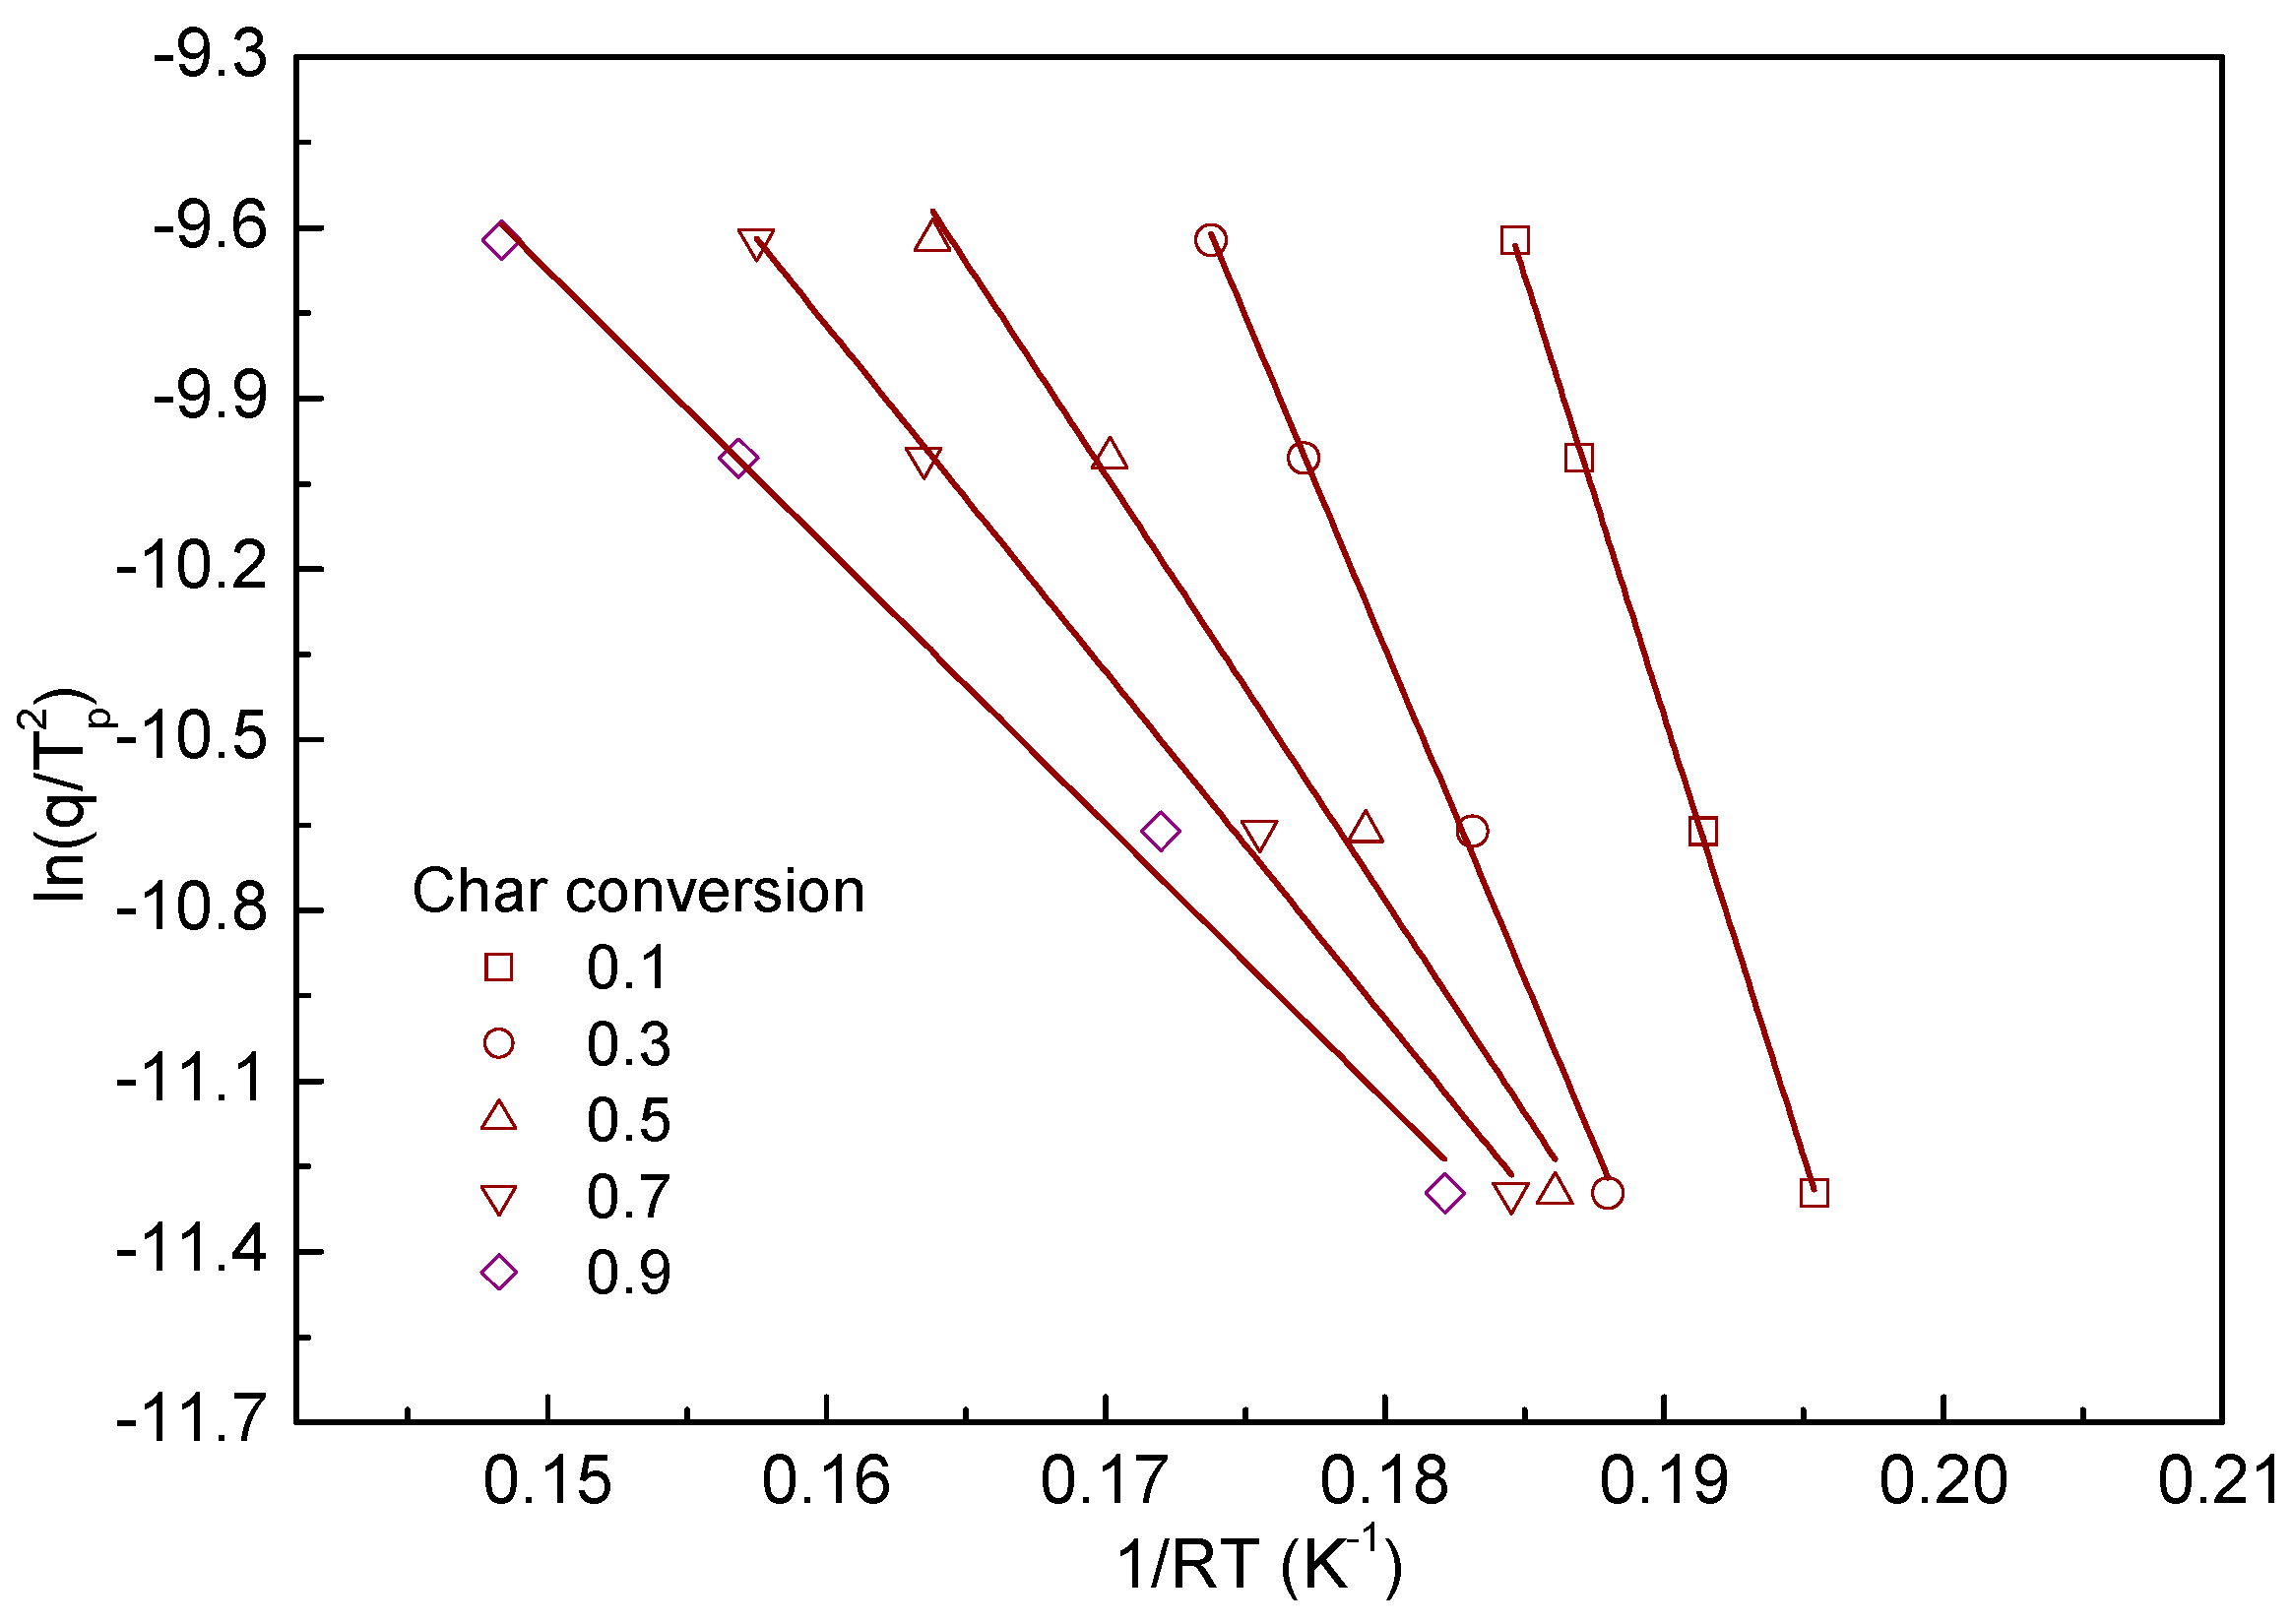
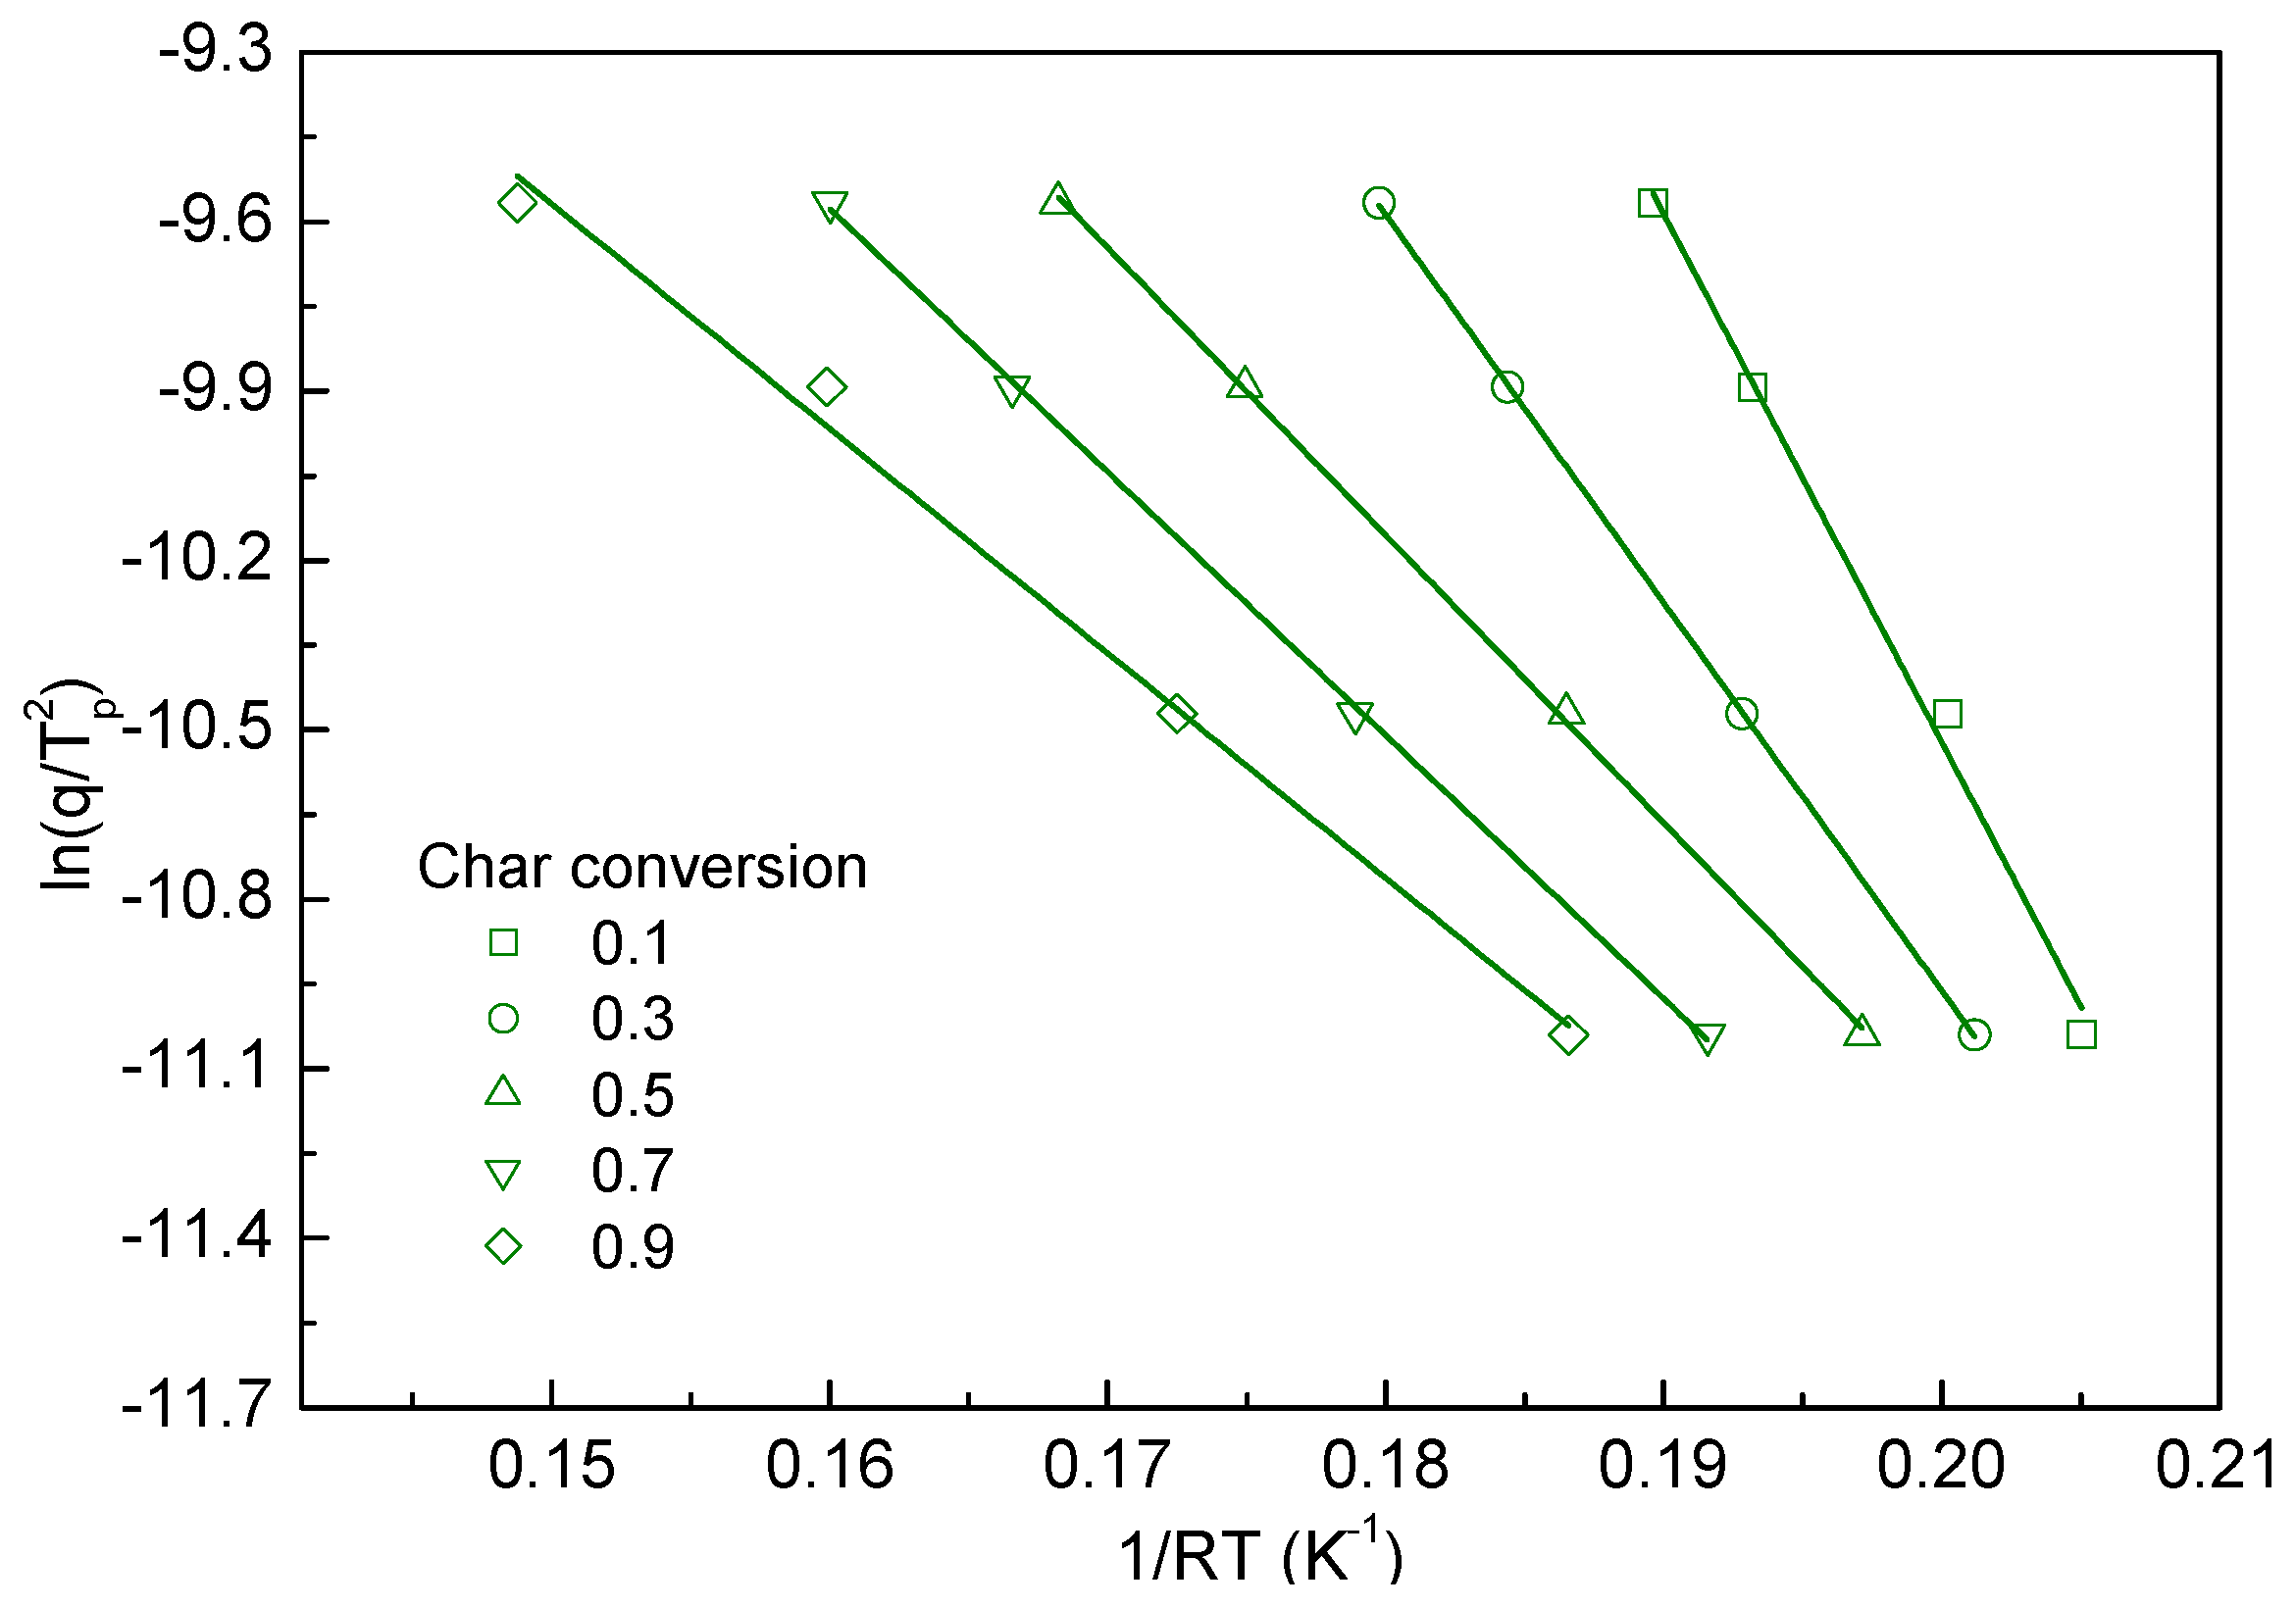
The reaction rate of char oxidation was taken into account by using the Kissinger equation, and it shows appropriate linearity for the derived kinetic parameters.

Author Contributions

Conceptualization, G.-M.K. and C.-H.J.; Data curation, G.-M.K. and C.-H.J.; Investigation, G.-M.K.; Methodology, G.-M.K. and D.-G.L.; Project administration, C.-H.J.; Supervision, C.-H.J.; Validation, G.-M.K. and D.-G.L.; Visualization, G.-M.K.; Writing—original draft, G.-M.K.; Writing—review and editing, G.-M.K., D.-G.L., and C.-H.J.

Funding

This work was supported by the Korea Institute of Energy Technology Evaluation and Planning (KETEP) and the Ministry of Trade, Industry & Energy (MOTIE) of the Republic of Korea [No. 20173010092550].

Conflicts of Interest

The authors declare no conflict of interest.

References

  1. Park, S.-W.; Lee, S.-Y.; Jeong, Y.-O.; Han, G.-H.; Seo, Y.-C. Effects of oxygen enrichment in air oxidants on biomass gasification efficiency and the reduction of tar emissions. Energies 2018, 11, 2664. [Google Scholar] [CrossRef]
  2. Norhasyima, R.S.; Mahlia, T.M.I. Advances in CO2 utilization technology: A patent landscape review. J. CO2 Util. 2018, 26, 323–335. [Google Scholar] [CrossRef]
  3. Uddin, M.N.; Techato, K.; Taweekun, J.; Rahman, M.M.; Rasul, M.G.; Mahlia, T.M.I.; Ashrafur, S.M. An overview of recent developments in biomass pyrolysis technologies. Energies 2018, 11, 3115. [Google Scholar] [CrossRef]
  4. Damanik, N.; Ong, H.C.; Tong, C.W.; Mahlia, T.M.I.; Silitonga, A.S. A review on the engine performance and exhaust emission characteristics of diesel engines fueled with biodiesel blends. Environ. Sci. Pollut. Res. 2018, 25, 15307–15325. [Google Scholar] [CrossRef]
  5. Białowiec, A.; Micuda, M.; Koziel, J.A. Waste to carbon: Densification of torrefied refuse-derived fuel. Energies 2018, 11, 3233. [Google Scholar] [CrossRef]
  6. Hasan, M.; Haseli, Y.; Karadogan, E. Correlations to predict elemental compositions and heating value of torrefied biomass. Energies 2018, 11, 2443. [Google Scholar] [CrossRef]
  7. Poudel, J.; Karki, S.; Oh, S.C. Valorization of waste wood as a solid fuel by torrefaction. Energies 2018, 11, 1641. [Google Scholar] [CrossRef]
  8. De Filippis, P.; de Caprariis, B.; Scarsella, M.; Verdone, N. Double distribution activation energy model as suitable tool in explaining biomass and coal pyrolysis behavior. Energies 2015, 8, 1730–1744. [Google Scholar] [CrossRef]
  9. Cai, J.; Wu, W.; Liu, R. An overview of distributed activation energy model and its application in the pyrolysis of lignocellulosic biomass. Renew. Sustain. Energy Rev. 2014, 36, 236–246. [Google Scholar] [CrossRef]
  10. Wang, J.; Li, P.; Liang, L.; Yang, J.; Hao, X.; Guan, G.; Huang, W. Kinetics modeling of low-rank coal pyrolysis based on a three-Gaussian distributed activation energy model (DAEM) reaction model. Energy Fuels 2016, 30, 9693–9702. [Google Scholar] [CrossRef]
  11. Hossain, N.; Zaini, J.; Mahlia, T.M.I.; Azad, A.K. Elemental, morphological and thermal analysis of mixed microalgae species from drain water. Renew. Energy 2019, 131, 617–624. [Google Scholar] [CrossRef]
  12. Guizani, C.; Jeguirim, M.; Valin, S.; Limousy, L.; Salvador, S. Biomass chars: The effects of pyrolysis conditions on their morphology, structure, chemical properties and reactivity. Energies 2017, 10, 796. [Google Scholar] [CrossRef]
  13. Qian, K.; Kumar, A.; Patil, K.; Bellmer, D.; Wang, D.; Yuan, W.; Huhnke, R. Effects of biomass feedstocks and gasification conditions on the physiochemical properties of char. Energies 2013, 6, 3972–3986. [Google Scholar] [CrossRef]
  14. Ogbonnaya, C.I.; Roy-Macauley, H.; Nwalozie, M.C.; Annerose, D.J.M. Physical and histochemical properties of kenaf (Hibiscus cannabinus L.) grown under water deficit on a sandy soil. Ind. Crops Prod. 1997, 7, 9–18. [Google Scholar] [CrossRef]
  15. Kim, J.-H.; Kim, G.-B.; Jeon, C.-H. Prediction of correlation between ash fusion temperature of ASTM and Thermo-Mechanical Analysis. Appl. Therm. Eng. 2017, 125, 1291–1299. [Google Scholar] [CrossRef]
  16. Song, H.; Liu, G.; Zhang, J.; Wu, J. Pyrolysis characteristics and kinetics of low rank coals by TG-FTIR method. Fuel Process. Technol. 2017, 156, 454–460. [Google Scholar] [CrossRef]
  17. Vyazovkin, S. Computational aspects of kinetic analysis: Part C. The ICTAC Kinetics Project—The light at the end of the tunnel? Thermochim. Acta 2000, 355, 155–163. [Google Scholar] [CrossRef]
  18. Miura, K.; Mae, K.; Shimada, M.; Minami, H. Analysis of formation rates of sulfur-containing gases during the pyrolysis of various coals. Energy Fuels 2001, 15, 629–636. [Google Scholar] [CrossRef]
  19. Miura, K.; Maki, T. A simple method for estimating f(E) and k0(E) in the distributed activation energy model. Energy Fuels 1998, 12, 864–869. [Google Scholar] [CrossRef]
  20. Kissinger, H.E. Reaction kinetics in differential thermal analysis. Anal. Chem. 1957, 29, 1702–1706. [Google Scholar] [CrossRef]
  21. Liu, N.; Jørgensen, U.; Lærke, P.-E. Quality Determination of Biomass for Combustion: A New High-Throughput Microwave Digestion Method Prior to Elemental Analysis by Inductively Coupled Plasma−Optical Emission Spectroscopy. Energy Fuels 2013, 27, 7485–7488. [Google Scholar] [CrossRef]
  22. Cai, J.; Wu, W.; Liu, R.; Huber, G.-W. A distributed activation energy model for the pyrolysis of lignocellulosic biomass. Green Chem. 2013, 15, 1331–1340. [Google Scholar] [CrossRef]
  23. Meng, A.; Chen, S.; Long, Y.; Zhou, H.; Zhang, Y.; Li, Q. Pyrolysis and gasification of typical components in wastes with macro-TGA. Waste Manag. 2015, 46, 247–256. [Google Scholar] [CrossRef] [PubMed]
  24. Tran, K.-Q.; Bach, Q.-V.; Trinh, T.-T.; Seisenbaeva, G. Non-isothermal pyrolysis of torrefied stump—A comparative kinetic evaluation. Appl. Energy 2014, 136, 759–766. [Google Scholar] [CrossRef]
  25. Prince, M.; Ptasinski, K.; Janssen, F. Torrefaction of wood: Part 1. Weight loss kinetics. J. Anal. Appl. Pyrolysis 2006, 77, 28–34. [Google Scholar] [CrossRef]
  26. Fletcher, T.H.; Hillier, J.L. Pyrolysis Kinetics of a Green River Oil Shale Using a Pressurized TGA. Energy Fuels 2011, 25, 232–239. [Google Scholar]
Figure 1. Schematic diagram of the thermomechanical analysis (TMA) device.
Energies 12 01008 g001
Figure 2. Distributed activation energy model (DAEM) calculation algorithm.
Energies 12 01008 g002
Figure 3. Thermogravimetry (TG) and derivative thermogravimetry (DTG) curves of biomass samples under pyrolysis conditions; (a) wood pellets and (b) kenaf.
Energies 12 01008 g003
Figure 4. Experimental and calculated pyrolysis conversion rate curves for the biomass; (a) wood pellets and (b) kenaf.
Energies 12 01008 g004aEnergies 12 01008 g004b
Figure 5. Weight loss of the pseudocomponents; (a) wood pellets and (b) kenaf.
Energies 12 01008 g005
Figure 6. Activation energy distributions of the pseudocomponents; (a) wood pellets and (b) kenaf.
Energies 12 01008 g006
Figure 7. Peak temperature at the maximum reaction rate of the various heating rate experiments.
Energies 12 01008 g007
Figure 8. Kissinger plot of the TG analysis results.
Energies 12 01008 g008
Figure 9. Kissinger kinetic plot of the wood pellet char for various char conversion values and heating rates.
Energies 12 01008 g009
Figure 10. Kissinger kinetic plot of the kenaf char for various char conversion values and heating rates.
Energies 12 01008 g010
Table 1. Proximate, ultimate, and oxide analysis results and calorific values of biomass samples.
PropertiesSamples
EndpointWood PelletsKenaf
Total moisture (as-rec a, wt.%)
Total moisture c9.4611.52
Proximate analysis (adb a, wt.%)
Moisture % c2.763.73
Volatiles %75.6573.64
Fixed carbon %19.4117.18
Ash yield %2.185.45
Ultimate analysis (daf a, wt.%)
Carbon %48.0746.71
Hydrogen %6.626.71
Nitrogen %0.571.21
Oxygen a %44.6845.32
Sulfur %0.060.05
Oxide analysis (wt.%)
SiO22.876.73
Al2O30.581.07
TiO20.160.25
Fe2O34.3427.82
CaO60.6226.07
MgO4.072.39
Cr2O33.697.61
K2O14.0912.61
P2O53.7312.35
SO34.662.58
MnO1.190.52
Calorific value (kcal/kg)
LHV b42103869
HHV b44814160
Notes: a as-rec: As-received basis; adb: Air-dry basis; daf: Dry and ash-free basis; oxygen by difference. b LHV: Lower heating value; HHV: Higher heating value. c Moisture content was characterized by American Society for Testing and Materials (ASTM) E871.
Table 2. TMA shrinkage parameters for the biomass ash samples.
IndexTMA Shrinkage Temperature (°C)
ParameterWood PelletsKenaf
T251124977
T5012781043
T7514941102
T9015371135
Table 3. Inductively coupled plasma-optical emission spectrometer (ICP-OES) results for the biomass samples.
SampleElementWavelength (nm)Measured (ppm) a
Wood pelletCu327.39330.1
Cd228.802n.d.
Cr267.716n.d.
Fe238.204213
Pb220.353n.d.
Mn257.6186.2
Zn206.2n.d.
Al396.153197
As188.979n.d.
Ba233.52714.6
Ca317.9334750
Mg285.213990
K766.491856
Na589.592437
Sr407.77118.6
P213.617682
Si251.611324
S180.669554
Ti334.94n.d.
KenafCu327.39341.3
Cd228.802n.d.
Cr267.71629.3
Fe238.2041738
Pb220.35325.8
Mn257.6190.0
Zn206.2210
Al396.153892
As188.979n.d.
Ba233.52740.3
Ca317.9337979
Mg285.2133124
K766.493090
Na589.592354
Sr407.77128.8
P213.6177177
Si251.6113049
S180.6691406
Ti334.9460.1
Note: a n.d.: Not detected.
Table 4. Pyrolysis kinetic parameters of biomass samples at a heating rate of 10 °C/min.
SamplesStage Temp.Activation Energy, EFrequency Factor, AR2
(°C)(kJ/mol)(min−1)(-)
Wood pellet150–31069.0433,8700.9982
310–36081.47,061,8720.9948
360–8757.616.420.9959
Kenaf150–19369.31,037,9310.9944
193–26458.061,0310.9967
264–32069.8855,7880.9981
320–8756.813.070.9885
Table 5. Component description for the DAEM of the biomass samples.
Wood Pellet Component DescriptionKenaf Component Description
SpeciesT (°C)E0 (kJ/mol) σ (kJ/mol)SpeciesT (°C)E0 (kJ/mol) σ (kJ/mol)
1st237–400181.88.21st132–287149.83.2
2nd340–360190.70.82nd180–375169.26.4
3rd162–897203.2323rd290–327178.71.4
----4th167–877196.43.8
Table 6. Activation energy for the samples at selected char conversion values.
Char Conversion Value Activation   Energy ,   E c   ( kJ / mol )
EndpointWood PelletKenaf
0.1155.093.5
0.3116.668.7
0.574.750.9
0.760.946.6
0.948.739.8

