Article

Quantifying the Benefits of a Solar Home System-Based DC Microgrid for Rural Electrification

1
Department of Electrical Sustainable Energy, Delft University of Technology, 2628 CD Delft, The Netherlands
2
Klimop Energy, 7202 DD Zutphen, The Netherlands
*
Author to whom correspondence should be addressed.
Energies 2019, 12(5), 938; https://doi.org/10.3390/en12050938
Submission received: 1 February 2019 / Revised: 28 February 2019 / Accepted: 1 March 2019 / Published: 11 March 2019
(This article belongs to the Section A1: Smart Grids and Microgrids)

Abstract

:
Off-grid solar home systems (SHSs) currently constitute a major source of providing basic electricity needs in un(der)-electrified regions of the world, with around 73 million households having benefited from off-grid solar solutions by 2017. However, in and of itself, state-of-the-art SHSs can only provide electricity access with adequate power supply availability up to tier 2, and to some extent, tier 3 levels of the Multi-tier Framework (MTF) for measuring household electricity access. When considering system metrics of loss of load probability (LLP) and battery size, meeting the electricity needs of tiers 4 and 5 is untenable through SHSs alone. Alternatively, a bottom-up microgrid composed of interconnected SHSs is proposed. Such an approach can enable the so-called climb up the rural electrification ladder. The impact of the microgrid size on the system metrics like LLP and energy deficit is evaluated. Finally, it is found that the interconnected SHS-based microgrid can provide more than 40% and 30% gains in battery sizing for the same LLP level as compared to the standalone SHSs sizes for tiers 4 and 5 of the MTF, respectively, thus quantifying the definite gains of an SHS-based microgrid over standalone SHSs. This study paves the way for visualizing SHS-based rural DC microgrids that can not only enable electricity access to the higher tiers of the MTF with lower battery storage needs but also make use of existing SHS infrastructure, thus enabling a technologically easy climb up the rural electrification ladder.

1. Introduction

By the end of 2016, almost 1.1 billion people globally lacked access to electricity [1]. Household electricity access is a major challenge that needs urgent attention. While conventional grid-based electricity has not reached large sections of the global population for various reasons, solar-based off-grid solutions have reached soaring levels of popularity and acceptance [2]. Solar lanterns and solar home systems (SHSs) are examples of such off-grid solutions. From 2010 to 2017, over 130 million off-grid solar devices have been cumulatively sold, and around 360 million people have moved from kerosene and solid fuels while getting basic solar-based electricity access [3]. An SHS is usually defined as a solar Photovoltaic (PV) generator rated from around 11–20 Wp to more than 100 Wp with a suitable battery storage [4].
As the electricity access of an under-electrified household in a remote area is not necessarily a have or have-not condition, a multi-tier framework (MTF) for measuring household electricity access was introduced in [5] and is widely adopted by both practitioners and policy-makers. Within this framework, different tiers of electricity access are defined. Table 1 captures the MTF as described in [6].
The electricity demand of a user increases with time, a phenomenon well captured in literature in the past [7,8]. The MTF helps in visualizing the climb up the so-called electrification ladder in terms of moving up the tiers within the MTF. The solar lanterns mainly cater to tier 1 electricity usage, the present-day SHS can satisfy the electricity demands of tier 2, and to some extent, tier 3, while higher tiers of electrification cannot be reached by currently available SHSs alone [9]. In this paper, an alternative, bottom-up, SHS-based microgrid is proposed as a solution to achieve higher tiers of electrification, and the benefits of such an interconnected SHS-based microgrid are quantified over standalone SHSs.

1.1. Literature Study

Inadequacy of Contemporary SHSs
Most plug-and-play SHSs for households currently being offered in the off-grid market segment belong to the 11 Wp to 100 Wp category [3,10]. For locations with 4 or more equivalent sun hours per day of solar insolation (a common attribute for locations in the equatorial and tropical areas), such a PV rating can easily satisfy the electricity needs up to tier 2 (refer to Table 1), provided adequate battery storage is present in the system. However, there is a scarcity of SHS-based solutions that cater to higher tiers of the MTF. For instance, tier 4 requirements are stated to be more than 3.4 kWh per day, which requires more than 800 Wp of rated PV in the SHSs, which is a far cry from contemporary SHS ratings available in the field (typically around 100 Wp or less) [3,9]. A recent study on optimal sizing of SHSs while increasing the battery lifetime, decreasing the excess unused energy, and reducing the loss of load probability (LLP)—a system metric quantifying the availability of power supply (described in detail in Section 2.3)—concluded that standalone SHSs are not tenable to be used for tier 4 and tier 5 level electrification [9]. In fact, the lowest LLP attainable by an optimally sized SHSs catering to tier 5 electricity demand was 0.029 [9], while several off-grid projects keep 0.02 as a lower limit of the LLP [11,12]. For off-grid systems, typical LLP values based on the specific application can be 0.01 and 0.0001 for domestic illumination and telecommunications respectively [13]. Moreover, due to the mismatch between the electricity demand and production, which is to some extent abated with the help of battery storage, there is usually some amount of energy that is wasted, leading to underutilization of the PV-generated energy. This utilized energy in standalone SHSs in literature has been seen to be as much as 31%, for simulated SHSs installed in Bangladesh [14]. For SHSs installed in Rwanda, around 65% of the generated energy remains unutilized [15]. The SHSs considered in these studies are currently catering to tier 1 and tier 2 users only. For higher tier usage, the scaling up of PV and battery size needed to meet the energy demand would mean that the unutilized component of generated energy also scales up in magnitude, thus leading to more “wasted energy”. Even though contemporary SHSs mostly cater to tier 1 and tier 2 usage, the climb up the electrification ladder is inevitable. Hence, there is a need to also focus on the larger goal of being able to satisfy the higher tier energy demands. As contemporary standalone SHSs suffer from the aforementioned drawbacks, a microgrid-based electrification needs to be explored, especially for meeting the electricity demands of the higher tiers. This is because microgrids can potentially cater to much higher power needs as opposed to single SHSs with only one PV panel at the household level. Furthermore, grid-extension, which is the third option apart from standalone systems and microgrids, has not been considered in this article as for the majority of the unelectrified population it is not a cost-effective solution.
Rural Microgrids
In the absence of a central grid connection in many of the un(der)-electrified off-grid regions where SHS are currently deployed, the best way to achieve tier 4 or tier 5 level of electricity access is via a microgrid. In the past, rural microgrids in literature have encompassed different categorizations: centralized [16] and decentralized microgrids [17]; grid-connected [18] and islanded (or off-grid) [19]; AC [20], DC [21] and hybrid [22]; Renewable energy-based [23] and hybrid energy-based (with diesel) [24]. However, given the falling PV prices, solar-based solutions like pico-solar products and SHS have already seen a very high rate of proliferation and acceptance. Additionally, the SHS available in the field are mostly DC-based, i.e. without AC components. Therefore, the focus of this study is mainly on islanded solar-based rural DC microgrids. Such a microgrid can be implemented in three ways, viz.,
  • a centralized microgrid , with central PV generation and centralized storage;
  • a semi-decentralized microgrid, with central PV generation and decentralized storage;
  • a fully decentralized microgrid, with decentralized PV generation, decentralized storage, and DC distribution.
Compared to standalone SHSs at the household level, a centralized islanded microgrid with central PV and storage requires high CAPEX investments, and few private players want to set up such a centralized endeavour with the high risks currently associated with such an investment. Semi-decentralized microgrids are also being explored, with a central village solar kiosk, with individual households having some loads and a basic energy storage unit like battery. This can sometimes also be implemented in the form of a single entrepreneur operating the kiosk and leasing out batteries that are charged from the centralized PV [25]. This does not strictly qualify as a microgrid, as there is no distribution grid present. Additionally, semi-decentralized solutions have also been limited by the extent of the electricity they are able to provide. In general, the level of electrification is often a dynamic requirement, as the electricity needs keep increasing with time [7,26]. For e.g., households might not need a direct tier 4 or tier 5 connection but might move from tier 3 to tier 4 over a span of time. This would mean that the planned microgrid has to expand and scale up with the increase in the energy demand. In such a case, it is more practical to envisage a bottom-up SHS-based microgrid born out of the interconnection of standalone SHS. This would lead to a reduced storage requirement as the households will be able to depend on the excess generation of other households in the microgrid network. Moreover, since the lower tier electrification is already underway through SHSs in large parts of the world, an interconnected SHS-based decentralized rural DC microgrid is an option that is easier to retrofit when visualizing future rural microgrids.
Bottom-Up, Decentralized Interconnected SHS-Based Rural Microgrids
Following are the main advantages of an interconnected SHS-based microgrid as compared to standalone SHS-based electrification.
  • Excess energy sharing. Interconnecting SHS enables excess energy sharing between the households.
  • Reduced system size. A direct consequence of 1 is that the system sizes will be lower than the standalone case for meeting the same LLP requirement.
  • Productive use of energy. High power appliances enabling productive use of energy can be easily supported in an interconnected SHS microgrid. Productive use of energy can supplement income-generating activities and therefore lead to a higher degree of ownership in the microgrid setup by the users.
  • Climbing up the electrification ladder. Climbing up the tiers of MTF will require much lower increments in energy storage per household as opposed to a standalone SHS climb up the tiers.
  • Retrofitting and ‘future-fitting’. Interconnected SHS-based microgrid not only helps in reusing the existing SHS but also ensures that a DC distribution grid exists for the central grid expansion if and when it reaches the target region.
The idea of bottom-up, decentralized rural DC microgrids that can grow organically with time has seen more proponents in literature [27,28]. However, existing studies like [28,29] mainly identify the financial benefits of interconnecting SHS. The advantage of demand diversity, that is the load profile peaks of different households occurring at different points in time, due to SHS interconnection, is captured in [15]. Moreover, these studies, based on existing SHS, are limited to tiers 1 to 2 with 12 V battery and distribution. Scaling up the energy ladder would demand high power loads, and therefore a much higher voltage for DC distribution. Additionally, higher power loads that enable productive use of energy are not considered in these studies. Moreover, there is insufficient information in literature on the quantified benefits of microgrid over SHS in terms of system sizing and other system metrics like power supply availability and excess energy.
Therefore, this paper focuses on the concept of bottom-up SHS-based microgrids that can grow organically based on the electricity demand and the affordability of the households in a given location. Furthermore, this paper endeavours to quantify the benefits of such an interconnected SHS-based microgrid over standalone SHS.

1.2. Contributions of This Paper

Following are the main contributions of this paper.
  • A bottom-up, organically growing microgrid is modeled that enables climbing up the rural electrification ladder through energy sharing.
  • The benefits of SHS interconnectivity over standalone SHSs for enabling higher tiers of electricity access are quantified in the form of system metrics of storage size, loss of load probability and excess energy.
  • A modular SHS-based architecture is proposed that can not only enable modular intra-household expansion of the SHS but also allow for inter-household scalability of a meshed DC microgrid.

2. Methodology

2.1. Location and Meteorological Inputs

Meteonorm software database was used to obtain the meteorological data of a city in India (that enjoys 5 equivalent sun hours of irradiance per day) as the ground level meteorological data was not readily available for the remote rural areas [30]. This data can be assumed to be representative of other areas in similar latitudes, as most of the un(der)-electrified areas lie in the tropical latitudes enjoying comparable sun hours. The meteorological data is composed of ambient temperature, wind speed, and ground level irradiance, which are all required for modelling the dynamic PV output for SHSs. This has been extensively discussed in a previous work by the authors [9]. The data used in this study has a resolution of 1 min.

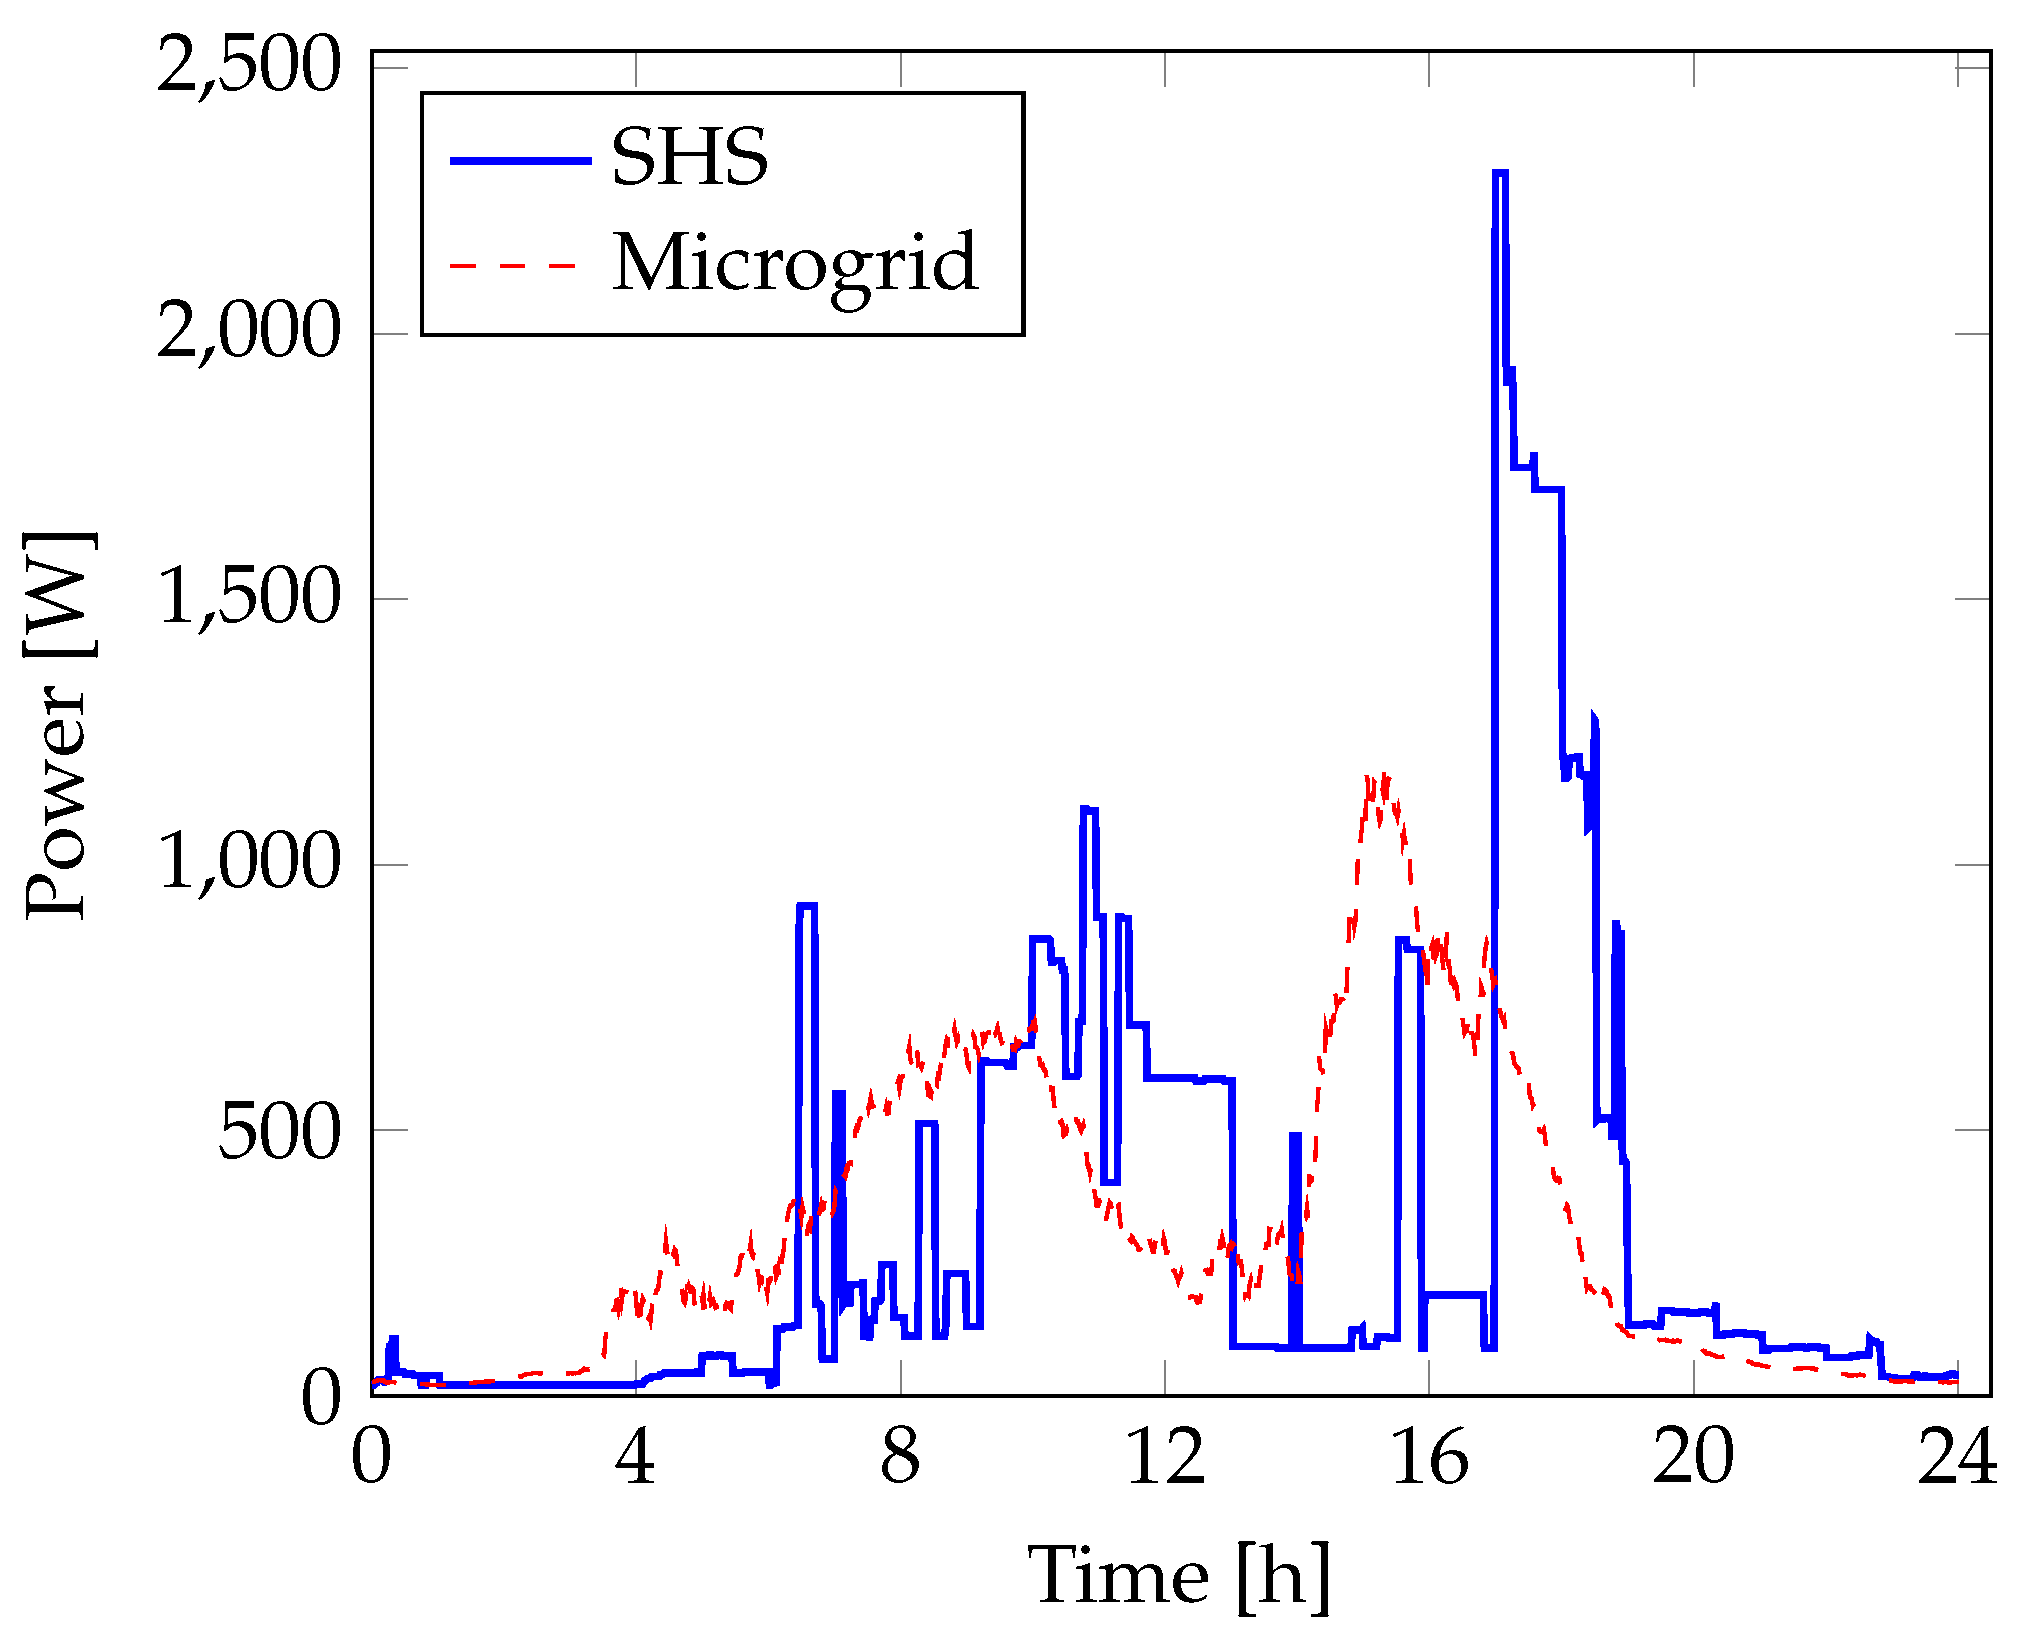
2.2. Stochastic Load Profiles

In a previous work by the authors, stochastic load profiles were constructed for the various tiers of the MTF [26]. Each load profile represents the electricity demand at the household level. Figure 1 shows sample load profiles from a representative day for tier 4 and tier 5 level electrified households. The household-level load profiles for all the tiers differ on a day-to-day basis; the datasets have been obtained from [26].
Table 2 shows the important load profile characteristics for each tier of the MTF, as obtained in the previous work [26].
As the focus of the work is to determine the adequacy, and quantify the benefits of, an SHS-based microgrid for higher tiers of electrification as compared to standalone SHSs, only tiers 4 and 5 have been considered in this study while modelling the energy exchange between the SHS in the microgrid.

2.3. System Metrics and Parameters

The system metrics used in this work are discussed below.

2.3.1. Loss of Load Probability (LLP)

The Loss of Load probability is a measure of the power supply availability of a system. It is defined as the ratio of the amount of time the system fails to deliver the demanded power to the total amount of operation time the system was designed to deliver power for [2]. When it comes to modelling and simulating off-grid systems, LLP is an application specific or a user-defined constraint. For e.g., in [2], the LLP over a year was constrained to 1.8%, in [11,12] a similar metric had a minimum limit of 2%, while in [9] different LLP thresholds were investigated for SHSs applications.
L L P = i = 1 N t downtime , i N
where t downtime , i takes a value of 1 if the system fails to deliver the expected load demand in the ith time interval, and 0 if the system fully meets the load requirement; N is the time duration of interest. t downtime , i is updated every minute as the system is modelled with a 1-min data resolution.

2.3.2. Unsatisfied Load Energy ( E fail )

E fail quantifies the unmet energy demand in kWh over a given period of time [9]. It can be mathematically defined as the summation of the unsatisfied energy over the time duration of interest for each time interval i (refer to Equation (2)).
E fail = i = 1 N E unsatisfied , i

2.3.3. Energy Dump ( E dump ) and Dump Ratio ( R dump )

This is the total amount of energy that is unused when the local battery is full and the load demand is met while the PV can still generate more power, considered over a year. A term dump ratio is introduced to make relative comparisons easier, which is the ratio between the total energy dump of the system in a year divided by the annual load energy need, as seen in Equation (3) [9].
R dump = E dump E load , year

2.3.4. Per Household Metrics

To translate the SHSs level metrics to the microgrid level, certain per household metrics are defined as the average metric per household in the microgrid. Specifically, these are:
  • Average LLP per household:
    L L P ¯ = i H L L P H
    where H is the total number of households in the microgrid.
  • Average R dump per household:
    R dump ¯ = i H R dump H
  • Average E fail per household:
    E fail ¯ = i H E fail H

2.4. Optimal Standalone SHSs Sizes for the MTF

As part of a recently concluded study by the authors on optimal sizing of standalone SHSs for the various tiers of the MTF [9], a multi-objective optimization was carried out to identify the optimal SHSs sizes. The multiple objectives were battery size, battery lifetime, loss of load probability and excess energy dump ratio, respectively. The study revealed the following SHS sizes, which were selected from the Pareto fronts based on the smallest battery size to meet the LLP thresholds; the optimal SHSs sizes across the tiers are summarized in Table 3 [9]. This will serve as the reference for comparing the performance of the interconnected SHS-based microgrid across the same system metrics.
As seen in Table 3, tiers 4 and 5 require very high sizes of standalone SHSs battery sizes. Also, no standalone SHSs size could satisfy the LLP threshold of ≤2% for tier 5 within the given constraints of the study (maximum R dump of 1, and maximum LLP of 0.1) [9]. As seen in Table 3, the lowest LLP achieved for tier 5 in the study [9] was 0.029.

2.5. SHS Interconnection-Based DC Microgrid

An interconnected SHS-based DC microgrid is expected to enable the excess energy sharing between the households while improving the overall system metrics of LLP and R dump . This section details the steps involved in modeling the energy exchange between different SHS in such a microgrid. A concept illustration of such an interconnected SHS-based microgrid is shown in Figure 2. One of the houses is shown without an installed SHSs (illustrated as a non-PV rooftop on the bottommost house), indicating that “load only” consumptive households can also be potentially part of such a microgrid to leverage the excess energy being produced from the PV of other SHS in the microgrid.

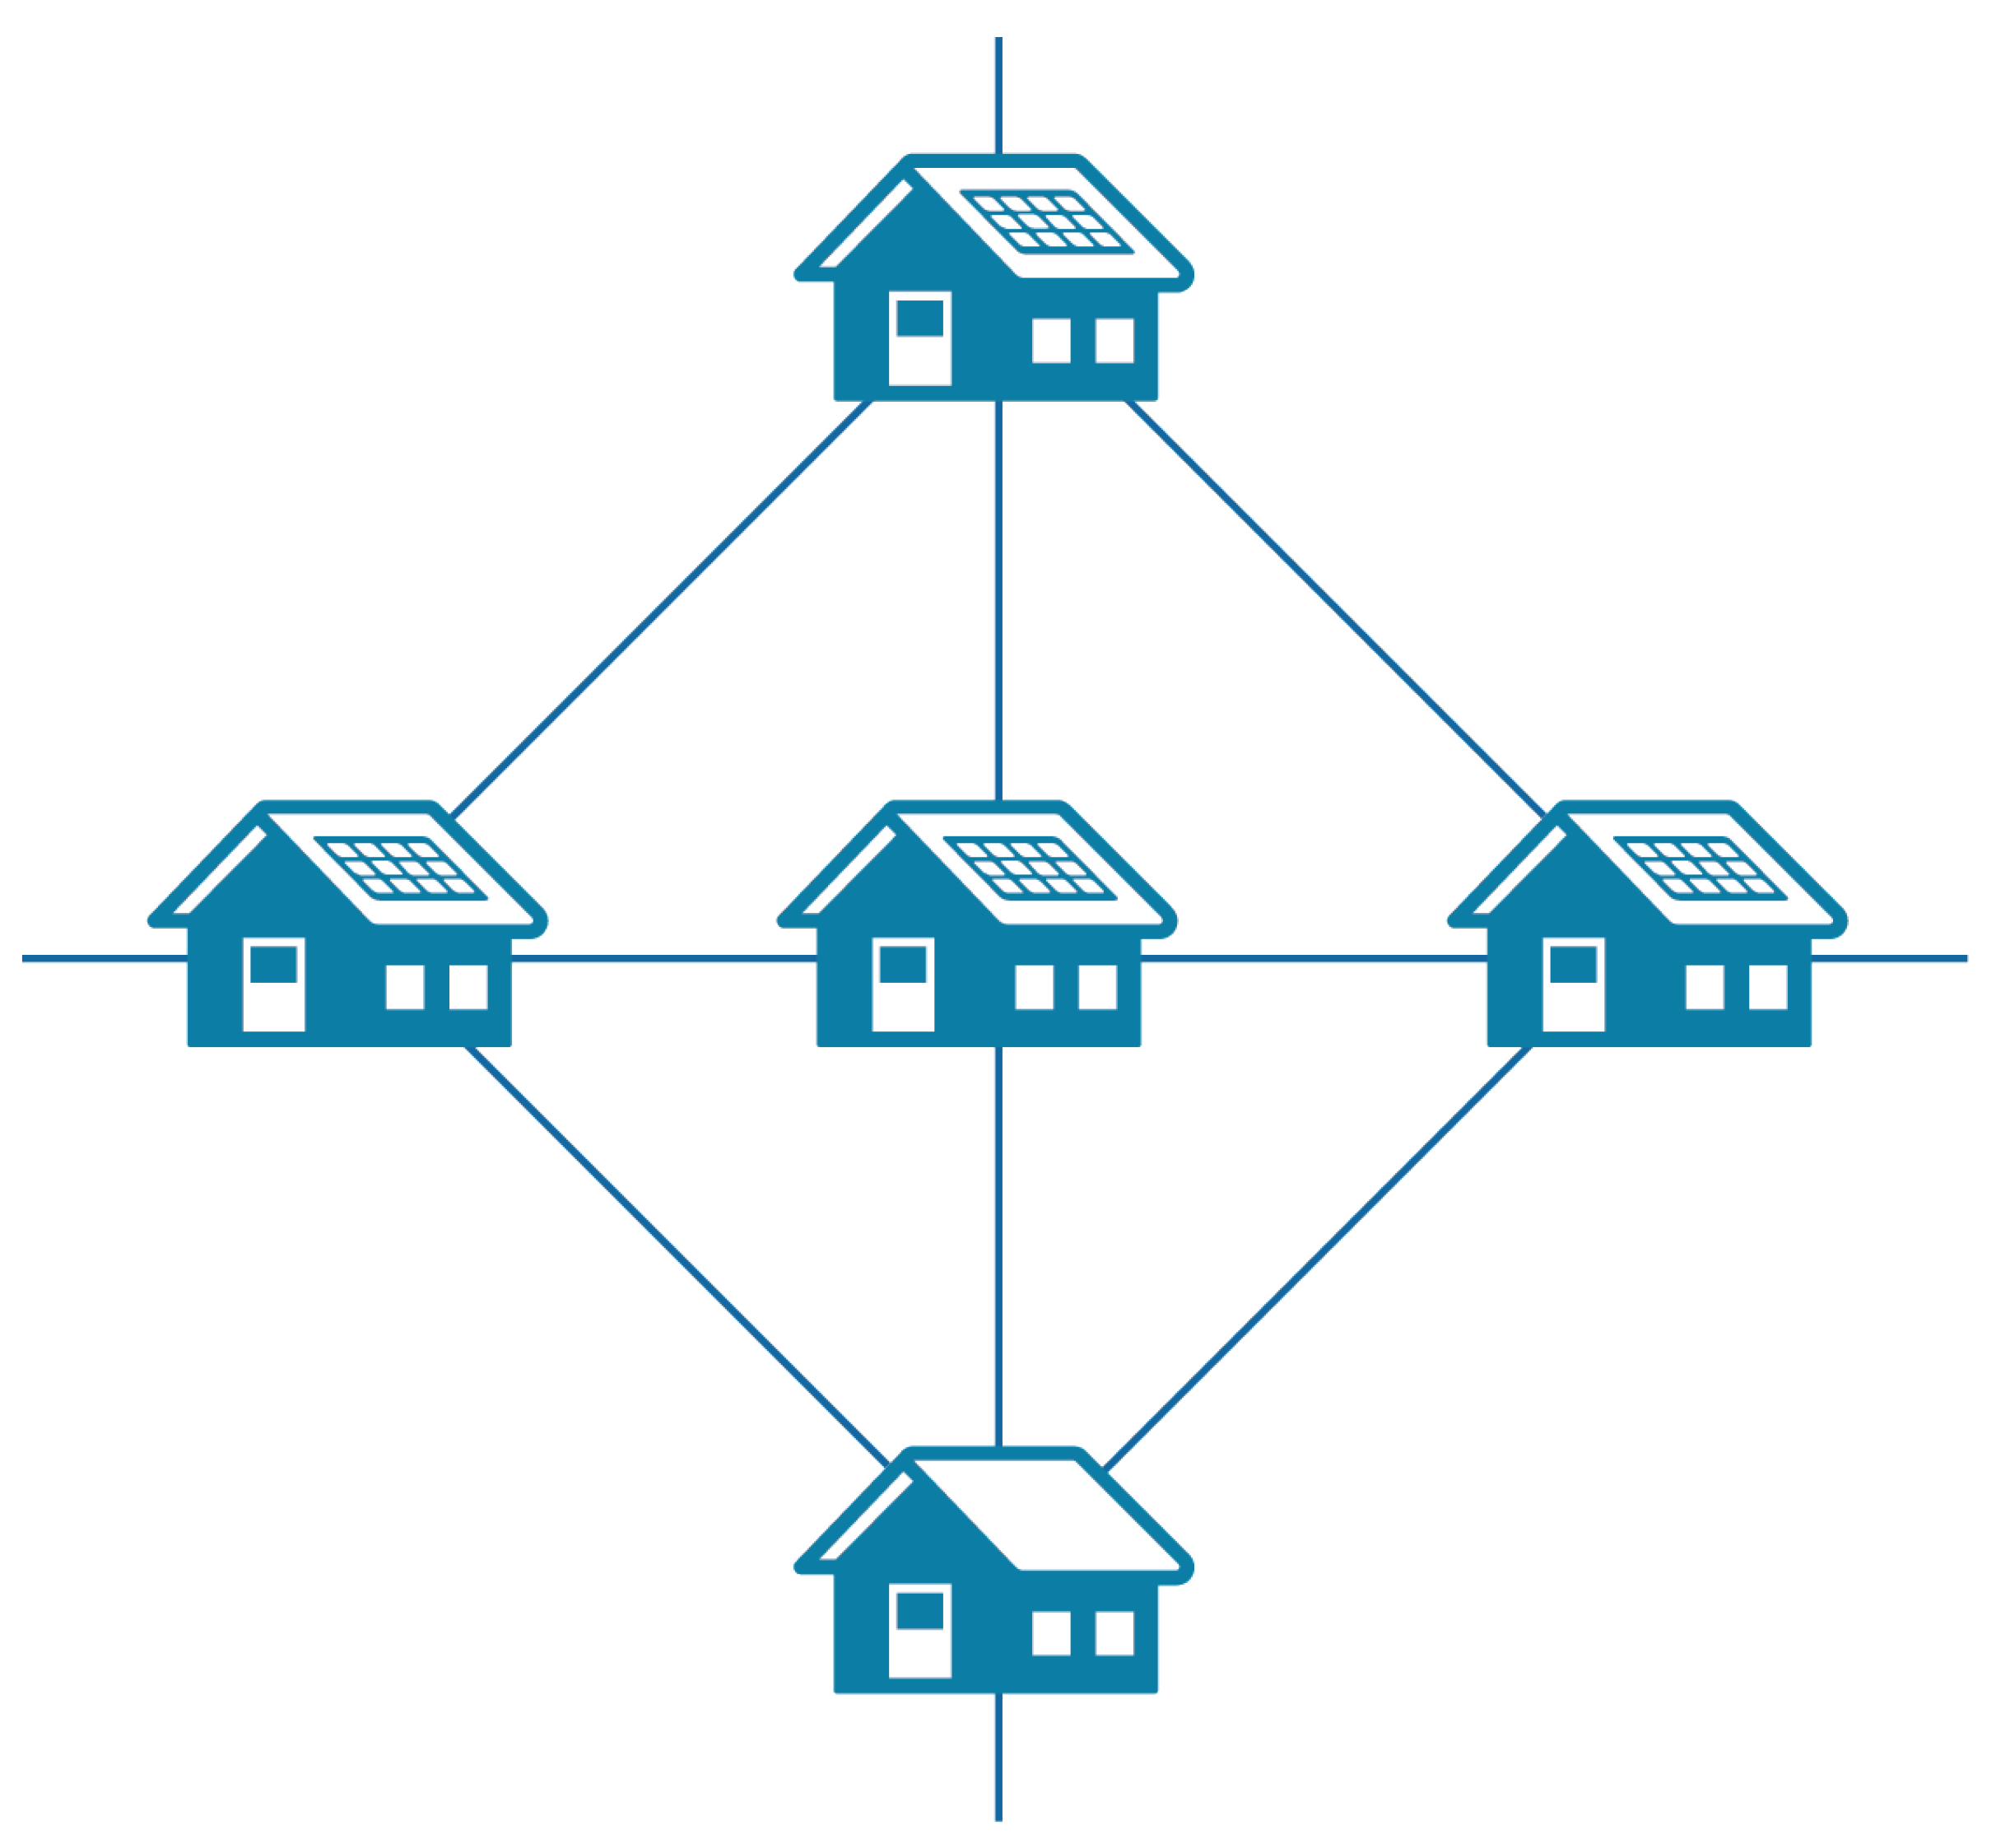
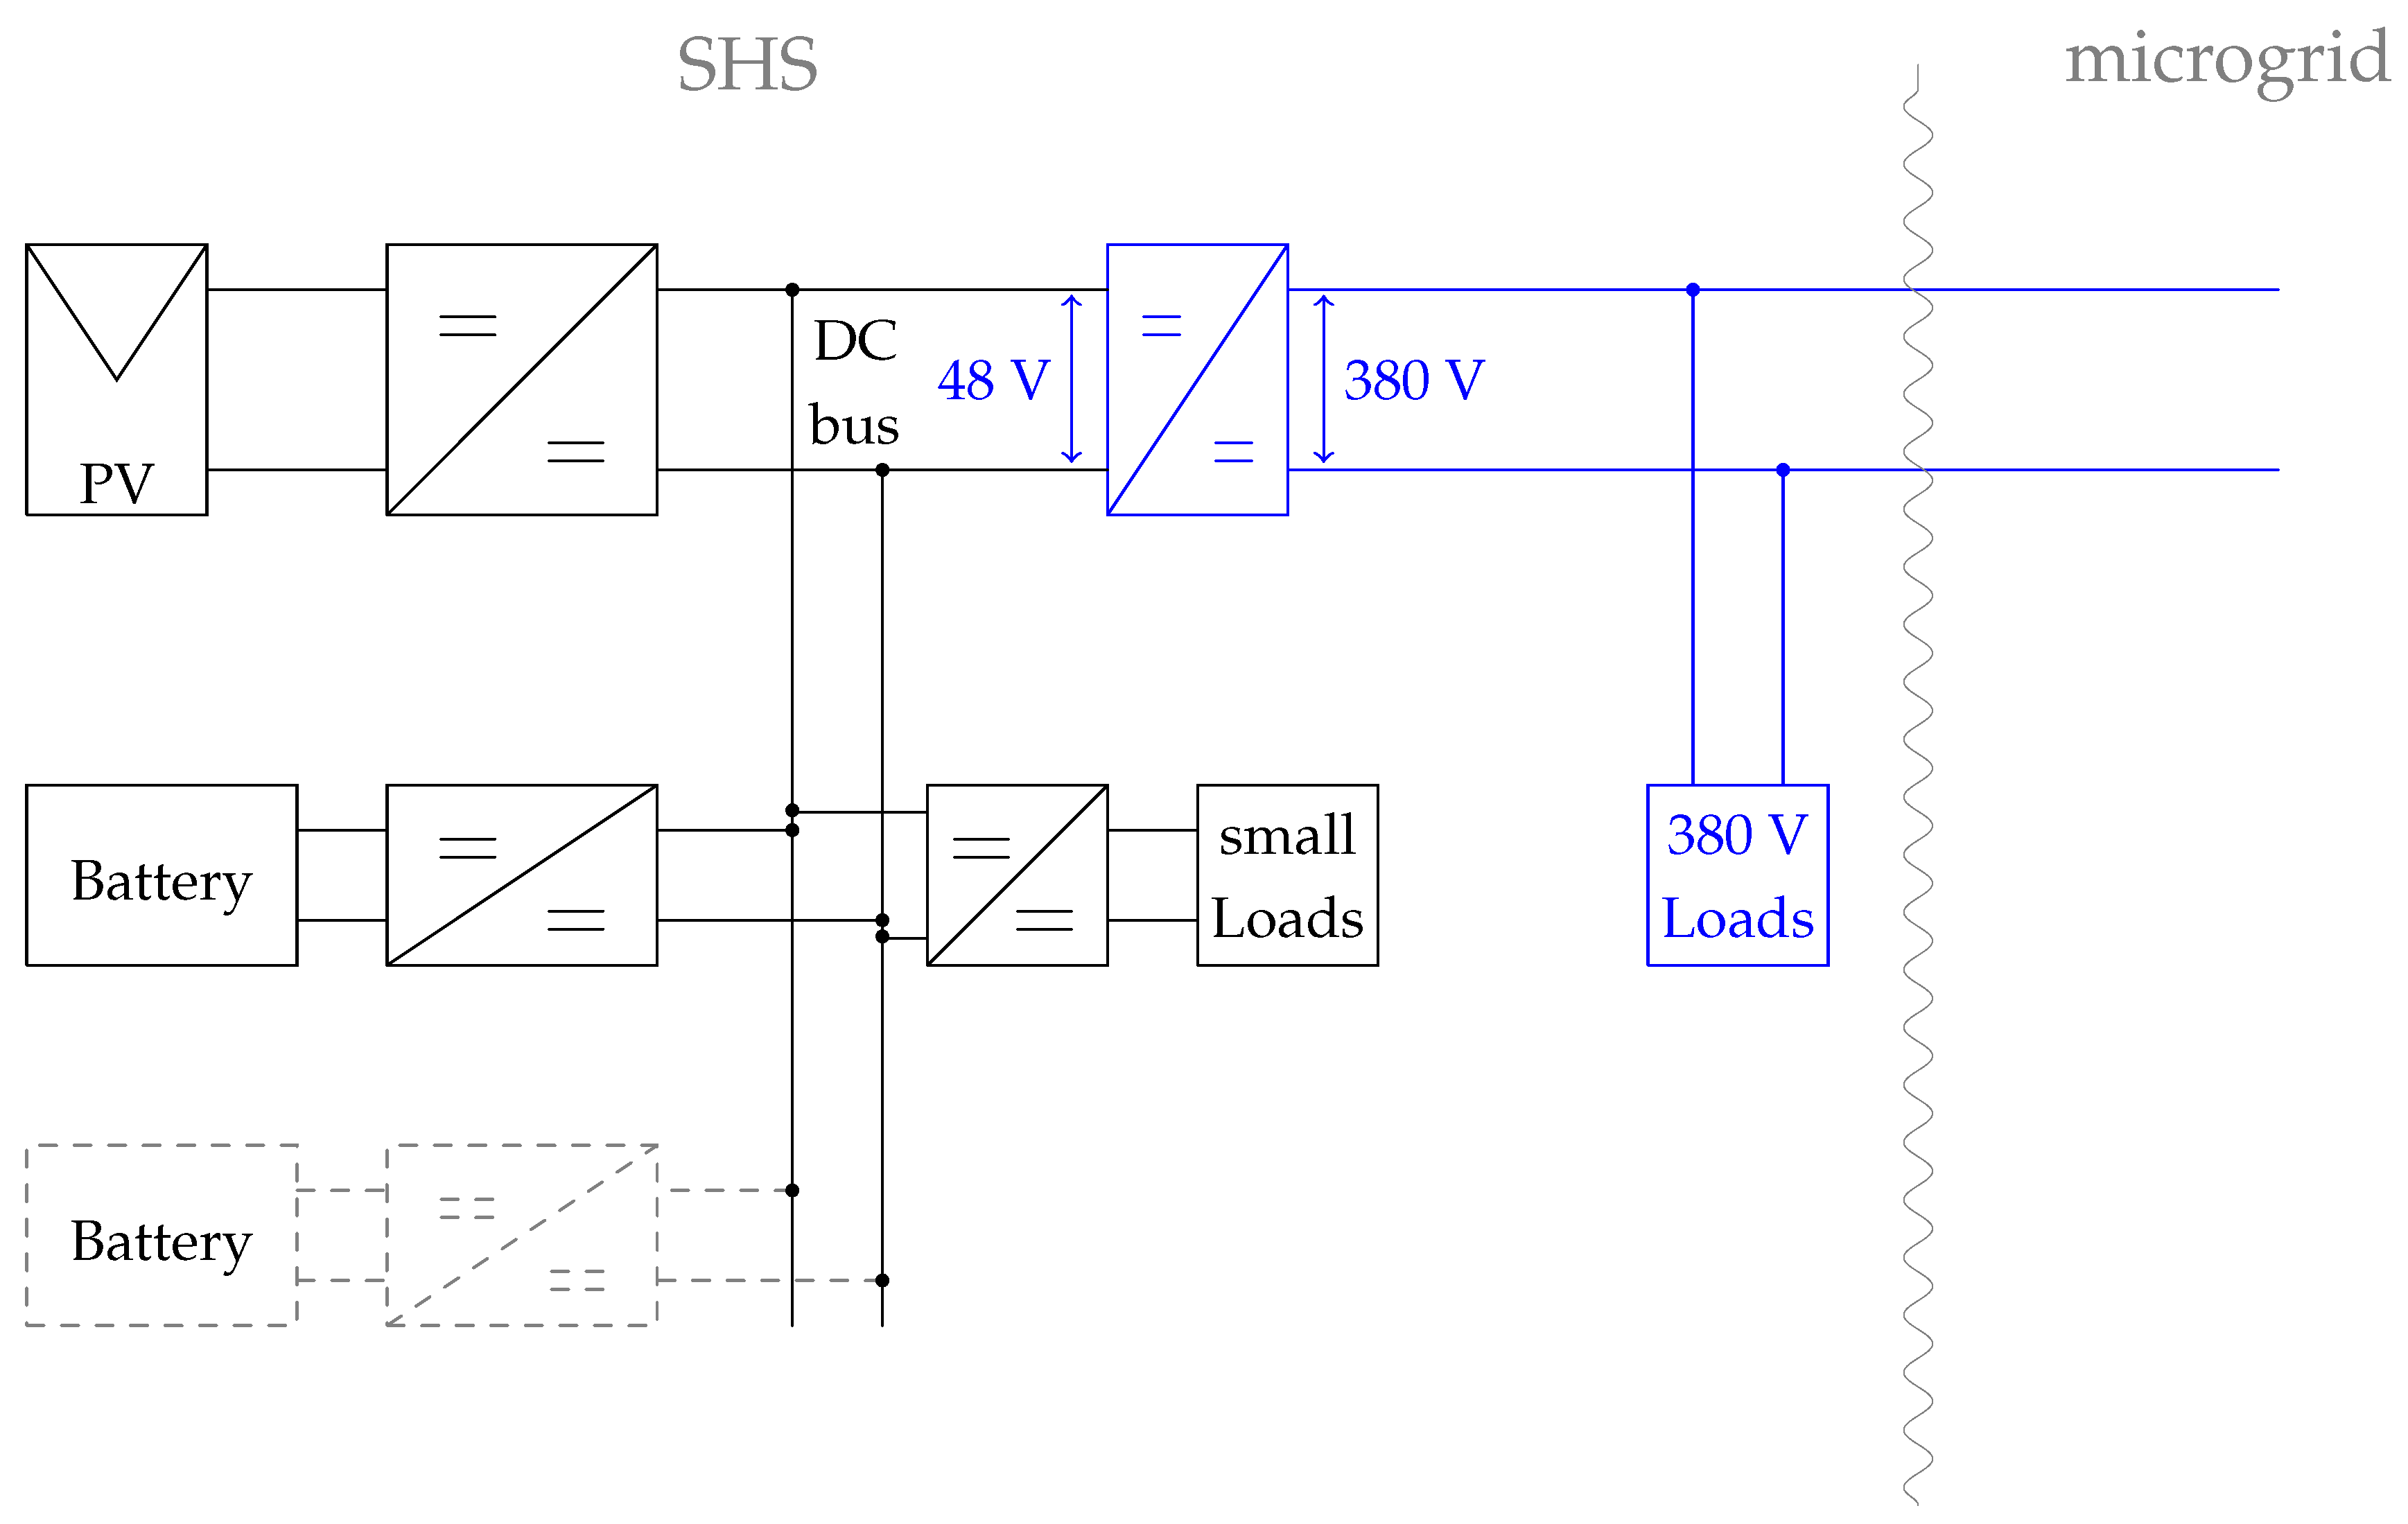
2.5.1. Modular SHS-Based Microgrid Architecture

Climbing up the so-called rural electrification ladder requires the architecture to support the expansion of the off-grid system to cater to increased load demand. On the other hand, the architecture should also allow for easy interconnectivity with other SHSs to form a meshed DC microgrid. Therefore, a modular architecture for SHSs is proposed that could potentially allow for expansion of the system at the household level, while also enabling scaling up of the microgrid size. Figure 3 shows the modular architecture.
All the SHSs components and DC loads are connected to the central DC bus via converters. The SHSs can be modularly expanded as shown in Figure 3 with the dashed battery at the bottom. The DC bus is assumed to be operated at a reference of 48 V, which has been tested in rural DC microgrid pilot in the past [32]. For the higher power loads, whether within a household (for tier 4/tier 5) or more communal loads like solar pumps, the higher voltage line is available that is operated at a reference of 380 V. This helps to keep the current and therefore cable losses low. Additionally, such an architecture also helps in scaling up this meshed DC microgrid, where more of such SHSs of different sizes could be interconnected. It is assumed that the power exchange capacity of such an architecture is only limited by the power demand of the high power loads on the 380 V bus.

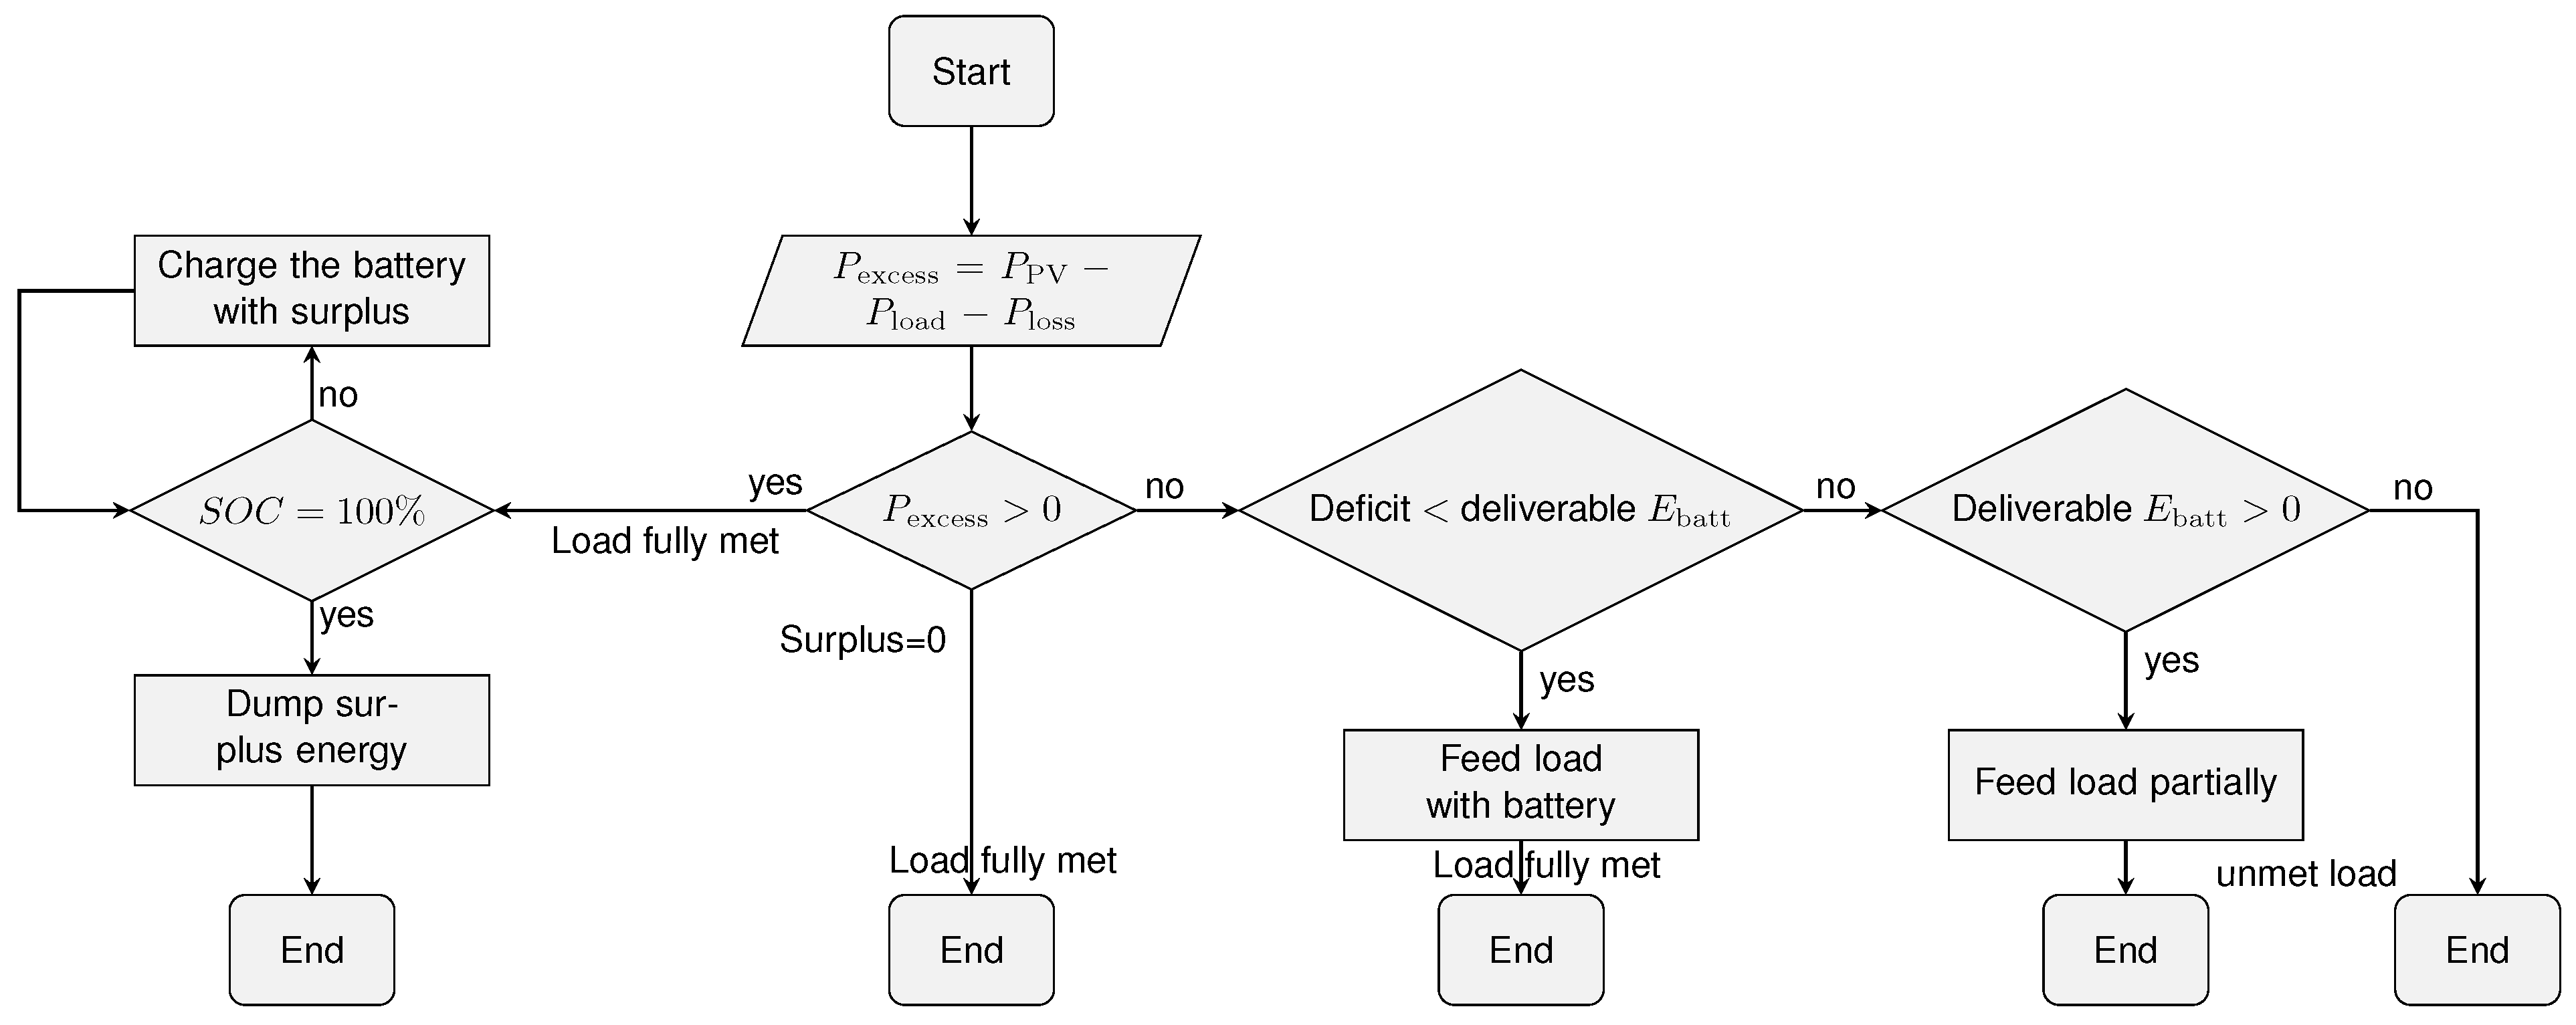
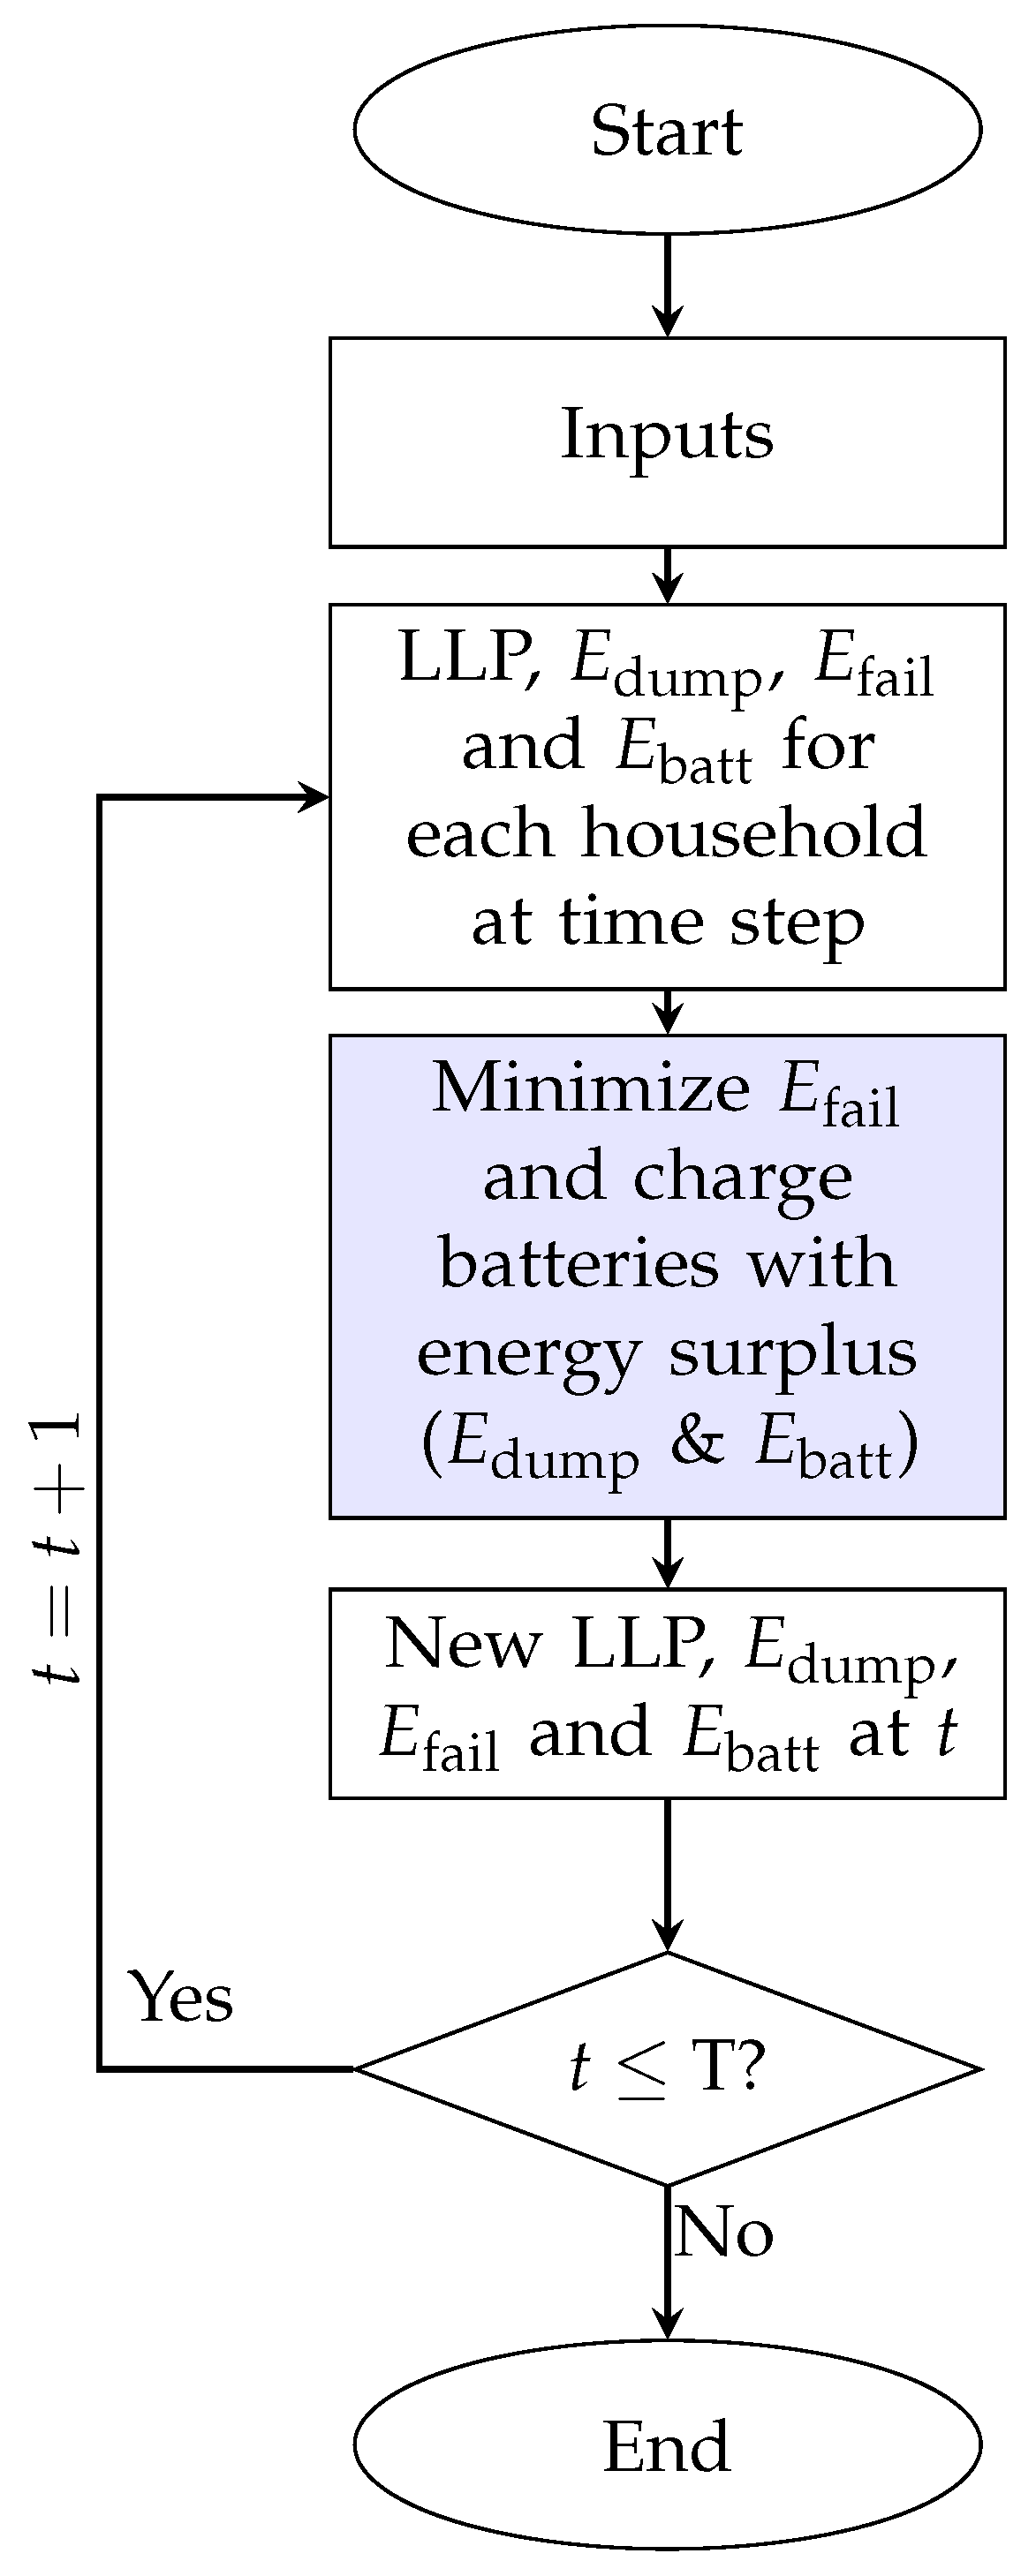
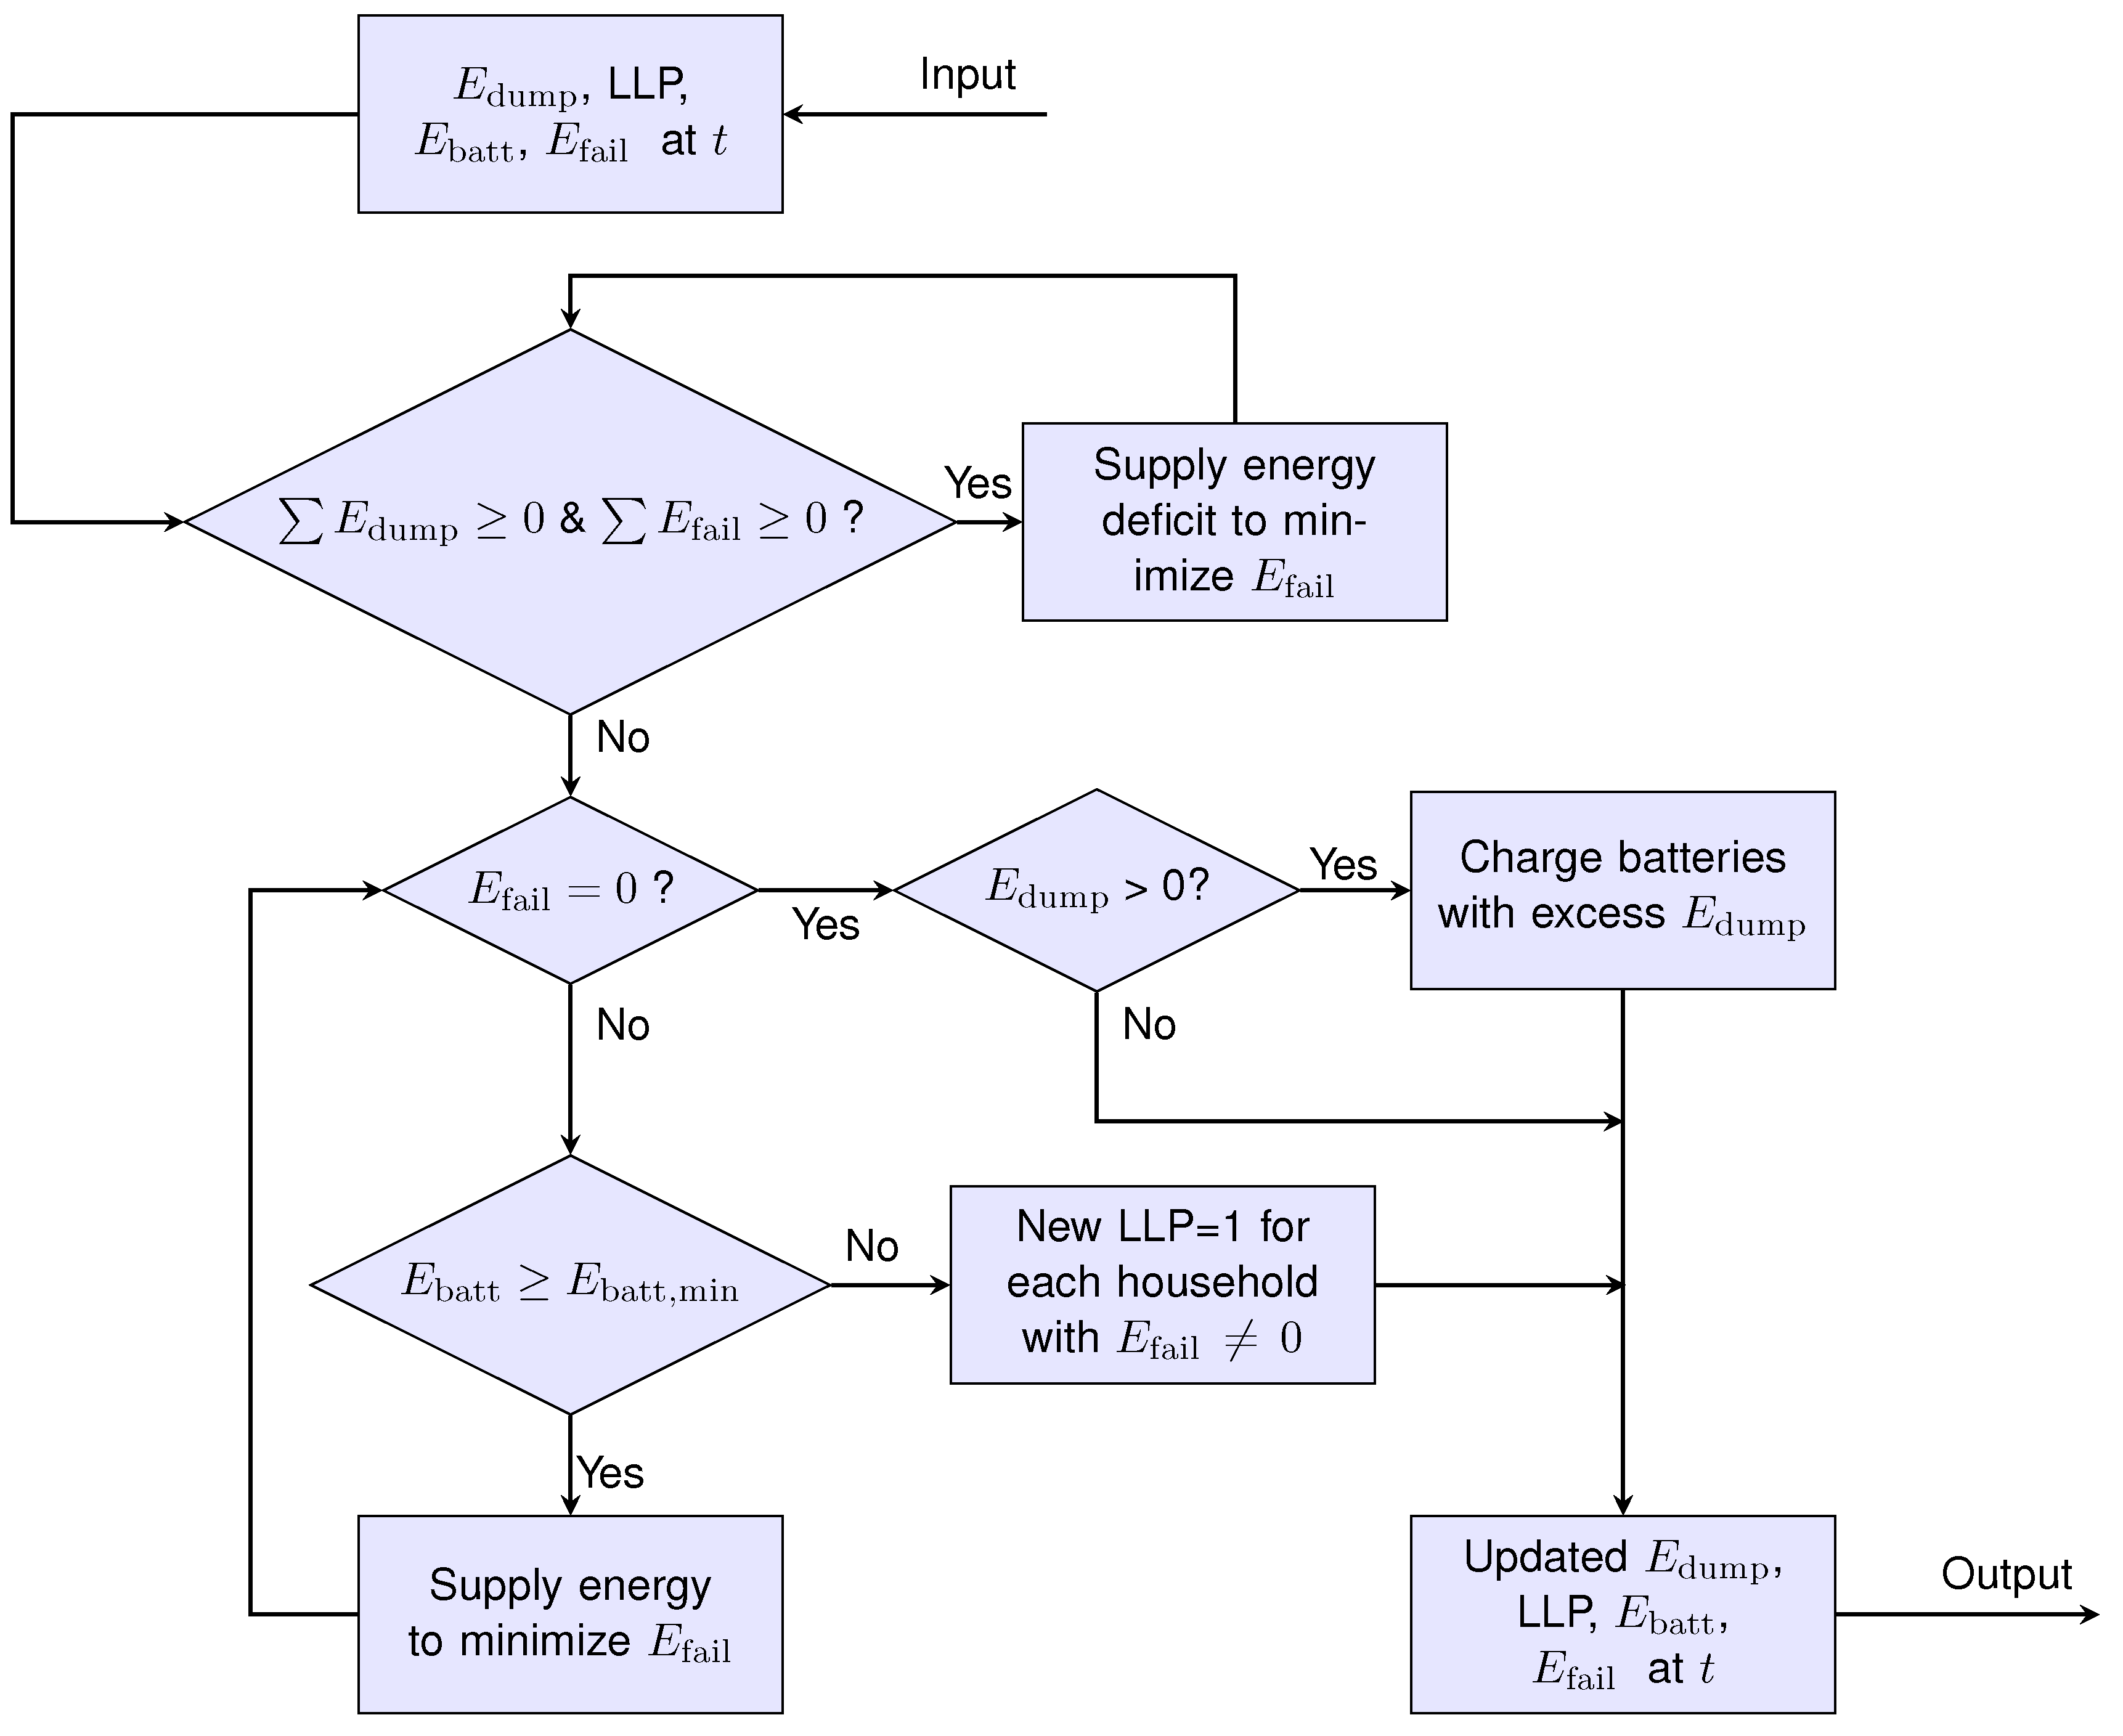
2.5.2. Power Management Scheme for Interconnected SHS-Based Microgrid Architecture

The detailed PV and storage modeling at every SHS level has been covered extensively in previous works by the authors in [2,9,33]. The power management scheme implemented at the SHS level is shown in the flowchart in Figure 4 [9]. This has been implemented on MATLAB. Here, E batt refers to the battery capacity in Wh in any time step.
While going from SHSs level to the interconnected SHS microgrid, additional information needs to be considered in every time step. Figure 5 shows the algorithm for the interconnected power management scheme. The same algorithm that occurs at every time step t in Figure 4 takes place in this scenario, and is repeated for each of the total number of households ‘H’. In this step, the LLP, E dump , E fail and E batt for each household are calculated.
The most important step in this algorithm is the energy sharing process that occurs towards the end of the time step, as indicated by the shaded process block in the flowchart in Figure 5. During this step, the energy sharing between the households takes place to balance the overall energy surplus and deficit in the microgrid. The entire process is detailed in Figure 6.
First, the LLP, E fail and E dump for each household are taken as inputs. The total dump obtained is used as the first measure to eliminate the energy deficit of the households in an ascending order as shown in Equation (7).
E fail , t = [ E fail , 1 , t , E fail , 2 , t , E fail , H , t ]
where E fail , t is the ordered array containing the energy deficit per household for time step t, E fail , i , t is the energy deficit in time step t for the i t h household, and E fail , i E fail , i + 1 . Hence, the household with the lowest energy deficit is the first to be supplied from the energy dump, and so on for the remaining households. Prioritizing the households with a low E fail minimizes the number of households with an E fail > 0 for time step t. This results in reducing the average LLP for the SHS community in the microgrid.
If there are still more households left with energy deficit, then the SHS batteries of the rest of the microgrid come into play. This happens when E dump , t = 0 & i = 1 H E fail , i , t > 0 . The available battery storage is then sorted in a descending order, where the SHS with the highest available battery energy is the first to supply energy to minimize the deficit.
E batt , t = [ E batt , 1 , t , E batt , 2 , t , E batt , H , t ]
where E batt , t is the matrix containing the battery per household for time step t, E batt , i , t is the battery energy in time step t for the i t h household, and E batt , i , t E batt , i + 1 , t . The energy deficit minimization process ends when
  • i = 1 H E fail , i , t = 0 or
  • E batt , i = E batt , min , i E batt , i
After this process, any household that still has an energy deficit has an LLP = 1 for that time step. In the case where all the energy deficit is satisfied but some excess energy still remains from E dump , the batteries in the microgrid are recharged. This can be done in multiple ways. In this study, 3 different excess energy sharing mechanisms are explored for charging the batteries with excess energy.

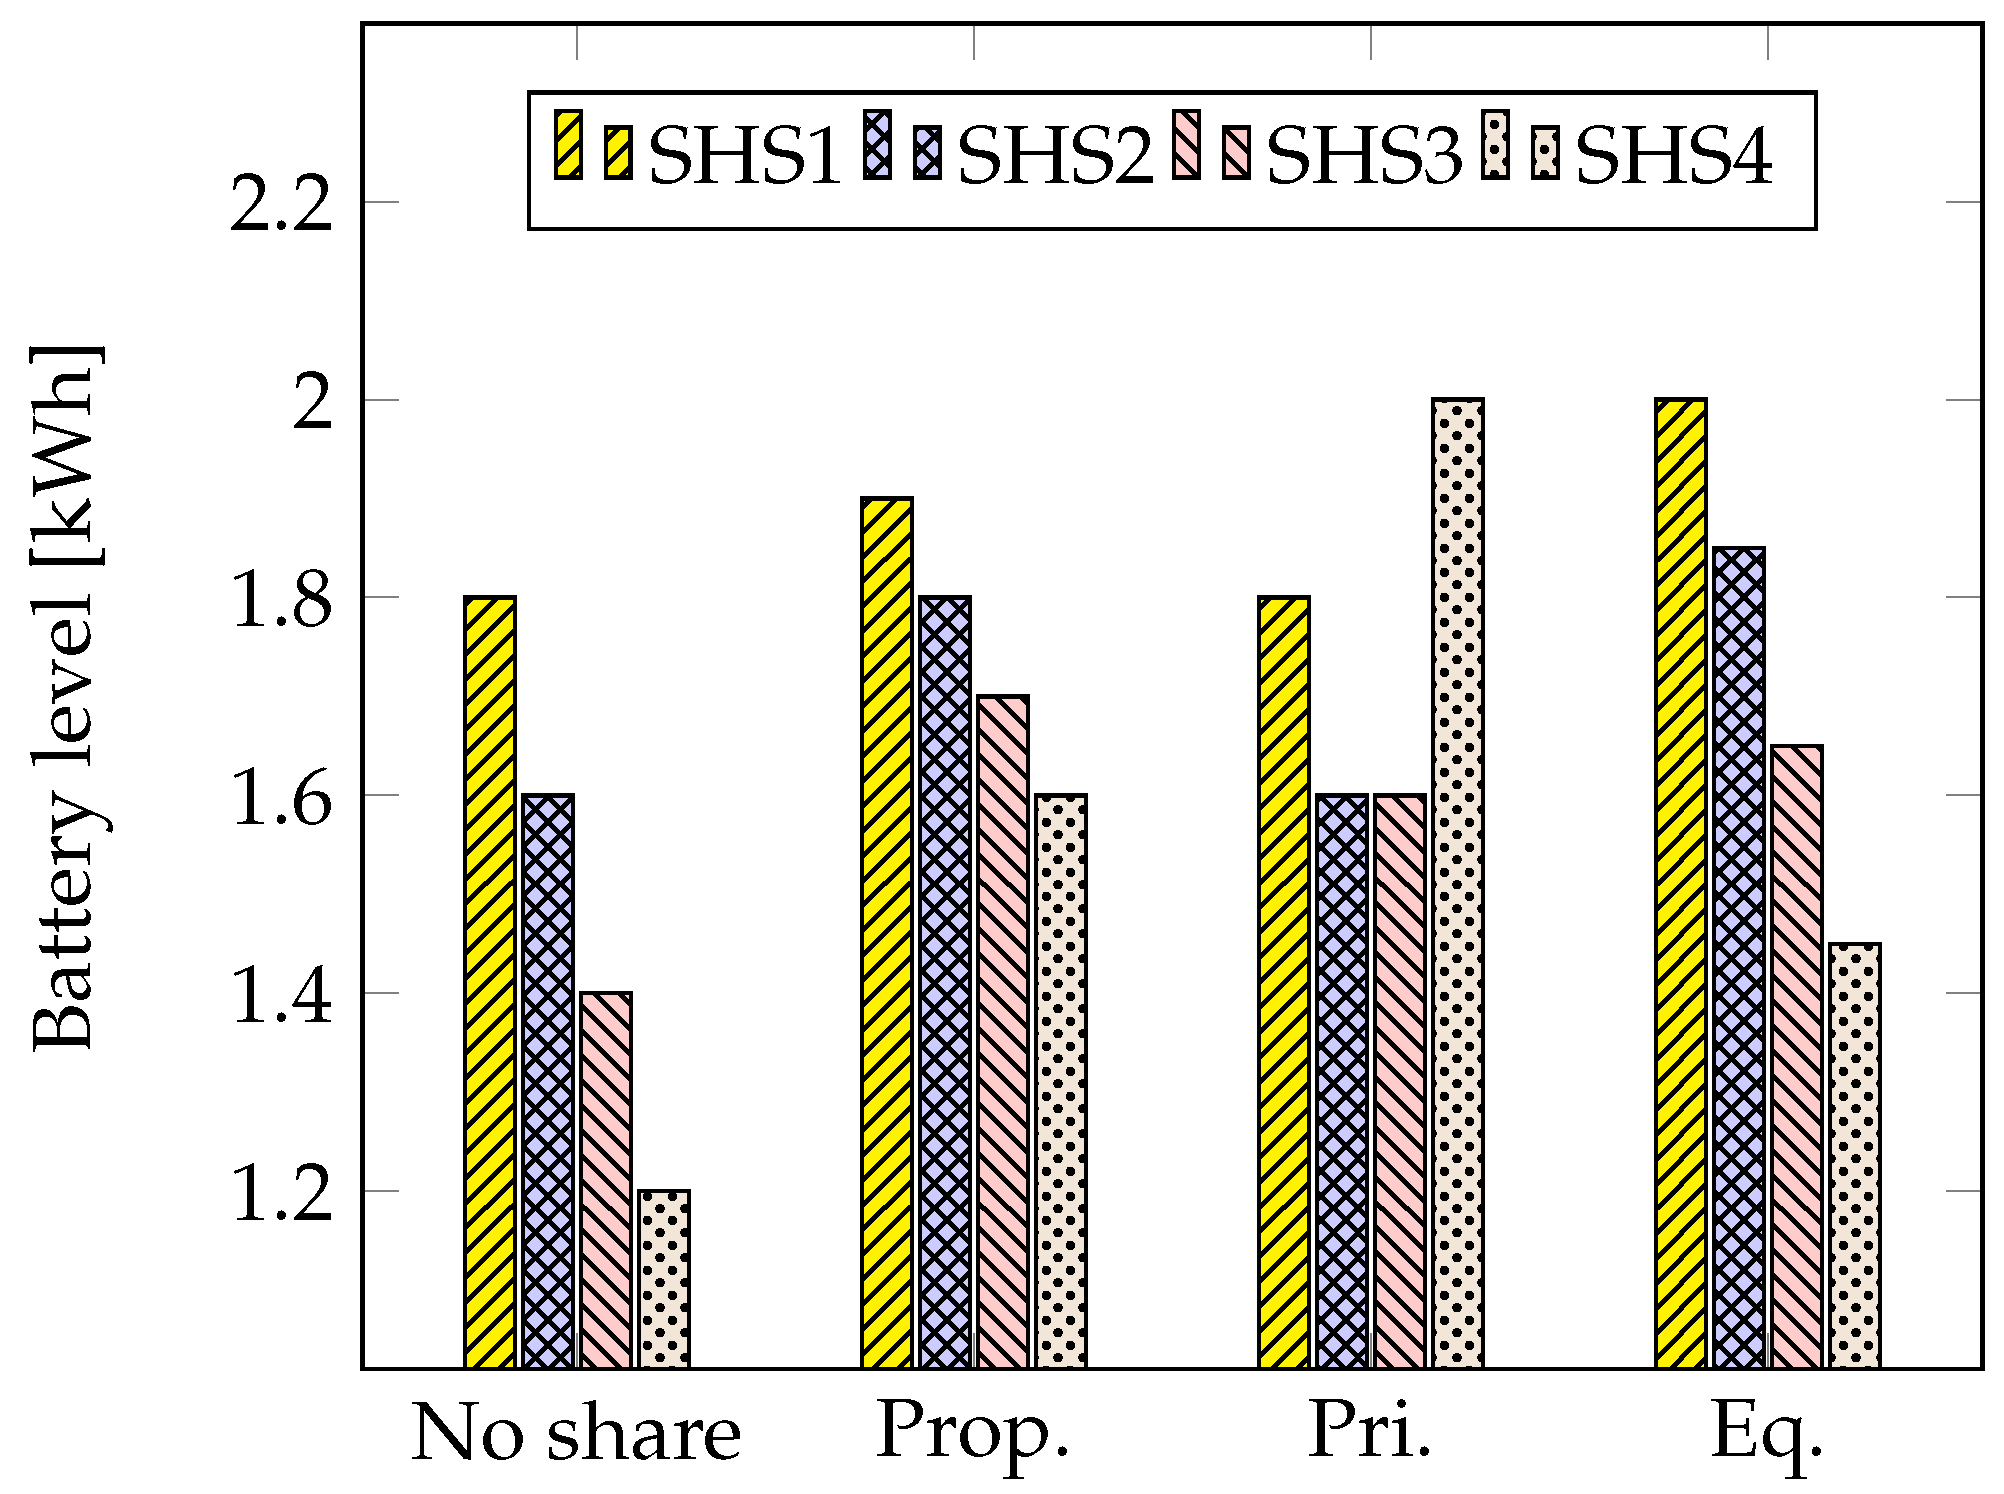
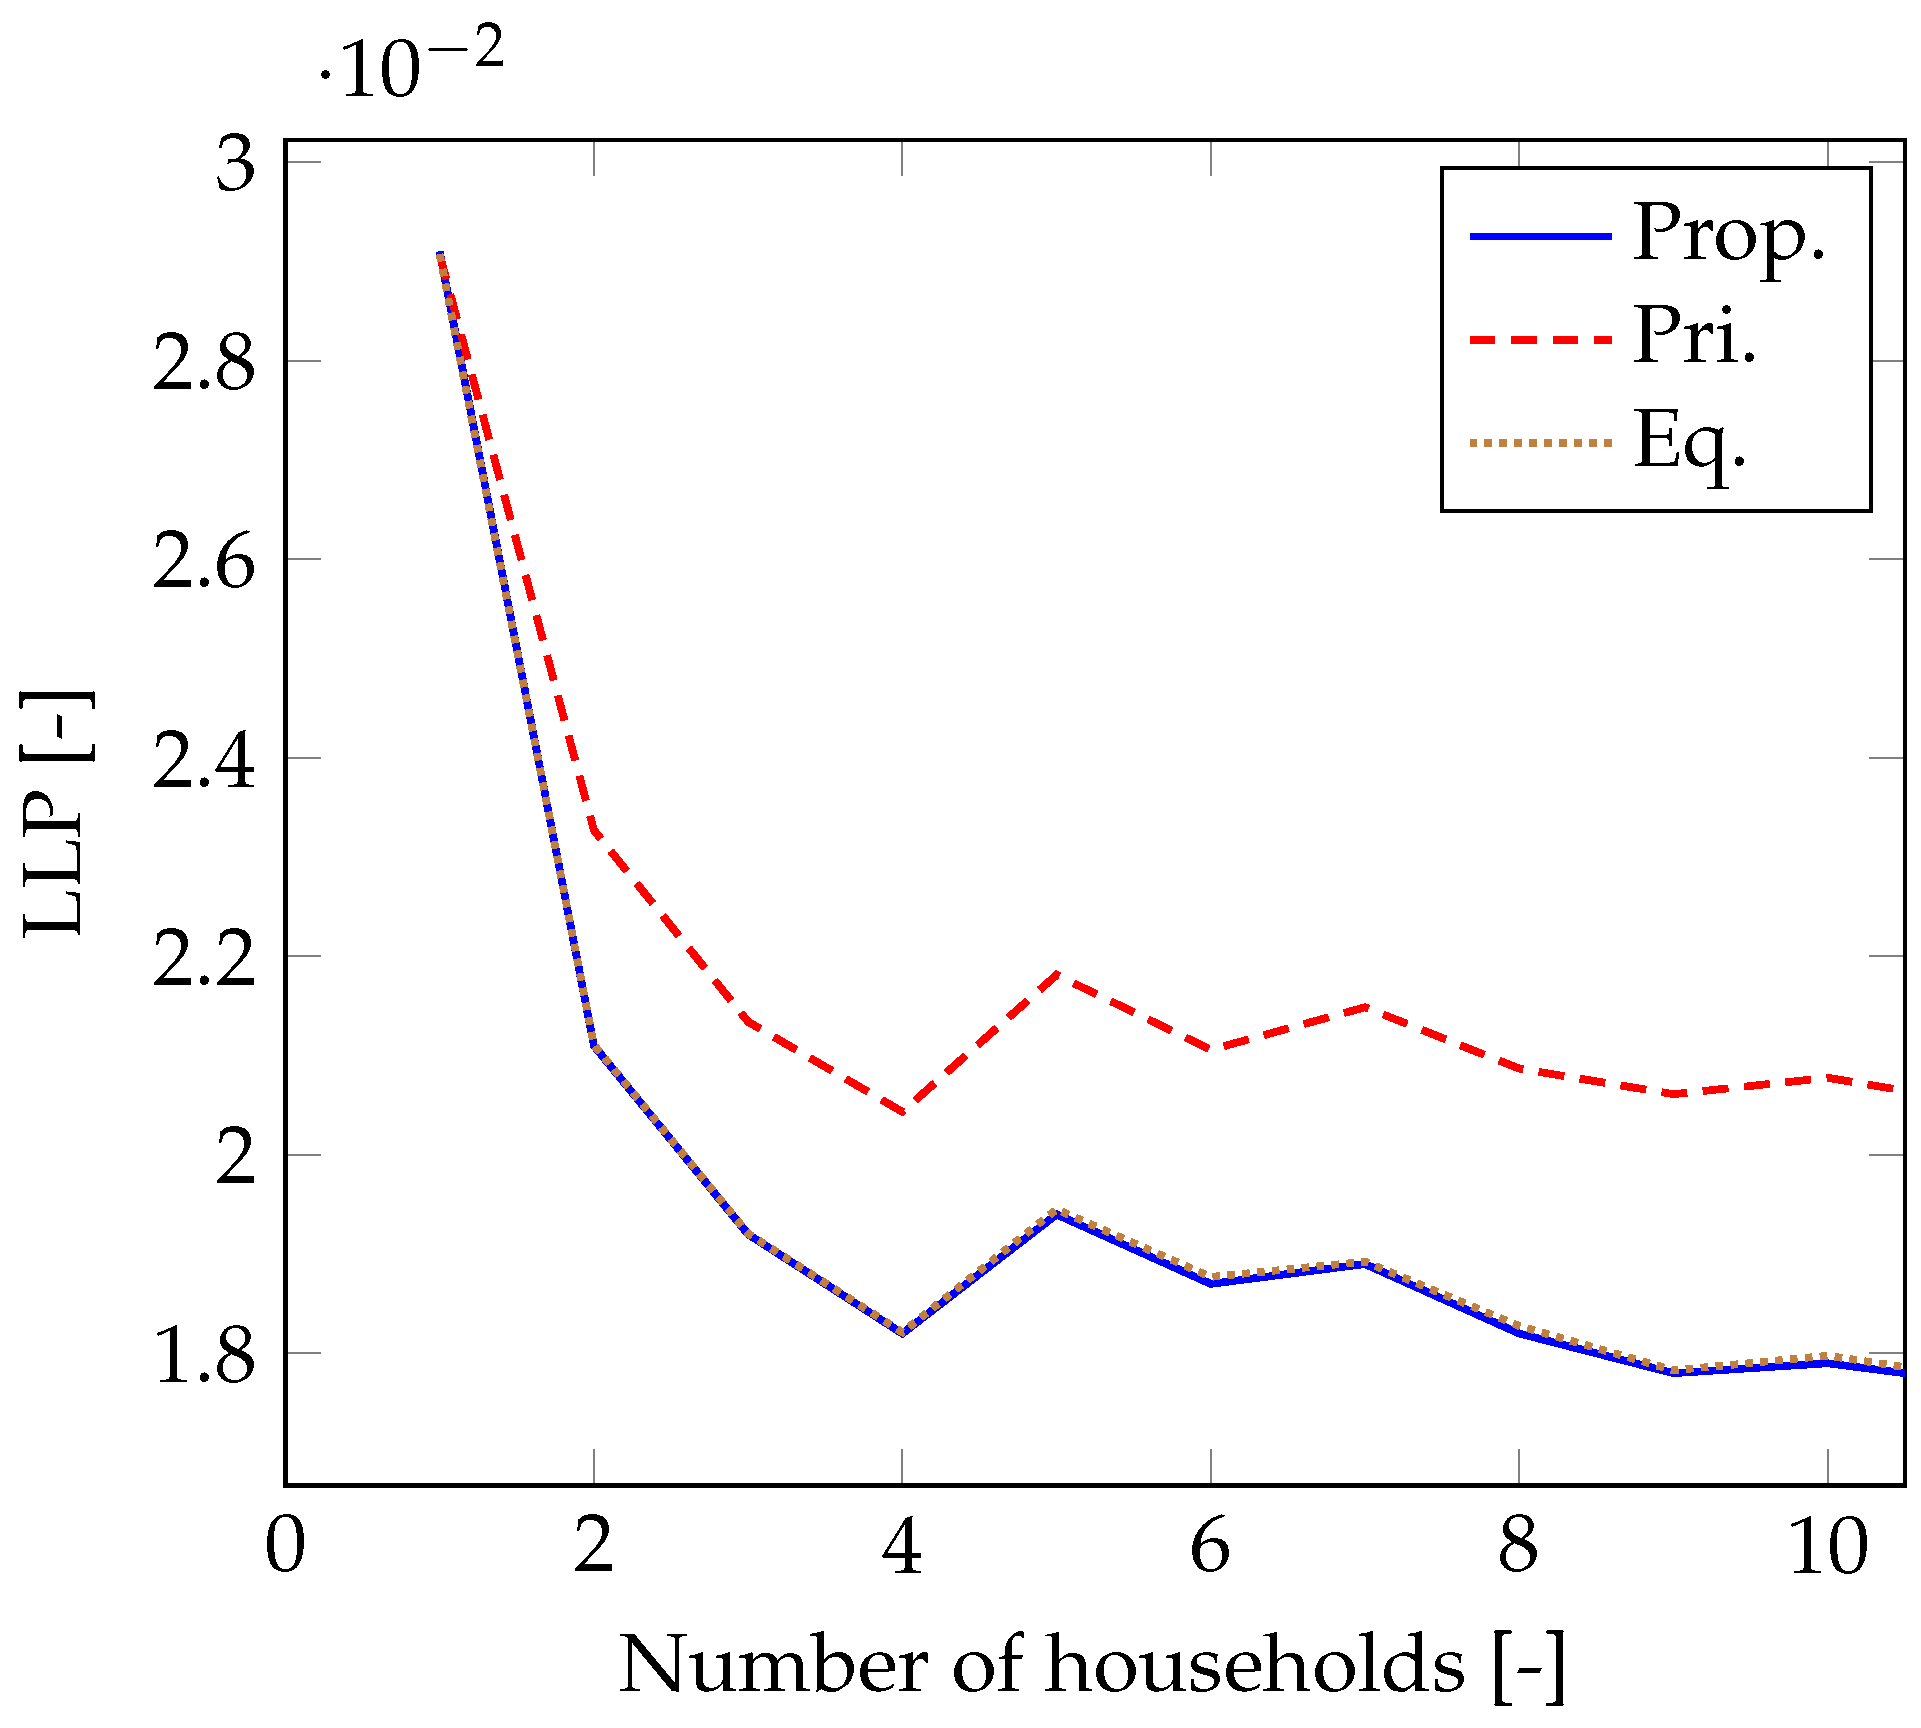
A DOD-Based Proportional Excess Energy Sharing

In this method, the excess energy is shared between the batteries based on their DOD levels, as shown in Equations (9) and (10).
E charge , i , t = x i , t . i = 1 H E dump , i , t
Where   x i , t = D O D i , t i = 1 H D O D i , t
where x i , t is the share of ith household out of the remaining surplus energy, E dump , i , t is the excess energy available from the ith household at time step t, and E charge , i , t is the energy allocated for sharing the battery of the ith household at time step t. Hence, the household with the highest DOD obtains the highest share from the available combined excess energy.
The concept of depth of discharge(DOD)-based proportional excess energy sharing can be best illustrated in the following example. Suppose there are 4 SHS (SHS1, SHS2, SHS3, and SHS4) with respective battery DOD levels of 10%, 20%, 30%, and 40% at time t wherein the individual load deficits have already been already taken care of. Suppose there is still a total excess E dump of 1 kWh available, while each battery has a rated capacity of 2 kWh. Consequently, through the DOD-based, proportional excess energy sharing method described in Equations (9) and (10), the 4 batteries will be recharged. Figure 7 shows the battery energy before and after the total excess energy is distributed. The recharged energy for each battery will also be in the proportion of 1:2:3:4 (as the DOD), and therefore each battery receives 100 Wh, 200 Wh, 300 Wh, and 400 Wh, respectively.

Priority Excess Energy Sharing

In this method, the excess energy is shared amongst the batteries in a ranked manner. The batteries are prioritized based on the DOD. Therefore, the highest DOD battery first receives the excess energy until it is full, then the next highest DOD-level battery gets the energy, if any, until it is full, and so on. In the context of the above example in Figure 7, the priority sharing would ensure that battery 4, owing to its highest DOD gets fully charged to 2 kWh. The remaining 200 Wh goes to battery 3, which charges up to 1.6 kWh, same as battery 2 at the end of the time step.

Equal Excess Energy Sharing

In this method, the excess energy is shared equally amongst the batteries irrespective of their DOD. Therefore, in the context of the example shown in Figure 7, the equal sharing would result in each battery getting 250 Wh of energy. It can be seen that battery 1 does not charge beyond 2 kWh, its maximum capacity, leading to a waste of 50 Wh. The equal sharing method can, therefore, be suboptimal in excess energy sharing.
It is interesting to note that these methods for sharing of the excess energy do not necessarily create a uniform SOC across the microgrid. That is, SOC balancing of SHS batteries in the microgrid is not the aim of these excess energy sharing methods.

2.5.3. Case Study: Homogeneous Microgrids
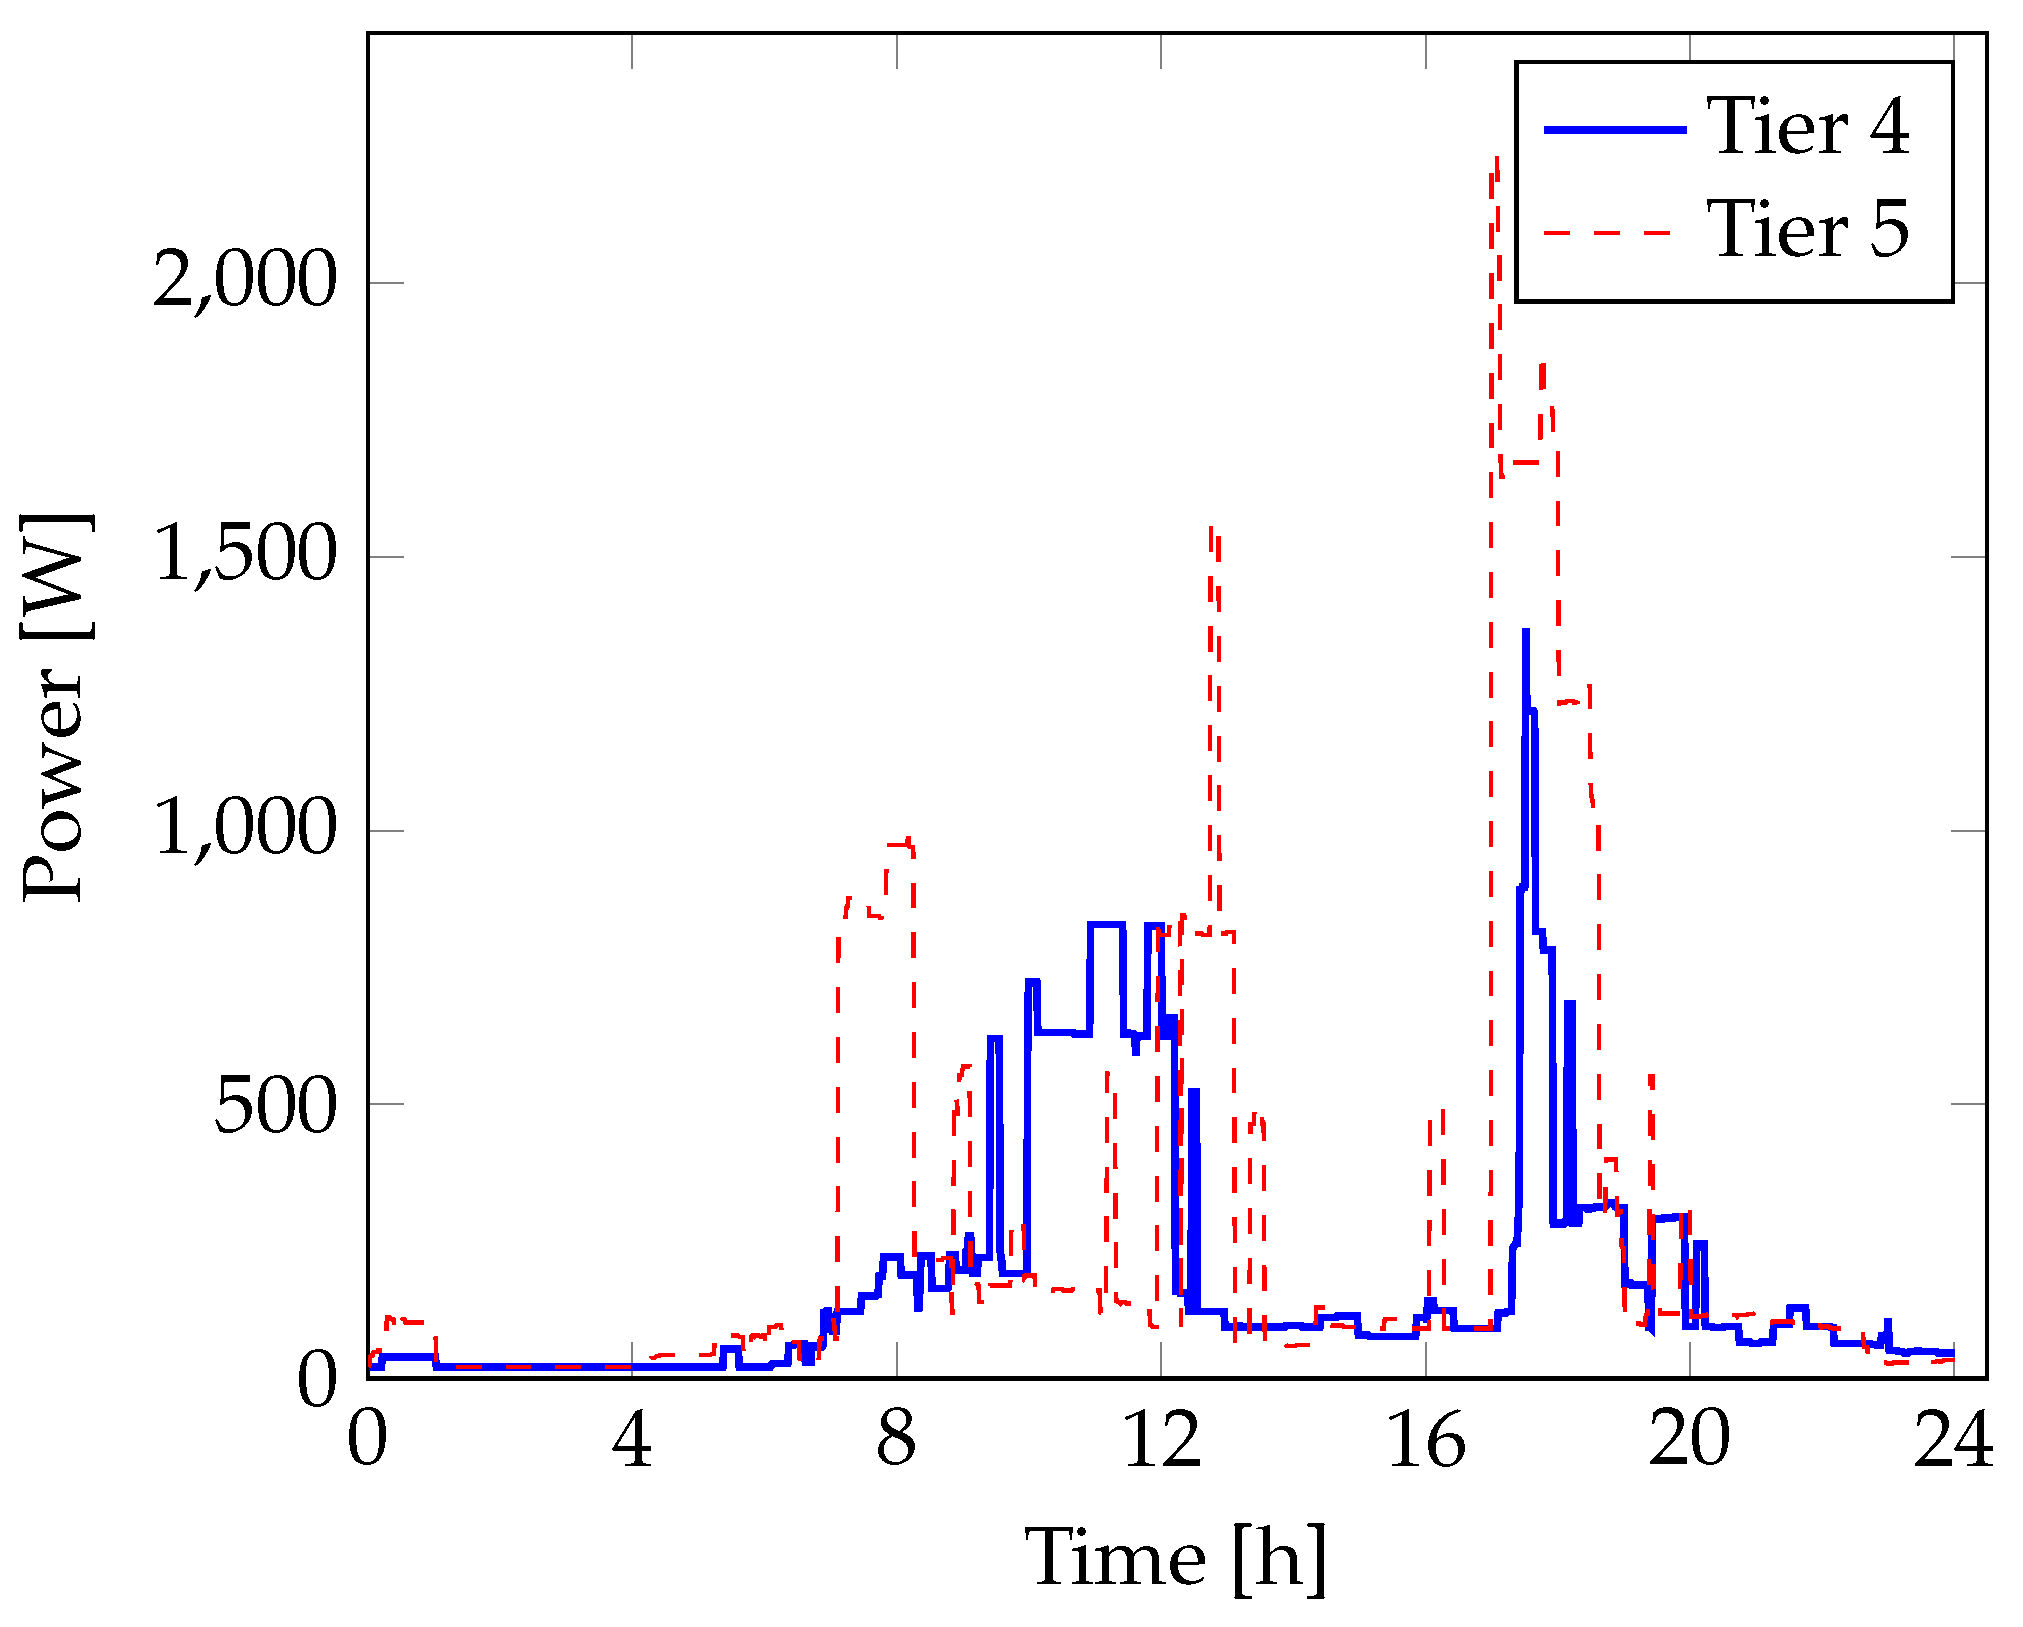
Two different case studies have been considered, viz., a homogeneous microgrid of tier 4 SHS and a homogeneous microgrid of tier 5 SHS. Having a homogeneous microgrid makes for easier comparison in terms of the system metric gains per household. However, the study can also be extended to heterogeneous microgrids consisting of SHS belonging to different tiers and sizes.

Tier 4 Microgrid

Based on the optimal SHS sizes mentioned in Table 3, each SHS was modelled with a PV size of 1740 Wp and battery size of 3560 Wh. Additionally, the microgrid size was varied between 2 to 50 households. The average load profile for the homogeneous tier 4 microgrid of 50 households is shown in Figure 8 along with the load profile for a single household for a representative day in the one-year long simulation.

Tier 5 Microgrid

Similar to the tier 4 case, each SHS was modelled based on the optimal SHS sizes (mentioned in Table 3), viz., a PV size of 4000 Wp and battery size of 6600 Wh. Additionally, the microgrid size was varied between 2 to 50 households. The average load profile for the tier 5 microgrid for 50 households is shown along with the load profile for a standalone SHS for tier 5 in Figure 9.

2.5.4. Scope of the SHS-Based Microgrid Study

It should be noted that the concept of the interconnected SHS-based microgrid is explored from the point-of-view of the overall benefits of energy sharing between SHS and the maximum potential consequent improvement in the system metrics for the microgrid as a whole. Accordingly, the study described in this paper assumes perfect knowledge of the battery states of every SHS for sharing energy.

3. Results and Discussion

Based on the modeling methodology described in Section 2.5, two SHS-based homogeneous microgrids were modeled comprising tier 4 and tier 5 households respectively. Firstly, the concept of energy sharing in the microgrid as explained in Section 2.5 is demonstrated in a scaled down case of two SHSs. Secondly, using the optimal SHS sizes of PV and battery for tier 4 and 5 as shown in Table 3, the microgrid was simulated for an increasing number of households. The performance of the overall system in terms of LLP and E fail per household for increasing mcirogrid sizes is analyzed in Section 3.3. Finally, the benefits in the system sizing for the individual SHS participating in the microgrid case is also shown in Section 3.4.

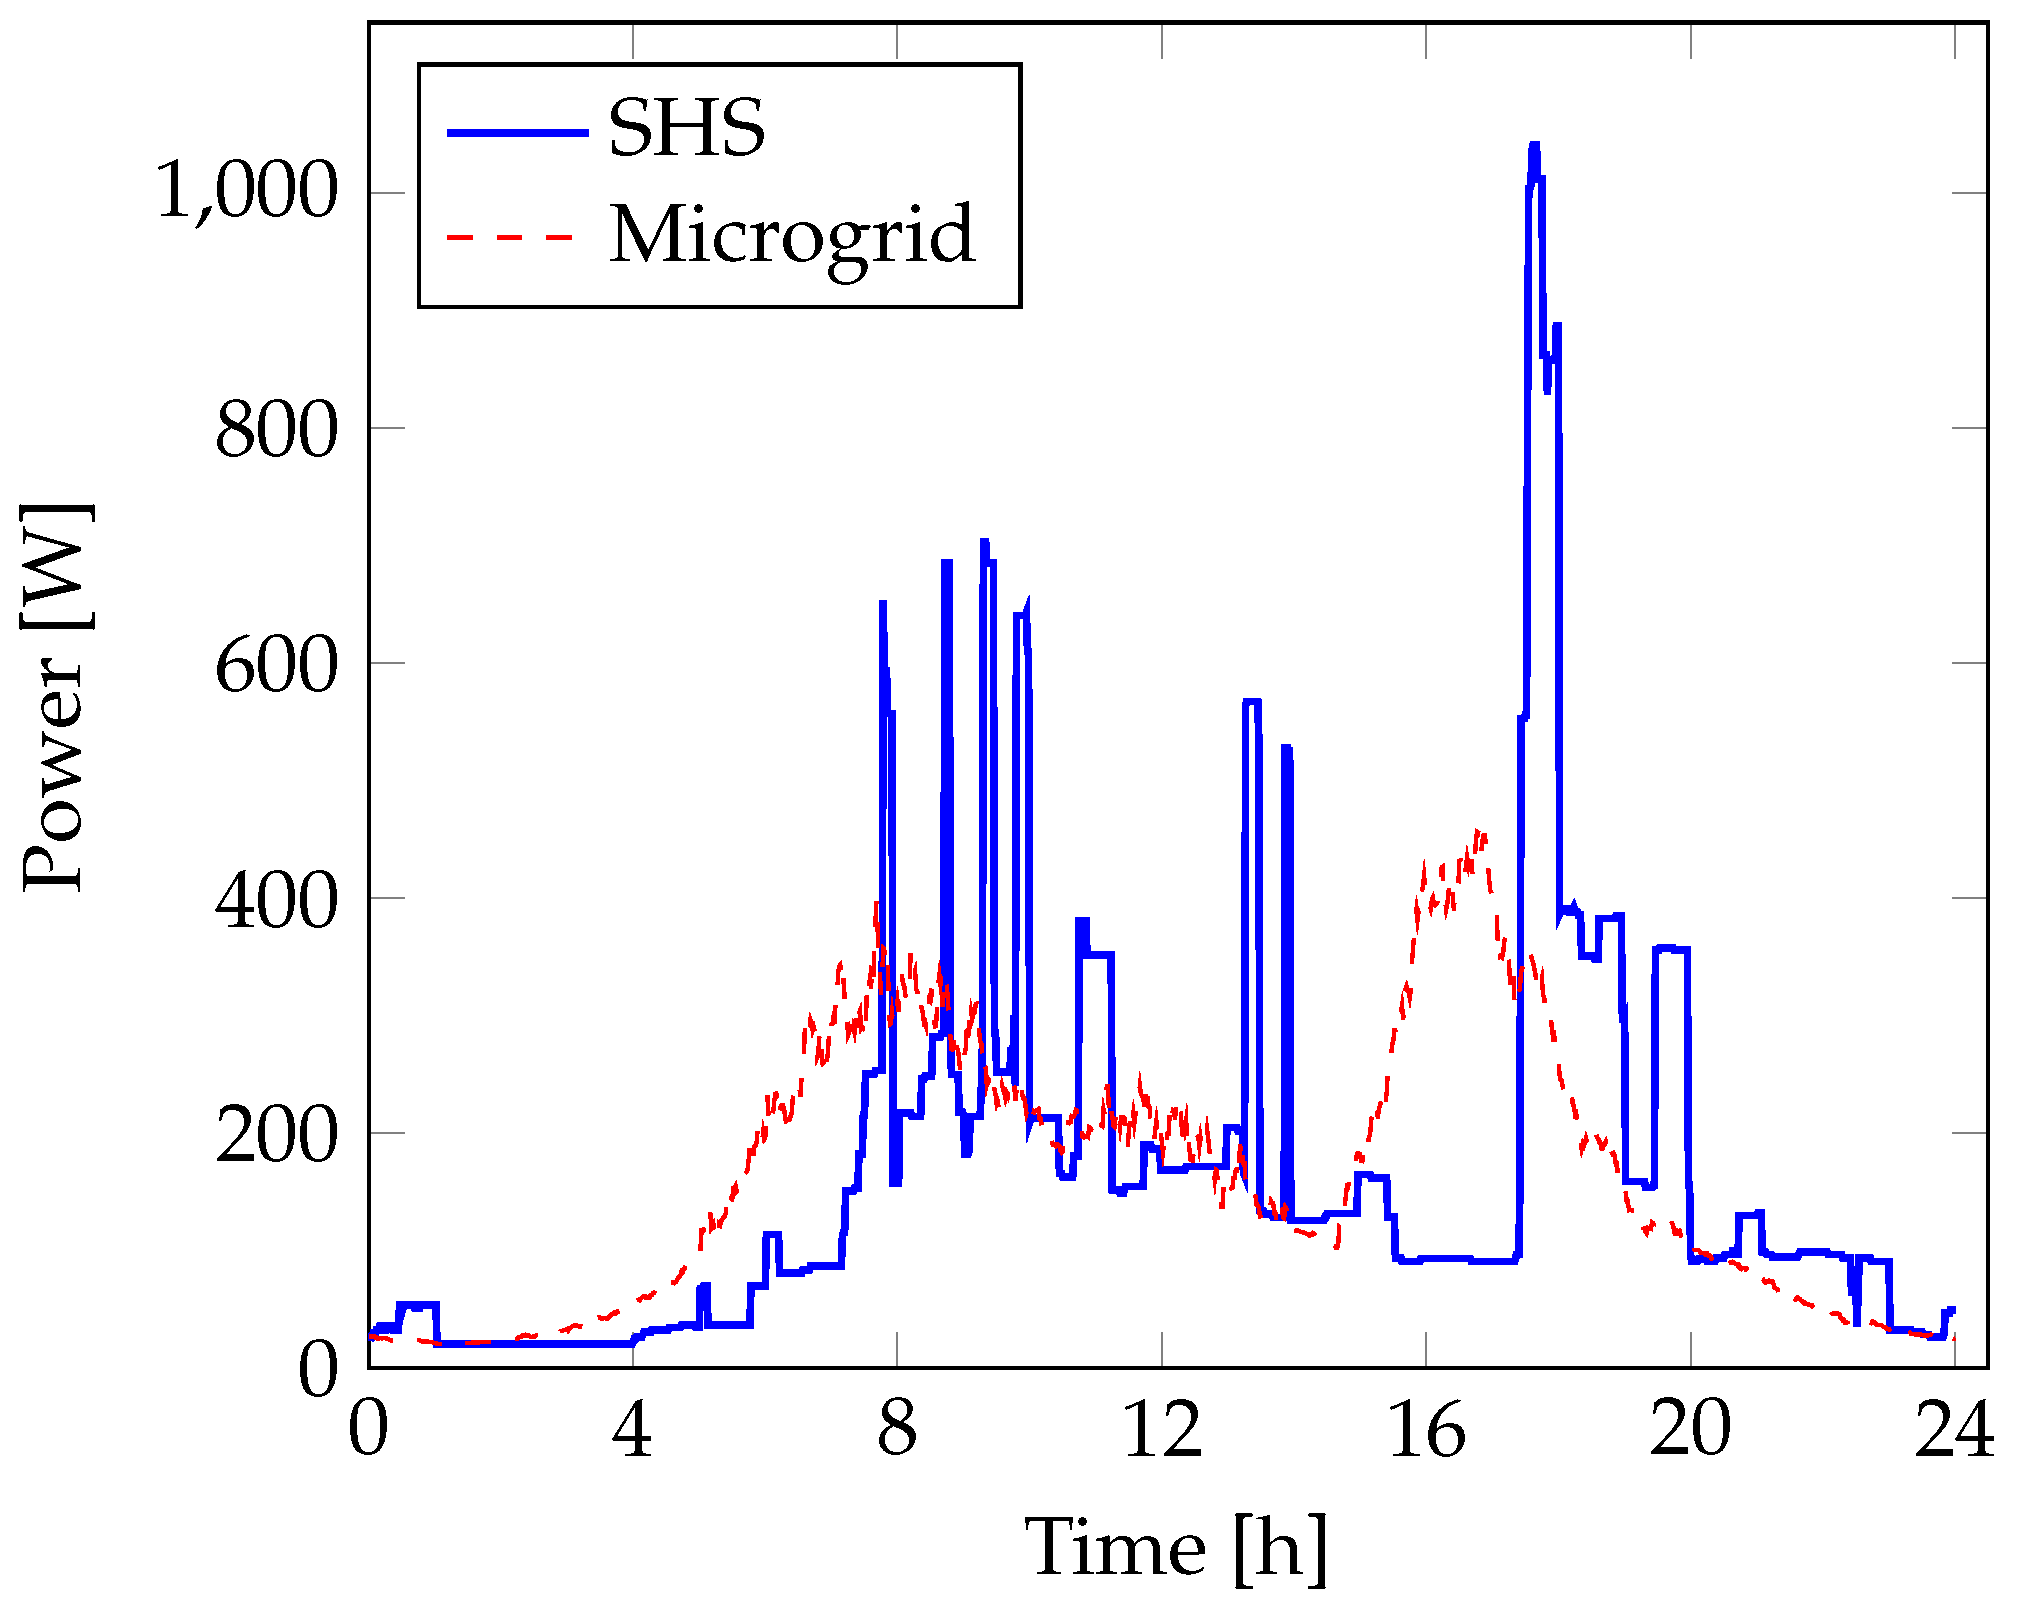
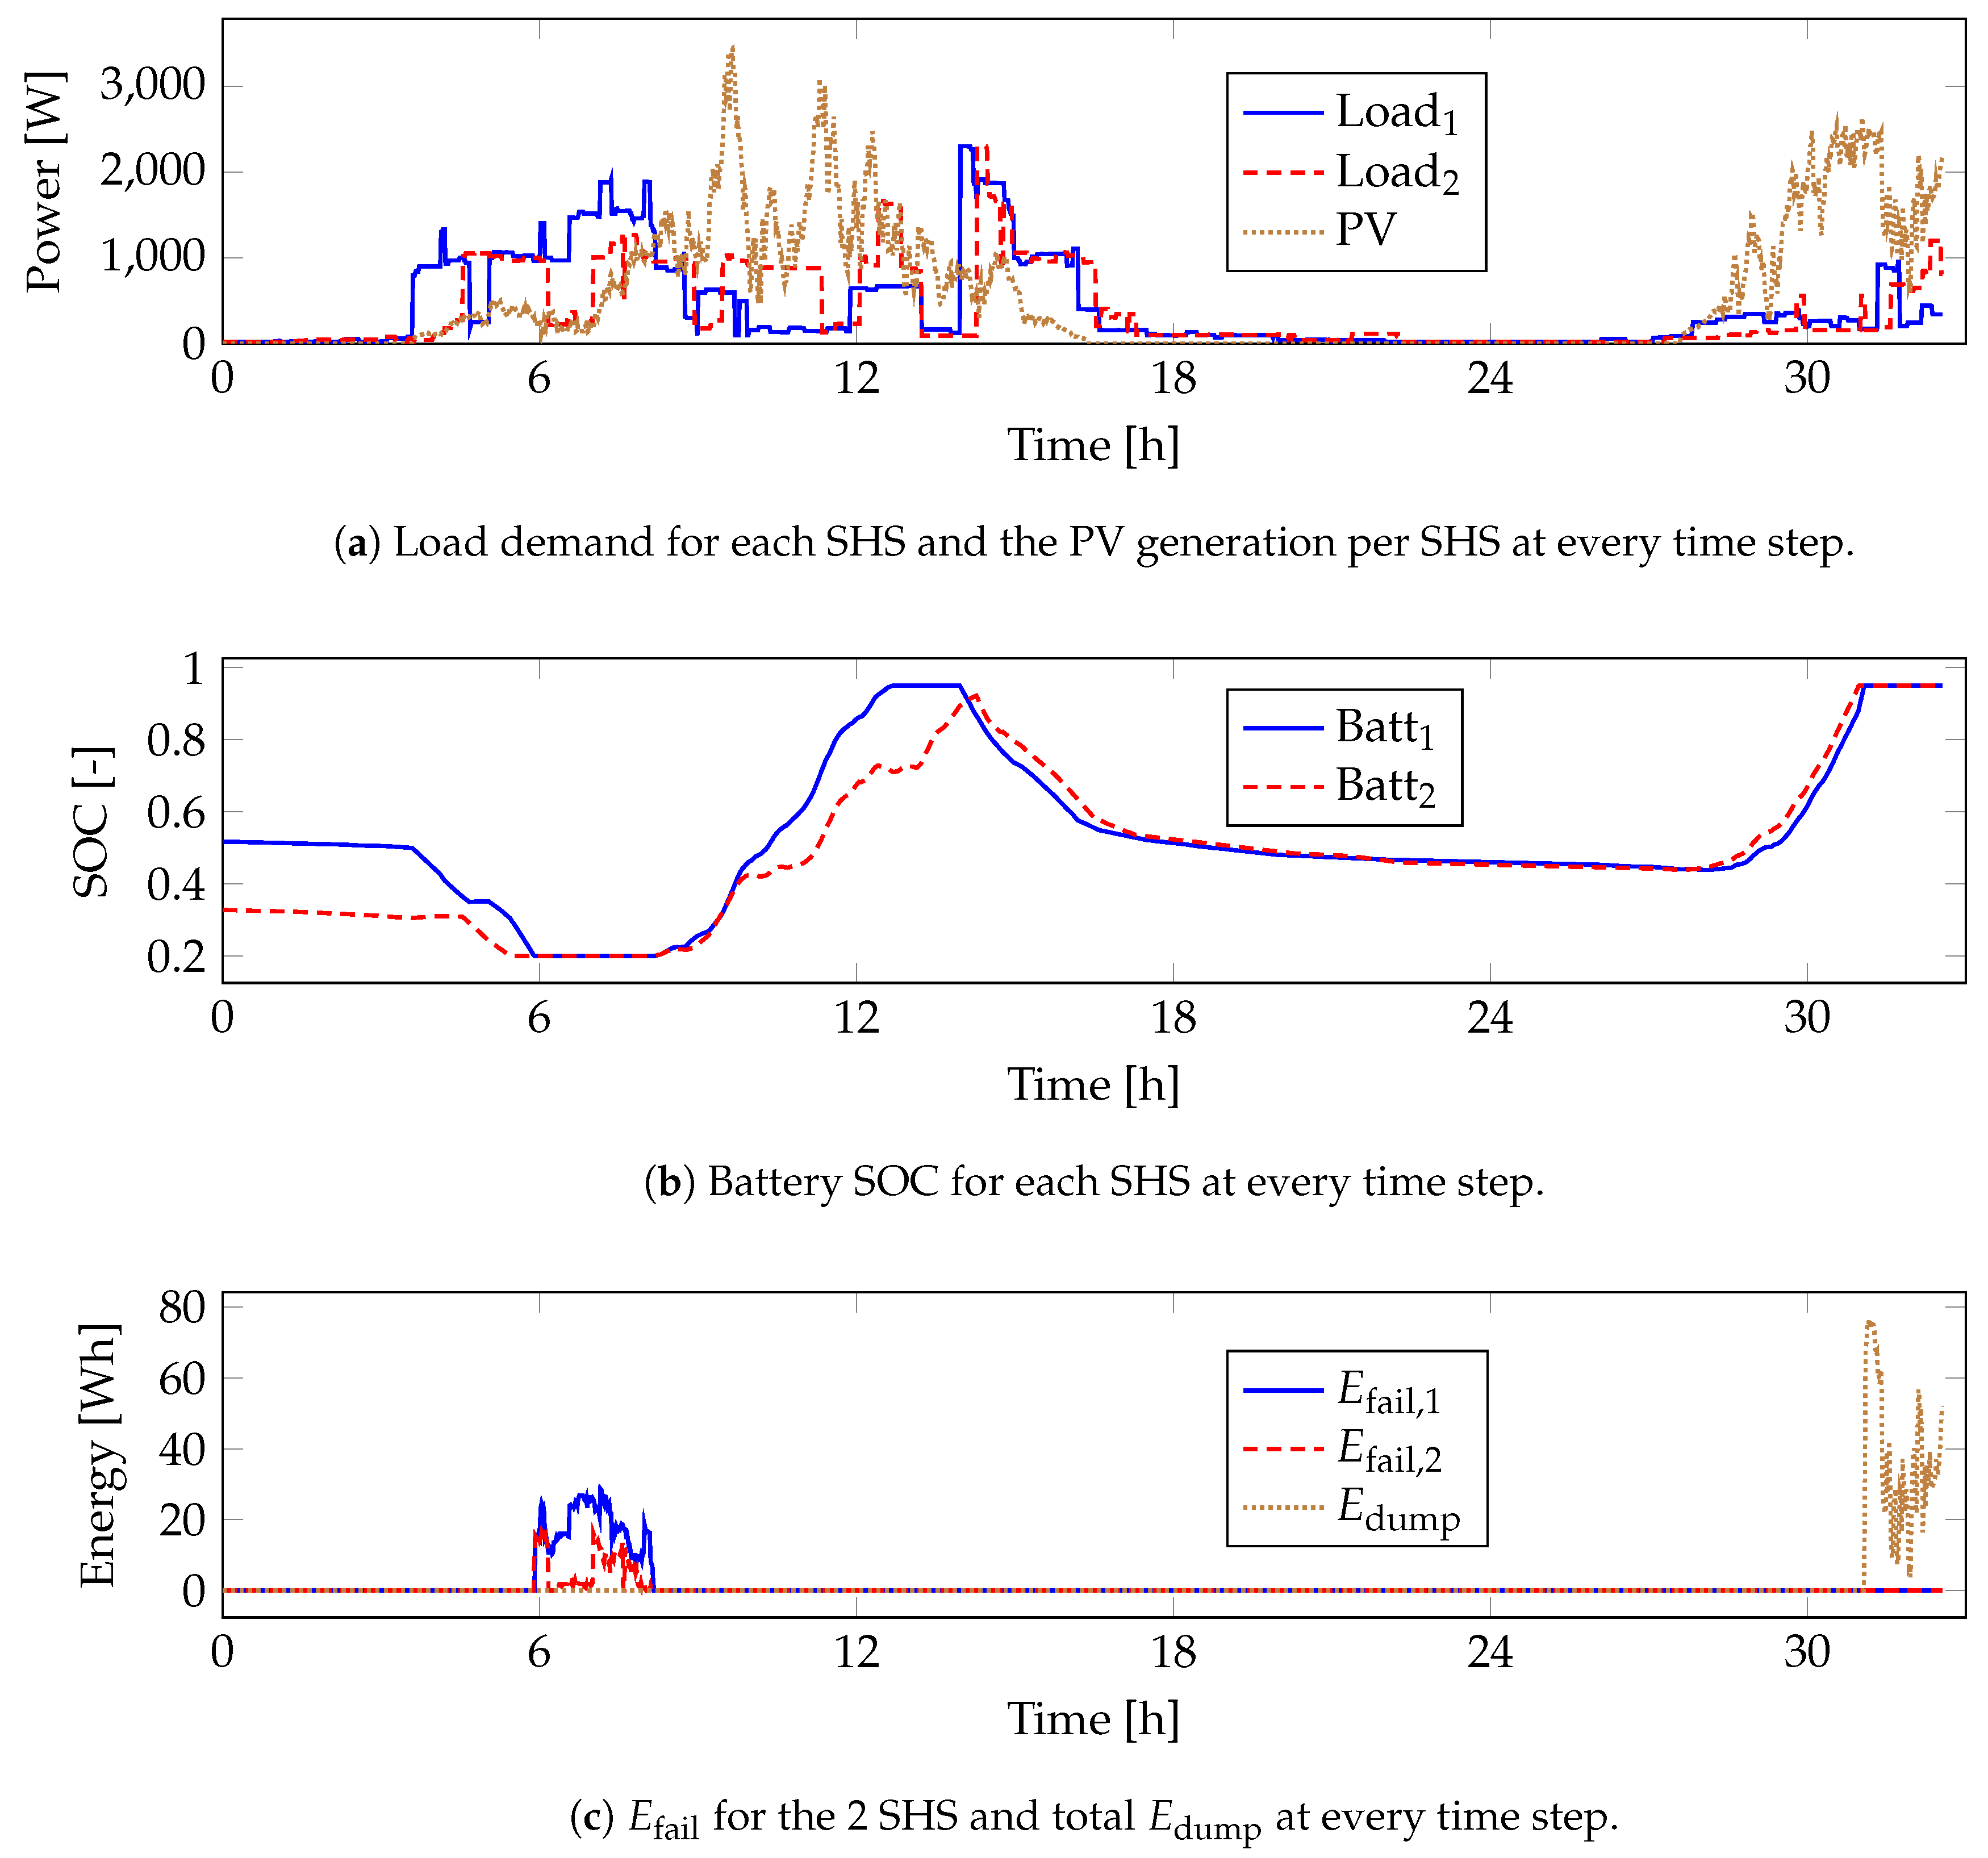
3.1. Energy Exchange in the SHS-Based Microgrid

Figure 10 depicts the various parameters of two SHSs participating in the microgrid over a period of 32 h. It can be seen in Figure 10a that there is a relatively low PV production in the region around 6 h, and higher PV production in the regions around 10–14 h, and again around 30 h. Consequently, as seen in Figure 10b, both the SHS batteries are fully depleted at hour 6. Conversely, both the batteries are fully charged after the excess PV production around hour 30. After the initial high PV production around hour 12, however, only Battery 1 is fully charged.
The most remarkable feature of the energy sharing can be seen (in Figure 10c) from the fact that neither SHS shows a positive E fail while there is even 1 non-empty battery. Additionally, until both the batteries are fully charged, the total E dump value in the interconnected system is 0. A proportional excess energy sharing scheme was considered to charge the battery with excess energy in this case.

3.2. Comparison of Battery Charging Using Excess Energy

Figure 11 shows the comparison between the 3 modes of excess energy-based battery charging (described in Section 2.5.2) in tier 5 homogeneous microgrid in terms of average LLP per household. The performance is measured over an increasing microgrid size up to 10 households. As seen in the figure, the priority excess sharing method yields the worst performing results. Proportional excess sharing method and equal sharing method perform almost similarly for most microgrid sizes. Given the relative performance, for the rest of the results, only the proportional sharing method for sharing excess energy is considered for the rest of the analysis while modeling the energy exchange in the microgrid.

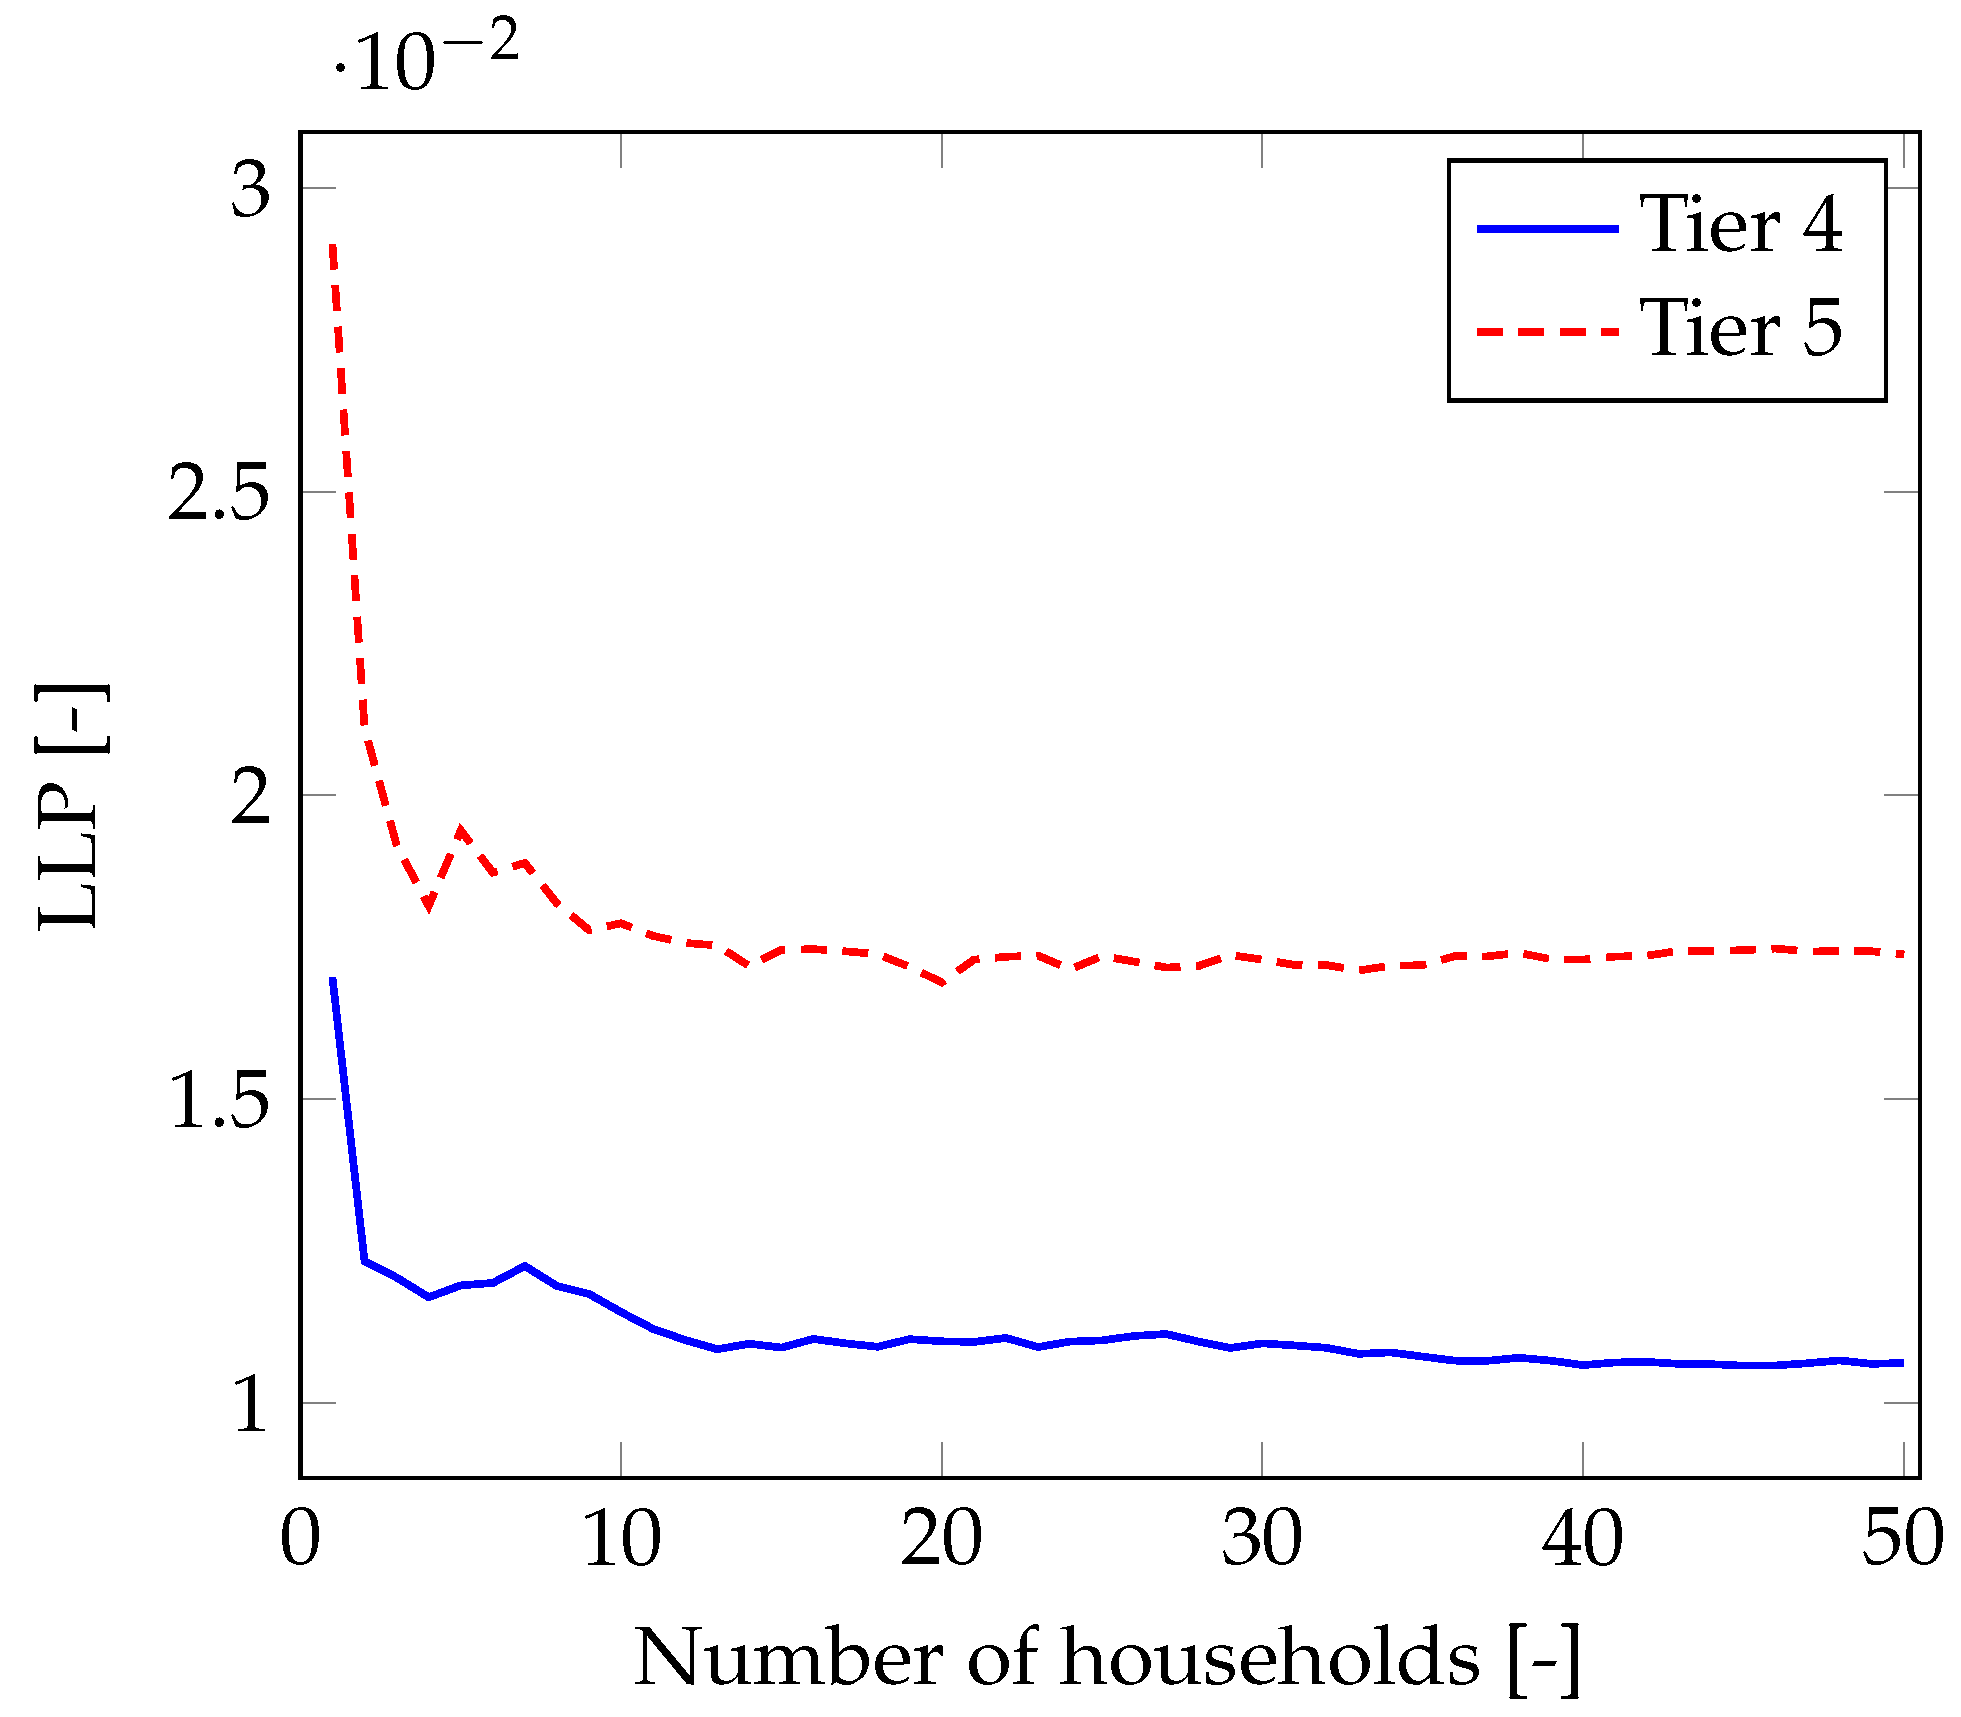
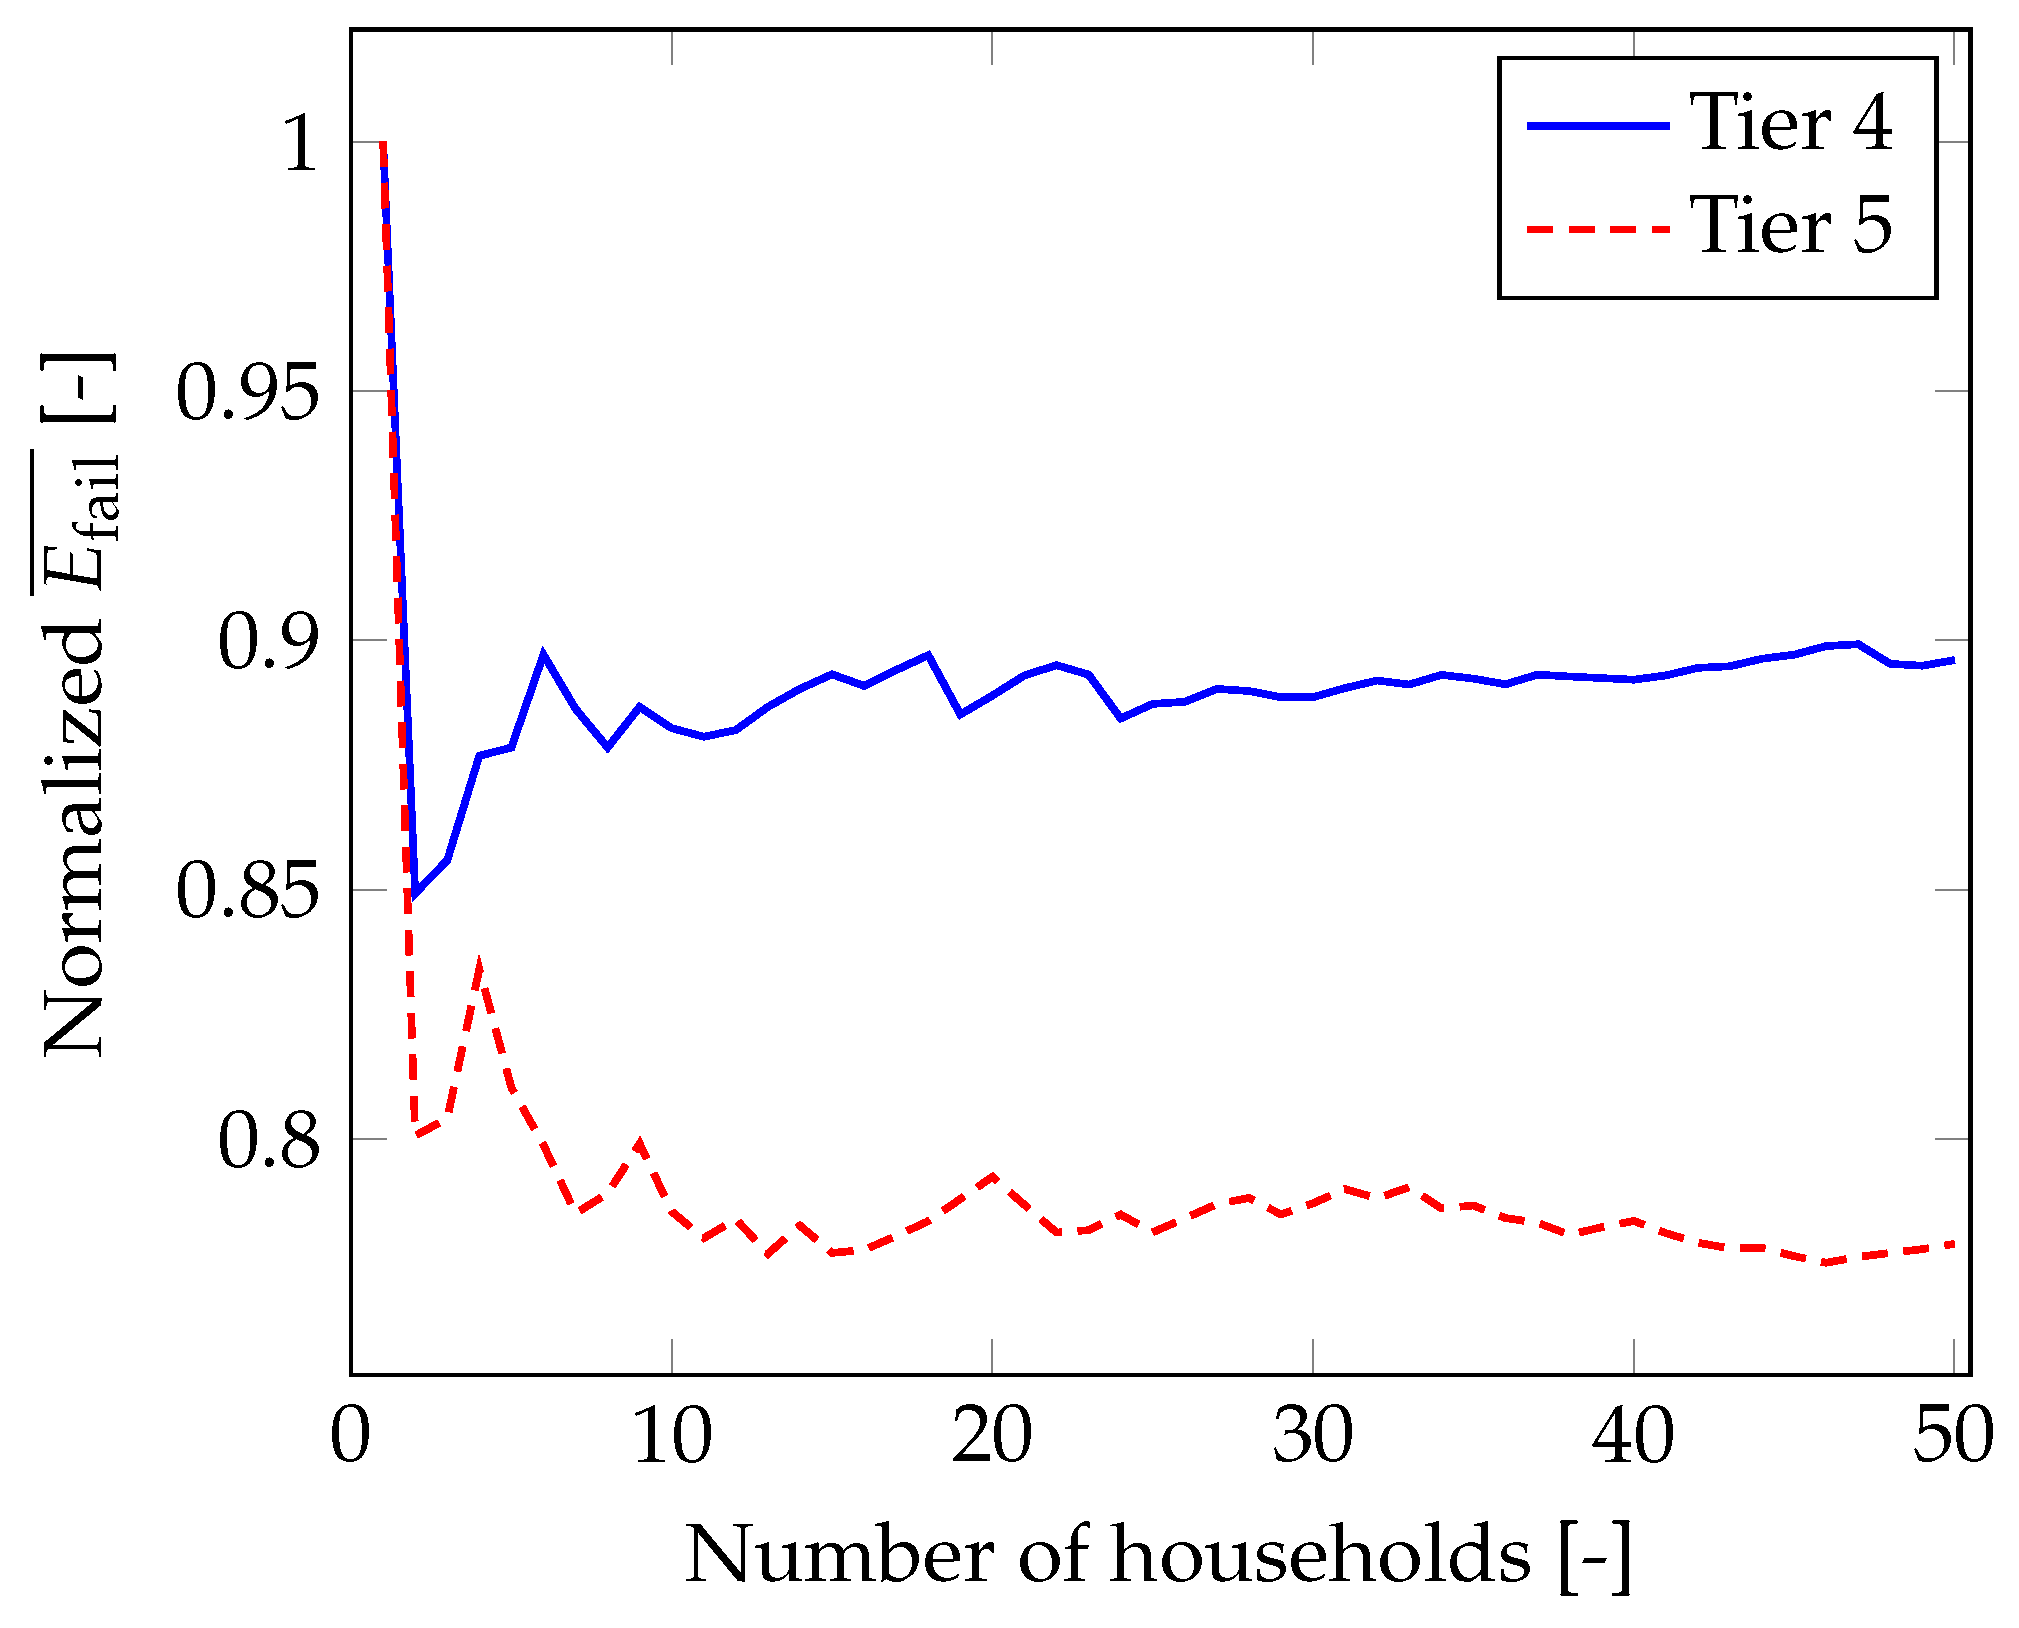
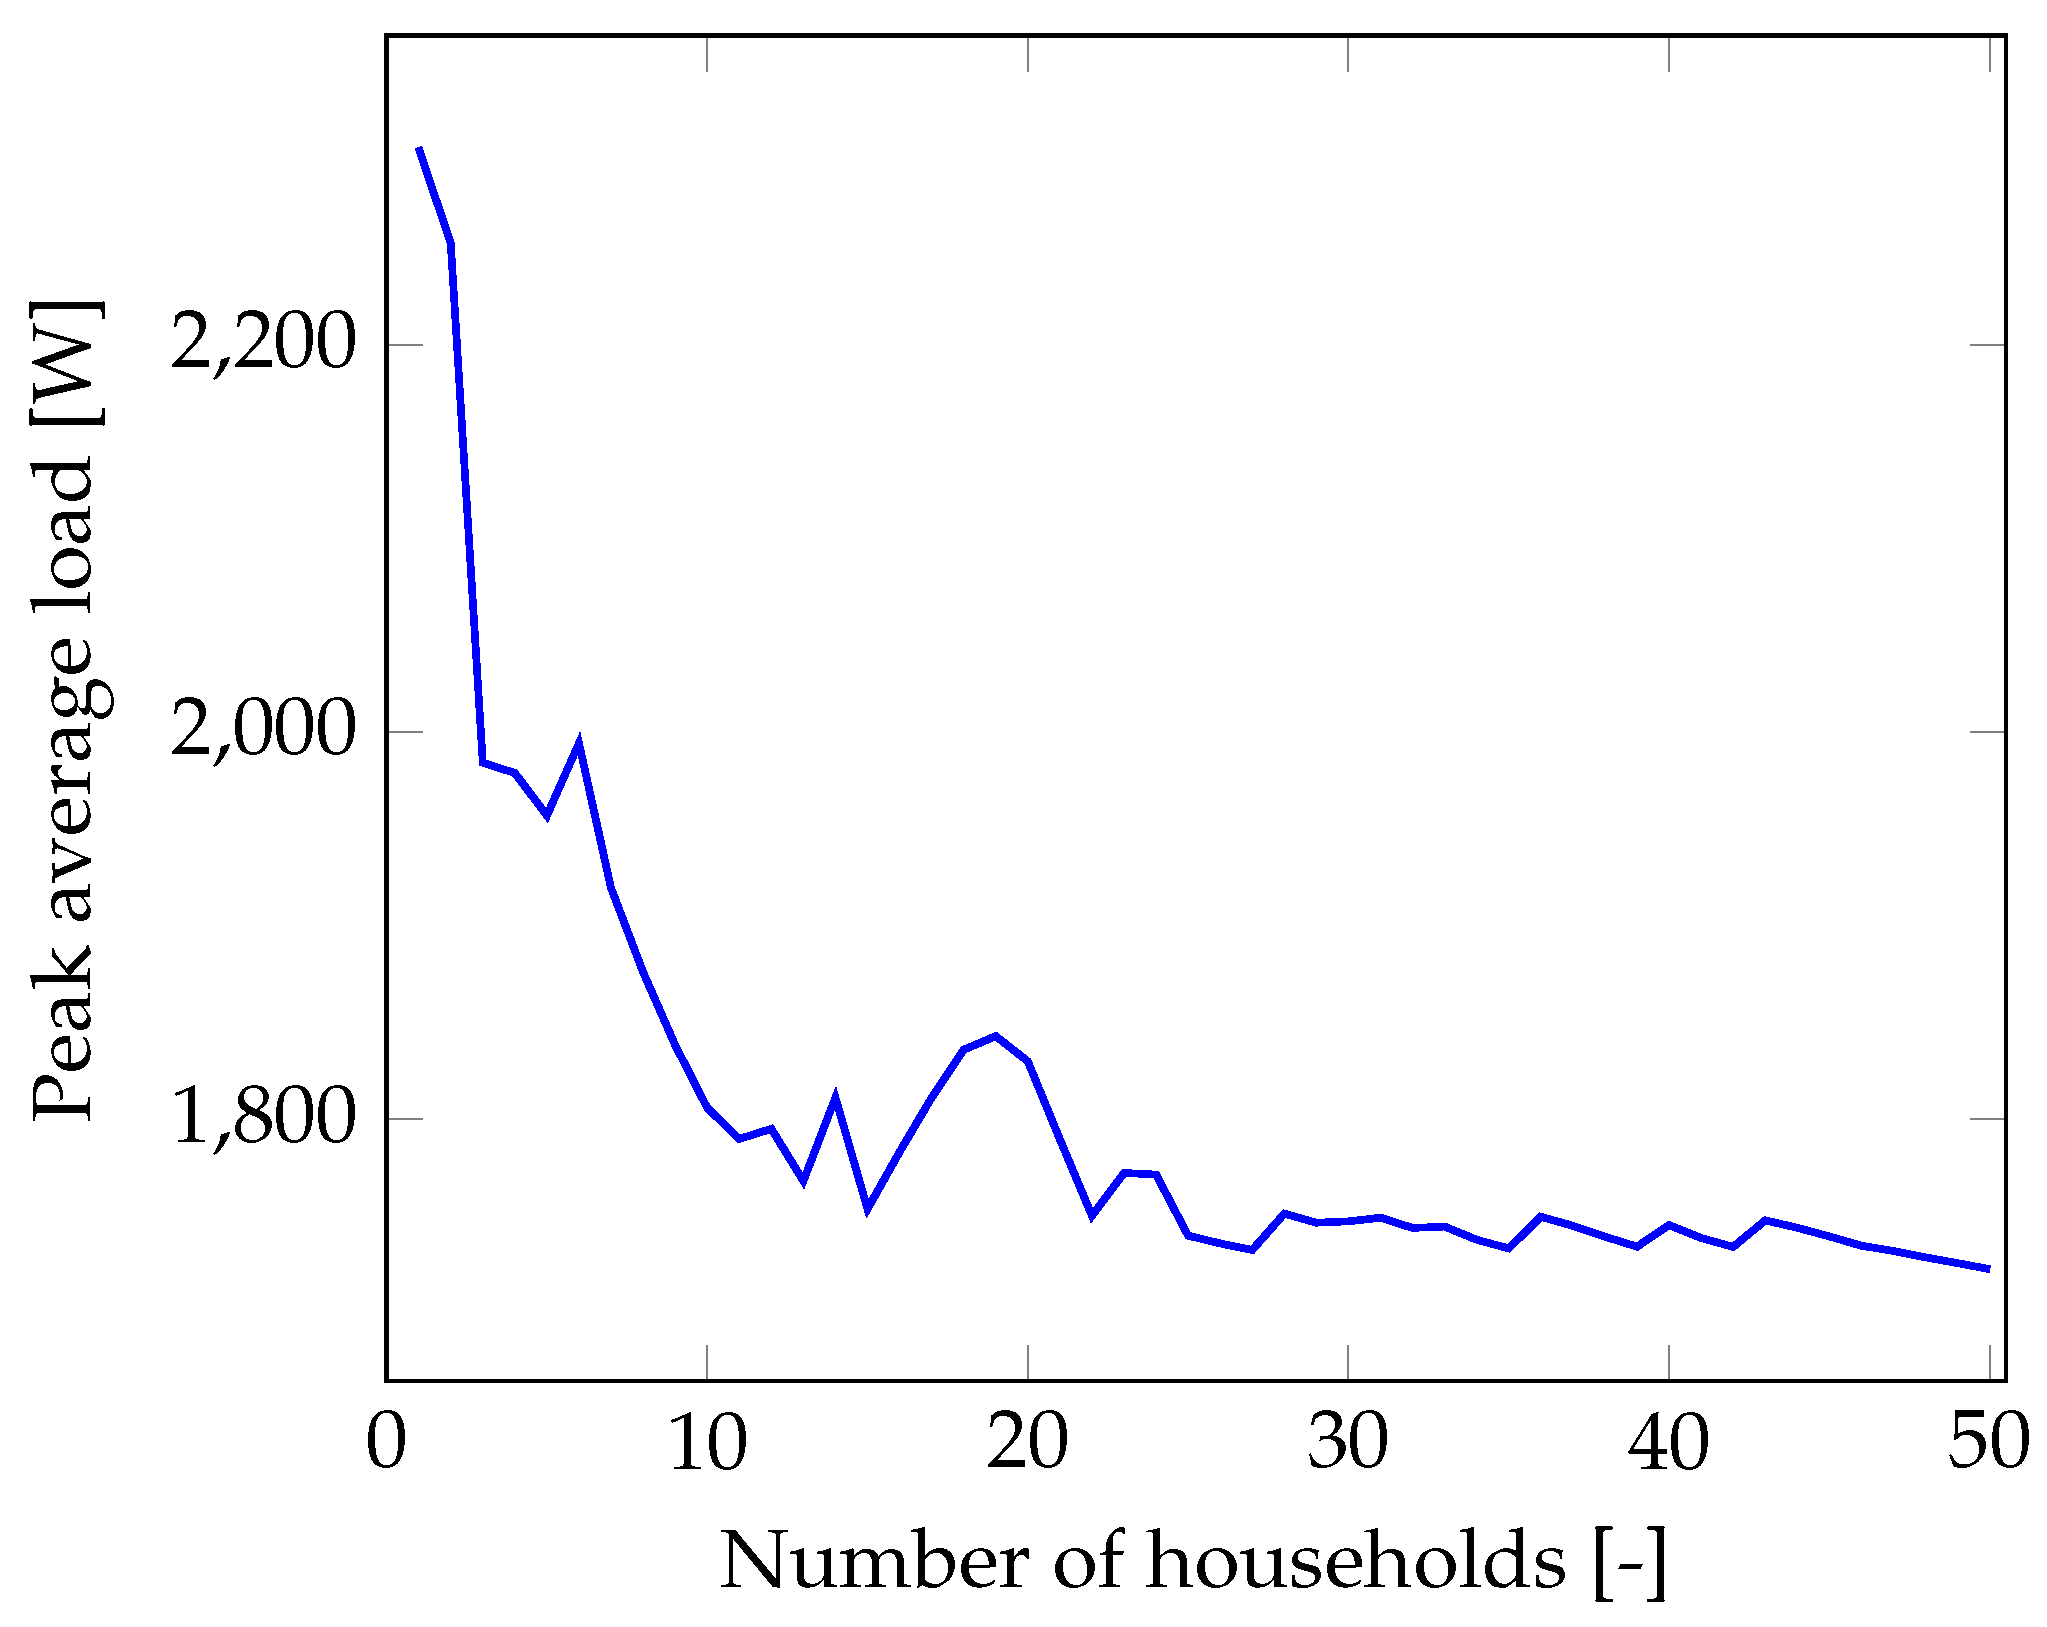
3.3. Impact of Microgrid Size

Figure 12 shows the LLP per household for tier 4 and tier 5 homogeneous microgrids for different microgrid sizes, up to a maximum of 50 houses. Each SHS in tier 4 has a PV and battery size of 1740 Wp and 3560 Wh respectively, while each tier 5 SHS has a PV and battery size of 4 kWp and 6600 Wh respectively.
It can be seen that the gains in the average LLP per household due to the microgrid largely “saturate” after around 15 households for tier 4, and around 20 households for tier 5, respectively. This is because the load profiles tier per household for a given are quite similar, with the load profile peaks still reasonably close to each other. Therefore, the gains in these system metrics will significantly increase if there is a larger intra-day variability between the load profiles for the various households. Additionally, it can be seen that the average LLP for tier 5 falls below 2%, which was not possible with purely standalone SHSs only, wherein the minimum achievable LLP was 2.9% (please refer to Table 3).
The average E fail per household also experiences a considerable decline with increasing size of the microgrid, as shown in Figure 13, where the normalized average E fail is represented for easy comparison between the tier 4 and tier 5 microgrids. The case with a single household is treated as the base value for normalization. The gains in average E fail per household in the microgrid seems to largely stagnate after around 10 households for both tier 4 and tier 5. While the tier 5 microgrid is able to achieve a reduction of 20% in the normalized average E fail per household, the tier 4 microgrid is able to achieve a reduction of 10%.
It should be noted that this does not mean that the microgrid size should not grow to more than 10 households. The fluctuations in these system metrics with every increasing microgrid size is attributed to the individual variability that an additional household’s load profile brings to the overall microgrid load profile. Figure 14 shows the impact of increasing microgrid size on the peak average load profile for the set of tier 5 load profiles considered in this study.
The peak average load largely decreases with increasing microgrid size, up to around 10 households, beyond which there is much less reduction. Moreover, each additional load profile brings about a tiny fluctuation in the peak average load, depending upon how coinciding the individual load profile peak is with that of the overall microgrid. Consequently, greater variability in the load demand across the SHS will lead to greater energy exchange and therefore better performance in terms of the system metrics. Naturally, the use of any demand-side management technique resulting in a higher load profile variability would result in more significant gains in each of the system metrics.
In general, it can be said that an increase in microgrid size will improve the system metrics until a certain size, beyond which the gains in these metrics will largely stagnate. This directly follows from the fact that the variations in the total load profile for any cluster increase with cluster size until a certain point, beyond which the incremental variations in the cluster load profile are minimal. As the performance gains in the system metrics are limited by the load profile variability, these gains are expected to improve when considering heterogeneous microgrids, i.e., microgrids comprising households belonging to mixed tiers of the MTF.

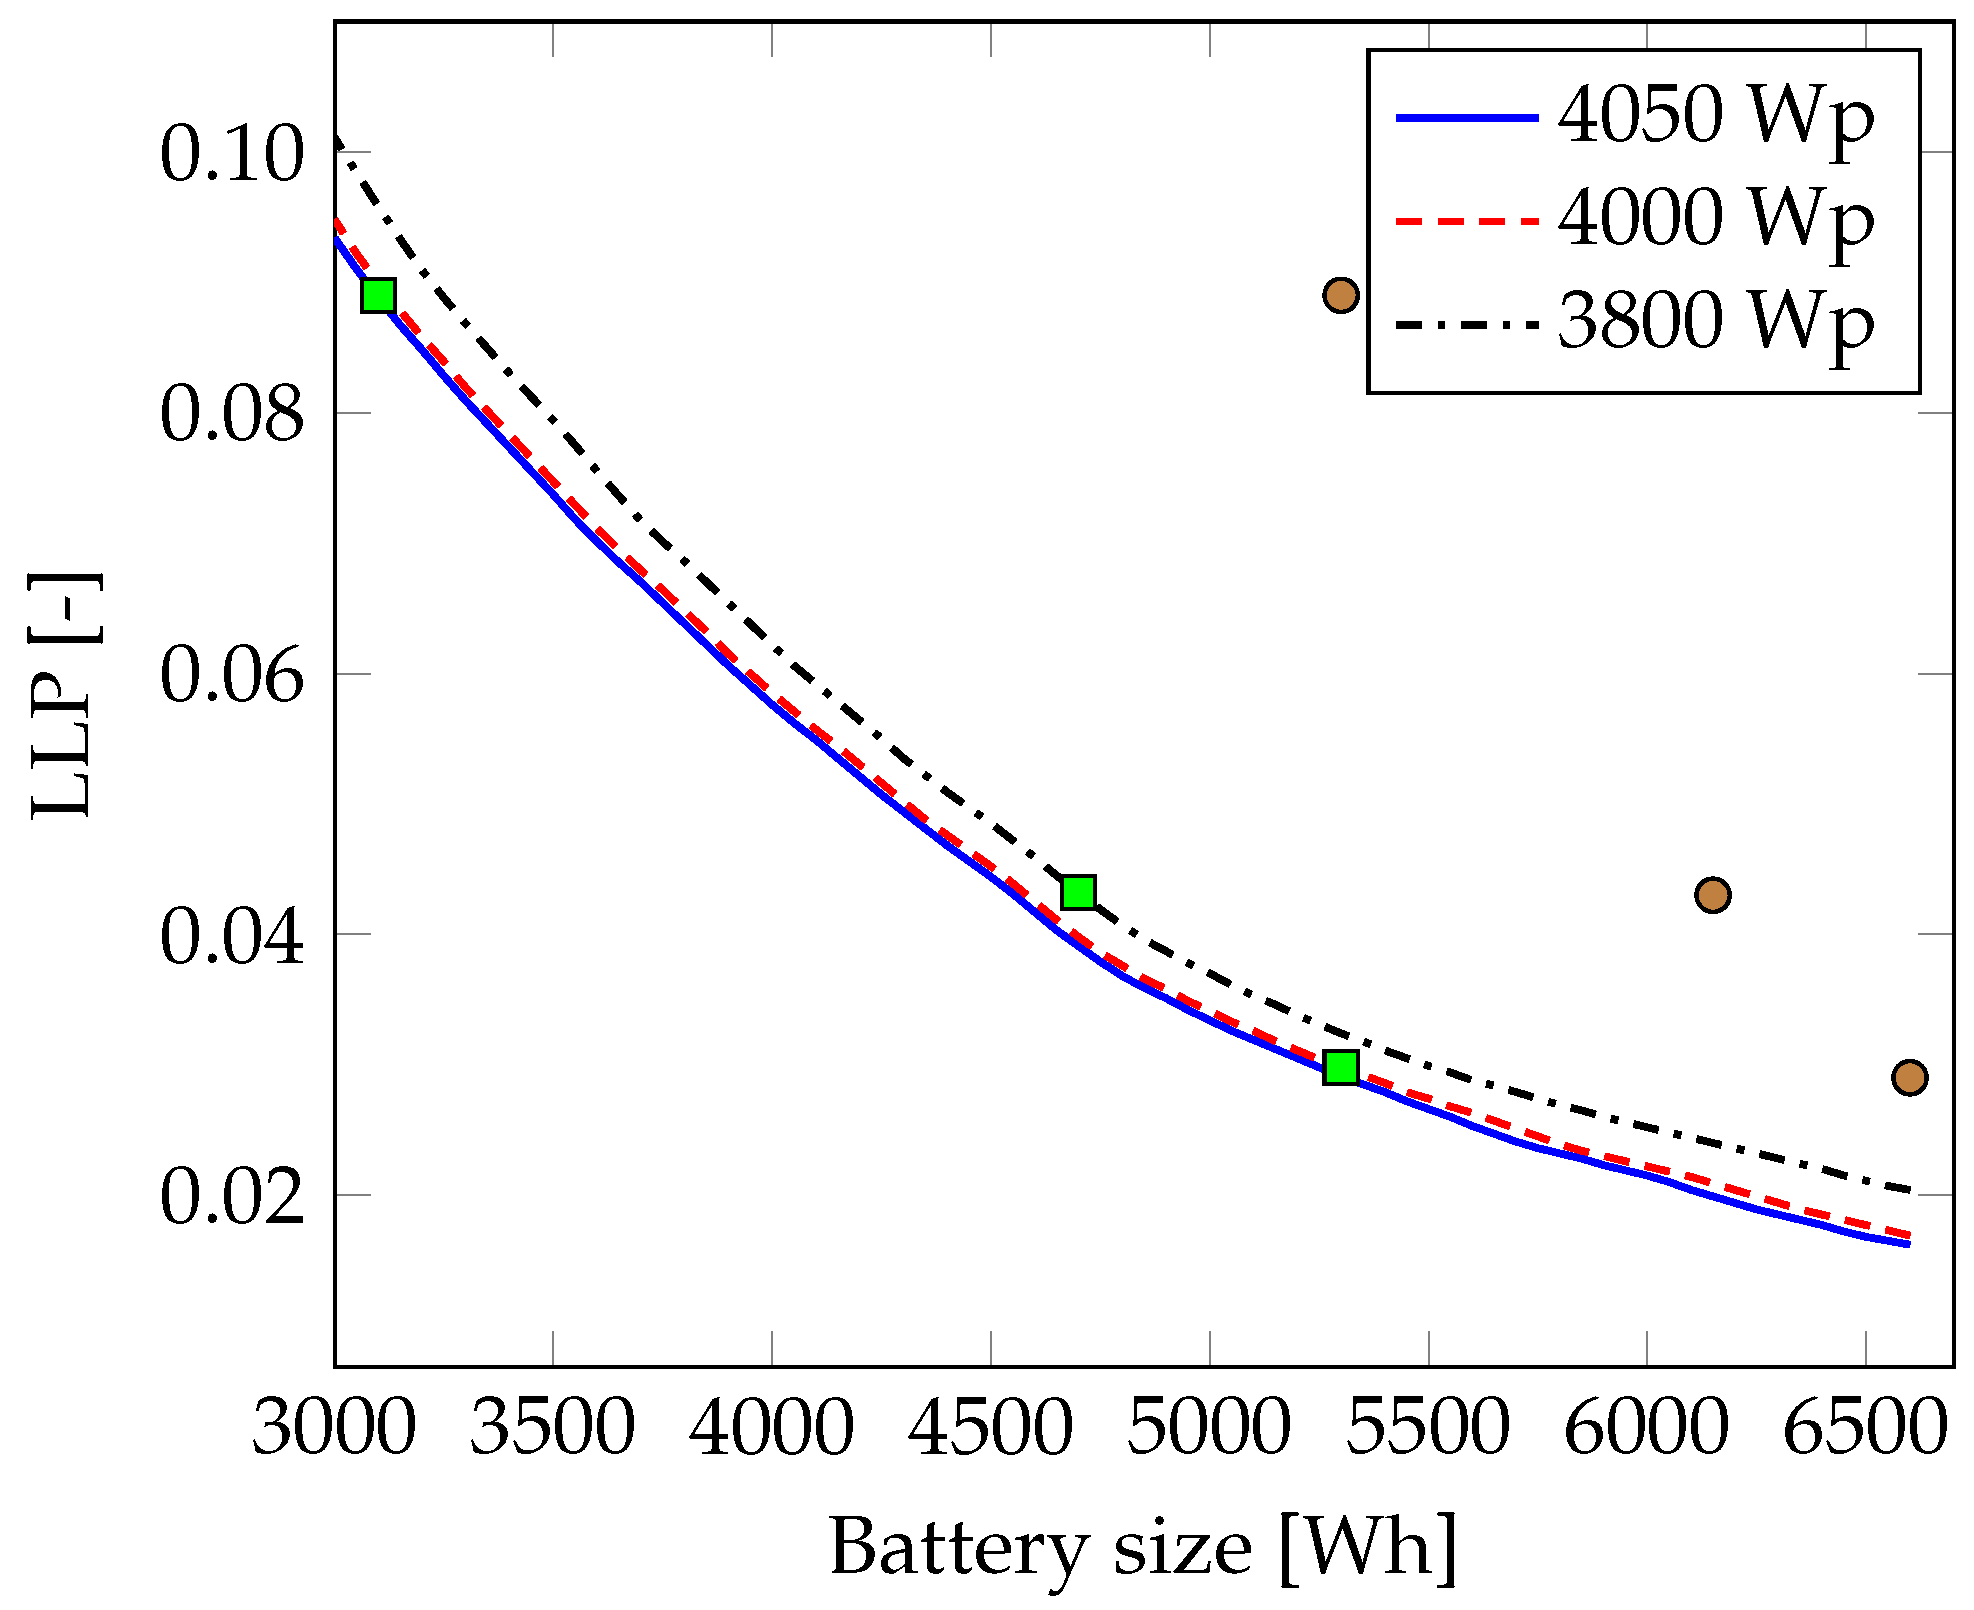
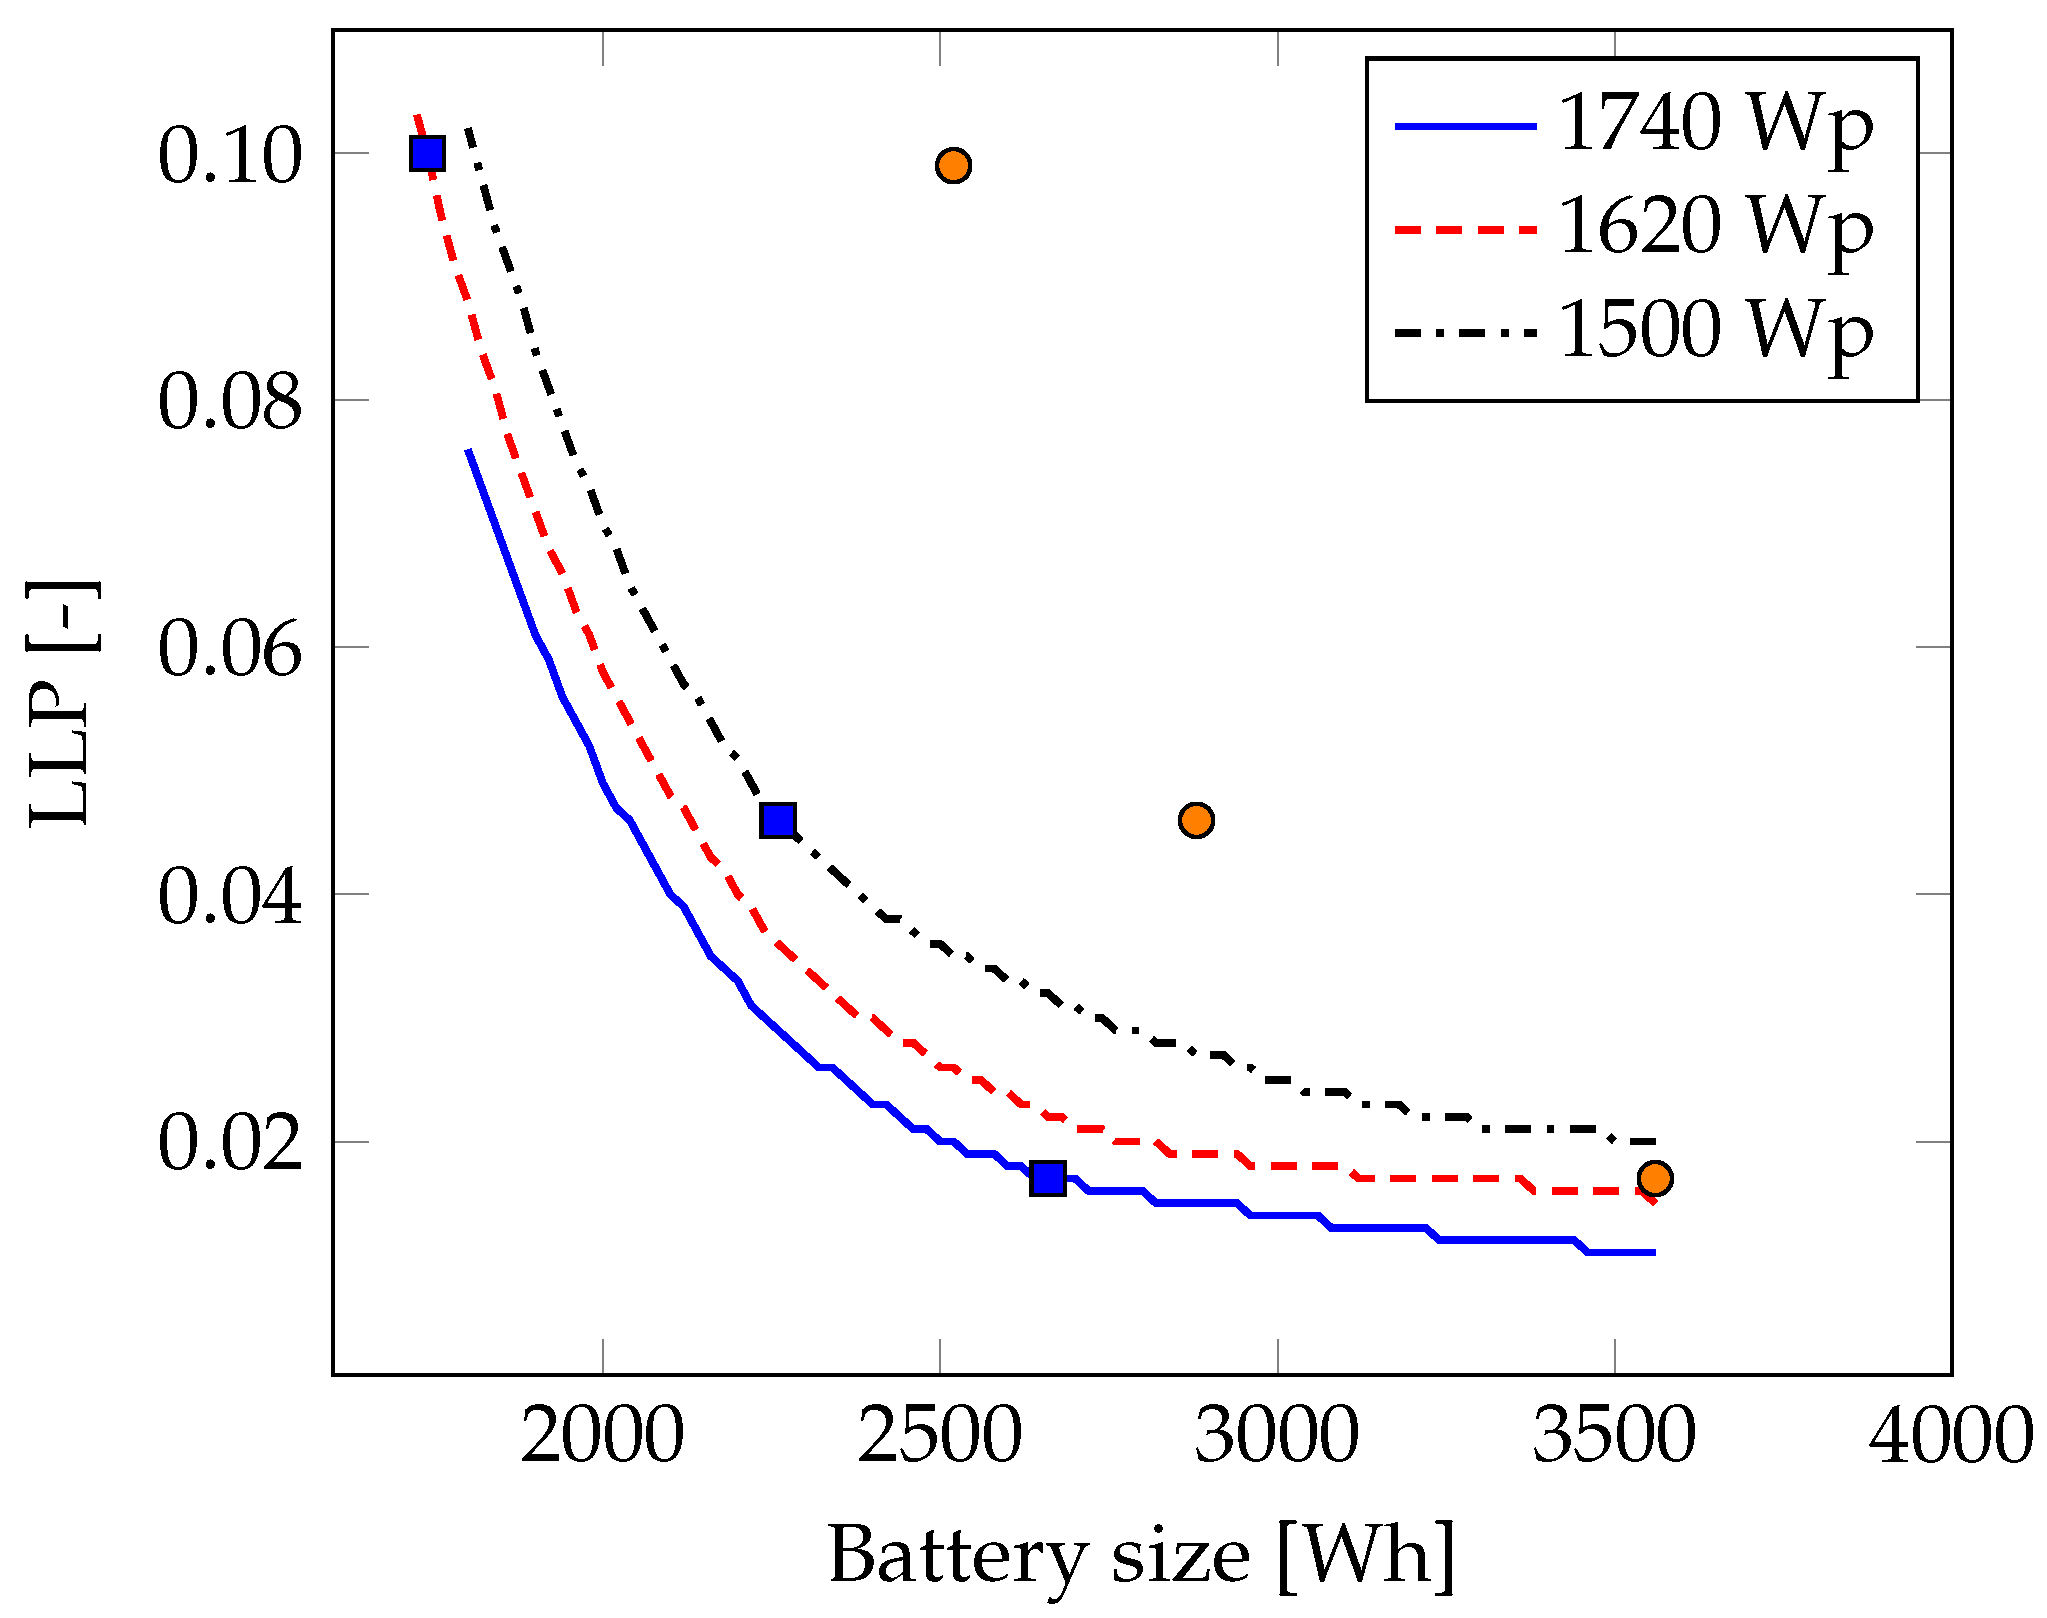
3.4. Benefits of Microgrid on SHS Sizing

For the same level of performance on system metrics like LLP, an SHS-based microgrid can offer a significant advantage in the individual SHS sizing compared to a standalone SHS. This is evident from Figure 15 as shown below, where for a particular microgrid size (number of households), the average LLP of the microgrid is evaluated across different SHS battery sizes.
A microgrid size of 20 households has been considered in Figure 16 as that size was seen to be enough (refer to Figure 12) for average LLP of both tiers 4 and 5 to stabilize. The x and y-axes refer to the battery and average LLP values in the homogeneous tier 5 microgrid. Three different PV sizes are used corresponding to the optimal PV sizes obtained in Table 3 for each of the LLP thresholds.
It can be seen that the general nature of the LLP curve depending on the battery size remains the same as that of an individual standalone SHS as seen in other studies [9]. The main difference is that with the energy sharing capability in the microgrid, the same system sizing would enable better performance. This can be seen while comparing the 3 circular brown marks corresponding to the standalone system sizes from Table 3, with the 3 rectangular green marks corresponding to the same LLP threshold and PV size but lower battery sizes for the tier 5 microgrid case. More than 2 kWh of battery size can be saved to meet the same LLP threshold. In other words, battery sizing gains of 41% (i.e., a 41% lower battery size) can be achieved for tier 5 SHSs by energy sharing with the microgrid as opposed to a standalone operation to meet LLP = 0.1. The gains are lower but still significant at 19.7% to meet LLP of 0.029, which was the minimum LLP achievable by an optimally sized tier 5 standalone SHS (please refer to Table 3).
A similar analysis is performed on a homogeneous tier 4 microgrid with 20 households to quantify the benefits achieved in terms of SHS battery sizes. This is shown in Figure 16. Similar to the tier 5 case, for all the 3 LLP thresholds shown in Table 3, significant battery sizing gains can be achieved through the microgrid when compared to standalone SHSs to meet the same LLP requirements. At 1740 Wh (blue rectangular mark in Figure 16), a 31% lower sized battery is needed to meet an LLP threshold of 0.1 for a tier 4 microgrid, as opposed to a standalone SHS with a battery size of 2520 (please refer to Table 3). Thus, the benefits of energy sharing in an SHS-based microgrid have been quantified in this study.
Most importantly, as the microgrid proposed in this study is SHS-based, the main problems of centralized PV battery installations with substantial component costs can be avoided. Additionally, each SHS belongs to a different household participating in the microgrid, as opposed to centralized microgrids with lack of clear ownership.

4. Conclusions

This study presented a detailed methodology for modeling an interconnected SHS-based microgrid. A modularly expandable and scalable microgrid architecture is proposed. Moreover, meeting the energy demand of higher tiers such as tier 4 and tier 5 is shown to be possible with this approach of bottom-up, interconnected SHS-based microgrid as opposed to standalone SHSs. The energy sharing between the different SHSs is modeled and its positive impact on the system metrics quantified. It is shown that battery sizing gains of more than 40% can be achieved at the tier 5 level with interconnectivity as compared to standalone SHSs to meet the same loss of load probability threshold. It should be noted that the sizing gains and better performance with respect to the system metrics can increase even further depending on the demand diversity in the load profiles. Furthermore, such a bottom-up microgrid can also help in using high power appliances, especially the ones that cater to productive use of energy.

Recommendations and Future Work

The interconnected SHS-based microgrid described in this paper assumes perfect knowledge of the dynamic behavior of every SHS. For a truly decentralized bottom-up expansion of such an envisioned microgrid, decentralized power management should be considered. Additionally, optimal microgrid topologies should be studied for such a decentralized microgrid. Moreover, the effects of load profile variations within the microgrid along with load and PV generation uncertainty can also be examined.
Finally, to fully assess the feasibility of such a microgrid towards scaling up electrification efforts, a broader multi-disciplinary approach is needed that includes fitting business models, socio-cultural aspects of contexts where the microgrid is to be deployed, and effective policies that stimulate technology adoption.

Author Contributions

Conceptualization, N.N. and J.P.-G.; Methodology, N.N., A.C.; Formal Analysis, N.N. and A.C.; Investigation, N.N. and A.C.; Resources, P.B., and M.Z.; Writing—Original Draft Preparation, N.N., V.V.-G.; Writing—Review & Editing, N.N., V.V.-G., Z.Q., J.P.-G.; Supervision, Z.Q., P.B. and M.Z.

Funding

This research received no external funding.

Acknowledgments

This work was supported by a fellowship from the Delft Global Initiative of the Delft University of Technology, the Netherlands. Thanks to Frans Pansier for the insightful discussions over the draft manuscript.

Conflicts of Interest

The authors declare no conflict of interest.

References and Note

  1. IEA. Energy Access Outlook 2017—From Poverty to Prosperity, 1st ed.; Organization for Economic Cooperation and Development, International Energy Agency: Paris, France, 2017. [Google Scholar]
  2. Narayan, N.; Vega-Garita, V.; Qin, Z.; Popovic-Gerber, J.; Bauer, P.; Zeman, M. A modeling methodology to evaluate the impact of temperature on Solar Home Systems for rural electrification. In Proceedings of the 2018 IEEE International Energy Conference (ENERGYCON), Limassol, Cyprus, 3–7 June 2018; pp. 1–6. [Google Scholar] [CrossRef]
  3. Lighting Global and Dalberg Advisors. Off-Grid Solar Market Trends Report; Technical Report; Lighting Global, Dalberg Advisors, GOGLA, ESMAP: Utrecht, The Netherlands, 2018. [Google Scholar]
  4. Global Off-Grid Lighting Association. Global Off-Grid Solar Market Report—Semi-Annual Sales and Impact Data; Technical Report; GOGLA, Lighting Global and Berenschot: Utrecht, The Netherlands, 2018. [Google Scholar]
  5. Bhatia, M.; Nicolina, A. Capturing the Multi-Dimensionality of Energy Access; Live Wire, 2014/16; World Bank: Washington, DC, USA, 2014. [Google Scholar]
  6. Bhatia, M.; Angelou, N. Beyond Connection, Energy Access Redefined; The World Bank: Washington, DC, USA, 2015; pp. 6–7. [Google Scholar]
  7. Heeten, T.D.; Narayan, N.; Diehl, J.C.; Verschelling, J.; Silvester, S.; Popovic-Gerber, J.; Bauer, P.; Zeman, M. Understanding the present and the future electricity needs: Consequences for design of future Solar Home Systems for off-grid rural electrification. In Proceedings of the 2017 International Conference on the Domestic Use of Energy (DUE), Cape Town, South Africa, 4–5 April 2017; pp. 8–15. [Google Scholar] [CrossRef]
  8. Gustavsson, M. With time comes increased loads: An analysis of solar home system use in Lundazi, Zambia. Renew. Energy 2007, 32, 796–813. [Google Scholar] [CrossRef]
  9. Narayan, N.; Chamseddine, A.; Vega-Garita, V.; Qin, Z.; Popovic-Gerber, J.; Bauer, P.; Zeman, M. Exploring the boundaries of Solar Home Systems (SHS) for off-grid electrification: Optimal SHS sizing for the multi-tier framework for household electricity access. Appl. Energy 2019, 240, 907–917. [Google Scholar] [CrossRef]
  10. Narayan, N.; Popovic, J.; Diehl, J.C.; Silvester, S.; Bauer, P.; Zeman, M. Developing for developing nations: Exploring an affordable solar home system design. In Proceedings of the 2016 IEEE Global Humanitarian Technology Conference (GHTC), Seattle, WA, USA, 13–16 October 2016; pp. 474–480. [Google Scholar] [CrossRef]
  11. Bhuiyan, F.A.; Yazdani, A.; Primak, S.L. Optimal sizing approach for islanded microgrids. IET Renew. Power Gener. 2015, 9, 166–175. [Google Scholar] [CrossRef]
  12. Benavente-Araoz, F.; Lundblad, A.; Campana, P.E.; Zhang, Y.; Cabrera, S.; Lindbergh, G. Loss-of-load probability analysis for optimization of small off-grid PV-battery systems in Bolivia. Energy Procedia 2017, 142, 3715–3720. [Google Scholar] [CrossRef]
  13. Smets, A.; Jäger, K.; Isabella, O.; Van Swaaij, R.; Zeman, M. Solar Energy—The Physics and Engineering of Photovoltaic Conversion, Technologies and Systems; UIT Cambridge Limited: Cambridge, UK, 2016. [Google Scholar]
  14. Kirchhoff, H. Identifying Hidden Resources in Solar Home Systems as the Basis for Bottom-Up Grids. In Decentralized Solutions for Developing Economies; Springer: Berlin/Heidelberg, Germany, 2015; pp. 23–32. [Google Scholar]
  15. Soltowski, B.; Bowes, J.; Strachan, S.; limpo Anaya-Lara, O. A Simulation-Based Evaluation of the Benefits and Barriers to Interconnected Solar Home Systems in East Africa. In Proceedings of the 2018 IEEE PES/IAS PowerAfrica, Cape Town, South Africa, 28–29 June 2018; pp. 491–496. [Google Scholar]
  16. Chaurey, A.; Kandpal, T. A techno-economic comparison of rural electrification based on solar home systems and PV microgrids. Energy Policy 2010, 38, 3118–3129. [Google Scholar] [CrossRef]
  17. Bani-Ahmed, A.; Rashidi, M.; Nasiri, A. Coordinated failure response and recovery in a decentralized microgrid architecture. In Proceedings of the 2017 IEEE Energy Conversion Congress and Exposition (ECCE), Cincinnati, OH, USA, 1–5 October 2017; pp. 4821–4825. [Google Scholar] [CrossRef]
  18. Xia, Y.; Wei, W.; Peng, Y.; Yang, P.; Yu, M. Decentralized Coordination Control for Parallel Bidirectional Power Converters in a Grid-Connected DC Microgrid. IEEE Trans. Smart Grid 2018, 9, 6850–6861. [Google Scholar] [CrossRef]
  19. Wang, Z.; Liu, F.; Chen, Y.; Low, S.H.; Mei, S. Unified Distributed Control of Stand-Alone DC Microgrids. IEEE Trans. Smart Grid 2019, 10, 1013–1024. [Google Scholar] [CrossRef]
  20. Liu, Z.; Su, M.; Sun, Y.; Li, L.; Han, H.; Zhang, X.; Zheng, M. Optimal criterion and global/sub-optimal control schemes of decentralized economical dispatch for AC microgrid. Int. J. Electr. Power Energy Syst. 2019, 104, 38–42. [Google Scholar] [CrossRef]
  21. Baranwal, M.; Askarian, A.; Salapaka, S.; Salapaka, M. A Distributed Architecture for Robust and Optimal Control of DC Microgrids. IEEE Trans. Ind. Electron. 2019, 66, 3082–3092. [Google Scholar] [CrossRef]
  22. Rahman, M.S.; Hossain, M.J.; Lu, J.; Pota, H.R. A Need-Based Distributed Coordination Strategy for EV Storages in a Commercial Hybrid AC/DC Microgrid with an Improved Interlinking Converter Control Topology. IEEE Trans. Energy Convers. 2018, 33, 1372–1383. [Google Scholar] [CrossRef]
  23. Baghaee, H.R.; Mirsalim, M.; Gharehpetian, G.B.; Talebi, H.A. Decentralized Sliding Mode Control of WG/PV/FC Microgrids Under Unbalanced and Nonlinear Load Conditions for On- and Off-Grid Modes. IEEE Syst. J. 2018, 12, 3108–3119. [Google Scholar] [CrossRef]
  24. Gong, K.; Lenz, E.; Konigorski, U. Decentralized frequency control of a DDG-PV Microgrid in islanded mode. In Proceedings of the 2015 23rd Mediterranean Conference on Control and Automation (MED), Torremolinos, Spain, 16–19 June 2015; pp. 292–297. [Google Scholar] [CrossRef]
  25. Rural Spark—Energy Kit. Available online: http://www.ruralspark.com/products/energy-kit/ (accessed on 12 October 2015).
  26. Narayan, N.; Qin, Z.; Popovic-Gerber, J.; Diehl, J.C.; Bauer, P.; Zeman, M. Stochastic load profile construction for the multi-tier framework for household electricity access using off-grid DC appliances. Energy Effic. 2018. [Google Scholar] [CrossRef]
  27. Soltowski, B.; Strachan, S.; Anaya-Lara, O.; Frame, D.; Dolan, M. Using smart power management control to maximize energy utilization and reliability within a microgrid of interconnected solar home systems. In Proceedings of the 7th Annual IEEE Global Humanitarian Technologies Conference (GHTC 2017), San Jose, CA, USA, 19–22 October 2017; pp. 1–7. [Google Scholar]
  28. Groh, S.; Philipp, D.; Lasch, B.E.; Kirchhoff, H. Swarm Electrification: Investigating a Paradigm Shift Through the Building of Microgrids Bottom-up. In Decentralized Solutions for Developing Economies; Springer: Berlin/Heidelberg, Germany, 2015; pp. 3–22. [Google Scholar]
  29. Groh, S.; Philipp, D.; Lasch, B.E.; Kirchhoff, H. Swarm electrification-Suggesting a paradigm change through building microgrids bottom-up. In Proceedings of the 2014 3rd International Conference on the Developments in Renewable Energy Technology (ICDRET), Dhaka, Bangladesh, 29–31 May 2014; pp. 1–2. [Google Scholar]
  30. Meteotest. (Software) Meteonorm ver 7.1; 2014.
  31. Narayan, N. Electrical Power Consumption Load Profiles for Households with DC Appliances Related to Multi-Tier Framework of Household Electricity Access. Available online: https://doi.org/10.4121/uuid:c8efa325-87fe-4125-961e-9f2684cd2086 (accessed on 11 March 2018).
  32. Jhunjhunwala, A.; Lolla, A.; Kaur, P. Solar-dc microgrid for Indian homes: A transforming power scenario. IEEE Electrif. Mag. 2016, 4, 10–19. [Google Scholar] [CrossRef]
  33. Narayan, N.; Papakosta, T.; Vega-Garita, V.; Qin, Z.; Popovic-Gerber, J.; Bauer, P.; Zeman, M. Estimating battery lifetimes in Solar Home System design using a practical modelling methodology. Appl. Energy 2018, 228, 1629–1639. [Google Scholar] [CrossRef]
Figure 1. 1-day load profiles for tier 4 and tier 5 levels of electricity consumption. Data sourced from [31].
Energies 12 00938 g001
Figure 2. Concept illustration of an interconnected SHS-based meshed DC microgrid.
Energies 12 00938 g002
Figure 3. Modular DC architecture for an SHS-based DC microgrid that enables intra-household growth option as well as scalability in the form of a meshed DC microgrid. Dashed battery with converter illustrates the modular capability. Similar modular expandability can be considered for loads and PV too. The additional hardware needed to go from standalone SHSs to microgrid, along with the high power loads at 380 V that the microgrid can support, are denoted in blue colour.
Energies 12 00938 g003
Figure 4. Flow chart explaining the power management scheme used in the standalone SHS model; it represents the algorithm followed in every time step [9].
Energies 12 00938 g004
Figure 5. Steps involved in the modeling of energy sharing between the SHS for a given number of households. T denotes the total time period of simulation.
Energies 12 00938 g005
Figure 6. Algorithm for sharing the excess energy based on the ranking of load deficit (in terms of E fail and battery depth of discharge (DOD)).
Energies 12 00938 g006
Figure 7. Battery energy levels for the 4 SHS batteries without sharing and after the combined excess energy distribution based on proportional (Prop.) energy sharing, priority (Pri.) energy sharing, and equal (Eq.) energy sharing. The rated battery capacity is also shown as the dashed line in the plot.
Energies 12 00938 g007
Figure 8. Comparison of 1-day load profile for a tier 4 standalone SHS and an average load profile for the SHS-based microgrid with 50 households for the same day. The demand diversity can be seen to significantly reduce the peak average load.
Energies 12 00938 g008
Figure 9. Comparison of 1-day load profile for a tier 5 standalone SHS and an average load profile for the SHS-based microgrid with 50 households for the same day. The demand diversity can be seen to significantly reduce the peak average load.
Energies 12 00938 g009
Figure 10. A snapshot capturing the energy sharing between two interconnected SHSs over a period of 32 h during the 1 year of simulation.
Energies 12 00938 g010
Figure 11. Performance comparison of the 3 excess energy-based battery charging methods in terms of LLP for varying homogeneous (tier 5) microgrid sizes. The 3 methods are proportional (Prop.), priority (Pri.), and equal (Eq.) energy sharing
Energies 12 00938 g011
Figure 12. Impact of increasing microgrid size on LLP per household for homogeneous microgrids of tiers 4 and 5.
Energies 12 00938 g012
Figure 13. Variations in normalized average E fail per household for homogeneous microgrids composed of tiers 4 and 5.
Energies 12 00938 g013
Figure 14. Change in peak average load with increasing microgrid size for tier 5.
Energies 12 00938 g014
Figure 15. Variations in average LLP per household over battery size for a homogeneous tier 5 microgrid with 20 households. The points marked correspond to the different battery sizes for the standalone (circular dots) and microgrid case (green rectangles), respectively.
Energies 12 00938 g015
Figure 16. Variations in average LLP per household over battery size for a homogeneous tier 4 microgrid with 20 households. The points marked correspond to the different battery sizes for the standalone (circular orange dots) and microgrid case (blue rectangles), respectively.
Energies 12 00938 g016
Table 1. Multi-tier matrix for measuring access to household electricity supply. Sourced from [6].
Tier 1Tier 2Tier 3Tier 4Tier 5
Energy and peak power rating > 12 Wh & > 3 W > 200 Wh & > 50 W > 1 kWh & > 200 W > 3.4 kWh & > 800 W > 8.2 kWh & > 2 kW
Availability (h/day) > 4 > 4 > 8 > 16 > 23
Availability (h/evening) > 1 > 2 > 3 > 4 > 4
Reliability---< 14 disruptions per week< 3 disruptions per week
Quality---Voltage problems do not affect the use of desired appliances
Affordability---Cost of 365 kWh/year < 5 % of household income
Legality---Bill is paid to the utility or authorized representative
Health & Safety---Absence of past accidents and high-risk perception in the future
Table 2. Main load profile parameters based on the 1-year generated load profile: maximum ( P max ) and minimum peak power ( P min ), and average daily energy E daily ¯ for each tier [26].
Tier 1Tier 2Tier 3Tier 4Tier 5
P max (W)125115416703081
P min (W)6351135831732
E daily ¯ (Wh)5021898139529531
Table 3. Optimal SHS sizes that satisfy the different LLP criteria, along with the performance of these system sizes on the system metrics. Adapted from [9].
LLP [-]TierPV [Wp]Battery [Wh] R dump [-]LLP [-]
≤ 0.1120600.820.047
2702100.480.1
33807200.810.1
4162025200.890.099
5405053000.990.089
≤ 0.05120600.820.047
2802400.650.039
33408600.560.042
4150028800.730.046
5380061500.840.0431
≤ 0.02120700.800.019
2902900.850.019
342010200.920.012
4174035601.00.017
5400066000.930.029

