Review

Models and Indicators to Assess Thermal Sensation Under Steady-State and Transient Conditions

Department of Electronics, Telecommunications and Energy, Valahia University of Targoviste, Aleea Sinaia no. 13, 130004 Targoviste, Romania
Energies 2019, 12(5), 841; https://doi.org/10.3390/en12050841
Submission received: 17 December 2018 / Revised: 19 February 2019 / Accepted: 25 February 2019 / Published: 4 March 2019
(This article belongs to the Section B: Energy and Environment)

Abstract

:
The assessment of thermal sensation is the first stage of many studies aimed at addressing thermal comfort and at establishing the related criteria used in indoor and outdoor environments. The study of thermal sensation requires suitable modelling of the human body, taking into account the factors that affect the physiological and psychological reactions that occur under different environmental conditions. These aspects are becoming more and more relevant in the present context in which thermal sensation and thermal comfort are represented as objectives or constraints in a wider range of problems referring to the living environment. This paper first considers the models of the human body used in steady-state and transient conditions. Starting from the conceptual formulations of the heat balance equations, this paper follows the evolution occurred during the years to refine the models. This evolution is also marked by the availability of increasingly higher computational capability that enabled the researchers developing transient models with a growing level of detail and accuracy, and by the validation of the models through experimental studies that exploit advanced technologies. The paper then provides an overview of the indicators used to characterise the local and overall thermal sensation, indicating the relations with local and overall thermal comfort.

1. Introduction

Thermal sensation (TS) and thermal comfort (TC) are vital concepts for the life of the occupants in living environments. These two concepts are defined in the ASHRAE Standard 55-2017 [1] concerning indoor environments. TS is a physical property of the body, defined as “a conscious feeling commonly graded into the categories cold, cool, slightly cool, neutral, slightly warm, warm and hot”. TC is defined as “that condition of mind which expresses satisfaction with the thermal environment and is assessed by subjective evaluation”. The thermal environment represents “the characteristics of the environment that affect a person’s heat loss”.
TS is the result of the body "psycho-physical reaction" to the thermal stimuli related to indoor conditions. TS depends on the human body temperature, which in turn is a function of the effects of the comfort factors. These comfort factors are indoor environmental factors (mean air temperature around the body, relative air velocity around the body, humidity, and mean radiant temperature to the body [2]) and personal factors of the occupants (metabolic rate or internal heat production in the body, which vary with the activity level, and clothing thermophysical properties such as clothing insulation and vapour clothing resistance). Furthermore, TS expresses the perception of the occupants, while TC assesses this perception taking into account physiological and psychological factors [3].
In physiology, the concept of thermal neutrality is defined by the Thermal Neutral Zone (TNZ) as the ambient temperature range in which the human body can maintain the body core temperature with no regulatory change in the metabolic heat production or sweating [4]. In these conditions, the temperature regulation is only obtained from the control of the sensible heat loss. From the biological point of view, the human thermoregulation system aims to maintain the temperature homeostasis (i.e., to keep a stable internal environment within the body) when the external environment is changed.
The main physiological indicators of the human responses to thermal environments are the skin temperature, which changes due to the ambient and body activity; the internal body or core temperature, which is the mean temperature of the thermal core of the body; the sweat rate, that represents the quantity of fluids lost by the body through sweat during exercise; the skin wettedness, which is the portion of the total skin surface area of the body covered with sweat, and the arterial and venous flow rates [5]. The lack of physiological experimental data is a major issue for the validation of the thermoregulation models.
The psychological factors include naturalness (an environment where the people tolerate wide changes of the physical environment), expectations and short/long-term experience (which directly affect individuals’ perceptions), time of exposure, perceived control, and environmental stimulation [6]. In addition, the psychological response of the individuals depends on social, economic and cultural aspects [7]. Furthermore, sensations of pleasure or pain, and the behaviour of the individuals (e.g., to change clothing or change the setting of a thermostat) are based on psychological responses that cannot be easily predicted on the basis of physical or physiological aspects.
The most used models to assess TS of the human body with respect to the environment have been developed starting from the Fanger empirical model [3] for steady-state conditions, and from the Gagge model [8] for transient conditions. Fanger’s work introduced a different and engineering-based approach with respect to the physiological approach that was used in the American School (see some historical notes in [9]). In the Fanger model, the thermoregulatory system of the human body creates a heat balance in a wide range of the environmental variables in indoor environments. The Fanger empirical model was used in the Standard ISO 7730 first issued in 1984 [10], and in its successive editions. Further studies considered that the occupants tend to make adaptations to reach better thermal comfort, following different approaches such as behavioural adjustment, physiological adaptation, and psychological expectations [11]. Thereby, adaptive models were developed for indoor spaces that can be controlled by the occupants, in which the outdoor climate can affect the indoor conditions. The adaptive model of de Dear and Brager [11] for indoor spaces with no heating, ventilation and air conditioning (HVAC) systems was included for the first time in the Standard ASHRAE 55:2004 [12]. In Europe, an adaptive model was included in the European Standard EN 15251:2007 [13], and further regulatory documents worldwide have incorporated an adaptive thermal comfort model [14].
To obtain an accurate assessment of TS, the best way generally considered is to ask the individuals directly. The metrics referring to TS and TC concepts are presented in the Standards [15] and [16]. Table 1 summarises various scales.
TS is represented by using the ASHRAE 7-point scale [15], the 9-point scale used in other prediction models, and the 11-point scale used in the Fanger model [3]. The Gagge model uses the 11-point Thermal Discomfort (TD) index to predict TS [17]. Although the use of these scales does not explain why the subjects indicate their sensation on a given point of the scale, the direct responses obtained provide practical information to be elaborated together with the physiological information and the physical characteristics of the environment [2].
The most used concept to address the opinion of the subjects concerning TS is the Thermal Sensation Vote (TSV). The subjects express their vote to rate their TS when they are exposed to given thermal conditions, by using a scale from cold to hot, with a predefined number of points. TSV can refer to the whole body, to quantify the global sensation, as well as to local body parts, indicating a local sensation. In the latter case, it is possible to compare the TSV results with the results of the physiological measurements carried out in the corresponding parts of the body [18]. Takada et al. [19] propose a nonlinear multiple regression analysis to predict TSV in function of the mean skin temperature and its differences in time. In general, it is very hard to correlate the physiological variables with information concerning global and local sensation.
Recent reviews deal with TS models. Walgama et al. [20] present computational and empirical models to predict thermal response and TS in the transient non-uniform environment for the automotive sector. Seven TS prediction models are experimentally compared in [21], indicating how the accuracy of the input parameters and the characteristics of the model affect the prediction accuracy. Schlader et al. [22] investigate the control of the human thermoregulatory behaviour during rest and exercise. The control of thermal perceptions, the perceived exertion and the importance of the skin temperature as thermal input to maintain temperature regulation are analysed. To evaluate TS, Alahmer et al. [23] focus on human thermal physiological models, psychological models, thermal manikin models, and combined models. Cheng et al. [24] address specific models based on physiological and environmental parameters.
Khodakarami and Nasrollahi [25] deal with the levels of productivity of the staff workers in hospitals. This analysis is useful considering that the thermal conditions have a significant influence on the health, safety and welfare of the occupants who work in these environments. Katić et al. [26] consider the thermophysiological models that describe the physiological responses, taking into account the heat transfer in the human body under different environmental conditions. In addition, they describe the issues about modelling isolated body segments for evaluating the sensitivity of different body zones and body extremities for various thermal environments. Mishra et al. [27] include a section dealing with TS in non-uniform ambient, with details on local sensations and comfort. Schweiker et al. [28] provide an overview of the scales used in studies in which TS scale, thermal preference scale, TC scale, thermal acceptance scale, and other scales are exploited. Psikuta et al. [29] deal with the usage of thermal manikins to assess the opportunities and constraints of thermo-physiological human simulators, including automotive field, artificial microclimates for human occupancy, clothing research, and urban environment. A review of local and overall TS models is presented in [30].
Table 2 summarises the recent review papers presented above. The relevant topics addressed are categorised into thermoregulatory control, applications to different contexts, human thermal physiological and psychological models, and numerical comparison with different software tools. The table shows that generally these reviews cover dedicated aspects of models and indices for TS prediction in specific environments.
This paper presents a review of the models of the human body used in steady-state and transient conditions for TS assessment. The conceptual formulation of the heat balance equations of the human body is recalled, with the corresponding models and indices for TS prediction in steady-state conditions. The attention is then focused on the models developed in transient conditions, following the evolution occurred during the years to define and refine these models. This evolution is also marked by the availability of increasingly higher computational capability that enables the researchers developing transient models with a growing level of detail and accuracy. Specific issues are pointed out, concerning the ways to model physiological aspects, the importance of the clothing model, the conditions of validity of the existing models, the model validation referring to the need to progressively correct the models on the basis of experimental data, and the differences emerging from different approaches, also on the standardisation side. Many of the models and indices are valid only in specific thermal conditions (e.g., moderate environments, cold or hot environments; indoor or outdoor conditions). The limitations of the models, also due to the lack of physiological and psychological aspects, and the possible incorporation of psychological aspects are discussed.
The last part presents an overview of the indicators used to characterise the local thermal sensation (LTS) and the overall thermal sensation (OTS), to show the link between these indicators and the models used in TC studies.

2. Steady-state Conditions

In the human body, the internal energy stored in the food is converted into mechanical work and thermal energy through the chemical process of digestion. The relevant quantity that indicates the generation of energy is the metabolic rate (or metabolic energy transformation), indicated by the symbol M. The metabolic rate is defined in the Standard ISO 13731:2001 [31] as the “rate of transformation of chemical energy into heat and mechanical work by aerobic and anaerobic metabolic activities within an organism”. According to the Standard ISO 8996:2004 [32], the metabolic rate “measures the energetic cost of muscular load and gives a numerical index of activity”.
The metabolic rate depends on the activity level. Heat is dissipated from the body (to keep its internal temperature constant) to the surroundings through the skin by heat transfer phenomena and activities [33]. In this case, the human body uses four processes of heat transfer (conduction, convection, radiation and evaporation of sweat) to maintain homeostasis [3].
From heat transfer, the body loses or gains energy. In particular, the human body exchanges heat with the environment (by radiation and convection) and loses heat by diffusion and evaporation of body liquids [34]. Inside the human body, the heat transfer processes developed are given by heat conduction through body tissues and bones, and convection in blood vessels.

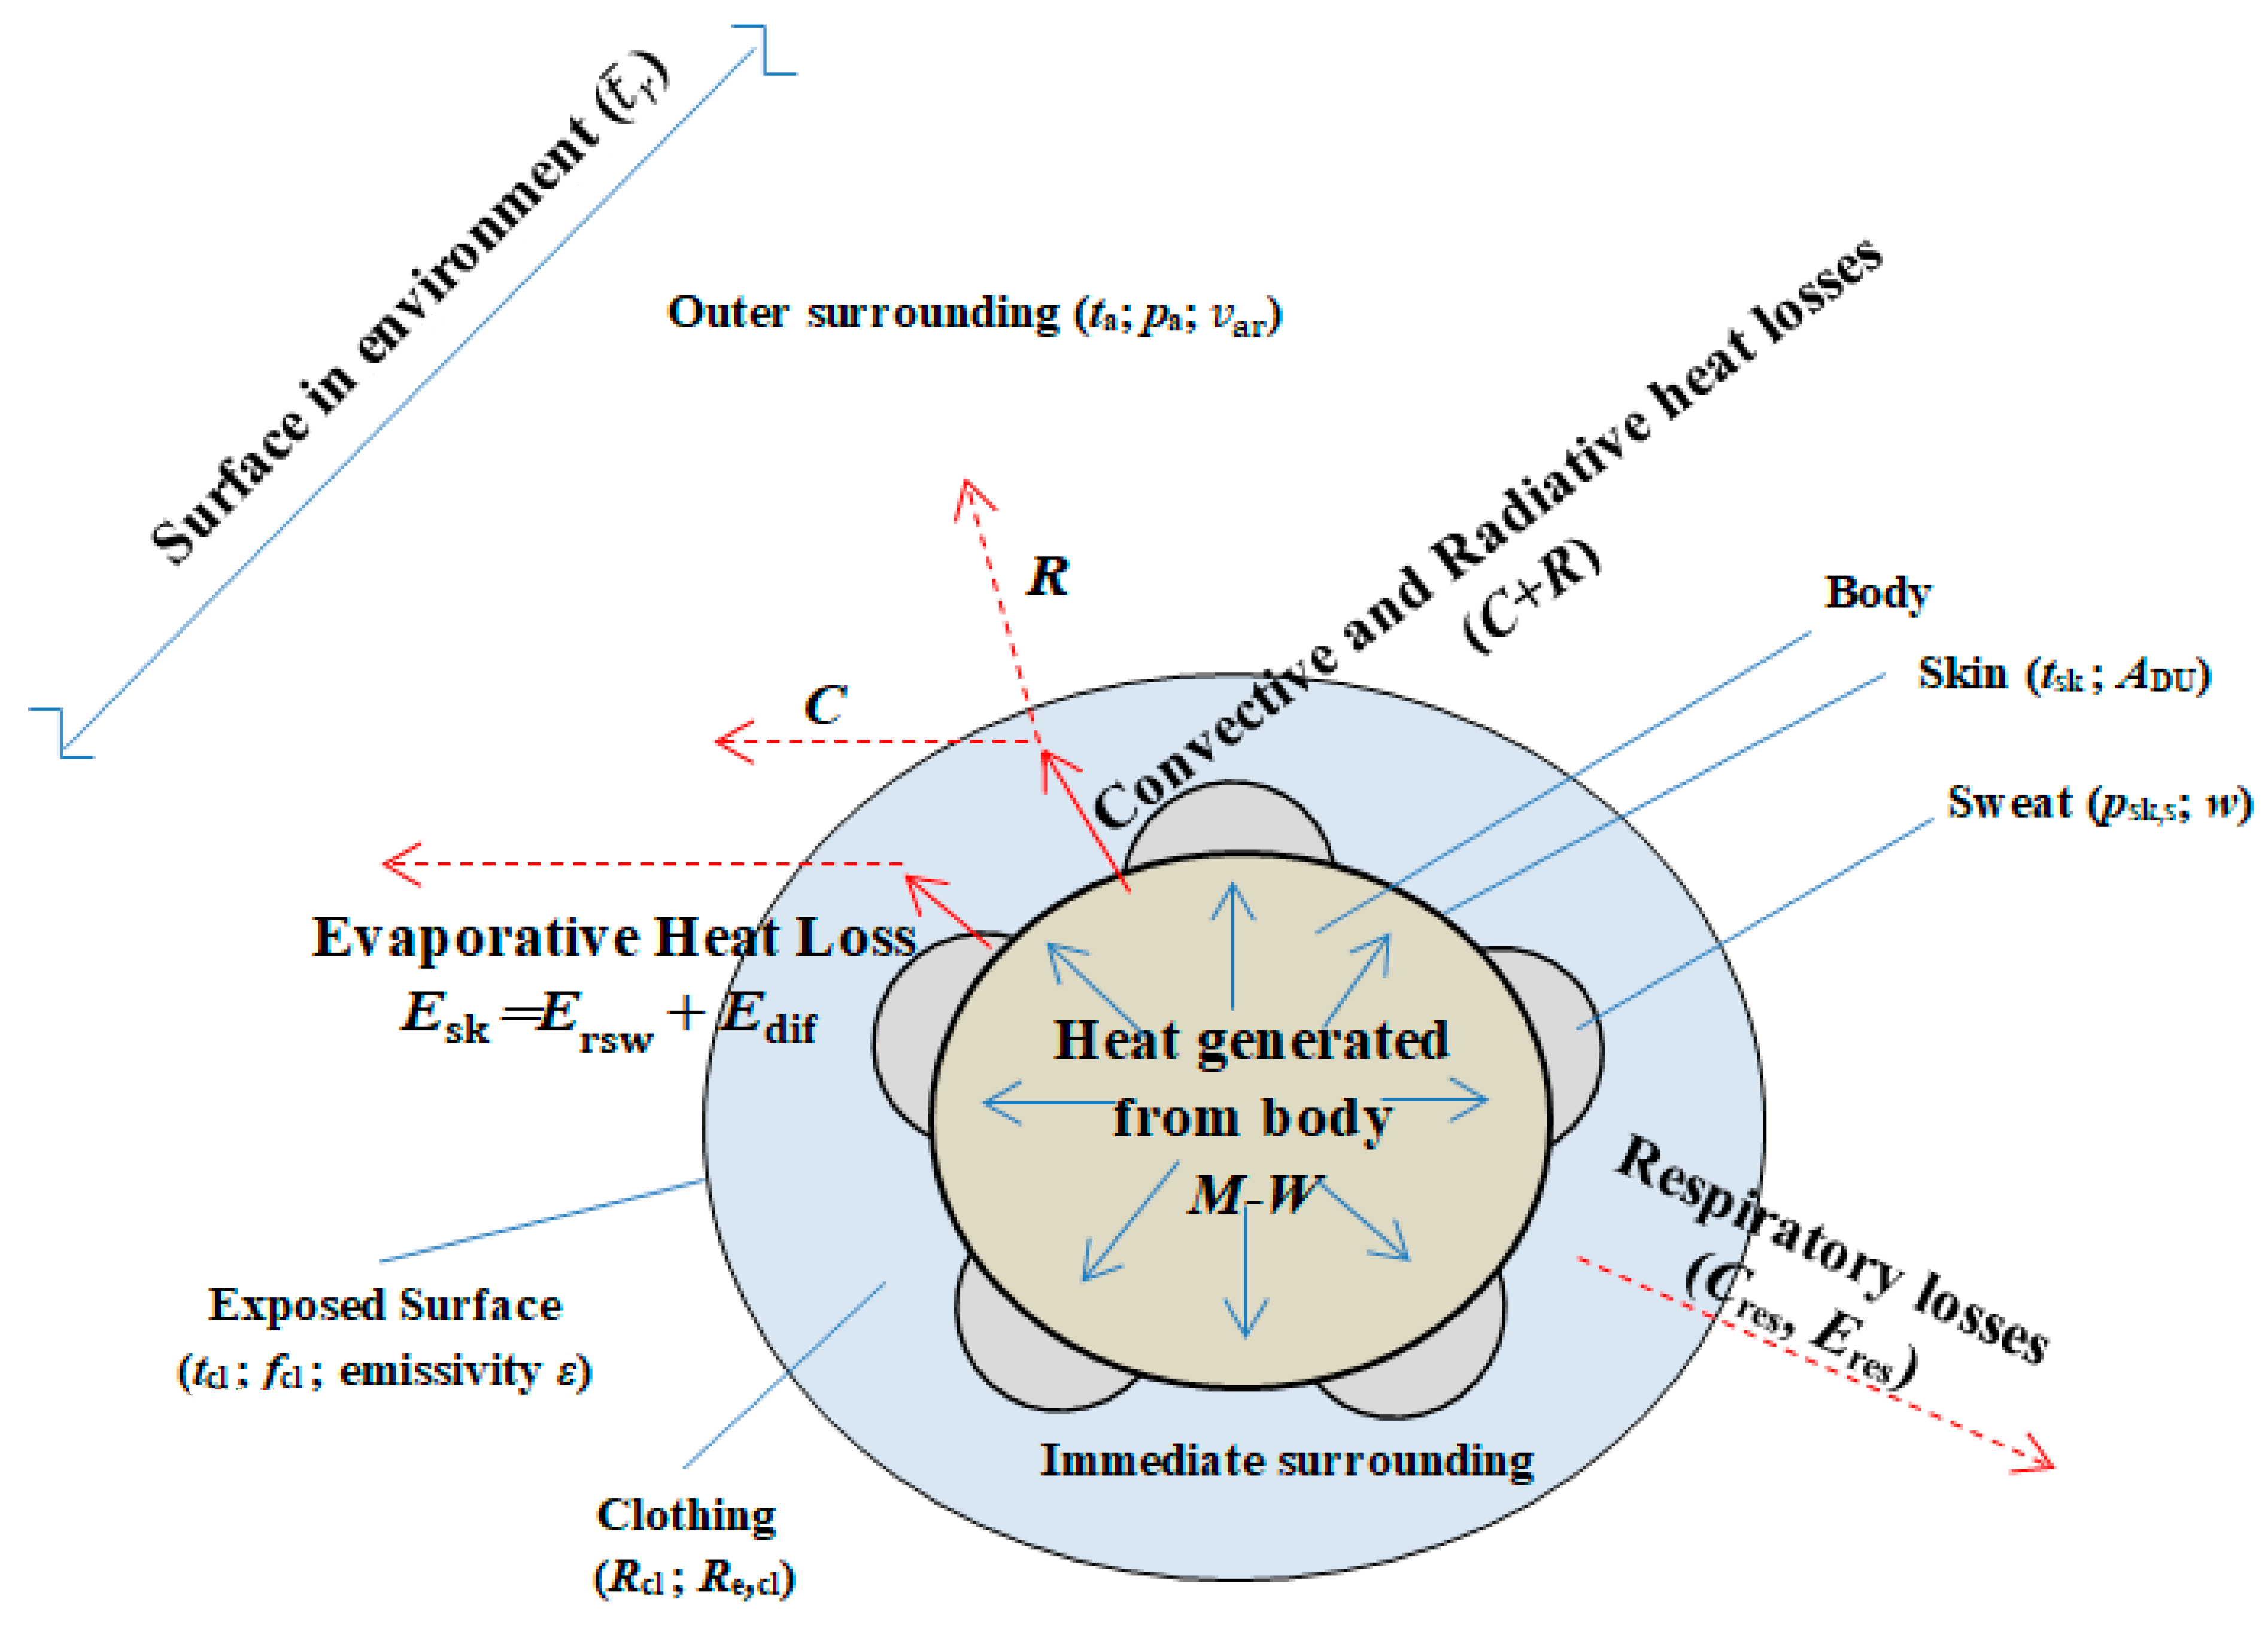
2.1. Heat Balance Equation of the Human Body

The body heat balance equation expresses the balance between the heat generated within the human body (metabolism) and the heat dissipated into the atmosphere to obtain thermal homeostasis. In this regard, the purpose of the thermoregulation system of the human body is to keep its constant core internal temperature, and for long exposures to a constant (moderate) thermal environment with constant M, the heat production is balanced with heat loss, while the heat storage within the human body is not significant [3]. The most important variables that influence thermal comfort are environmental variables and personal variables. The environmental variables (mean radiant temperature t ¯ r , air temperature t a , water vapour partial pressure in ambient air p a , and relative air velocity v ar ) give the outer surrounding. The personal variables are activity level (heat production in the body) and clothing [3].
Figure 1 presents the thermal interaction between the human body and the environment. The human body surface is represented as a control volume, whose boundary is the skin surface. Clothing is considered in the immediate surrounding. Heat dissipates from the body to the immediate surrounding the evaporative heat flow at the skin E sk , the convective heat flow C , the radiative heat flow R , and the respiratory heat flow q res . Further parameters are the local skin temperature t sk and the skin wettedness w [3].
TS depends on the body-surroundings heat transfer, which is strictly connected to environmental variables and personal variables due to the heat balance equation. The heat generated M-W is transferred to the outer surrounding through the skin surface q sk and the respiratory tract q res with any deficit and surplus stored S , leading to an increase or reduction of the body temperature [35]:
M W heat   generated = S + q sk + q res = ( S k + S cr ) S heat   storage + ( C + R + E sk ) q sk + ( C res + E res ) q res heat   losses
where the terms, measured in [W·m−2] and defined according to ISO 13731:2001 [31], are:
M metabolic rate, the sum between the metabolic rate required for the person’s activity M act and the metabolic rate required for shivering M shiv : M = M act + M shiv ;
W effective mechanical power, “the energy spent in overcoming external mechanical forces on the body”;
q sk total rate of heat loss from skin;
q res total rate of heat loss through respiration;
C + R sensible heat loss from skin;
C convective heat flow, “the heat exchange by convection between the boundary surface (clothing or skin) and environment”;
R radiative heat flow, “the heat exchange by radiation between the boundary surface (clothing or skin) and environment”;
E sk the evaporative heat flow at the skin, “the rate at which heat energy is transferred by evaporation from or condensation on the skin”;
C res respiratory convective heat flow, “the heat exchanges by convection in the respiratory tract”;
E res respiratory evaporative heat flow, “the heat exchanges by evaporation in the respiratory tract”;
S body heat storage rate, “the rate of increase (+) or decrease (−) in the heat content of the body caused by an imbalance between heat production and heat loss”;
S sk rate of heat storage in the skin compartment;
S cr rate of heat storage in the core compartment.
The body is considered as two thermal compartments: the skin and the core [8,36,37]. In this case, the body heat storage rate is the sum between the rate of heat storage in skin compartment S sk and rate of heat storage in core compartment S cr [35]:
S = S sk + S cr = ( 1 α sk ) · m · c p , b · A DU 1 · d t cr d τ + α sk · m · c p , b · A DU 1 · d t sk d τ
where:
α sk fraction of the body mass concentrated in the skin compartment, dimensionless;
c p , b specific heat capacity of body, with c p , b = 3490   J · ( kg · K ) 1 ;
A DU DuBois body surface area, “the total surface area of a nude person”, with A DU = 0.202 · m 0.425 · h 0.725 , m 2 ;
m body mass, kg;
h body height, m;
t cr core temperature, “the mean temperature of the thermal core of the body”, ° C ;
t sk local skin temperature, “the skin temperature measured at a specific point of the body surface”, ° C ;
τ time, s.

Heat Losses from the Body to Outer Surrounding

Heat dissipated from the body to the outer environment [35]:
  • The sensible heat loss from the skin C + R can be expressed as:
    C + R = ( t sk t 0 ) · ( R cl + 1 f cl · h ) 1
    where the terms are defined according to the Standard ISO 13731:2001 [31]:
    h total heat transfer coefficient, the sum between the convective heat transfer coefficient h c and radiative heat transfer coefficient h r , h = h c + h r , W · ( m 2 · K ) 1 ;
    h c convective heat transfer coefficient, “the net sensible heat transfer per unit area between a surface and a moving fluid medium per unit temperature difference between the surface and the medium”, W · ( m 2 · K ) 1 ;
    h r radiative heat transfer coefficient, “the net rate of heat transfer per unit area by radiation between two surfaces, per unit temperature difference between the surfaces”, W · ( m 2 · K ) 1 ;
    t 0 operative temperature, “uniform temperature of an imaginary black enclosure in which an occupant would exchange the same amount of heat by radiation plus convection as in the actual non-uniform environment”, ° C ;
    t 0 = ( h r · t ¯ r + h c · t a ) · h 1
    t a air temperature, “the dry-bulb temperature of the air surrounding the occupant, ° C ;
    t ¯ r mean radiant temperature, “uniform temperature of an imaginary black enclosure in which an occupant would exchange the same amount of radiant heat as in the actual non-uniform enclosure”, ° C ;
    f cl clothing area factor f cl = A cl A DU 1 , “ratio between the surface area of the clothed body, including unclothed parts, and the surface of the nude body”, dimensionless;
    R cl thermal resistance of clothing, ( m 2 · K ) · W 1 .
  • The evaporative heat flow at the skin E sk is the sum between evaporative heat loss by regulatory sweating E rsw and diffusion evaporative heat loss E dif :
    E sk = E rsw + E dif = w rsw · E max + ( 1 w rsw ) · 0.06 · E max with   regulatory   sweating = E max · [ w rsw + ( 1 w rsw ) · 0.06 ] w
    where the terms are defined as in the Standard ISO 13731:2001 [31]:
    w skin wettedness, “the equivalent fraction of the skin surfaces which can be considered as fully wet,” dimensionless;
    w rsw skin wettedness caused by diffusion, represents the zone of the human body which has to be wetted to evaporate the regulatory sweat:
    w rsw = E rsw E max
    E max maximum possible evaporative heat flow at the skin, “the heat flow due to evaporation that can be achieved in the hypothetical case of the skin completely wetted”; E max occurs when skin wittedness is w = 1 :
    E max = p sk , s p a R e , cl + ( f cl · h e ) 1
    p sk , s saturated water vapour pressure at skin temperature, kPa ;
    p a water vapour partial pressure, “the pressure which the water vapour would exert if it alone occupied the volume occupied by the humid air at the same temperature”, kPa;
    R e , cl evaporative resistance of a clothing ensemble, “resistance to vapour transport of a uniform layer of insulation covering the entire body that has the same effect on evaporative heat loss as the actual clothing under (static, wind-still) conditions”, W · ( m 2 · kPa ) 1 ;
    h e evaporative heat transfer coefficient, “net latent-heat per unit vapour-pressure difference caused by the evaporation of water from a unit area of a wet surface or by condensation of water vapour on a unit area of body surface”, W · ( m 2 · kPa ) 1 .
  • The respiratory heat flow q res is the sum between the respiratory convective heat flow C res and the respiratory evaporative heat flow E res :
    q res = C res + E res = 0.0014 · M · ( 34 t a ) + 0.0173 ·   M · ( 5.87   p a )
Because the heat balance cannot alone determine thermal comfort, there are two linear regression equations (one of the mean skin temperature, and the other of the sweat rate with data obtained from [38]) useful to obtain a connection between thermal comfort and physiological and heat flow expressions [35]:
t sk = 35.7 0.0275 · ( M W )
E rsw = 0.42 · ( M W 58.15 )

2.2. Approaches for Assessing Indoor and Outdoor Human Thermal Indices

The heat balance equation can be used both in moderate thermal environments, where the aim is to achieve the thermal comfort conditions, and in severe environments where the health protection of the workers to hot or cold stress is very important. The thermal environment is evaluated by using an adequate human thermal index [39]. The human thermal index can be any indicator or parameter that includes climate variables or terms that represent the state of the thermal environment, for a person or a group of persons [40].
The choice of a proper human thermal index is based on the following approaches: (a) studies in situ for making a subjective assessment of the climatic conditions; (b) analytical studies necessary to group the environmental and personal parameters in a single index; and (c) determination of the combinations of the climatic parameters to obtain the same physiological effect [39]. Blazejczyk et al. [41] made a categorisation of thermal indices as: (a) direct indices, based on direct measurements of the environmental variables, which are more user friendly and easily applicable (e.g., the wet-bulb globe temperature—WBGT, the apparent temperature, and the operative temperature); (b) empirical indices based on subjective and objective stress, difficult to be implemented for daily use due to the multitude of variables and invasive measurements (e.g., the Predicted Heat Strain—PHS [42]); and c) rational indices based on the calculation concerning the heat balance of the human body, difficult to be implemented for daily use (e.g., the heat stress index for warm weather; the required clothing insulations for cold environments—IREQ [43]). De Freitas and Grigorieva [40] classified the human thermal climate indices according to the following criteria: (a) the thermal conditions where the index must be used; (b) for what type of metabolic states the index is applied for; (c) the environmental parameters (mean radiant temperature, air temperature, relative air velocity, humidity) considered as the input values in the block diagram of the index; (d) personal parameters (metabolic rate and clothing insulation) considered as the inputs the block diagram of the index; (e) an absolute or relative measure of thermal conditions; (f) an index of thermal environmental stress; and (g) if the index has been experimentally tested and validated.
There is a vast literature dedicated to the indoor and outdoor thermal indices. The International Standard Organisation (ISO) selected only a set of reliable indices to be published in the Standards, where: (1) moderate environments are evaluated by the Predicted Mean Vote (PMV) presented in the Standard ISO 7730:2005 [44]; (2) hot extreme environments are evaluated by the WBGT index presented in the Standard ISO 7243:2017 [45], and for transient conditions the PHS approach is used in the Standard ISO 7933:2004 [42]; and (3) cold extreme environments are evaluated by the IREQ index presented in the Standard ISO 11079:2007 [43]. Furthermore, some indices with interesting characteristics have not been used any longer after their definition [39].
The conditions of applicability of the indoor and outdoor indices have to be carefully stated and followed. For indoor conditions, the suitable indices are based on steady-state models. These indices cannot be used outdoor, where non-steady-state models are needed [46]. In fact, in outdoor conditions the external variables change more frequently than inside a building. In addition, for relatively short times (e.g., less than one hour) a thermal steady state is difficult to be reached, because of the mechanisms of thermal adaptation of the body temperatures. Moreover, the thermal expectations of the individuals can be very different from the psychological point of view.
Typically, for indoor moderate environments the PMV method is adopted. This method requires quasi-steady state conditions and assumes there is no heat storage variation in the human body. These assumptions are not valid outdoors. Moreover, solar radiation is present outdoors, while this term does not appear on the energy balance equation on which the PMV method is based. On-site measurements and questionnaires [47] have shown that, even extending the PMV beyond the [−3, +3] range, the actual sensation recorded by people does not agree with the expected PMV.

2.3. Fanger One-Dimensional Model

This model solves the heat balance equation between the human body and its surrounding environment [48]. The whole body is considered as a single node. The clothing system is simulated as uniform insulation over the entire body surface [49]. The heat balance is obtained taking into account physiological and physical factors, that is, the heat production by metabolism and by external work, as well as the heat loss due to evaporation, respiration, radiation, conduction and convection from the surface of the clothing and skin [50].
Fanger negatively debated the American approach concerning thermal comfort in his research [51]. The American approach related to thermal comfort considered no air motion, only one level of metabolic rate, t a = t ¯ r , and one clothing type (e.g., summer). Fanger developed his equation by means of experimental studies on a large number of young subjects. The result of the experimental researches was that the TS could be connected to the mean skin temperature t ¯ sk and the heat loss by evaporation (both depending on the metabolic rate M ) [9]. The Fanger comfort equation is mainly focused on the thermal physiology of the human body [52]. It is applied only to subjects with a constant M exposed to steady-state conditions in uniform thermal environments for an extended period, and is appropriate for sedentary people.
The Fanger comfort equation [3], based on the heat balance equation of the human body under particular boundary conditions, is written in the implicit form as follows:
f ( M , I cl , v ar , t ¯ r , t a , p a ) = 0
where I cl is the clothing insulation, defined as “the thermal insulation from the skin surface to the outer clothing surface (considering enclosed air layers)”, [clo], where 1 clo = 0.155 (m2·°C)/W; v ar is the relative air velocity, or “the air velocity relative to the occupant, including body movements”, [m·s−1] [31].
Fanger’s experimental studies, based on the thermal balance model, have an important advantage by controlling all environmental parameters. The field studies developed later had shown the same purpose, namely, thermal comfort is obtained when the body temperature is maintained with the lowest effort of physiologic regulation [53].
Fanger carried out experimental studies in air-conditioned chambers in Denmark in the 1970s, on the human perception. He established that the TS is mainly obtained by narrow ranges of sweat evaporation rate and skin temperature, considering the activity level. He measured just physical quantities easy to be obtained by experiments. In addition, he observed that the values are correlated with the outer surrounding of the human body. The effects of diverse environmental variables (air velocities, air temperatures, and diverse humidity) are taken into account in Fanger’s model. In addition, these variables are connected to the release of the heat from the skin to the outer surrounding, without many details about the heat transfer processes developed inside the human body. The heat generated by the body activities must be totally dissipated to the outer surrounding to keep a steady state of comfort. The heat is transferred from the body core to the skin, and after that it is dissipated due to the processes of heat transfer taken into account in Fanger’s model [54].
The practical concepts that emerged from Fanger’s model are the Predicted Mean Vote (PMV) described below and the Predicted Percentage of Dissatisfied (PPD). The PMV index is based on heat balance studies, being considered as a reference index for buildings provided with HVAC systems in a moderate indoor thermal environment. The PMV index appeared in the first edition of the Standard ISO 7730:1984 [10], was accepted about 20 years later also by ASHRAE, and is currently used in various Standards such as ISO 7730:2005 [44], EN 15251:2007 [13], ASHRAE 55-2017 [1], and ISO 17772-1:2017 [55]. The PPD index is obtained from the PMV index, and gives information on discomfort or dissatisfaction. The PMV and PPD indicators predict cold and warm discomfort for the body as a whole [44]. The PPD index predicts the number of people who feel too cool or too warm (thermally dissatisfied) among a large group of people in a given environment [44].
Dissatisfaction is also caused by unwanted heating or cooling of one particular zone of the human body (local discomfort) [44]). Furthermore, the local thermal discomfort is caused by draught (unwanted local cooling of the body provoked by air motion) DR, vertical air temperature difference, warm and cool floors, and radiant asymmetry (provoked by cool walls/windows or warm ceilings) Δ T p r , which are parameters provided by the Standard ISO 7730:2005 [44] and are presented in Section 2.5.

2.4. PMV Index for Thermal Sensation Prediction

PMV based on the thermal neutrality concept has been used to predict TS on a seven-point scale from “cold” (−3) to “hot” (+3) for a single-segment human body in a uniform environment and steady-state conditions in buildings with HVAC systems [1,55]. The PMV index represents the expected average TSV, considering that a large group of people with the same activity level and clothing insulation in a given environment express their thermal sensation vote (TSV). The PMV index predicts TS as a function of the personal parameters and environmental parameters that affect the human heat balance.
Fanger [3] estimated the PMV index to express disequilibrium between the actual heat flow from a human body in a given environment and the heat flow required to get optimum comfort for a given activity, by the following expression:
P M V = [ 0.303 · e 0.036 · M + 0.028 ] · L
where L is the thermal load of the human body defined by Fanger [3] as “the difference between internal heat production and the heat loss to the actual environment for a man kept at the comfort values of the mean skin temperature and the sweat secretion at the actual activity level”.
In the thermal comfort condition, L = 0 . In other environments, the effector mechanisms (vasodilatation, vasoconstriction, sweat secretion and shivering) of the body modify the sweat secretion and the mean skin temperature to keep the body heat balance. The thermal load of the human body represents an expression for the physiological strain on the effector mechanism of the body. In addition, TS at a certain activity level is connected to this strain [3].
The expression of the PMV index is presented in the Standard ISO 7730:2005 [44]:
P M V = [ 0.303 · e ( 0.036 · M ) + 0.028 ] · { ( M W ) 3.05 · 10 3 · [ 5733 6.99 · ( M W ) p a ] · 0.42 [ ( M W ) 58.15 ] 1.7 · 10 5 · M · ( 5867 p a ) 0.0014 · M · ( 34 t ¯ r ) 3.96 · 10 8 · f cl · [ ( t c l + 273 ) 4 ( t ¯ r + 273 ) 4 ] f cl · h c · ( t cl t a ) }
By assuming PMV = 0, different combinations of environmental parameters, activity level and clothing are predicted assuring a thermally neutral sensation [44]. The terms that appear in the PMV expression are:
  • The convective heat transfer coefficient is solved by iterations and is given by:
    h c = { 2.38 · | t cl t a |         for         2.38 · | t cl t a | 0.25 > 12.1 · v ar 12.1 · v ar                   for               2.38 · | t cl t a | 0.25 > 12.1 · v ar }
  • The ratio of clothed surface area f cl is expressed by:
    f cl = { 1.00 + 1.290 · I cl     for         I cl   0.078   m 2 · K · W 1 1.05 + 0.645 · I cl     for         I cl   0.078   m 2 · K · W 1 }
The clothing surface temperature T cl is a variable obtained by solving in an iterative way the implicit equation:
t cl 35.7 + 0.28 · ( M W ) + I cl · { 3.96 · 10 8 · f cl · [ ( t cl + 273 ) 4 ( t ¯ r + 273 ) 4 ] + f cl · h c · ( t cl t a ) } = 0
t cl = t sk I cl · { 3.96 · 10 8 · f cl · [ ( t cl + 273 ) 4 ( t ¯ r + 273 ) 4 ] + f cl · h c · ( t cl t a ) }
The clothing surface temperature t cl is a variable very important for obtaining the PMV index. d’Ambrosio Alfano et al. [56] showed that some software applications available to calculate the PMV index are not consistent with the values reported in the Standard ISO 7730:2005 [44] (Annex E), mainly because of missing input data and values of the clothing insulation not corrected by considering the effects of body movement and air action.

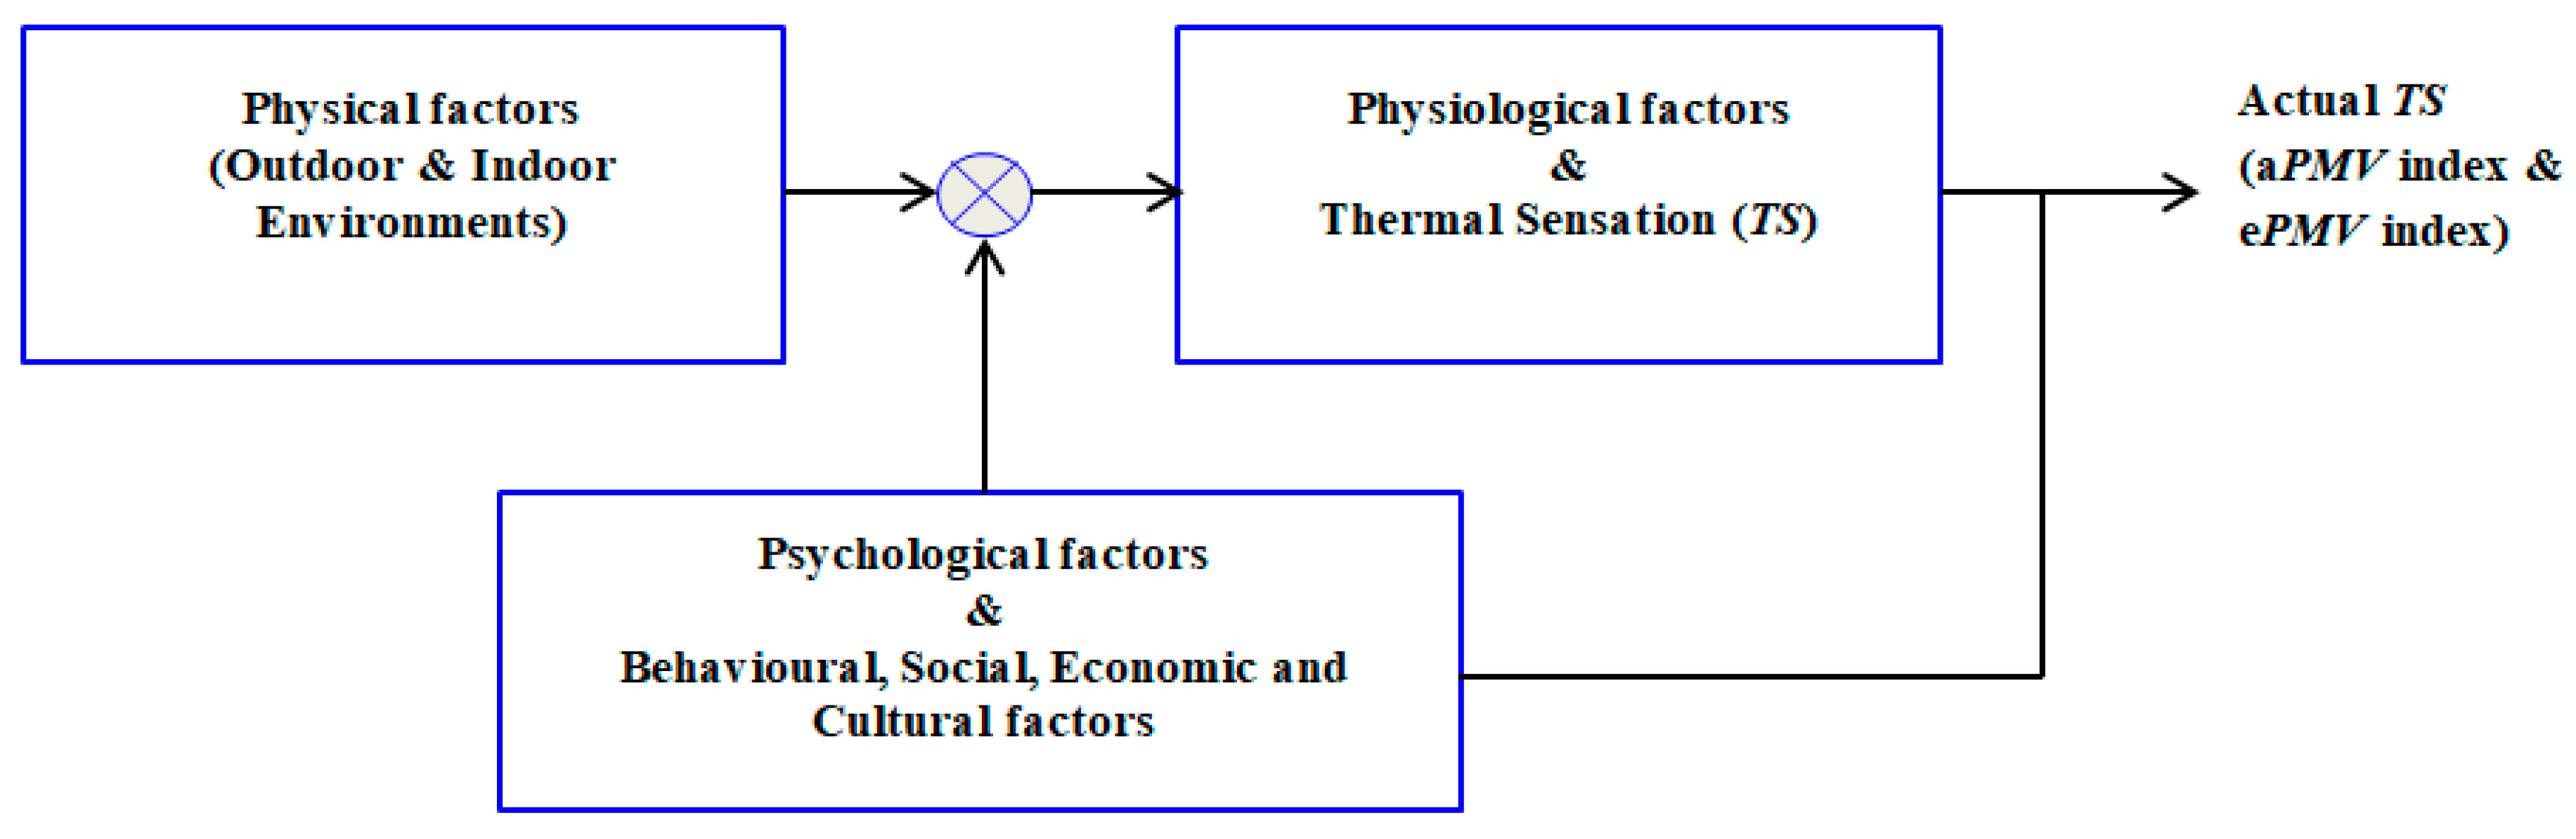
2.5. Psychological Factors, Adaptive PMV Index and Extended PMV Index

In addition to the physical and physiological factors, psychological factors play a key role. The identification and modelling of psychological factors are quite complex, as they depend on subjective conditions. In particular, the initial thermal state of the body, the position of the body, the rate of change of the temperature, and the duration of the thermal stimuli may have an impact on TS [2]. Candas and Dufour [57] reported an overview about the multisensory influence on the TS and comfort. To reduce the thermal disturbances an occupant must reconstruct an adequate climate around him in order to prevent the thermal discomfort. The individual judgement also depends on the presence of asymmetries resulting in different sensations in some body parts [24].
To assess the psychological response, subjective measures can be associated with a black-box approach, in which the stimulus is introduced as input, and the reaction (e.g., a TS or TD value taken from Table 1) is observed at the output. In the black-box approach, there is no need to know the internal model that describes the input-output relations, and even complex phenomena can be addressed. A limitation is a non-simple interaction with some categories of persons (e.g., very young children, sick people, or disabled) to gather the relevant information. Furthermore, in some cultures the individuals are less inclined to declare their sensations. Also, persons living in hot conditions may tend to prefer colder climates (and vice versa). Finally, the translation in different languages of the terminology used in the TS scale has to be accurate, to ensure that the terms used have the correct meaning in the specific language [2].
Subjective responses could also be formulated to understand whether the environment is acceptable or tolerable, or whether the individual expresses a preference for a change in the current status, e.g., to be in a warmer environment. An example is the set of subjective scales included in the Standard ISO 10551:1995 [16], which consider different types of judgements (perceptual, affective, thermal preference, personal acceptance, and personal tolerance).
Furthermore, TS can be assessed with a behavioural and observational approach, by observing the activity of the subjects in the environment (e.g., to put on or take off clothes, changes the thermostat set-points, change the mood or the way to speak, etc.).
The classical PMV is not appropriate for warm climates in buildings without HVAC systems, because studies have shown that it predicts a warmer TS than the persons feel [58]. The classical PMV is proper for buildings with HVAC systems in cold, temperate and warm climates, and is assessed over both winter and summer. For this reason, de Dear and Brager [11] proposed the adaptive PMV (aPMV) model, considered more adequate to establish thermal comfort in warm climates in buildings without HVAC systems. The adaptive model takes into account the thermal environmental conditions occurring in different periods of the year. If the occupants may have an influence on their thermal environment in these periods of time, the indoor thermal climate becomes more variable and the comfort can be improved [59].
The aPMV includes psychological aspects and heat balance together, while the classical PMV index does not take into account any psychological aspect. The optimal operating temperature is defined as the operative temperature that satisfies most individuals at a given clothing and activity level [60]. The classic PMV predicts optimum operative temperature by using four inputs (clothing insulation, metabolic rate, relative humidity, and relative air velocity). Instead, the aPMV model predicts it by using only one input (the mean monthly outdoor effective temperature) [11]. The mean monthly outdoor effective temperature at the highest value has an indirect influence on the heat balance of the human body [61]. The drawback of aPMV is that the thermal parameters, human clothing, and activity level, with significant impact on the heat balance of the human body and on the TS, are not taken into account.
Fanger and Toftum [61] introduced the ePMV model, suitable for buildings without HVAC systems, in warm and humid climates of regions with long summer, where the indoor air temperature considerably increases. This model considers the expectancy factor ep, which is a correction factor to be multiplied by PMV, aimed to determine the corrected value of PMV expressing the mean TSV of the occupants. The ep ranges between 0.5 and 1 and ep is 1 for building with HVAC systems. This correction factor depends on the period of warm weather during a year, and if the buildings without HVAC systems can be compared with many buildings from the region where the HVAC systems are located [61]. In this way, it is possible to take into account that in the environments without HVAC the occupants have a reduced expectation of comfort [39]. The determination of aPMV and ePMV follows the general scheme indicated in Figure 2, in which psychological aspects are seen as a feedback coming from the individual with respect to the classical TS determination.

2.6. Local Discomfort Assessment Models

Non-uniform environments are addressed with indicators of thermal discomfort (referring to radiant asymmetry, vertical air temperature gradients, warm or cold floors, or draught). For example, the Standard ISO 7730:2005 [44] defines a general expression of the percentage dissatisfied (PD) indicator in function of the radiant temperature asymmetry Δ t pr (“the difference between the plane radiant temperature of the two opposite sides of a small plane element” [31]), where the numerical values of the coefficients a pr , b pr , and c pr depend on the cause of radiant temperature asymmetry (warm ceiling, cool wall, cool ceiling, or a warm wall):
P D = 100 1 + exp ( a pr + b pr Δ t pr ) + c pr
Likewise, vertical air temperature gradients are addressed in the Standard ISO 7730:2005 [44] by considering the vertical air temperature difference Δ t a , v between head and feet, in [°C], to calculate PD with the following expression, valid for Δ t a , v < 8 °C and containing the numerical parameters a a , v and b a , v :
P D = 100 1 + exp ( a a , v + b a , v Δ t a , v )
With local thermal discomfort caused by warm or cold floors, PD depends on the floor temperature t f in [°C] and on the numerical parameters k f , a f , b f , and c f (for long occupancy the results are not valid for electrically heated floors):
P D = 100 k f exp ( a f + b f   t f + c f   t f 2 )
Concerning draught, the percentage of people predicted to be dissatisfied by the presence of draught is expressed in the Standard ISO 7730:2005 [44] as the draught rate (DR). The related model for predicting draught at the neck, valid for local mean relative air velocity v ¯ a , l < 0.5 m/s, local air temperature t a , l from 20 °C to 26 °C, local turbulence intensity Tu from 10% to 60%, and numerical parameters a d , t , b d , v , c d , v , d d , v , and e d , v , is:
D R = ( a d , t t a , l ) ( v ¯ a , l b d , v ) e d , v ( c d , v v ¯ a , l T u + d d , v )
This model applies for light and mainly sedentary activity, when TS for the whole body is close to neutral.

3. Transient Conditions

3.1. Non-Uniform Energy Balance Models

Non-uniform models are based on partitioning the human body into connected components. Two types of partitioning can be identified (Figure 3):
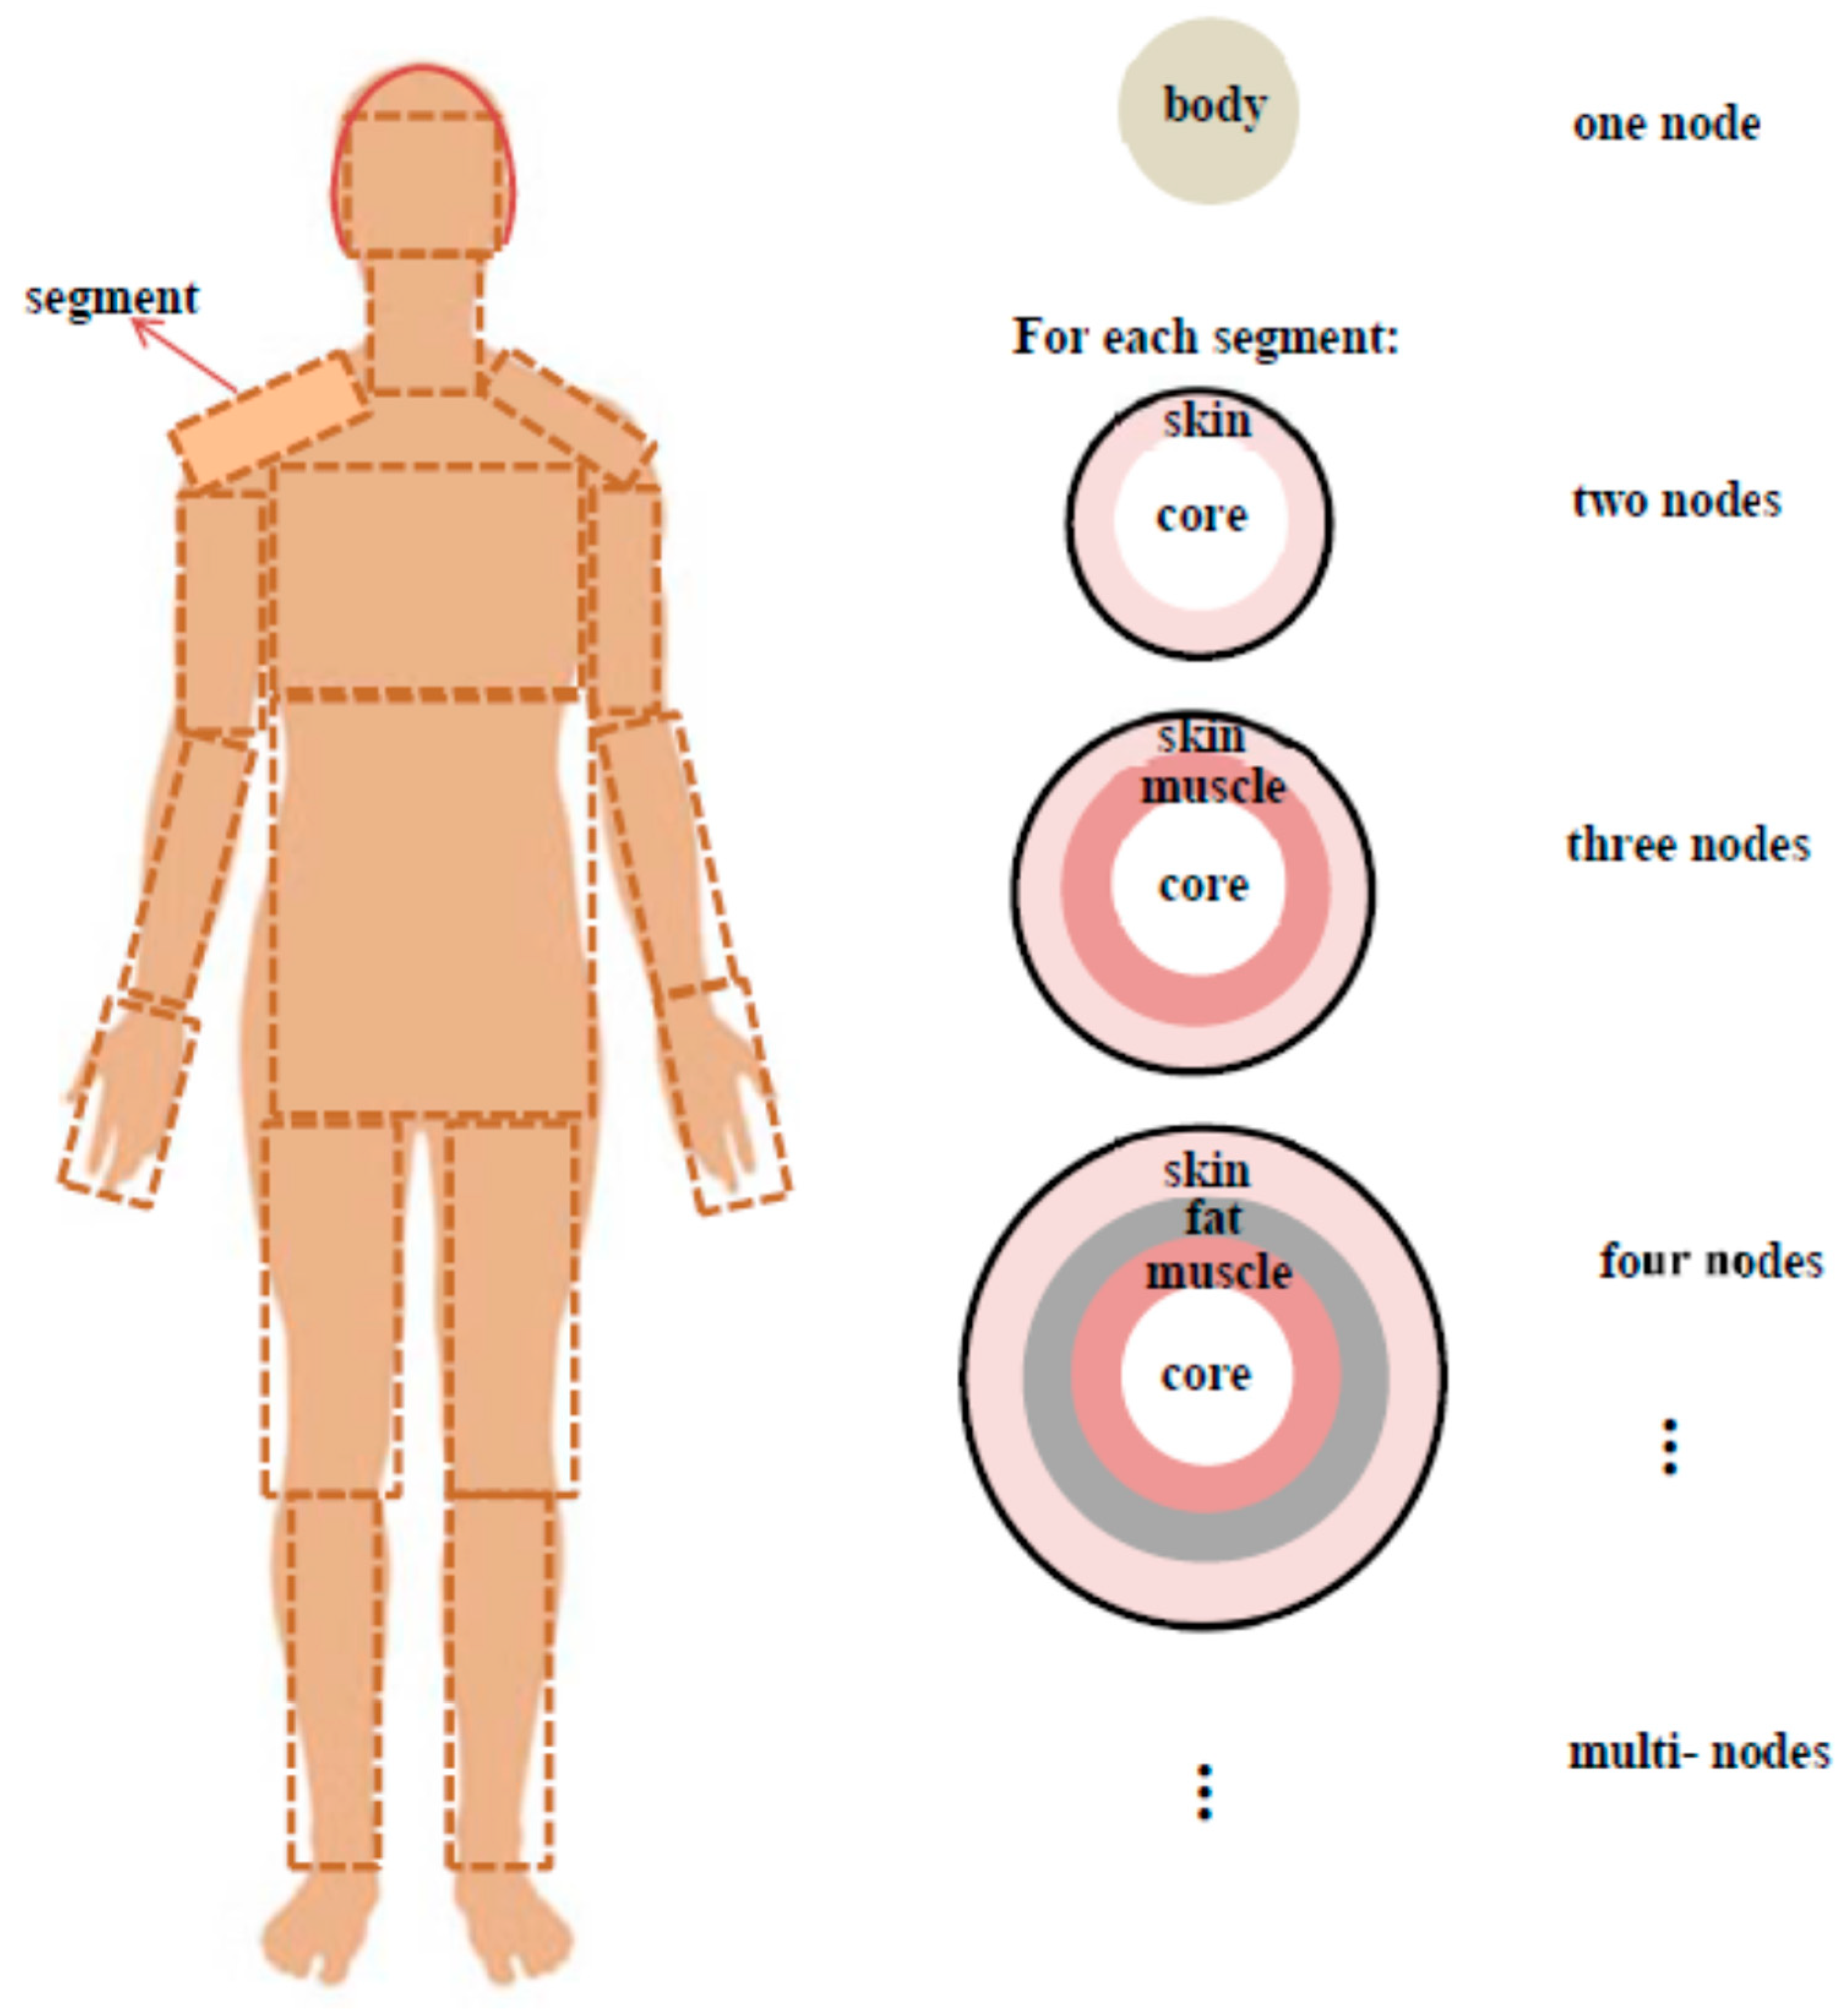
  • Body segments: the body can be represented as a single component or as a set of interconnected components called segments (e.g., head, trunk, fore arms, upper arms, fingers, hand, legs, etc.).
  • Thermal nodes: each body segment can be represented by using multiple concentric layers or thermal nodes (e.g., two layers with the core part of the body and skin; three layers with core, muscles and skin; four layers with core, muscle, fat and skin). Each layer is interfaced with the adjacent one(s). Each individual thermal node (skin tissue, fat tissue, muscle tissue, bone) has different physical properties (e.g. thermal capacity, thermal conductivity, etc.) [62]. Most of the physical properties are obtained from measurements and physiological studies [63].
Thermoregulation models can simulate the local skin and body core temperatures to predict TS [64,65,66,67]. The input parameters used in these models are air temperature, radiation temperature, relative air velocity, relative humidity, clothing insulation, metabolic rate and their variations with the exposure time [68,69]. In general, the thermal behaviour of the human body is simulated by considering a passive (or controlled) system and an active (or controlling) system [70,71,72,73,74]:
  • The passive (or controlled) system is affected by the heat transfer phenomena that occur inside the human body, or between the human body and the external ambient. Heat transfer in the core occurs by conduction with the skin and two convection phenomena (one with the skin due to the blood-vessels convection (blood acts as a carrier) and another with the external environment due to the breathing). In the core, the heat is generated by the metabolism and muscle work [67]. At the surface of the body-environment interface the heat exchange occurs by evaporation, convection and radiation [72]. To simulate the heat transfer phenomena, key parameters are the thermal properties of the blood, muscle, fat and bones. In addition, external sources given by electromagnetic (EM) fields are considered (Section 3.3).
  • The active (or controlling) system controls the passive system to regulate the temperature of the human body in steady-state and transient environments [75]. The active system considers the human body’s regulatory responses of vasodilatation, vasoconstriction, sweating and shivering. The objective is to provide thermoregulation by maintaining constant body core temperature. For this purpose, feedback signals are used to change the parameters of the passive system. The main feedback signal comes from the skin temperature. Further feedback signals come from the hypothalamic temperature variation, the skin temperature variation, and the basal evaporative heat loss from the skin [76]. Under stress conditions, the core temperature is particularly relevant in the case of hyperthermia, while the core and skin temperatures are relevant in case of hypothermia [77].
In the thermoregulation model, the control depends on the error signal given by the difference between the actual temperatures (at predefined locations, e.g., representing core and skin) and the corresponding setpoints corresponding to a thermo-neutral system. Positive error signals represent warm conditions, while negative error signals represent cold conditions at the corresponding locations. The error signals are sent to the active system, where they are processed to define the commands to be sent to the human body. For this purpose, the active system needs to set up the control coefficients to be used in the command-error equations (that combine the error signals in either a linear or a non-linear way). These control coefficients are found and validated through experiments. However, the nature of the phenomena involved in the thermoregulation is so complex that it is rather difficult to obtain the coefficients of the command-error equation, and it is not possible to account for all experimental results with a single set of control coefficients [70].
The classification of the thermal models indicated in [78] considers one-node, two-node, multi-node, up to 3-D models with thousands of nodes [24,79]. The empirical one-node model is applicable to hot environments [80] in which the thermoregulatory system is not considered [81]. 3-D models are based on partitioning the human body into segments, applying a two-node model or multi-node model to each segment.
The first transient model [82] approximated the human body by a single cylinder and divided it into four concentric layers. The Gagge model [36] considers the human body as one segment (or cylinder). The basic Stolwijk model [70] divides the human body between six segments and 25 nodes. In addition, other Stolwijk-like thermoregulation models are Tanabe’s model (65MN) model [73] and the THERmoregulation MOdel for Disuniform Environments (THERMODE 193) [72]. In the 65MN model, the human body is divided into 16 segments and 65 nodes, while in the THERMODE 193 model, the human body is divided into 48 segments and 193 nodes. Table 3 summarises the number of segments and nodes included in the most used thermophysiological models, and indicates advantages and limitations of these models.

3.1.1. Two-Node Thermal Model

The Gagge two-node thermal model [8,36,37] is based on partitioning the body into an external region formed by the skin and an internal core. In each region, the temperature is assumed to be uniform. The only temperature gradients occur between cylinders [17]. This is applicable to predict TS only for sedentary people in moderate levels of activity for stable environments, with human exposure times lower than one hour [103] under transient personal/environmental conditions [118]. This model takes into account the dynamic physiological reactions of the human thermoregulatory system, provoked by changes in the ambient climate.
The Gagge two-node model with single segment is used in [119] to determine the coefficients of the skin blood flow rate that minimise the difference between the experimental and computed skin and core temperatures. The single-segment model presented in [120] analyses what combinations of body core, skin and ambient temperatures satisfy thermal balance requirements in the thermoneutral zone for steady-state conditions. The thermoneutral zone model combines internal heal balance within the body with external heat balance from the body to the outer surrounding. The internal heat balance depends on the metabolic rate, skin temperature, body tissue insulation, and body core. The external heat balance depends on metabolic rate, air action, relative humidity, skin wettedness, skin temperature, operative temperature and clothing insulation.
Gagge et al. [121] consider clothing insulation Icl, but neglect the effects of the body activity and air movement on the variation in the surface air insulation Ia (“thermal insulation of the boundary air layer around the outer clothing or, when nude, around the skin surface” [122]). Other contributions have taken into account the combined effects of body posture, body motion (pumping effect), wind, and clothing fit [123]. In particular, body movement and body posture affect Icl, while wind especially influences Ia. Furthermore, the model of the vapour resistance of clothing has been improved with respect to the one used in Gagge et al. [121] and have been used to calculate and predict the heat strain of a person who works in warm and hot environments [124]. The Standard ISO 9920:2009 [122] considers the decrease of the vapour resistance due to the wind and body movement. Some dedicated papers estimate the effect of body motion and wind on the clothing insulation to assess the reduction of thermal insulation and vapour resistance of clothing [125,126,127,128,129].
The Gagge two-node model with multi-segment is used in some models of thermal interactions between human body and environment considering the effect of clothing. The relative air velocity is also examined under transient conditions [130,131,132]. This model has been used to predict TS in a vehicle [133], to examine sitting and standing postures [130], and to assess skin temperature differences in local body parts caused by the effects of high radiant temperature [134].
The two-node model converts the real environment into a "standard environment" at a Standard Effective Temperature (SET) [135]. It also converts the real environment into a “hypothetical environment” at a New Standard Effective Temperature (SET*), which is a progress over SET [15]. The calculation of SET is similar to the computation of PMV, with the difference that SET considers the two-node thermal model to obtain the mean skin temperature t ¯ s k and the skin wettedness w s k . In particular:
  • SET predicts TS in conditions with high airflows [136]. According to the ASHRAE Standard 55-2017 [1], SET is defined as the air temperature of a standard environment at 50% relative humidity (RH) for individuals wearing clothing that would be standard for the given activity in the real environment. SET considers standard climate having uniform temperature ( t ¯ r = t a ) , relative air velocity v ar = 0.1   m · s 1 , metabolic heat rate M = 1   met , and clothing insulation I cl = 0.6   clo .
  • SET* is a temperature index for uniform thermal environments [137]. SET* is the air temperature of a hypothetical climate at uniform temperature ( t ¯ r = t a ) and relative humidity R H = 50 % , where the individuals have the same physiological strain (i.e., the same t ¯ s k , w sk and heat losses to the environment) as in the real environment [138]. The standard environment has t ¯ r = t a , relative air velocity v ar = 0.15   m · s 1 , metabolic heat rate M = 1.2   met , and clothing insulation I cl = 0.9   clo .
The advantage of SET* is the possibility of carrying out thermal comparisons between environments with any combination of the physical input variables. The disadvantage is that “standard” people are required. The temperature range of TS on the SET* scale indicated in [41] includes SET* values <17 (cool, moderate hazard), 17 ÷ 30 (comfortable, no danger) 30 ÷ 34 (warm, caution), 34 ÷ 37 (hot, extreme caution), and >37 (very hot, danger).
The Jones model (or Two-dimensional model of clothing) [89] is based on the transient clothing model [139]. The core is represented by a single node. The skin is divided into arbitrary segments taking into account the angular tissue temperature variations, and is represented by several nodes. The Multi-Segmental Pierce (or MSP) model [84] divides the body into 24 segments and two nodes to predict more accurately the local skin temperatures of individual body parts in the neutral condition.

3.1.2. Multi-Node and Multi-Segment Thermal Models

Multi-node thermal models consider the inhomogeneous distribution of temperature and thermoregulatory responses over the whole human body surface. They further simulate the local skin temperature of independent body parts based on vasomotion models [26].
The first multi-node thermal model in transient conditions [90] takes into account the physiological mechanism of thermal regulation [103]. The body is divided into three layers. Each layer has its energy balance equation. The core layer has one node, the other layers have several nodes.
Further multi-node models are defined with multiple segments. The Stolwijk model (or 25-node model [63,70,140] is the first multi-node and multi-segment model of the human body under transient conditions. This model uses six cylindrical segments to describe the human body. Each segment is divided into four concentric lumped layers, where each layer represents a node. The temperature of each layer is assumed to be uniform. There are 24 tissue nodes and one central blood node. The 25th node is thermally connected to all other nodes. This model does not consider sweat accumulation on the skin surface [24,80].
Stolwijk and Hardy [141] improved the model considering the human body as a passive system or a controlling system, still neglecting the sweat accumulation on the skin surface. An improved version of the Stolwijk model is the THERMODE 193 model developed by Candas et al. [72] in cooperation with the LPPE (Laboratoire de Physiologie et de Psychologie Environnementales) of the French CNRS. THERMODE 193 was one of the first models that considered a clothed individual. The initial version of the model showed good performance in predicting with satisfactory accuracy the core temperature and local skin temperature both in standing and in sitting positions, under neutral and slightly warm conditions, with exceptions for hands and feet. The model was later enhanced by d’Ambrosio Alfano et al. [102], with a significant improvement in the active and in the passive system. The clothing model includes the correction referring to the effect of the body movement. This model, based upon an iterative procedure, is able to predict the thermal resistance of clothing for each segment from the value of the basic clothing insulation for the body as a whole (Icl).
The Stolwijk model was modified by other authors [80,142] to introduce the sweat accumulation on the skin surface, for a clothed body. The hygroscopicity of clothing materials significantly affects the human thermoregulation process. Munir et al. [91] demonstrate that the Stolwijk model is valid to predict the transient average skin temperature t ¯ s k for the “average” person under sedentary conditions. Li et al. [143] present a new simplified thermoregulation model based on the Stolwijk model and on the human temperature regulatory system model from [144]. The model accurately predicts the transient t ¯ s k in warm environments.

Other Multi-Node and Multi-Segment Models

The Fiala model, or Dynamic Thermal Sensation (DTS) model [145], addresses the transient response of the human thermoregulatory system to external stimuli over a period using environmental parameters (temperature, humidity, and velocity of air at the skin surface). The model includes DTS in function of the simulated core temperature and t ¯ s k , and also predicts PPD. The Fiala model is blind to users and is implemented by commercial software. The regression analysis developed by Fiala et al. [146] for sedentary individuals demonstrate that the temperature error signal from the skin is the best predictor for TS. Furthermore, TS is better correlated with tsk than with other physiological variables (sweat rate, internal temperature, skin blood flow). In the case of exercising subjects, the physiological conditions inside the human body vary without being influenced by the conditions found in the skin. Polynomial regression studies demonstrate that the temperature error signals from the head are the driving impulses with a significant influence on TS [146].
The extension of the Fiala model with passive and active parts [92,147] predicts TS from moderate to stressful cases, from low activity to high activity levels. Standard human manikins are used in [148], where a Computational Fluid Dynamics (CFD) code is coupled with the Fanger model to compute the impact of the human body on the environment, and in [149] to integrate the Fiala model with a realistic 3D figure. Van Treeck et al. [150,151] couple the model [146] with CFD to simulate the environmental impact on the human body. Fiala et al. [94] present the algorithms and methods of the multi-node dynamic Universal Thermal Climate Index (UTCI)-Fiala model of human thermal physiology. UTCI is the equivalent ambient temperature of a reference environment with the same physiological response of a reference individual like the real environment [41]. UTCI is divided into ten groups beginning from extreme cold stress (about −40 °C) till extreme heat stress (>46 °C) [152]. The ThermoSEM model, based on the DTS model [145], simulates body temperatures and physiological responses [97,153]. The difference between ThermoSEM and the Fiala model consists of the active part (thermoregulation) [26].
The Berkeley Comfort (UCB) model is used to simulate unlimited body segments allowing the estimation of OTS by predicting LTS in different body segments [100,154]. To obtain LTS, the equivalent temperature teq for different parts of the body introduced in [155] is used. To evaluate TC in buildings, acceptable teq ranges are identified in [156] and [157] for different zones of the body. The Fiala DTS, UCB and MSP models are compared in [158] with experimental data. The results show appropriate performance of the MSP model compared with the Fiala model. The MSP model is selected for coupling with the UCB model, because this combined model produces higher predictability of the skin temperature than in the Fiala and UCB models.
The Tanabe model (or 65MN model) [73] is a 3D model of a standard human manikin in the CFD tool that incorporates radiation heat transfer. The CFD technique is used to simulate the impact of the human body on the environment using empirical heat transfer coefficients. The Tanabe model predicts TC and OTS in non-uniform and transient environments. On these bases, Zhu et al. [159] propose a non-uniform thermal model to predict TS coupled with CFD technique and human thermal physiological model, which simulates the effects of the surrounding temperatures on the human body. Moreover, the multi-node thermal model proposed in [149] is based on a coupling system that can simulate human thermal responses in transient environmental conditions.
The Multi-node 15-segmented model, or American University of Beirut (AUB) model [85], is used to predict nude and clothed human body thermal and regulatory responses in steady-state and transient conditions. An improvement of the AUB model, described in [160], agrees well with experimental data during transitions from hot to cold, dry to humid environments, and in asymmetric radiative environments. The 12-Segment model [93] takes into account 2D heat transfer in each part of the human body for unclothed and clothed persons in transient and non-uniform environment. The results of the Three-Node Thermoregulation model [49] accurately estimate the TS of bare and clothed parts of the body compared with the experimental results reported in [85,161,162]. The Human Thermal Model (HTM) [104] is used to demonstrate that the operative temperature, metabolic rate and clothing insulation are the most effective boundary conditions for TS and TC [103].

Models for Patients, Children, Adults and the Elderly

The Multi-node model shown in [106], based on the Fiala model, predicts the patient temperature during cardiac surgery. The simulation results show good agreement with the experimental results of three surgical procedures. The Burned Patients Thermoregulation model [105] is used to predict the optimum environmental temperatures for the treatment of patients with burn wounds.
The thermoregulatory response is different from children to adults [163], and from adults to the elderly [164]. Table 4 indicates some differences in thermoregulation between young adults and aged persons, which strongly depend on physiological changes [165,166,167,168]. Specific models are dedicated to infants, adults and the elderly.
For infants, two models combine the Stolwijk model with the Gagge model. The Clothed Infants Thermoregulation model [109] assesses the thermal physiological response of clothed infants. The Naked Infants Thermoregulation model [110] assesses the naked infants’ thermal physiological response. Furthermore, the Newborn Premature Infants Thermoregulation model [111], inspired by [70,71,172,173], is used to predict skin and core temperatures of newborn premature infants in transient conditions and thermal neutrality.
For adults, the Four-Node Thermoregulation model [107] is based on modifications of the Gagge two-node model, to encompass the differences in the thermoregulatory responses of sleeping and awaking persons. The Chinese Thermoregulation model [112], based on the Fiala model, is used to predict the thermal behaviour of Chinese adults. The model includes the passive and active systems, and the central nervous system provides all modifications in the muscle metabolism.
The elderly have reduced metabolism, vasoconstriction, sweating and thickness of the skin fat, the lower range of variation of skin blood flow, and different skin or core temperature thresholds at which the thermoregulatory action is activated. The thermoregulatory response in the elderly for relatively high or relatively low temperatures is more variable than for young people, because the thermoregulation ability of the elderly is lower [165]. A bio-heat model developed for the elderly should predict accurately the blood flow in the fingers. The model shown in [174] for young adults, which considers independent segments for hand and fingers, has been customised in [165] for the elderly, by incorporating the effects of the changes in physiological thermoregulation and vasomotion. The Older Persons Thermoregulation model [114], based on the modified Fiala model, includes the passive system (body structure) and the control system (the central nervous system). It predicts the core body temperature, as well as the regulatory responses of the older subjects in different environmental conditions. The thermal behaviour prediction for Chinese elderly [113], whose thermoregulation part is based on [112], uses specific inputs for height, weight, age and sex to provide results for indoor environments.
The Jointed Circulation System (JOS) model [74] is applied to women and the elderly, considering the physiological reactions to the thermal environment. The physical parameters can be modified. The results show that the thermoregulatory mechanisms (shivering or perspiration) answer to the change of thermal conditions.

3.1.3. Multi-Element and Multi-Segment Thermal Models

Multi-element thermal models consider the heterogeneous heat transfer boundary conditions. These models give more accurate computational results than multi-node models because the hypothesis of uniform node temperatures is not considered [103,175]. Multi-element thermal models are 3D transient thermoregulation models, in which the human body is divided into various parts without the need of an additional division in nodes [26,176] as it happens in the models with lumped parameters considered in Section 3.1.2. In this case, many geometric properties of the body are taken into account, and the temperature of each element is not uniform [26,80,103]. In this way, the multi-element models are able to provide better results than the models with lumped parameters, in particular when there are large temperature gradients in the human body [177]. The energy balance equations are determined for each body part using thermoregulatory control equations for blood flow rate, shivering, sweating constriction, and dilatation [103]. In the first multi-element steady-state model developed by Wissler [115], the human body is subdivided into six cylinders. The second Wissler model [178] is an extension of the model [82], and the body is divided into fifteen elements connected by the vascular system (arteries, veins, and capillaries).
The Kansas State University (KSU) model [87,88] is a 3000-node Finite Element Model (FEM) that improves the Wissler model. This model implements the first 3-D transient, a multi-element thermal model for the entire human body and establishes TS directly from the physiological effort. The KSU model is appropriate for sedentary conditions but not during cold or hot operating conditions [155,176]. The Fu clothing model [78] is based on [89] and [179] using 3000-node FEM, and includes a clothing layer. The model simulates the clothed human thermal response under different conditions (e.g. high-temperature, vibration, severe weather conditions). The clothing layer computes the exchange of the heat generated by the surroundings and the quantity of heat produced [103]. Some human-clothing-environment models are presented in Section 3.2.
Ferreira and Yanagihara [117] propose a 3D model of the human thermal system. The simulation results agree with the experimental data reported in [75] for the nude body model at hot exposure. Sun et al. [180] develop a more realistic human thermal model in uniform environment starting from the models [88] and [78]. The transient temperature distribution in the body segments agrees with experimental data in neutral and warm conditions [181].
Tang et al. [175] adopt a multi-scale model of behaviour and thermoregulatory system under various environmental and clothing conditions. The FEM method is applied to assess the temperature field of the 3D human body and accurately predict human thermal regulation. The model is useful for design and clothing selection to assess TC.

3.2. Considerations on the Human Clothing

3.2.1. Thermophysical Properties of Clothing

The assessment of the thermophysical properties of clothing is a crucial issue in the formulation of one-node and multi-node models to predict skin and core temperatures. Clothing affects the heat exchanged with the environment and keeps the core temperature in a limited range when exposed to different environments [182].
Earlier contributions adopted an approach based on the reduction factor for latent heat exchanges due to wearing clothes Fpcl, defined as the “ratio of the actual evaporative heat loss to that of a nude body at the same conditions, including an adjustment for the increase in surface area due to clothing” [31]. Successively, this approach was replaced by the use of the evaporative resistance of a clothing ensemble Re,cl, that is, the “resistance to vapour transport of a uniform layer of insulation covering the entire body that has the same effect on evaporative heat loss as the actual clothing under standardized (static, wind-still) conditions” [31], where the entire body includes the uncovered parts like head and hands.
The most significant parameters to predict the heat strain of an individual working in a warm or hot environment are Re,cl and the insulative properties of clothing [124]. Furthermore, the total water vapour resistance Re,T is defined as the “vapour resistance from the body surface to the environment (including all clothing, enclosed air layers and boundary air layers) under reference conditions, static” [122]. Re,T is linked to the total insulation I T (“thermal insulation from the body surface to the environment (including all clothing, enclosed air layers and boundary air layer) under reference conditions, static” [122]) through the Woodcock permeability index im (introduced in [183]) and the Lewis number L = 1.5 K·kPa−1, as follows:
R e , T = I T i m L = 0.06 i m ( I a f cl + I cl )
where the right hand-side is further expressed in terms of the air insulation I a , the clothing area factor f cl , and the clothing insulation I cl defined in the Standard ISO 9920:2009 [122].
Havenith et al. [123] explain how clothing insulation is affected by body posture, movement, wind, clothing ensemble, and their interactions. From the openings (e.g., cuffs and collars) in the clothing ensemble there is an air exchange with the environment. During work, the increased air exchange modifies the clothing insulation (the so-called “pumping effect”).
Furthermore, Havenith et al. [124] show that wind and movement increase the permeability index for clothing ensembles. Furthermore, with respect to a reference standing person without wind, they determine that sitting increases Re,T, while walking and wind decrease Re,T. Nilsson et al. [184] develop a general equation that considers the insulation reduction given by wind, air permeability and walk, in different weather conditions and activity with winter work clothing. From their results, obtained from measurements on manikins, the effect of air permeability can be neglected for wind speeds below 2 m/s. Their model has been adopted by the Standard ISO 11079:2007 [43,185].
Havenith et al. [186] discuss the effects of the clothing vapour resistance variations on the body heat loss rates, highlight the importance of correcting the clothing vapour resistance values depending on body and air movements, and present corrections equations that have been incorporated, together with other equations proposed in [187] and [188], in the PHS approach used in the Standard ISO 7933:2004 [42].
The models to assess the clothing vapour resistance are complex and refer to the whole body surface. The evaluation of the clothing vapour resistance for single parts of the body is even more challenging. Recently some investigations on the localised clothing vapour resistance have been presented, e.g., by using sweating manikins to assess the different effects of wind speed and body movement on the local body segments [189].
The combined effect of wind and walking on clothing insulation is addressed in Havenith and Nilsson [126]. From experimental investigations, updated equations are proposed to correct the previously adopted equations for the total insulation in such a way to ensure that for wind speeds equal to the reference wind speed the correction factor is equal to 1. Further experimental tests that consider wind and walking have been carried out with movable sweating manikins. For example, Qian and Fan [190] develop a regression model to predict the clothing thermal insulation and the vapour resistance with wind and walking on the basis of the values of the same quantities measured on an individual standing in “still air”. Havenith et al. [191] provide many clothing thermal insulation results for non-Western (and mainly indoor) clothing ensembles, with the aim of extending the database of insulation values of non-Western clothing in the relevant International Standards. With respect to the Standards, the investigation carried out by d’Ambrosio Alfano et al. [129] shows significant differences between the results of the algorithms proposed in two different Standards – ISO 9920:2009 [122] and ISO 7933:2004 [42] to correct the static values of the thermophysical properties of clothing. These differences raise a warning to avoid the use of the new equations introduced in the Standard ISO 9920:2009 [122] in the revision of the Standard ISO 7933:2004 [42]. At the same time, these differences highlight a need to harmonise all the Standards concerning the Ergonomics of the Thermal Environment.
In these studies, the clothing insulation refers to the surface of the whole body, and the coefficients included in the equations are defined empirically. Recent contributions have presented empirical equations to estimate the total clothing insulation in function of the relative air velocity and walking speed [128], as well as correction equations for each part of the body [192]. The definition of equations for clothing insulation valid for the single parts of the body is a challenging open field of research.

3.2.2. Human Clothing Models

The human-clothing-environment models combine the human thermoregulatory model with a clothing model to predict skin and core temperatures. The human thermoregulatory model determines the thermoregulation and heat transfer within the body, while the clothing model simulates heat and moisture transfer from the human skin to the environment [193]. Clothing establishes how much heat is exchanged with the environment and keeps the core temperature in a limited range when exposed to different environments [182].
Various clothing models simulate the heat and mass transfer in clothing layers, considering phenomena like diffusion, evaporation, condensation, and sorption [194,195,196,197]. In particular, Fan et al. [162] and Fan and Wen [198] introduce the dynamic clothing model of heat and moisture transfer considering sorption and condensation in the porous clothing layer. The results show that condensation is reduced in clothing assembly. Khatoon and Kim [195] test different ventilation schemes in a car. Ghali et al. [199] develop a mathematical model for the heat and mass transfer through the air spacing layer and the fibre clothing system. Fan et al. [196] describe an improved model of [198] using experimental data, taking into account the condensates in fibrous insulation. Zhu et al. [197] establish a fractal model for the coupled heat and mass transfer in porous media considering moisture sorption/desorption and evaporation/condensation.
The human-clothing models presented in [200] are useful for the analysis of dynamic thermal stress problems. Three dynamic predictive clothing insulation models are tested in [201] to obtain improved TC estimation by considering that the occupants adjust their clothing during time depending on the thermal conditions. The heat transfer modelling through the clothing [202] based on [203] considers a clothing ensemble with different layers of material and air, inside which condensation occurs as well. The effect of two-layer clothing ensemble in thermoneutral conditions and extreme ambient conditions is analysed with or without an EM source. The magnitude of the blood temperature elevation is influenced much more by environmental conditions (e.g., temperature and RH) and type of clothing than by the EM source.
Some dynamic human-clothing-environment models are presented in [108,178,204,205], with numerical results validated by experimental data. In particular, the human clothing model [108] is valid in both steady-state and dynamic conditions (heat, cold, exercise, clothing and transient phases). The model used in [204], based on the Tanabe model, takes into account the dynamic heat and moisture transfer through clothing, including liquid water transport and clothing ventilation. The transient model [205] of heat and mass transfer through clothing layers containing phase change material (PCM) packets is integrated with a segmental bio-heat model to predict the instantaneous response of the human body. In [193] the thermoregulatory model is coupled with a clothing model to simulate the effects of the air gap and fabric properties on human thermal responses.

3.3. Anatomical Models

Starting from an initial condition with acceptable temperatures in different parts of the body, if the body is subject to an external source such as the absorbed electromagnetic (EM) radiation, the body temperature increases. The Specific Absorption Rate (SAR) index used in the radio-frequency (RF) protection standards represents the power per unit mass absorbed by the human body from an EM source. The SAR index is used to assess the safety of the human body exposed to different frequencies [76].
The blood flowing in the body introduces conduction and convection effects. The tissue and blood temperatures can be directly obtained by measurements in a discrete number of points of the human body [206]. However, a mathematical model to calculate the tissue and blood temperatures provides more general information.
There is a vast literature on anatomical models, whose complete review is outside the scope of this paper. Some conceptual aspects are recalled here. Explicit and implicit methods have been formulated to solve the bio-heat transfer equation. Explicit models are based on the Finite Difference Method (FDM) or the Finite Element Method (FEM) representation of the body [207]. Implicit models are based on the inversion of a sparse matrix, with a computational burden that increases for larger dimensions of the domain. The use of an alternate-direction-implicit (ADI) technique reduces the computational burden by making the matrix inversion more efficient, as in the ADI-FDM [208] and the ADI technique introduced in [209].
Further models have been developed in non-equilibrium conditions. The generalised dual-phase lag bio-heat equations proposed in [210] are based on dividing the biological tissue into vascular and extravascular regions, to consider different temperatures for each region. Then, only one temperature (blood or tissue) is considered as an unknown, by eliminating the other temperature from the model. The generalised dual-phase-lag model of bio-heat transfer has been used in various applications, including magnetic hyperthermia treatment [211]. Furthermore, the local thermal non-equilibrium (LTNE) method is used in [212] to represent the bio-heat transport through the body tissues in RF hyperthermia treatment, studying the SAR of the body tissues when the EM field is imposed.
The thermoregulatory system has a strong influence on decreasing the elevation of the blood temperature almost uniformly in all body regions. The analysis of the thermoregulatory response is particularly important to study prolonged exposures to external sources (e.g., more than two minutes), or exposure to EM fields in extreme thermal environments [213]. Without thermoregulation, important blood temperature elevations are observed. For this reason, the thermoregulation model implemented in [76] has been included into the bio-heat equation to calculate the blood temperature elevation and the distribution of the power absorption inside a human body exposed to a uniform plane wave, in function of frequency. The thermoregulatory response provides an essential reduction of the temperature elevation, in particular in the body core. A limitation of including the thermoregulation model into the bio-heat equation is the high computational cost [206].
Furthermore, the temperature rise in a human body exposed to RF may depend on adverse environmental conditions (e.g., high ambient temperature, strong humidity, and the effects of clothing) [202]; the preliminary results obtained do not envisage changes needed to the existing safety standards and guidelines.

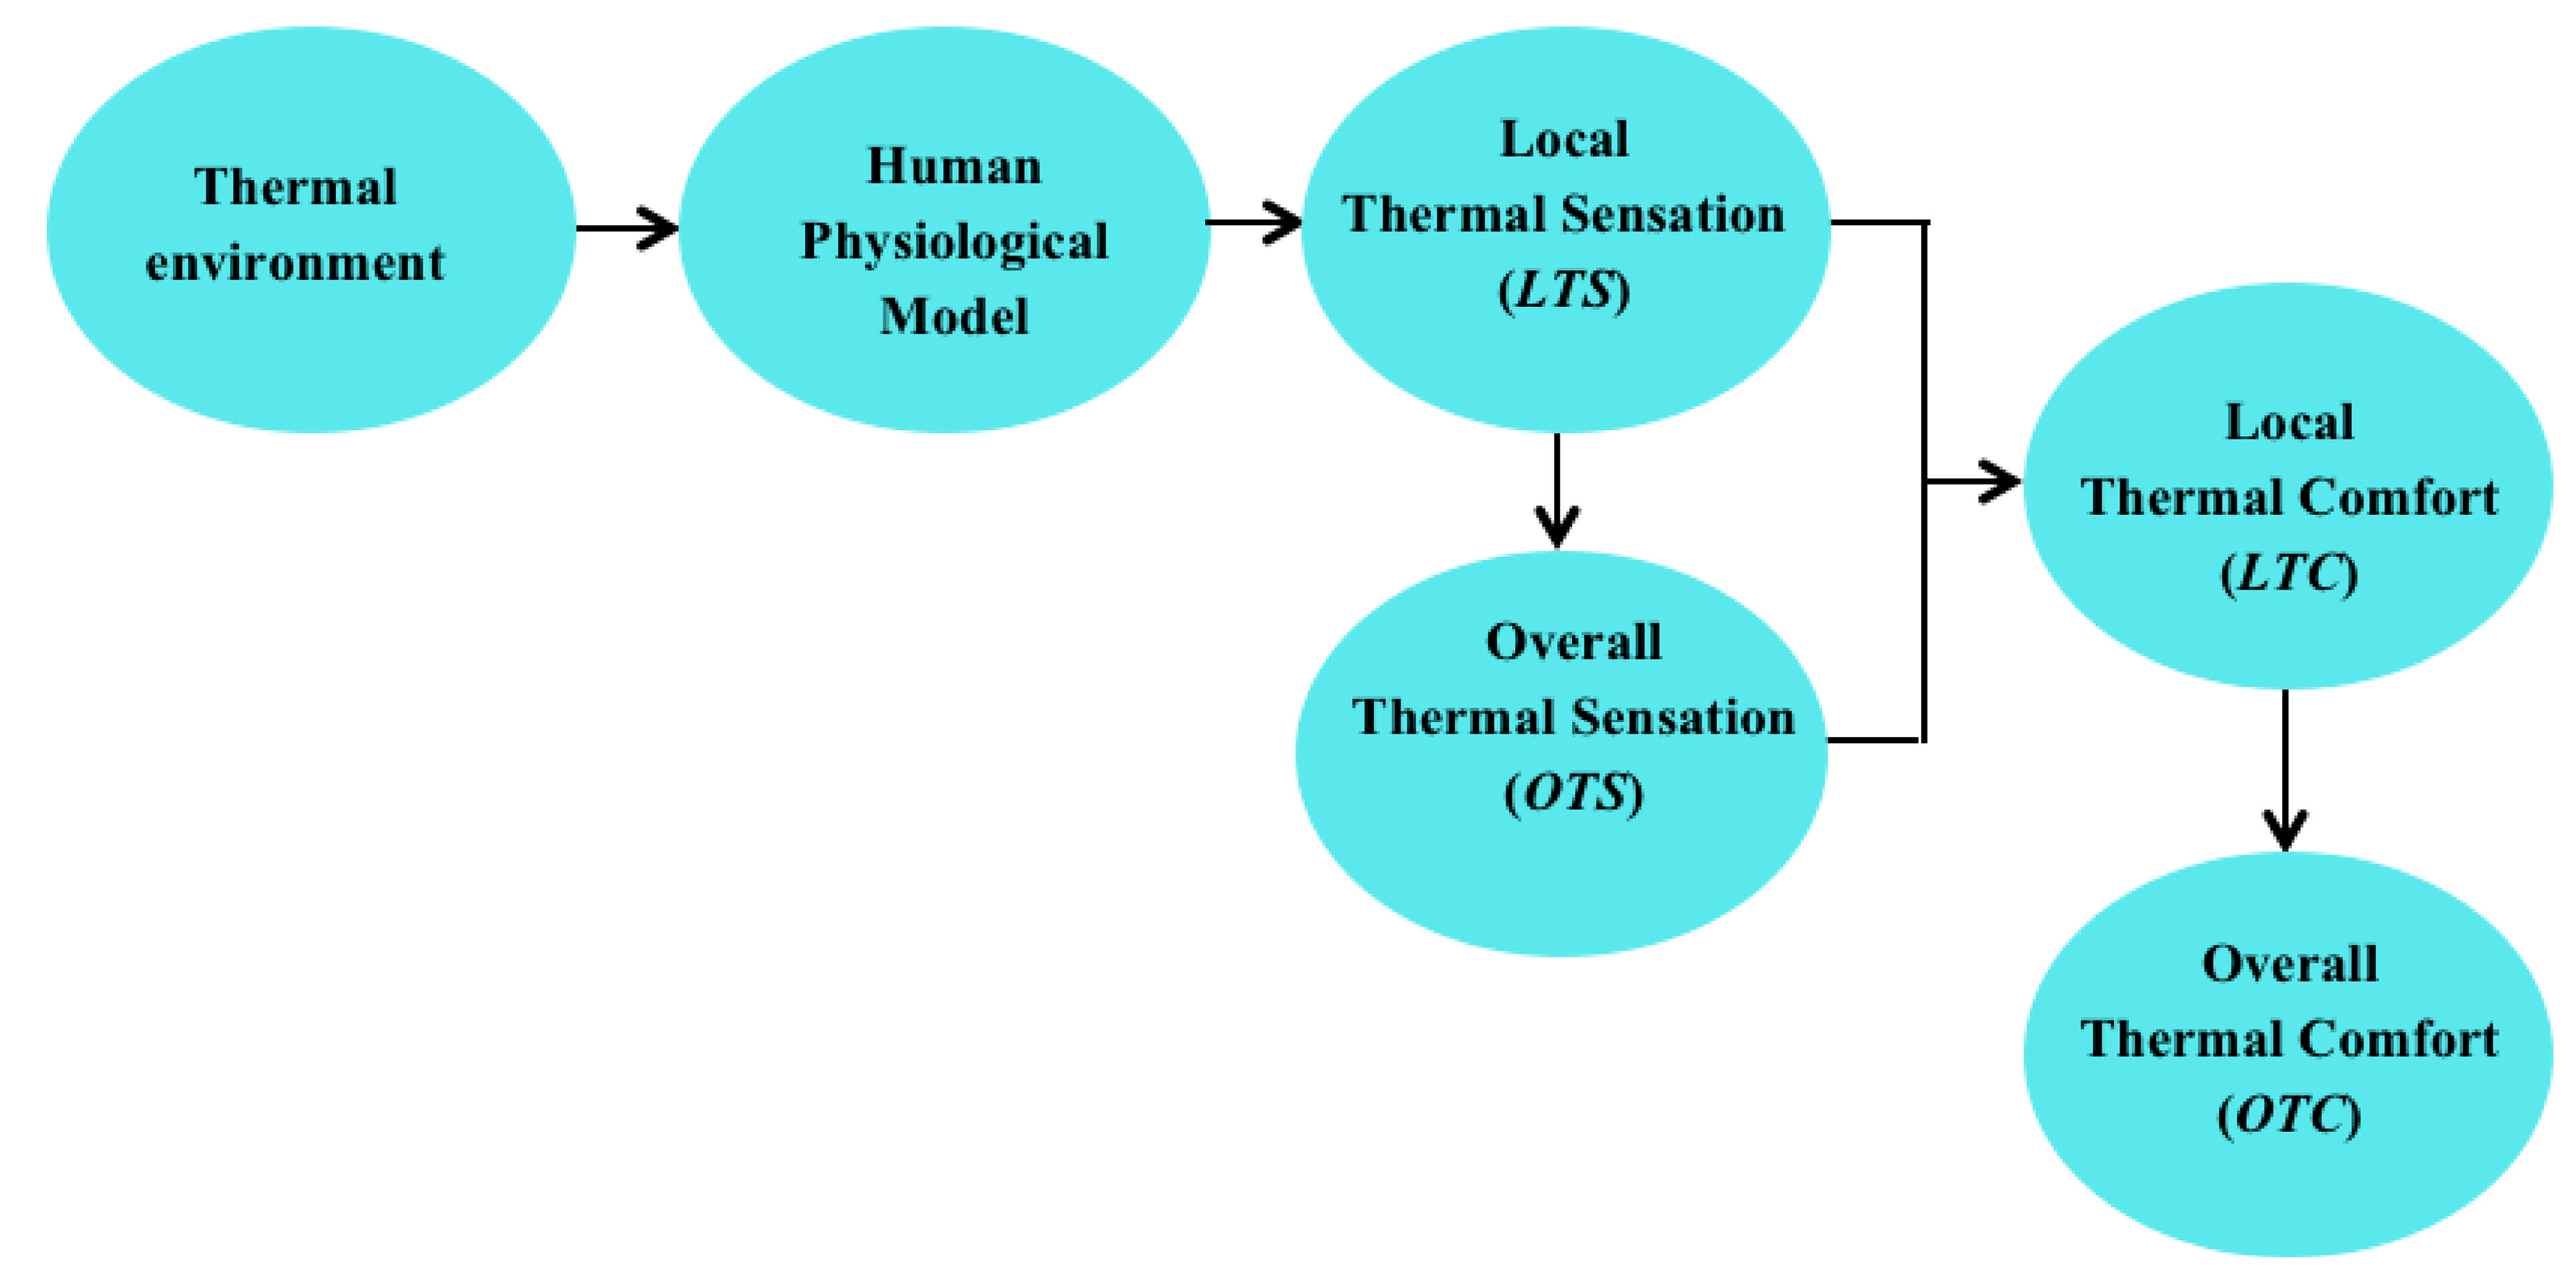
3.4. Models to Predict the Local and Overall Thermal Sensation

The local thermal sensation ( L T S ) considers the individual body segments, while the overall thermal sensation (OTS) summarises the local effects into a unique indicator. Corresponding acronyms are used for local thermal comfort (LTC) and overall thermal comfort (OTC).
The local environment establishes which body parts are relevant [214]. The L T S for one body segment could affect other segments [215]. The multi-segment physiological models presented above are used to predict the local temperatures necessary to determine LTS and LTC.
LTS depends on the local skin temperature t skloc and the overall thermal state. In [181], LTS is written as a logistic function of the skin temperature:
L T S = f ( t skloc ; t skloc set ;   t ¯ sk ;   t ¯ set ; t core ;   r )
where t skloc _ set is the local skin set point temperature, t ¯ set is the mean whole-body skin set point temperature, t core is the core temperature, and r is the vector that contains the body-part regression coefficients.
Starting from the local thermal sensation L T S j for the body segment j = 1 , , n and from the average local sensation L T S ¯ j (arithmetic mean of L T S j ), the following weighting coefficient s j is computed:
s j = ϑ · ( L T S j L T S ¯ j )
where ϑ is the slope of the linear model considered.
The OTS expression, applicable in steady-state and transient conditions for cooling and heating, is estimated according to the UCB model considering the weighted average of all the local sensations [103,216]:
O T S = ( j = 1 n s j · L T S j ) · ( j = 1 n s j ) 1
This formulation can also be retrieved in the models reviewed in [30], in which LTS is denoted as TSV, and OTS is denoted as Mean Thermal Sensation Vote (MTSV).
The OTS expression has also been written by introducing a constant term s 0 , using the multiple stepwise regression methods to show how the local body parts affect OTS in a HVAC environment in summer [217]:
O T S = j = 1 n L T S j · s j + s 0
The results show that the head has a significant influence, followed by calf and foot. A negligible effect is observed at chest and back.
A linear regression equation of O T S is used in [214] to analyse L T S at different parts of the body:
O T S = f ( L T S arm ,   L T S hand ,   L T S calf ,   L T S back , L T S foot )
The results show that high velocity and low air temperature close to the floor strongly influences the OTS of the individuals.
In the model for non-uniform transient environments described in [181], OTS (and OTC) are variable over the time τ and depends on t skloc and t core , and on their change rates d t skloc d τ and d t core d τ , for example:
O T S = f ( t skloc , d t skloc d τ , t core ,   d t core d τ )
The experimental results obtained in [181] confirm that the overall response to cooling is more significant than the overall response to heating. Moreover, a body portion with the same t skloc feels relatively warmer when other body portions are colder, and vice versa.
Different evaluations under transient conditions are conducted in [218], obtaining an empirical equation of OTS:
O T S = 0.0152 · t a 0.0726 · D a + 0.676 · v 3.66
where D a is the supply air temperature difference in °C. A definite benefit is obtained by taking into account the simulated airflow from a ventilation system. In this case, the free term of the equation becomes 3.51 and corresponds to a reduction of OTS. Jin et al. [216] start from [219] and develop a weighting factor model for OTS under local cooling conditions by statistical analysis. In [219], the weighting factors are constant when cooling different body parts, while in [216] the body parts are cooled independently by local ventilation. In [220], OTS is affected by LTS of various body parts (head, chest, back, calf, and foot) varying at different seat positions in aircraft cabins. From the experimental analysis presented in [221], the most significant influence on OTS refers to the superior part of the body, then the head, and finally the inferior part of the body. A simplified three-node model is used in [49] to assess LTS of the bare and clothed parts of the body, as well as OTS.
For the prediction of LTS, OTS, LTC and OTC, the model for non-uniform transient environments shown in Figure 4 (adapted from [181]) contains the expression that links human body physiological parameters (skin and core temperatures and their change rates) and thermal response. Successive refinements of the model presented in [181] have been introduced in [222,223,224], up to the version presented in [225] that includes computational details. In particular, in [222] the body has been divided into 19 parts, LTS models applicable in non-uniform and transient environments have been developed for each body part in function of thermo-physiological parameters like skin and core temperatures, and have been validated separately in an automobile testing facility. The concepts presented in [225] include the distinction between the so-called “no-opposite-sensation” condition (when no body part feels significantly opposite thermal sensation with respect to the other body parts) and the “opposite sensation” condition (when there are body parts that feel significantly opposite thermal sensation with respect to the rest of the body parts). For each condition, a specific model represents the OTS for sedentary activities in different environments (uniform and non-uniform, for steady-state and transient). In the model, the individual parts of the body are weighted in different ways for warm and cool sensations, so that strong local thermal sensations dominate the OTS. In [225] the best agreement between the predicted and actual OTS is found for the UCB model. The Dymola/Modelica coupled model of human physiology for non-uniform and transient environmental conditions [226] combines the modified Tanabe model [73] and the model presented in [181,223,224,225], with better results for warm environments than for cold environments. The predictions of the Dymola/Modelica coupled model successfully predict TC compared with the predictions of the Fiala model. Starting from the model [181], successful comparisons with experimental results are shown in [227] from the 65MN model combined with a CFD code.
Some references address the correlation between OTS and LTS. From the results shown in [228], the LTS and skin temperature of hands and arms are significant for OTS in the case of women, while for men are not so important. In [65] the ThermoSEM model for predicting the TS in a non-uniform environment, correlated with the UCB model, gives a reasonable OTS prediction in steady-state conditions. The results of the experiments carried out in a climate control chamber in [30] indicate in which parts of the body the LTS is warmer or colder than the OTS. In particular, the LTS of chest and back has a strong linear correlation with the OTS and values higher than the OTS. The other parts of the body exhibit poorer correlation with the OTS. Starting from a substantial agreement between OTS and LTS in uniform environmental conditions [229], fast temperature changes are introduced in [230], showing a strong correlation between OTS and LTS also in non-uniform environments.
The correlation between OTS and OTC is addressed in [231]. The OTS and OTC models are obtained through multiple linear regressions. According to the regression models, the LTS of different body parts affects OTS and OTC to different extents. A significant influence on OTS is obtained for head and hand, a small influence for leg and foot, and a negligible influence for the other body parts. Regarding the impact on OTC, only head and leg demonstrate significant influences. These results are in line with the findings of [232], in which the forehead and arm are indicated as appropriate local spots for OTS estimation. In [30] the main effect on OTS comes from the upper body.
The LTS and OTS results are used to define further indicators. The General Percentage Dissatisfied (GPD) in non-uniform environment is determined in [219] as:
G P D = 100 95 · e ( 0.03353 · O T S 4 + 0.2179 · O T S 2 ) uniform   term + 7.27 · Δ T S 2 + 6.64 · Δ T S max non-uniform   term
where Δ T S max is the maximum thermal sensation difference between the body parts. The authors of [219] observe that the face has a more significant influence on OTS than other parts of the body. The new thermal acceptability ( n T A ) model, suitable for both neutral and warm situations in uniform and non-uniform environments, is proposed in [233] from an experimental study. The n T A model depends on a uniform term, in function of OTS, and a non-uniform term, in function of Δ T S max :
n T A = 0.41 · O T S + 0.58 uniform   term + 0.27 · Δ T S max non-uniform   term > 0
The relation between TS and TC for steady and uniform conditions is shown in the new Thermal Comfort n T C model reported in [234], written as:
n T C = ( 0.80 · O T S + 1 ) steady   -state   conditions + ( 0.56 · T S CS ) steady   and   transient   conditions
where T S CS is the thermal sensation changing with space. The results show that T S CS is an essential factor in determining TC.

4. Conclusions

This paper has reviewed a number of models used to study various aspects of the thermal sensation in steady-state and transient conditions. These models differ because of their structure, with the partitioning of the human body into segments and the further consideration of nodes to represent external and internal parts of the body by using lumped parameters. With the availability of increasingly higher computational capability, the models have been detailed by resorting to the finite element method, where the human body is represented through a large number of points. The finite element method enables the development of transient models with a growing level of detail and accuracy in the representation of the temperature gradients. However, the increasingly higher detail of the numerical model has to be accompanied by an effective formulation of the thermoregulation model. In this respect, the validation of the thermoregulation models is still difficult, because the reliability of physiological experimental data is affected by the accuracy of the measurement techniques and by insufficient information on the clothing parameters. The existing approaches, also adopted by International Standards, are based on the definition of model equations corrected on the basis of the results of experimental investigations. Some differences emerge in the existing Standards, and the discussions on the possible convergence of the models used in various Standards are under way. Furthermore, most of the thermoregulation models currently used are not accessible to the users or are implemented in commercial software tools (e.g., the Fiala model, not available for free). This does not help the research on further improvements. In this context, the open source approach used in Stolwijk-like models is still very important to advance the research in the field and facilitate comparisons among the results obtained by different research teams.
Clothing models are further introduced to represent the heat and mass transfer in clothing layers. The assumptions used in the definition of the models make them suitable to be exploited in different conditions. In early models, the application was limited to uniform environmental conditions. The most recent models may be applied in non-uniform and transient conditions. In particular, the availability of models in which the human body is represented with multiple segments is essential to assess the thermal response of the body in non-uniform conditions with natural or forced ventilation, also taking into account the posture and clothing. The assessment of the thermophysical properties of clothing is one of the key points still under development.
The outcomes of the thermal sensation assessment also depend on the psychological response of the subjects and further social, cultural and behavioural factors. These factors are taken into account by introducing a feedback on the outcomes of the physiological model, to represent the thermal sensation more comprehensively.
The most recent research is enhancing the models and indicators to assess global and local thermal sensation. In particular, the local thermal sensation is becoming more and more significant, taking into account in which segment of the human body the worst conditions occur, as well as the temperature differences among the body parts, in case of slowly or rapidly changing external conditions. The comparisons of the results obtained from more sophisticated models with respect to simpler models provide hints on the limitations of the simple models and on the need to resort to more detailed models to analyse specific situations. The advances in progress also concern the effectiveness of predicting the thermal sensation and use the predicted results into thermal comfort models. In this respect, suitable information to refine the models comes from the correlation between thermal sensation and thermal comfort indicators, and from the correlation among the physiological parameters of different parts of the human body and the outcomes of thermal sensation and thermal comfort assessment. Some thermal sensation models are used in the Standards concerning the design of indoor spaces. Extended information to drive the upgrade of the Standards come from the availability of more refined tools that consider human responses in transient conditions under asymmetrical environments, together with the experimental results gathered from practical applications.

Funding

This research received no external funding.

Acknowledgments

The Author thankfully acknowledges prof. Giovanni Vincenzo Fracastoro of Politecnico di Torino, Italy, for his helpful suggestions, and an anonymous Reviewer who provided many insightful and constructive remarks.

Conflicts of Interest

The author declares no conflict of interest.

References

  1. Thermal Environmental Conditions for Human Occupancy; ANSI/ASHRAE Standard 55-2017; American Society of Heating, Refrigerating and Air-conditioning Engineering: Atlanta, GA, USA, 2017.
  2. Parsons, K. Measurement Methods and Assessment Techniques. In Human Thermal Environments—The Effects of Hot, Moderate, and Cold Environments on Human Health, Comfort, and Performance; CRC Press, Taylor & Francis Group: Boca Raton, FL, USA, 2002; Chapter 5; pp. 101–138. [Google Scholar]
  3. Fanger, P.O. Thermal Comfort: Analysis and Applications in Environmental Engineering; McGraw Hill Book Company: New York, NY, USA, 1970. [Google Scholar]
  4. IUPS Thermal Commission. Glossary of terms for thermal physiology. Third edition. Jpn. J. Physiol. 2001, 51, 245–280. [Google Scholar]
  5. Forgiarini Rupp, F.; Giraldo Vásquez, N.; Lamberts, R. A review of human thermal comfort in the built environment. Energy Build. 2015, 105, 178–205. [Google Scholar] [CrossRef]
  6. Nikolopoulou, M.; Steemers, K. Thermal comfort and psychological adaptation as a guide for designing urban spaces. Energy Build. 2003, 35, 95–101. [Google Scholar] [CrossRef]
  7. Yao, R.; Li, B.; Liu, J. A theoretical adaptive model of thermal comfort—Adaptive Predicted Mean Vote (aPMV). Build. Environ. 2009, 44, 2089–2096. [Google Scholar] [CrossRef]
  8. Gagge, A.P.; Stolwijk, J.A.J.; Nishi, Y. An effective temperature scale based on a simple model of human physiological regulatory response. ASHRAE Trans. 1971, 77, 247–262. [Google Scholar]
  9. D’Ambrosio Alfano, F.R.; Olesen, B.W.; Palella, B.I. Povl Ole Fanger’s Impact Ten Years Later. Energy Build. 2017, 152, 243–249. [Google Scholar] [CrossRef]
  10. International Organization for Standardization. Moderate Thermal Environments—Determination of the PMV and PPD Indices and Specification of the Conditions for Thermal Comfort, 1st ed.; Standard ISO 7730:1984; International Organization for Standardization: Geneva, Switzerland, 1984. [Google Scholar]
  11. De Dear, R.J.; Brager, G.S. Developing an adaptive model of thermal comfort and preference. ASHRAE Trans. 1998, 104, 145–167. [Google Scholar]
  12. American Society of Heating, Refrigerating and Air-conditioning Engineering. Thermal Environmental Conditions for Human Occupancy; ANSI/ASHRAE Standard 55-2004; American Society of Heating, Refrigerating and Air-conditioning Engineering: Atlanta, GA, USA, 2004. [Google Scholar]
  13. European Committee for Standardization. Indoor Environmental Input Parameters for Design and Assessment of Energy Performance of Buildings Addressing Indoor Air Quality, Thermal Environment, Lighting and Acoustics; Standard EN 15251:2007; European Committee for Standardization: Brussels, Belgium, 2007. [Google Scholar]
  14. Carlucci, S.; Bai, L.; de Dear, R.; Yang, L. Review of adaptive thermal comfort models in built environmental regulatory documents. Build. Environ. 2018, 137, 73–89. [Google Scholar] [CrossRef]
  15. Thermal Environmental Conditions for Human Occupancy; ANSI/ASHRAE, Standard 55-2013; American National Standards Institute, American Society of Heating, Refrigerating and Air-Conditioning Engineers: Atlanta, GA, USA, 2013.
  16. International Standardization Organization. Ergonomics of the Thermal Environment—Assessment of the Influence of the Thermal Environment Using Subjective Judgement Scales, 1st ed.; Standard ISO 10551-1995; International Standardization Organization: Geneva, Switzerland, 1995. [Google Scholar]
  17. Athienitis, A.K.; Santamouris, M. Thermal Analysis and Design of Passive Solar Buildings; Earthscan Publishing House: New York, NY, USA, 2013. [Google Scholar]
  18. Koelblen, B.; Psikuta, A.; Bogdan, A.; Annaheim, S.; Rossi, R.M. Thermal sensation models: A systematic comparison. Indoor Air 2017, 27, 680–689. [Google Scholar] [CrossRef] [PubMed]
  19. Takada, S.; Matsumoto, S.; Matsushita, T. Prediction of whole-body thermal sensation in the non-steady state based on skin temperature. Build. Environ. 2013, 68, 123–133. [Google Scholar] [CrossRef]
  20. Walgama, C.; Fackrell, S.; Karimi, M.; Fartaj, A.; Rankin, G.W. Passenger thermal comfort in vehicles—A review. Proc. Inst. Mech. Eng. Part D J. Automob. Eng. 2006, 220, 543–562. [Google Scholar] [CrossRef]
  21. Koelblen, B.; Psikuta, A.; Bogdan, A.; Annaheim, S.; Rossi, R.M. Thermal sensation models: Validation and sensitivity towards thermo-physiological parameters. Build. Environ. 2018, 130, 200–211. [Google Scholar] [CrossRef]
  22. Schlader, Z.J.; Stannard, S.R.; Mündel, T. Human thermoregulatory behavior during rest and exercise—A prospective review. Physiol. Behav. 2010, 99, 269–275. [Google Scholar] [CrossRef] [PubMed]
  23. Alahmer, A.; Mayyas, A.; Mayyas, A.A.; Omar, M.A.; Shan, D. Vehicular thermal comfort models; a comprehensive review. Appl. Therm. Eng. 2011, 31, 995–1002. [Google Scholar] [CrossRef]
  24. Cheng, Y.; Niu, J.; Gao, N. Thermal comfort models: A review and numerical investigation. Build. Environ. 2012, 47, 13–22. [Google Scholar] [CrossRef]
  25. Khodakarami, J.; Nasrollahi, N. Thermal comfort in hospitals—A literature review. Renew. Sustain. Energy Rev. 2012, 16, 4071–4077. [Google Scholar] [CrossRef]
  26. Katić, K.; Li, R.; Zeiler, W. Thermophysiological models and their applications: A review. Build. Environ. 2016, 106, 286–300. [Google Scholar] [CrossRef]
  27. Mishra, A.K.; Loomans, M.G.L.C.; Hensen, J.L.M. Thermal comfort of heterogeneous and dynamic indoor conditions—An overview. Build. Environ. 2016, 109, 82–100. [Google Scholar] [CrossRef]
  28. Schweiker, M.; Fuchs, X.; Becker, S.; Shukuya, M.; Dovjak, M.; Hawighorst, M.; Kolarik, J. Challenging the assumptions for thermal sensation scales. Build. Res. Inf. 2017, 45, 572–589. [Google Scholar] [CrossRef]
  29. Psikuta, A.; Allegrini, J.; Koelblen, B.; Bogdan, A.; Annaheim, S.; Martínez, N.; Derome, D.; Carmeliet, J.; Rossi, R.M. Thermal manikins controlled by human thermoregulation models for energy efficiency and thermal comfort research—A review. Renew. Sustain. Energy Rev. 2017, 78, 1315–1330. [Google Scholar] [CrossRef]
  30. Fang, Z.; Liu, H.; Li, B.; Tand, M.; Olaideea, O.M. Experimental Investigation on Thermal Comfort Model between Local Thermal Sensation and Overall Thermal Sensation. Energy Build. 2018, 158, 1286–1295. [Google Scholar] [CrossRef]
  31. International Standardization Organization. Ergonomics of the Thermal Environment—Vocabulary and Symbols, 1st ed.; Standard ISO 13731:2001; International Standardization Organization: Geneva, Switzerland, 2001. [Google Scholar]
  32. International Standardization Organization. Ergonomics of the Thermal Environment—Determination of Metabolic Rate, 2nd ed.; Standard ISO 8996:2004; International Standardization Organization: Geneva, Switzerland, 2004. [Google Scholar]
  33. Malchaire, J.; d’Ambrosio Alfano, F.R.; Palella, B.I. Evaluation of the metabolic rate based on the recording of the heart rate. Ind. Health 2017, 55, 219–232. [Google Scholar] [CrossRef] [PubMed]
  34. Hensen, J.L.M. Literature review on thermal comfort in transient conditions. Build. Environ. 1990, 25, 309–316. [Google Scholar] [CrossRef]
  35. ASHRAE. Thermal comfort. In ASHRAE Handbook Fundamentals; ASHRAE: Atlanta, GA, USA, 2017; Chapter 9. [Google Scholar]
  36. Gagge, A.P.; Stolwijk, J.A.J.; Hardy, J.D. Comfort and thermal sensations and associated physiological responses at various ambient temperatures. Environ. Res. 1967, 1, 1–20. [Google Scholar] [CrossRef]
  37. Gagge, A.P. A two node model of human temperature regulation in FORTRAN. In Bioastronautics Data, 2nd ed.; Parker, J.F., Jr., West, V.R., Eds.; NASA Special Publication: Washington, DC, USA, 1973; pp. 142–148. [Google Scholar]
  38. Rohles, F.H., Jr.; Nevins, R.G. The nature of thermal comfort for sedentary man. ASHRAE Trans. 1971, 77, 239. [Google Scholar]
  39. D’Ambrosio Alfano, F.R.; Palella, B.I.; Riccio, G. Thermal Environment Assessment Reliability Using Temperature-Humidity Indices. Ind. Health 2011, 49, 95–106. [Google Scholar] [CrossRef] [PubMed]
  40. De Freitas, C.R.; Grigorieva, E.A. A comprehensive catalogue and classification of human thermal climate indices. Int. J. Biometeorol. 2015, 59, 109–120. [Google Scholar] [CrossRef] [PubMed]
  41. Blazejczyk, K.; Epstein, Y.; Jendritzky, G.; Staiger, H.; Tinz, B. Comparison of UTCI to selected thermal indices. Int. J. Biometeorol. 2012, 56, 515–535. [Google Scholar] [CrossRef] [PubMed]
  42. International Standardization Organization. Ergonomics of the Thermal Environment—Analytical Determination and Interpretation of Heat Stress Using Calculation of the Predicted Heat Strain, 2nd ed.; Standard ISO 7933:2004; International Standardization Organization: Geneva, Switzerland, 2004. [Google Scholar]
  43. International Standardization Organization. Ergonomics of the Thermal Environment—Determination and Interpretation of Cold Stress When Using Required Clothing Insulation (IREQ) and Local Cooling Effects, 1st ed.; Standard ISO 11079:2007; International Standardization Organization: Geneva, Switzerland, 2007. [Google Scholar]
  44. International Organization for Standardization. Moderate Thermal Environments—Determination of the PMV and PPD Indices and Specification of the Conditions for Thermal Comfort, 3rd ed.; Standard ISO 7730:2005; International Organization for Standardization: Geneva, Switzerland, 2005. [Google Scholar]
  45. International Standardization Organization. Ergonomics of the Thermal Environment—Assessment of Heat Stress Using the WBGT (Wet Bulb Globe Temperature) Index, 3rd ed.; Standard ISO 7243:2017; International Standardization Organization: Geneva, Switzerland, 2017. [Google Scholar]
  46. Höppe, P. Different aspects of assessing indoor and outdoor thermal comfort. Energy Build. 2002, 34, 661–665. [Google Scholar] [CrossRef]
  47. Thorsson, S.; Lindqvist, M.; Lindqvist, S. Thermal bioclimatic conditions and patterns of behaviour in an urban park in Göteborg, Sweden. Int. J. Biometeorol. 2004, 48, 149–156. [Google Scholar] [CrossRef] [PubMed]
  48. Macpherson, R.K. The assessment of the thermal environment—A review. Br. J. Ind. Med. 1962, 19, 151–164. [Google Scholar] [CrossRef] [PubMed]
  49. Zolfaghari, A.; Maerefat, M. A new simplified model for evaluating non-uniform thermal sensation caused by wearing clothing. Build. Environ. 2010, 45, 776–783. [Google Scholar] [CrossRef]
  50. Chen, K.; Jiao, Y.; Lee, E.S. Fuzzy adaptive networks in thermal comfort. Appl. Math. Lett. 2006, 19, 420–426. [Google Scholar] [CrossRef]
  51. Fanger, P.O. Calculation of thermal comfort: Introduction of a basic comfort equation. Build. Eng. 1967, 73, III.4.1–III.4.20. [Google Scholar]
  52. Prek, M. Thermodynamical analysis of human thermal comfort. Energy 2006, 31, 732–743. [Google Scholar] [CrossRef]
  53. Broday, E.E.; de Paula Xavier, A.A.; de Oliveira, R. Comparative analysis of methods for determining the clothing surface temperature (tcl) in order to provide a balance between man and the Environment. Int. J. Ind. Ergon. 2017, 57, 80–87. [Google Scholar] [CrossRef]
  54. Marn, J.; Chung, M.; Iljaž, J. Relationship between metabolic rate and blood perfusion under Fanger thermal comfort conditions. J. Therm. Biol. 2019, 80, 94–105. [Google Scholar] [CrossRef] [PubMed]
  55. International Standardization Organization. Energy Performance of Buildings—Indoor Environmental Quality—Part 1: Indoor Environmental Input Parameters for the Design and Assessment of Energy Performance of Building, 1st ed.; Standard ISO 17772-1; International Standardization Organization: Geneva, Switzerland, 2017. [Google Scholar]
  56. D’Ambrosio Alfano, F.R.; Palella, B.I.; Riccio, G.; Toftum, J. Fifty years of Fanger’s equation: Is there anything to discover yet? Int. J. Ind. Ergon. 2018, 66, 157–160. [Google Scholar] [CrossRef]
  57. Candas, V.; Dufour, A. Thermal comfort: Multisensory interactions? J. Appl. Hum. Sci. 2005, 24, 33–36. [Google Scholar] [CrossRef]
  58. Humphreys, M. Outdoor temperatures and comfort indoors. Batim. Int. Build. Res. Pract. 1978, 6, 92–105. [Google Scholar] [CrossRef]
  59. Van Marken Lichtenbelt, W.D.; Kingma, B.R. Building and occupant energetics: A physiological hypothesis. Archit. Sci. Rev. 2013, 56, 48–53. [Google Scholar] [CrossRef]
  60. Fanger, P.O. Thermal environment—Human requirements. Environ. Syst. Decis. 1986, 6, 275–278. [Google Scholar] [CrossRef]
  61. Fanger, P.O.; Toftum, J. Extension of the PMV model to non-air-conditioned buildings in warm climates. Energy Build. 2002, 34, 533–536. [Google Scholar] [CrossRef]
  62. De Dear, R.J.; Akimoto, T.; Arens, E.A.; Brager, G.; Candido, C.; Cheong, K.W.D.; Li, B.; Nishihara, N.; Sekhar, S.C.; Tanabe, S.; et al. Progress in thermal comfort research over the last twenty years. Indoor Air 2013, 23, 442–461. [Google Scholar] [CrossRef] [PubMed]
  63. Stolwijk, J.A.J. Mathematical Model of Thermoregulation, Physiological and Behavioural Temperature Regulation; C.C Thomas Publishers: Springfield, IL, USA, 1970; pp. 703–721. [Google Scholar]
  64. Arens, E.; Zhang, H. The skin’s role in human thermoregulation and comfort. In Thermal and Moisture Transport in Fibrous Materials; Woodhead Publ.: Cambridge, UK, 2006; Chapter 16; pp. 560–602. [Google Scholar]
  65. Schellen, L.; Loomans, M.G.L.C.; Kingma, B.R.M.; de Wit, M.H.; Frijns, A.J.H.; van Marken Lichtenbelt, W.D. The use of a thermophysiological model in the built environment to predict thermal sensation, coupling with the indoor environment and thermal sensation. Build. Environ. 2013, 59, 10–22. [Google Scholar] [CrossRef]
  66. Katić, K.; Zeiler, W.; Boxem, G. Thermophysiological models: A first comparison. In Proceedings of the 5th German-Austrian IBPSA Conference RWTH Aachen University, Aachen, Germany, 22–24 September 2014; pp. 525–602. [Google Scholar]
  67. Palella, B.I.; d’Ambrosio Alfano, F.R.; Riccio, G. On the Evolution of Thermoregulation Models. Ergon. Int. J. 2017, 1, 000118. [Google Scholar] [CrossRef]
  68. Yang, Y.; Yao, R.; Li, B.; Liu, H.; Jiang, L. A method of evaluating the accuracy of human body thermoregulation models. Build. Environ. 2015, 87, 1–9. [Google Scholar] [CrossRef]
  69. Hong, S.H.; Lee, J.M.; Moon, J.W.; Lee, K.H. Thermal Comfort, Energy and Cost Impacts of PMV Control Considering Individual Metabolic Rate Variations in Residential Building. Energies 2018, 11, 1767. [Google Scholar] [CrossRef]
  70. Stolwijk, J.A.J. A Mathematical Model of Physiological Temperature Regulation in Man; NASA Contractor Report, NASA CR-1855; NASA: Washington, DC, USA, August 1971.
  71. Fiala, D.; Lomas, K.J.; Stohrer, M. A computer model of human thermoregulation for a wide range of environmental conditions: The passive system. J. Appl. Physiol. 1999, 87, 1957–1972. [Google Scholar] [CrossRef] [PubMed]
  72. Candas, V.; d’Ambrosio, F.R.; Herrmann, C. A mathematical model of thermoregulation to evaluate thermal comfort. In Proceedings of the 2nd International Conference on Energy and Environment towards the Year 2000, Capri, Italy, 3–5 June 1993; pp. 1031–1043. [Google Scholar]
  73. Tanabe, S.; Kobayashi, K.; Nakano, J.; Ozeki, Y.; Konishi, M. Evaluation of thermal comfort using combined multi-node thermoregulation (65MN) and radiation models and computational fluid dynamics (CFD). Energy Build. 2002, 34, 637–646. [Google Scholar] [CrossRef]
  74. Kobayashi, Y.; Tanabe, S. Development of JOS-2 human thermoregulation model with detailed vascular system. Build. Environ. 2013, 66, 1–10. [Google Scholar] [CrossRef]
  75. Stolwijk, J.A.J.; Hardy, J.D. Temperature Regulation in Man—A Theoretical Study. Pflügers Archiv Die Gesamte Physiologie Des Menschen Und Der Tiere. 1966, 291, 129–162. [Google Scholar] [CrossRef]
  76. Bernardi, P.; Cavagnaro, M.; Pisa, S.; Piuzzi, E. Specific absorption rate and temperature elevation in a subject exposed in the far-field of radio-frequency sources operating in the 10-900-MHz range. Ieee Trans. Biomed. Eng. 2003, 50, 295–304. [Google Scholar] [CrossRef] [PubMed]
  77. Jendritzky, G.; de Dear, R. Adaptation and Thermal Environment. In Biometeorology for Adaptation to Climate Variability and Change; Ebi, K.L., Burton, I., McGregor, G., Eds.; Springer Science + Business Media B.V.: Berlin/Heidelberg, Germany, 2009; ISBN 978-1-4020-8920-6. [Google Scholar]
  78. Fu, G. A Transient 3-D Mathematical Thermal Model for the Clothed Human. Ph.D. Thesis, Kansas State University, Manhattan, KS, USA, 1995. [Google Scholar]
  79. Kuznetz, L.H. A two-dimensional transient mathematical model of human thermoregulation. Am. J. Physiol. 1979, 237, 266–277. [Google Scholar] [CrossRef] [PubMed]
  80. Li, Y.; Li, F.; Liu, Y.; Luo, Z. An integrated model for simulating interactive thermal processes in the humane clothing system. J. Therm. Biol. 2004, 29, 567–575. [Google Scholar]
  81. Givoni, B.; Goldman, R. Predicting metabolic energy cost. J. Appl. Physiol. 1971, 30, 429–433. [Google Scholar] [CrossRef] [PubMed]
  82. Wyndham, C.H.; Atkins, A.R. A physiological scheme and mathematical model of temperature regulation in man. Pfulgers Arch. 1968, 303, 14–30. [Google Scholar] [CrossRef]
  83. Gagge, A.P. Rational temperature indices of man’s thermal environment and their use with a 2-node model of his temperature regulation. Federation Proc. 1973, 32, 1572–1582. [Google Scholar]
  84. Foda, E.; Sirén, K. A new approach using the Pierce two-node model for different body parts. Int. J. Biometeorol. 2011, 55, 519–532. [Google Scholar] [CrossRef] [PubMed]
  85. Salloum, M.; Ghaddar, N.; Ghali, K. A new transient bioheat model of the human body and its integration to clothing models. Int. J. Therm. Sci. 2007, 46, 371–384. [Google Scholar] [CrossRef]
  86. Höppe, P. The physiological equivalent temperature—A universal index for the biometeorogical assessment of the thermal environment. Int. J. Biometeorol. 1999, 43, 71–75. [Google Scholar] [PubMed]
  87. Azer, N.Z.; Hsu, S. The prediction of thermal sensation from a simple thermoregulatory model. ASHRAE Trans. 1977, 83, 88–102. [Google Scholar]
  88. Smith, C.E. A Transient Three-Dimensional Model of the Human Thermal System. Ph.D. Thesis, Kansas State University, Manhattan, KS, USA, 1991. [Google Scholar]
  89. Jones, B.W.; Ogawa, Y. Transient interaction between the human and the thermal environment. ASHRAE Trans. 1992, 98, 189–195. [Google Scholar]
  90. Crosbie, R.J.; Hardy, J.D.; Fessender, E. Electrical analog simulation of temperature regulation in man. Temp. Meas. Control Sci. Ind. 1963, 3, 627–635. [Google Scholar] [CrossRef]
  91. Munir, A.; Takada, S.; Matsushita, T. Re-evaluation of Stolwijk’s 25-node human thermal model under thermal-transient conditions: Prediction of skin temperature in low-activity conditions. Build. Environ. 2009, 44, 1777–1787. [Google Scholar] [CrossRef]
  92. Fiala, D.; Lomas, K.J.; Stohrer, M. Computer predictions of human thermoregulatory and temperature responses to a wide range of environment conditions. Int. J. Biometeorol. 2001, 45, 143–159. [Google Scholar] [CrossRef] [PubMed]
  93. Lai, D.; Chen, Q. A two-dimensional model for calculating heat transfer in the human body in a transient and non-uniform thermal environment. Energy Build. 2016, 118, 114–122. [Google Scholar] [CrossRef]
  94. Fiala, D.; Havenith, G.; Bröde, P.; Kampmann, B.; Jendritzky, G. UTCI–Fiala multi-node model of human heat transfer and temperature regulation. Int. J. Biometeorol. 2012, 56, 429–441. [Google Scholar] [CrossRef] [PubMed]
  95. Blazejczyk, K.; Bröde, P.; Fiala, D.; Havenith, G.; Holmér, I.; Jendritzky, G.; Kampmann, B.; Kunert, A. Principles of the new universal thermal climate index (UTCI) and its application to bioclimatic research in European scale. Misc. Geogr. 2010, 14, 91–102. [Google Scholar]
  96. Fiala, D.; Psikuta, A.; Jendritzky, G.; Paulke, S.; Nelson, D.A.; van Marken Lichtenbelt, W.D.; Frijns, A.J. Physiological modeling for technical, clinical and research applications. Front. Biosci. 2010, 2, 939–968. [Google Scholar] [CrossRef]
  97. Kingma, B.R.M. Human thermoregulation: A synergy between physiology and mathematical modelling. Ph.D. Thesis, Maastricht University, Maastricht, The Netherlands, 2012. [Google Scholar]
  98. Van Marken Lichtenbelt, W.D.; Frijns, A.J.H.; Fiala, D.; Janssen, F.E.M.; van Ooijen, A.M.J.; Van Steenhoven, A.A. Effect of individual characteristics on a mathematical model of human thermoregulation. J. Therm. Biol. 2004, 29, 577–581. [Google Scholar] [CrossRef]
  99. Van Marken Lichtenbelt, W.D.; Frijns, A.J.H.; van Ooijen, M.J.; Fiala, D.; Kester, A.M.; van Steenhoven, A.A. Validation of an individualised model of human thermoregulation for predicting responses to cold air. Int. J. Biometeorol. 2007, 51, 169–179. [Google Scholar] [CrossRef] [PubMed]
  100. Huizenga, C.; Zhang, H.; Arens, E. A model of human physiology and comfort for assessing complex thermal environments. Build. Environ. 2001, 36, 691–699. [Google Scholar] [CrossRef]
  101. Zhang, H.; Huizenga, C.; Arens, E.; Yu, T. Considering individual physiological differences in a human thermal model. J. Therm. Biol. 2001, 26, 401–408. [Google Scholar] [CrossRef]
  102. D’Ambrosio Alfano, F.R.; Palella, B.I.; Riccio, G. Thermode 193: An enhanced Stolwijk thermoregulation model of the human body. In Proceedings of the 7th International Thermal Manikin and Modelling Meeting, University of Coimbra, Coimbra, Portugal, 3–5 September 2008; pp. 1–8. [Google Scholar]
  103. Holopainen, R.A. Human Thermal Model for Improved Thermal Comfort. Ph.D. Thesis, Aalto University, Aalto, Findland, 2012. [Google Scholar]
  104. Holopainen, R.; Tuomaala, P. New human thermal model integrated in a building simulation environment for a more accurate estimation of thermal comfort in transient conditions. Chest 2010, 14, 29.7. [Google Scholar]
  105. Gardner, G.G.; Martin, C.J. The mathematical modelling of thermal responses of normal subjects and burned patients. Physiol. Meas. 1994, 15, 381–400. [Google Scholar] [CrossRef] [PubMed]
  106. Severens, N.M.W.; van Marken Lichtenbelt, W.D.; Frijns, A.J.H.; Van Steenhoven, A.A.; De Mol, B.A.J.M.; Sessler, D.I. A model to predict patient temperature during cardiac surgery. Phys. Med. Biol. 2007, 52, 5131–5145. [Google Scholar] [CrossRef] [PubMed]
  107. Pan, D.; Chan, M.; Deng, S.; Qu, M. A four-node thermoregulation model for predicting the thermal physiological responses of a sleeping person. Build. Environ. 2012, 52, 88–97. [Google Scholar]
  108. Xu, X.; Werner, J. A dynamic model of the human/clothing/environment-system. Appl. Hum. Sci. J. Physiol. Anthropol. 1997, 16, 61–75. [Google Scholar] [CrossRef]
  109. Ying, B.; Kwok, Y.; Li, Y.; Yeung, C.Y.; Li, F.Z.; Li, S. Mathematical modeling of thermal physiological responses of clothed infants. J. Therm. Biol. 2004, 29, 559–565. [Google Scholar] [CrossRef]
  110. Ying, B.; Kwok, Y.; Li, Y.; Li, F.; Yick, K.; Wong, K. An Improved Mathematical Model of Thermal Physiological Response of Naked Infants. J. Fiber Bioeng. Inform. 2009, 2, 90–100. [Google Scholar]
  111. Pereira, C.B.; Heimann, K.; Czaplik, M.; Blazek, V.; Venema, B.; Leonhardt, S. Thermoregulation in premature infants: A mathematical model. J. Therm. Biol. 2016, 62, 159–169. [Google Scholar] [CrossRef] [PubMed]
  112. Zhou, X.; Lian, Z.; Lan, L. An individualized human thermoregulation model for Chinese adults. Build. Environ. 2013, 70, 257–265. [Google Scholar] [CrossRef]
  113. Ma, T.; Xiong, J.; Lian, Z. A human thermoregulation model for the Chinese elderly. J. Therm. Biol. 2017, 70, 2–14. [Google Scholar] [CrossRef] [PubMed]
  114. Novieto, D.T. Adapting a Human Thermoregulation Model for Predicting the Thermal Response of Older Persons. Ph.D. Thesis, De Montfort University, Leicester, UK, 2013. [Google Scholar]
  115. Wissler, E.H. Steady-state temperature distribution in man. J. Appl. Physiol. 1961, 16, 734–740. [Google Scholar] [CrossRef] [PubMed]
  116. Wissler, E.H. Mathematical Simulation of Human Thermal Behaviour Using Whole-Body Models; Plenum Press: New York, NY, USA, 1985. [Google Scholar]
  117. Ferreira, M.S.; Yanagihara, J.I. A transient three-dimensional heat transfer model of the human body. Int. Commun. Heat Mass Transf. 2009, 36, 718–724. [Google Scholar] [CrossRef]
  118. Fanger, P.O. Thermal Comfort: Analysis and Applications in Engineering; McGraw-Hill: New York, NY, USA, 1982. [Google Scholar]
  119. Takada, S.; Kobayashi, H.; Matsushita, T. Thermal model of human body fitted with individual characteristics of body temperature regulation. Build. Environ. 2009, 44, 463–470. [Google Scholar] [CrossRef]
  120. Kingma, B.R.; Frijns, A.J.H.; Schellen, L.; van Marken Lichtenbelt, W.D. Beyond the classic thermoneutral zone, including thermal comfort. Temperature 2014, 1, 142–149. [Google Scholar] [CrossRef] [PubMed]
  121. Gagge, A.P.; Burton, A.C.; Bazeti, H.C. A practical system of units for the description of heat exchange in man with his thermal environment. Science 1941, 94, 428–430. [Google Scholar] [CrossRef] [PubMed]
  122. International Standardization Organization. Ergonomics of the Thermal Environment—Estimation of the Thermal Insulation and Evaporative Resistance of a Clothing Ensemble, Standard ISO 9920:2009 (ISO 9920:2007, corrected version 2008-11-01); International Standardization Organization: Geneva, Switzerland, 2009. [Google Scholar]
  123. Havenith, G.; Heus, R.; Lotens, W.A. Resultant clothing insulation: A function of body movement, posture, wind, clothing and ensemble thickness. Ergonomics 1990, 33, 67–84. [Google Scholar] [CrossRef]
  124. Havenith, G.; Heus, R.; Lotens, W.A. Clothing ventilation, vapour resistance and permeability index: Changes due to posture, movement and wind. Ergonomics 1990, 33, 989–1005. [Google Scholar] [CrossRef]
  125. Havenith, G.; Holmér, I.; den Hartog, E.A.; Parsons, K.C. Clothing evaporative heat resistance—Proposal for improved representation in standards and models. Ann. Occup. Hyg. 1999, 43, 339–346. [Google Scholar] [CrossRef]
  126. Havenith, G.; Nilsson, H.O. Correction of clothing insulation for movement and wind effects, a meta-analysis. Eur. J. Appl. Physiol. 2004, 92, 636–640. [Google Scholar] [CrossRef] [PubMed]
  127. Havenith, G.; Nilsson, H. Correction of clothing insulation for movement and wind effects, a meta-analysis (erratum). Eur. J. Appl. Physiol. 2005, 93, 506. [Google Scholar] [CrossRef]
  128. Lu, Y.; Wang, F.; Wan, X.; Song, G.; Shi, W.; Zhang, C. Clothing resultant thermal insulation determined on a movable thermal manikin. Part I: Effects of wind and body movement on total insulation. Int. J. Biometeorol. 2015, 59, 1475–1486. [Google Scholar] [CrossRef] [PubMed]
  129. D’Ambrosio Alfano, F.R.; Palella, B.I.; Riccio, G.; Malchaire, J. On the effect of thermophysical properties of clothing on the heat strain predicted by PHS model. Ann. Occup. Hyg. 2016, 60, 231–251. [Google Scholar] [CrossRef] [PubMed]
  130. Kaynakli, O.; Unver, U.; Kilic, M. Evaluating thermal environments for sitting and standing posture. Int. Commun. Heat. Mass Transf. 2003, 30, 1179–1188. [Google Scholar] [CrossRef]
  131. Kaynakli, O.; Kilic, M. Investigation of indoor thermal comfort under transient conditions. Build. Environ. 2005, 40, 9165–9174. [Google Scholar] [CrossRef]
  132. Kaynakli, O.; Pulat, E.; Kilic, M. Thermal comfort during heating and cooling in an automobile. Heat Mass Transf. 2005, 41, 449–458. [Google Scholar] [CrossRef]
  133. Kohri, I.; Mochida, T. Evaluation Method of Thermal Comfort in a vehicle with a Dispersed Two-Node Model, Part 1—Development of a Dispersed Two-Node Model. J. Hum. Environ. Syst. 2002, 6, 19–29. [Google Scholar] [CrossRef]
  134. Atmaca, I.; Kaynakli, O.; Yigit, A. Effects of radiant temperature on thermal comfort. Build. Environ. 2007, 42, 3210–3220. [Google Scholar] [CrossRef]
  135. ASHRAE. Thermal Environmental Conditions for Human Occupancy; ANSI/ASHRAE Standard 55-2010; American Society of Heating, Refrigerating and Air-Conditioning Engineers, Inc.: Atlanta, GA, USA, 2010. [Google Scholar]
  136. Zhu, Y.; Luo, M.; Ouyang, Q.; Huang, L.; Cao, B. Dynamic characteristics and comfort assessment of airflows in indoor environments: A review. Build. Environ. 2015, 91, 5–14. [Google Scholar] [CrossRef]
  137. Enescu, D. A review of thermal comfort models and indicators for indoor environments. Renew. Sustain. Energy Rev. 2017, 79, 1353–1379. [Google Scholar] [CrossRef]
  138. Monteiro, L.M. Review of numerical modelling of outdoor thermal comfort. In Proceedings of the World Sustainable Building Conference, Tokyo, Japan, 27–29 September 2005. [Google Scholar]
  139. Jones, B.W. Transient Model of the Human Body and Clothing Systems; Technical Report 91-01; Institute for Environmental Research, Kansas State University: Manhattan, KS, USA, 1991. [Google Scholar]
  140. Stolwijk, J.A.J.; Hardy, J.D. Partitional calorimetric studies of responses of man to thermal transients. J. Appl. Physiol. 1966, 21, 967–977. [Google Scholar] [CrossRef] [PubMed]
  141. Stolwijk, J.A.J.; Hardy, J.D. Control of body temperature. In Handbook of Physiology. Reactions to Environmental Agents; Lee, D.H.K., Falk, H.L., Murphy, S.D., Geiger, S.R., Eds.; Williams and Wilkins: Baltimore, MD, USA, 1977; Section 9; pp. 45–68. [Google Scholar]
  142. Li, F.; Li, Y. Effect of clothing material on thermal response of the human body. Model. Simul. Mater. Sci. Eng. 2005, 13, 809–827. [Google Scholar]
  143. Li, B.; Yang, Y.; Yao, R.; Liu, H.; Li, Y. A simplified thermoregulation model of the human body in warm conditions. Appl. Ergon. 2017, 59, 387–400. [Google Scholar] [CrossRef] [PubMed]
  144. Gordon, R.G.; Roemer, R.B.; Horvath, S.M. A mathematical model of the human temperature regulatory system-transient cold exposure response. IEEE Trans. Biomed. Eng. 1976, 23, 434–444. [Google Scholar] [CrossRef] [PubMed]
  145. Fiala, D. Dynamic Simulation of Human Heat Transfer and Thermal Comfort. Ph.D. Thesis, De Montfort University, Leicester, UK, 1998. [Google Scholar]
  146. Fiala, D.; Lomas, K.J.; Stohrer, M. First Principles Modelling of Thermal Sensation Responses in Steady State and Transient Conditions. ASHRAE Trans. 2003, 109, 179–186. [Google Scholar]
  147. Fiala, D.; Lomas, K.J. The dynamic effect of adaptive human responses in the sensation of thermal comfort. In Proceedings of the Moving Thermal Comfort Standards into the 21st Century, International Conference, Windsor, UK, 5–8 April 2001; pp. 147–157. [Google Scholar]
  148. Omori, T.; Yang, J.H.; Kato, K.; Murakami, S. Coupled Simulation of Convection and Radiation on Thermal Environment around an Accurately Shaped Human Body. In Proceedings of the 9th International Conference-RoomVent, Coimbra, Portugal, 5–8 September 2004; Volume 7. [Google Scholar]
  149. Yang, T.; Cropper, P.C.; Cook, M.J.; Yousaf, R.; Fiala, D. A new simulation system to predict human–environment thermal interactions in naturally ventilated buildings. In Proceedings of the 10th International Building Performance Simulation Association Conference and Exhibition (BS2007), Beijing, China, 3–6 September 2007; pp. 751–756. [Google Scholar]
  150. Van Treek, C.; Pfaffinger, C.M.; Wenisch, P.; Frisch, J.; Yue, Z.; Egger, M.; Rank, E. Towards computational steering of thermal comfort assessment. In Proceedings of the 11th International Conference on Indoor Air Quality and Climate, Copenhagen, Denmark, 17–22 August 2008; Volume 5. [Google Scholar]
  151. Van Treeck, C.; Frisch, J.; Pfaffinger, M.; Rank, E.; Paulke, S.; Schweinfurth, I.; Schwab, R.; Hellwig, R.; Holm, A. Integrated thermal comfort analysis using a parametric manikin model for interactive real-time simulation. J. Build. Perform. Simul. 2009, 2, 233–250. [Google Scholar] [CrossRef]
  152. Zare, S.; Hasheminejad, N.; Shirvan, H.E.; Hemmatjo, R.; Sarebanzadeh, K.; Saeid Ahmadi, S. Comparing Universal Thermal Climate Index (UTCI) with selected thermal indices/environmental parameters during 12 months of the year. Weather Clim. Extrem. 2018, 19, 49–57. [Google Scholar] [CrossRef]
  153. Kingma, B.; Schellen, L.; Frijns, A.; van Marken Lichtenbelt, W. Thermal sensation: A mathematical model based on neurophysiology. Indoor Air 2011, 22, 253–262. [Google Scholar] [CrossRef] [PubMed]
  154. Huizenga, C.; Zhang, H.; Arens, E.; Wang, D. Skin and core temperature response to partial and whole—Body heating and cooling. J. Therm. Biol. 2004, 29, 549–558. [Google Scholar] [CrossRef]
  155. Wyon, D.P.; Larsson, S.; Forsgren, B.; Lundgren, I. Standard Procedures for Assessing Vehicle Climate with a Thermal Manikin; SAE Paper 890049; SAE International: Warrendale, PA, USA, 1989. [Google Scholar]
  156. Tanabe, S.; Arens, E.; Bauman, F.; Zhang, H.; Madsen, T. Evaluating thermal environments by using a thermal manikin with controlled skin surface temperature. ASHRAE Trans. 1994, 100, 39–48. [Google Scholar]
  157. Nilsson, H.O. Thermal comfort evaluation with virtual thermal manikin methods. Build. Environ. 2007, 42, 4000–4005. [Google Scholar] [CrossRef]
  158. Foda, E.; Almesri, I.; Awbi, H.B.; Sirén, K. Models of human thermoregulation and the prediction of local and overall thermal sensations. Build. Environ. 2011, 46, 2023–2032. [Google Scholar] [CrossRef]
  159. Zhu, S.; Kato, S.; Ooka, R.; Sakoi, T. Development of a computational thermal manikin applicable in a nonuniform thermal environment—Part 1: Coupled Simulation of Convection, Radiation, and Smith’s Human Thermal Physiological Model for Sensible Heat Transfer from a Seated Human Body in Radiant Environment. HVAC R Res. 2007, 13, 661–679. [Google Scholar]
  160. Al-Othmani, M.; Ghaddar, N.; Ghali, K. A multi-segmented human bioheat model for transient and asymmetric radiative environments. Int. J. Heat Mass Transf. 2008, 51, 5522–5533. [Google Scholar] [CrossRef]
  161. Ozaki, H.; Enomoto-Kushimizu, H.; Tochihara, Y.; Nakamura, K. Thermal responses from repeated exposures to severe cold with intermittent warmer temperatures. Appl. Hum. Sci. 1998, 17, 195–205. [Google Scholar] [CrossRef]
  162. Kakitsuba, N. Dynamic changes in sweat rates and evaporation rates through clothing during hot exposure. J. Therm. Biol. 2004, 29, 739–742. [Google Scholar] [CrossRef]
  163. Bach, V.; Telliez, F.; Libert, J.P. The interaction between sleep and thermoregulation in adults and neonates. Physiol. Rev. 2002, 6, 481–492. [Google Scholar] [CrossRef]
  164. Dijk, D.J.; Duffy, J.F.; Czeisler, C.A. Contribution of circadian physiology and sleep homeostasis to age-related changes in human sleep. Chronobiol. Int. 2000, 17, 285–311. [Google Scholar] [CrossRef] [PubMed]
  165. Rida, M.; Ghaddar, N.; Ghali, K.; Hoballah, J. Elderly bioheat modeling: Changes in physiology, thermoregulation, and blood flow circulation. Int. J. Biometeorol. 2014, 58, 1825–1843. [Google Scholar] [CrossRef] [PubMed]
  166. Schellen, L.; van Marken Lichtenbelt, W.D.; Loomans, M.G.L.C.; Toftum, J.; De Wit, M.H. Differences between young adults and elderly in thermal comfort, productivity, and thermal physiology in response to a moderate temperature drift and a steady-state condition. Indoor Air 2010, 20, 273–283. [Google Scholar] [CrossRef] [PubMed]
  167. Havenith, G. Temperature regulation and technology. Gerontechnology 2001, 1, 41–49. [Google Scholar] [CrossRef]
  168. Van Hoof, J.; Hensen, J. Thermal comfort and older adults. Gerontechnology 2006, 4, 223–228. [Google Scholar]
  169. Van Hoof, J. Forty years of Fanger’s model of thermal comfort: Comfort for all? Indoor Air 2008, 18, 182–201. [Google Scholar] [CrossRef] [PubMed]
  170. Tsuzuki, K.; Ohfuku, T. Thermal sensation and thermoregulation in elderly compared to young people in Japanese winter season. In Proceedings of the 9th International Conference on Indoor Air Quality and Climate, Monterey, CA, USA, 30 June–5 July 2002; pp. 659–664. [Google Scholar]
  171. Tsuzuki, K.; Iwata, T. Thermal comfort and thermoregulation for elderly people taking light exercise. In Proceedings of the 9th International Conference on Indoor Air Quality and Climate, Monterey, CA, USA, 30 June–5 July 2002; pp. 647–652. [Google Scholar]
  172. Bussmann, O.; Nahm, W.; Konecny, E. A model for simulating heat transfer and thermoregulation of premature infants. Biomed. Tech. 1998, 43 (Suppl. S1), S300–S301. [Google Scholar]
  173. Werner, J.; Buse, M. Temperature profiles with respect to inhomogeneity and geometry of the human body. J. Appl. Physiol. 1988, 65, 1110–1118. [Google Scholar] [CrossRef] [PubMed]
  174. Karaki, W.; Ghaddar, N.; Ghali, K.; Kalev, K.; Holmer, I.; Vanggaard, L.L. Human thermal response with improved AVA modeling of the digits. Int. J. Therm. Sci. 2013, 67, 41–52. [Google Scholar] [CrossRef]
  175. Tang, Y.L.; He, Y.; Shao, H.W.; Ji, C.J. Assessment of comfortable clothing thermal resistance using a multi-scale human thermoregulatory model. Int. J. Heat Mass Transf. 2016, 98, 568–583. [Google Scholar] [CrossRef]
  176. Afzali, A.; Maghsoodlou, S. Heat and Moisture Transfer in Clothing System. In Nanostructured Polymer Blends and Composites in Textiles; Apple Academic Press: Oakville, ON, Canada, 2015; Chapter 5; pp. 187–215. [Google Scholar]
  177. Li, F.; Wang, Y.; Li, Y. A transient 3D thermal model for clothed human body considering more real geometry. J. Comput. 2013, 8, 676–684. [Google Scholar]
  178. Wissler, E.H. An analysis of factors affecting temperature levels in the nude human. Temp. Meas. Control Sci. Ind. 1963, 3, 603–612. [Google Scholar]
  179. Jones, B.W.; Ogawa, Y. Transient response of the human-clothing system. J. Therm. Biol. 1993, 18, 413–416. [Google Scholar] [CrossRef]
  180. Sun, X.Y.; Eckels, S.; Charlie Zheng, Z.Q. An improved thermal model of the human body. HVAC R Res. 2012, 18, 323–338. [Google Scholar]
  181. Zhang, H. Human Thermal Sensation and Comfort in Transient and Non-Uniform Thermal Environment. Ph.D. Thesis, University of California, Berkeley, CA, USA, 2003. [Google Scholar]
  182. Neves, S.F.; Campos, J.B.; Mayor, T.S. On the determination of parameters required for numerical studies of heat and mass transfer through textiles methodologies and experimental procedures. Int. J. Heat Mass Transf. 2015, 81, 272–282. [Google Scholar] [CrossRef]
  183. Woodcock, A.H. Moisture transfer in textile systems, Part 1. Text. Res. J. 1962, 32, 628–633. [Google Scholar] [CrossRef]
  184. Nilsson, H.O.; Anttonen, H.; Holmér, I. New algorithms for prediction of wind effects on cold protective clothing. In Proceedings of the Nokobetef 6 and 1st European Conference on Protective Clothing, Stockholm, Sweden, 7–10 May 2000; pp. 17–20. [Google Scholar]
  185. D’Ambrosio Alfano, F.R.; Palella, B.I.; Riccio, G. Notes on the Implementation of the IREQ Model for the Assessment of Extreme Cold Environments. Ergonomics 2013, 56, 707–724. [Google Scholar] [CrossRef] [PubMed]
  186. Havenith, G.; Holmer, I.; Parsons, K. Personal factors in thermal comfort assessment: Clothing properties and metabolic heat production. Energy Build. 2002, 34, 581–591. [Google Scholar] [CrossRef]
  187. Holmér, I.; Nilsson, H.; Havenith, G.; Parsons, K.C. Clothing Convective Heat Exchange—Proposal for improved Prediction in Standards and Models. Ann. Occup. Hyg. 1999, 43, 329–337. [Google Scholar] [CrossRef]
  188. Parsons, K.; Havenith, G.; Holmér, I.; Nilsson, H.; Malchaire, J.B. The Effects of Wind and Human Movement on the Heat and Vapour Transfer Properties of Clothing. Ann. Occup. Hyg. 1999, 43, 347–352. [Google Scholar] [CrossRef]
  189. Wang, F.; del Ferraro, S.; Lin, L.; Sotto Mayor, T.; Molinaro, V.; Ribeiro, M.; Gao, C.; Kuklane, K.; Holmér, I. Localised boundary air layer and clothing evaporative resistances for individual body segments. Ergonomics 2012, 55, 799–812. [Google Scholar] [CrossRef] [PubMed]
  190. Qian, X.; Fan, J. Prediction of Clothing Thermal Insulation and Moisture Vapour Resistance of the Clothed Body Walking in Wind. Ann. Occup. Hyg. 2006, 50, 833–842. [Google Scholar] [PubMed]
  191. Havenith, G.; Kuklane, K.; Fan, J.; Hodder, S.; Ouzzahra, Y.; Lundgren, K.; Au, Y.; Loveday, D. A database of static clothing thermal insulation and vapor permeability values of non-Western ensembles for use in ASHRAE Standard 55, ISO 7730, and ISO 9920. ASHRAE Trans. 2015, 121, 197–215. [Google Scholar]
  192. Lu, Y.; Wang, F.; Wan, X.; Song, G.; Zhang, C.; Shi, W. Clothing resultant thermal insulation determined on a movable thermal manikin. Part II: Effects of wind and body movement on local insulation. Int. J. Biometeorol. 2015, 59, 1487–1498. [Google Scholar] [CrossRef] [PubMed]
  193. Yang, J.; Weng, W.; Wang, F.; Song, G. Integrating a human thermoregulatory model with a clothing model to predict core and skin temperatures. Appl. Ergon. 2017, 61, 168–177. [Google Scholar] [CrossRef] [PubMed]
  194. Fan, J.T.; Luo, Z.X.; Li, Y. Heat and moisture transfer with sorption and condensation in porous clothing assemblies and numerical simulation. Int. J. Heat Mass Transf. 2000, 43, 2989–3000. [Google Scholar] [CrossRef]
  195. Khatoon, S.; Kim, M.H. Human Thermal Comfort and Heat Removal Efficiency for Ventilation Variants in Passenger Cars. Energies 2017, 10, 1710. [Google Scholar] [CrossRef]
  196. Fan, J.T.; Cheng, X.; Wen, X.; Sun, W.W. An improved model of heat and moisture transfer with phase change and mobile condensates in fibrous insulation and comparison with experimental results. Int. J. Heat Mass Transf. 2004, 47, 2343–2352. [Google Scholar] [CrossRef]
  197. Zhu, Q.Y.; Xie, M.H.; Yang, J.; Li, Y. A fractal model for the coupled heat and mass transfer in porous fibrous media. Int. J. Heat Mass Transf. 2015, 54, 1400–1409. [Google Scholar] [CrossRef]
  198. Fan, J.; Wen, X. Modeling heat and moisture transfer through fibrous insulation with phase change and mobile condensates. Int. J. Heat Mass Transf. 2002, 45, 4045–4055. [Google Scholar] [CrossRef]
  199. Ghali, K.; Ghaddar, N.; Jones, B. Modeling of heat and moisture transport by periodic ventilation of thin cotton fibrous media. Int. J. Heat Mass Transf. 2002, 45, 3703–3714. [Google Scholar] [CrossRef]
  200. Lotens, W.A. Heat Transfer from Humans Wearing Clothing. Ph.D. Thesis, TU Delft, Delft University of Technology, Delft, The Netherlands, 1993. [Google Scholar]
  201. Lee, K.H.; Schiavon, S. Influence of Three Dynamic Predictive Clothing Insulation Models on Building Energy Use, HVAC Sizing and Thermal Comfort. Energies 2014, 7, 1917–1934. [Google Scholar] [CrossRef]
  202. Moore, S.M.; McIntosh, R.L.; Iskra, S.; Wood, A.W. Modeling the effect of adverse environmental conditions and clothing on temperature rise in a human body exposed to radio frequency electromagnetic fields. IEEE Trans. Biomed. Eng. 2015, 62, 627–637. [Google Scholar] [CrossRef] [PubMed]
  203. Wissler, E.H.; Havenith, G. A simple theoretical model of heat and moisture transport in multi-layer garments in cool ambient air. Eur. J. Appl. Physiol. 2009, 105, 797–808. [Google Scholar] [CrossRef] [PubMed]
  204. Wan, X.; Fan, J. A transient thermal model of the human body-clothing-environment system. J. Therm. Biol. 2008, 33, 87–97. [Google Scholar] [CrossRef]
  205. Hamdan, H.; Ghaddar, N.; Ouahrani, D.; Ghali, K.; Itani, M. PCM cooling vest for improving thermal comfort in a hot environment. Int. J. Therm. Sci. 2016, 102, 154–167. [Google Scholar] [CrossRef]
  206. Vecchia, P.; Matthes, R.; Ziegelberger, G.; Lin, J.; Saunders, R.; Swerdlow, A. Exposure to High Frequency Electromagnetic Fields, Biological Effects and Health Consequences (100 kHz-300 GHz); International Commission on Non-Ionizing Radiation Protection: Oberschleissheim, Germany, 2009. [Google Scholar]
  207. Gosselin, M.; Neufeld, E.; Moser, H.; Huber, E.; Farcito, S.; Gerber, L.; Jedensjö, M.; Hilber, I.; Di Gennaro, F.; Lloyd, B.; et al. Development of a new generation of high-resolution anatomical models for medical device evaluation: The Virtual Population 3.0. Phys. Med. Biol. 2014, 5287–5303. [Google Scholar] [CrossRef] [PubMed]
  208. Pisa, S.; Cavagnaro, M.; Piuzzi, E.; Bernardi, P.; Lin, J.C. Power density and temperature distributions produced by interstitial arrays of sleeved-slot antennas for hyperthermic cancer therapy. IEEE Trans. Microw. Theory Tech. 2003, 51, 2418–2426. [Google Scholar] [CrossRef]
  209. Ibrahiem, A.; Dale, C.; Tabbara, W.; Wiart, J. Analysis of the temperature increase linked to the power induced by RF source. Prog. Electromagn. Res. 2005, 52, 23–46. [Google Scholar] [CrossRef]
  210. Zhang, Y. Generalized dual-phase lag bioheat equations based on nonequilibrium heat transfer in living biological tissues. Int. J. Heat Mass Transf. 2009, 52, 4829–4834. [Google Scholar] [CrossRef]
  211. Liu, K.C.; Chen, T.M. Analysis of the thermal response and requirement for power dissipation in magnetic hyperthermia with the effect of blood temperature. Int. J. Heat Mass Transf. 2018, 126, 1048–1056. [Google Scholar] [CrossRef]
  212. Goyal, R.; Bhargava, R. FEM simulation of EM field effect on body tissues with bio-nanofluid (blood with nanoparticles) for nanoparticle mediated hyperthermia. Math. Biosci. 2018, 300, 76–86. [Google Scholar] [CrossRef] [PubMed]
  213. Nelson, D.A.; Curran, A.R.; Nyberg, H.A.; Marttila, E.A.; Mason, P.A.; Ziriax, J.M. High-resolution simulations of the thermophysiological effects of human exposure to 100 MHz RF energy. Phys. Med. Biol. 2013, 58, 1947–1968. [Google Scholar] [CrossRef] [PubMed]
  214. Hagino, M.; Hara, J. Development of a Method for Predicting Comfortable Airflow in the Passenger Compartment; Society of Automotive Engineers (SAE) Technical Paper Series; SAE: Warrendale, PA, USA, 1992; Volume 922131. [Google Scholar]
  215. Cheong, K.W.D.; Yu, W.J.; Sekhar, S.C.; Tham, K.W.; Kosonen, R. Local thermal sensation and comfort study in a field environment chamber served by displacement ventilation system in the tropics. Build. Environ. 2007, 42, 525–533. [Google Scholar] [CrossRef]
  216. Jin, Q.; Li, X.; Duanmu, L.; Shu, H.; Sun, Y.; Ding, Q. Predictive model of local and overall thermal sensations for non-uniform environments. Build. Environ. 2012, 51, 330–344. [Google Scholar] [CrossRef]
  217. He, Y.; Li, N.; Zhang, W.; Peng, J. Overall and local thermal sensation & comfort in air-conditioned dormitory with hot-humid climate. Build. Environ. 2016, 101, 102–109. [Google Scholar]
  218. Zhao, R.Y. Investigation of transient thermal environments. Build. Environ. 2007, 42, 3926–3932. [Google Scholar] [CrossRef]
  219. Zhang, Y.; Zhao, R. Effect of local exposure on human responses. Build. Environ. 2007, 42, 2737–2745. [Google Scholar] [CrossRef]
  220. Cui, W.L.; Ouyang, Q.; Zhu, Y.X. Field study of thermal environment spatial distribution and passenger local thermal comfort in aircraft cabin. Build. Environ. 2014, 80, 213–220. [Google Scholar] [CrossRef]
  221. Duanmu, M.L. The Study on Thermal Environment and Comfort for Desktop Based Task—Ambient Air Conditioning. Ph.D. Thesis, Dalian University of Technology, Dalian, China, 2007. [Google Scholar]
  222. Zhang, H.; Arens, E.; Kim, D.; Buchberger, E.; Bauman, F.; Huizenga, C. Comfort, perceived air quality, and work performance in a low-power task-ambient conditioning system. Build. Environ. 2010, 45, 29–39. [Google Scholar] [CrossRef]
  223. Zhang, H.; Arens, E.; Huizenga, C.; Han, T. Thermal sensation and comfort models for non-uniform and transient environments: Part I: Local sensation of individual body parts. Build. Environ. 2010, 45, 380–388. [Google Scholar] [CrossRef]
  224. Zhang, H.; Arens, E.; Huizenga, C.; Han, T. Thermal sensation and comfort models for non-uniform and transient environments, part II: Local comfort of individual body parts. Build. Environ. 2010, 45, 389–398. [Google Scholar] [CrossRef]
  225. Zhang, H.; Arens, E.; Huizenga, C.; Han, T. Thermal sensation and comfort models for non-uniform and transient environments, part III: Whole-body sensation and comfort. Build. Environ. 2010, 45, 399–410. [Google Scholar] [CrossRef]
  226. Pokorny, J.; Jicha, M. Coupling of the Models of Human Physiology and Thermal Comfort. EPJ Web Conf. 2013, 45, 01077. [Google Scholar] [CrossRef]
  227. Streblow, R.; Müller, D.; Gores, I.; Bendfeldt, P. A Coupled Simulation of the Thermal Environment and Thermal Comfort with an Adapted Tanabe Comfort Model. In Proceedings of the 7th International Thermal Manikin and Modelling Meeting, University of Coimbra, Coimbra, Portugal, 3–5 September 2008. [Google Scholar]
  228. Schellen, L.; Loomans, M.G.L.C.; de Wit, M.H.; Olesen, B.W.; Lichtenbelt, W.D. The influence of local effects on thermal sensation under non-uniform environmental conditions—Gender differences in thermophysiology, thermal comfort and productivity during convective and radiant cooling. Physiol. Behav. J. 2012, 107, 252–261. [Google Scholar] [CrossRef] [PubMed]
  229. Arens, E.; Zhang, H.; Huizenga, C. Partial-and whole-body thermal sensation and comfort—Part I: Uniform environmental conditions. J. Therm. Biol. 2006, 31, 53–59. [Google Scholar] [CrossRef]
  230. Arens, E.; Zhang, H.; Huizenga, C. Partial-and whole-body thermal sensation and comfort—Part II: Non-uniform environmental conditions. J. Therm. Biol. 2006, 31, 60–66. [Google Scholar] [CrossRef]
  231. He, Y.; Li, N.; Huang, Q. A field study on thermal environment and occupant local thermal sensation in offices with cooling ceiling in Zhuhai China. Energy Build. 2015, 102, 277–283. [Google Scholar] [CrossRef]
  232. Choi, J.H.; Yeom, D. Investigation of the relationships between thermal sensations of local body areas and the whole body in an indoor built environment. Energy Build. 2017, 149, 204–215. [Google Scholar] [CrossRef]
  233. Zhang, Y.; Zhao, R. Overall thermal sensation, acceptability and comfort. Build. Environ. 2008, 43, 44–50. [Google Scholar] [CrossRef]
  234. Zhang, Y.; Zhao, R. Relationship between thermal sensation and comfort in nonuniform and dynamic environments. Build. Environ. 2009, 44, 1386–1391. [Google Scholar] [CrossRef]
Figure 1. Heat exchanges from human body to environment (adapted from ASHRAE 2017 [35]).
Energies 12 00841 g001
Figure 2. The feedback-based determination of the aPMV index and ePMV index.
Energies 12 00841 g002
Figure 3. Body segments and examples of thermal nodes.
Energies 12 00841 g003
Figure 4. Block diagram for computing local and overall thermal sensation and thermal comfort.
Energies 12 00841 g004
Table 1. Scales used to represent the TC, TS and TD indicators.
IndicatorTCTSTSTSTD
ScaleISO 4-point *ASHRAE 7-point9-point11-point11-point
+5------intolerably hotintolerably warm discomfort
+4----very hotvery hotlimited warm
discomfort
+3--hothothotvery uncomfortable warm
+2comfortablewarmwarmwarmuncomfortable and unpleasant warm
+1slightly comfortableslightly warmslightly warmslightly warmslightly uncomfortable but acceptable warm
0--neutralneutralneutralneutral
−1slightly uncomfortableslightly coolslightly coolslightly coolslightly uncomfortable but acceptable cold
−2uncomfortablecoolcoolcooluncomfortable and unpleasant cold
−3--coldcoldcoldvery uncomfortable
cold
−4----very coldvery coldlimited cold
discomfort
−5------intolerably coldintolerably cold discomfort
* The 4-point scale uses relative expressions only. The position in the table is indicative of the absence of a neutral level.
Table 2. Categorisation of recent literature reviews.
Review Paper ReferenceThermoregulatory ControlApplicationsThermal Manikins
Model
Human Thermal Physiological ModelHuman Thermal Psychological ModelNumerical Comparison with Different Tools
Walgama et al.
[20]
-vehiclesyesyesyes-
Schlader et al.
[22]
yesduring rest
& exercise
----
Alahmer et al.
[23]
-vehiclesyesyesyes-
Cheng et al.
[24]
--yesyesyesCFD
Khodakarami and Nasrollahi [25]-hospitals----
Katić et al.
[26]
-vehicles-yes-THESEUS-FE
Mishra et al.
[27]
-building----
Schweiker et al. [28]-TS scales----
Psikuta et al.
[29]
yesoutdoor and buildingcontrolled by models of human thermo-
regulation
yes-CFD
Fang et al.
[30]
-calculation of LTS (head; upper and lower parts of the body) and OTS----
Table 3. Number of segments, thermal nodes, advantages and limitations of different transient thermoregulation models.
ModelNumber of Segments/ElementsNumber of Nodes/LayersAdvantagesLimitationsApplicability Conditions to Predict Human Thermal Responses
One-node
[81]
1 1 Introduces the equations of the metabolic costs of running, walking, and carrying loads [26]Empirical model
Limited applicability range
Thermoregulatory system not considered
Hot environments
Considers clothing
One-node
[82]
1 1/4 Two controlling centres (for heat loss and energy stored in the body) [67] Limited applicability range
Differences among body parts not considered
Effect of blood flow in the heat transfer within the tissue not considered [67]
Big variation of the constants in the control equations [67]
Steady-state, uniform
Considers clothing
Gagge/Pierce
[8,36,83]
1 2 Good mean skin temperature estimation [84]
Simple model and fast calculation time [84]
Easy implementation [85]
Introduces the SET* index [86]
Limited applicability range
No local body zone output [24]
Limited human exposure times (<1 h)
[24]
Does not explain spatial non-uniformities
[24]
No difference between the sensation of bare skin and clothed skin [49]
Transient, uniform
Moderate activity
Considers clothing
KSU
[87,88]
152 Determines TS directly from physiological strain
[24]
Limited applicability range
Not applicable in cold or hot conditions [85]
Heavy computational burden
Skin and fat layers modelled as one layer
Heat transfer of the blood flow in large arteries neglected [85]
Transient, non-uniform, non-symmetric
Sedentary activity
Considers clothing
Jones, Ogawa
[89]
1 2 Wide applicability range
The clothing model reflects non-uniformity
User-friendly interface
Fast determination of the skin moisture accumulation calculations
Constraints to human exposure timesTransient, non-uniform
Various environments, activities and clothing types
MSP
[84]
242 Accurate predictions of local skin temperatures of separate body parts with normal clothingLimited applicability range
Less accurate predictions at the limb in very cold environment
Steady-state, uniform
Sedentary activities
Considers clothing
Crosbie
[90]
13 Accurate human temperature regulation predictions
Accurate predictions of dynamic responses to unexpected changes
Limited applicability range Steady-state and transient, uniform
Clothing is not considered
Stolwijk
[70]
6 4 per segmentAccurate local skin temperature predictions [91]
Gives the instantaneous temperature for all body segments [67]
Limited applicability range
Less accurate predictions of body core temperature in the cold environment [92]
No model of the flow in veins and individual arteries [85]
Model based on limited data [93]
Transient, uniform
Constant environment
Clothing is not considered
Fiala thermoregulation [71,92] 15187Wide applicability range
Accurate predictions of skin temperatures for cold, moderate and hot stress conditions
Accurate predictions of body core temperature in the cold environment [92]
Less accurate predictions of skin temperatures during exercise in cold environments
The model is implemented by a commercial software blind to users
Steady-state and transient, non-uniform
Indoor and outdoor
Different activity intensity [67]
Considers clothing
Fiala UTCI
[94]
12 187 Wide applicability range
Accurate predictions of body thermal effects (hyperthermia and hypothermia) and local effects [92]
Time-consuming when real-time execution of the physiological model is needed [95]Transient, non-uniform
Outdoor applications including weather extremes [95,96]
All scales from micro to macro, all climates and seasons [95]
Whole-body and local skin cooling [77]
Considers clothing
ThermoSEM
[65,97]
19 Multi- nodeAccurate predictions of metabolic responses to cold and mean skin temperature [98]
More physiological background than in the regression model implemented in [92]
Limited applicability range The energy metabolism requires improvement in reply to mild cold [98] Transient, close to neutral thermal environments [65]
Mild cold environment [98,99]
Different subpopulations (male, female) and individual characteristics (height, weight, and fat percentage)
Considers clothing
UCB
[100,101]
165 Flexibility of changing input data [20]
Improvements over Stolwijk model [20]
Fine segmentation for environments with local temperature variations
Accurate predictions of OTS and LTS [17,20]
Extremely sensitive to the skin temperature set-pointTransient, non-uniform
Considers clothing
65MN
[73]
16 65 Wide applicability range Extremely sensitive to the skin temperature set-point on each segment Steady-state and transient, non-uniform
Considers clothing
JOS-2
[74]
17Multi- nodeConsiders arterial and venous circulation (improves 65MN) [67]
Accurate core and skin temperature predictions
Applicable to women and elderly Transient, non-uniform
Considers clothing
AUB
[85]
154 Accurate and realistic representation of the arterial system including blood flow pulsation
Accurate predictions of heat gains/losses
Improved circulatory system model
Solves the asymmetry and uses anatomic positions and real dimensions of arteries
Low time step size achieved for transient simulations Transient, non-uniform
Nude and clothed subjects
THERMODE 193
[72,102]
48193Good prediction of mean skin temperatures and their trends in comfort and moderated discomfort cases [72,102]
Possibility of using different values of clothing insulation for each body segment
Limited prediction of temperature trend in cold conditions; limited predictions for hands and feet [72] (improvements made in [102])Steady-state and transient, non-uniform
Considers clothing
HTM
[103,104]
16 plus head3200/4 Accurate predictions of the effects on the occupants under different conditions
More accurate predictions than in the Fanger model [3]
Limited applicability range Steady-state and transient, non-uniform
Indoor
Considers clothing
12-segment
[93]
12 1 node per layer / 4 or 5 layers per segmentAccurate skin and rectal temperature predictionsLimited applicability range Transient, non-uniform
Indoor
Considers clothing
Burned Patients
[105]
114 per segmentAccurate environmental temperature predictionsLimited applicability range Transient, non-uniform
Ambient temperatures from 20 °C to 40 °C for burned patients
Considers clothing
Patients during cardiac surgery
[106]
19 Various tissue layers Accurate core temperature distribution predictions
Accurate predictions of heat losses in surgical interventions not experimentally evaluated in humans
Limited applicability range Uncertain initial boundary conditions lead to model sensitivity
Less accurate predictions for the mean skin temperature
Transient, non-uniform
Cardiac surgery patients
Considers clothing
Three-Node
[49]
16 2 Easy implementation due to simplifications
Accurate predictions of TS of bare skin and clothed skin
Introduces TS indices for bare skin, clothed skin and OTS of body
Clothing system simulated as an overall insulation covering the whole bodyTransient, non-uniform
Considers clothing
Sleeping person
[107]
14 Acceptable accuracy to predict thermoregulatory responses
Good prediction of indoor parameters (e.g., air temperature and humidity) in a sleeping environment
Limited applicability range Transient, uniform
Sleeping environments
Young adults only
Clothing is not considered
Human/clothing/environment
[108]
6 101 nodes per half- cylinder/4 layers per segmentWide range of environmental conditions (heat, cold, and exercise)
User-friendly interface
Accurate predictions of human thermal response and clothing effects on humans
Time increment restricted by numerical stability Steady-state and transient, non-uniform
Considers clothing
Clothed Infants
[109]
4 7 Accurate predictions of infants’ interaction with the thermoregulation system Limited applicability range
Environment temperature set to 35 °C
Relative humidity set to 65%
Transient, non-uniform
Clothed infants
Naked Infants
[110]
49 Accurate core and skin temperature distribution predictionsLimited applicability range Transient, non-uniform
Naked infants
Premature Infants
[111]
7 multi- node/
all segments contain multiple homogeneous layers
Accurate predictions of core and skin temperature distribution at thermal neutrality
Accurate global and local physiological response predictions
Accurate thermoregulatory dynamic response predictions
Limited applicability range Transient, non-uniform, thermal neutrality
Premature infants
Clothing is not considered
Chinese adults
[112]
14 Most segments have 4 layers with 3 sectors Accurate predictions of mean and local skin temperature compared with the Fiala model
Reduced standard deviation of predicted local skin temperatures compared to the standard Chinese model
Limited applicability range
Skin surface area and body fat distribution different for Chinese adults and western people
Transient, asymmetrical
Chinese young adults
Considers clothing
Chinese elderly
[113]
14Most segments have 4 layers with 3 sectors Accurate predictions of skin temperature due to the introduction of parameters like height, weight, sex and age [112] Limited applicability range
Modifications of passive and active systems
Skin temperature differences between foot and thorax
Transient, asymmetrical
Chinese elderly
Considers clothing
Older Persons
[114]
15187Accurate core temperature predictionsLimitations for the mean skin temperature Steady-state and transient, non-uniform
Older individuals
Considers clothing
Wissler
[115,116]
6 elements (15 in the improved version) About 5300 nodes Accurate predictions of the human body’s response to the temperature changes [26] Many equations needed to represent the temperature variation in space and the thermal flux in the boundariesSteady-state and transient, non-uniform
Cold and hot environments
Hyperbaric and one-atmosphere environments
Clothing is not considered
Ferreira and Yanagihara
[117]
15 Multi-node/
8 tissues
Satisfactory representation of the behaviour of the passive human thermal system Require more segments to improve circulatory and thermoregulatory systemsTransient, uniform
Clothing is not considered
Table 4. Differences between young and aged adults.
AspectCharacteristicsYoung AdultsAged AdultsReference
ThermoregulationAbility of the human body to regulate its own temperatureHighLow[165]
Illnesses and disabilitiesIncreases with ageLowHigh[165]
Thermal environmentExtreme climateTS depends on air temperature and skin temperatureTS depends on the air temperature [166]
Physical strain low - Physical strain high
- Physiological modifications:
  • low muscle strength;
  • low blood pressure;
  • low work capacity;
  • low sweating capacity;
  • low capacity to transfer heat from the body core to the skin;
  • low hydration levels;
  • low vascular reactivity;
  • low cardiovascular stability (blood pressure).
[167]
Same climate
(same clothing level)
- Low temperature preference due to high metabolism
- High activity level
- High temperature preference due to low metabolism
- Low activity level
[168]
Neutral climate TS of young is similar with TS of aged at specific temperature ranges (summer 24–28 °C, winter 22–25 °C)[169]
Cold environment t ¯ sk aged > t ¯ sk young (colder environment) [170]
Hot environment t ¯ sk aged < t ¯ sk young (warmer environment)[171]

