CO2, Water and N2 Injection for Enhanced Oil Recovery with Spatial Arrangement of Fractures in Tight-Oil Reservoirs Using Huff-‘n-puff

Abstract
:1. Introduction
2. Methodology
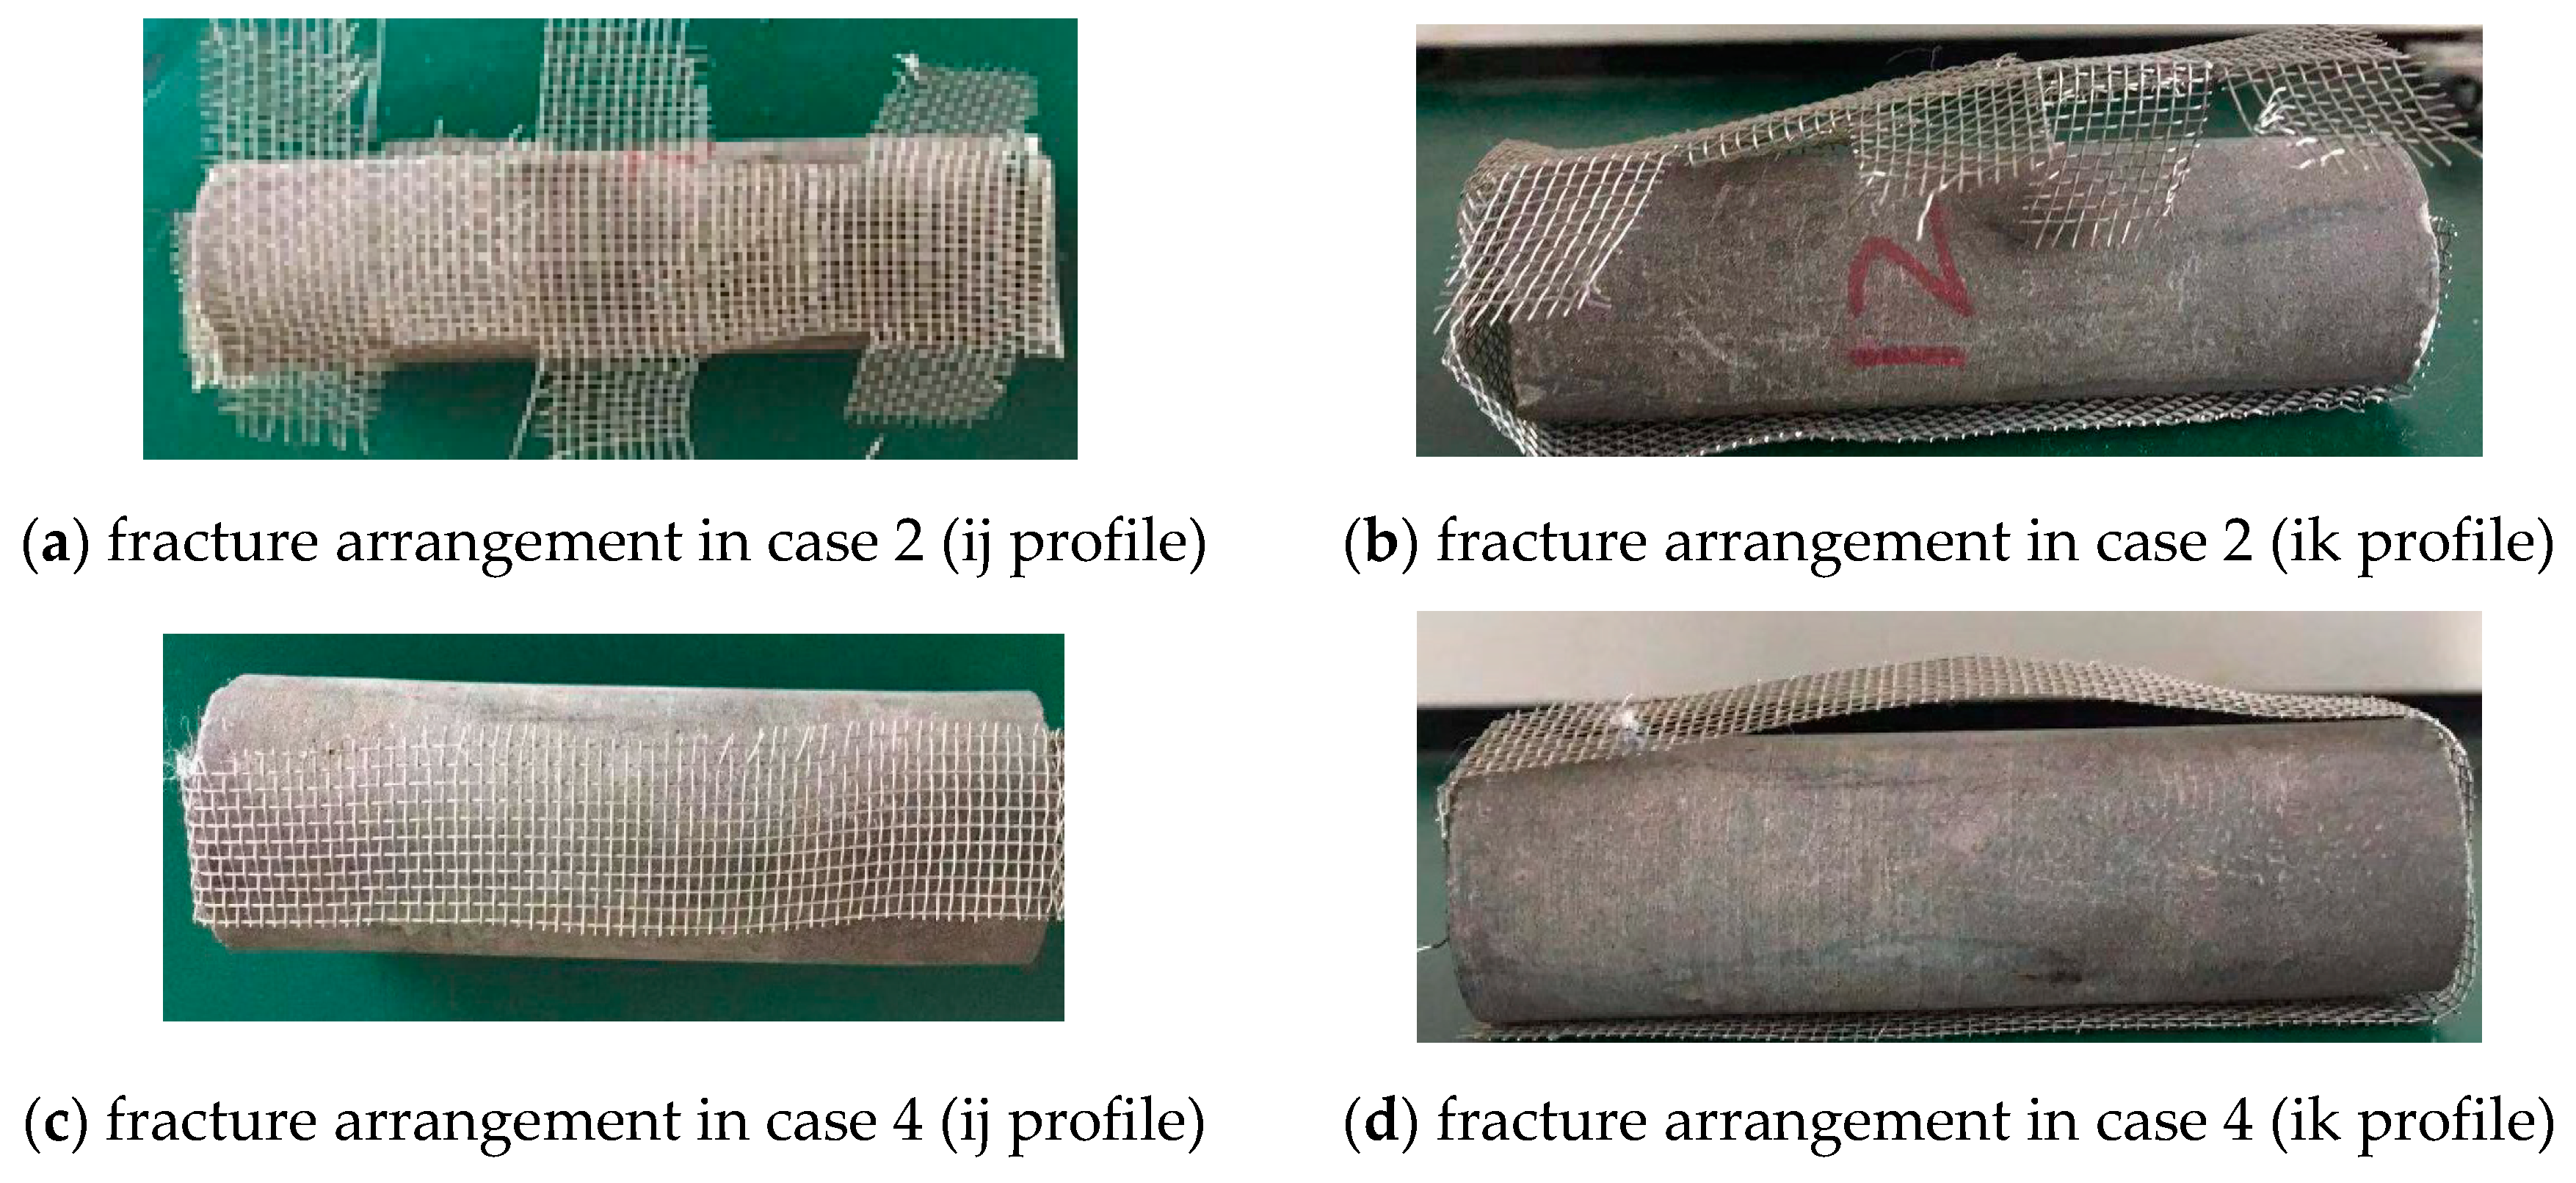
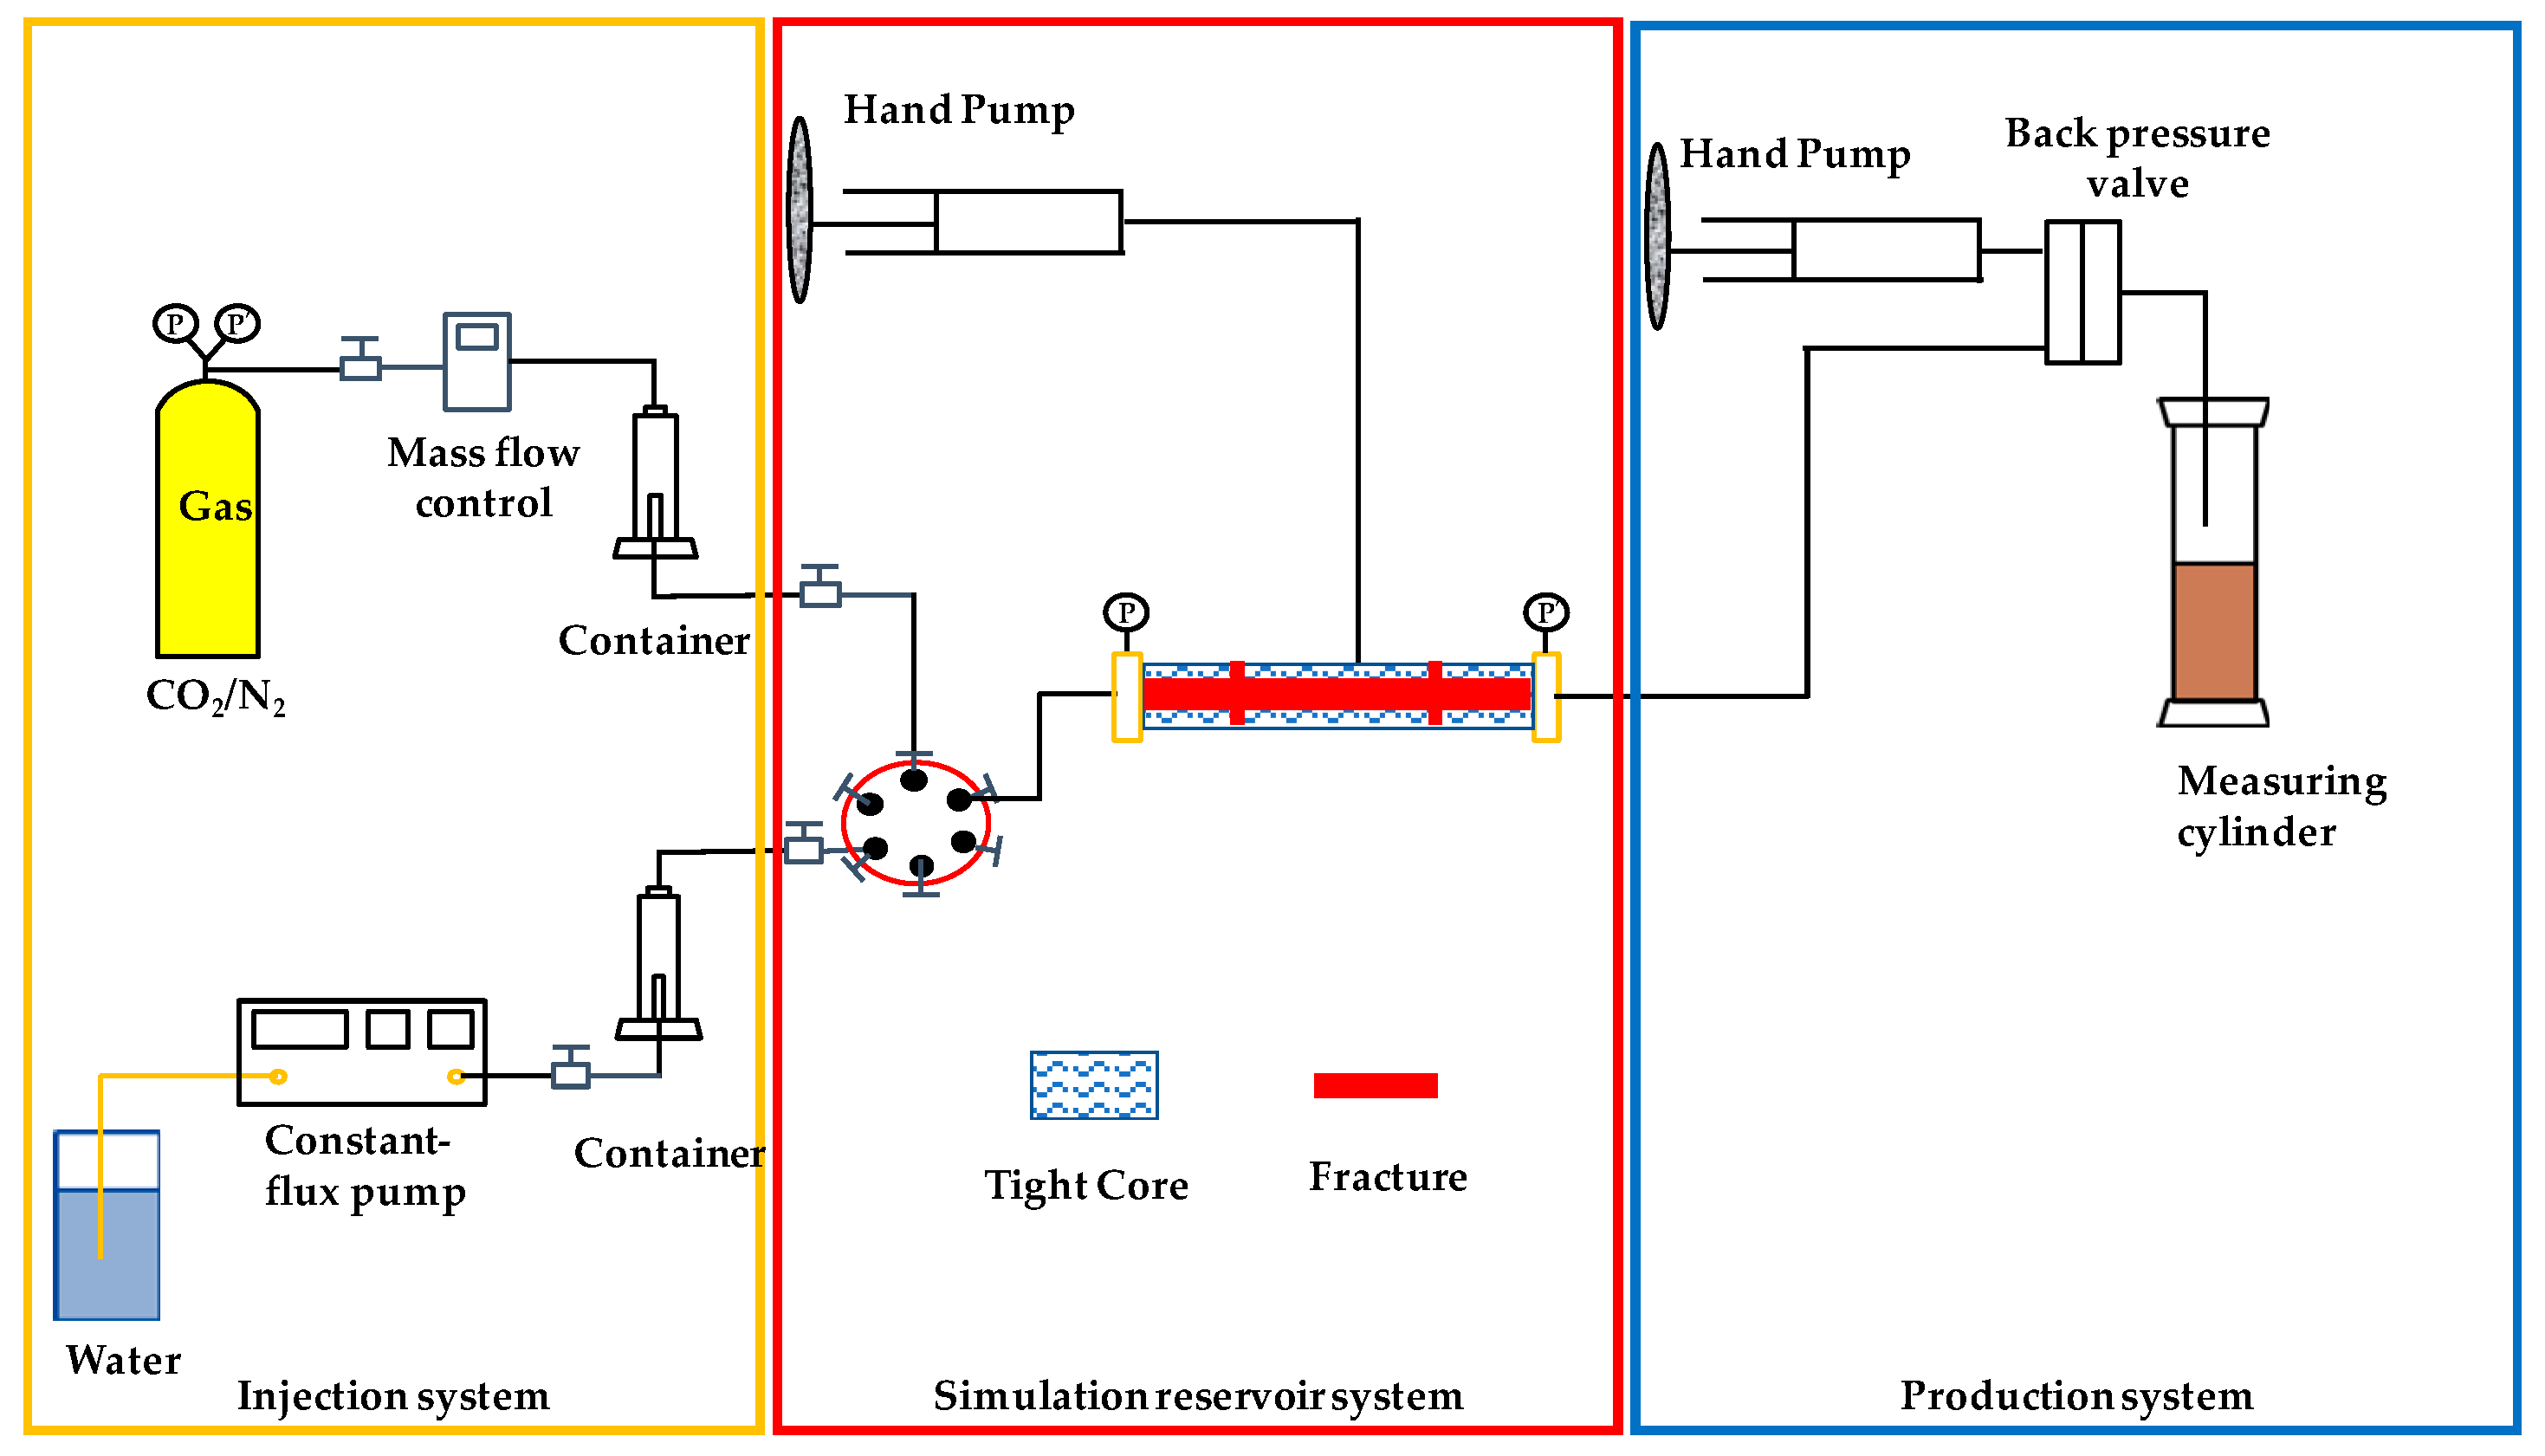
2.1. Experiments
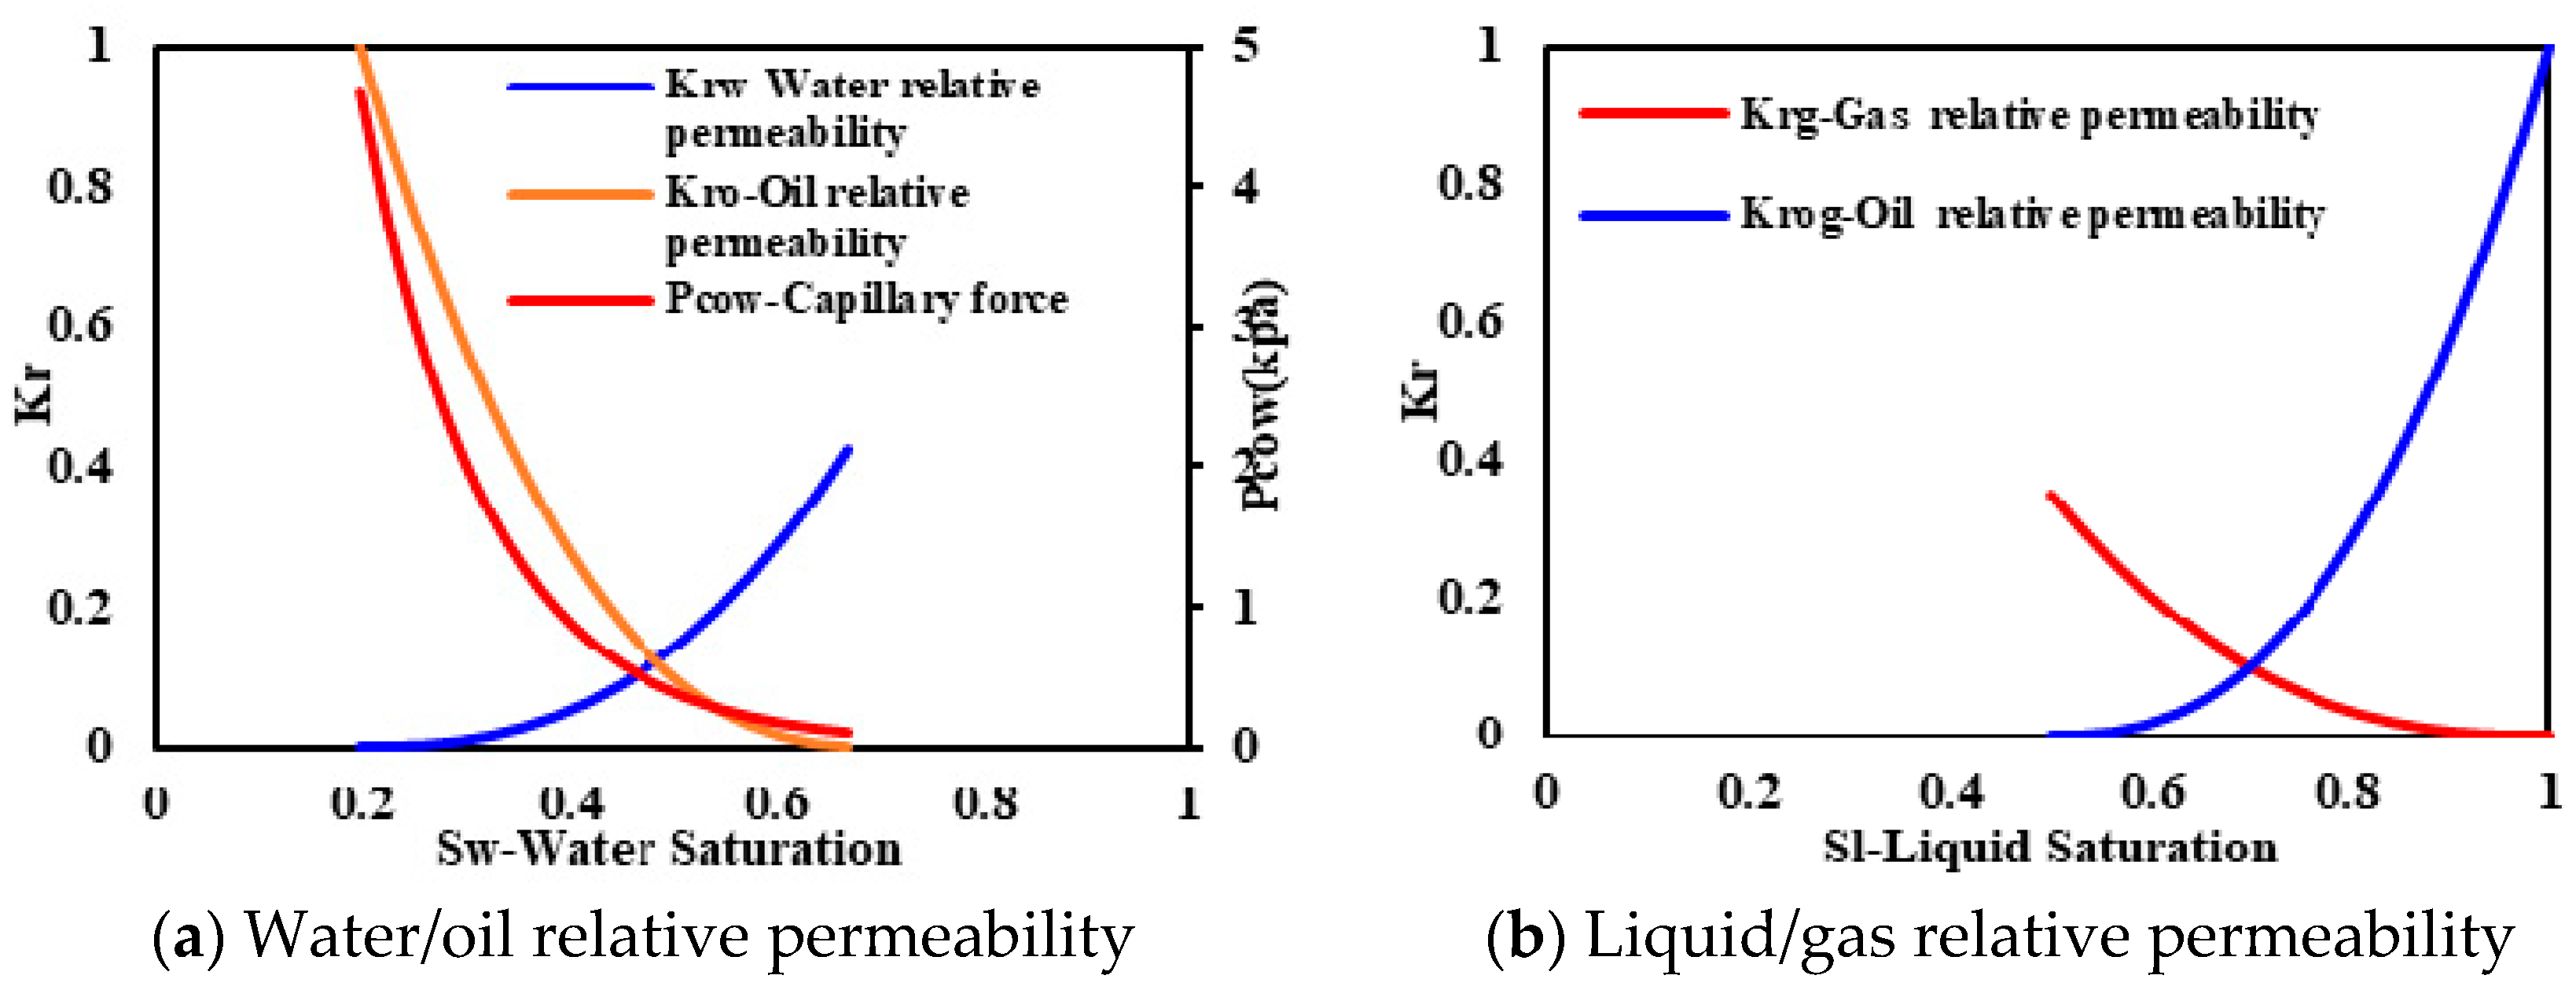
2.2. Numerical Simulation
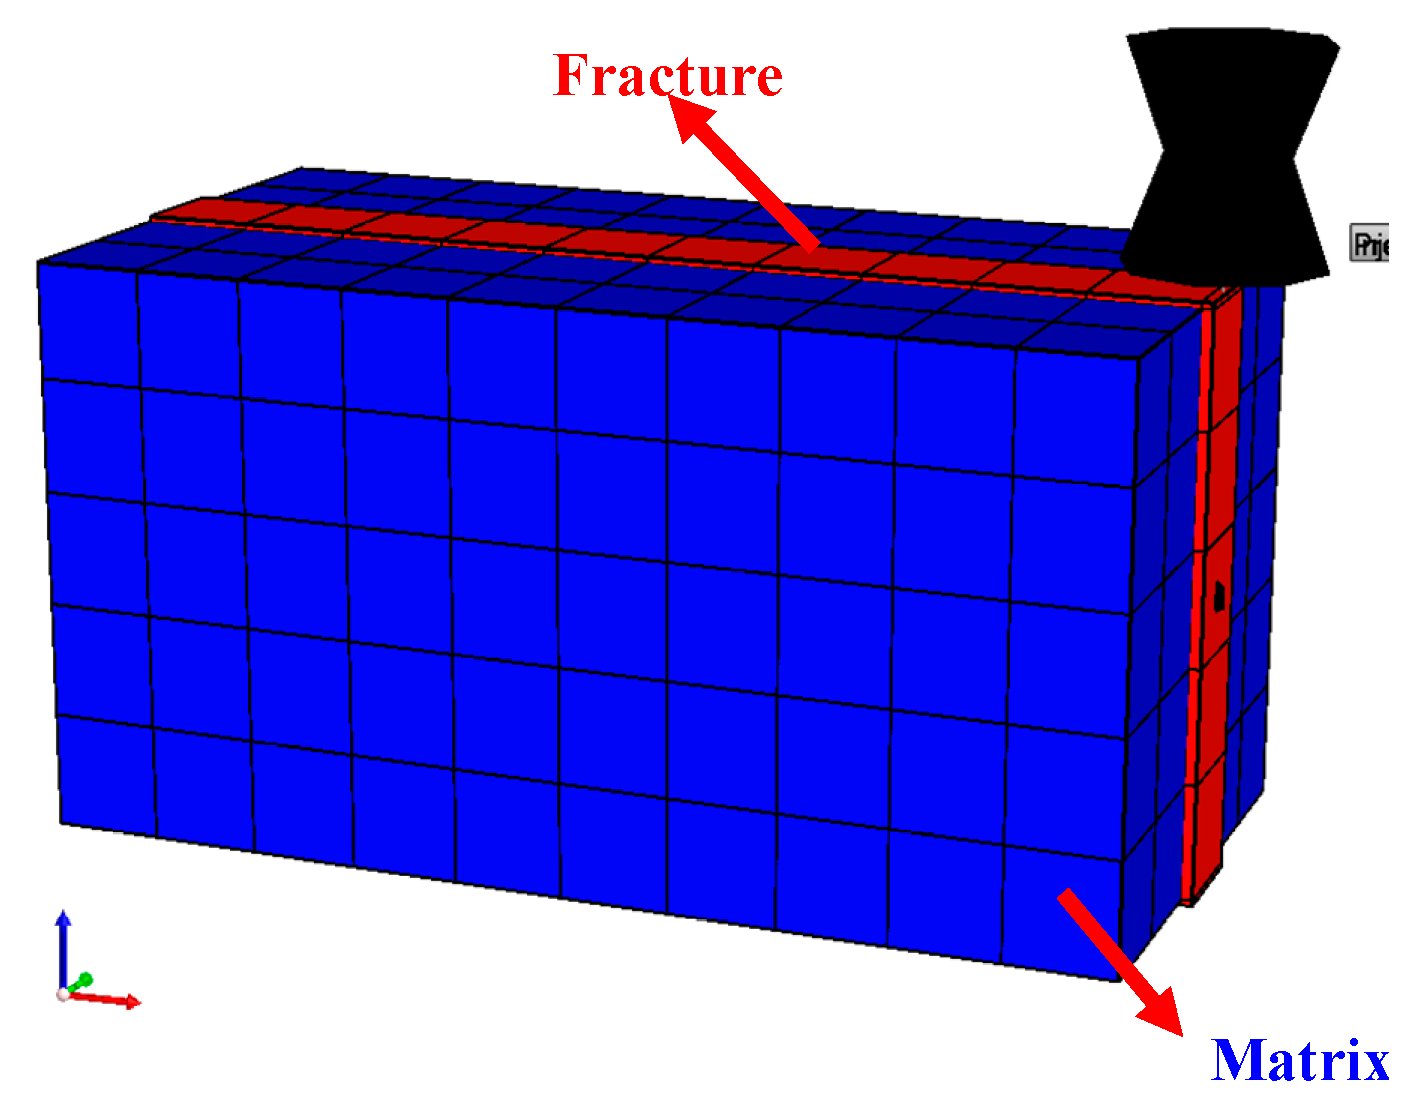
2.2.1. Reservoir Simulation Model
2.2.2. Reservoir Model Description
3. Results
3.1. Depletion and Huff-‘n-puff with Different Fluids
3.1.1. Depletion Mode
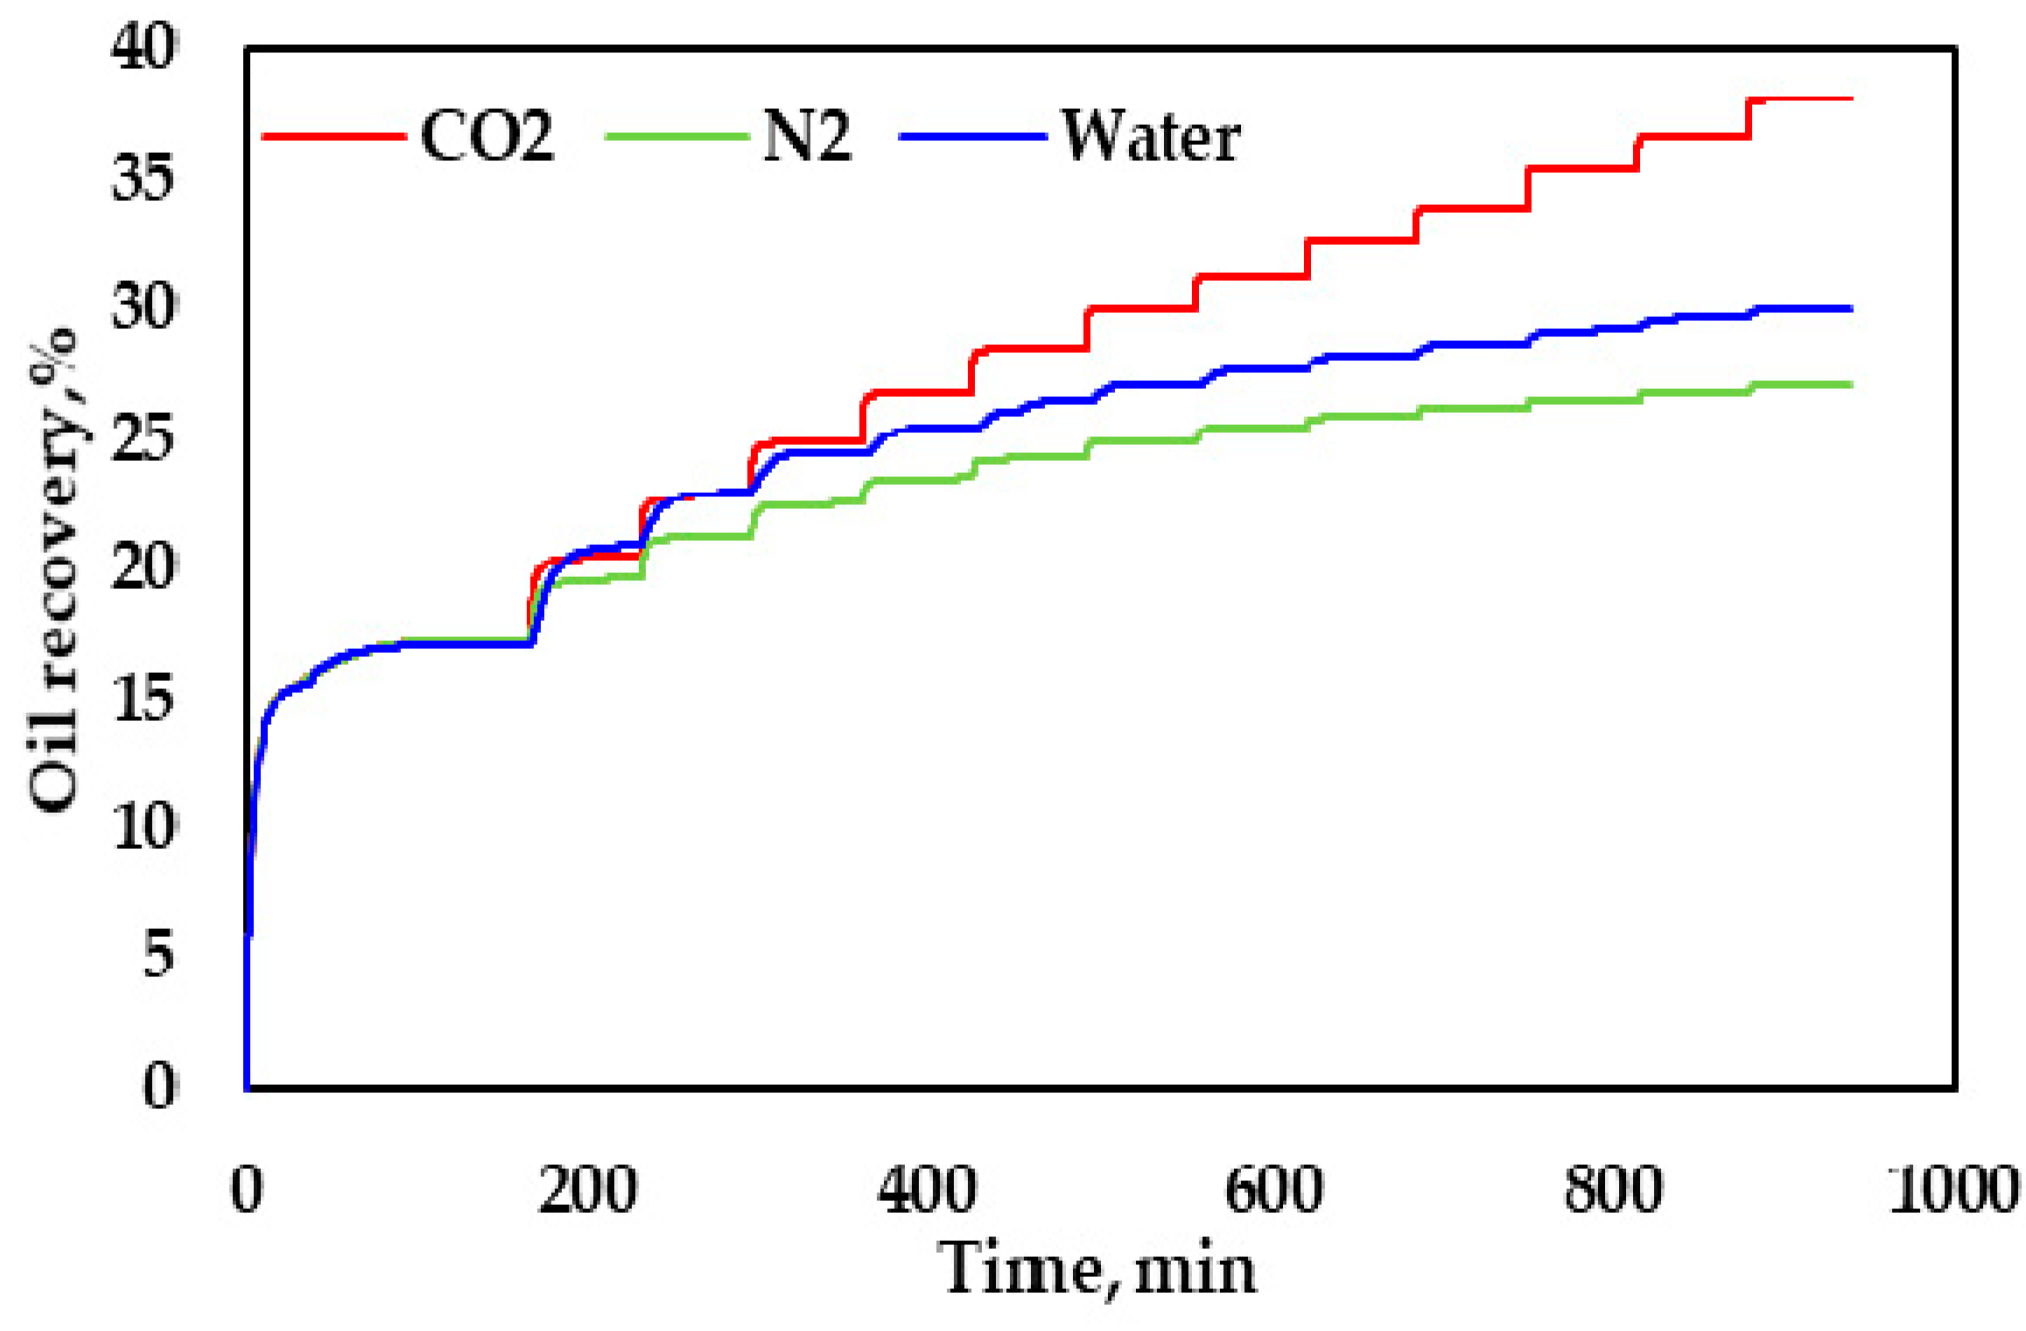
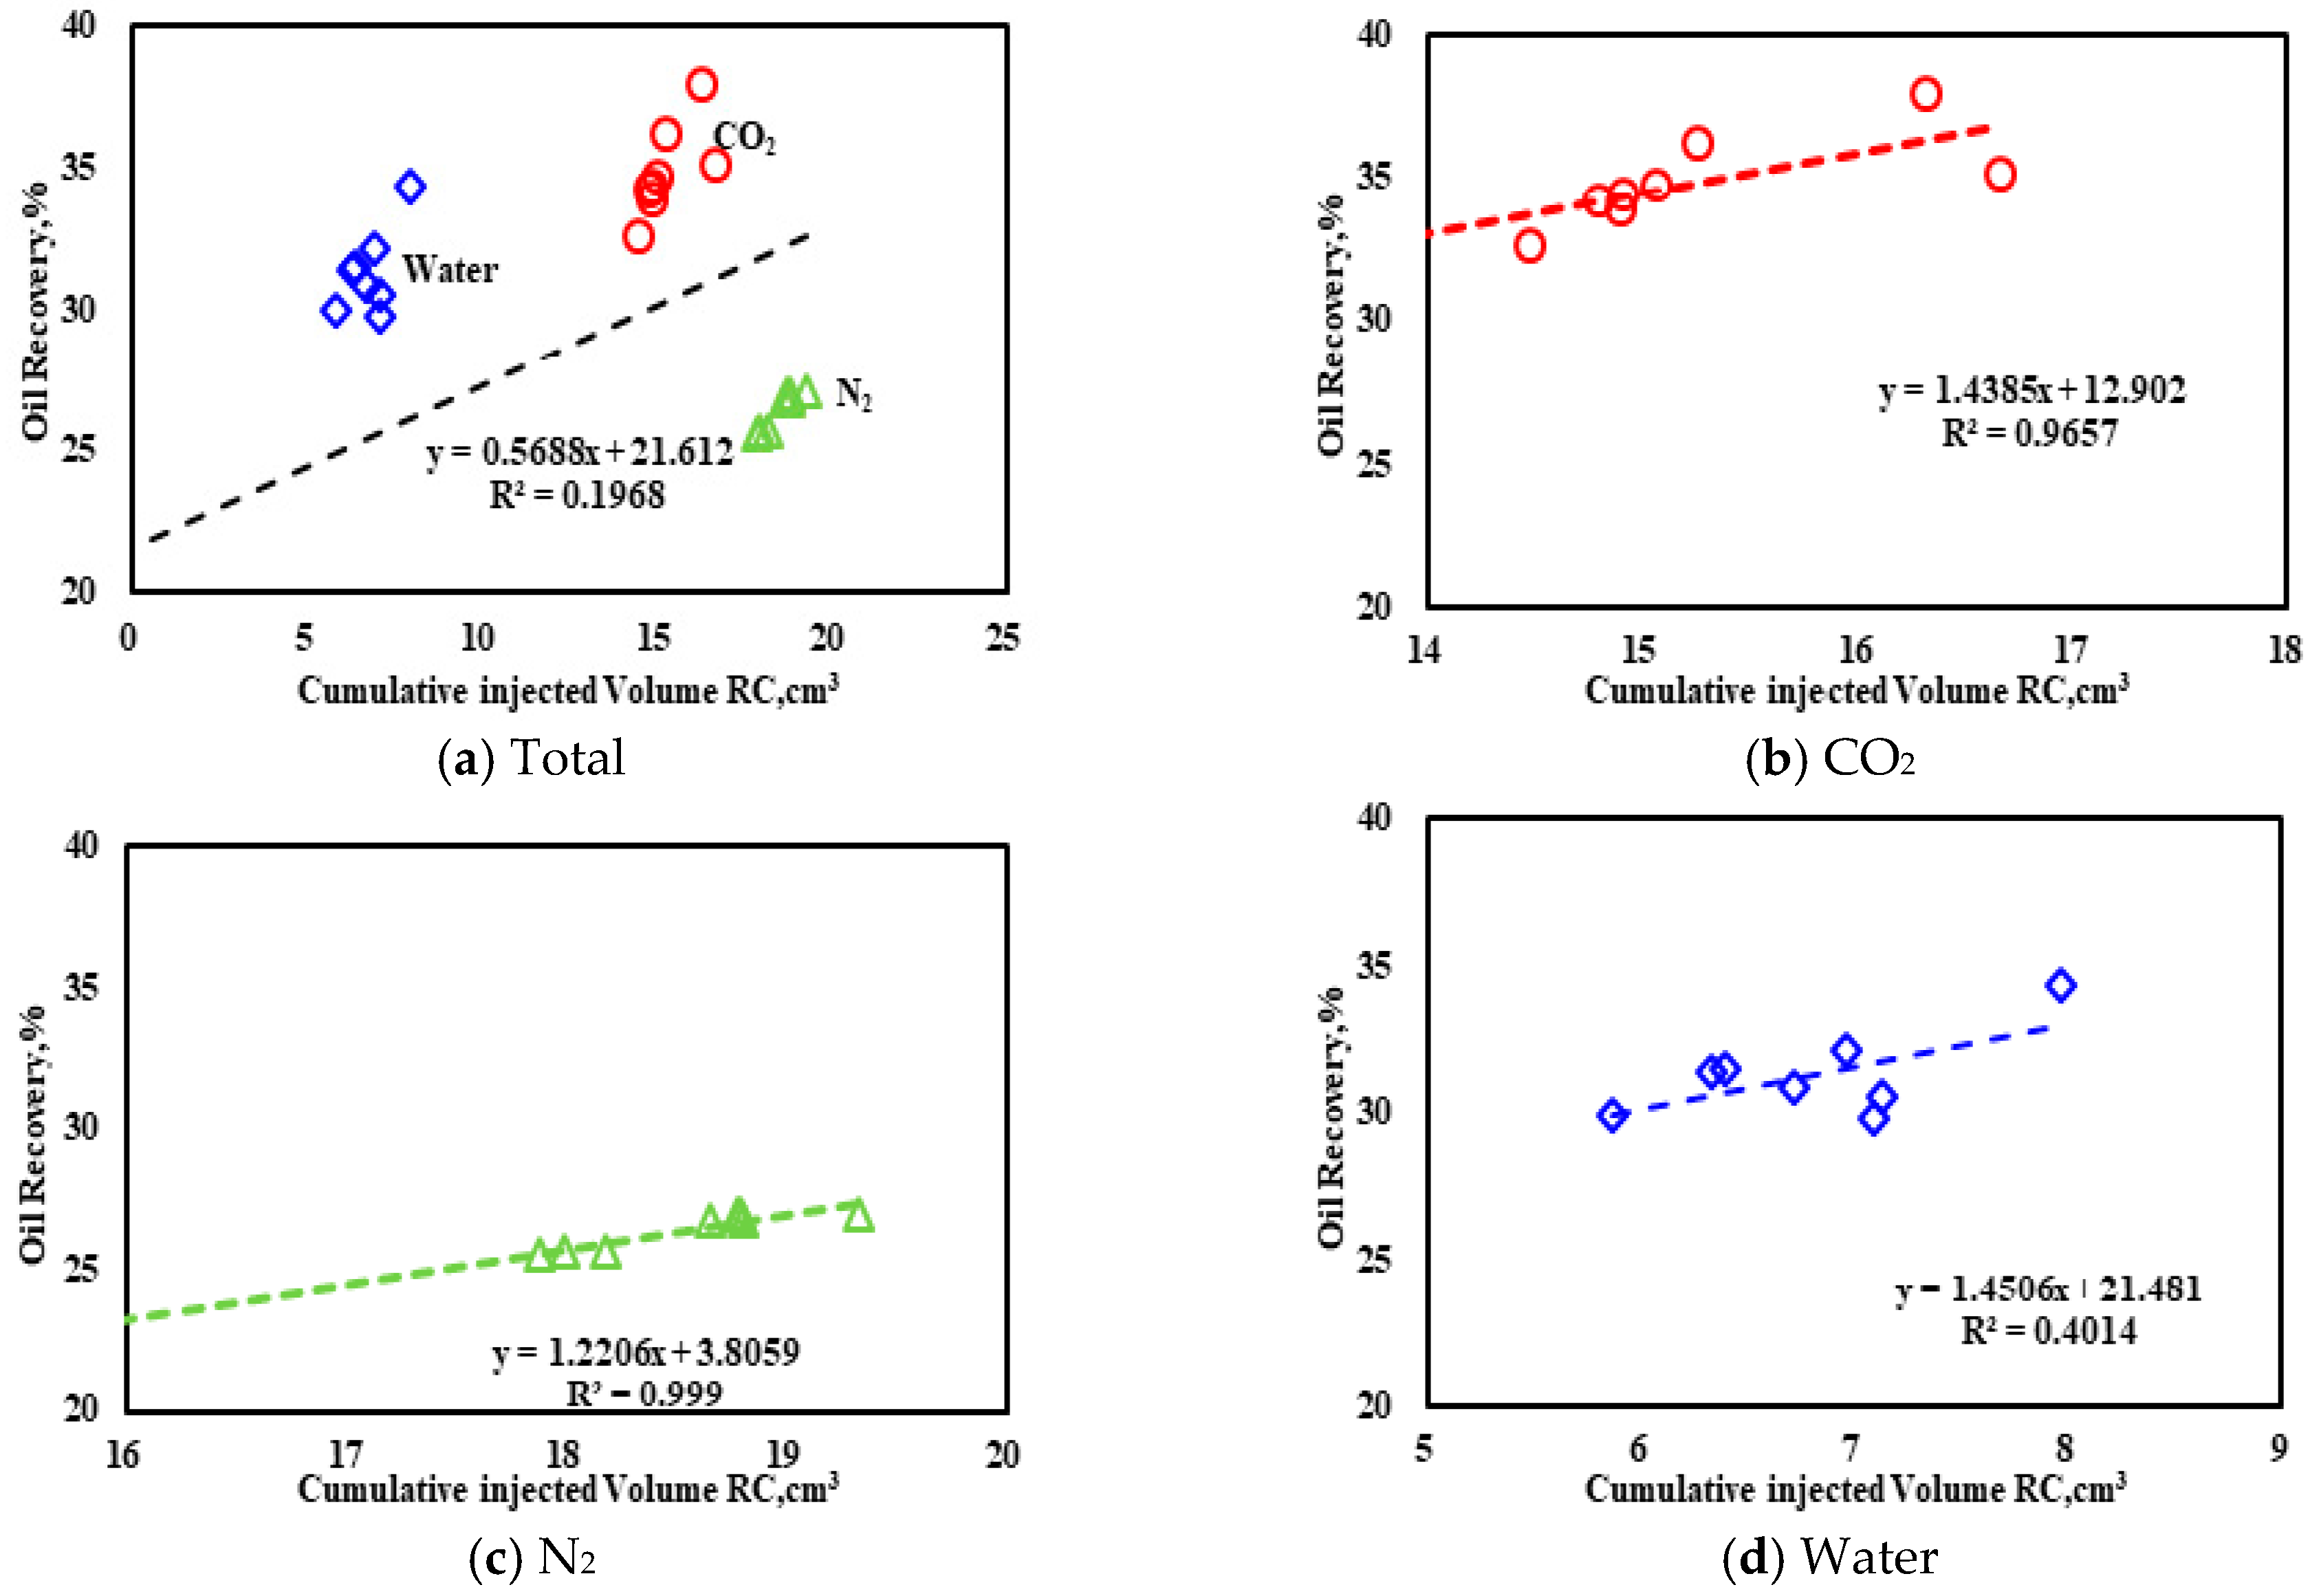
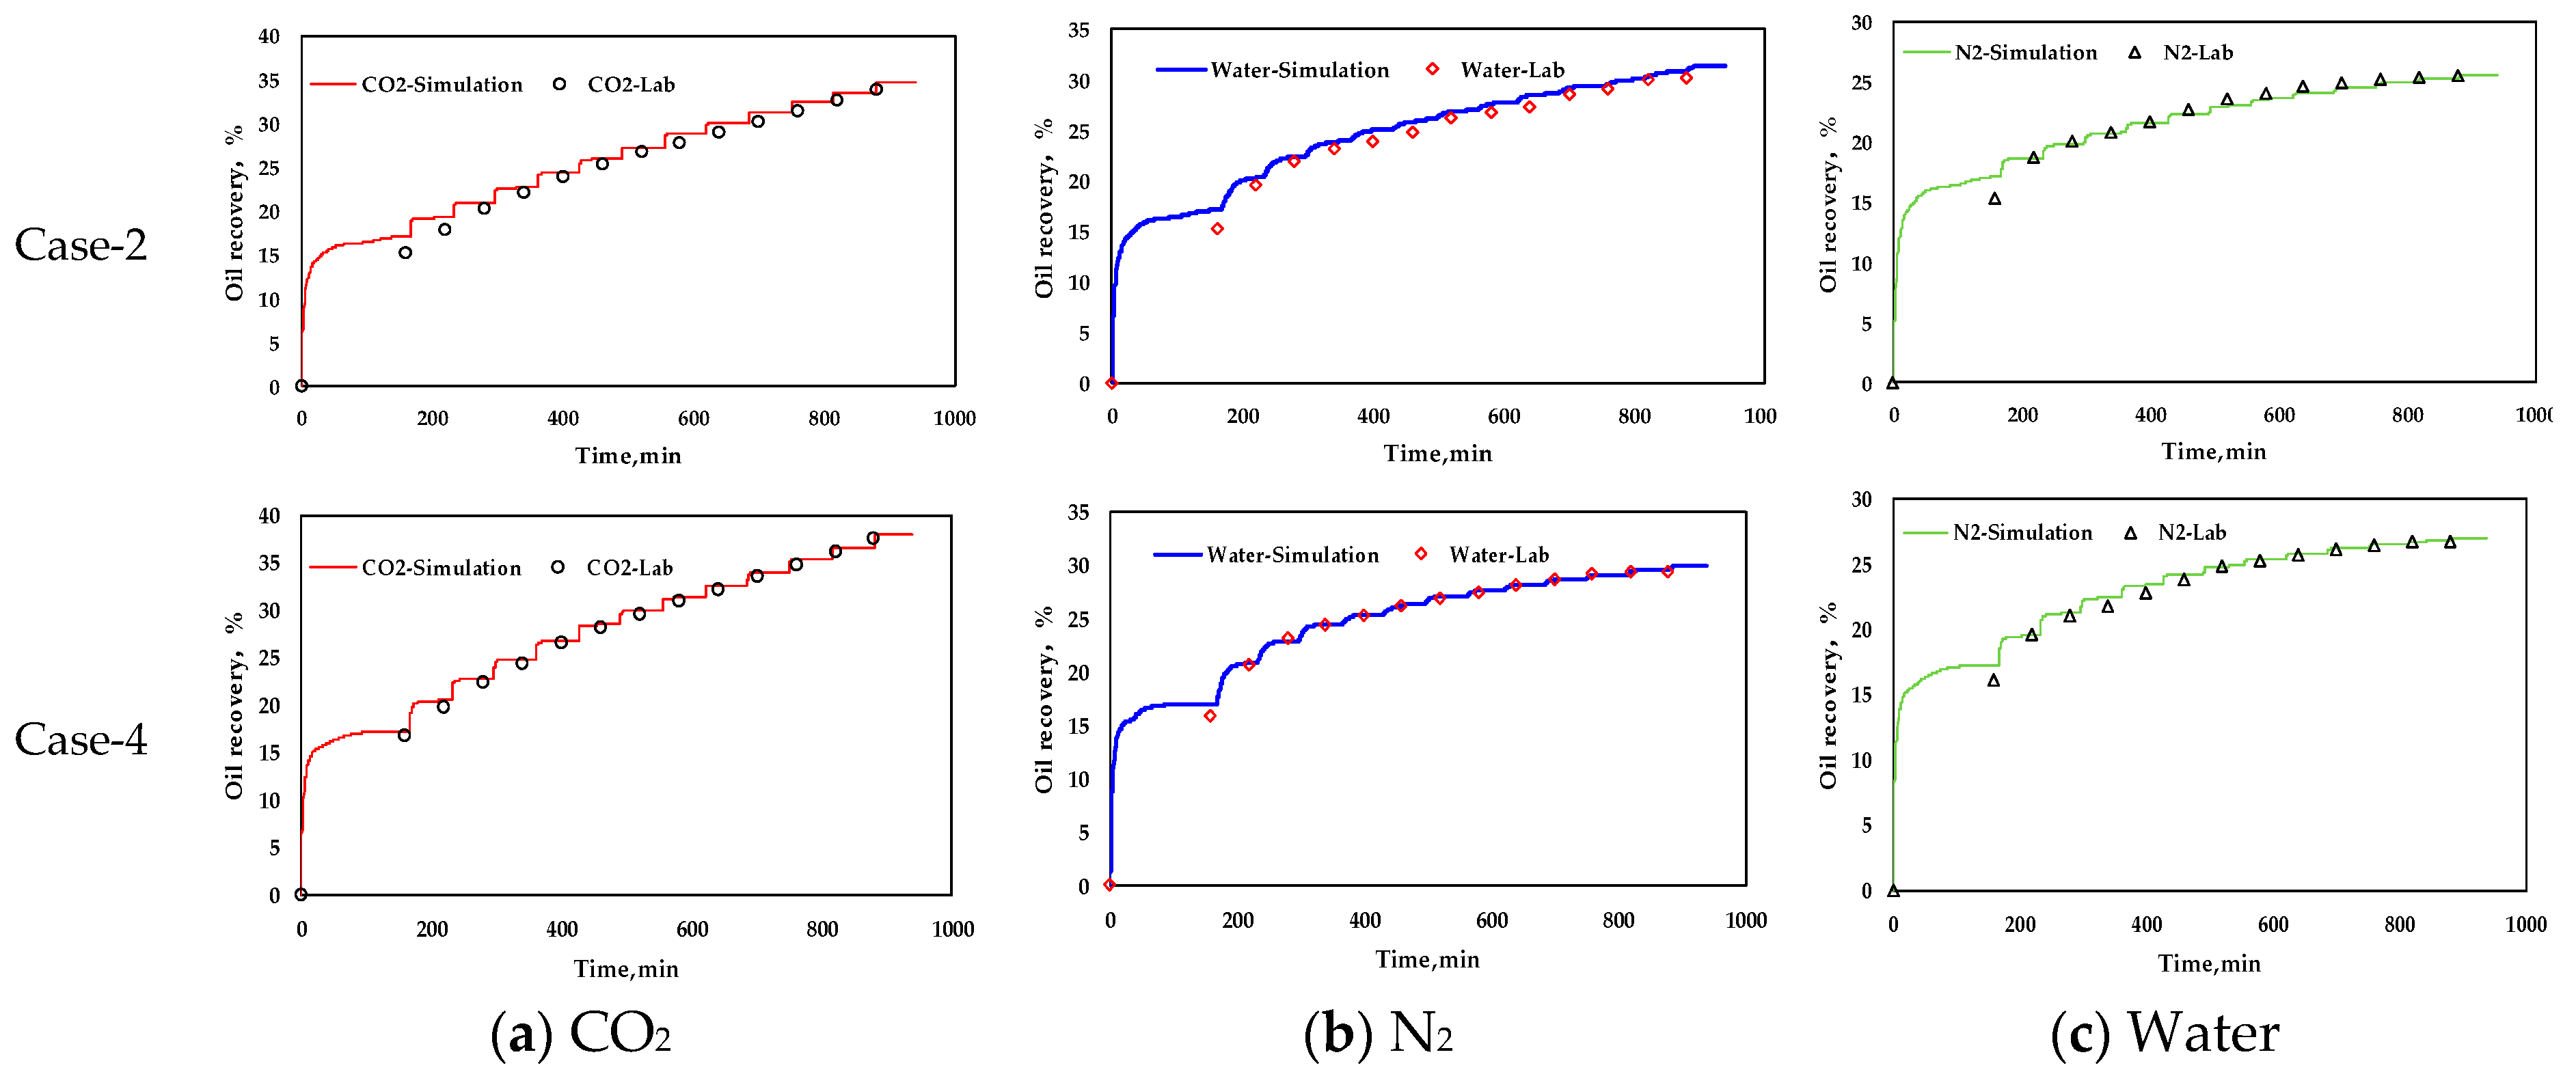
3.1.2. Comparison of CO2, N2 and Water as Injecting Fluids for Huff-n-puff
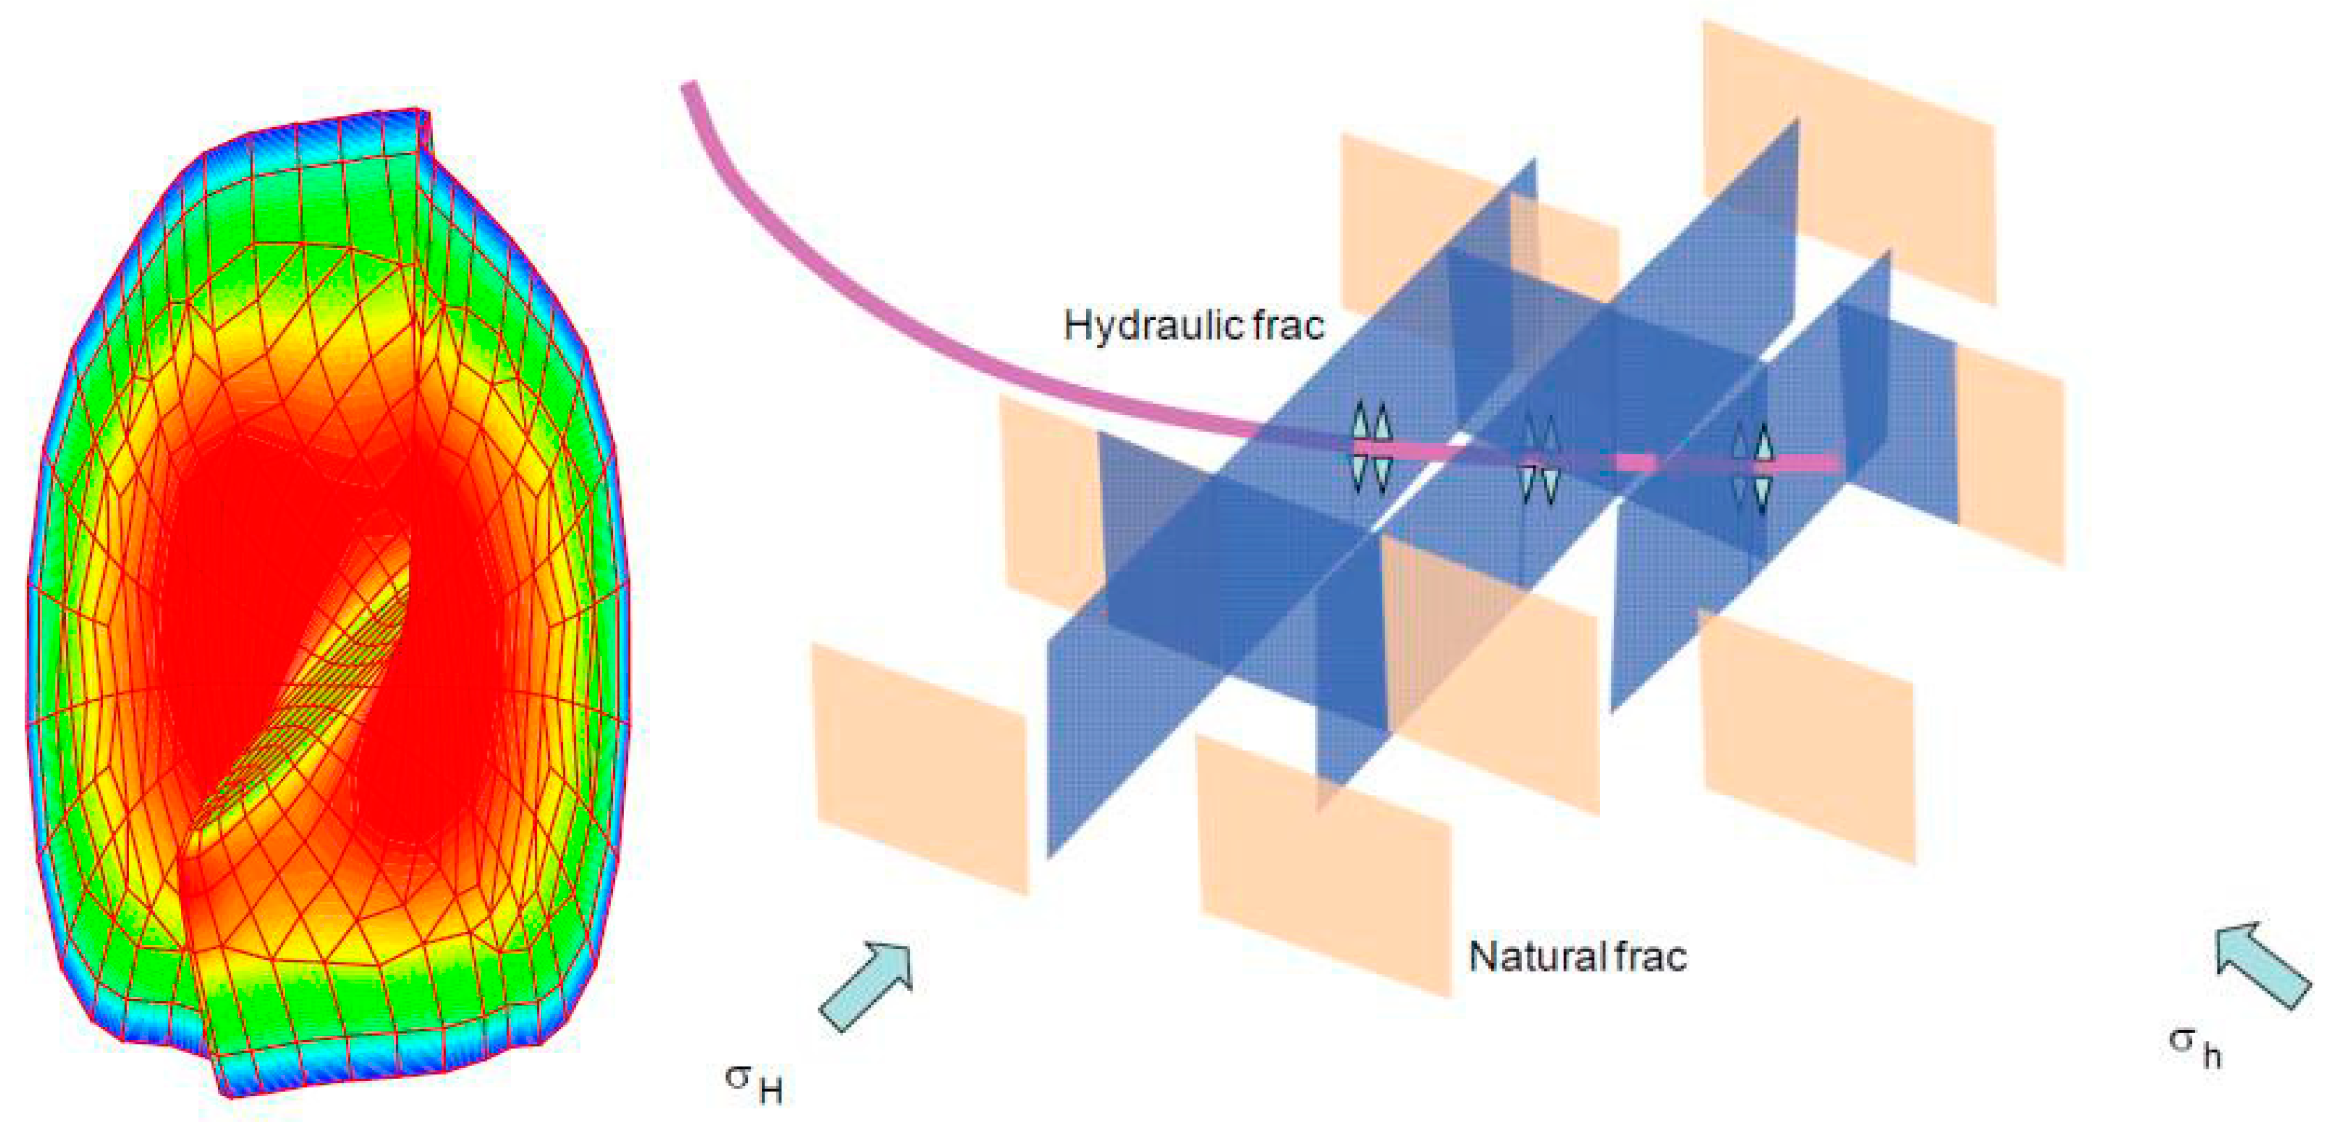
3.2. Fracture Characteristics
3.2.1. Scattered Pattern of Fractures
3.2.2. Direction of Scattered Fracture (with Kv = 0.2)
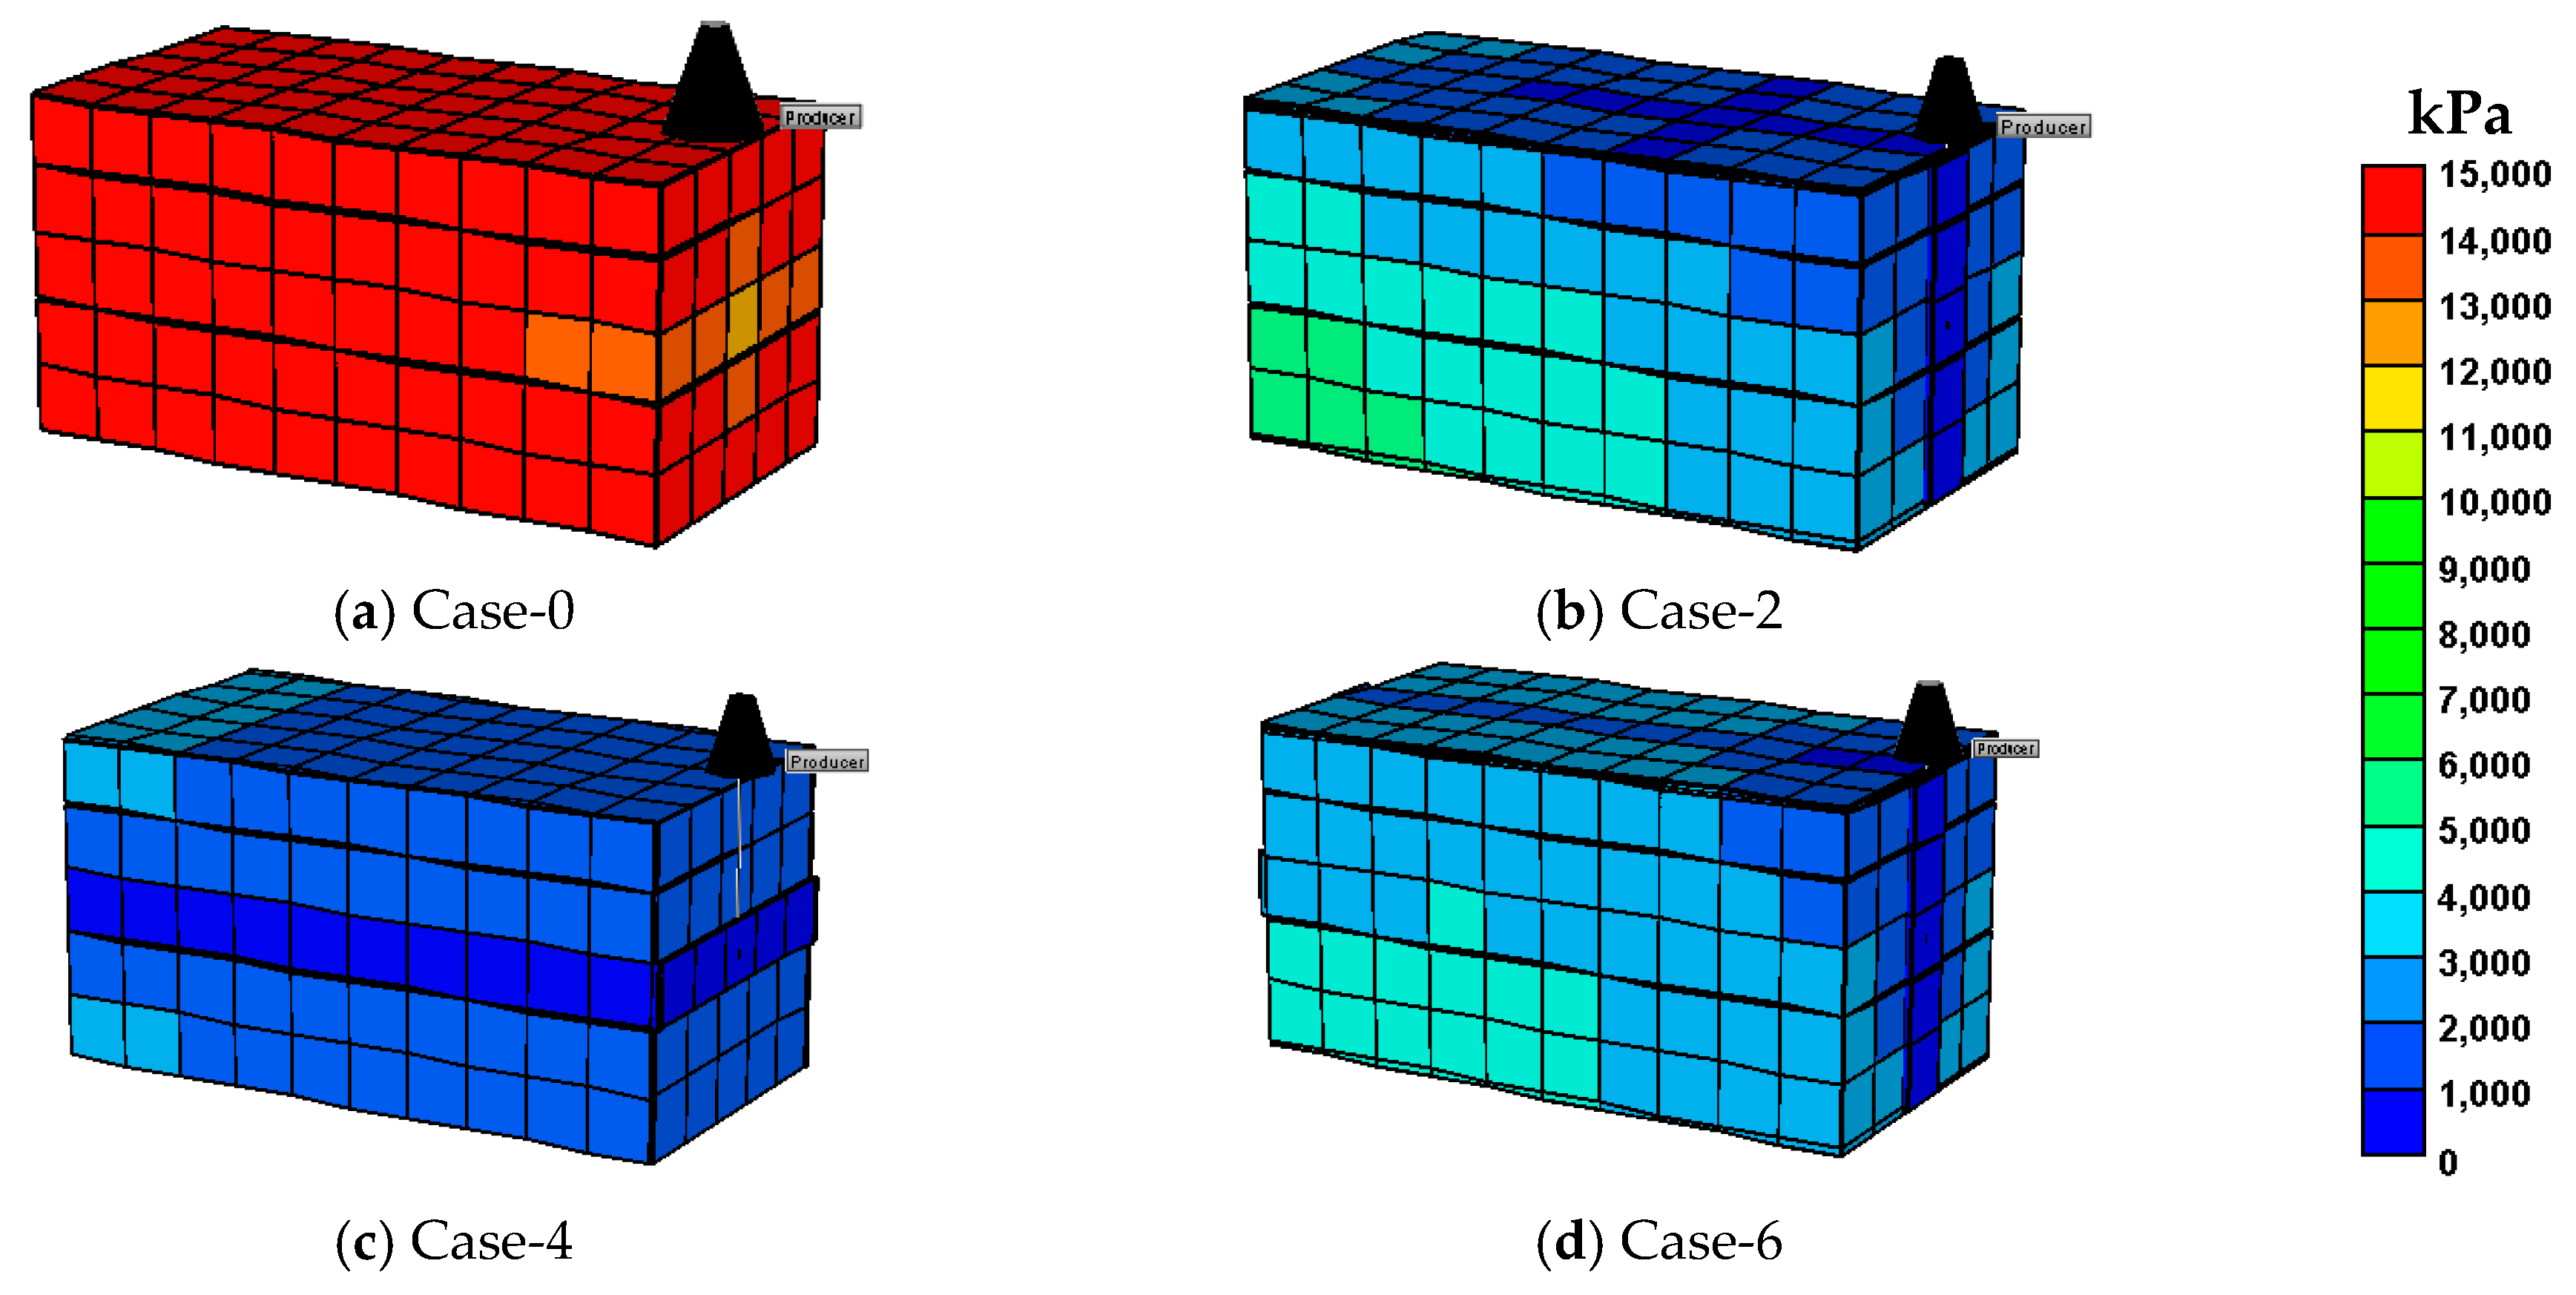
3.2.3. Fracture Near Well and Far Well
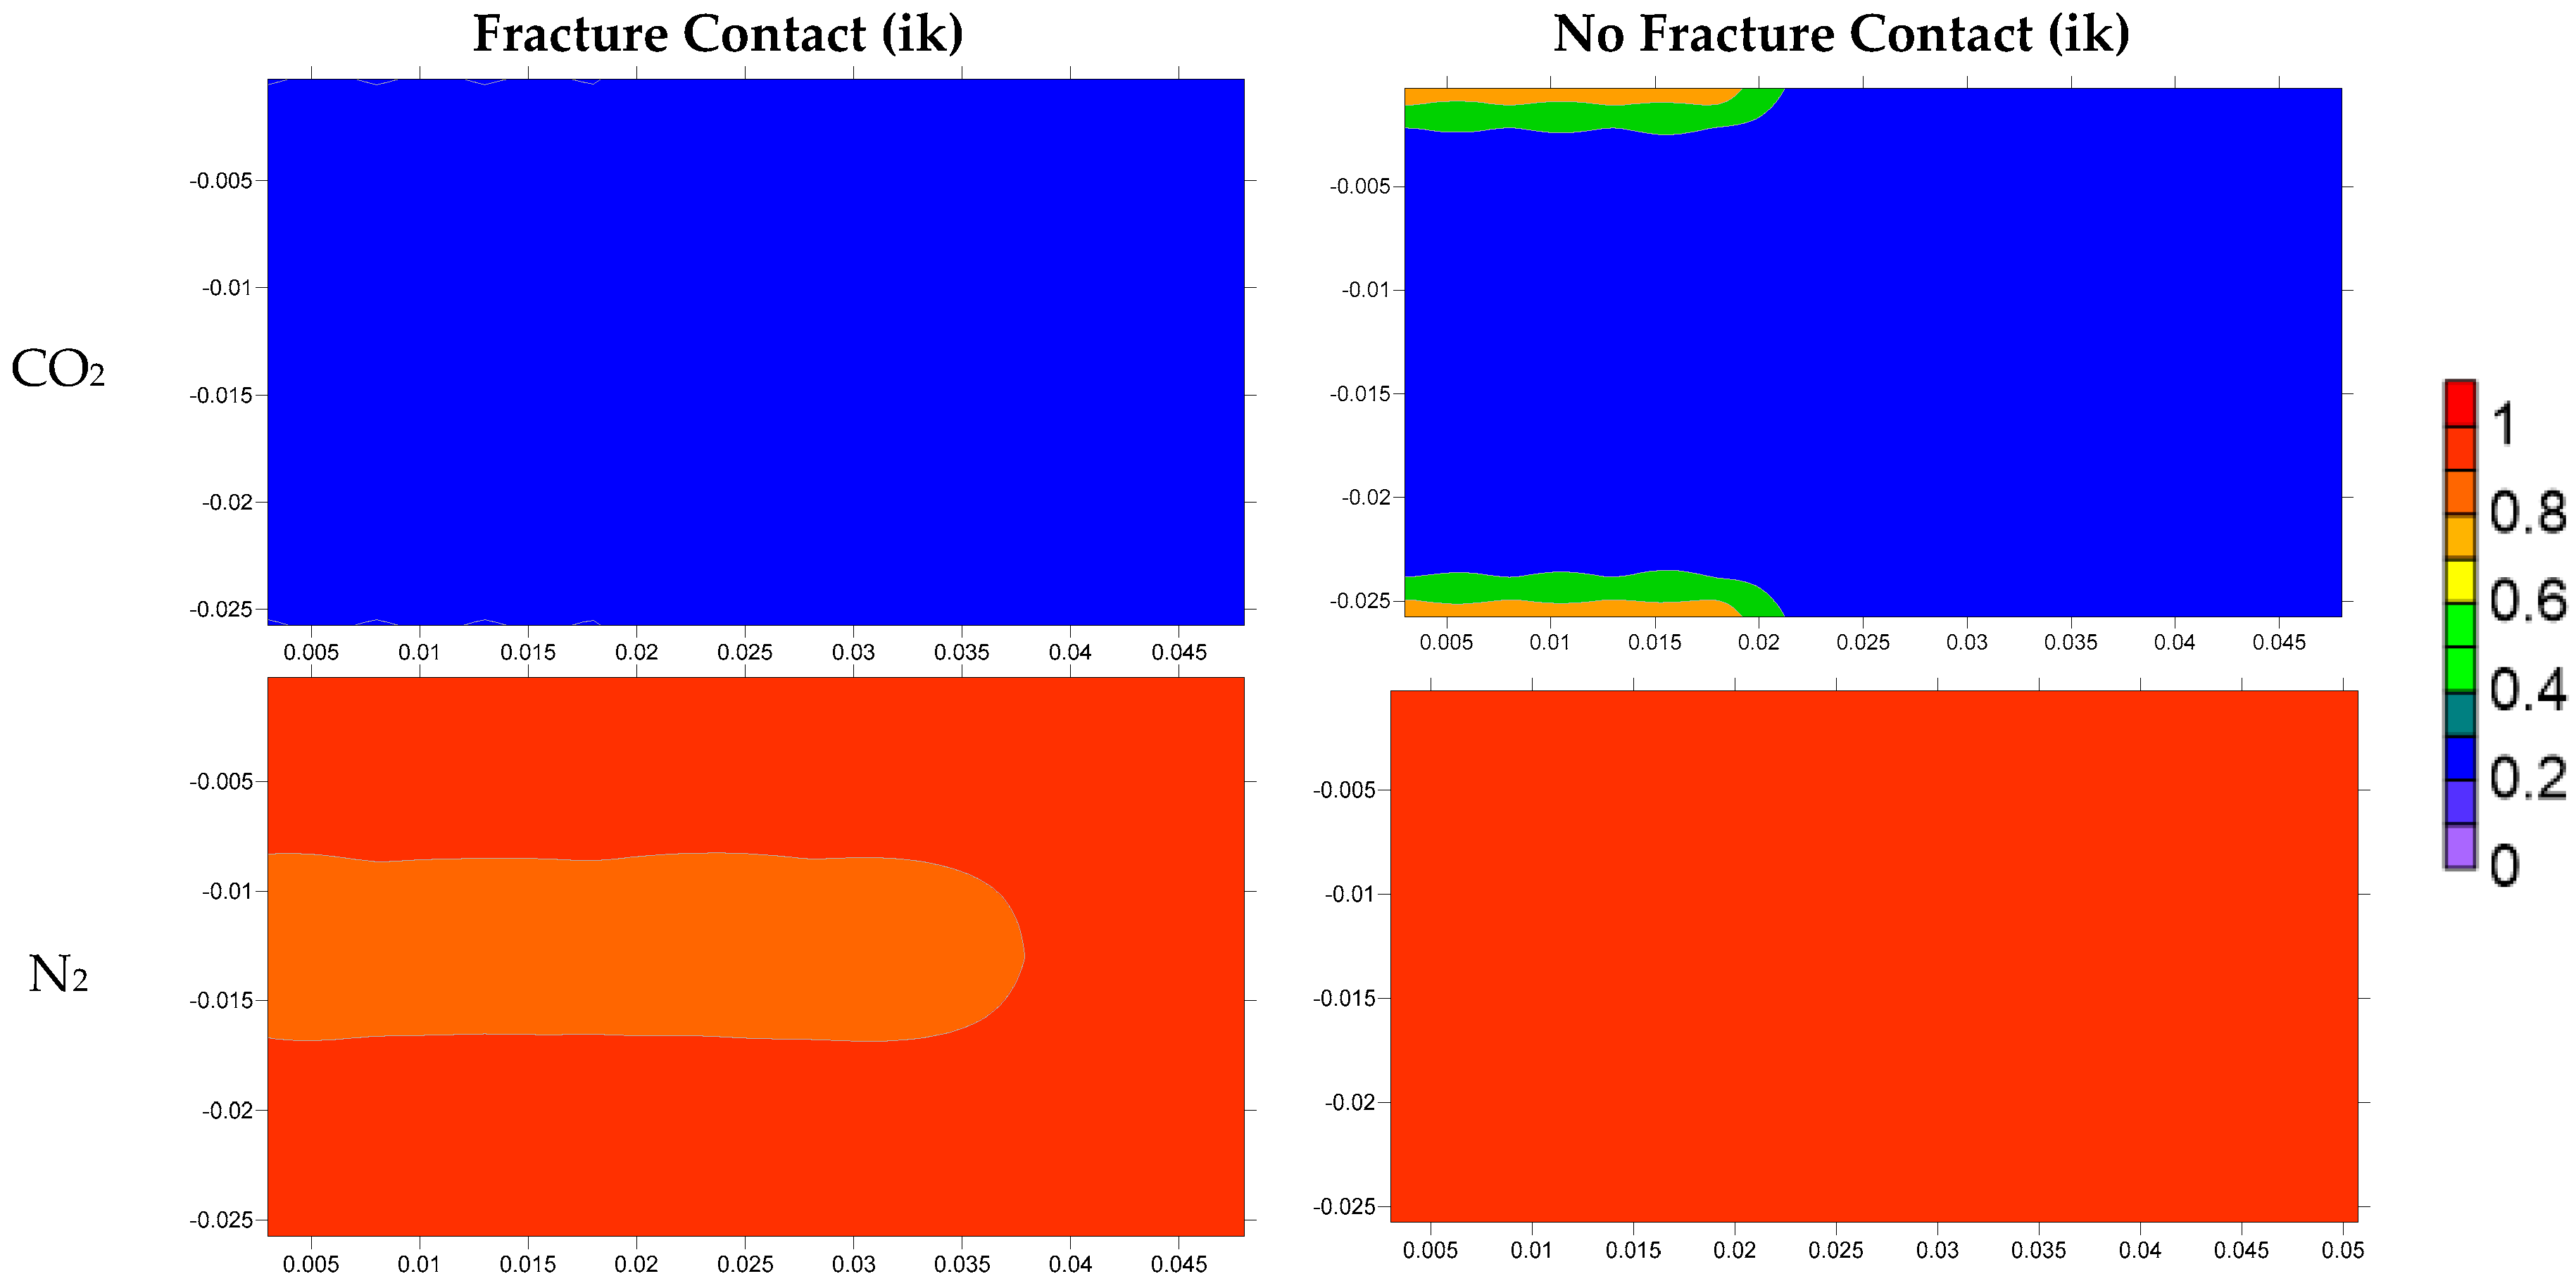
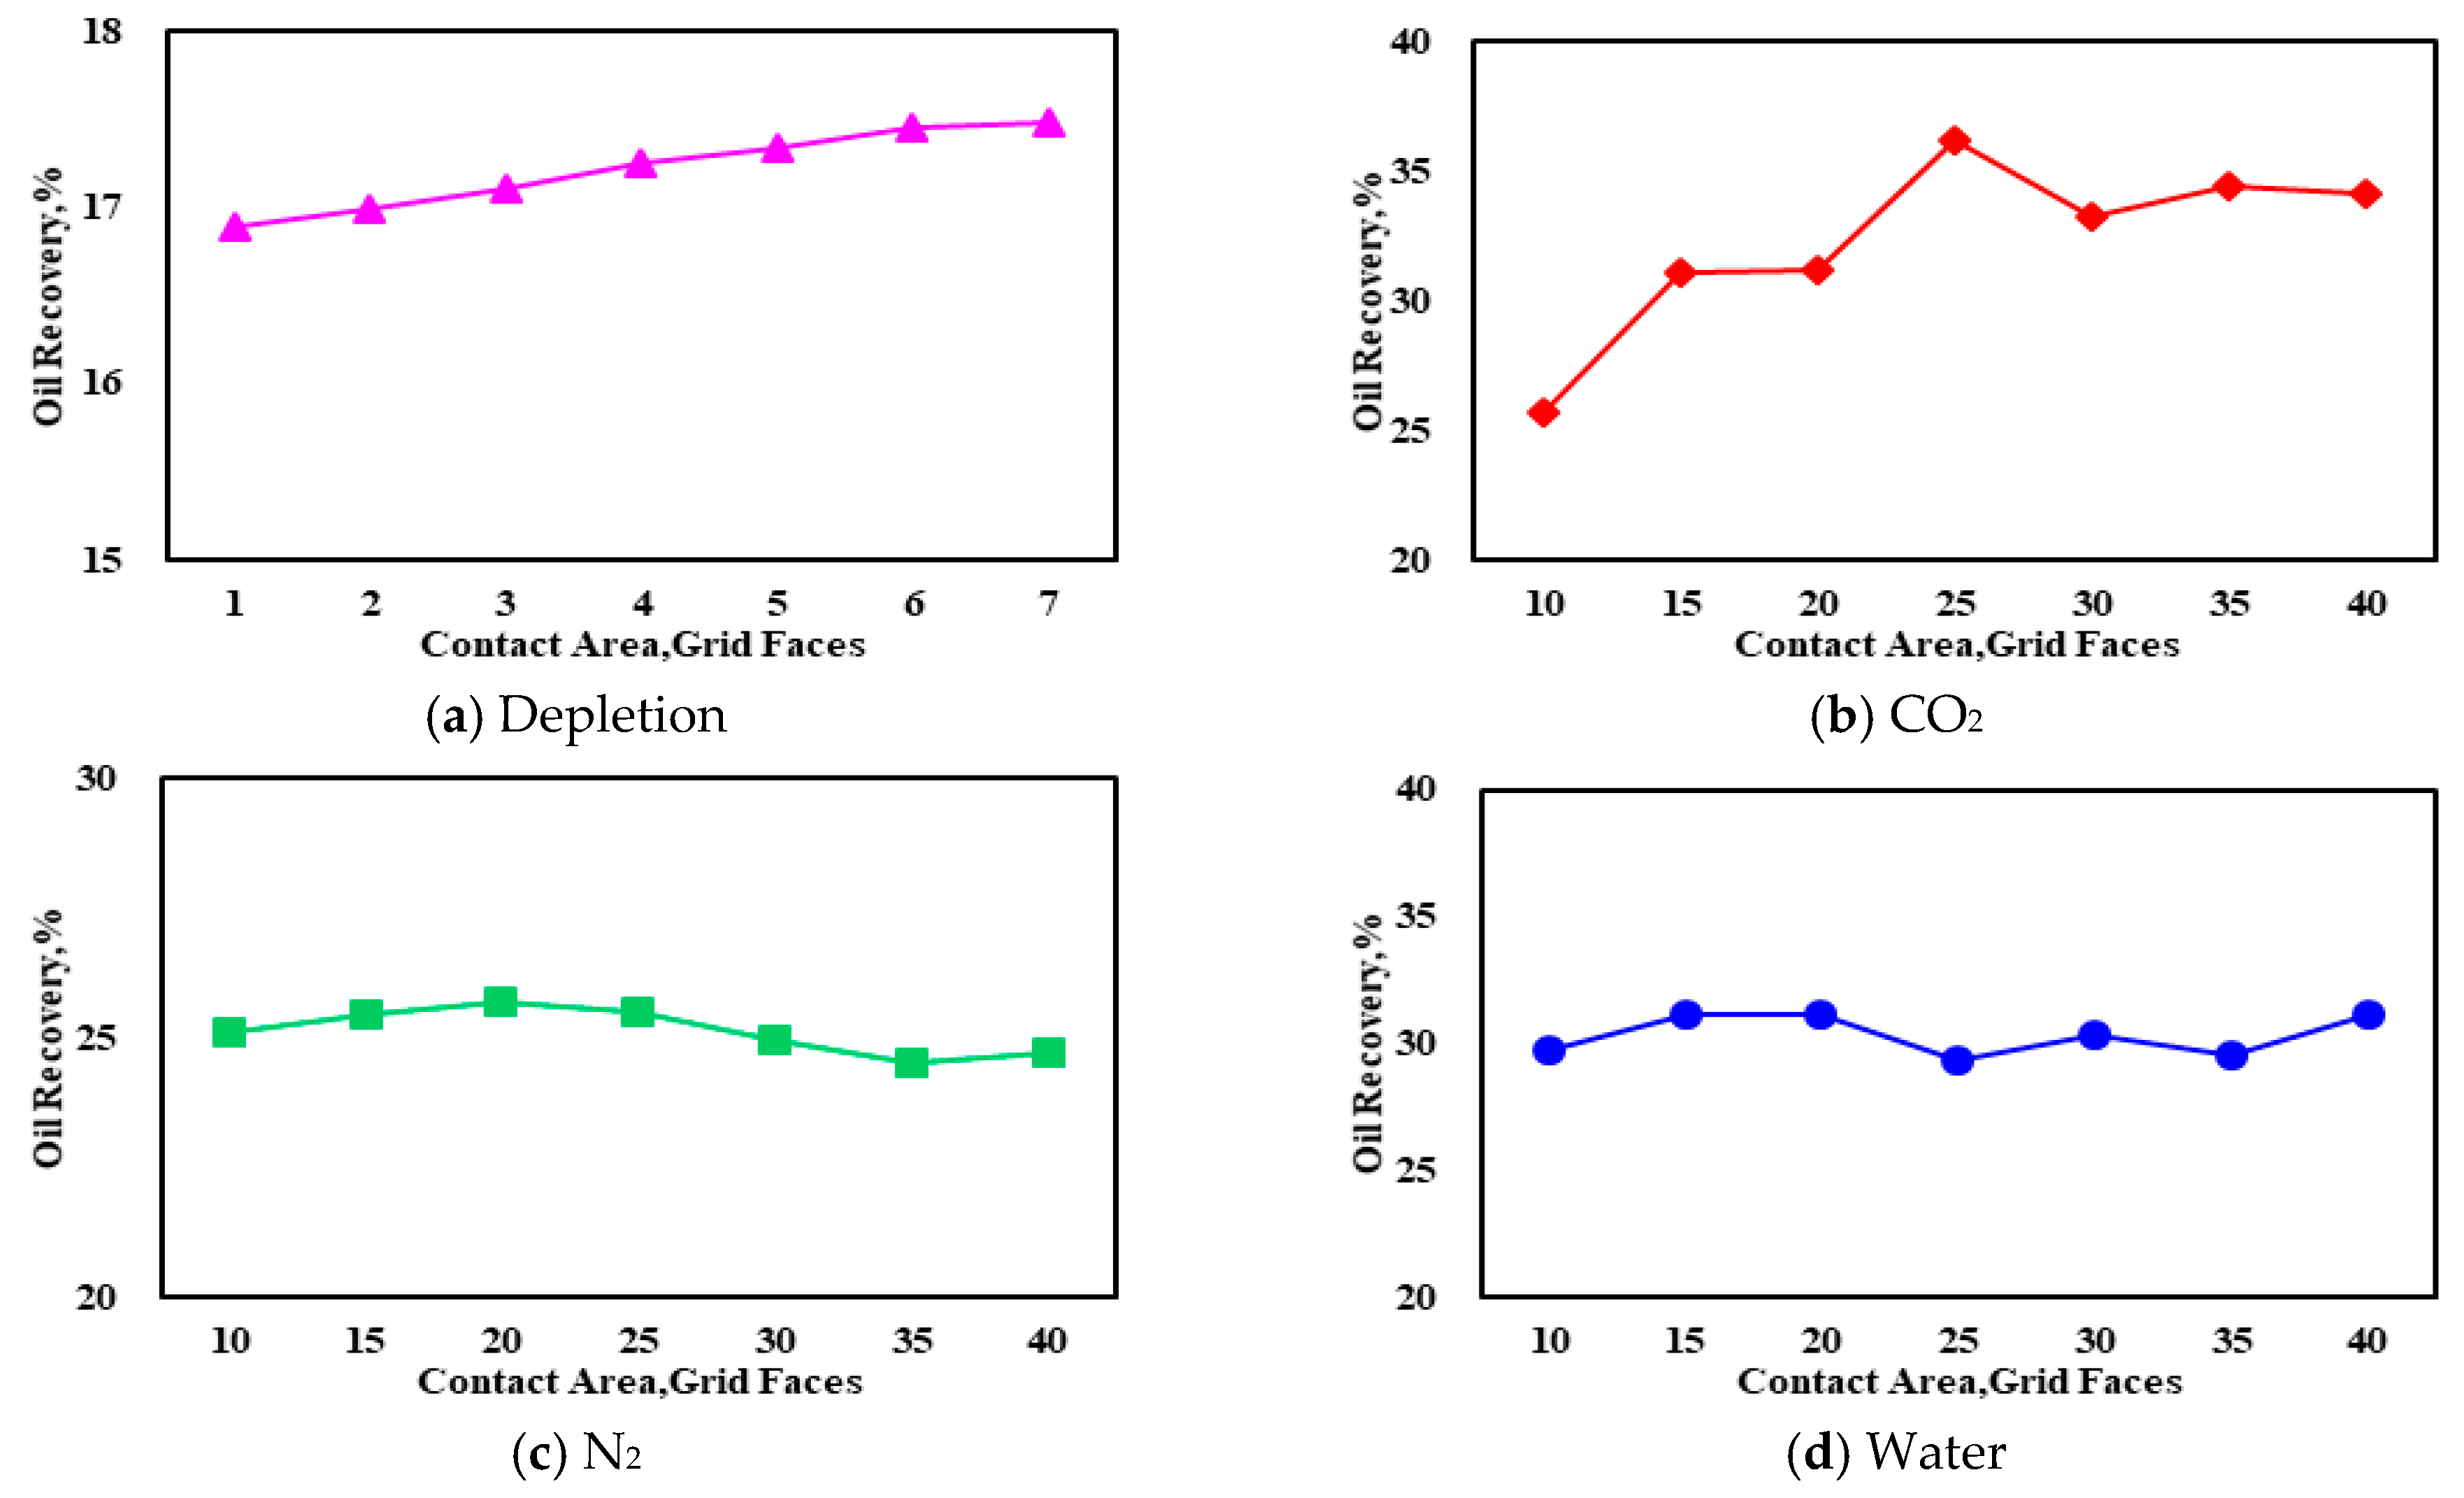
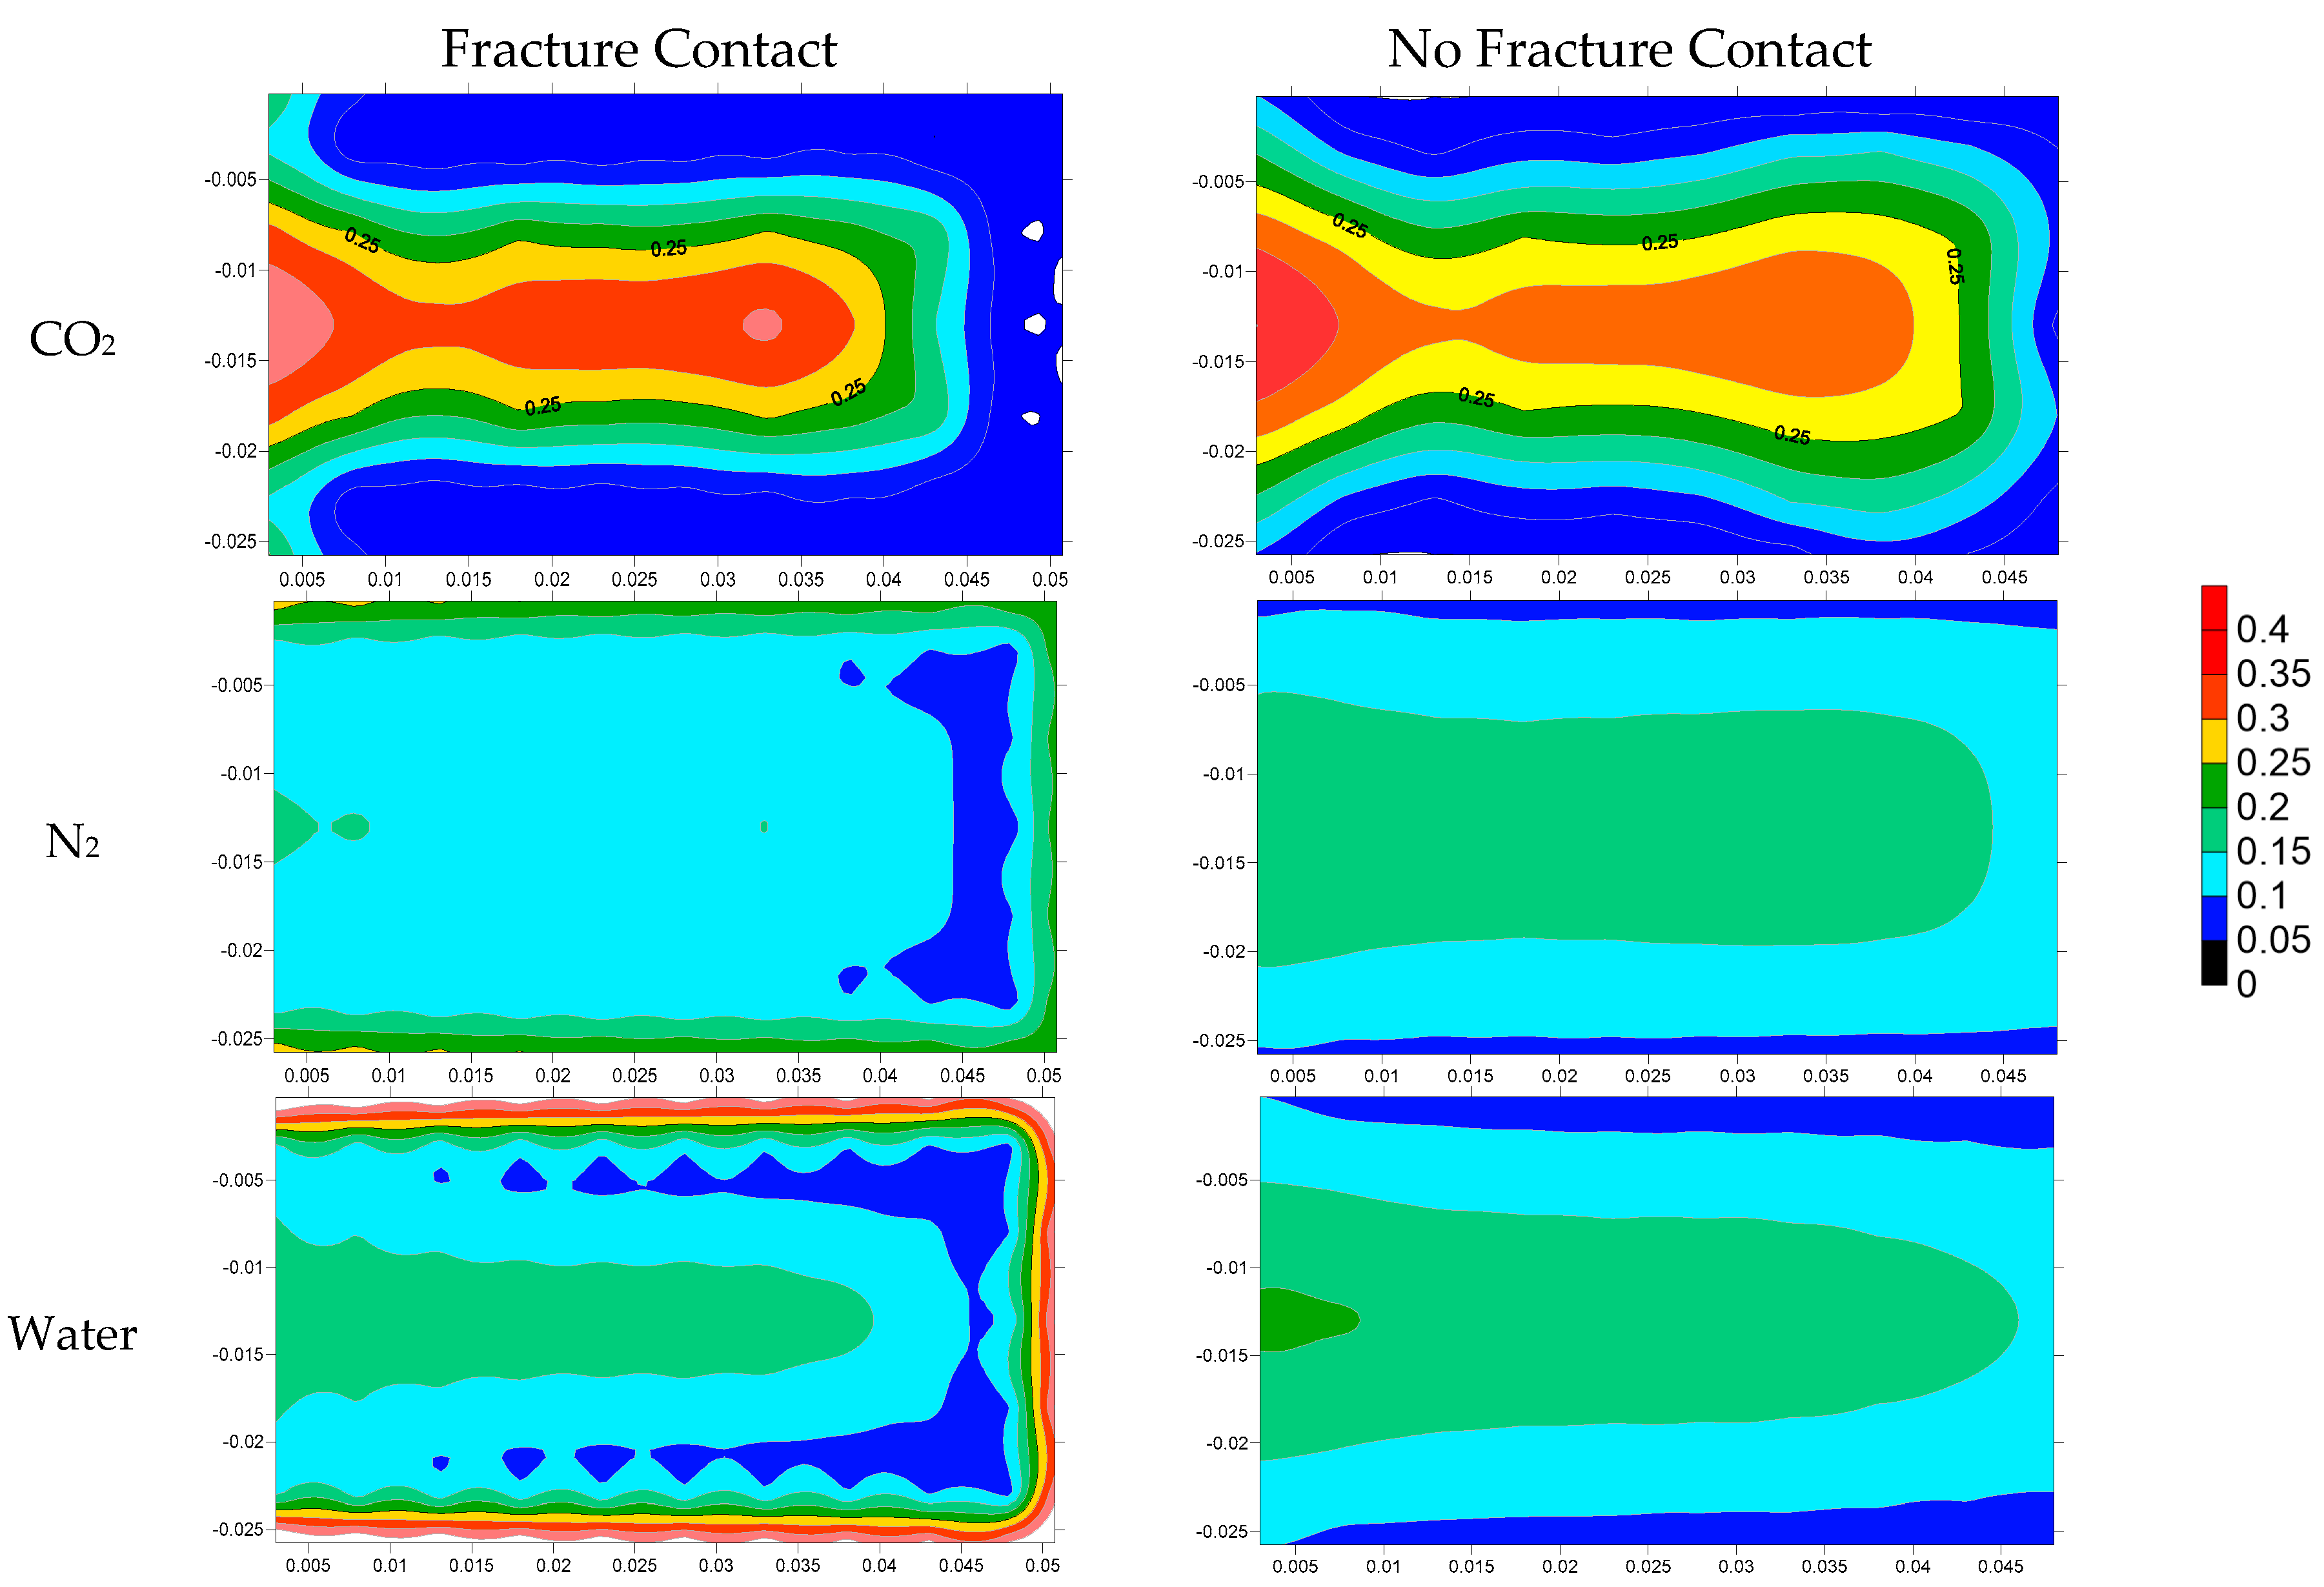
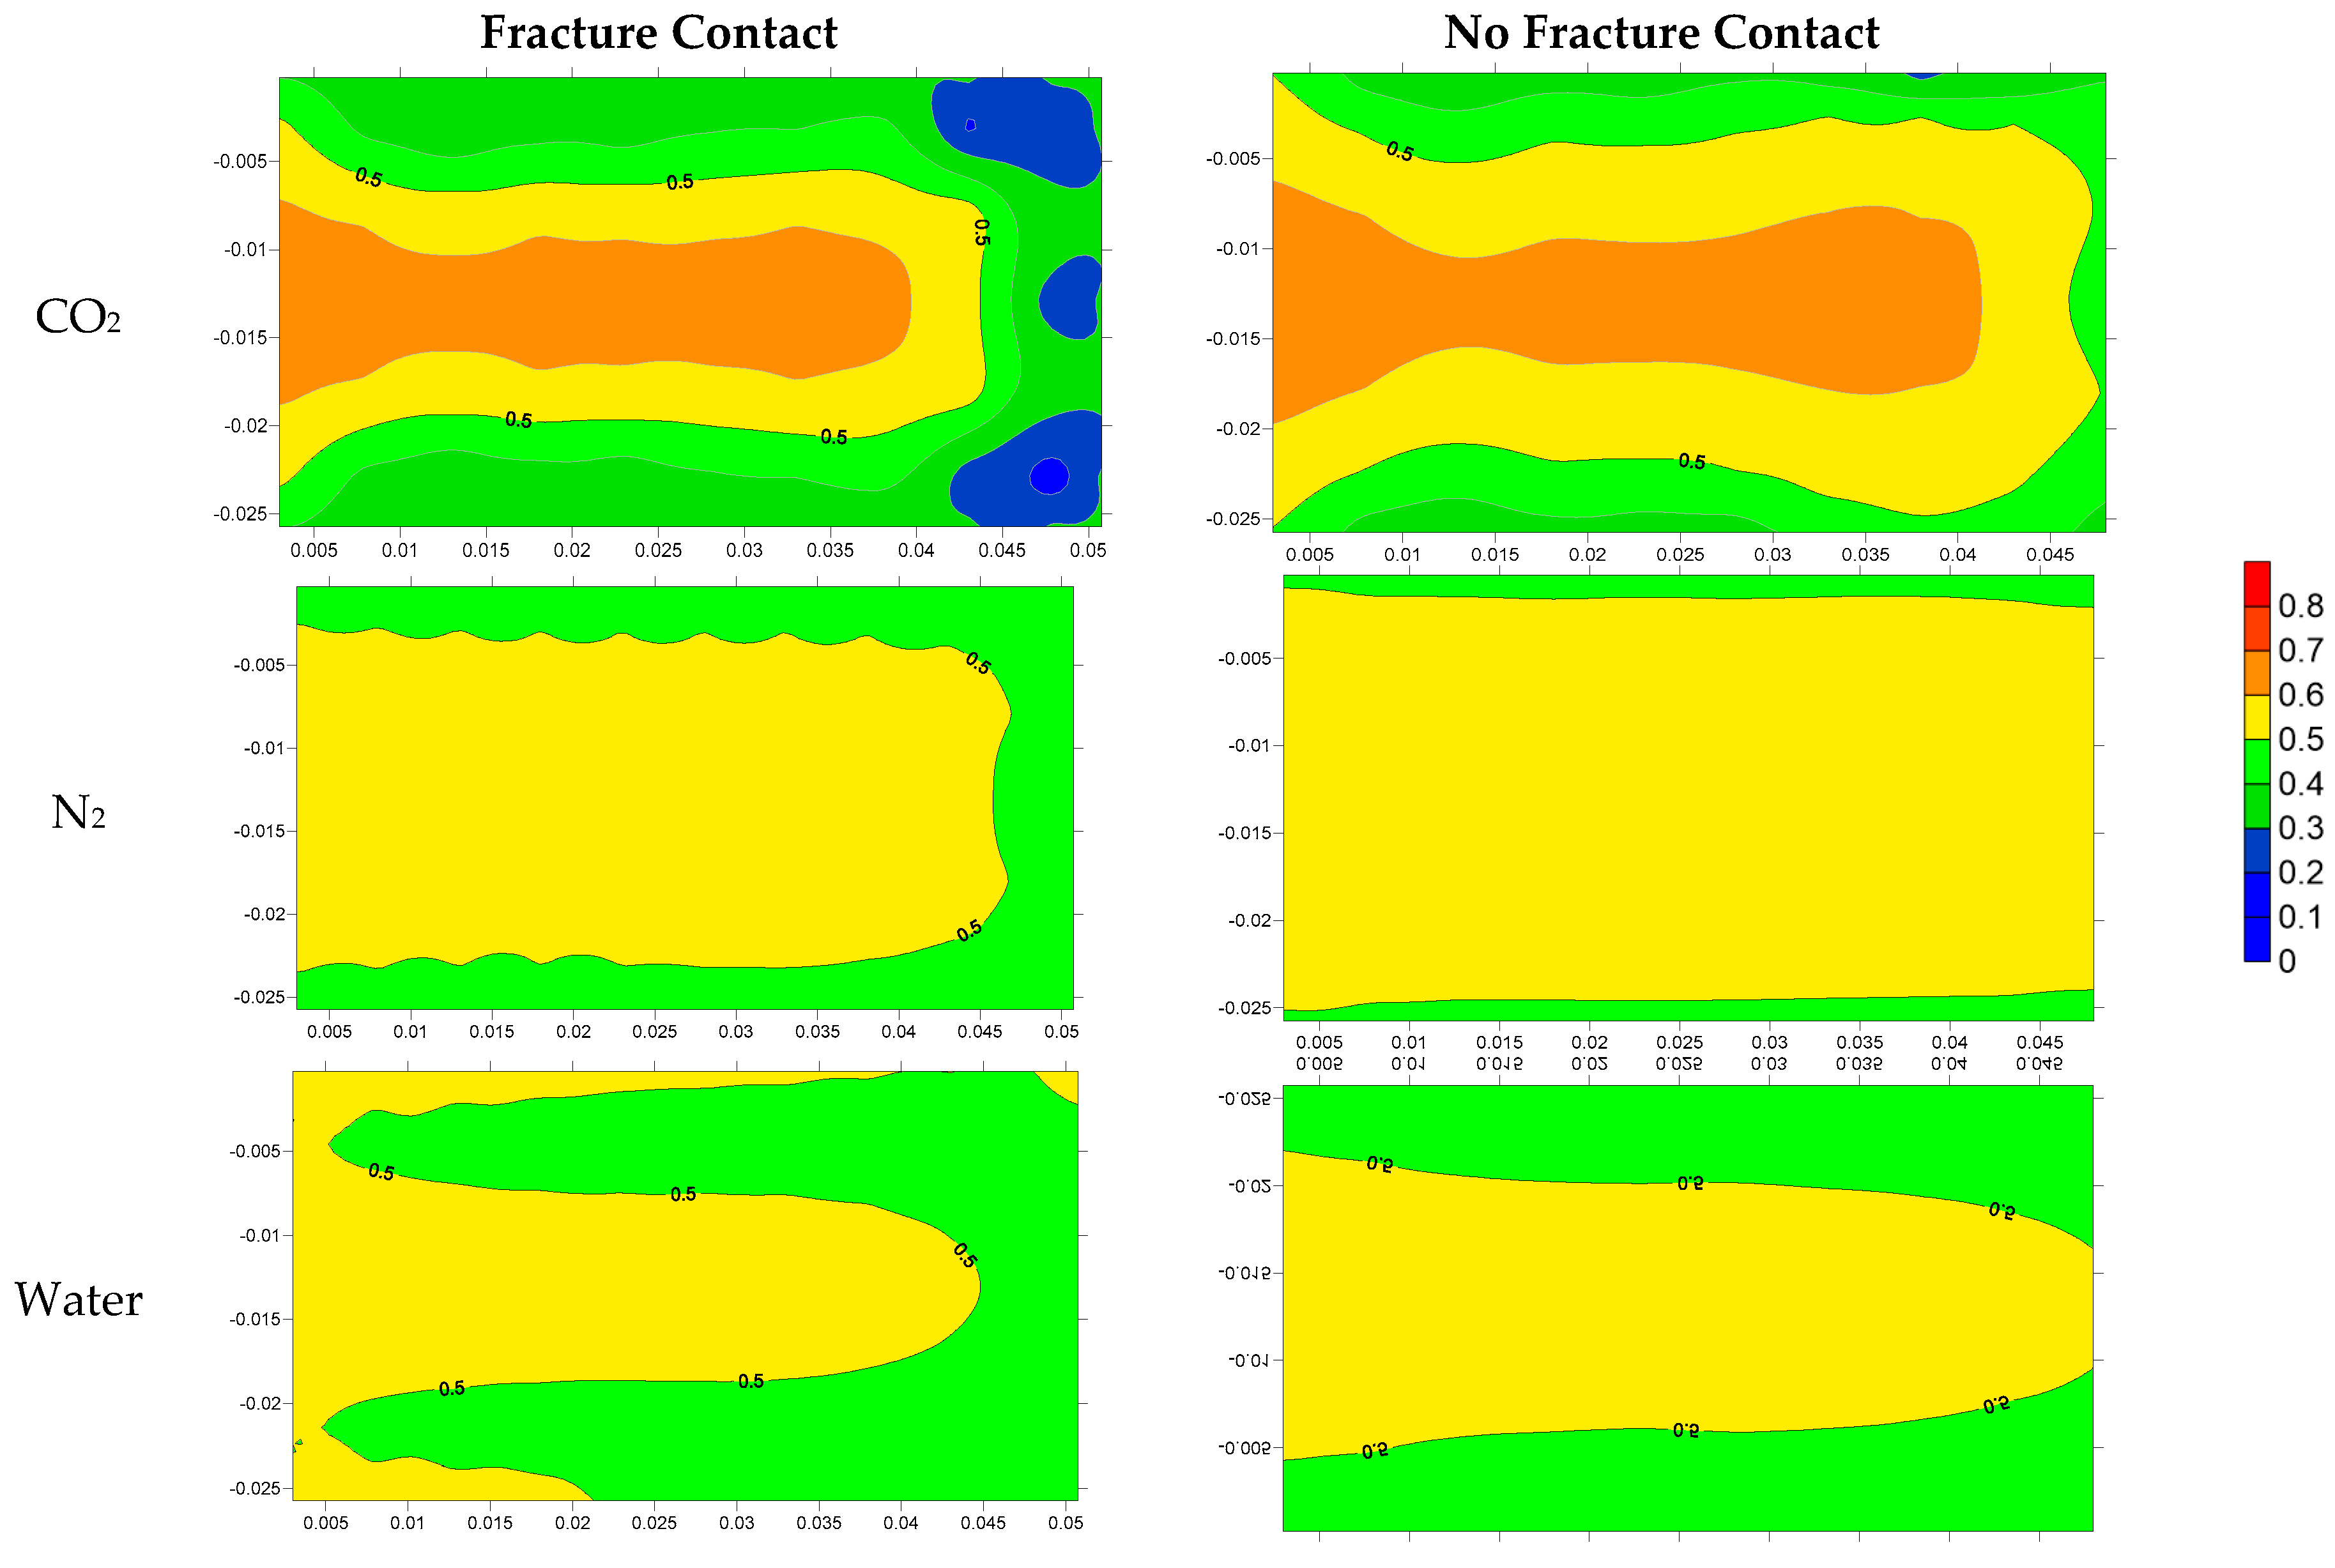
3.2.4. Fracture Contact Area
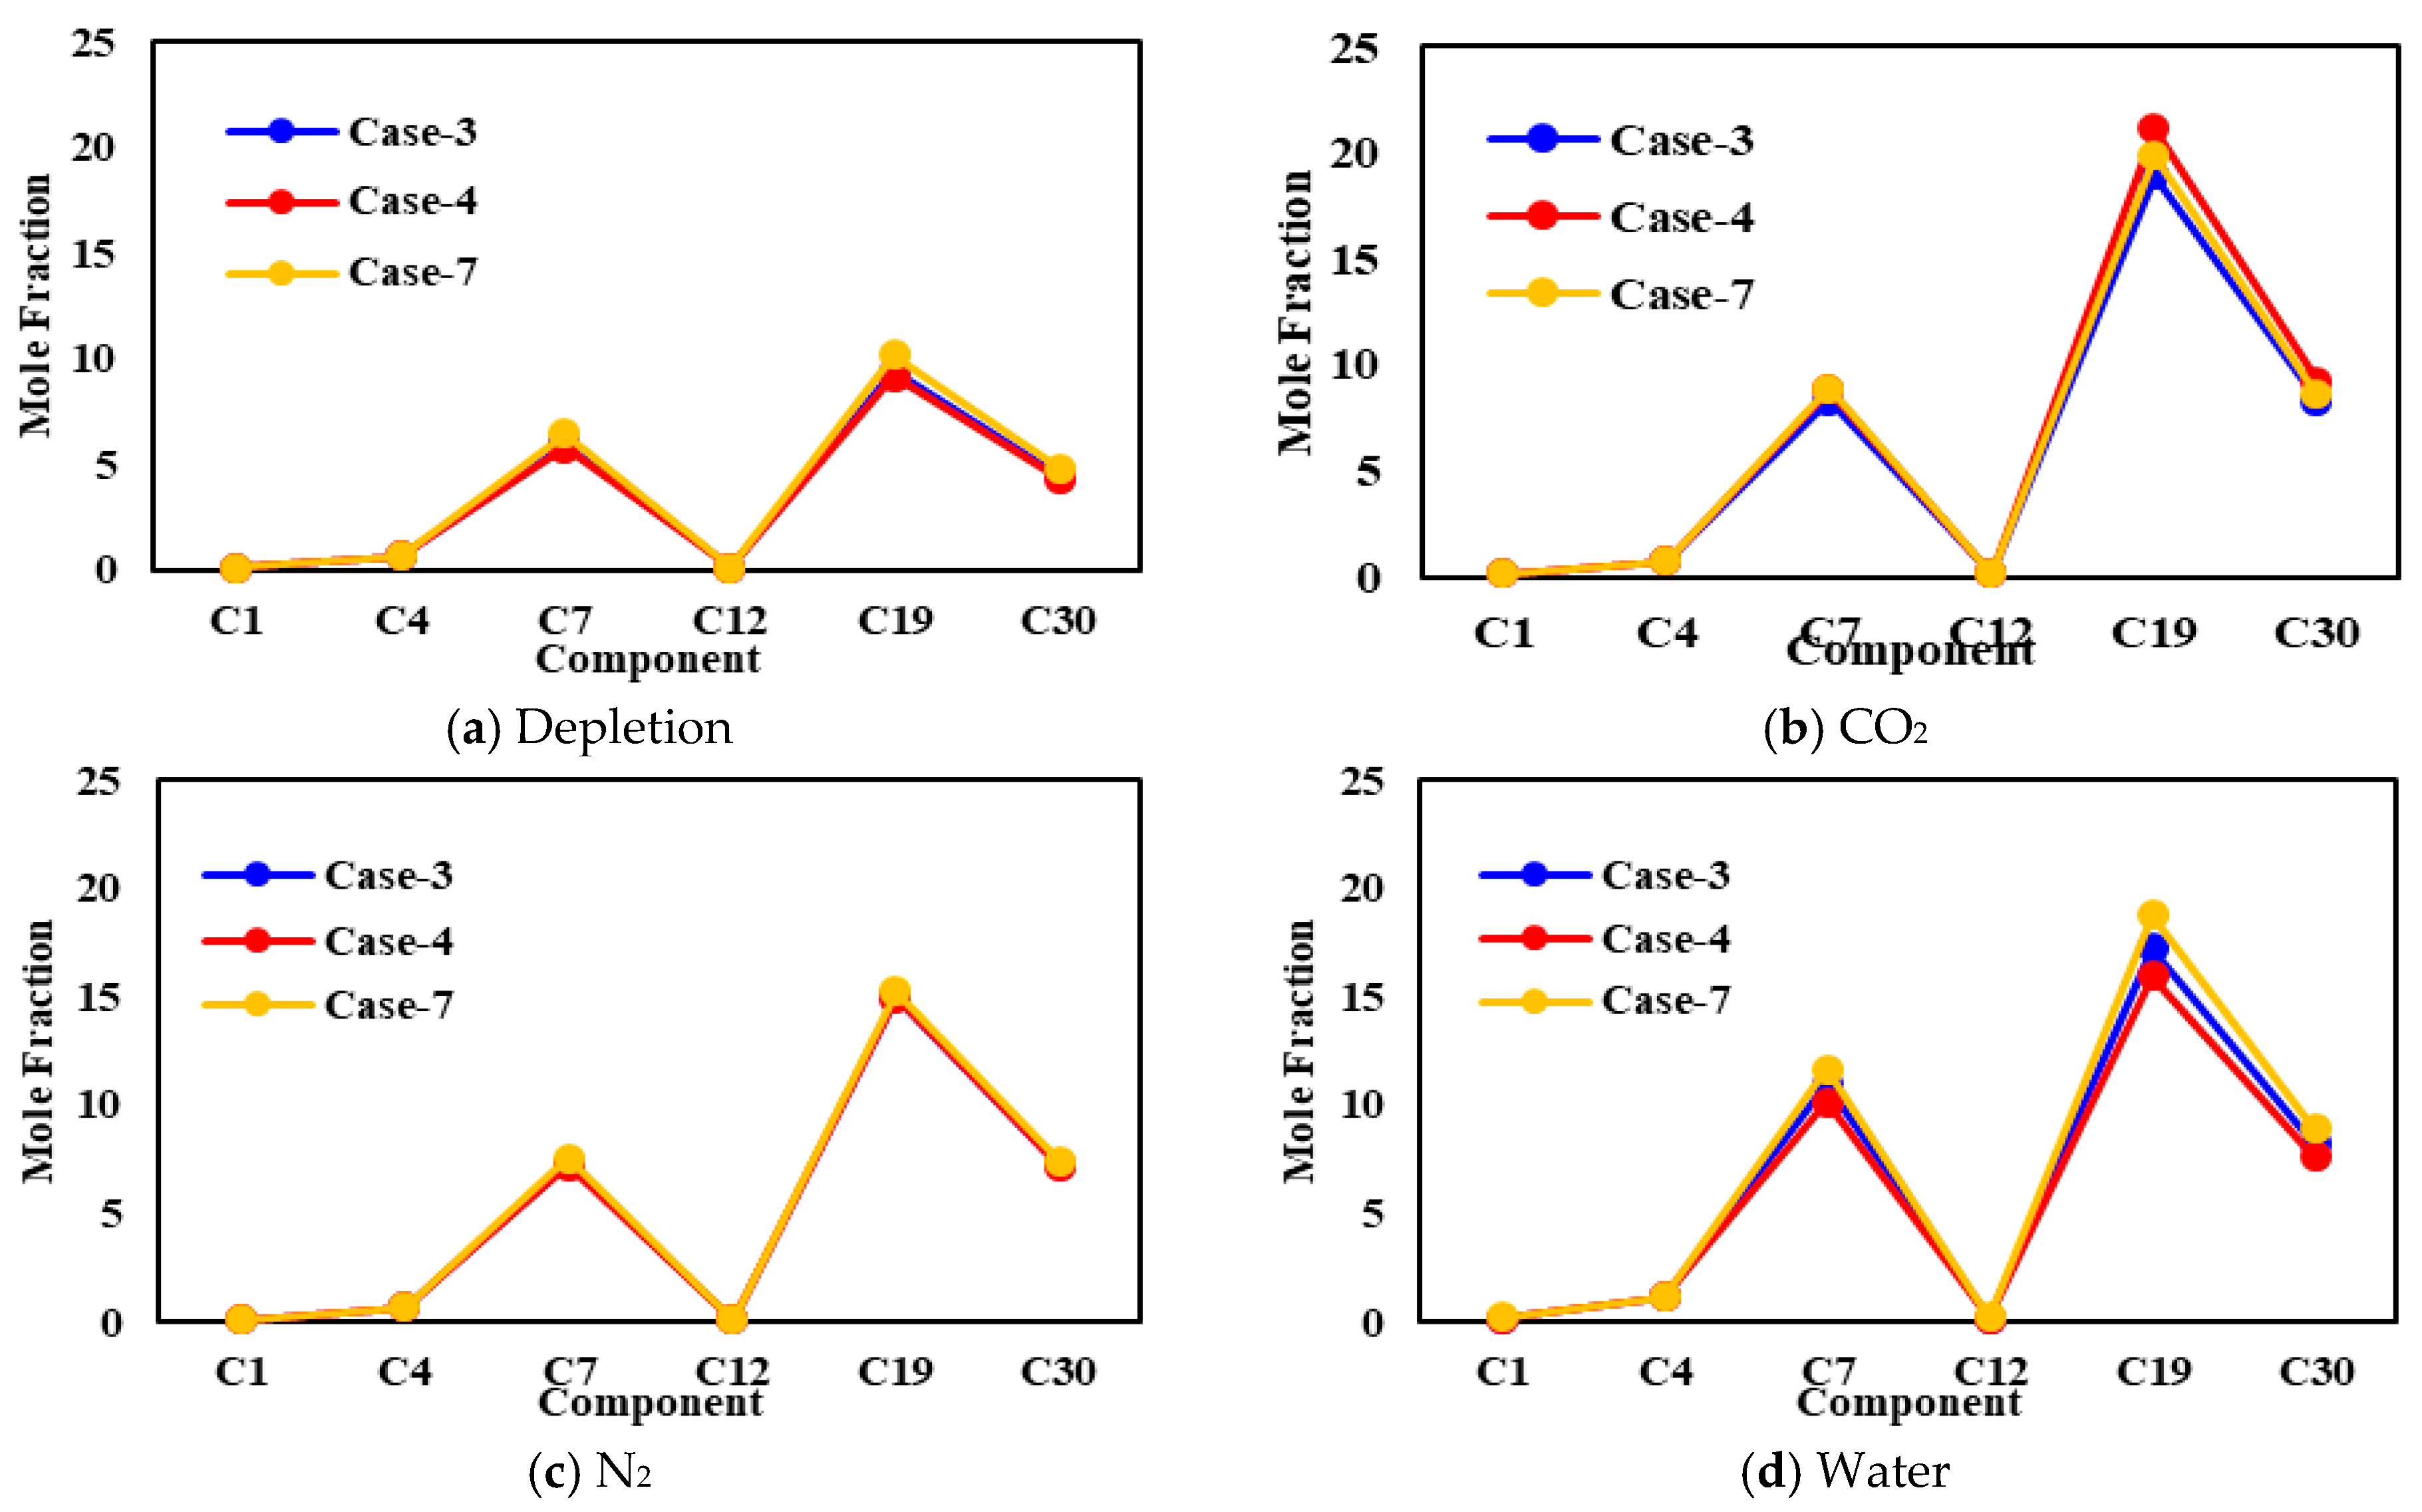
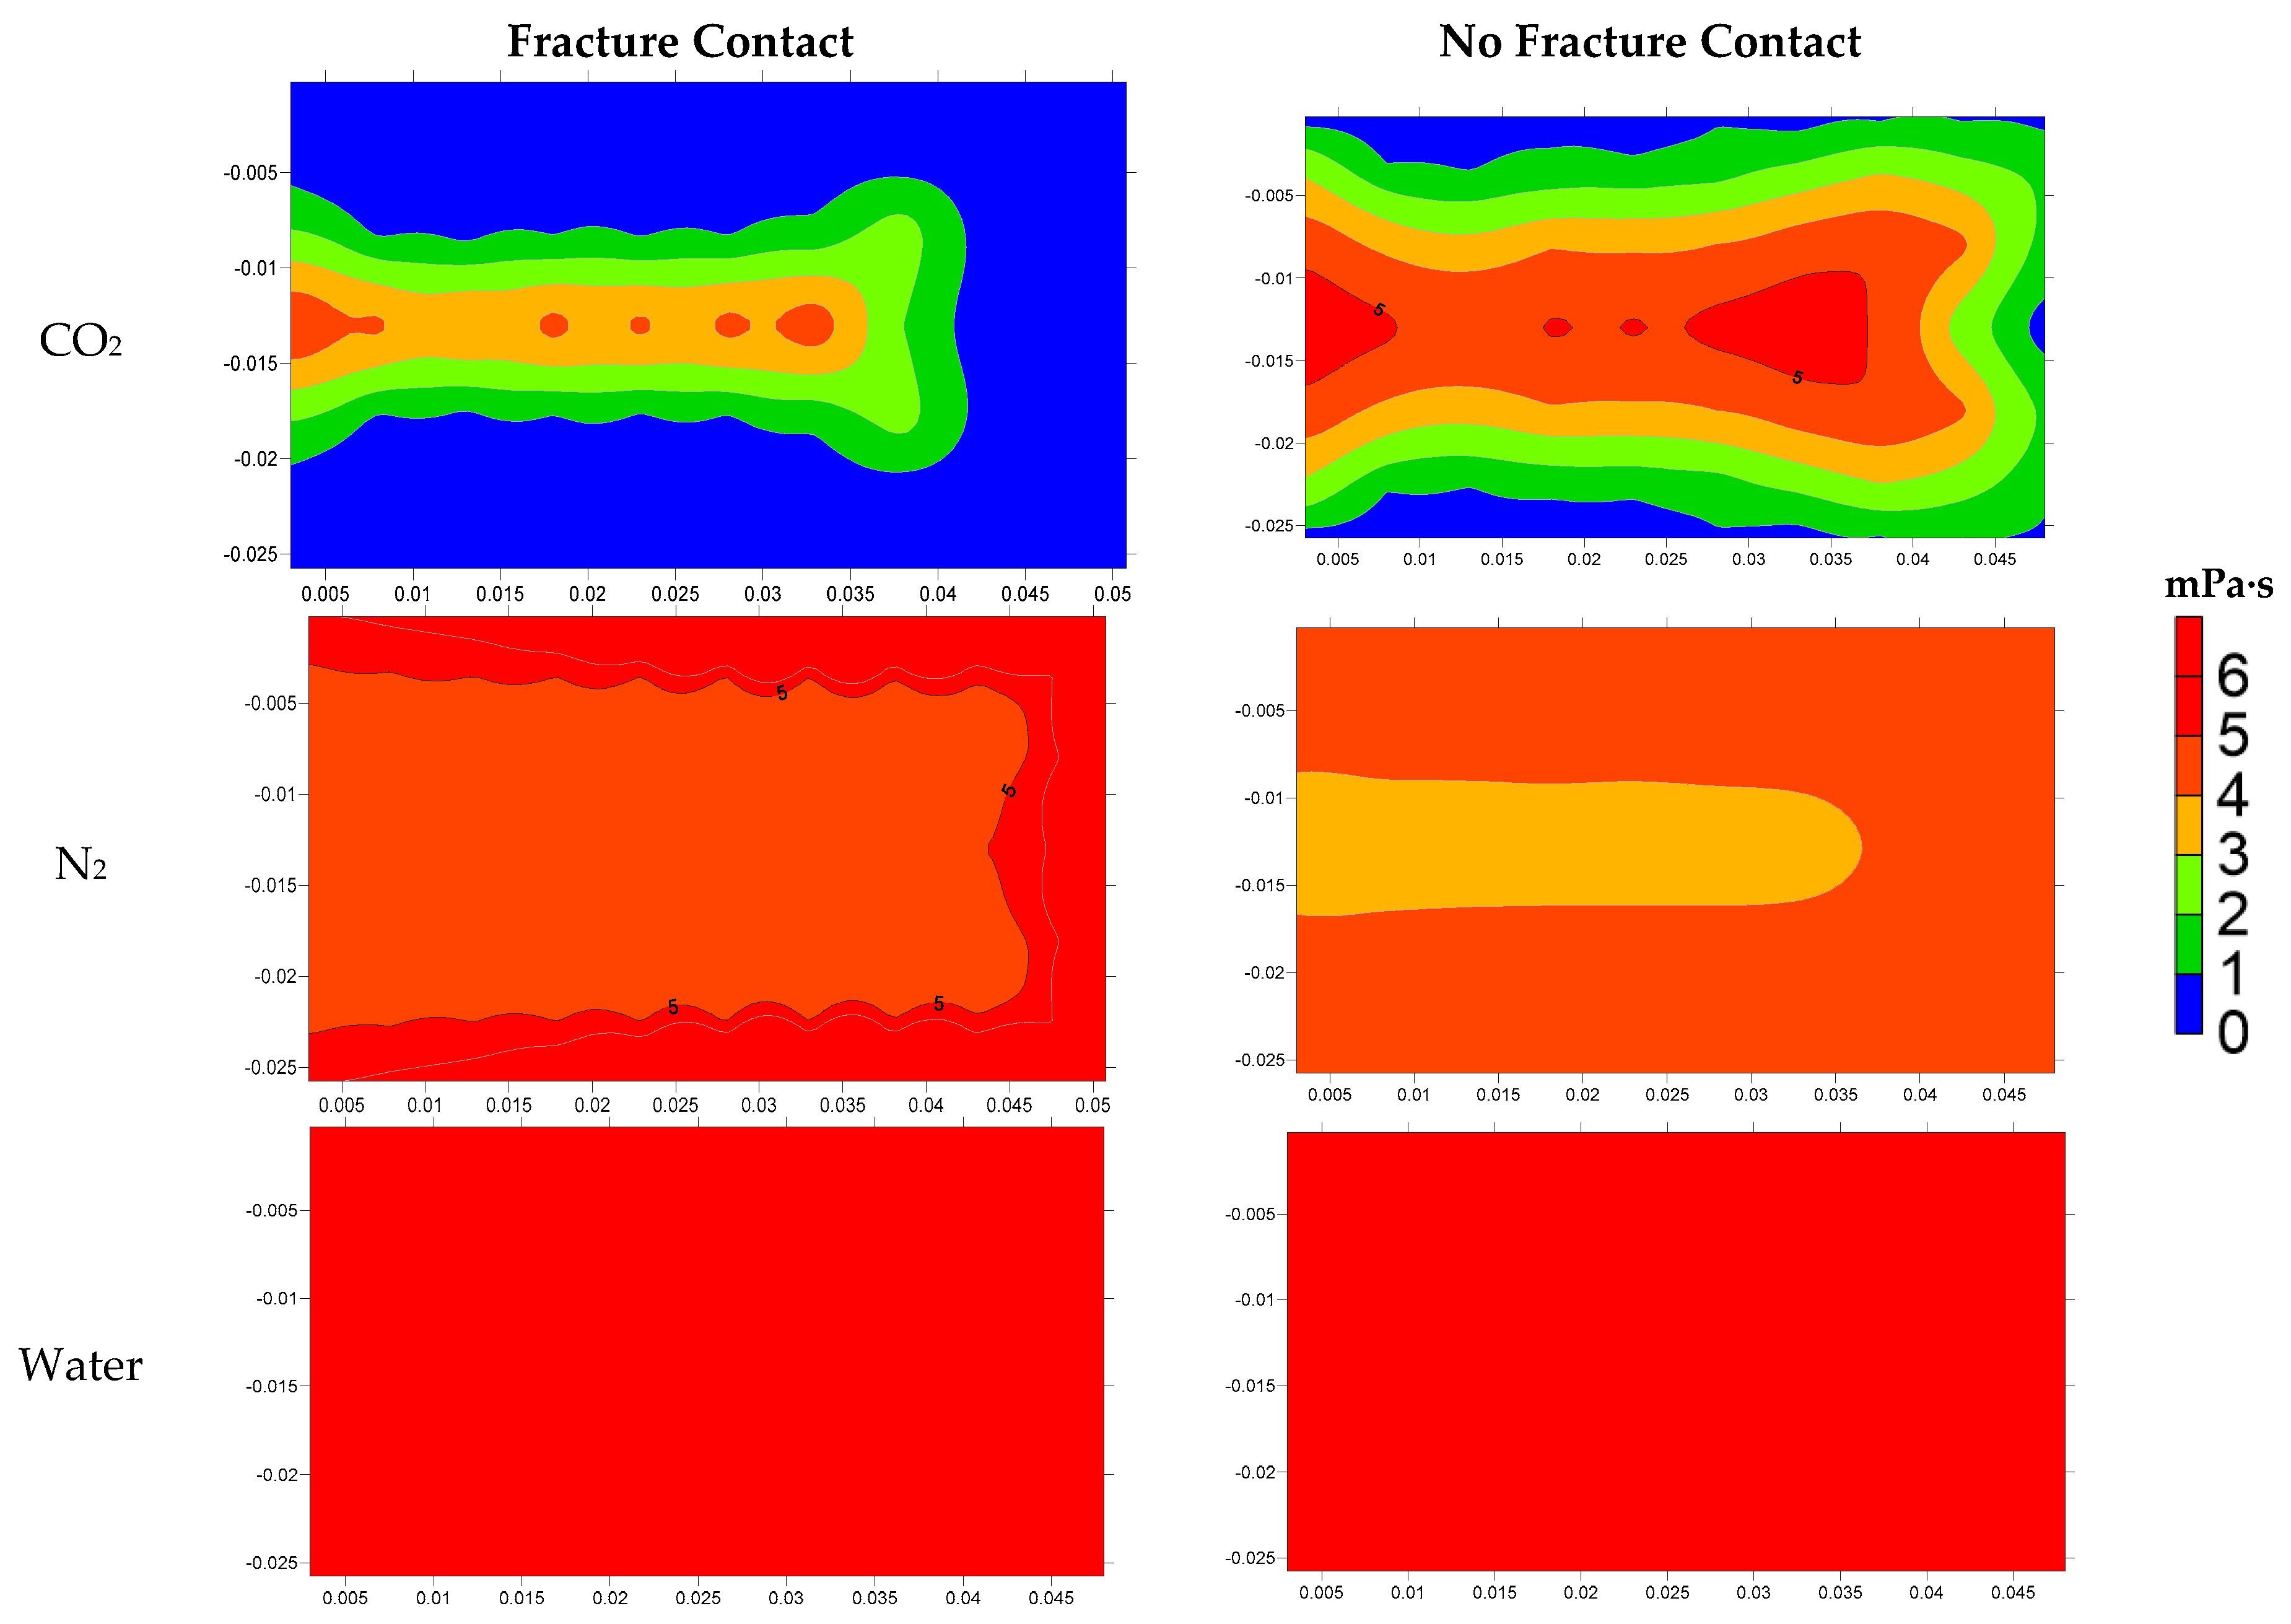
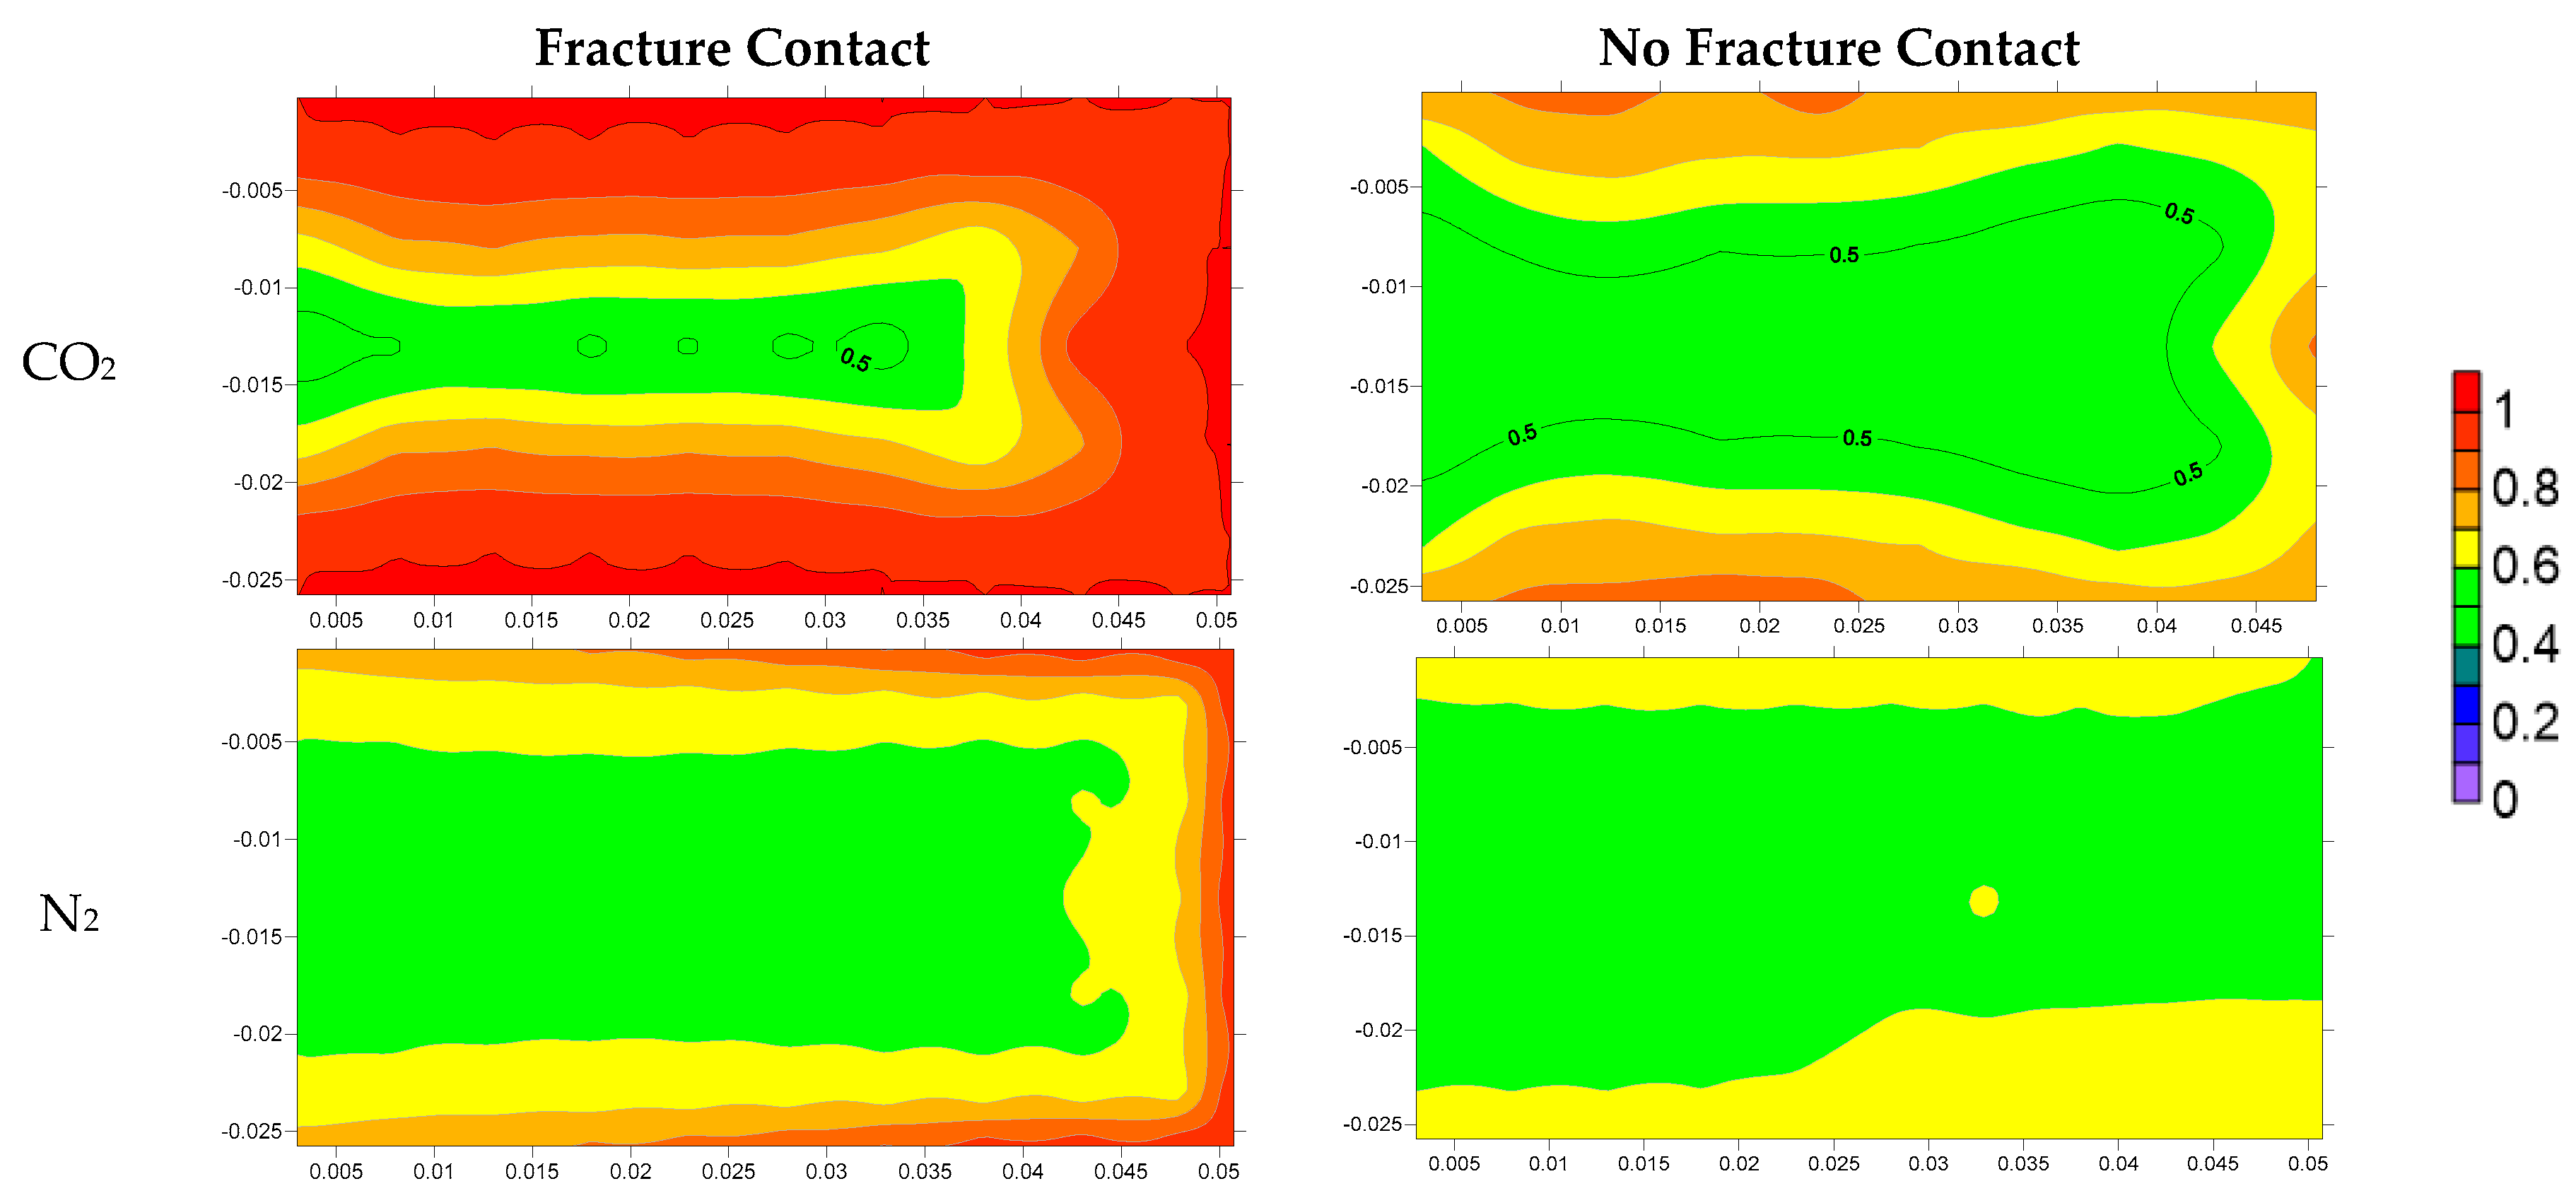
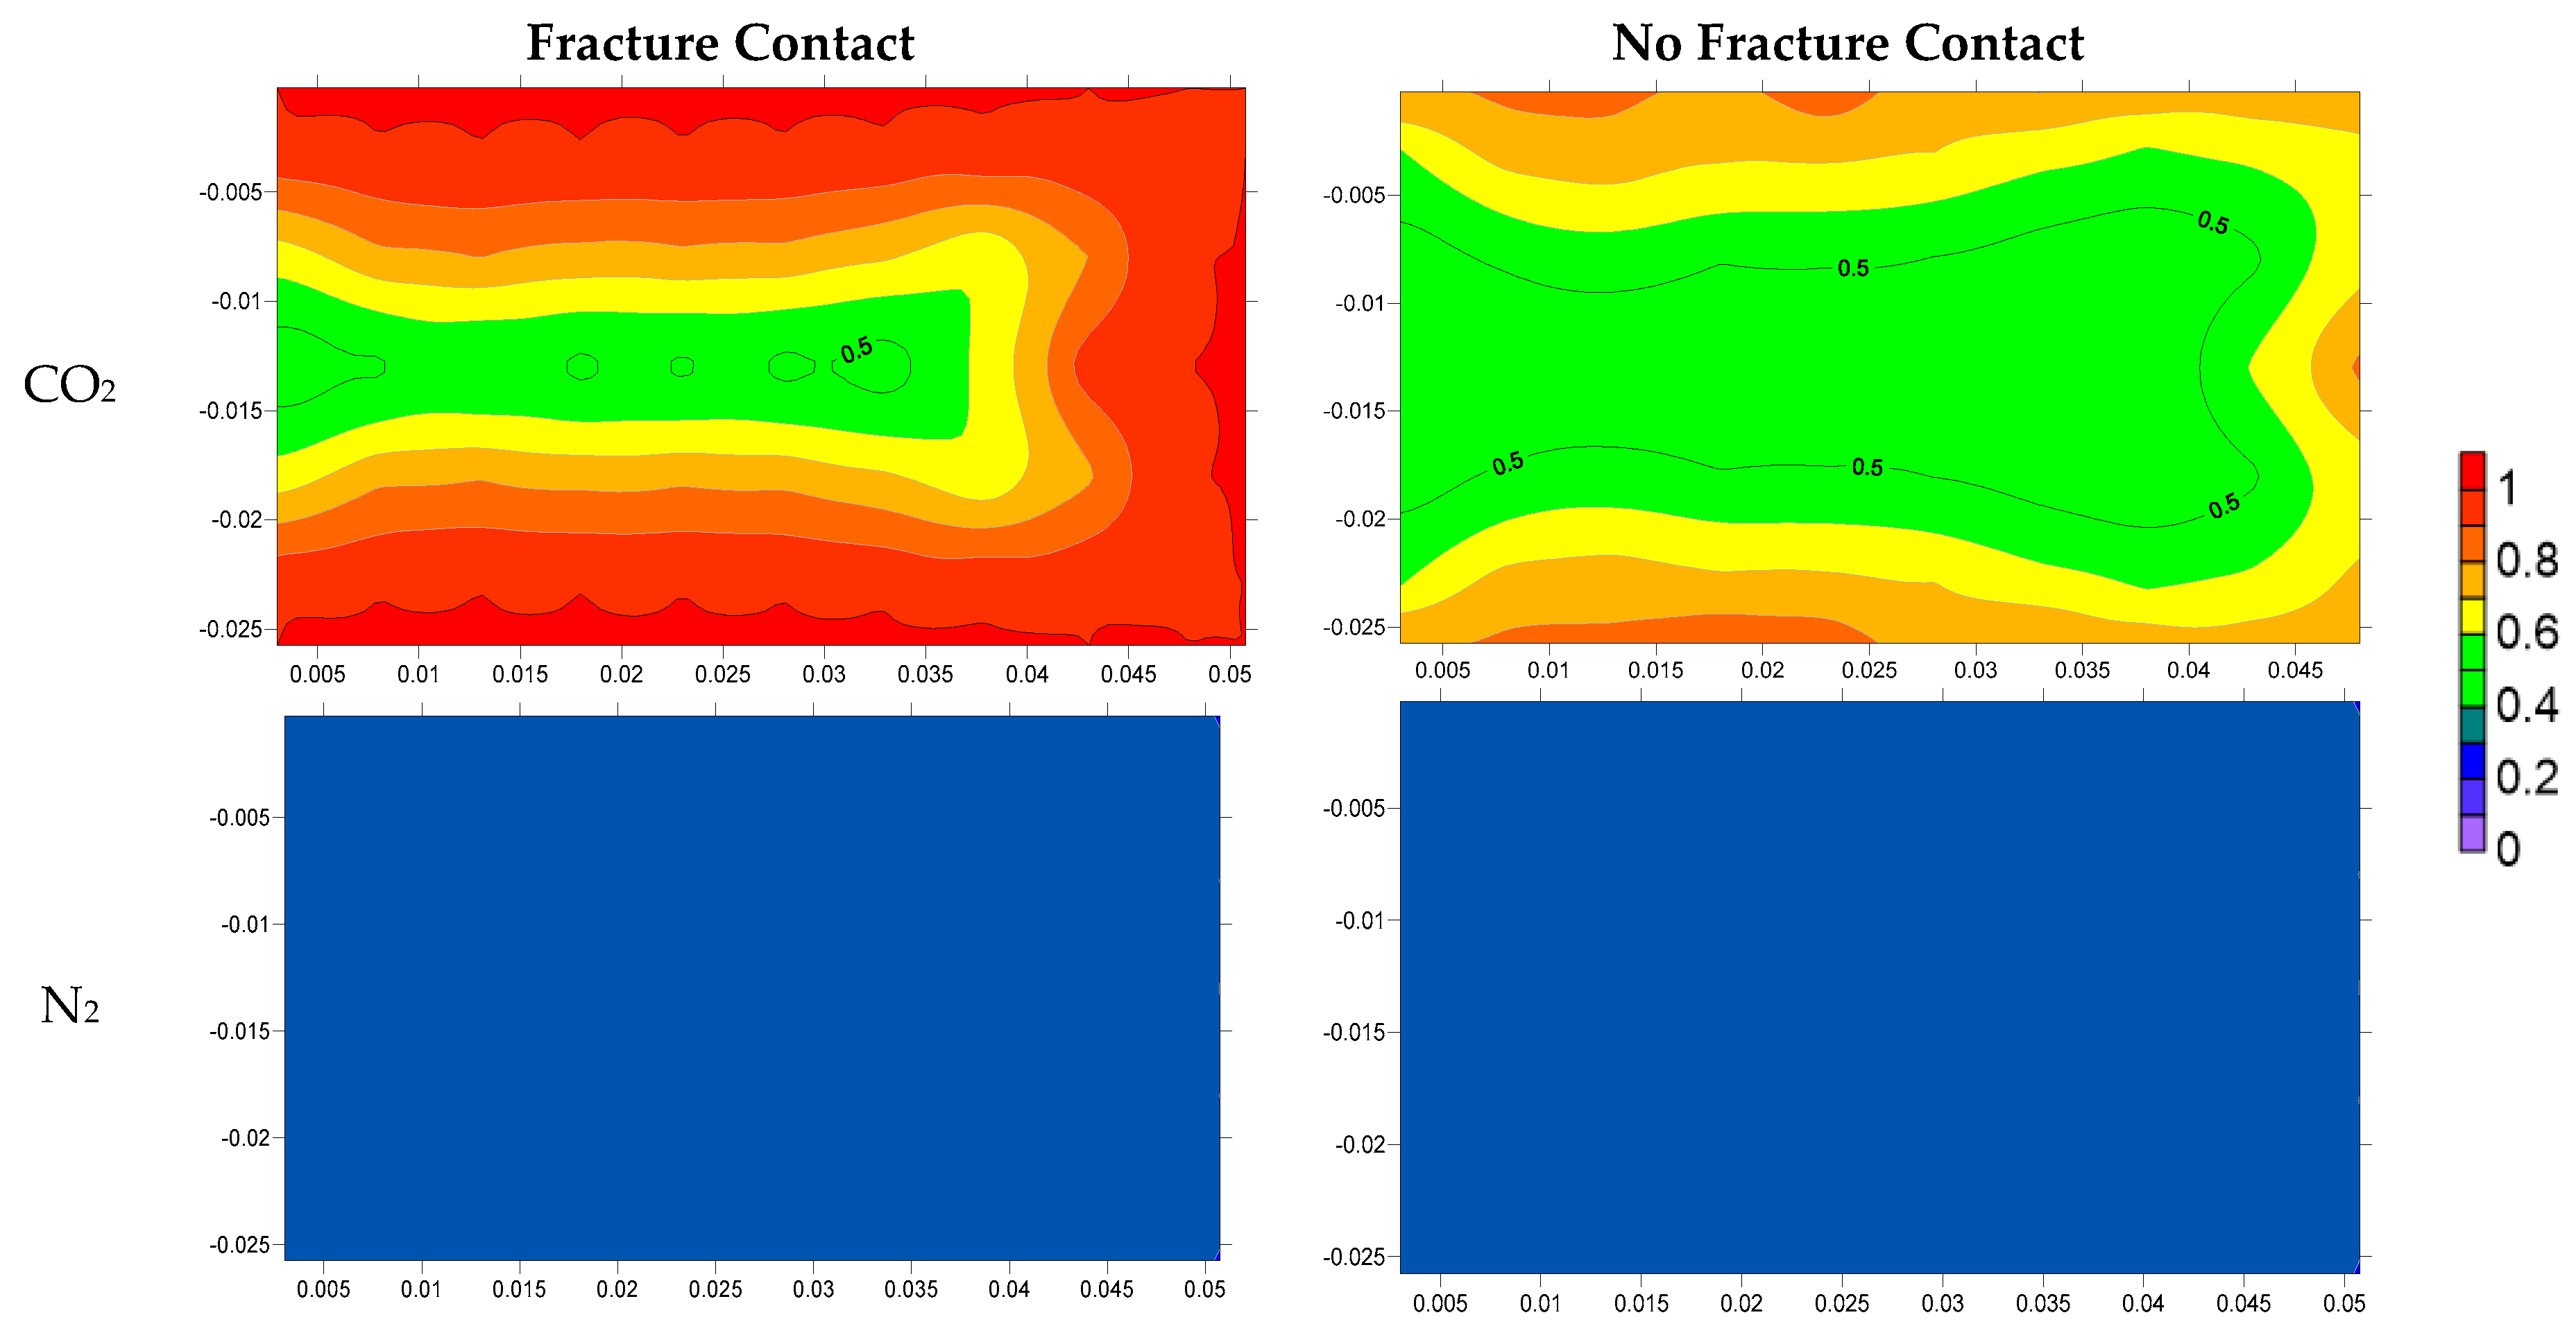
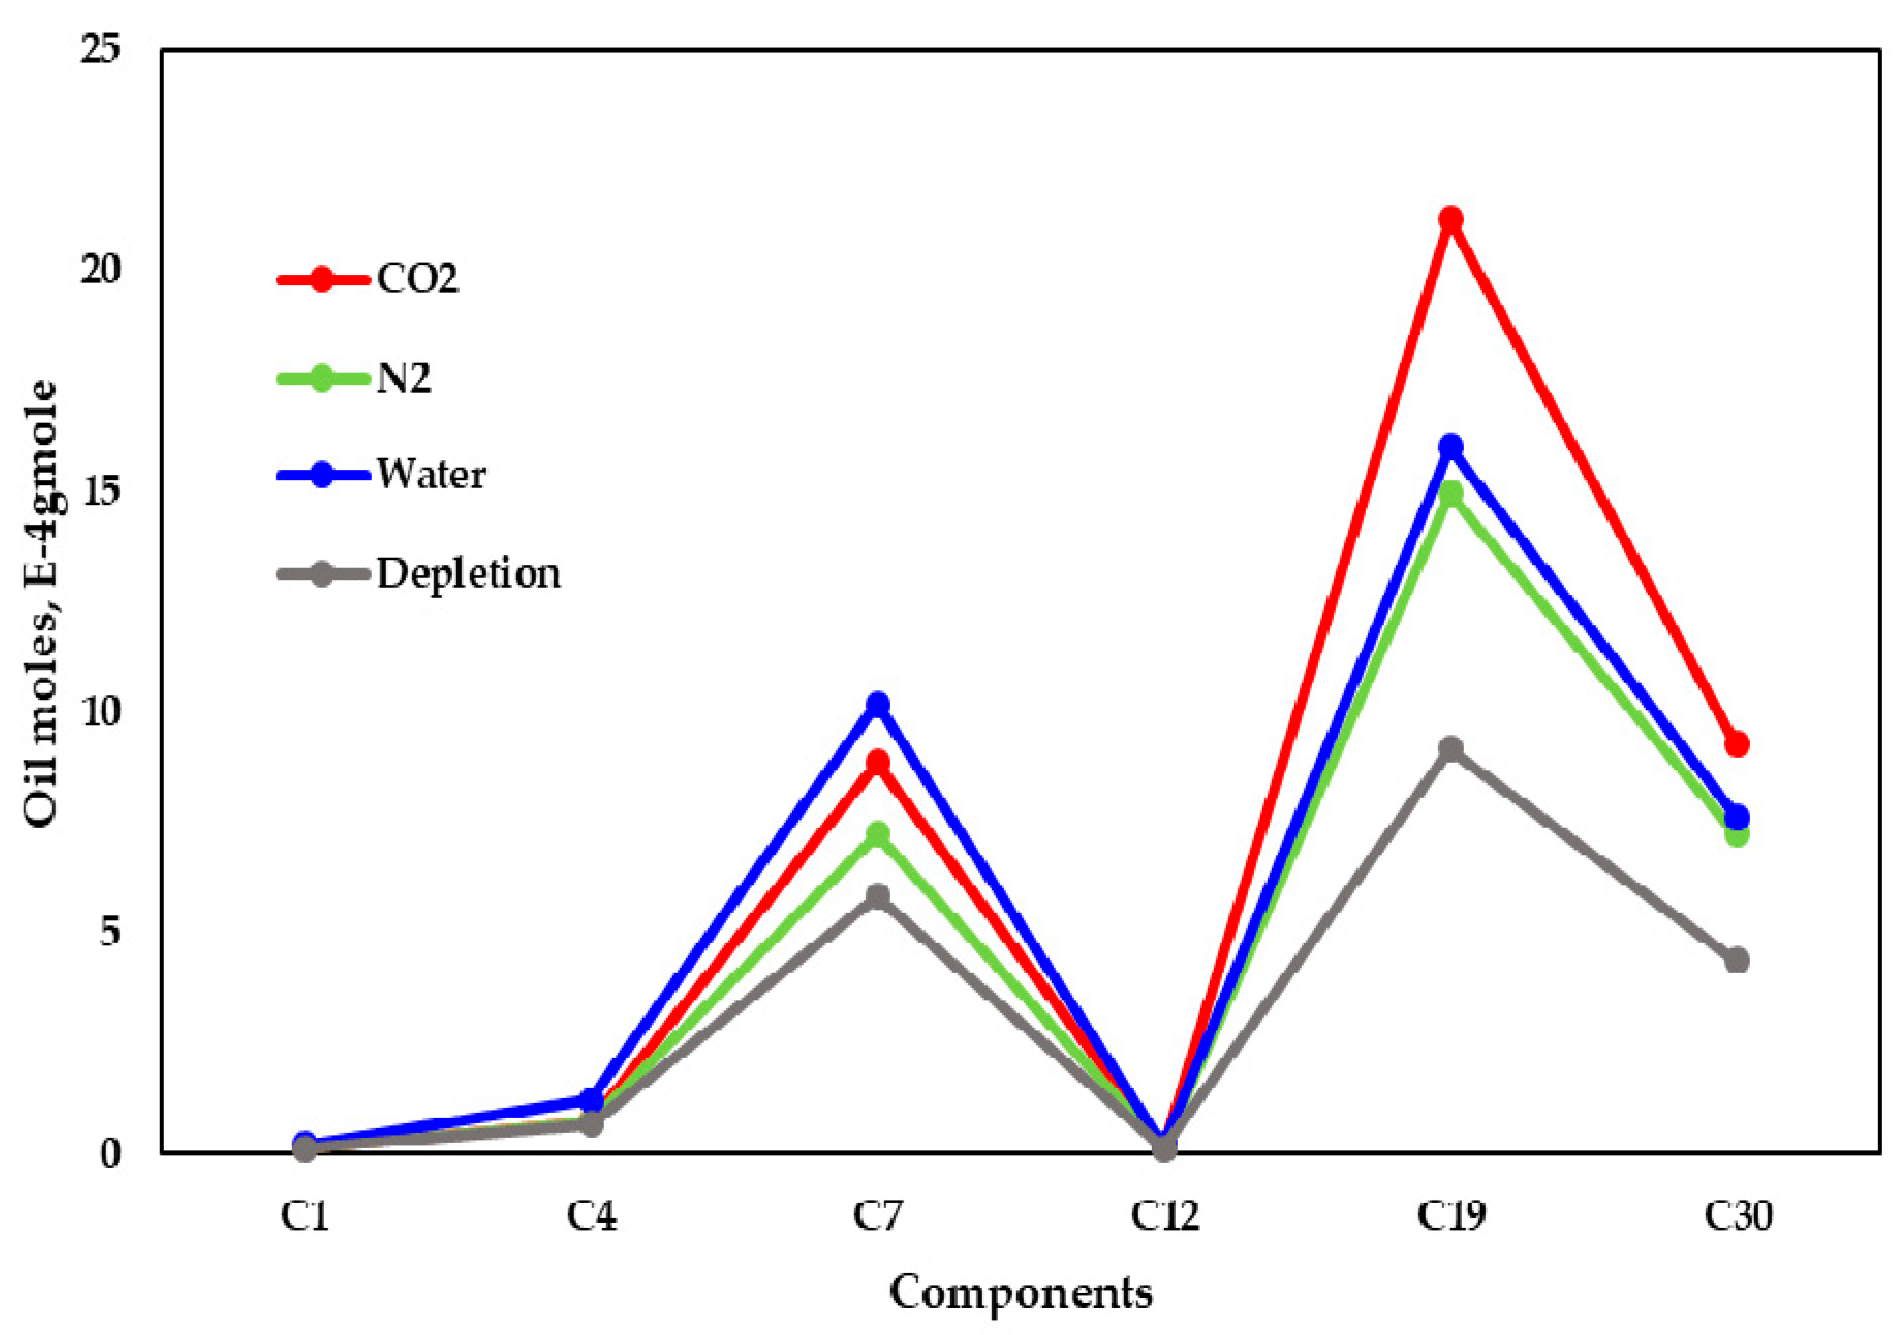
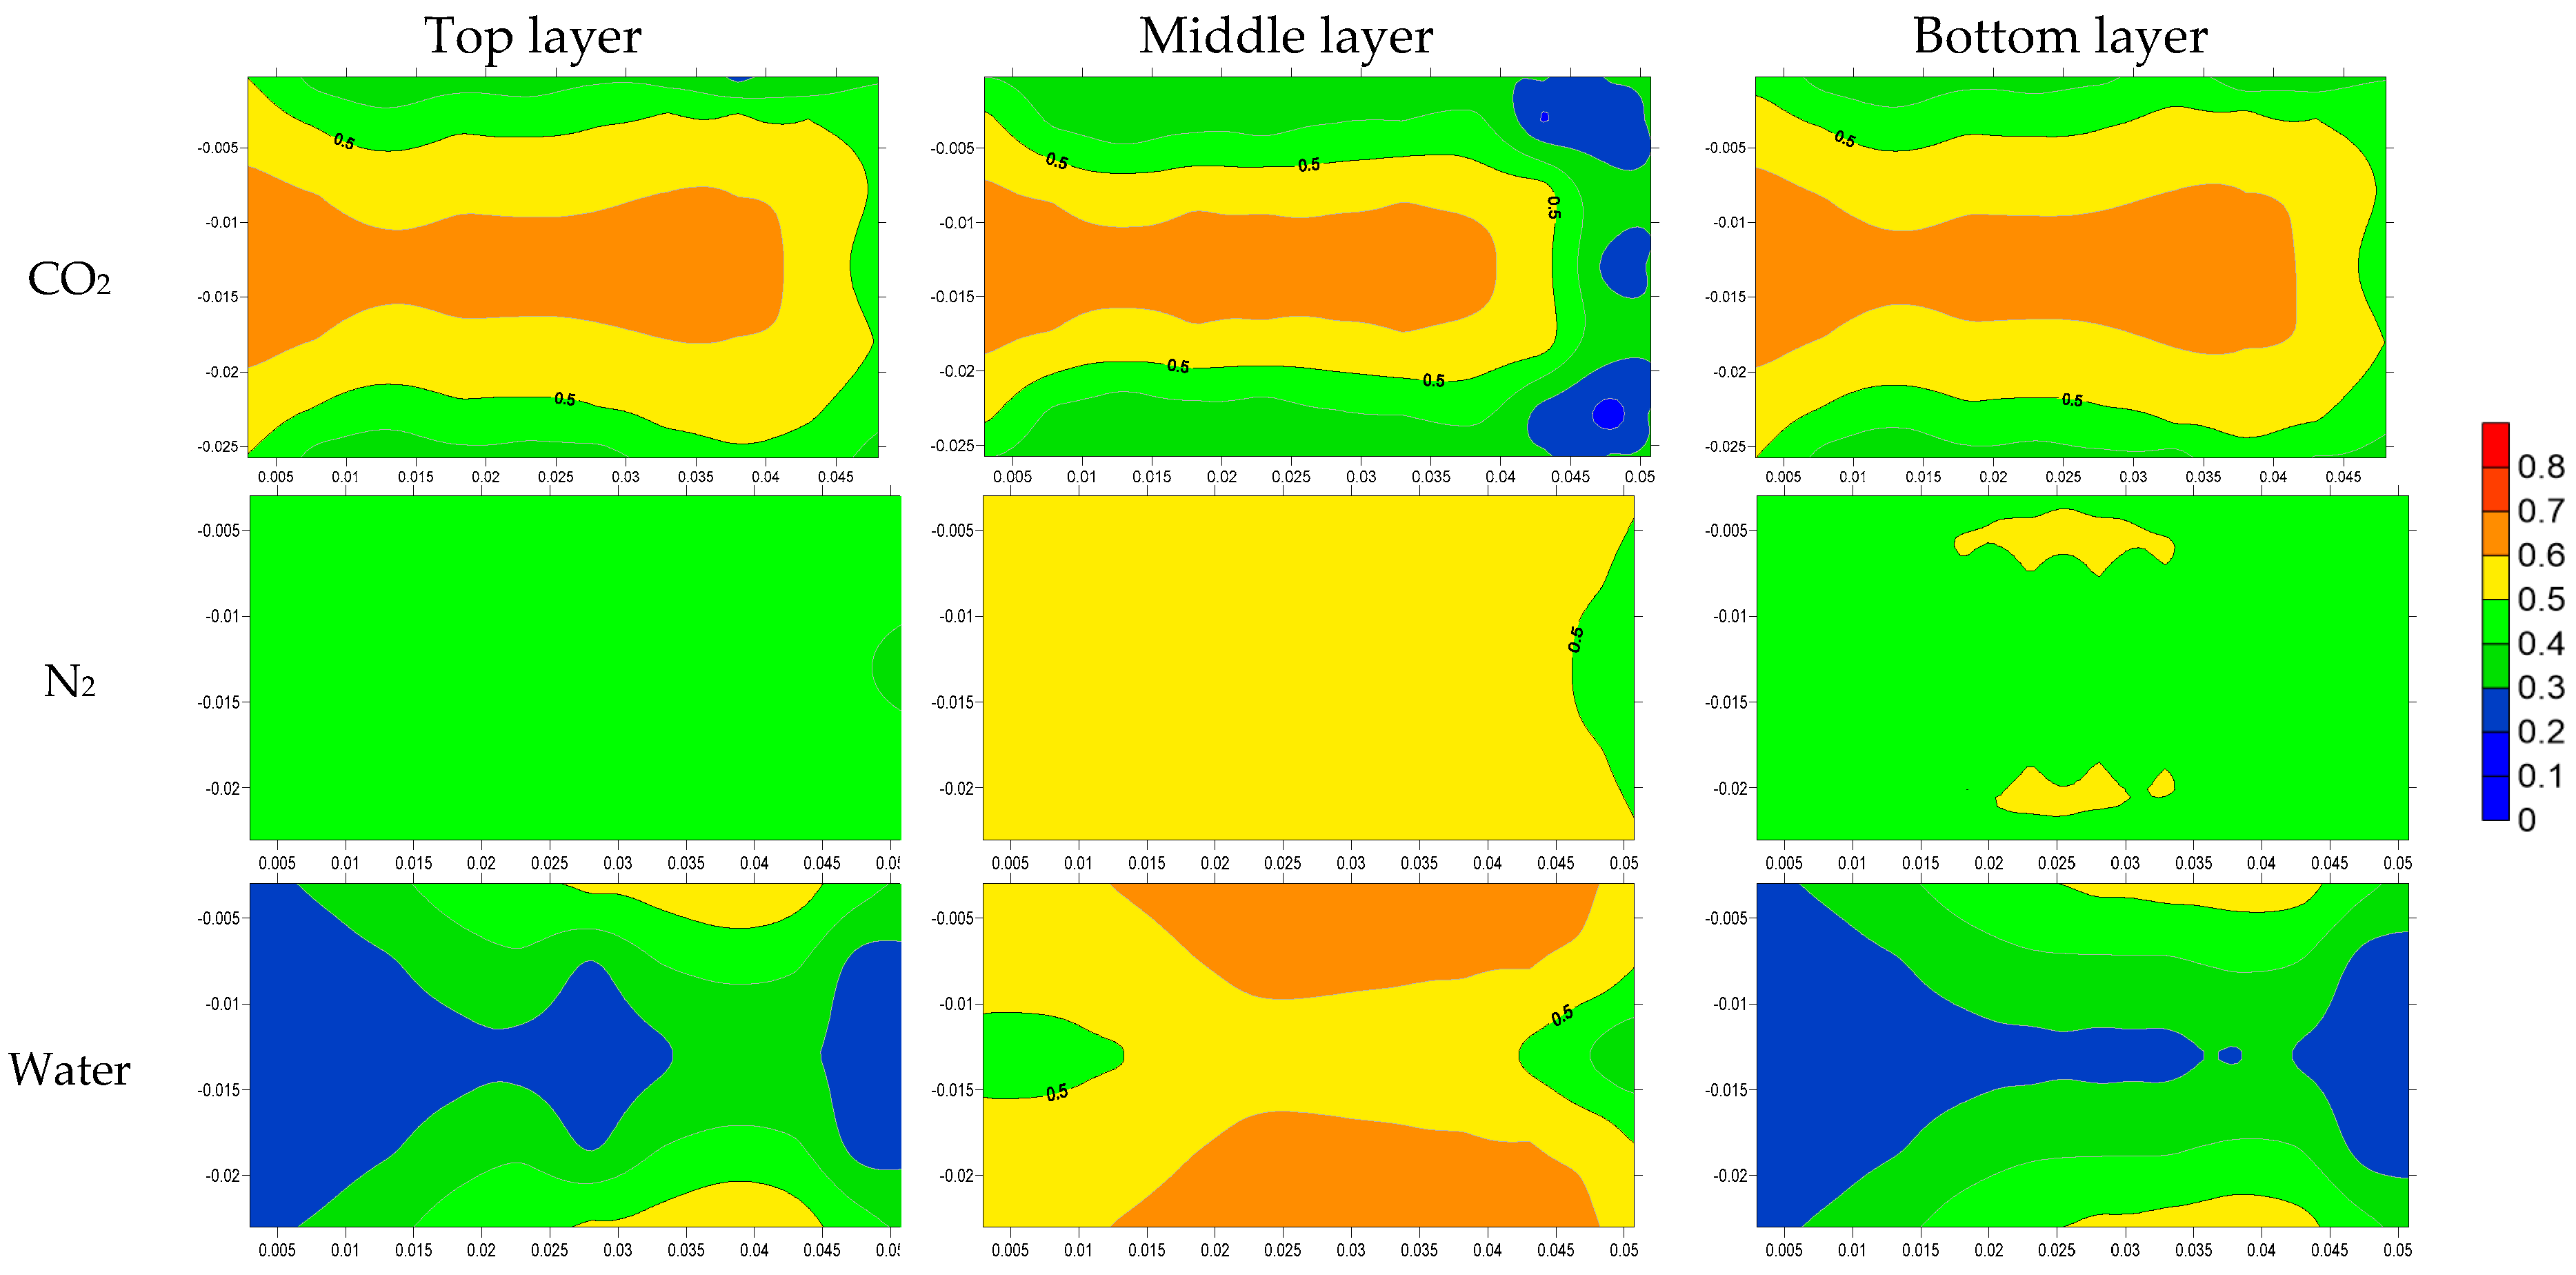
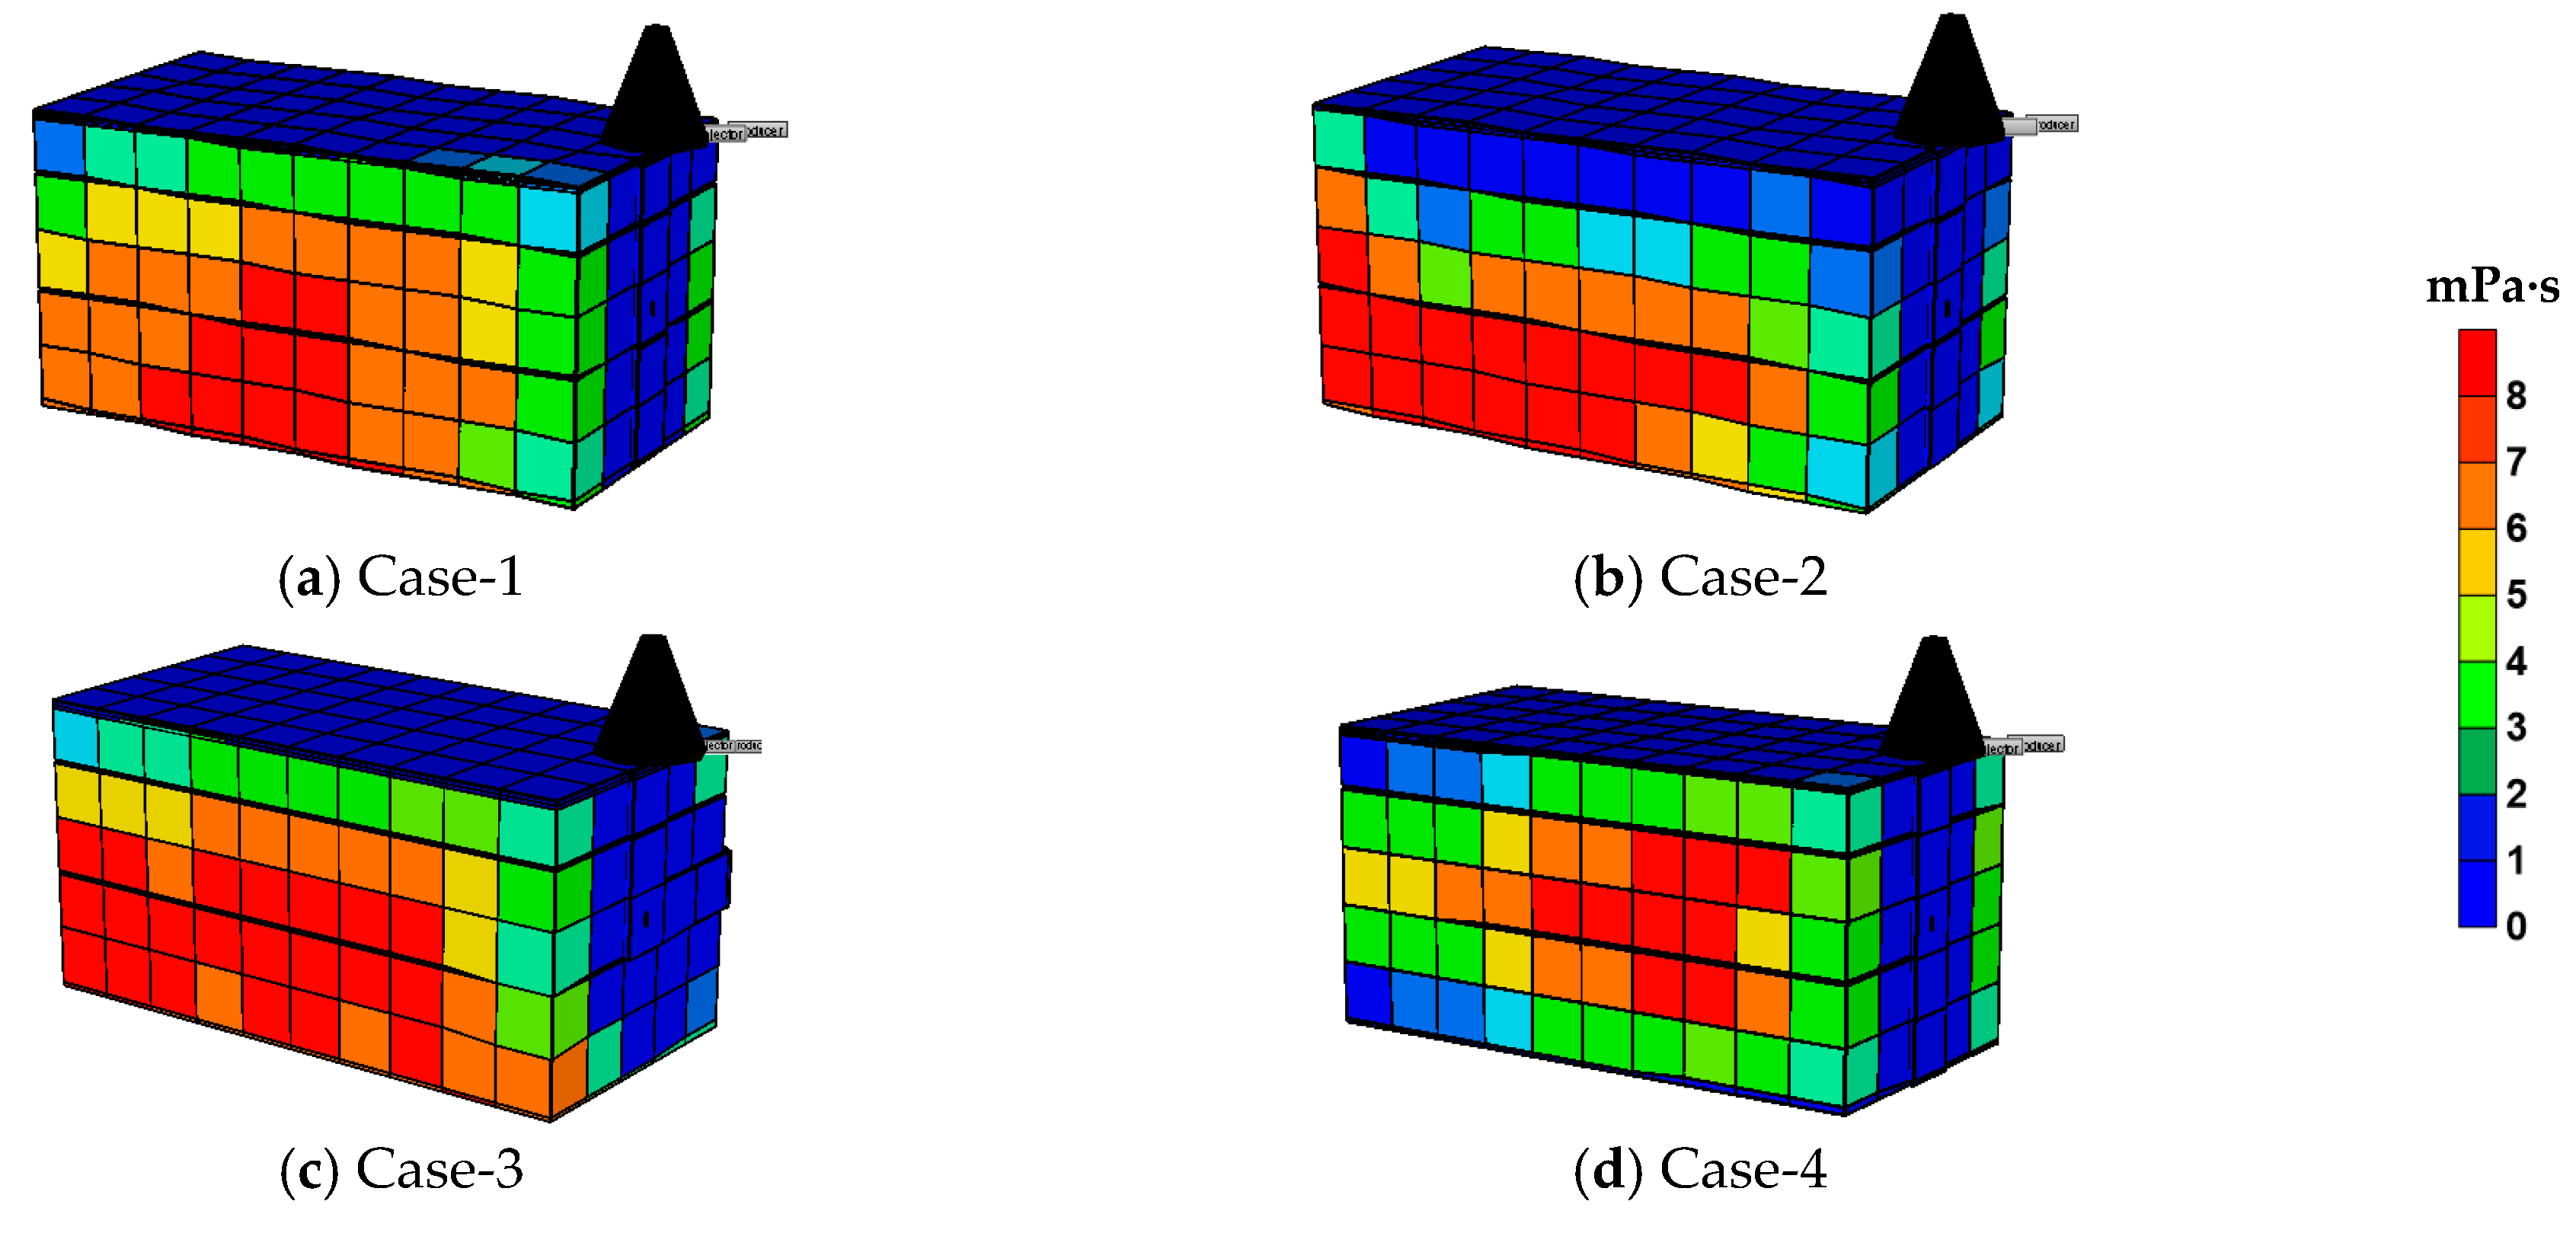
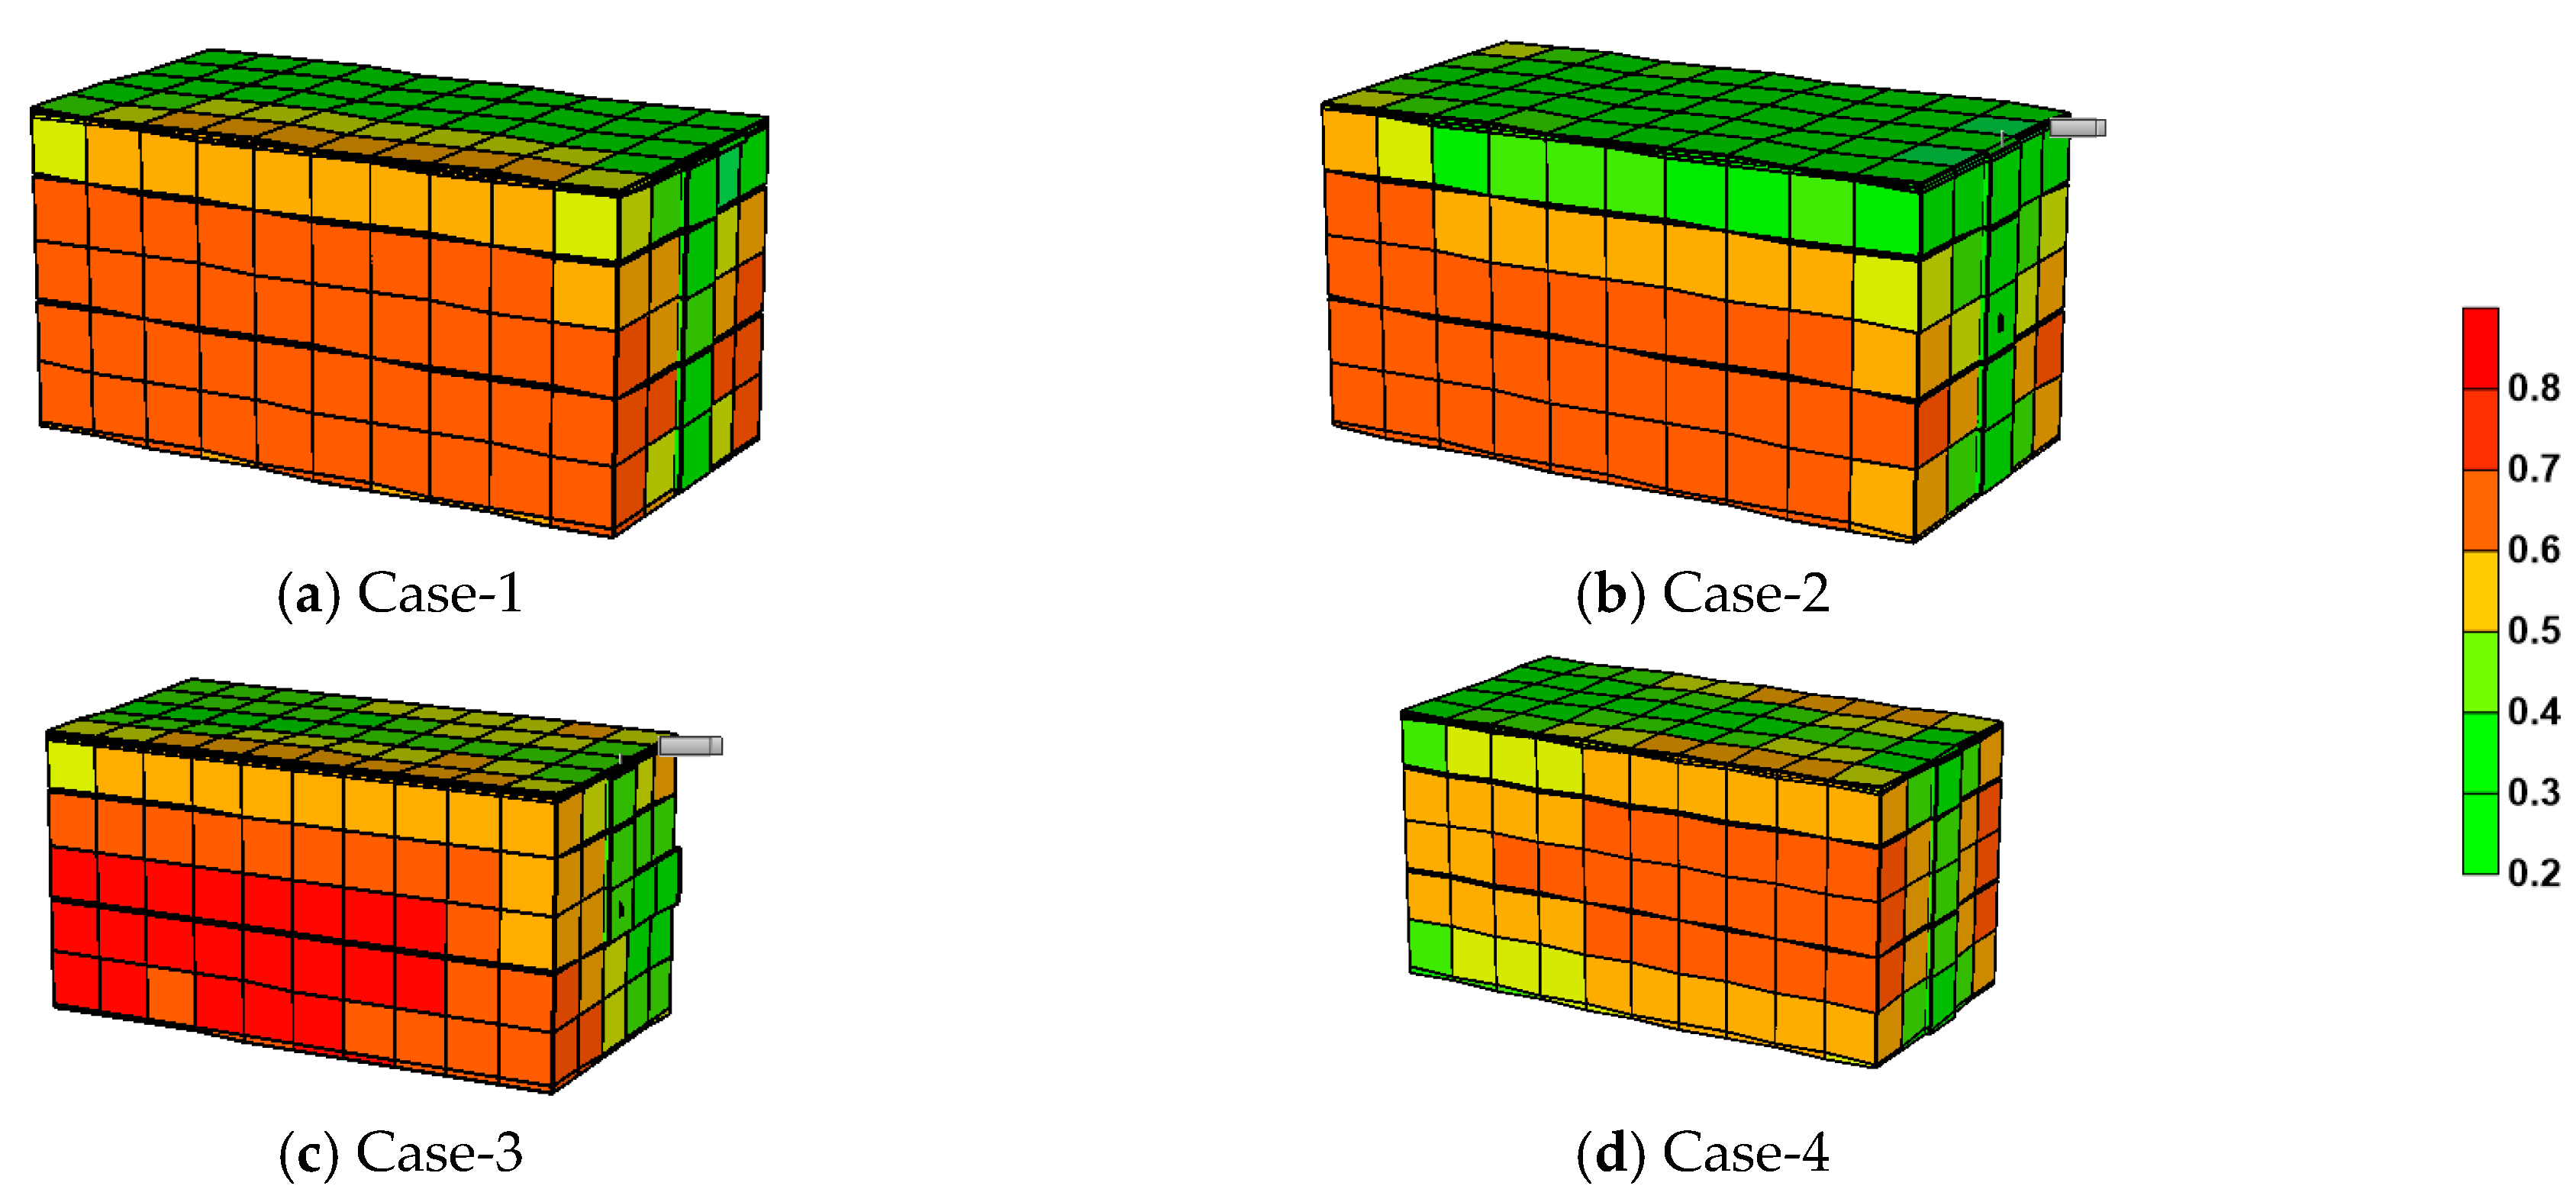
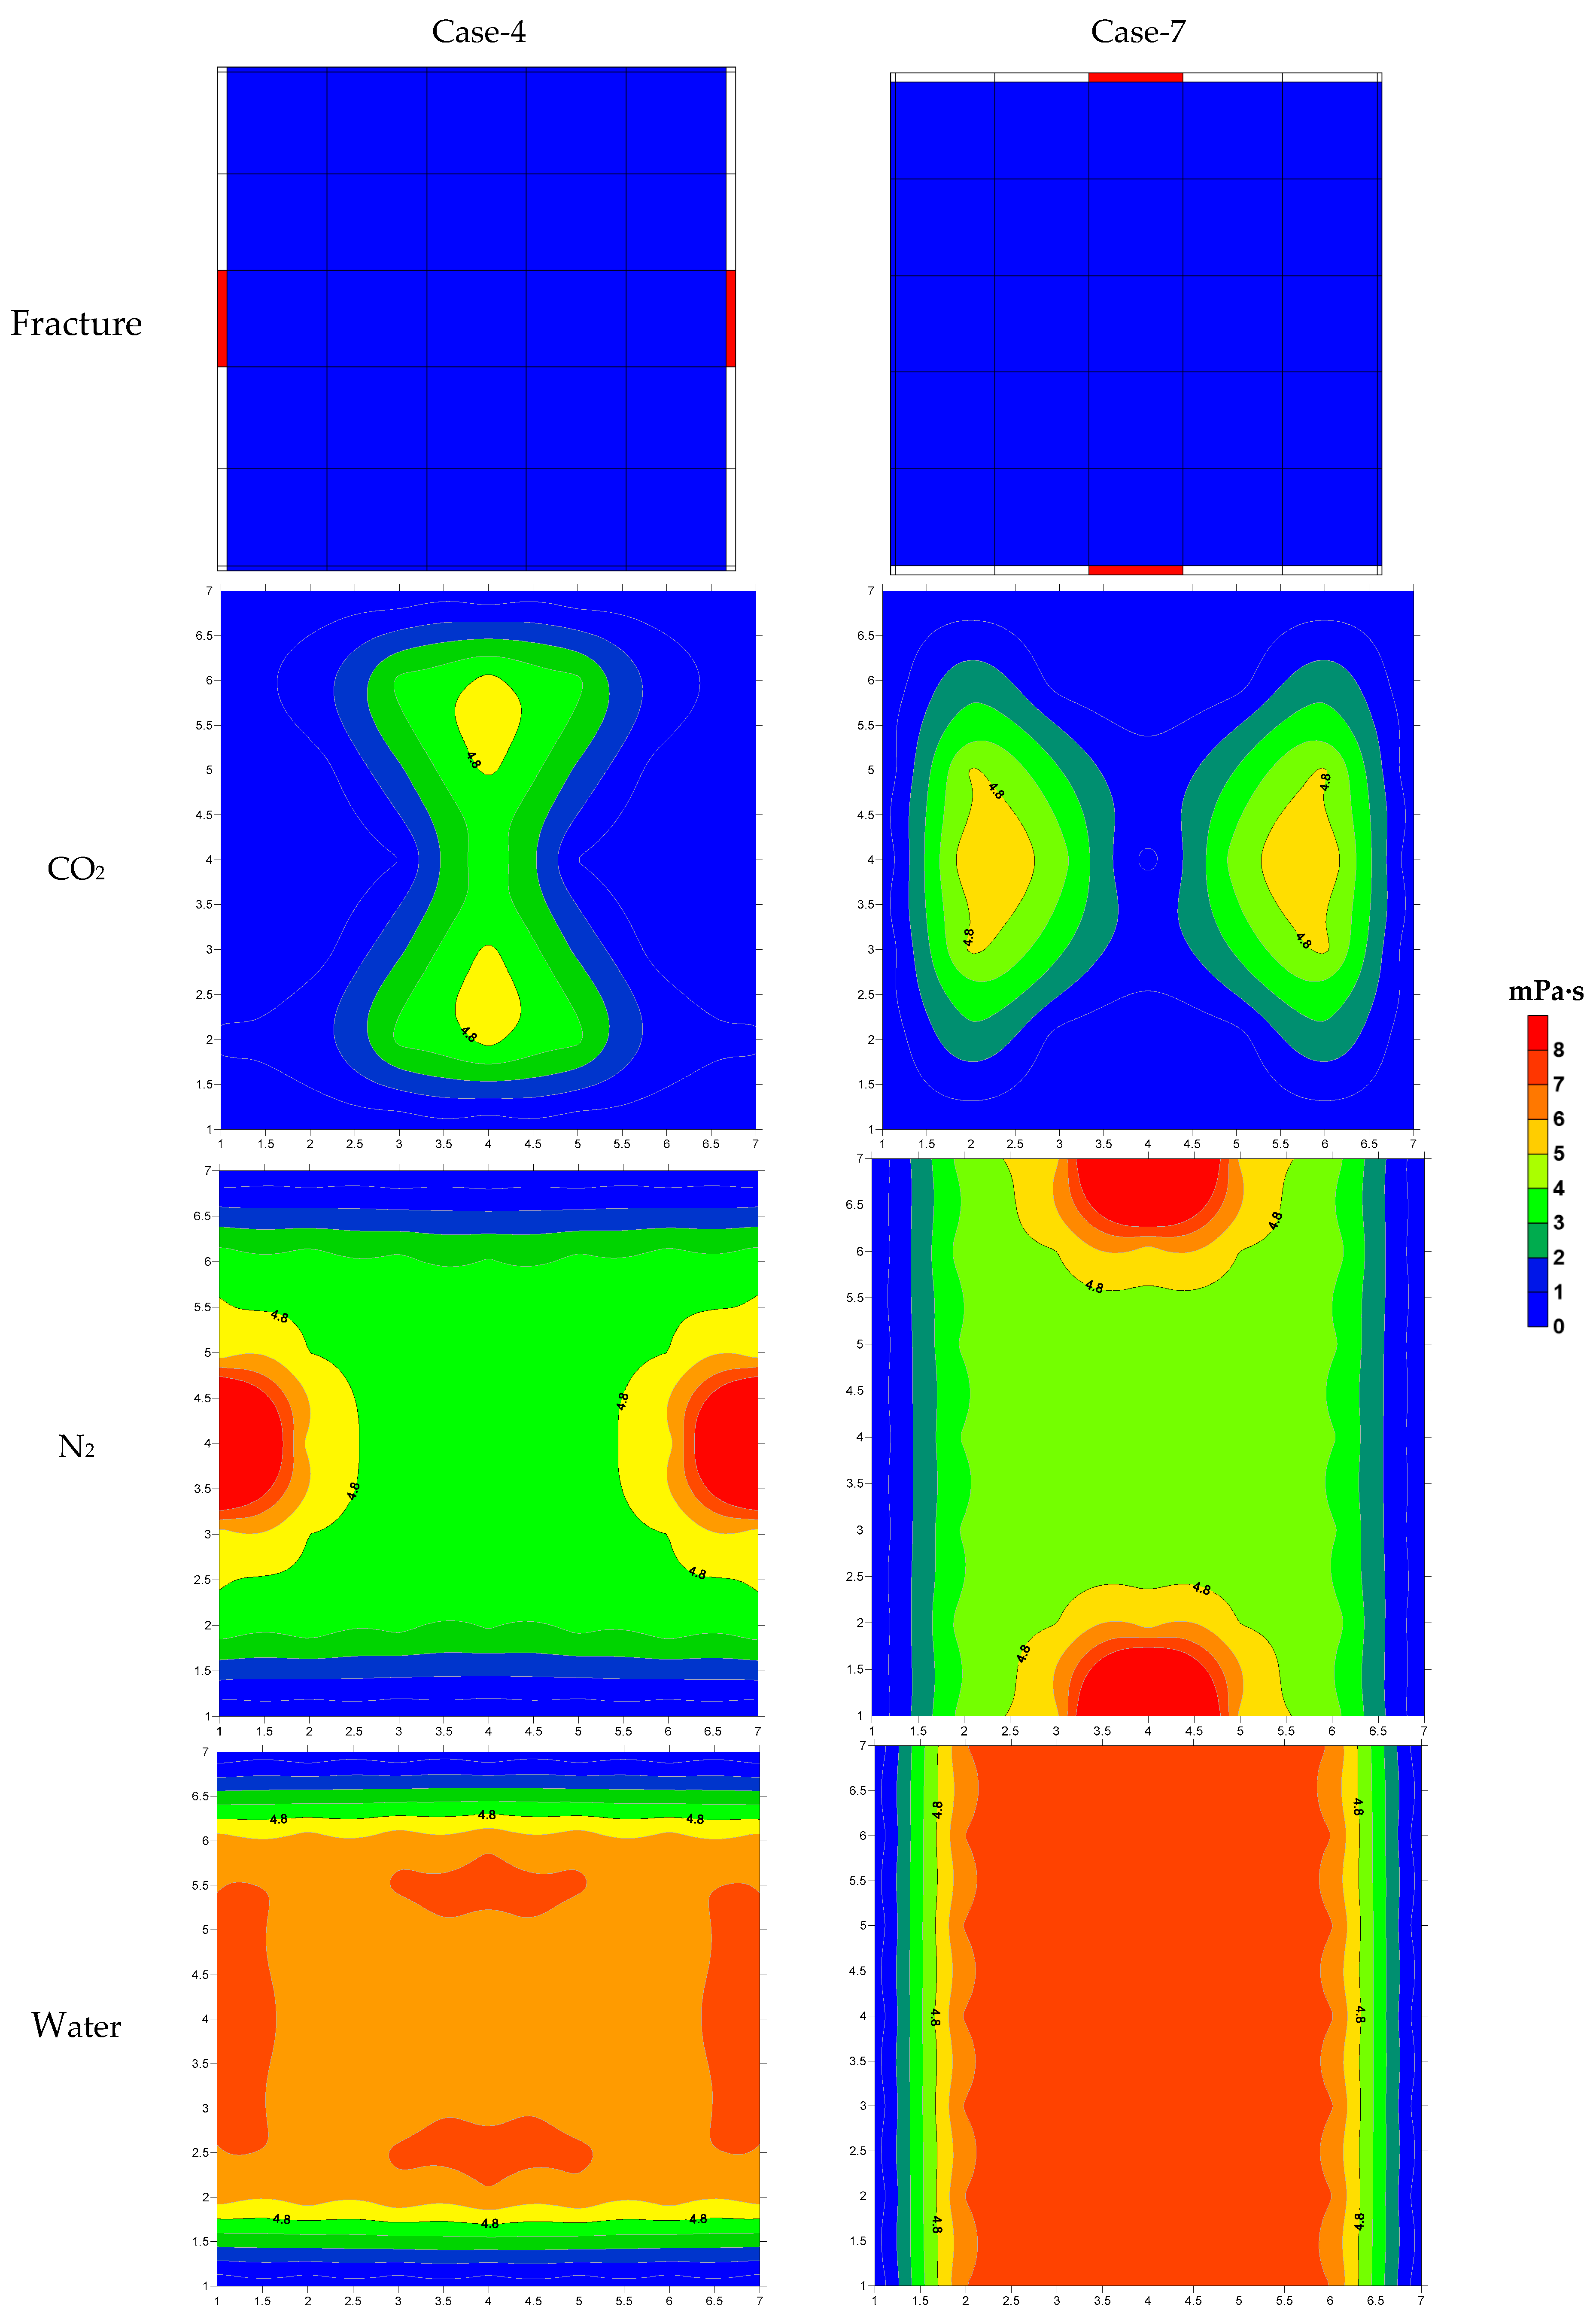
3.2.5. Components Analysis
4. Conclusions
- (1)
- In core-scale fractures, a new experimental core-level fracture simulation method that is easy to operate and reusable is proposed. In this method, woven metallic wires are attached to the outer surface of the core to create a space between the core holder and the core as a high permeability zone, equivalent to a fracture. This avoids the defects of single fracture shape, sanding, and difficulty in reusing the core. Different spatial arrangement of fractures can be set up in core-scale experiments.
- (2)
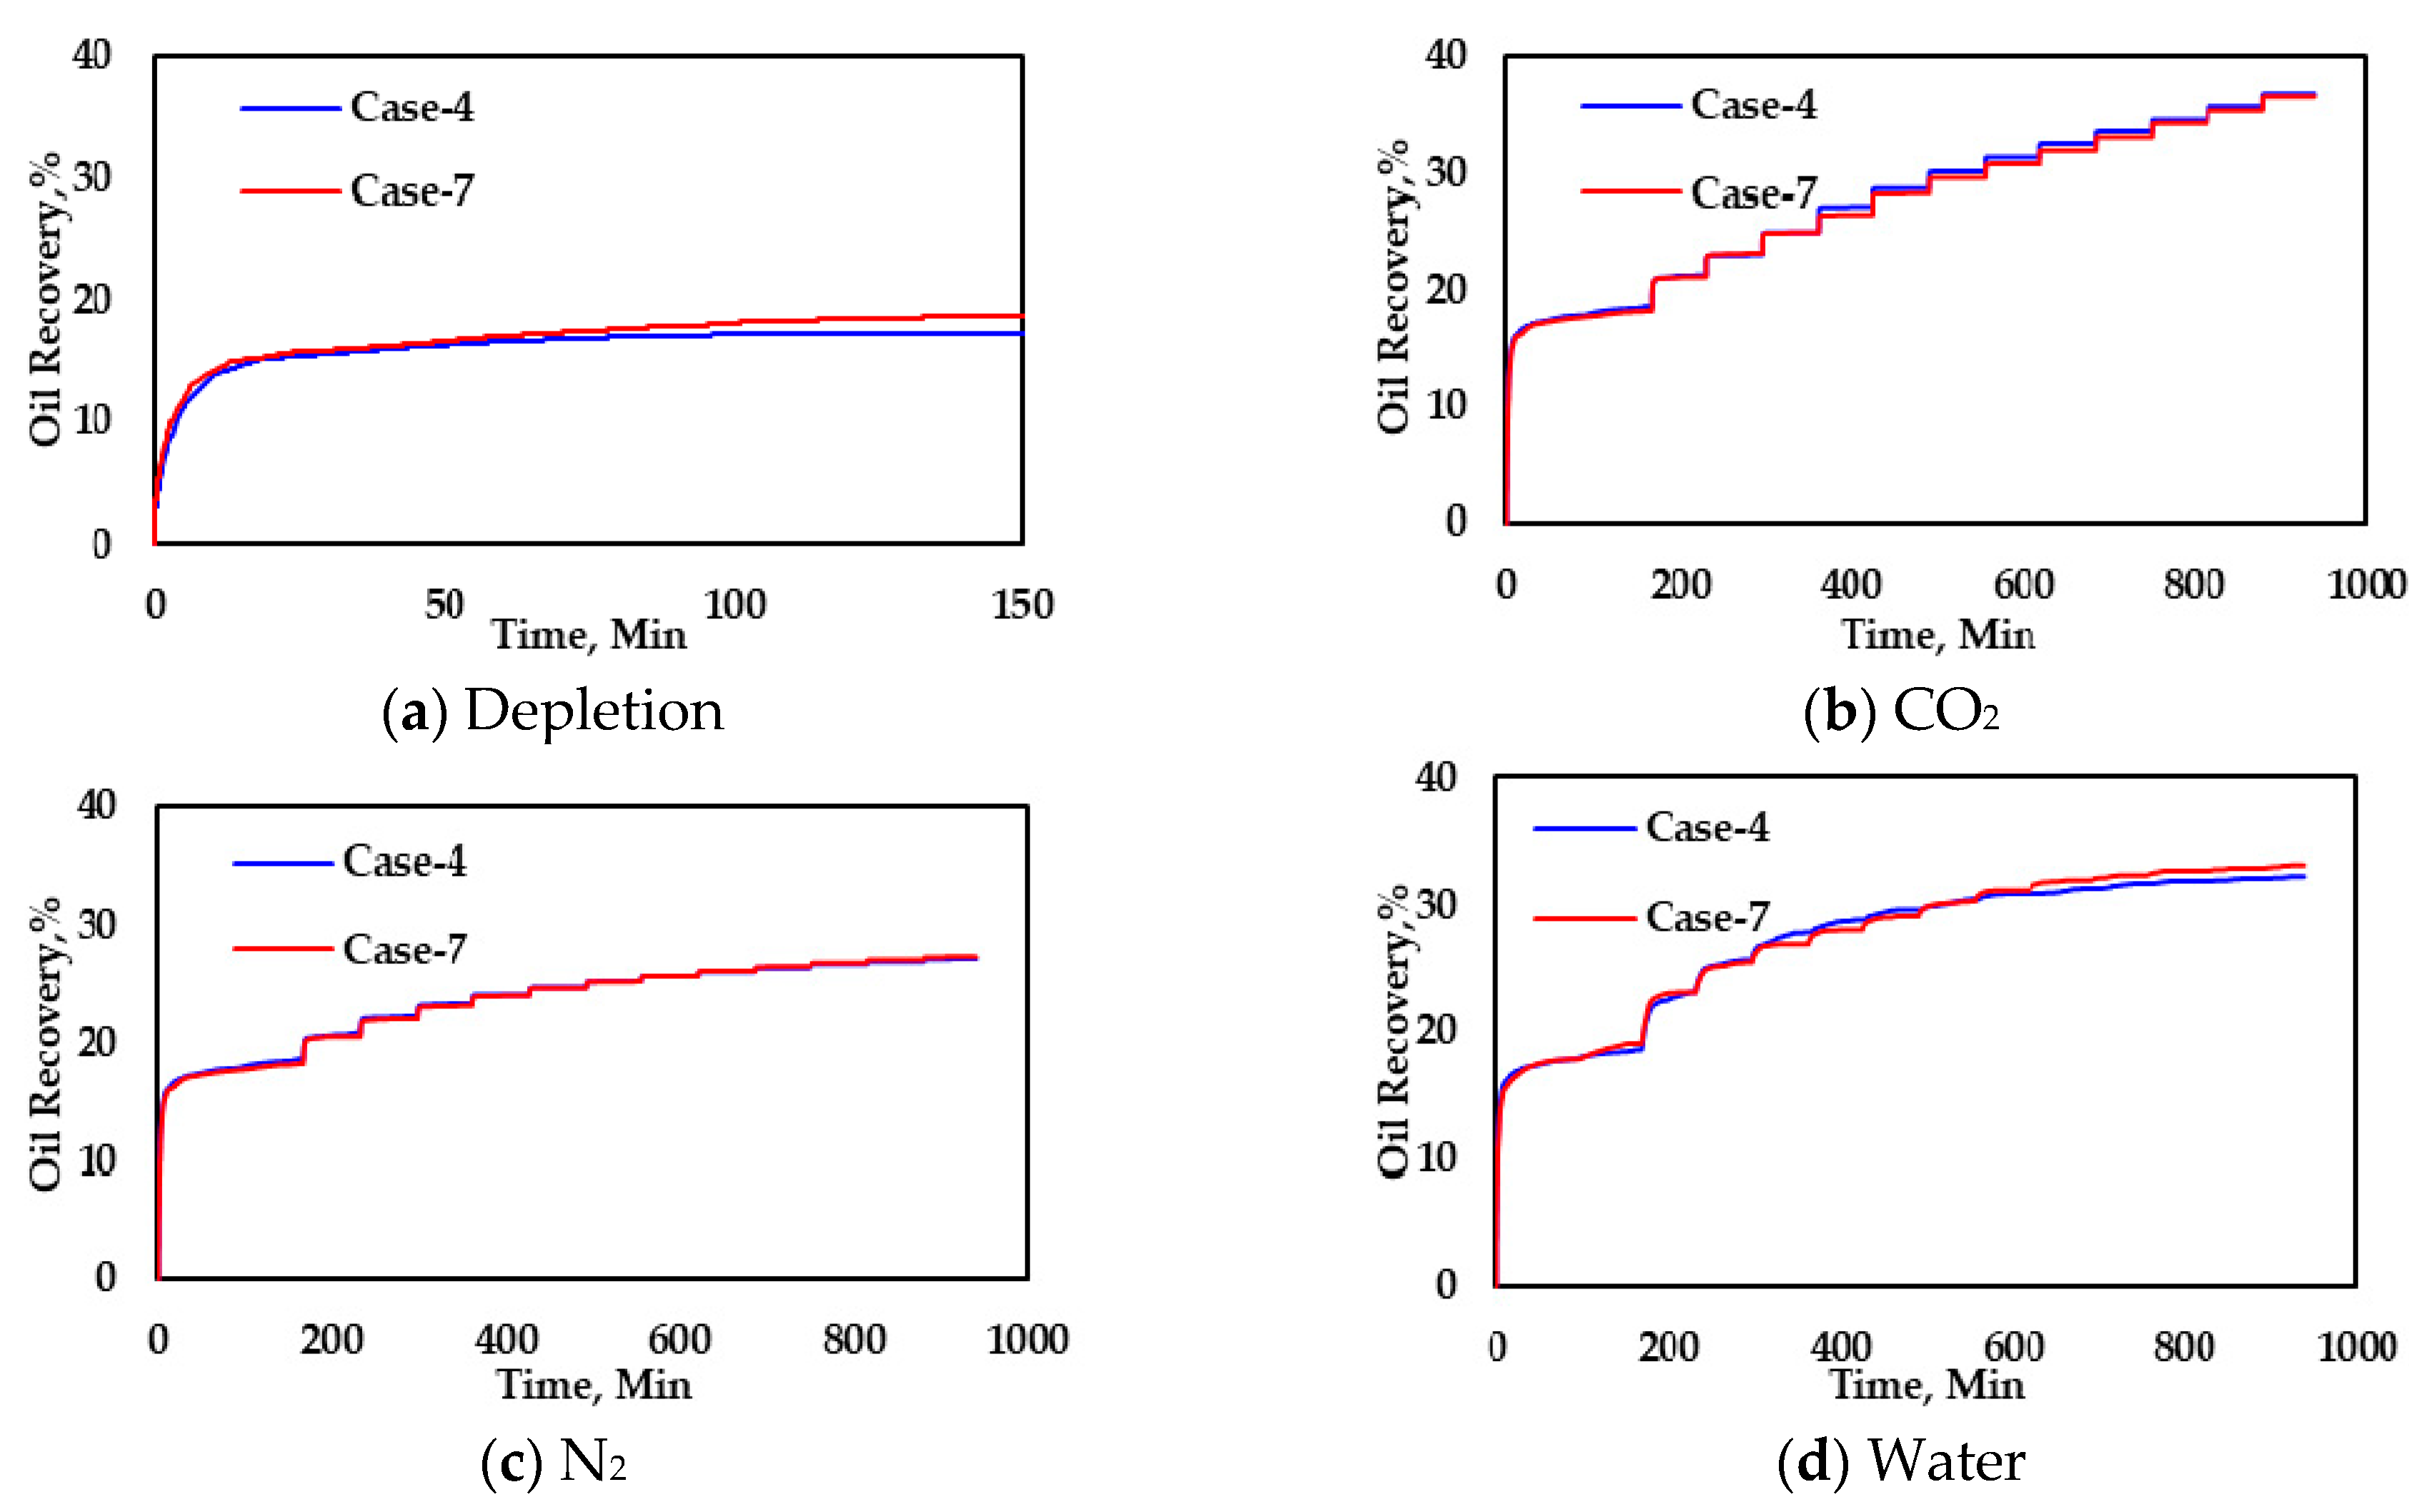
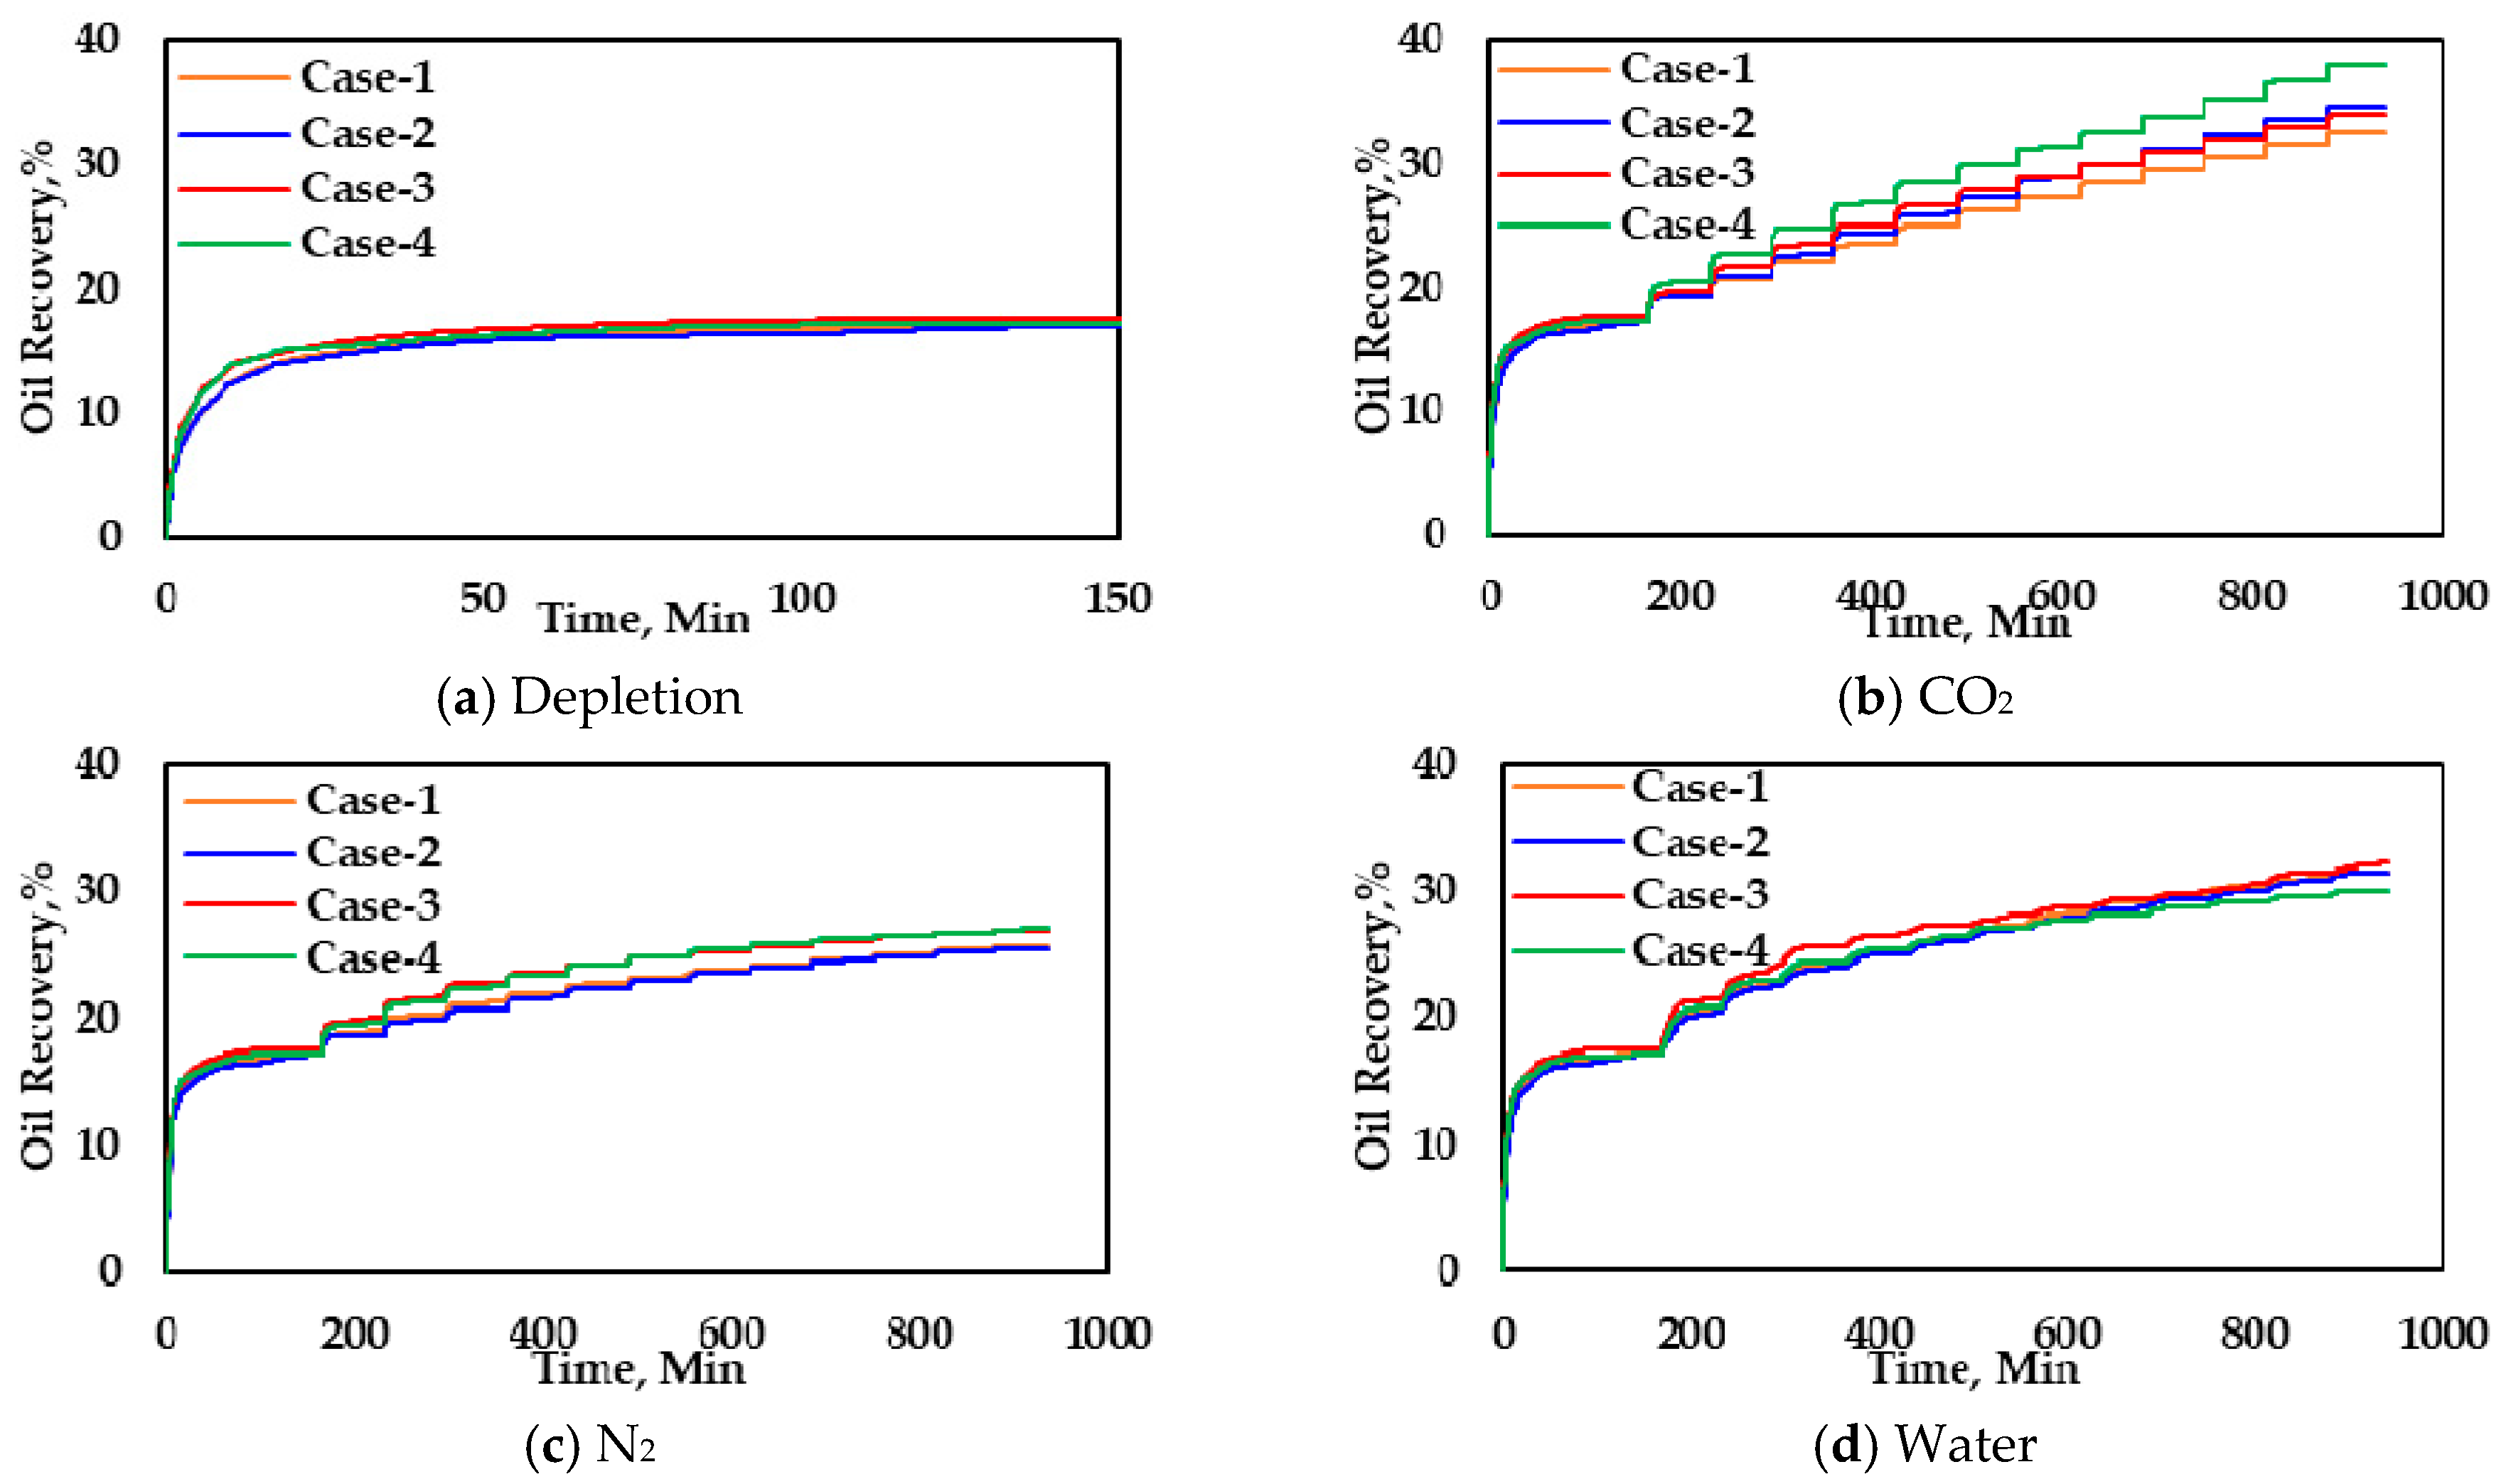
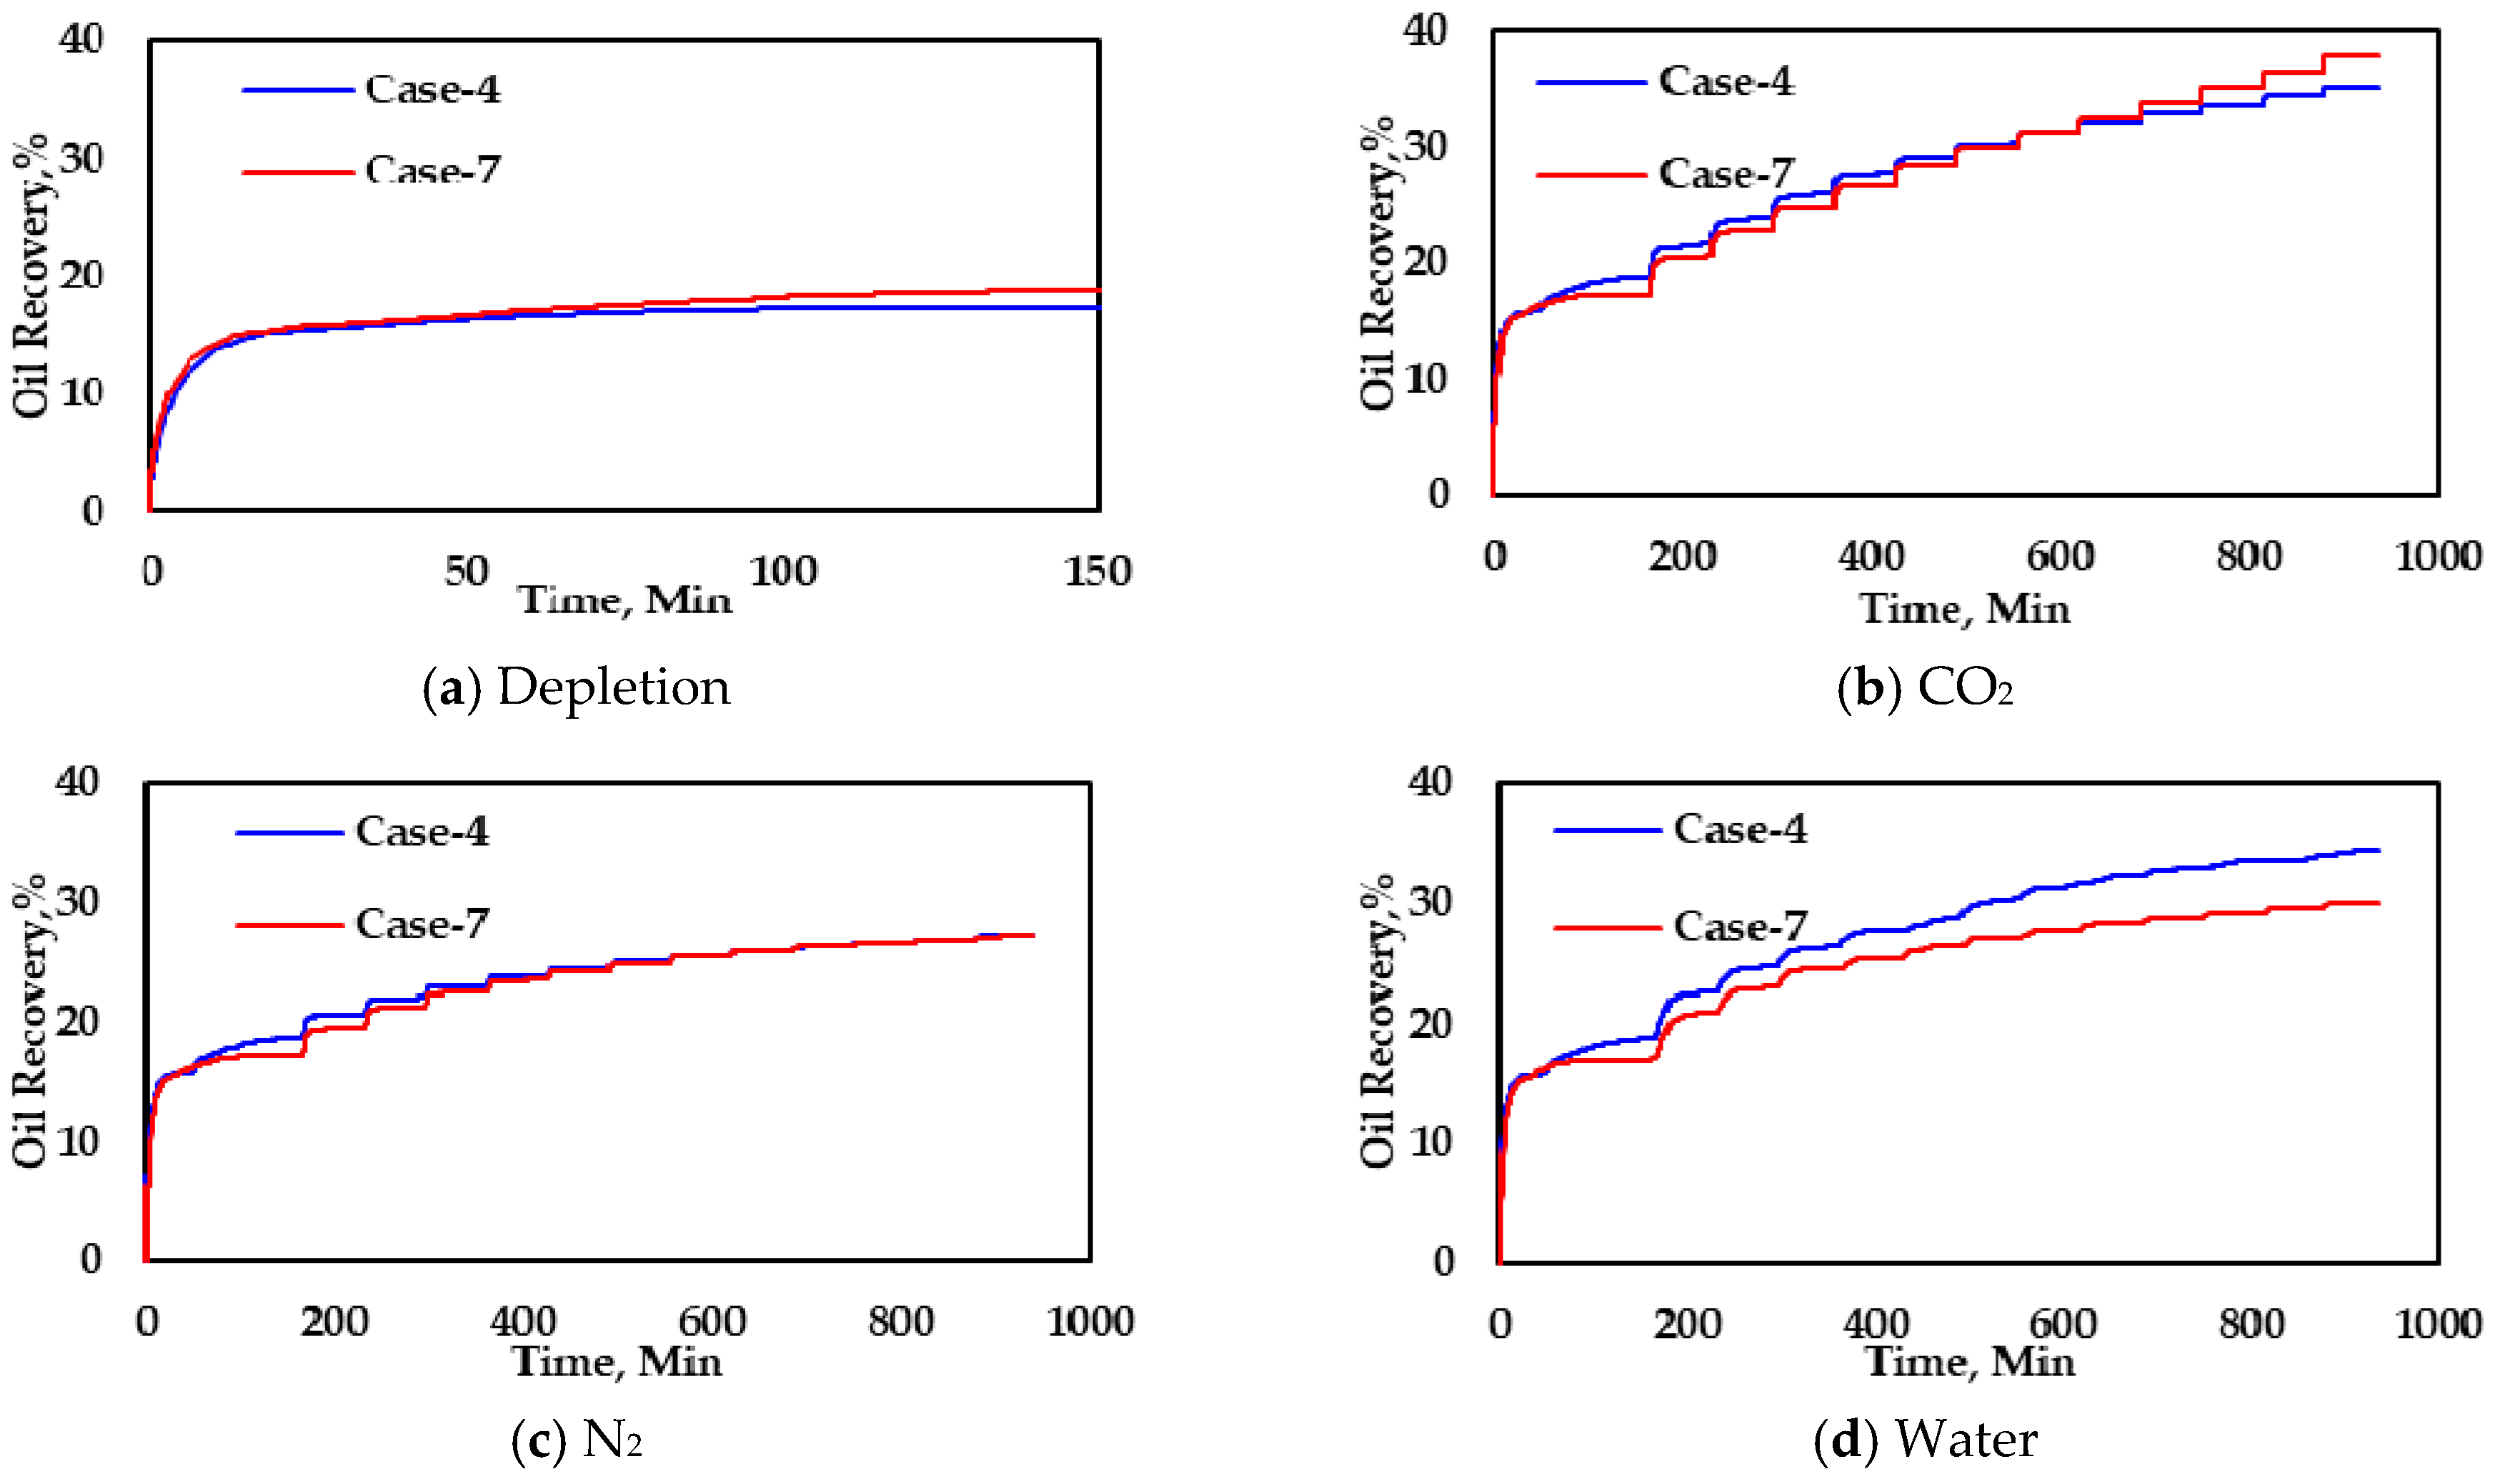
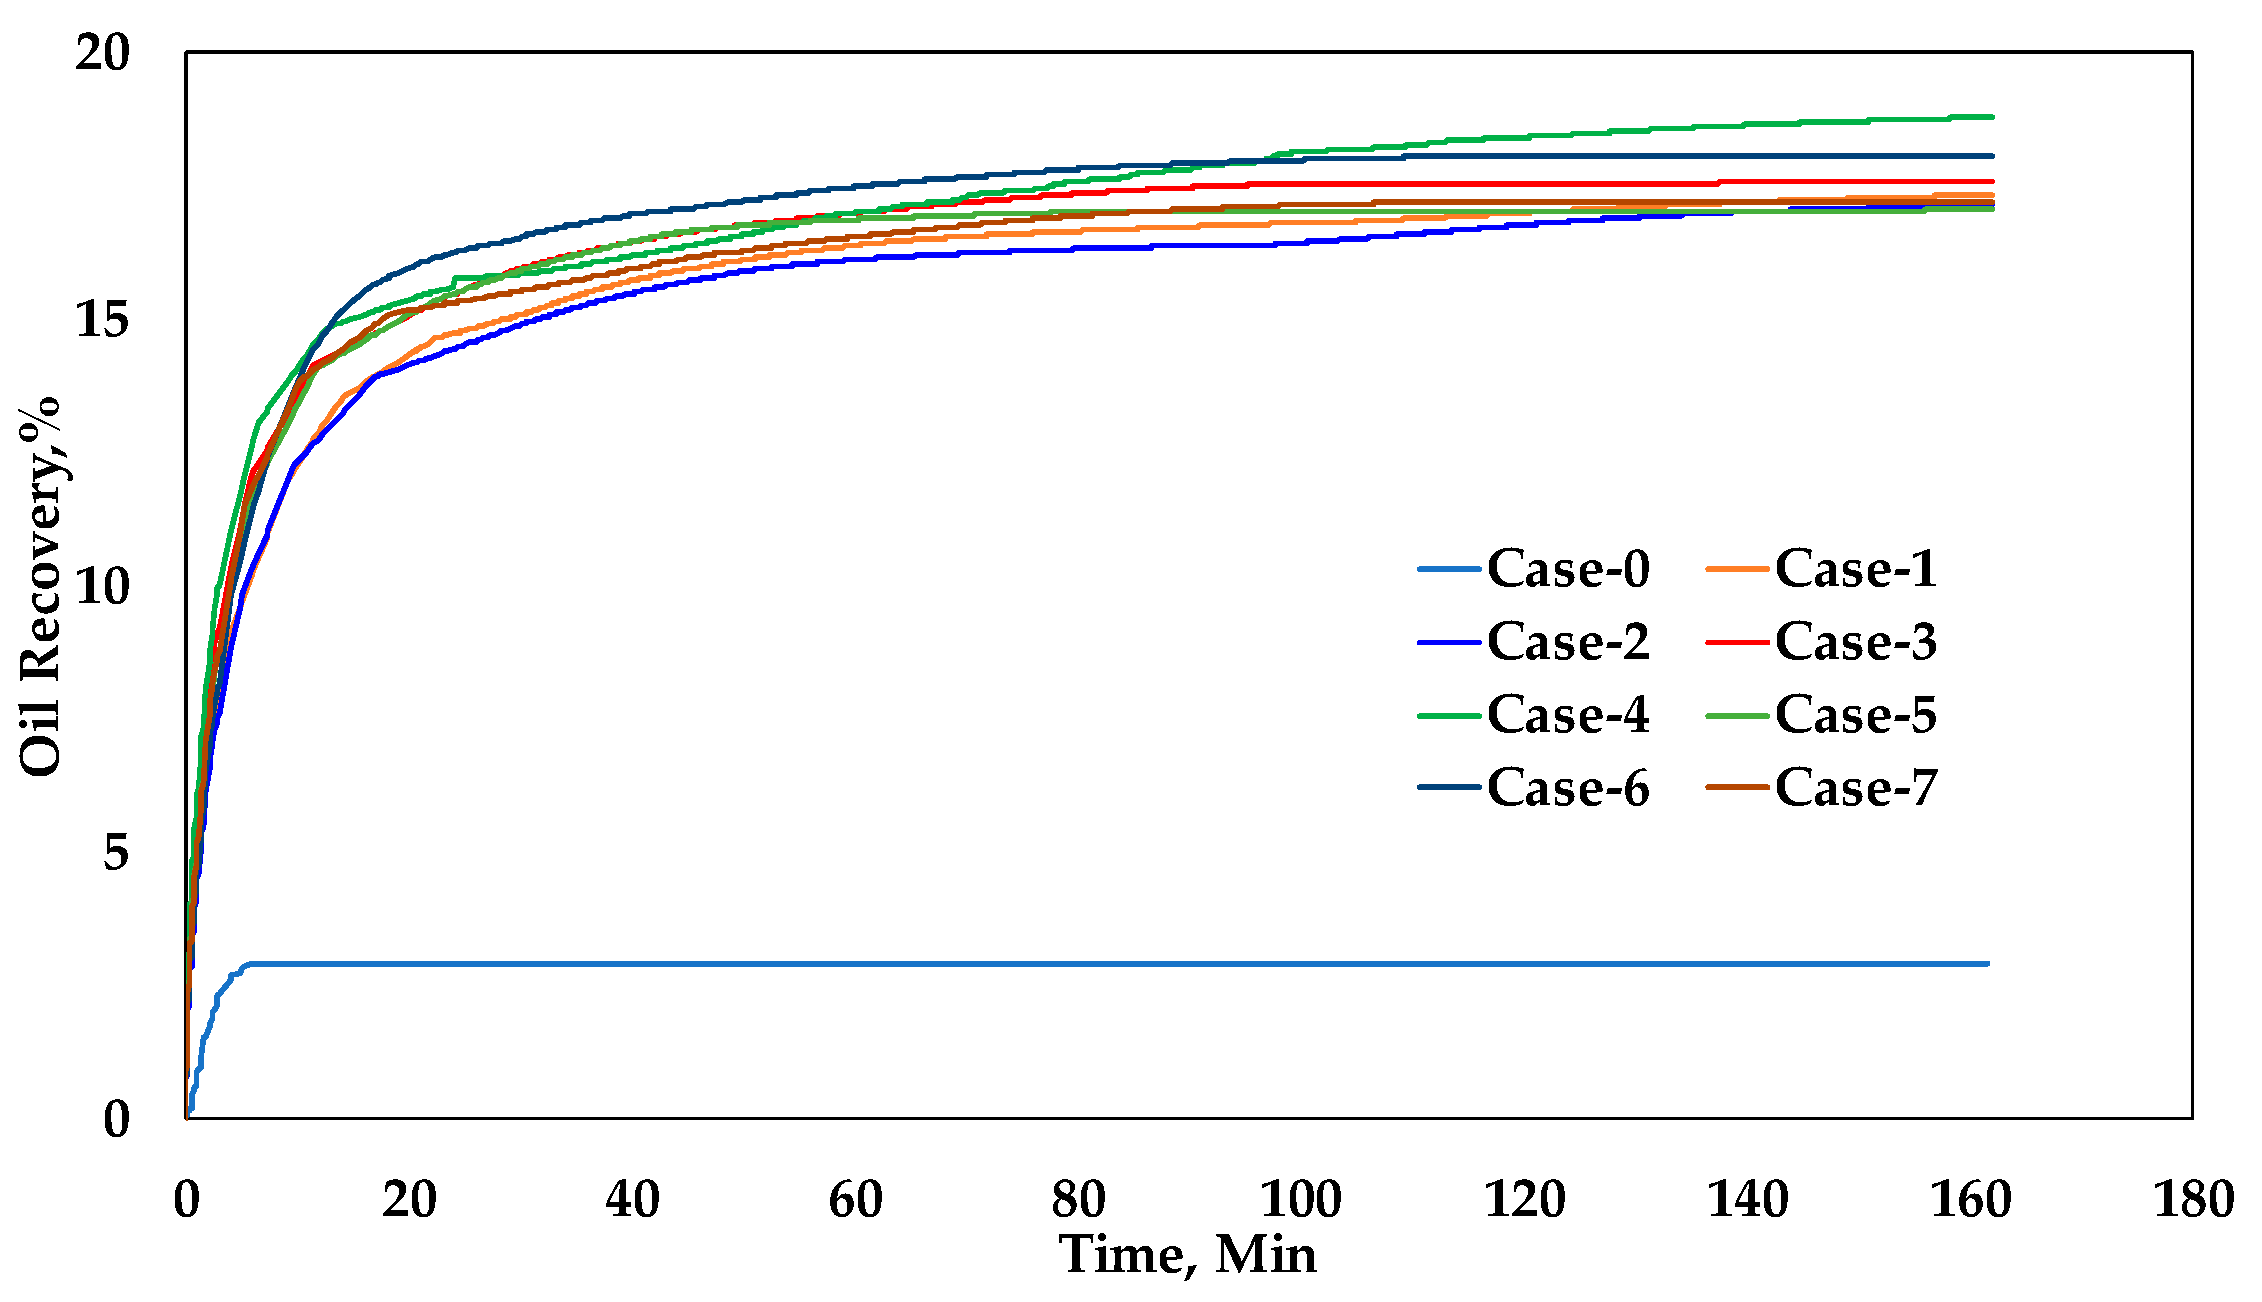
- Based on the core-scale experiments and numerical simulation analyses, the existence of fractures is significant for the enhanced oil process in tight reservoirs. The presence of fractures not only has a significant effect on the depletion mode, but also has an important effect on the enhanced oil recovery (EOR) performance of the huff-‘n-puff method. After comparison, fracture arrangement in space has most impact on CO2 huff-‘n-puff, followed by water and finally N2.
- (3)
- In the depletion mode, crude oil flows mainly due to the pressure drop caused by elastic energy, and there is no contact between other fluids and crude oil in the matrix through fractures. Therefore, in the case of depletion mode, when fractures have the same contact area with spatial arrangement, the obvious difference in oil recovery cannot be observed.
- (4)
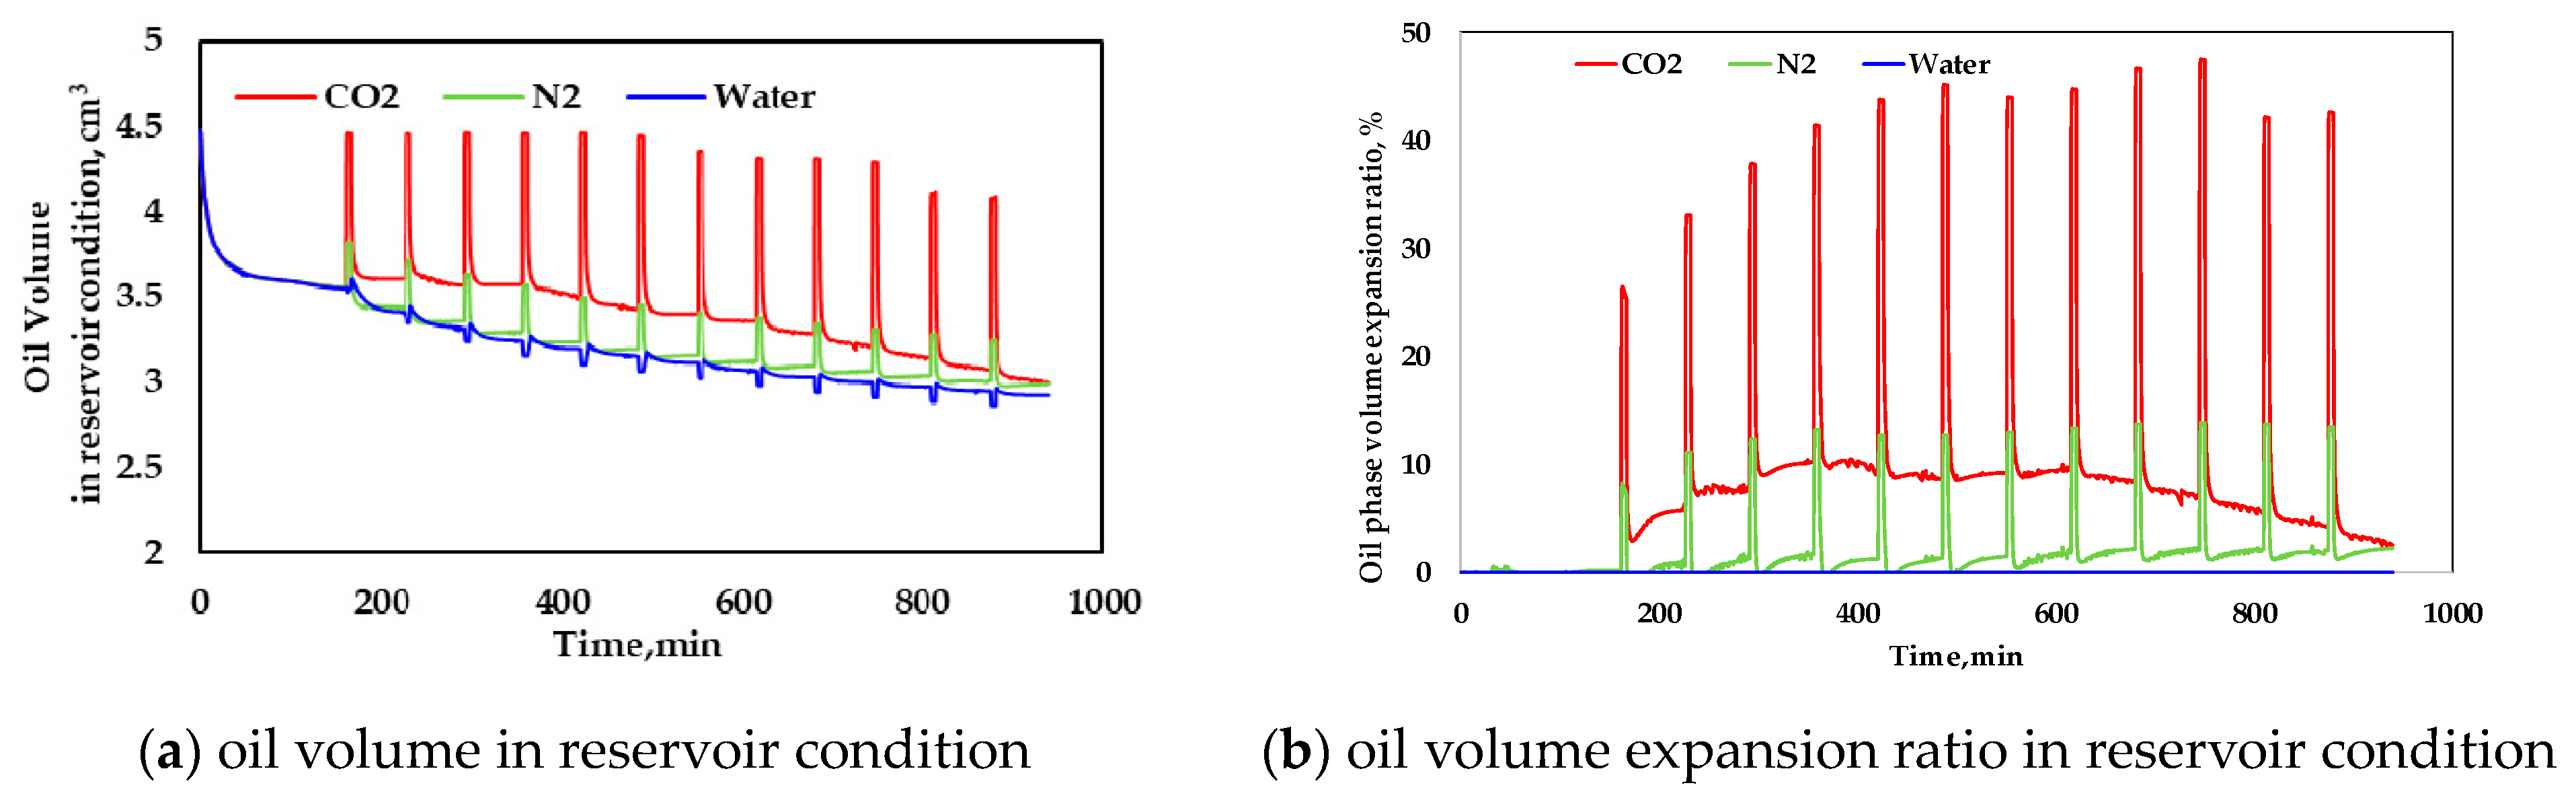
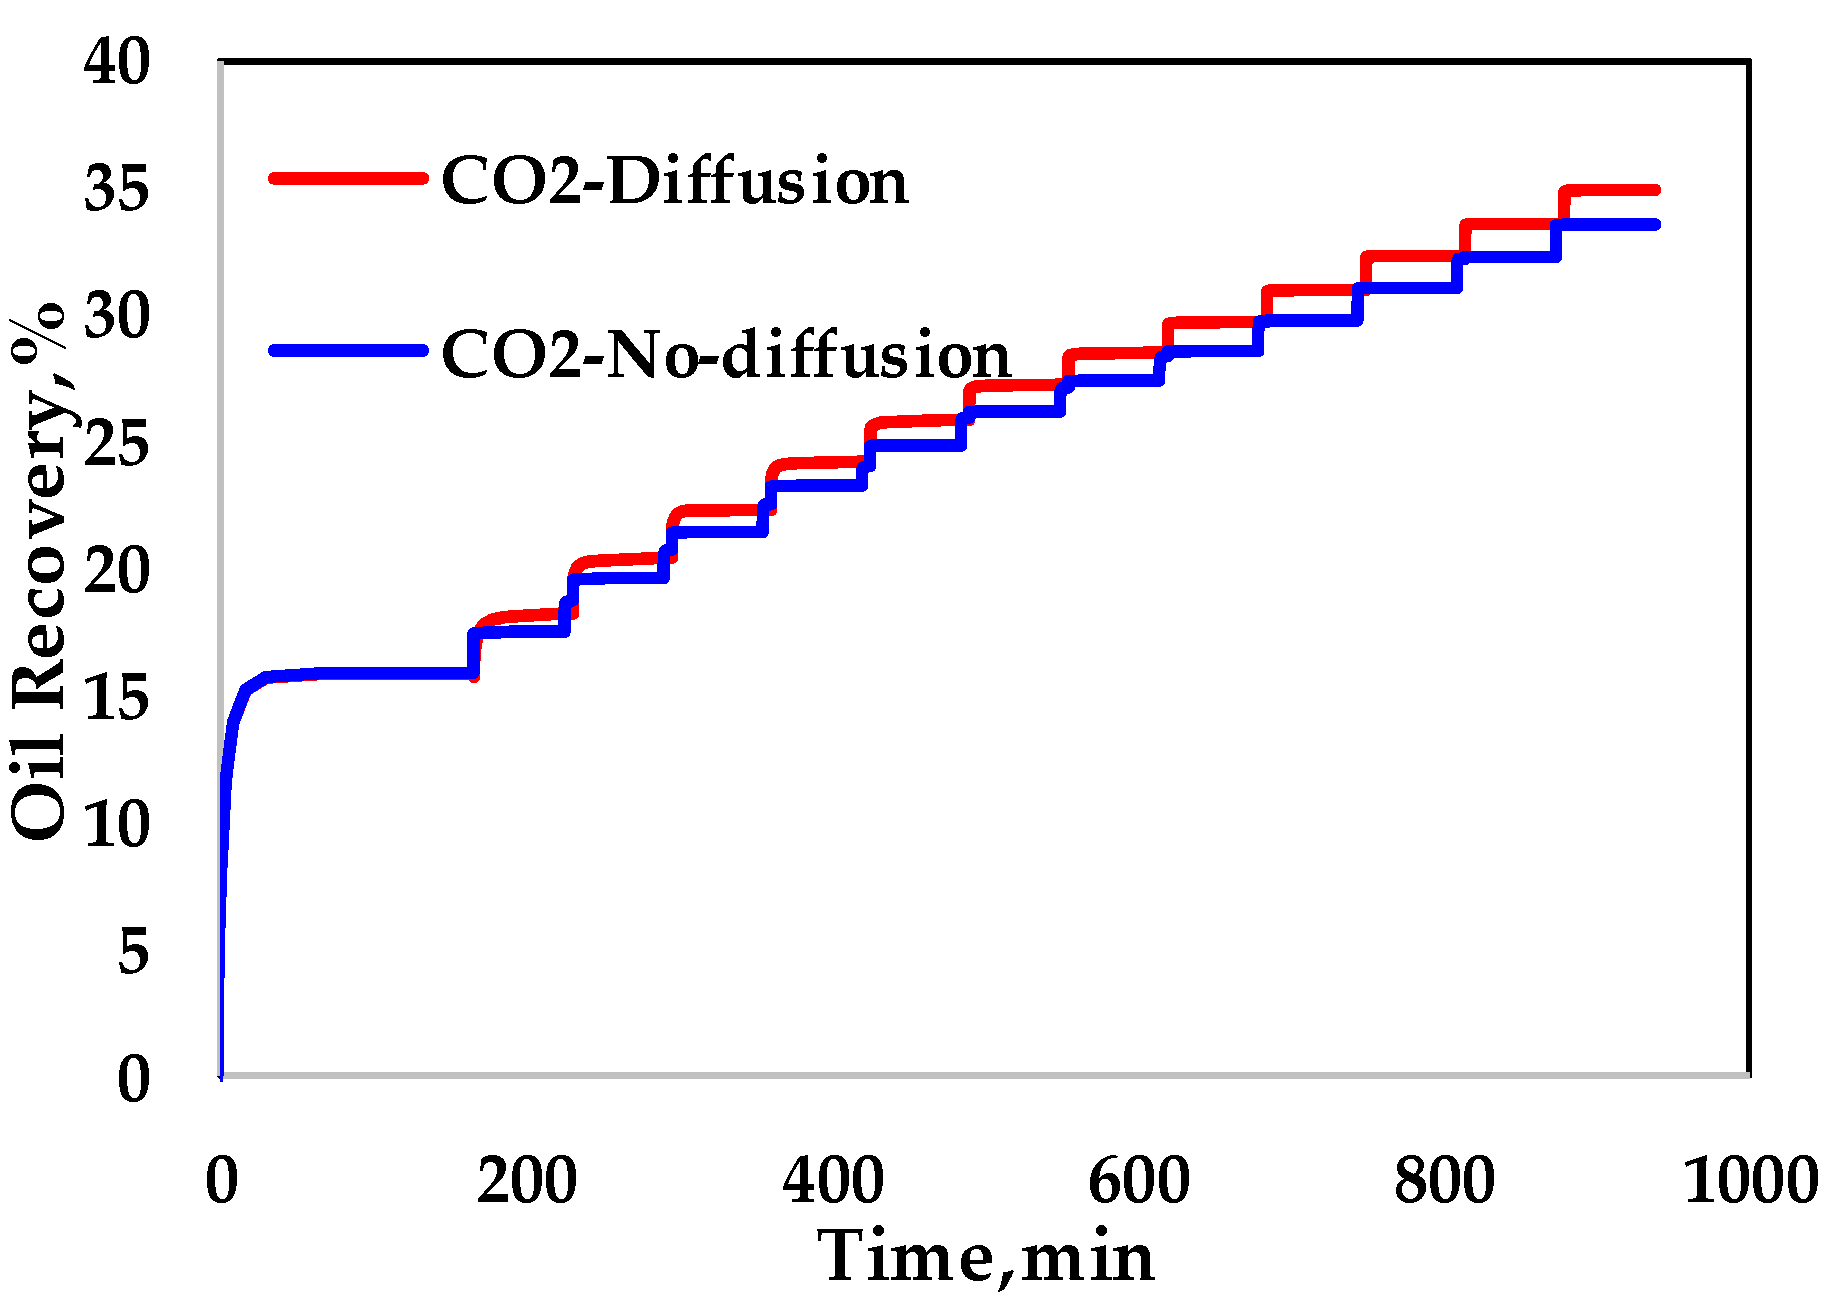
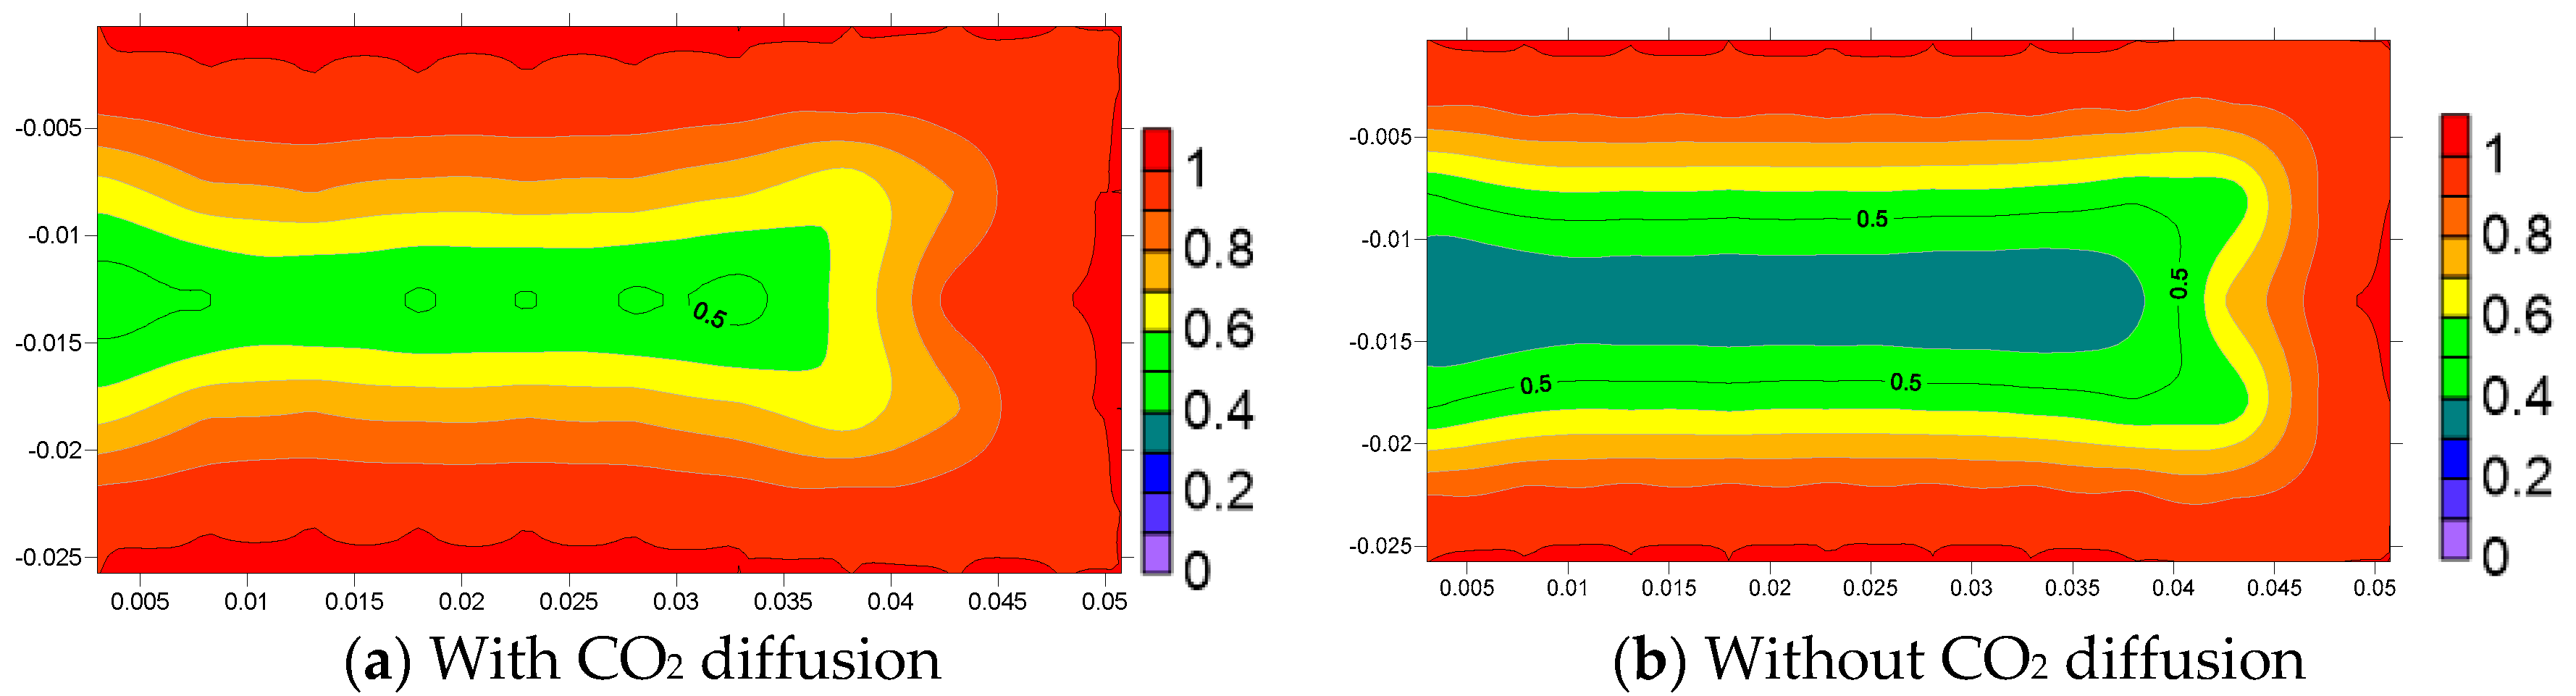
- CO2 has more advantages over water and N2 in tight reservoir with huff-‘n-puff. Through the EOR mechanism analysis, CO2 is the only fluid that is miscible with oil (even a 90% mole fraction with CO2 in the oil phase is possible). This solubility of CO2 results in the lowest oil phase viscosity in the three cases. The CO2 diffusion mechanism is pronounced. In contrast, N2 mainly exists in the gas phase and is much less soluble in the oil phase compared to CO2, however, it still has a certain swelling effect on crude oil. Water does not dissolve in the oil and water mainly enhances oil recovery through capillary force, gravity and elasticity displacement.
- (5)
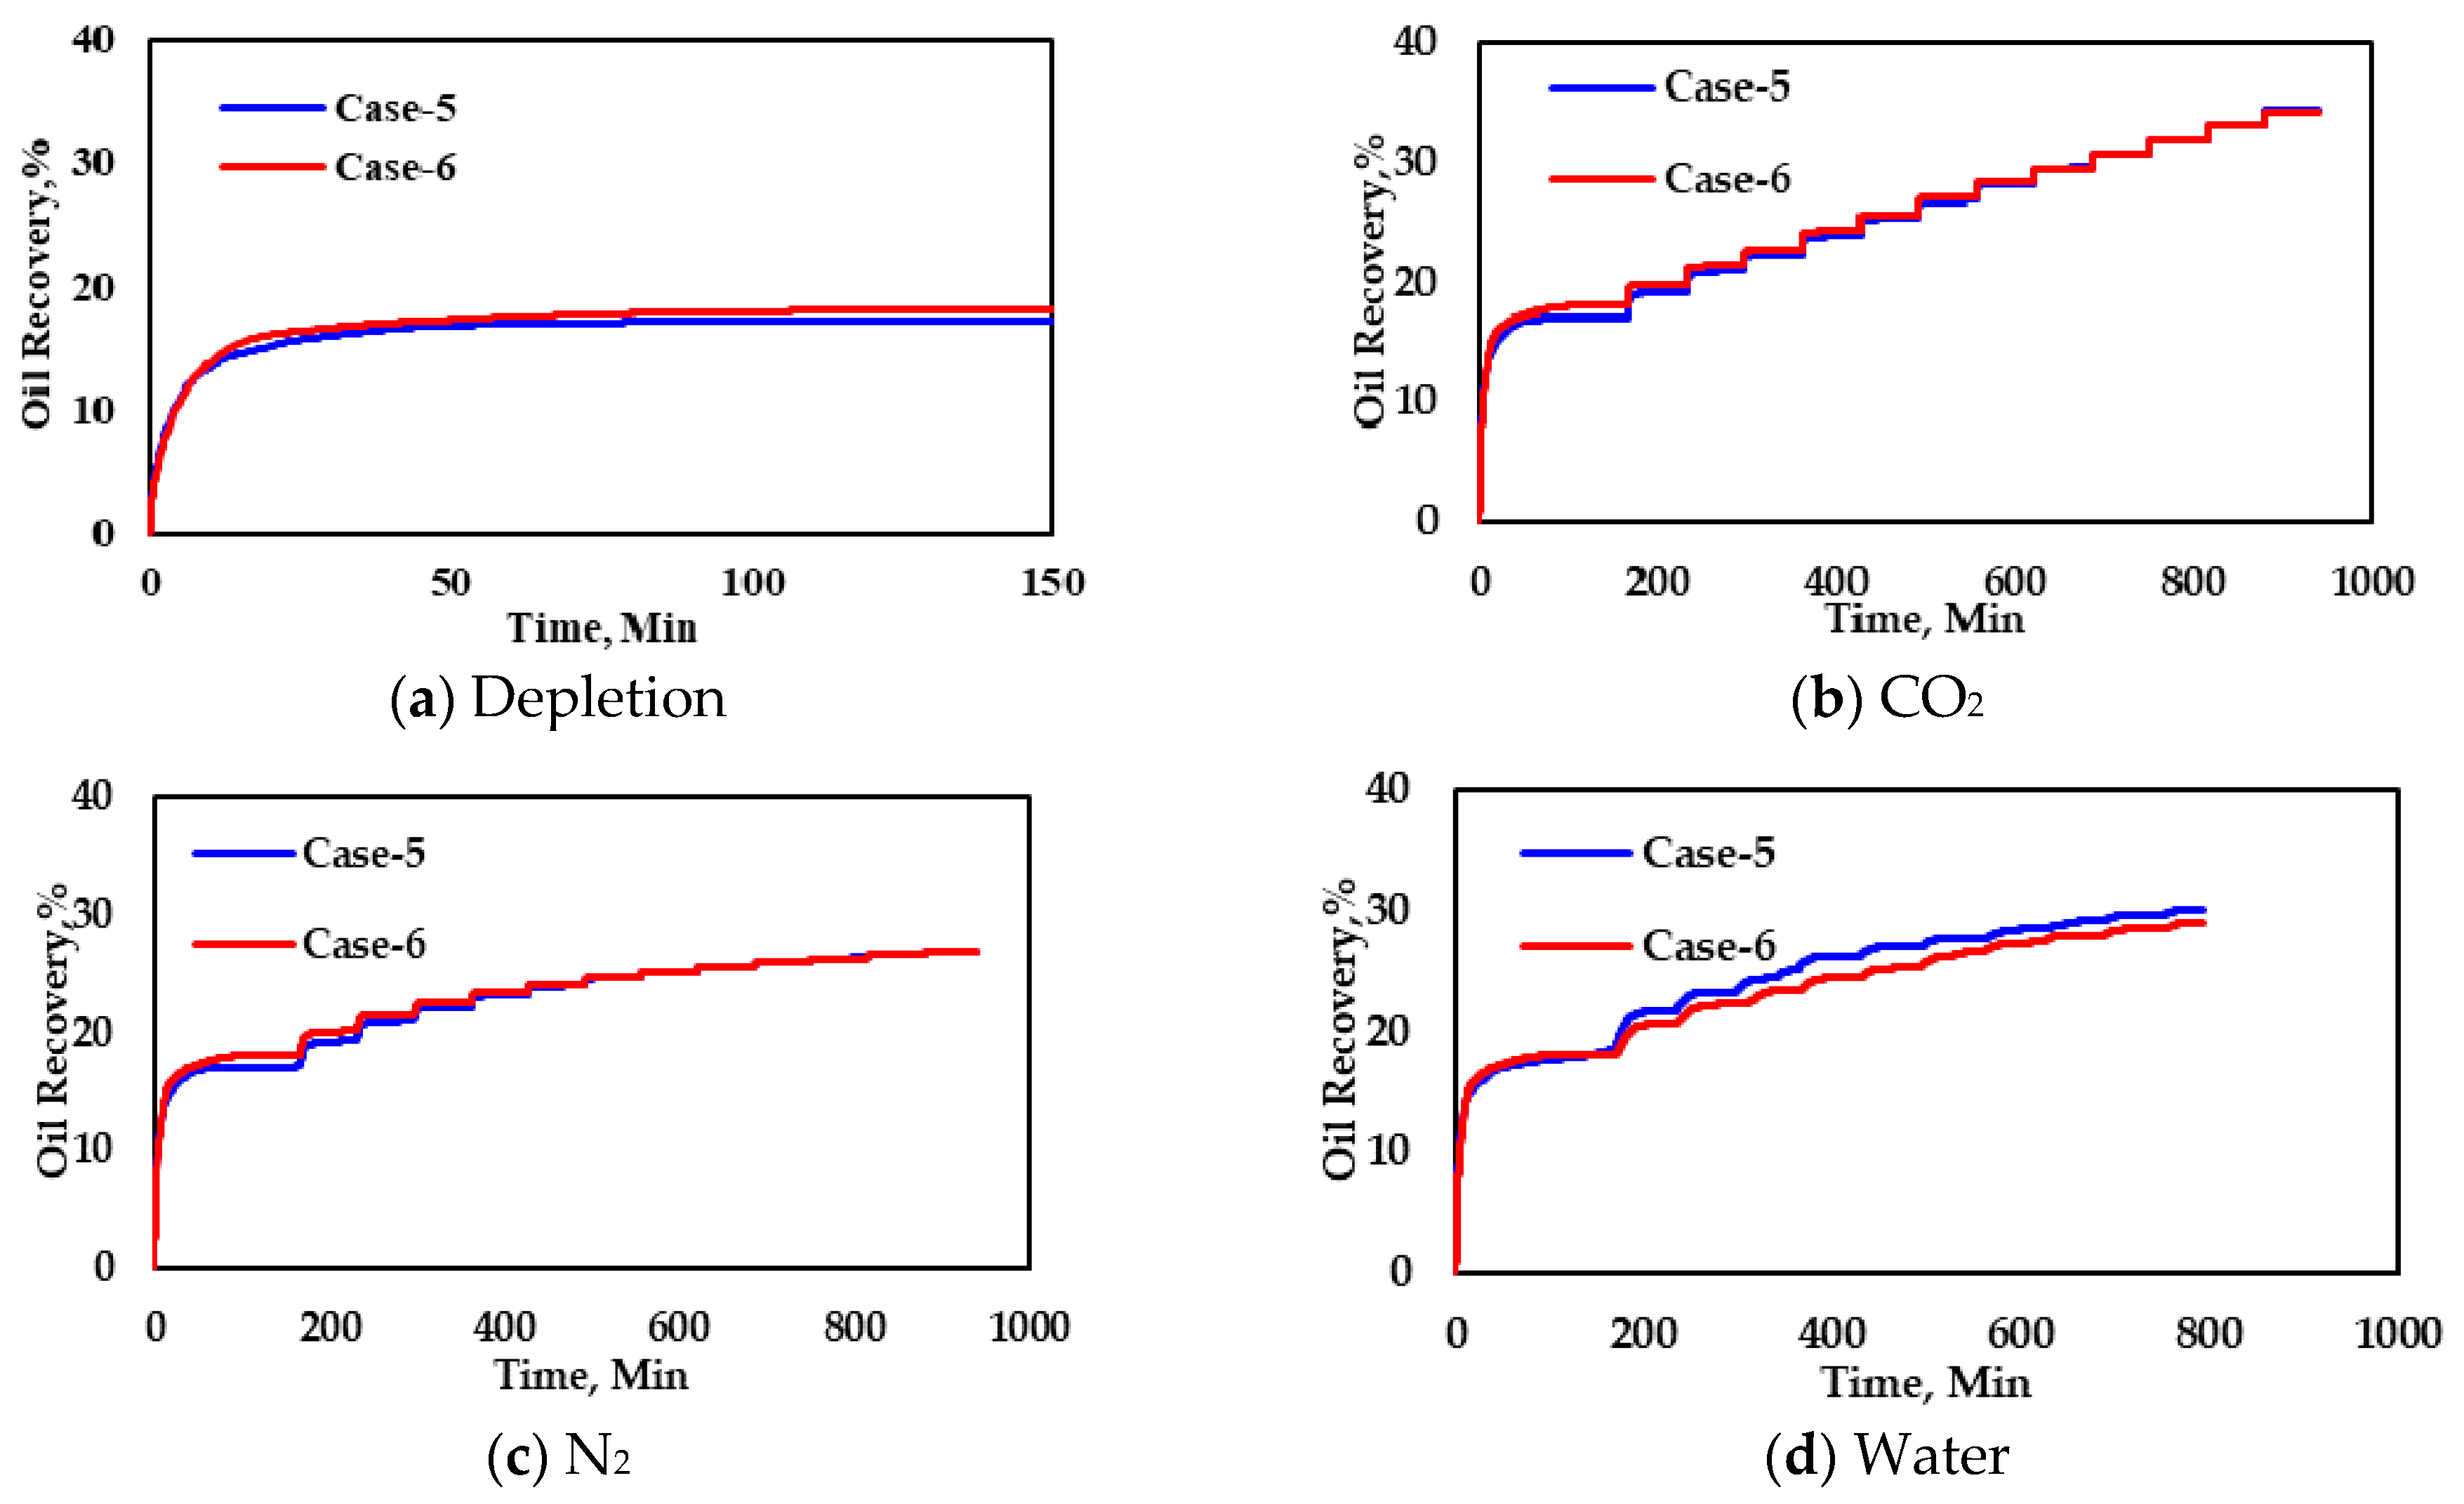
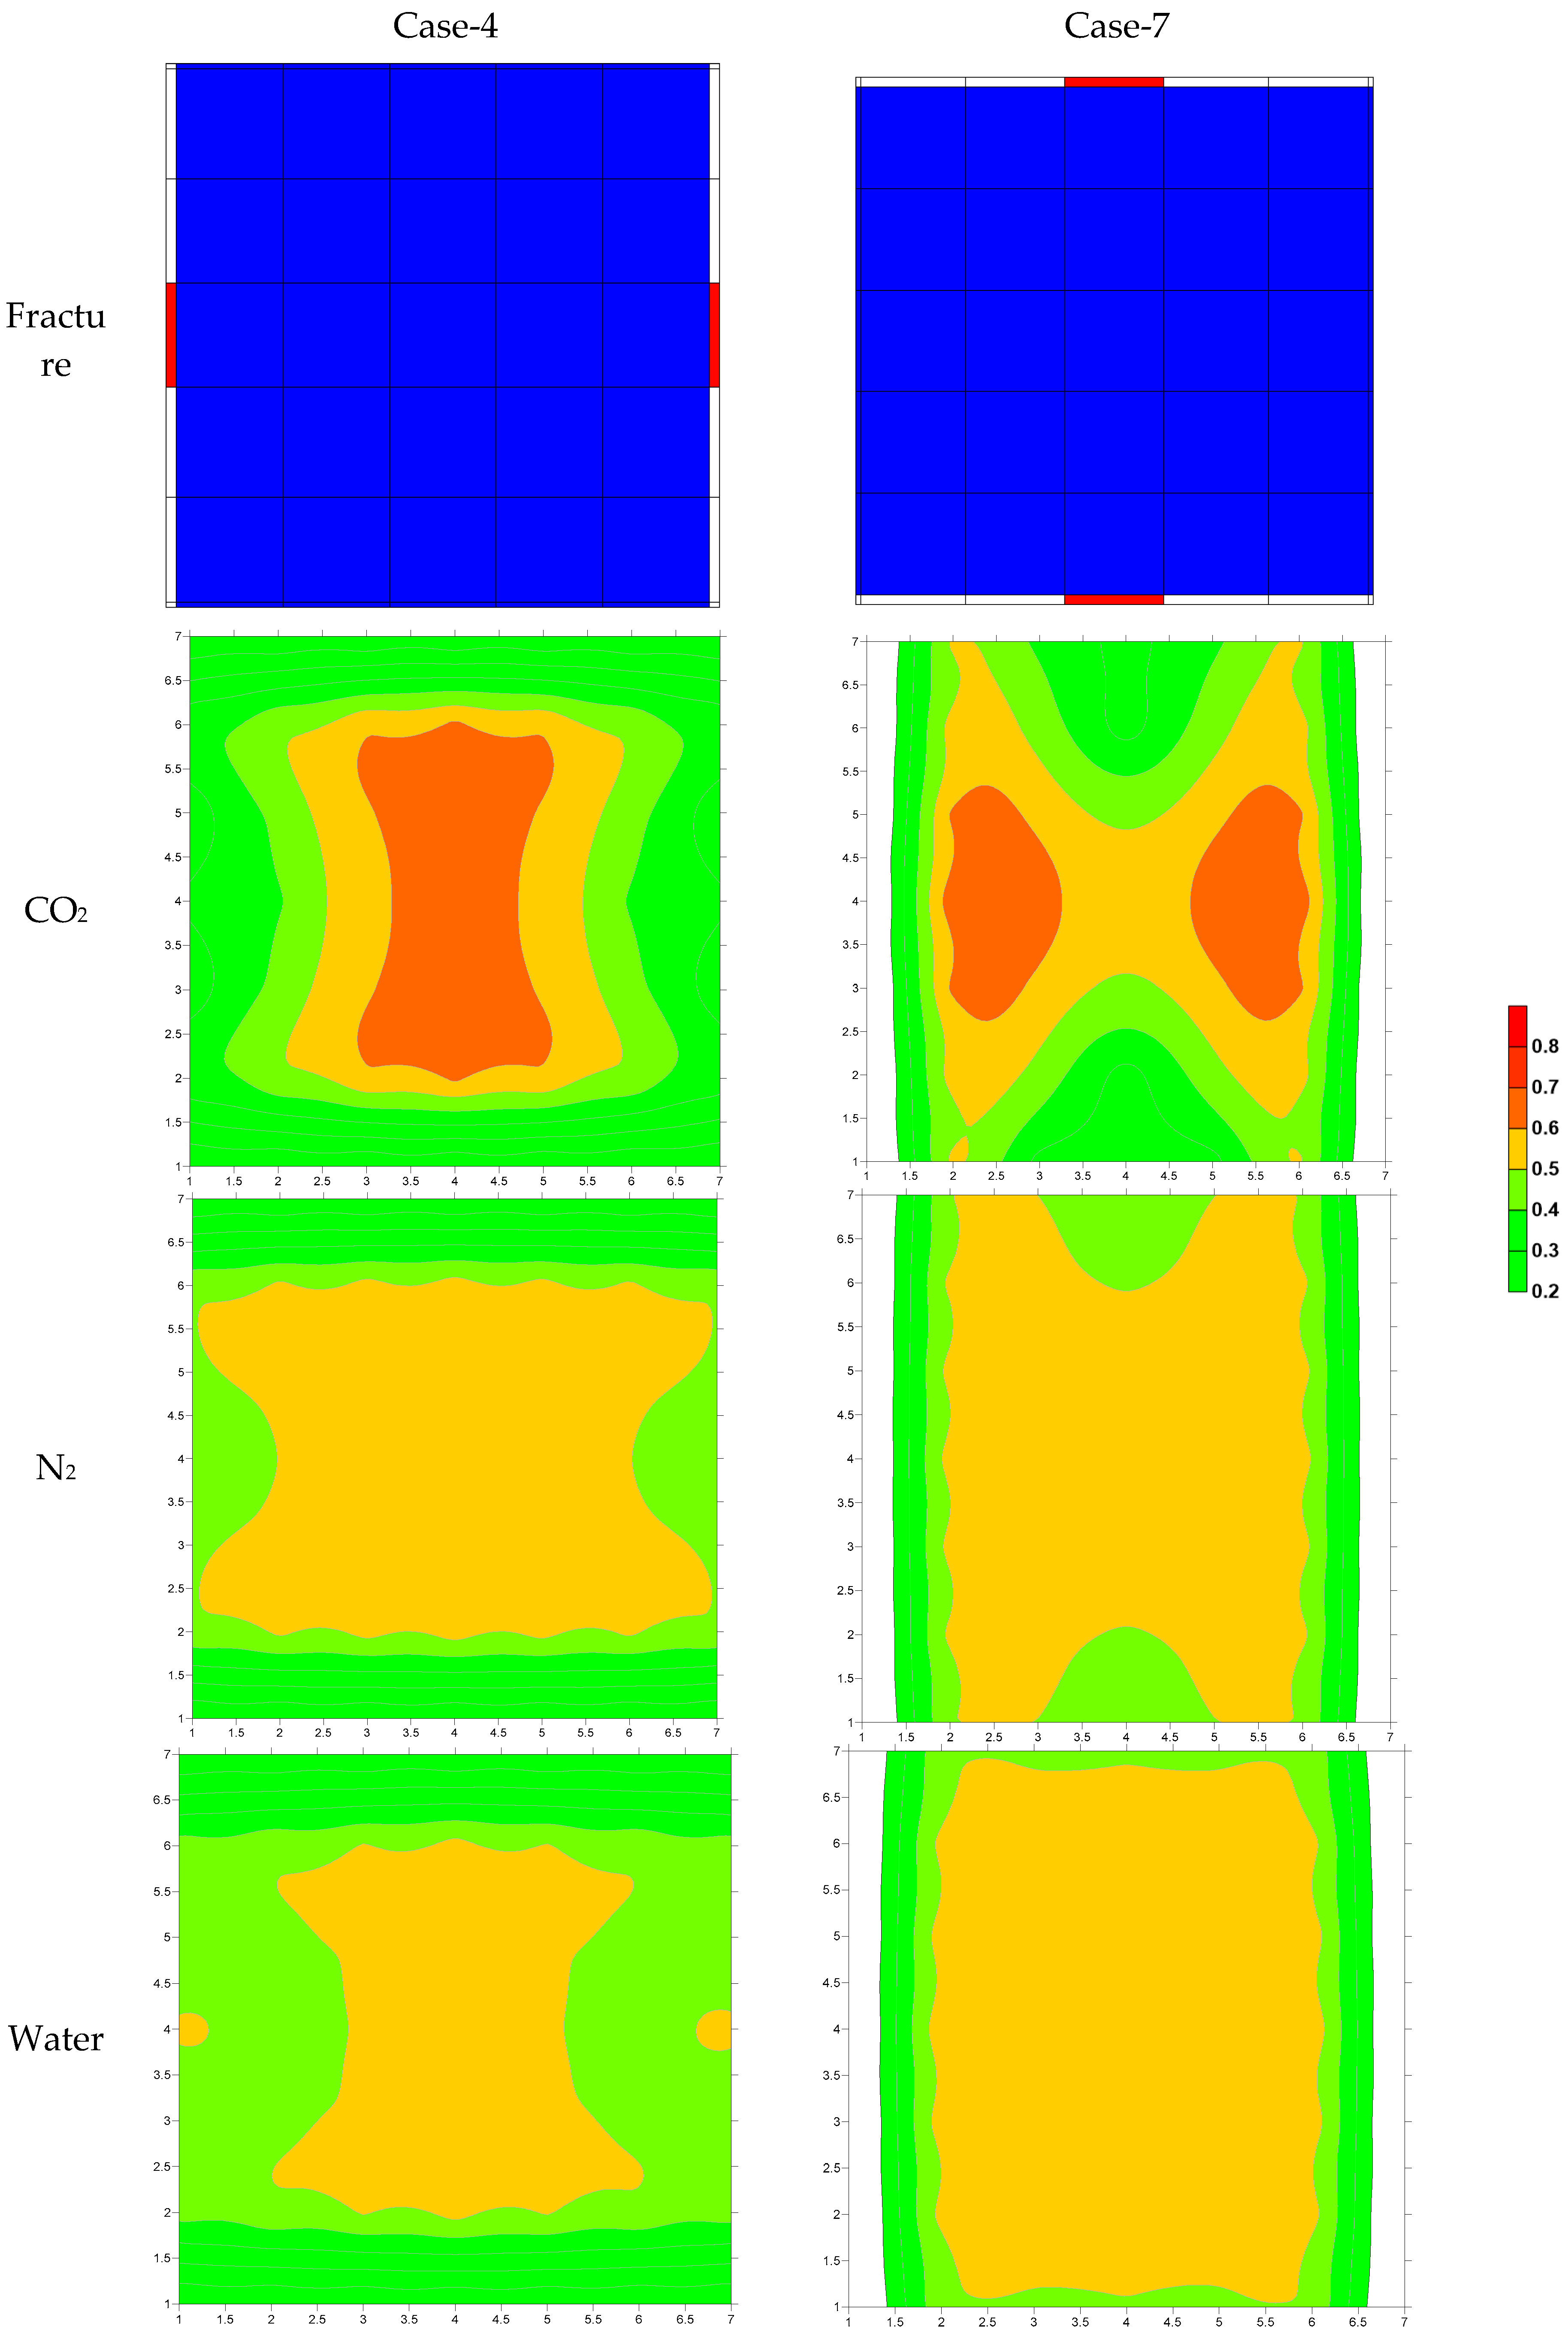
- When considering the anisotropy, the direction of fracture will have a greater impact on oil recovery for the water huff-‘n-puff. The conclusion from this comparison is that permeability anisotropy plays a significant role in the water case (Case-7 is 4.38% higher than Case-4; but anisotropy has a negligible impact on CO2 and N2).
- (6)
- When it comes to the relative location between well and fracture, for the depletion development mode, the far-well fracture has an advantage over the near well case by 1% higher oil recovery. In the CO2 and N2 huff-‘n-puff modes, the oil recovery of the two fracture types are not much different. In water huff-‘n-puff, the fractures near the well have a better effect on the EOR process.
- (7)
- The fracture contact area is not sensitive for the huff-‘n-puff process for N2 and water cases based on this research.
- (8)
- From analysis of the produced components, CO2 gives the most incremental C19 and C30 compared to depletion. However, in the water case, more C7 are produced, leaving a depleted heavy mass that causes an increase in the viscosity of the crude oil. N2 has the least incremental effect oil components for all carbon number ranges.
- (9)
- Finally, the main EOR effect is mainly applied by the fluid. Fractures only provide a more efficient and convenient channel, and offer a better contact relationship for fluids to exert their EOR effects. In the fluid selection of tight reservoir EOR huff-n-puff, it is necessary to accurately and reasonably evaluate the distribution characteristics of fractures, and select the optimal injected fluid for specific fracture morphology.
Author Contributions
Funding
Acknowledgments
Conflicts of Interest
References
- Pollastro, R.M. Total petroleum system assessment of undiscovered resources in the giant Barnett Shale continuous (unconventional) gas accumulation, Fort Worth Basin, Texas. AAPG Bull. 2007, 91, 551–578. [Google Scholar] [CrossRef]
- Miller, B.; Paneitz, J.; Mullen, M.; Meijs, R.; Tunstall, K.; Garcia, M. The Successful Application of a Compartmental Completion Technique Used to Isolate Multiple Hydraulic-Fracture Treatments in Horizontal Bakken Shale Wells in North Dakota. In Proceedings of the SPE Annual Technical Conference and Exhibition, Denver, CO, USA, 21–24 September 2008. [Google Scholar]
- Loucks, R.G.; Reed, R.M.; Ruppel, S.C.; Jarvie, D.M. Morphology, Genesis, and Distribution of Nanometer-Scale Pores in Siliceous Mudstones of the Mississippian Barnett Shale. J. Sediment. Res. 2009, 79, 848–861. [Google Scholar] [CrossRef]
- Jia, C.; Caineng, Z.; Jianzhong, L.; Denghua, L.; Min, Z. Evaluation criteria, main types, basic characteristics and resource prospects of China’s tight oil. Acta Pet. Sin. 2012, 33, 343–350. [Google Scholar]
- Hawthorne, S.B.; Gorecki, C.D.; Sorensen, J.A.; Miller, D.J.; Harju, J.A.; Melzer, L.S. Hydrocarbon Mobilization Mechanisms from Upper, Middle, and Lower Bakken Reservoir Rocks Exposed to CO. In Proceedings of the SPE Unconventional Resources Conference Canada, Calgary, AB, Canada, 5–7 November 2013. [Google Scholar]
- Jinhu, D.; Haiqing, H.; Jianzhong, L.; Fuji, H.; Bingcheng, G.; Weipeng, Y. Progress in China’s Tight Oil Exploration and Challenges. China Pet. Explor. 2014, 19, 1–9. [Google Scholar]
- Rungamornrat, J.; Wheeler, M.F.; Mear, M.E. Coupling of Fracture/Non-Newtonian Flow for Simulating Nonplanar Evolution of Hydraulic Fractures. In Proceedings of the SPE Annual Technical Conference and Exhibition, Dallas, TX, USA, 9–12 October 2005. [Google Scholar]
- Kabir, S.; Rasdi, F.; Igboalisi, B.O. Analyzing Production Data from Tight Oil Wells. J. Can. Pet. Technol. 2011, 50, 48–58. [Google Scholar] [CrossRef]
- West, D.R.; Harkrider, J.D.; Barham, M.; Besler, M.R.; Mahrer, K.D. Optimized Production in the Bakken Shale: South Antelope Case Study. In Proceedings of the SPE Unconventional Resources Conference Canada, Calgary, AB, Canada, 5–7 November 2013. [Google Scholar]
- Wang, H.; Liao, X.; Lu, N.; Cai, Z.; Liao, C.; Dou, X. A study on development effect of horizontal well with SRV in unconventional tight oil reservoir. J. Energy Inst. 2014, 87, 114–120. [Google Scholar] [CrossRef]
- Wei, Y.; Ran, Q.; Ran, L.I.; Yuan, J.; Dong, J. Determination of dynamic reserves of fractured horizontal wells in tight oil reservoirs by multi-region material balance method. Pet. Explor. Dev. 2016, 43, 490–498. [Google Scholar] [CrossRef]
- Sohrabi, M.; Tehrani, D.H.; Danesh, A.; Henderson, G.D. Visualisation of Oil Recovery by Water Alternating Gas (WAG) Injection Using High Pressure Micromodels—Oil-Wet & Mixed-Wet Systems. In Proceedings of the SPE Annual Technical Conference and Exhibition, New Orleans, LA, USA, 30 September–3 October 2001. [Google Scholar]
- Ghaderi, S.M.; Clarkson, C.R.; Kaviani, D. Evaluation of Recovery Performance of Miscible Displacement and WAG Processes in Tight Oil Formations. In Proceedings of the SPE/EAGE European Unconventional Resources Conference and Exhibition, Society of Petroleum Engineers, Vienna, Austria, 20–22 March 2012. [Google Scholar]
- Holtz, M.H. Immiscible Water Alternating Gas (IWAG) EOR: Current State of the Art. In Proceedings of the SPE Improved Oil Recovery Conference, Tulsa, OK, USA, 11–13 April 2016. [Google Scholar]
- Yu, W.; Lashgari, H.R.; Wu, K.; Sepehrnoori, K. CO2 injection for enhanced oil recovery in Bakken tight oil reservoirs. Fuel 2015, 159, 354–363. [Google Scholar] [CrossRef]
- Hoffman, B.T. Comparison of Various Gases for Enhanced Recovery from Shale Oil Reservoirs. In Proceedings of the SPE Improved Oil Recovery Symposium, Society of Petroleum Engineers, Tulsa, OK, USA, 14–18 April 2012. [Google Scholar]
- Arshad, A.; Al-Majed, A.A.; Menouar, H.; Muhammadain, A.M.; Mtawaa, B. Carbon Dioxide (CO2) Miscible Flooding in Tight Oil Reservoirs: A Case Study. In Proceedings of the Kuwait International Petroleum Conference and Exhibition, Kuwait City, Kuwait, 14–16 December 2009. [Google Scholar]
- Song, C.; Yang, D. Performance Evaluation of CO2 Huff-n-Puff Processes in Tight Oil Formations. In Proceedings of the SPE Unconventional Resources Conference Canada, Calgary, AB, Canada, 5–7 November 2013. [Google Scholar]
- Wang, H.; Liao, X.; Lu, N.; Cai, Z.; Liao, C.; Dou, X. The Study of CO2 Flooding of Horizontal Well with SRV in Tight Oil Reservoir. In Proceedings of the SPE Energy Resources Conference, Port of Spain, Trinidad and Tobago, 9–11 June 2014. [Google Scholar]
- Ren, B.; Ren, S.; Zhang, L.; Huang, H.; Chen, G.; Zhang, H. Monitoring on CO2 Migration in a Tight Oil Reservoir during CO2-EOR Process. In Proceedings of the Carbon Management Technology Conference, Carbon Management Technology Conference: Sugar Land, TX, USA, 17–19 November 2015. [Google Scholar]
- Sheng, J.J. Enhanced oil recovery in shale reservoirs by gas injection. J. Nat. Gas Sci. Eng. 2015, 22, 252–259. [Google Scholar] [CrossRef]
- Yang, Z.; Liu, X.; Zhang, Z.H.; Zhou, T.; Zhao, S.X. Physical simulation of CO2 injection in fractureing horizontal wells in tight oil reservoirss. Acta Pet. Sin. 2015, 36, 724–729. [Google Scholar]
- Torabi, F.; Asghari, K. Performance of CO2 Huff-and-Puff Process in Fractured Media (Experimental Results). In Proceedings of the Canadian International Petroleum Conference, Petroleum Society of Canada: Calgary, AB, USA, 12–14 June 2007; p. 11. [Google Scholar]
- Gamadi, T.D.; Sheng, J.J.; Soliman, M.Y. An Experimental Study of Cyclic CO2 Injection to Improve Shale Oil Recovery. In Proceedings of the SPE Improved Oil Recovery Symposium, Society of Petroleum Engineers: Tulsa, OK, USA, 12–16 April 2014; p. 9. [Google Scholar]
- Ma, J.; Wang, X.Z.; Gao, R.M.; Zeng, F.H.; Huang, C.X.; Tontiwachwuthikul, P.; Liang, Z.W. Enhanced light oil recovery from tight formations through CO2 huff ‘n’ puff processes. Fuel 2015, 154, 35–44. [Google Scholar] [CrossRef]
- Todd, H.B.; Evans, J.G. Improved Oil Recovery IOR Pilot Projects in the Bakken Formation. In Proceedings of the SPE Low Perm Symposium, Society of Petroleum Engineers: Denver, CO, USA, 5–6 May 2016; p. 22. [Google Scholar]
- Wang, L.; Tian, Y.; Yu, X.Y.; Wang, C.; Yao, B.W.; Wang, S.H.; Winterfeld, P.H.; Wang, X.; Yang, Z.Z.; Wang, Y.H. Advances in improved/enhanced oil recovery technologies for tight and shale reservoirs. Fuel 2017, 210, 425–445. [Google Scholar] [CrossRef]
- Hawthorne, S.B.; Gorecki, C.D.; Sorensen, J.A.; Steadman, E.N.; Harju, J.A.; Melzer, S. Hydrocarbon Mobilization Mechanisms Using CO2 in an Unconventional Oil Play. Energy Procedia 2014, 63, 7717–7723. [Google Scholar] [CrossRef]
- Yu, W.; Lashgari, H.; Sepehrnoori, K. Simulation Study of CO2 Huff-n-Puff Process in Bakken Tight Oil Reservoirs. In Proceedings of the SPE Western North American and Rocky Mountain Joint Meeting, Denver, CO, USA, 17–18 April 2014. [Google Scholar]
- Tovar, F.D.; Eide, O.; Graue, A.; Schechter, D. Experimental Investigation of Enhanced Recovery in Unconventional Liquid Reservoirs using CO2: A Look Ahead to the Future of Unconventional EOR. In Proceedings of the SPE Unconventional Resources Conference, Society of Petroleum Engineers: The Woodlands, TX, USA, 1–3 April 2014; p. 9. [Google Scholar]
- Vega, B.; O’Brien, W.J.; Kovscek, A.R. Experimental Investigation of Oil Recovery from Siliceous Shale by Miscible CO2 Injection. In Proceedings of the SPE Annual Technical Conference and Exhibition, Society of Petroleum Engineers: Florence, Italy, 19–22 September 2010; p. 21. [Google Scholar]
- Gamadi, T.D.; Sheng, J.J.; Soliman, M.Y. An Experimental Study of Cyclic Gas Injection to Improve Shale Oil Recovery. In Proceedings of the SPE Annual Technical Conference and Exhibition, New Orleans, LA, USA, 30 September–2 October 2013; p. 9. [Google Scholar]
- Lei, L.; Sheng, J.J. Upscale Methodology for Gas Huff-n-Puff Process in Shale Oil Reservoirs. J. Pet. Sci. Eng. 2017, 153, 36–46. [Google Scholar] [CrossRef]
- Jing, W. Investigations on spontaneous imbibition and the influencing factors in tight oil reservoirs. Fuel 2019, 236, 755–768. [Google Scholar] [CrossRef]
- Jing, W.; Huiqing, L.; Genbao, Q.; Yongcan, P.; Yang, G. Experimental investigation on water flooding and continued EOR techniques in buried-hill metamorphic fractured reservoirs. J. Pet. Sci. Eng. 2018, 171, 529–541. [Google Scholar]
- Kurtoglu, B.; Salman, A. How to Utilize Hydraulic Fracture Interference to Improve Unconventional Development. In Proceedings of the Abu Dhabi International Petroleum Exhibition and Conference, Society of Petroleum Engineers: Abu Dhabi, The United Arab Emirates, 9–12 November 2015; p. 18. [Google Scholar]
- Wei, B.; Li, Q.; Jin, F.; Li, H.; Wang, C. The Potential of a Novel Nanofluid in Enhancing Oil Recovery. Energy Fuels 2016, 30, 2882–2891. [Google Scholar] [CrossRef]
- Meng, Q.; Cai, Z.X.; Cai, J.C.; Yang, F. Oil recovery by spontaneous imbibition from partially water-covered matrix blocks with different boundary conditions. J. Pet. Sci. Eng. 2019, 172, 454–464. [Google Scholar] [CrossRef]
- Weng, X.W.; Kresse, O.; Cohen, C.E.; Wu, R.T.; Gu, H.R. Modeling of Hydraulic-Fracture-Network Propagation in a Naturally Fractured Formation. SPE Prod. Oper. 2011, 26, 368–380. [Google Scholar]
- Zuloaga-Molero, P.; Yu, W.; Xu, Y.; Sepehrnoori, K.; Li, B. Simulation Study of CO2-EOR in Tight Oil Reservoirs with Complex Fracture Geometries. Sci. Rep. 2016, 6, 33445. [Google Scholar] [CrossRef] [PubMed]
- CMG. CMG: User’s Guide GEM; Computer Modeling Group, Ltd.: Calgary, AB, Canada, 2015. [Google Scholar]
- Sigmund, P.M. Prediction of Molecular Diffusion at Reservoir Conditions. Part II—Estimating the Effects of Molecular Diffusion and Convective Mixing in Multicomponent Systems. J. Can. Pet. Technol. 1976, 15, 11. [Google Scholar] [CrossRef]
- Reid, R.C.; Sherwood, T.K. The properties of gases and liquids: Their estimation and correlation. Phys. Today 1959, 12, 38–40. [Google Scholar] [CrossRef]
- Zhang, Y.; Yu, W.; Li, Z.P.; Sepehrnoori, K. Simulation study of factors affecting CO2 Huff-n-Puff process in tight oil reservoirs. J. Pet. Sci. Eng. 2018, 163, 264–269. [Google Scholar] [CrossRef]
- Li, S.; Li, Z.; Dong, Q. Diffusion coefficients of supercritical CO2 in oil-saturated cores under low permeability reservoir conditions. J. CO2 Util. 2016, 14, 47–60. [Google Scholar] [CrossRef]


| Core Number | Porosity, % | Gas Permeability, mD | Liquid Permeability, mD |
|---|---|---|---|
| 1 | 0.177513 | 0.0356 | 0.02835 |
| 2 | 0.175812 | 0.03691 | 0.0304 |
| 3 | 0.173267 | 0.03994 | 0.0339 |
| Average | 0.175531 | 0.037483 | 0.030883 |
| Parameter | Value | Unit |
|---|---|---|
| Initial reservoir pressure | 30 | MPa |
| Porosity | 0.175 | - |
| Oil viscosity | 6 | mPa·s |
| Soak pressure | 40 | MPa |
| Soak time | 45 | min |
| Production time | 6 | min |
| Cycle number | 12 | - |
| Temperature | 60 | °C |
| Initial water saturation | 0.2 | - |
| Matrix permeability | 0.03 | mD |
| Fracture permeability | 50 | mD |
| CO2 diffusion coefficient | 0.0005 | cm2/s |
| Component | CO2 | C1 | C4 | C7 | C12 | C19 | C30 | N2 |
|---|---|---|---|---|---|---|---|---|
| CO2 | ||||||||
| C1 | 0.103 | |||||||
| C4 | 0.1317 | 0.013 | ||||||
| C7 | 0.1421 | 0.0358 | 0.0059 | |||||
| C12 | 0.1501 | 0.0561 | 0.016 | 0.0025 | ||||
| C19 | 0.1502 | 0.0976 | 0.0424 | 0.0172 | 0.0067 | |||
| C30 | 0.1503 | 0.1449 | 0.0779 | 0.0427 | 0.0251 | 0.0061 | ||
| N2 | −0.02 | 0.031 | 0 | 0 | 0 | 0 | 0 |
| Component | Pc/atm (atm) | Tc (K) | Acentric Factor | Mol. Weight (g/gmole) | Volume Shift | Crit. Volume (m3/kgmole) | Omega A | Omega B | Specific Gravity (SG) | Tb (°C) | Parachor |
|---|---|---|---|---|---|---|---|---|---|---|---|
| CO2 | 72.80 | 304.20 | 0.23 | 44.01 | −0.09 | 0.10 | 0.46 | 0.08 | 0.60 | −102.51 | 126.49 |
| C1 | 45.24 | 189.67 | 0.01 | 16.21 | −0.15 | 0.09 | 0.46 | 0.08 | 0.35 | −161.15 | 40.38 |
| C4 | 43.49 | 412.47 | 0.15 | 44.79 | −0.09 | 0.23 | 0.46 | 0.08 | 0.80 | −17.09 | 128.86 |
| C7 | 37.69 | 556.92 | 0.25 | 83.46 | −0.01 | 0.35 | 0.46 | 0.08 | 0.95 | 86.79 | 242.85 |
| C12 | 31.04 | 667.52 | 0.33 | 120.52 | 0.06 | 0.50 | 0.46 | 0.08 | 1.05 | 176.75 | 345.92 |
| C19 | 19.29 | 673.76 | 0.57 | 220.34 | 0.16 | 0.89 | 0.46 | 0.08 | 1.30 | 217.98 | 593.49 |
| C30 | 15.38 | 792.40 | 0.94 | 321.52 | 0.21 | 1.06 | 0.46 | 0.08 | 1.50 | 331.76 | 799.68 |
| N2 | 33.50 | 126.20 | 0.04 | 28.01 | 0.00 | 0.09 | 0.00 | 0.00 | 0.81 | −195.75 | 41.00 |
| Competent | Percent/% |
|---|---|
| ZGLOBALC ‘N2’ | 1 |
| ZGLOBALC ‘CO2’ | 0.01 |
| ZGLOBALC ‘C1’ | 23.79 |
| ZGLOBALC ‘C4’ | 4.38 |
| ZGLOBALC ‘C7’ | 11.26 |
| ZGLOBALC ‘C12’ | 36.18 |
| ZGLOBALC ‘C19’ | 16.51 |
| ZGLOBALC ‘C30’ | 7.87 |
| Sum | 100 |
| Fracture Pattern |  |  I = 1 |  I = 10 | Remarks |
|---|---|---|---|---|
| 0 |  |  |  | Baseline |
| 1 |  |  |  | Scattered fracture-1 |
| 2 |  |  |  | Scattered fracture-2 |
| 3 |  |  |  | Scattered fracture-3 |
| 4 |  |  |  | Scattered fracture-4 |
| 5 |  |  |  | Near well |
| 6 |  |  |  | Far well |
| 7 |  |  |  | Relationship with Kv and Gravity |
© 2019 by the authors. Licensee MDPI, Basel, Switzerland. This article is an open access article distributed under the terms and conditions of the Creative Commons Attribution (CC BY) license (http://creativecommons.org/licenses/by/4.0/).
Share and Cite
Bai, J.; Liu, H.; Wang, J.; Qian, G.; Peng, Y.; Gao, Y.; Yan, L.; Chen, F. CO2, Water and N2 Injection for Enhanced Oil Recovery with Spatial Arrangement of Fractures in Tight-Oil Reservoirs Using Huff-‘n-puff. Energies 2019, 12, 823. https://doi.org/10.3390/en12050823
Bai J, Liu H, Wang J, Qian G, Peng Y, Gao Y, Yan L, Chen F. CO2, Water and N2 Injection for Enhanced Oil Recovery with Spatial Arrangement of Fractures in Tight-Oil Reservoirs Using Huff-‘n-puff. Energies. 2019; 12(5):823. https://doi.org/10.3390/en12050823
Chicago/Turabian StyleBai, Jie, Huiqing Liu, Jing Wang, Genbao Qian, Yongcan Peng, Yang Gao, Lin Yan, and Fulin Chen. 2019. "CO2, Water and N2 Injection for Enhanced Oil Recovery with Spatial Arrangement of Fractures in Tight-Oil Reservoirs Using Huff-‘n-puff" Energies 12, no. 5: 823. https://doi.org/10.3390/en12050823
APA StyleBai, J., Liu, H., Wang, J., Qian, G., Peng, Y., Gao, Y., Yan, L., & Chen, F. (2019). CO2, Water and N2 Injection for Enhanced Oil Recovery with Spatial Arrangement of Fractures in Tight-Oil Reservoirs Using Huff-‘n-puff. Energies, 12(5), 823. https://doi.org/10.3390/en12050823