Article

Optimal Dispatch Model Considering Environmental Cost Based on Combined Heat and Power with Thermal Energy Storage and Demand Response

1
School of Electrical Engineering, Shenyang University of Technology, Shenyang 110870, China
2
State Grid Liaoning Electric Power Supply CO. LTD, Shenyang 110004, China
*
Author to whom correspondence should be addressed.
Energies 2019, 12(5), 817; https://doi.org/10.3390/en12050817
Submission received: 25 January 2019 / Revised: 22 February 2019 / Accepted: 26 February 2019 / Published: 1 March 2019

Abstract

:
In order to reduce the pollution caused by coal-fired generating units during the heating season, and promote the wind power accommodation, an electrical and thermal system dispatch model based on combined heat and power (CHP) with thermal energy storage (TES) and demand response (DR) is proposed. In this model, the emission cost of CO2, SO2, NOx, and the operation cost of desulfurization and denitrification units is considered as environmental cost, which will increase the proportion of the fuel cost in an economic dispatch model. Meanwhile, the fuel cost of generating units, the operation cost and investment cost of thermal energy storage and electrical energy storage, the incentive cost of DR, and the cost of wind curtailment are comprehensively considered in this dispatch model. Then, on the promise of satisfying the load demand, taking the minimum total cost as an objective function, the power of each unit is optimized by a genetic algorithm. Compared with the traditional dispatch model, in which the environmental cost is not considered, the numerical results show that the daily average emissions CO2, SO2, NOx, are decreased by 14,354.35 kg, 55.5 kg, and 47.15 kg, respectively, and the wind power accommodation is increased by an average of 6.56% in a week.

1. Introduction

In recent years, clean energy is promoted all over the world to reduce environmental pollution. Although China is rich in wind energy resources, the main operation pattern “determining power by heat” for combined heat and power (CHP) and the “anti-peak regulation” character of wind power in heating season causes severe wind curtailment [1,2]. In the heating season, the thermal load demand of consumers must be met, but the thermal power constrains the electrical power of CHP. This condition leads to low wind power accommodation when most of electrical load demand could be covered by the electrical power of CHP during the off-peak hours [3]. Meanwhile, slather utilization of fossil fuel releases a large amount of CO2, SO2, and NOx, which causes the greenhouse effect and environmental pollution [4].
Many studies have been performed recently about the dispatch model of CHP with thermal energy storage (TES) to increase the wind power accommodation, such as in References [5,6,7,8], in which the minimum wind curtailment or minimum coal consumption cost was used as the fitness function to reduce wind curtailment. In Reference [9], a dispatch model including CHP, conventional thermal power units, and renewable energy source was proposed, and the heating process by a three-stage heat transfer model of the extraction steam was described. In Reference [10], a multi-timescale rolling dispatch model based on real-time error compensation was proposed. The power of thermal power unit was revised in real-time to compensate for the error of wind power forecast. In addition, some scholars have made further study on the district heating system, and taken the heat storage capacity of pipelines and buildings into account. For example, in Reference [11], a dispatch model considering the TES capacity of pipelines, buildings and TES devices was proposed. The advantage of this model was that it could be simplified to any combination of the TES capacity of pipelines, buildings, and TES devices. In Reference [12], in order to coordinate the operation of the electric power system and the district heating system, a dispatch model including CHP and TES was proposed. In this dispatch model, the temperature dynamics of the district heating network were considered as energy storage to manage the variability of wind energy. In Reference [13], Dai et al. proposed a detailed model for the district heating network, building envelopes, and TES, and taken heat transfer constraints into account. In Reference [14], the conventional thermal units, wind turbines, and CHP with TES were included in an integrated electrical-thermal dispatch model. The authors proposed an iteration method to solve this nonlinear programming problem. However, these dispatch methods only considered the devices in generation side, and it is not very effective to promote the wind power accommodation, because the burden of the power generation side is enormous when the wind power in large scale grid-connected. Therefore, scholars in References [15,16] pointed out that demand response (DR) was a key approach to be responsive to grid connection when the wind power reached a large proportion of generation. In References [17,18], a DR model based on time-of-use pricing mechanism was employed, and the optimal results were applied in the game theoretic model for multiple virtual power plants dispatch. In Reference [19], the dynamic dispatch problem was optimally integrated with the incentive-based DR program, and the author pointed out that intelligent implementation of DR programs not only decreases electricity price in electricity markets, but also improves network reliability. Some scholars have conducted further study on DR. For example, in Reference [20], a fuzzy inference system for considering the customer load profile attributes in DR bids was presented, and the impact of load profiling attributes on the DR exchange mechanism was investigated. In References [21,22], a commitment model based on incentive-based considering different types of DR resources was proposed. “Source-load-energy storage” coordination is an important method to improve the system operation economy and the accommodation rate of renewable energy. However, all of these references ignored the environmental problems caused by the electric power industry. In other words, the emissions of CO2, SO2, and NOx caused by coal-fired units were not taken into account.
Some scholars realized that environmental pollution needs to be considered in the electric power industry. For instance, in Reference [4], a unit commitment model with wind power that considers the dispersion of air pollutants was proposed. In Reference [23], Nguyen et al. proposed an environment-friendly distributed control approach, in which the pollutant emission costs were incorporated into the fitness function. However, in these dispatch models, the emission cost of CO2 was not taken into account. In Reference [24], Deylamsalehi et al. proposed a new approach for the power grid to minimize the electricity costs and the pollutant emissions under various electricity markets. In this approach, the electric power price and the fuel price were used to find the lowest total electricity cost path. However, DR as an effective dispatch resource was not included in these approaches.
For the research of the above references, there were few studies concretely considering the environmental cost for electric and thermal system dispatch model, or ignoring the advantages of DR, which could effectively reduce the pressure of generating units.
In this paper, aiming at reducing the emissions of CO2, SO2, and NOx, and promoting the wind power accommodation, an electrical and thermal system dispatch model considering environmental cost based on CHP-DR is proposed. Then, a test system is studied to demonstrate the accuracy and effectiveness of the proposed model. On the premise that the electrical power balance and thermal power meet the user’s comfort, the power of power generation units and the regulating variable of demand response are optimized by a genetic algorithm (GA) in MATLAB 2018a (MathWorks, Natick, MA, USA). Compared with the traditional dispatch model, not only the emissions of CO2, SO2, and NOx are reduced, but also the wind power accommodation is promoted, the test results demonstrate the reasonableness and validity of the proposed model. The contributions of this work are as follows:
  • We analyze the operation characteristics of CHP with TES and incentive-based DR, respectively. Then, the cost formula of incentive-based DR participating in power grid dispatching is given.
  • An economic power dispatch model based on CHP-DR is proposed. In this dispatch model, the emission cost of CO2, SO2, NOx, the operation cost of desulfurization units, and the operation cost of denitrification units are considered as environmental cost, which increases the cost of power generation.
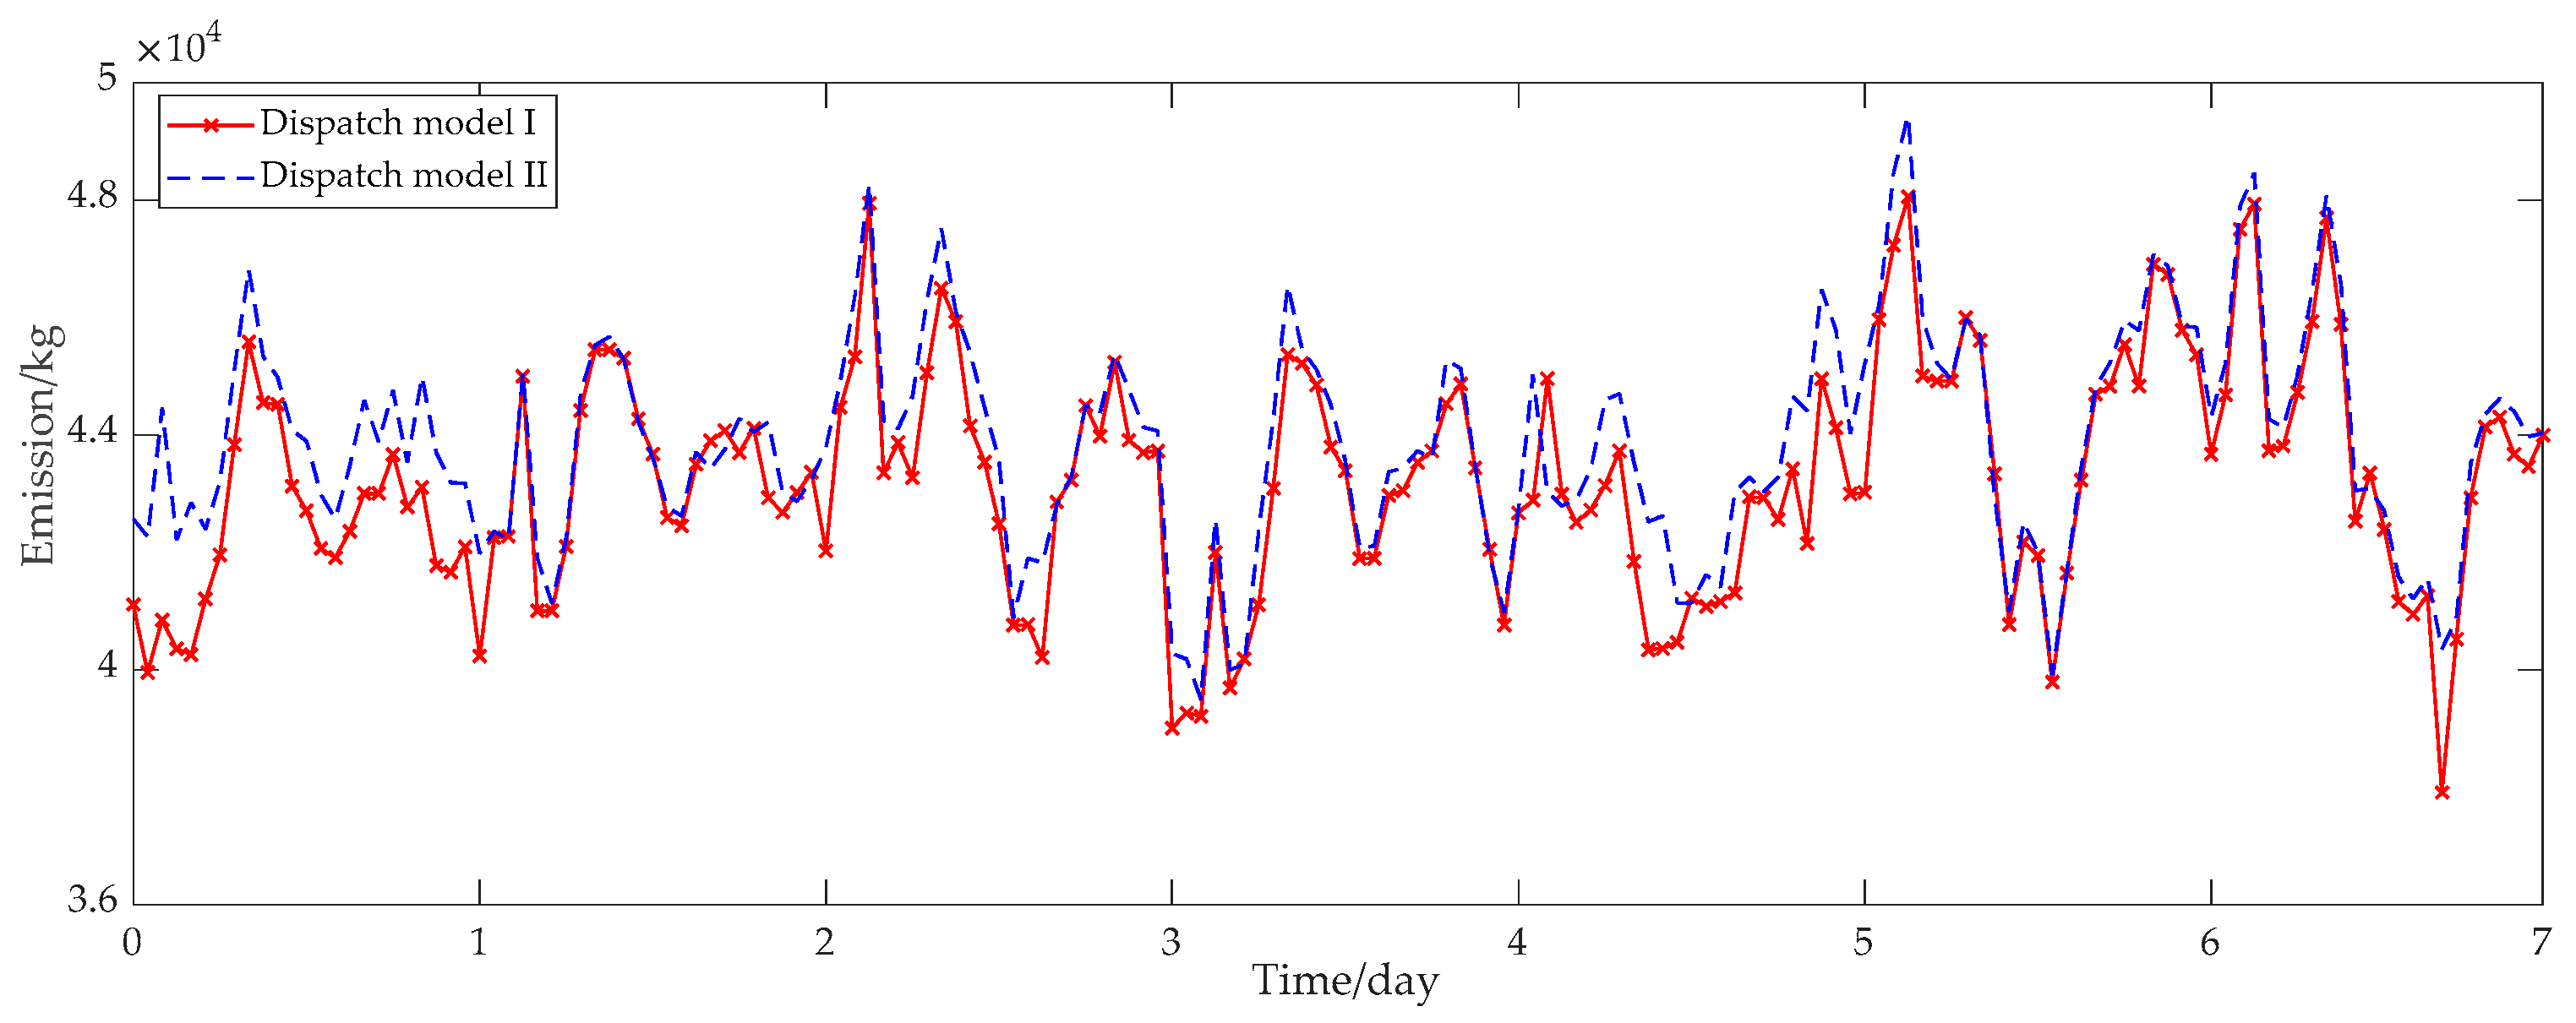
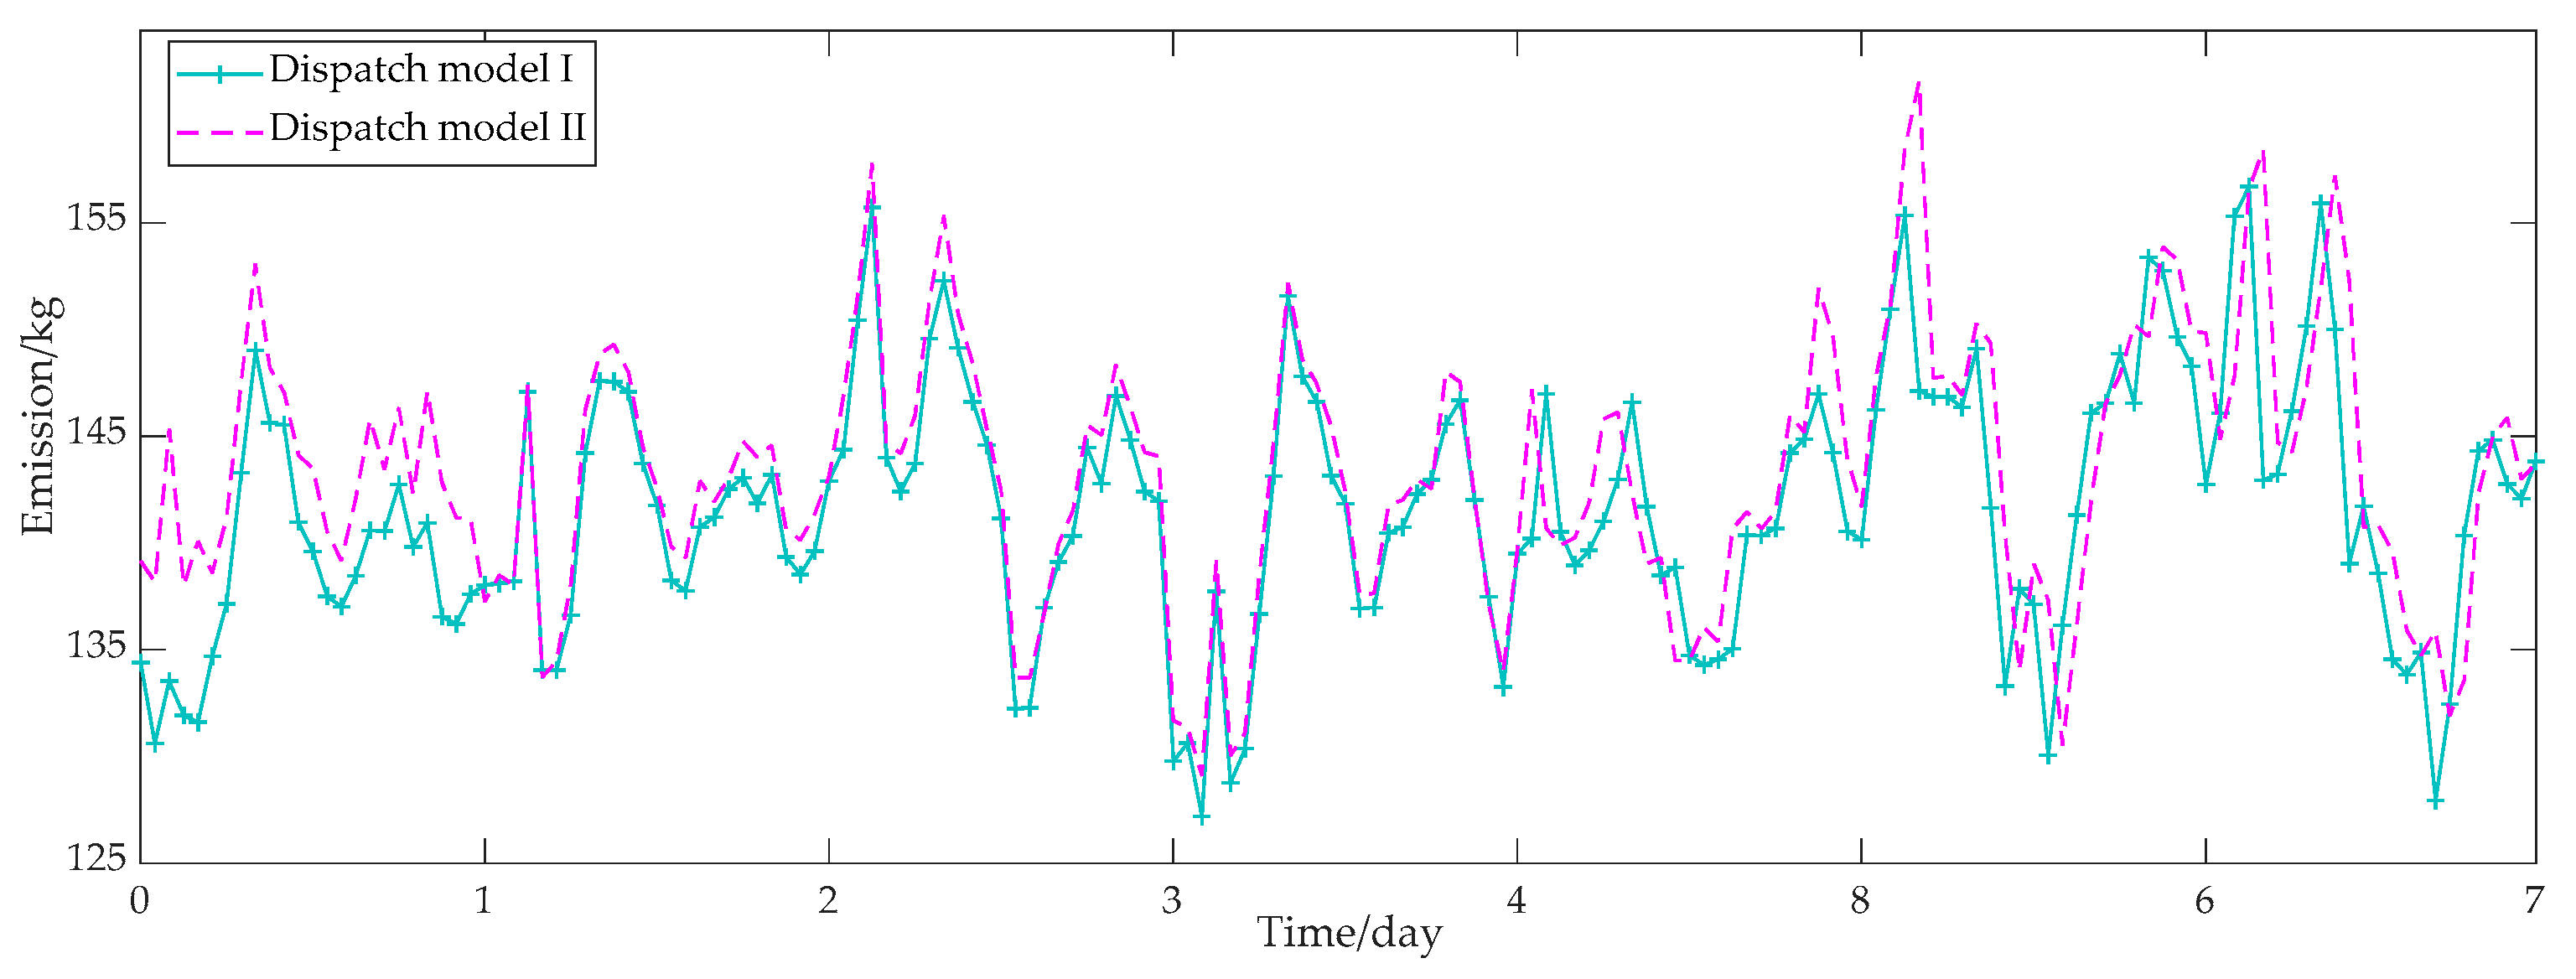
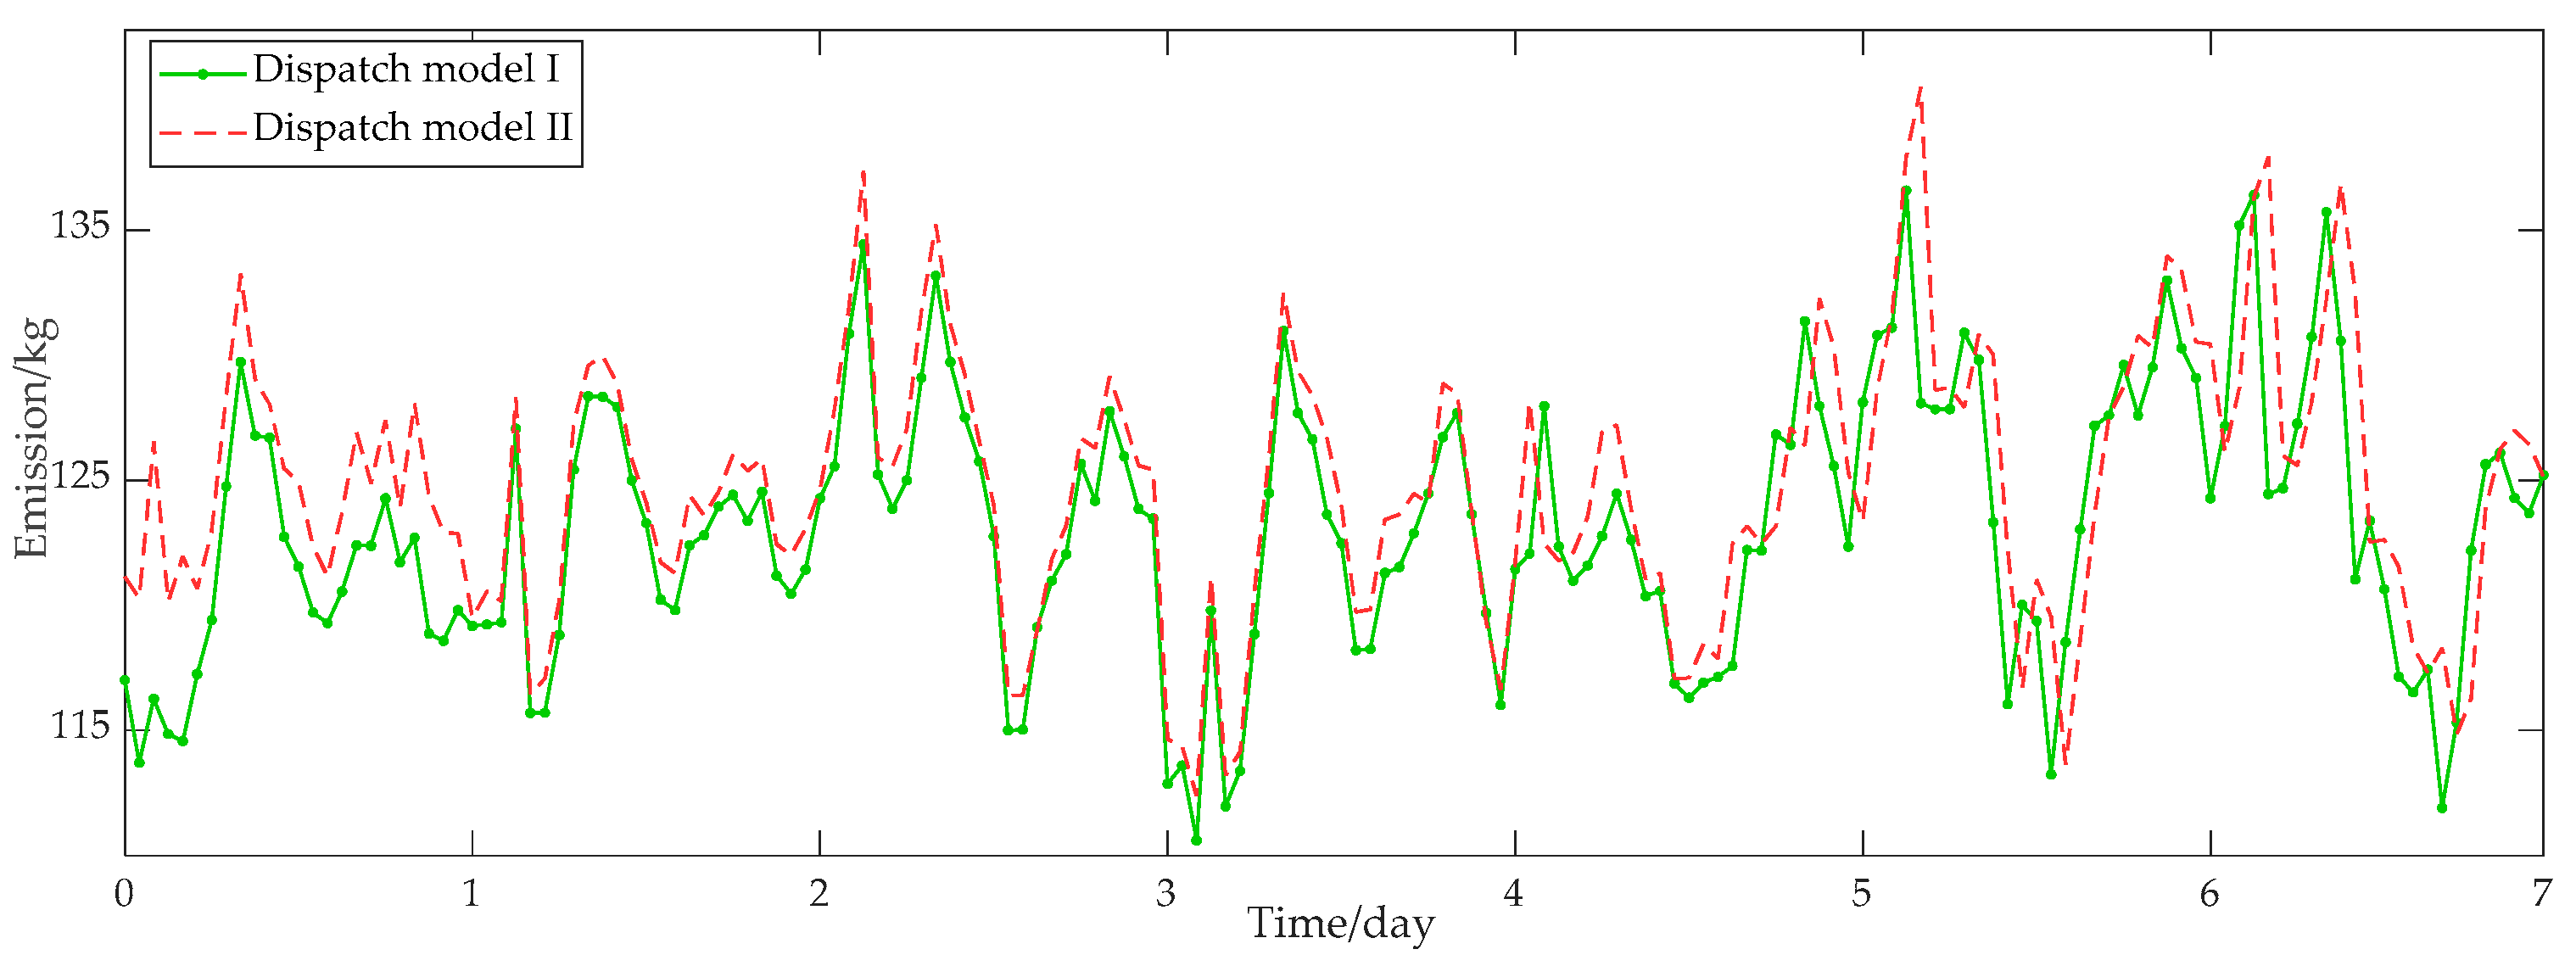
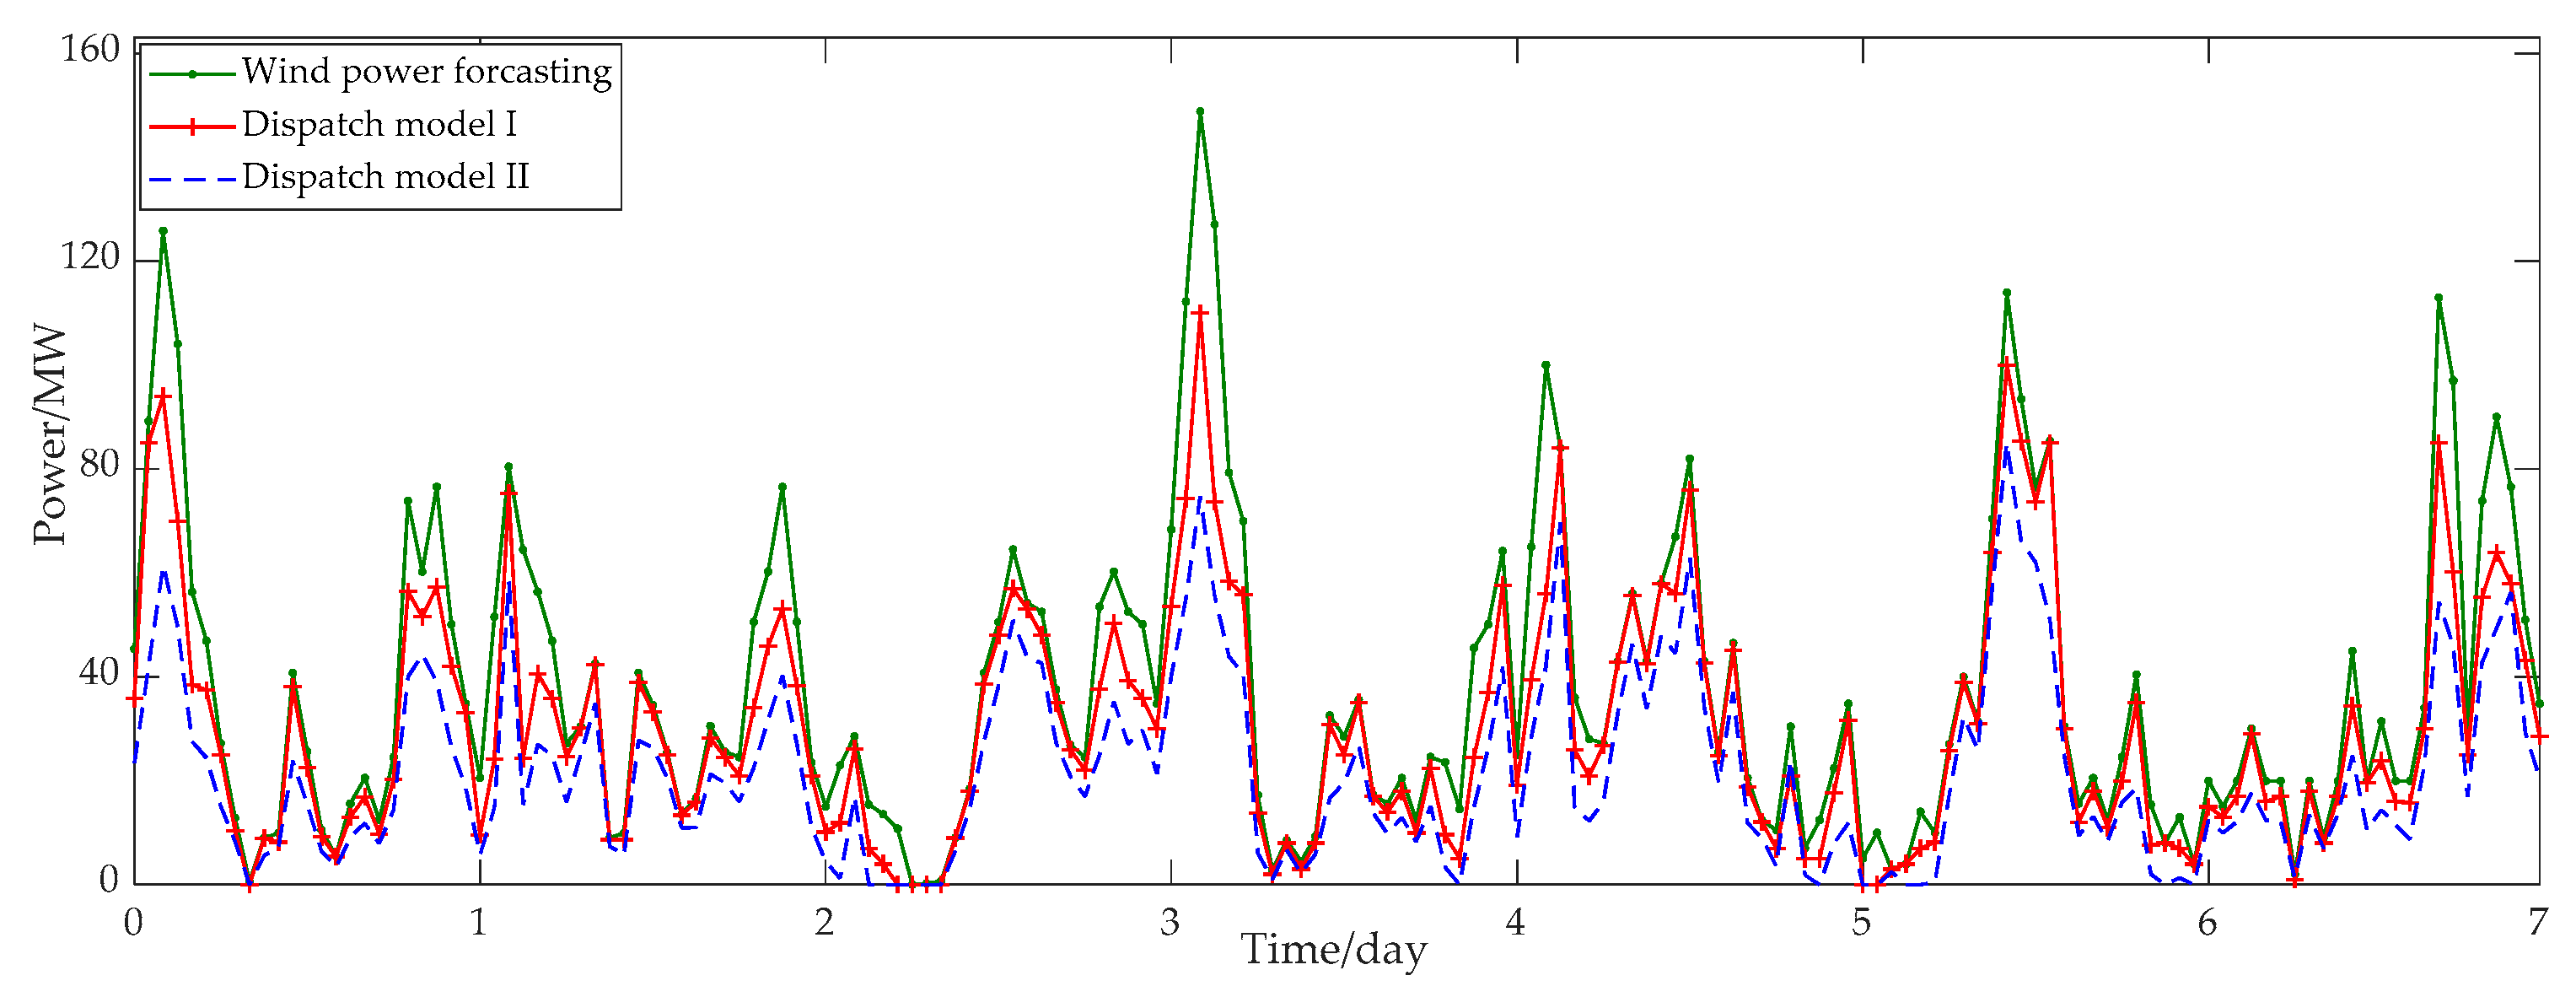
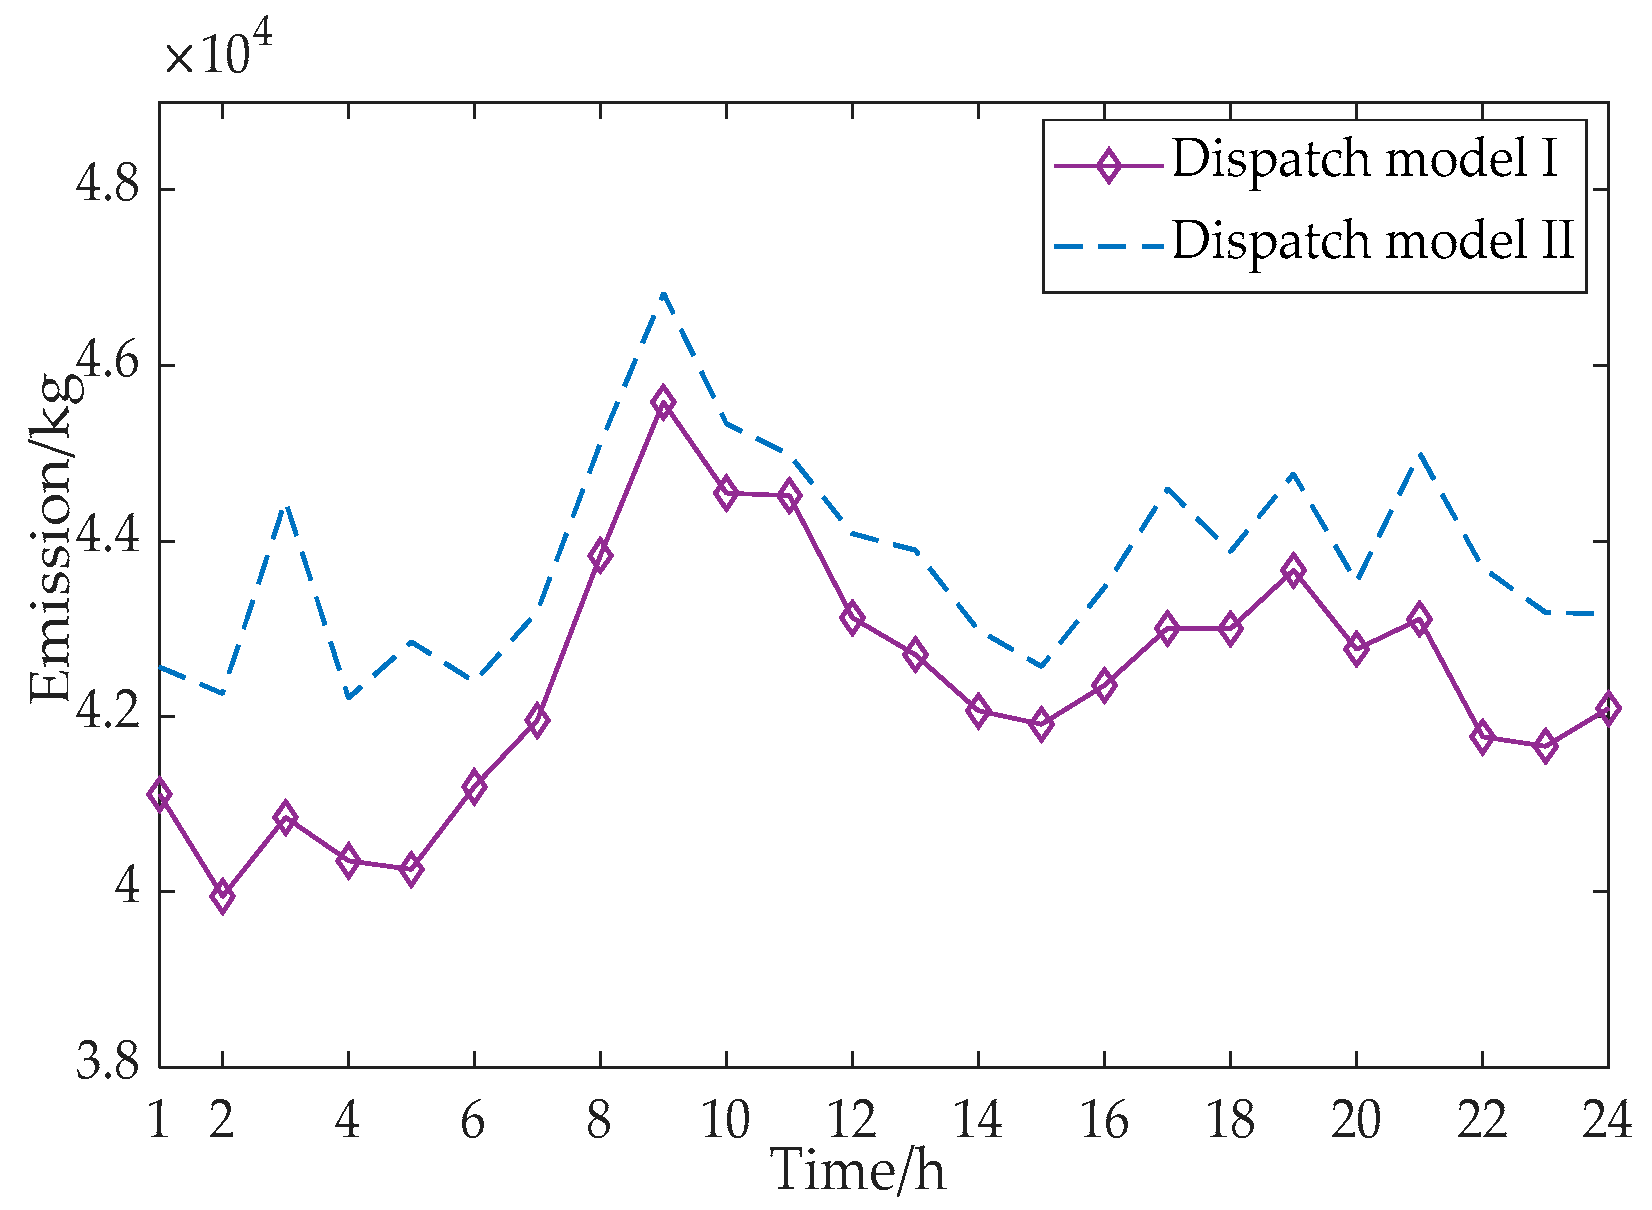
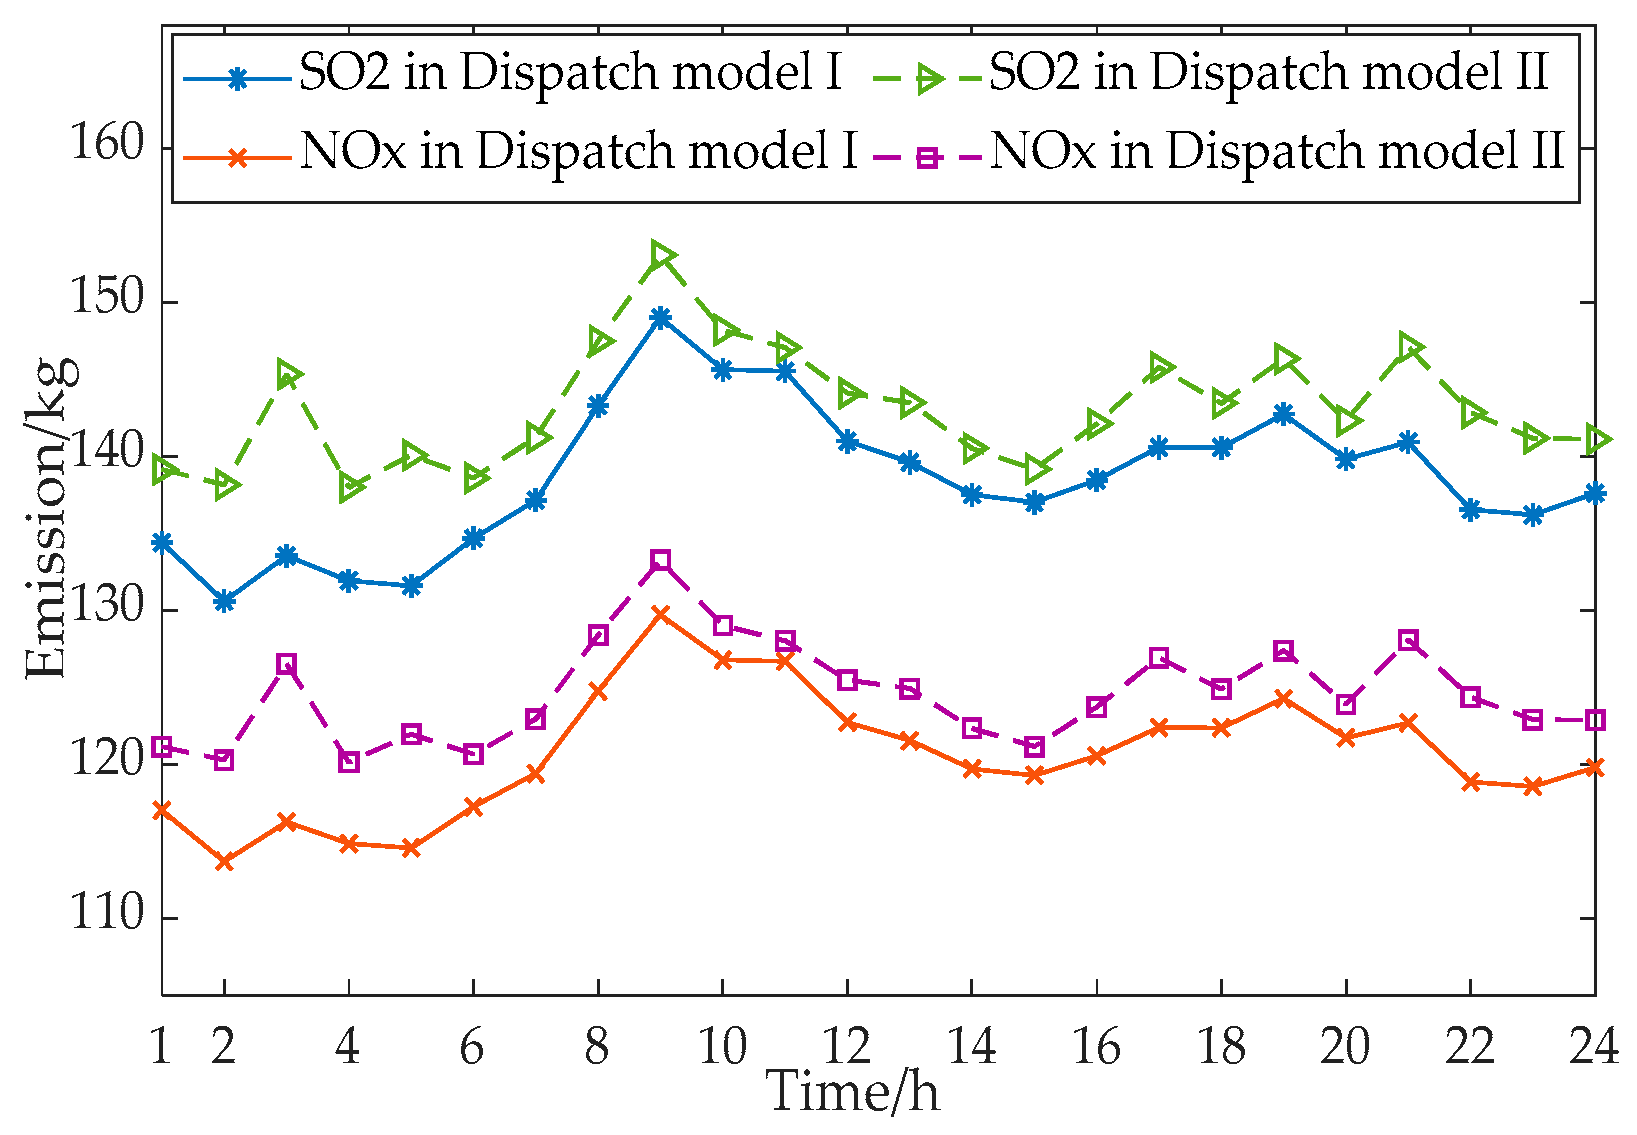
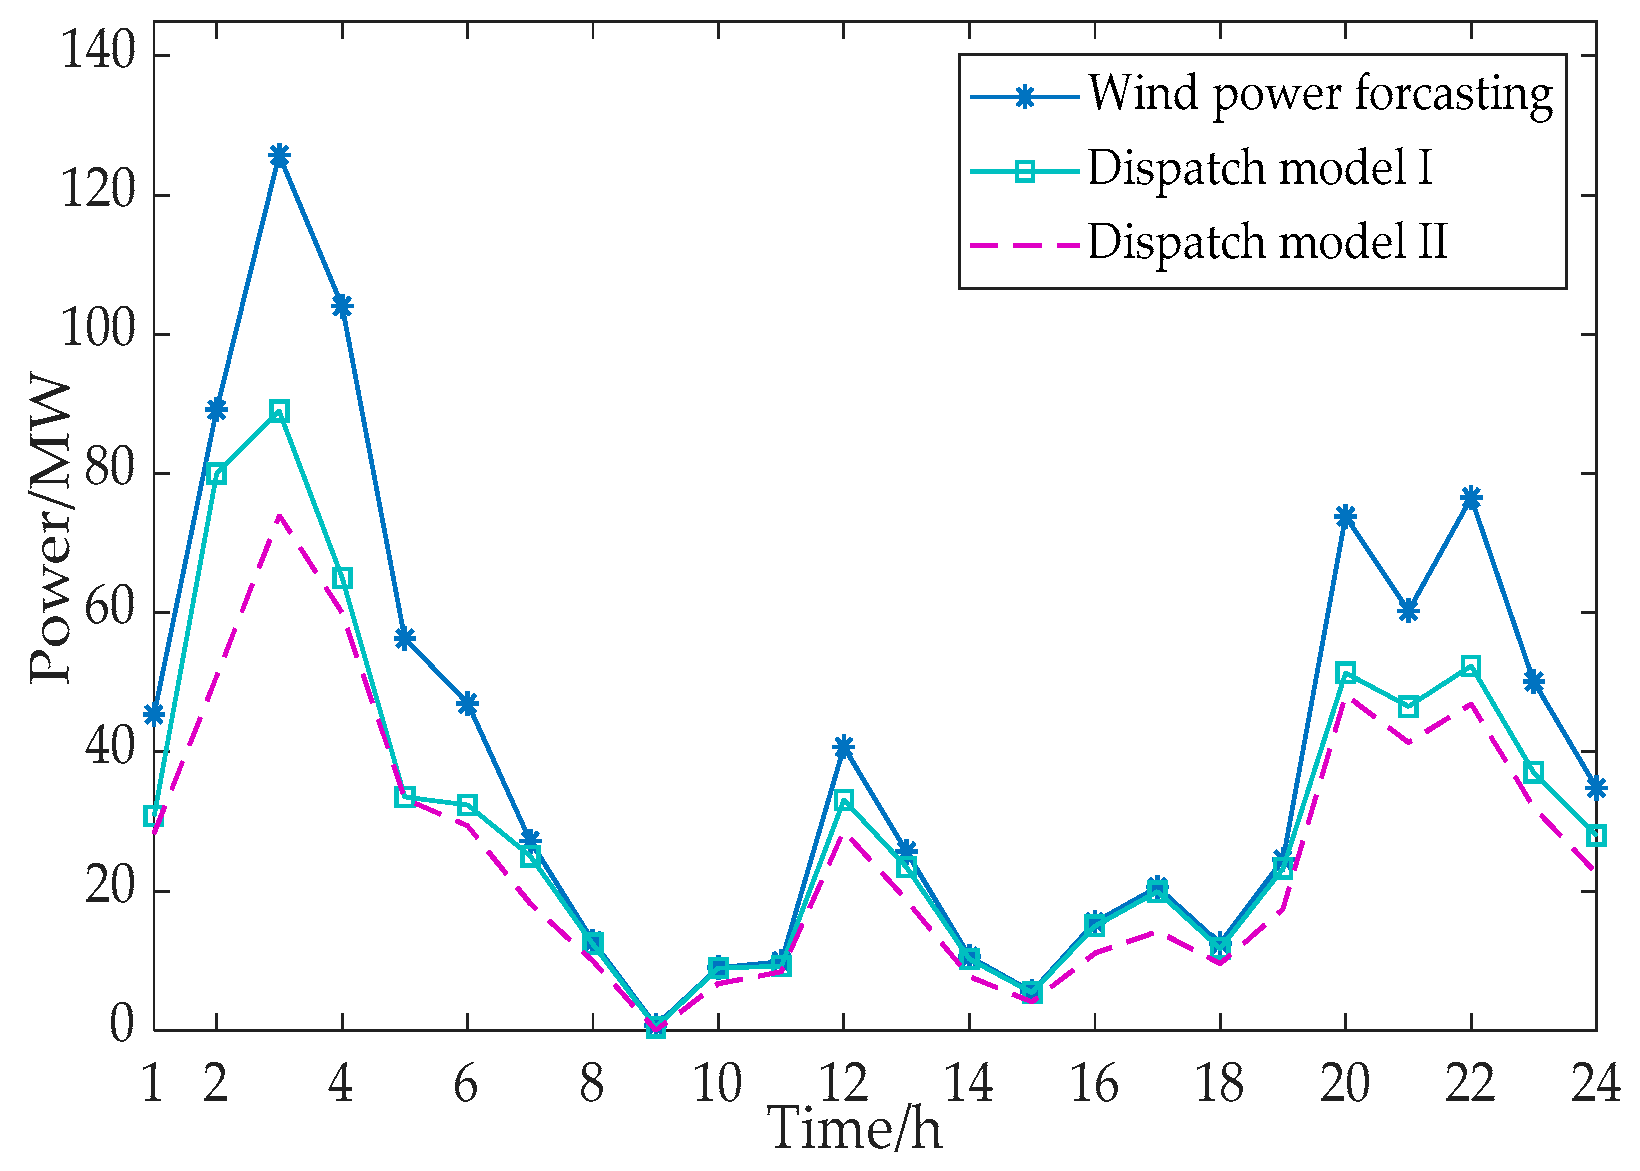
  • Two dispatch models are set and the data in one week is utilized to verify the effectiveness. One dispatch model takes the environmental cost into account and the other does not. The results show that the daily average emissions of CO2, SO2, and NOx are decreased by 14,354.35 kg, 55.5 kg, and 47.15 kg, respectively, and the wind power accommodation is increased by an average of 6.56%.

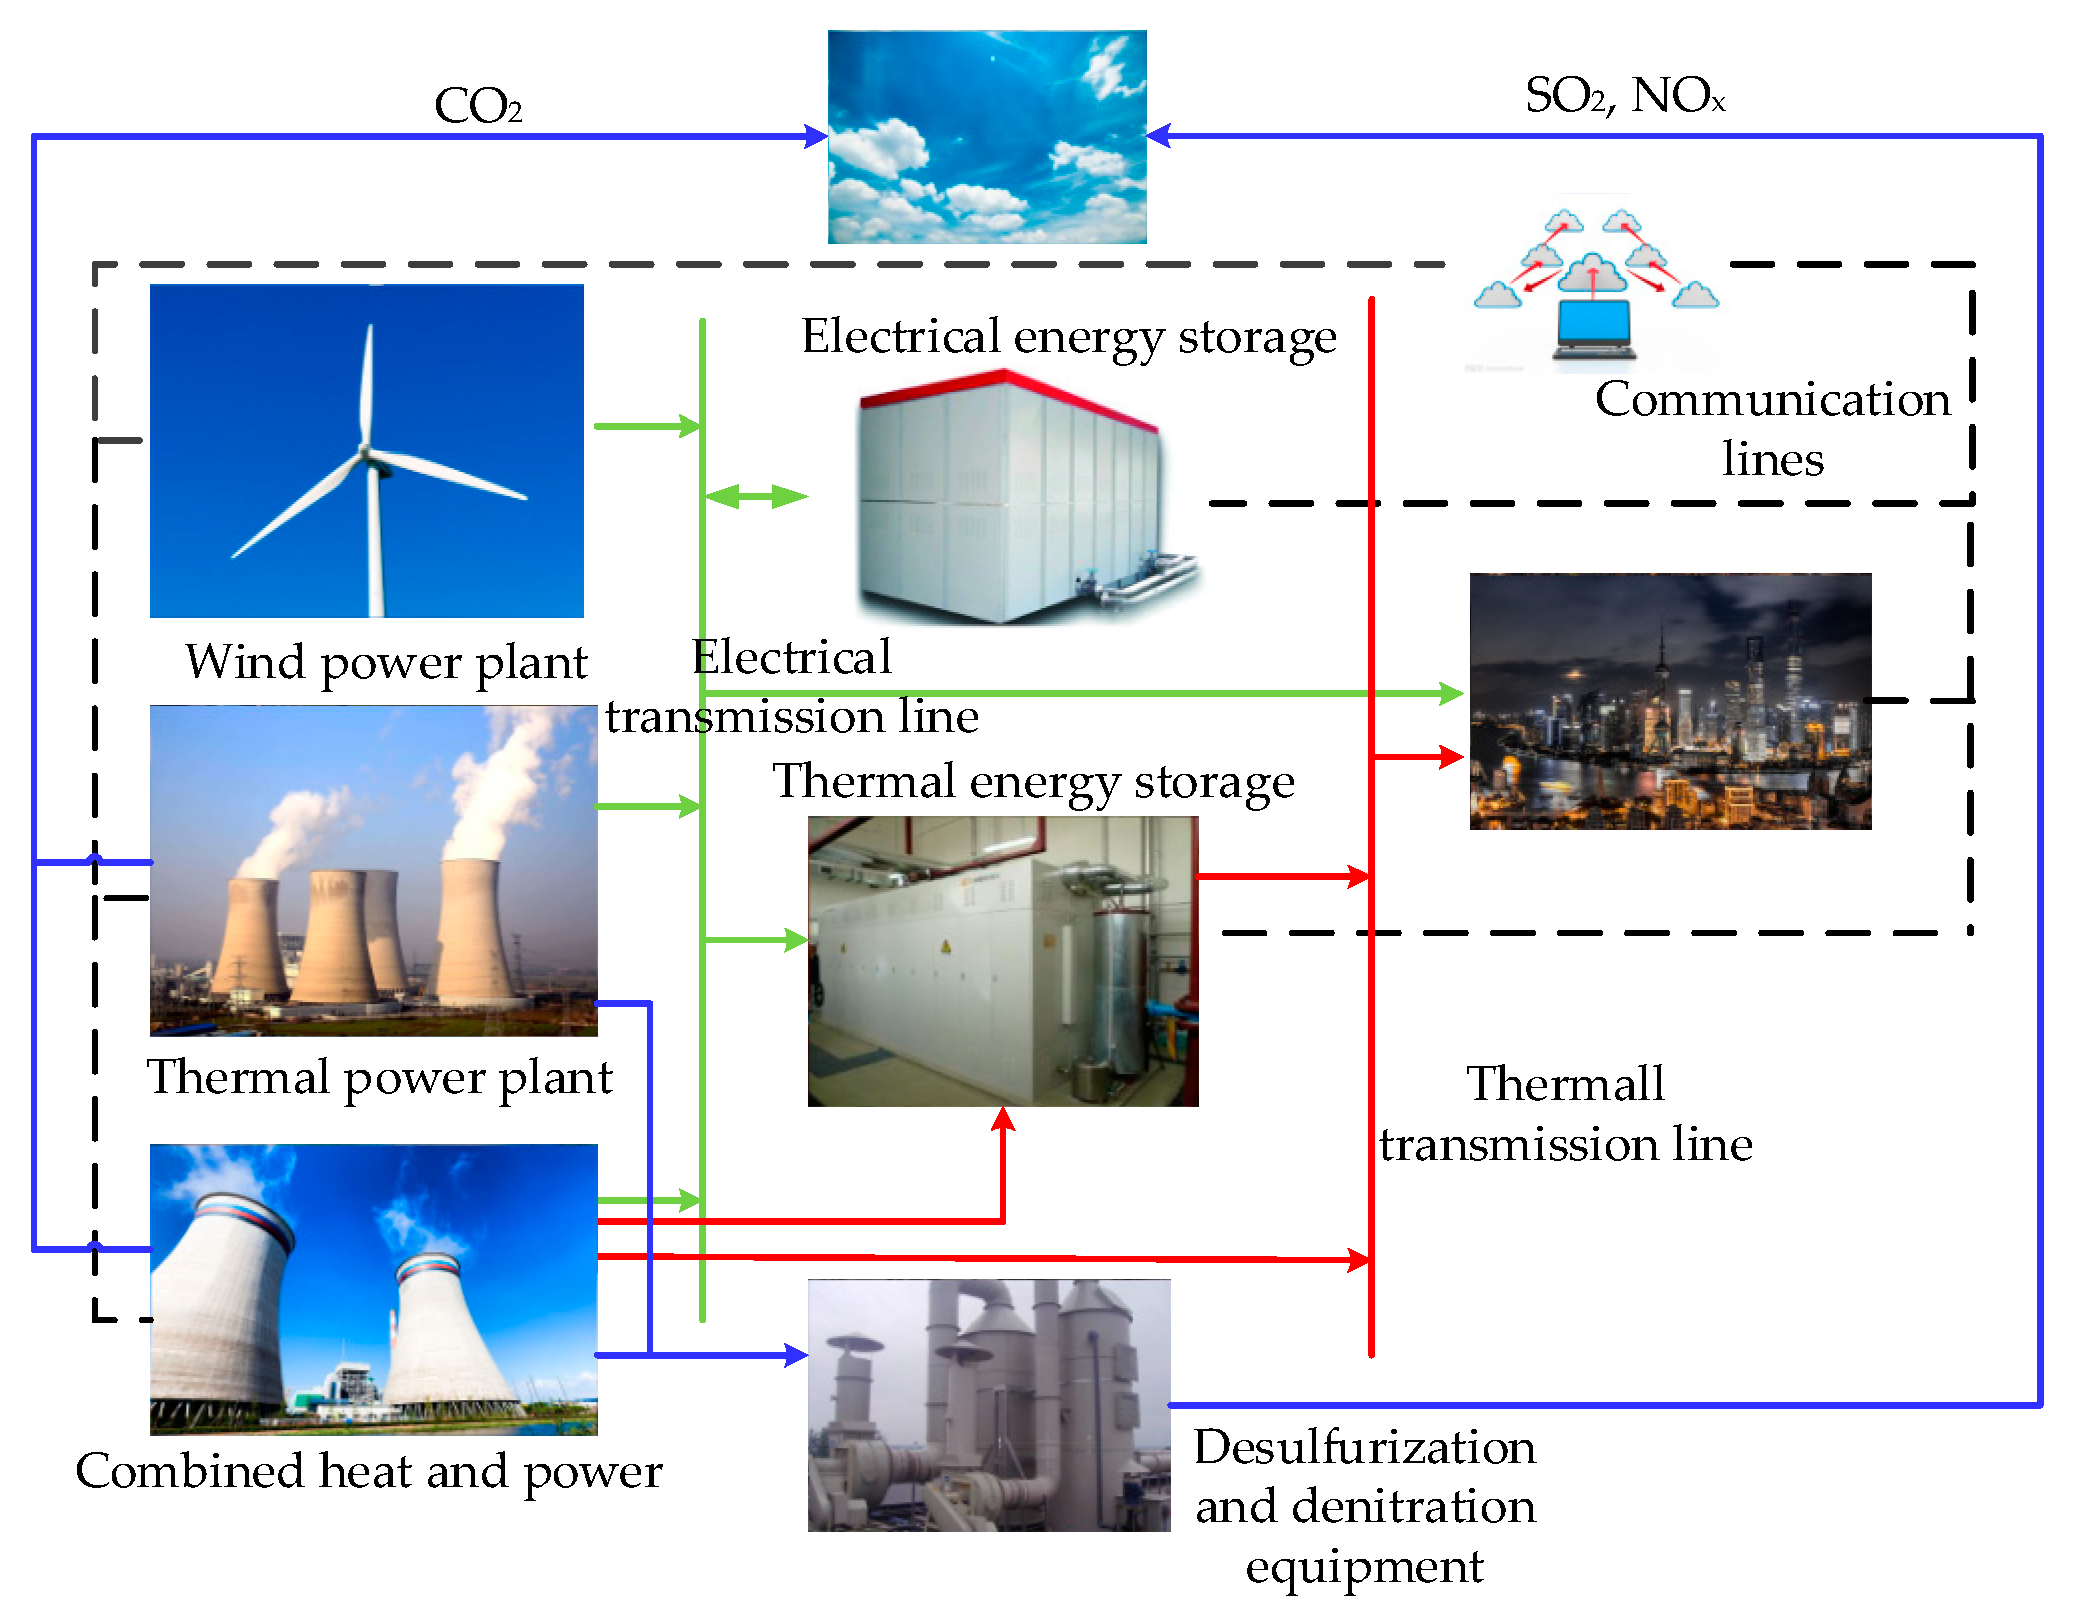
2. Operating Characteristic and Dispatch Model of CHP with TES and DR

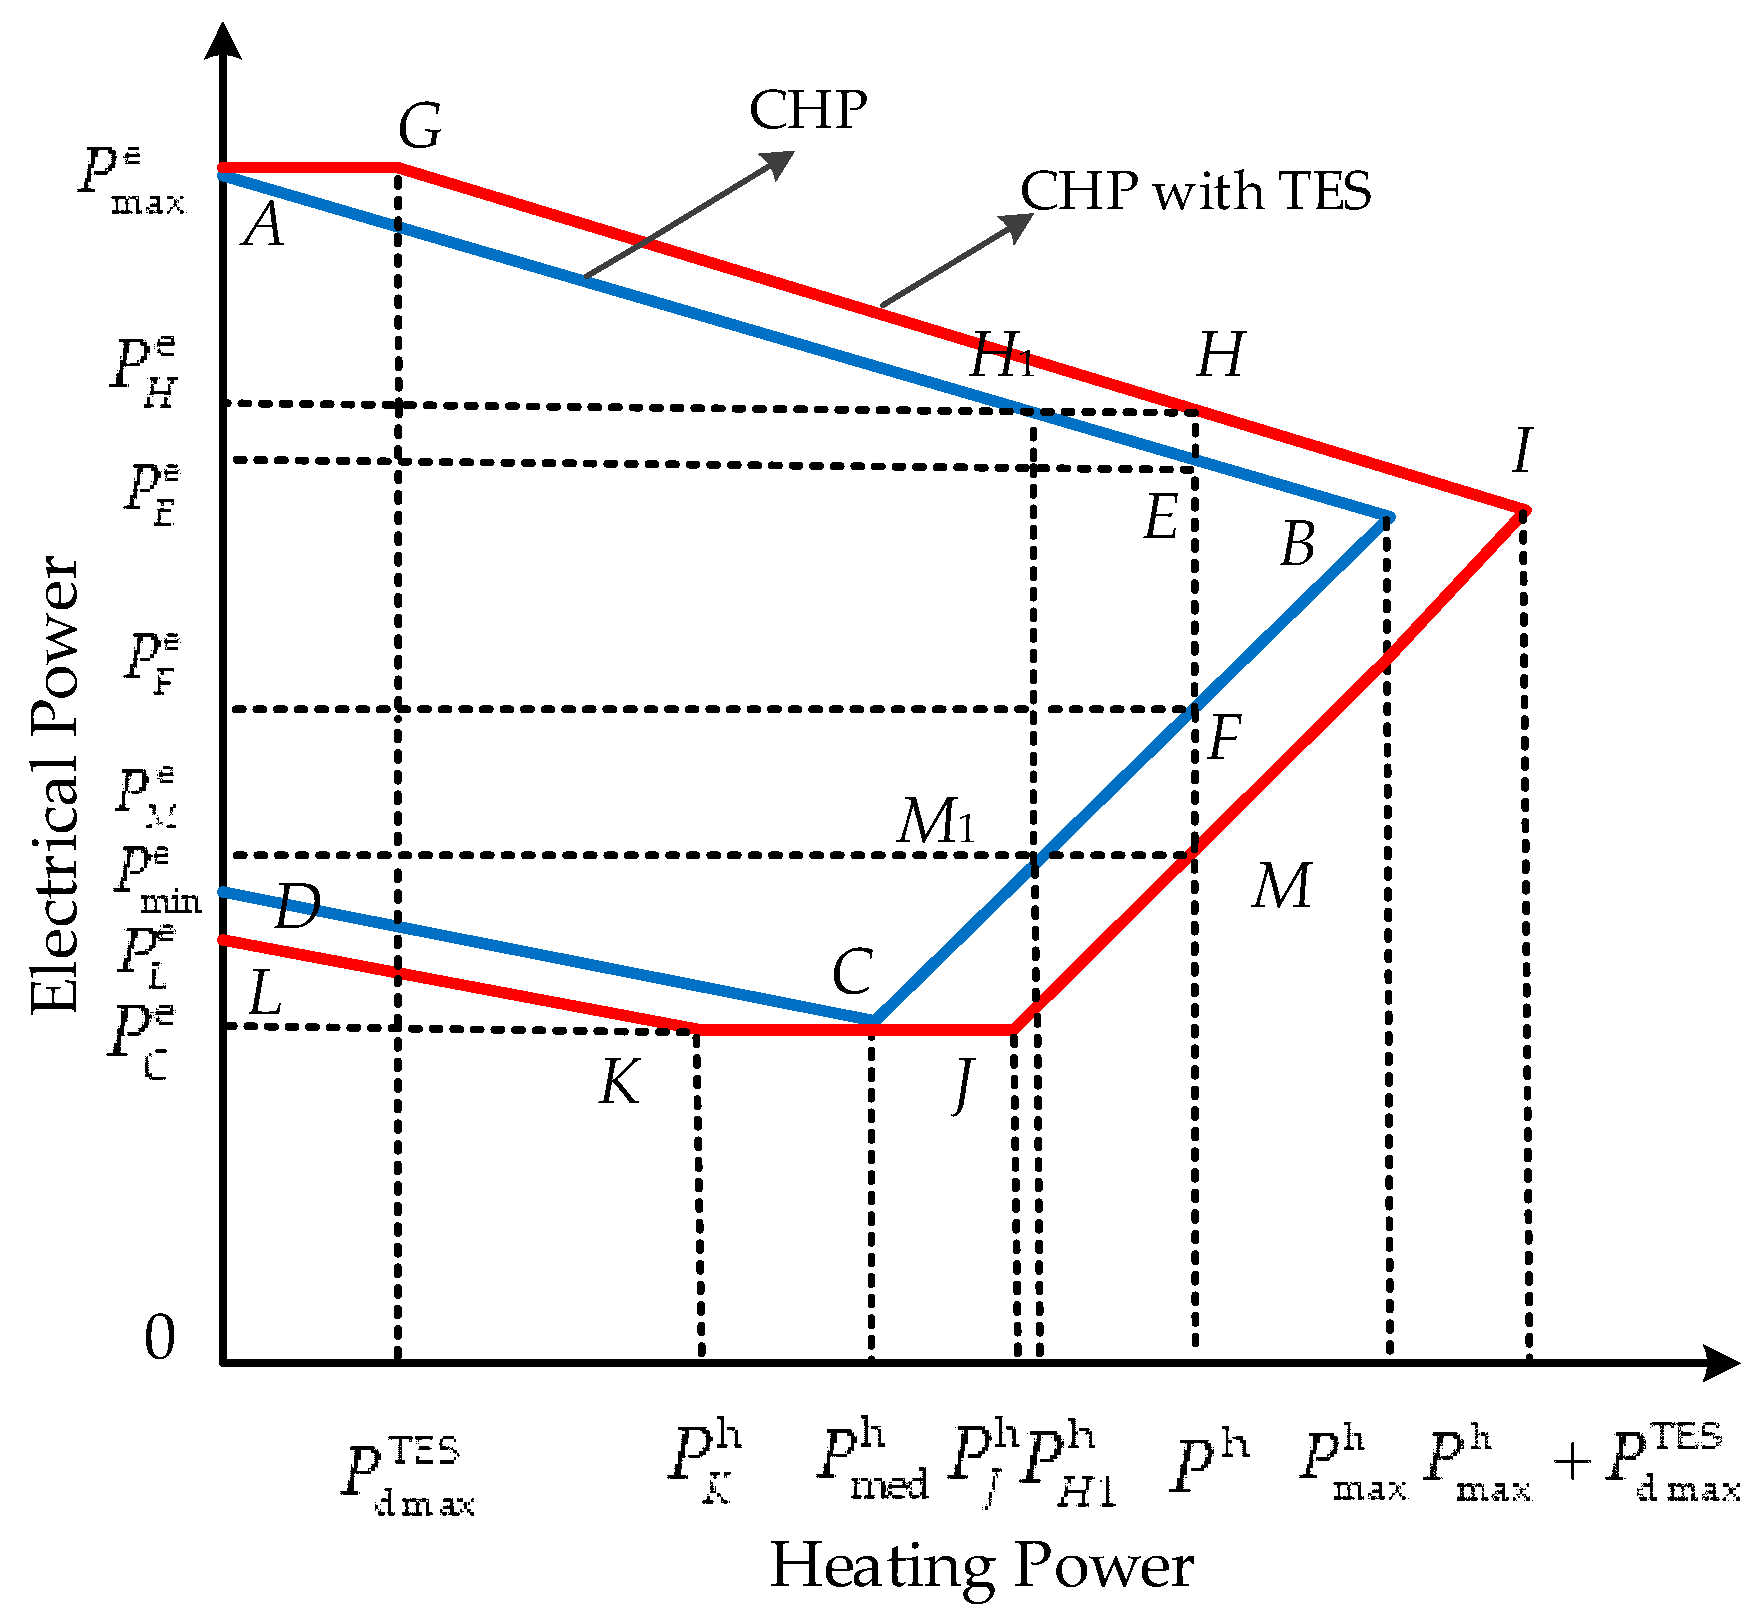
2.1. Operation Characteristic and Modeling of CHP with TES

Combined heat and power (CHP) is an efficient device to generate electrical power and thermal power at the same time. CHP can be classified into two types: extraction-condensing turbine and non-condensing turbine [9]. In this paper, the extraction-condensing unit is studied. Due to the operation pattern “determining power by heat” of the extraction-condensing unit, the electrical power, and thermal power are coupled. The operation characteristics of the extraction-condensing unit are shown in the blue curve in Figure 1 [25].
Various means to improve the flexibility of CHP have been performed, but thermal energy storage (TES) is the most attracted owing to its high efficiency, large capacity, and high efficiency. The addition of TES units on the traditional CHP units can break the thermo-electric coupling characteristic, as shown by the red curve in Figure 1 [26].
In Figure 1, P max h is the maximum thermal power of CHP; P med h is the thermal power with the minimum electrical power; P min e and P max e are the minimum and maximum electrical power of CHP under the condition of pure condensation.
We assume that the heat storage of TES is sufficient, and set the maximum discharge power as P dmax TES and the maximum charge power as P cmax TES . For a certain power generation, the maximum thermal power P max h of the whole system (CHP with TES) will be increased by P dmax TES on the original basis. This is equivalent to the segment AB and the segment BC in Figure 1 is shifted to the right by P max TES . In Figure 1, P J h = P max h + P d max TES , P K h = P med h P d max TES , P H 1 h = P h P d max TES . In addition, there is a minimum thermal power, when the electrical power of CHP is between P min e and P C e (i.e., section CD in Figure 1). After the configuration of TES, the minimum thermal power will shift to the left by P c max TES . Therefore, the feasible region of heat production and electricity production is AGIJKL. In other words, when the thermal power is P h , the feasible region of electrical power is from [ P F e , P E e ] to [ P M e , P H e ]. The regulation of CHP is significantly increased, and the coupling characteristic of CHP is reduced.
The cost of CHP units with TES can be described as [27]:
F C T = i = 1 N C c , i + j = 1 M ( F T C , j + F T W , j )
where FCT is the total cost of CHP with TES, i = 1, …, N is the number of CHP units, and j = 1, …, M is the number of TES units. Cc,i is the fuel cost of CHP i with TES. For CHP with TES, the operation cost should consider both thermal power and electric power. In general, the electric power and thermal power need to be converted into electric power under the condition of pure condensation. Therefore, the fuel cost of CHP units with TES can be described as in Equation (2). FTC,j is the average daily investment cost of TES j, which is calculated by Equation (3). FTW,j is the operation and maintenance cost of TES j, which is shown in Equation (4):
C c , i = t = 1 T { a m [ P i , t e + c v ( P i , t h + P j , t TES ) ] 2 + b m [ P i , t e + c v ( P i , t h + P j , t TES ) ] + c m }
F T C , j = C T P P R , j TES + C T E E R , j TES T T , j
F T W , j = t = 1 T ( C U P j , t TES )
where t = 1, …, T, T is the number of hours in operation. P i , t e is the electrical power of CHP i at time t, and P i , t h is the thermal power of CHP i at time t. P j , t TES is the thermal power of TES j at time t. am, bm, and cm are the operation cost coefficients of CHP with TES. cv is the linear supply slopes of thermal power and electric power of CHP. P R , j TES is the rated power of TES j, E R , j TES is the rated capacity of TES j, CTP, and CTE are the cost coefficients of TES, TT,j is the service life of TES i. CU is the operation and maintenance cost coefficient of TES.
(1) Constraints of CHP:
P min , i e P i , t e P max , i e
P min , i h P i , t h P max , i h
where P min , i e and P max , i e are the lower and upper limits of electrical power for CHP i respectively, P min , i h and P max , i h are the lower and upper limits of thermal power for CHP i respectively. Such as Equation (2), the electrical power and thermal power should be converted into electrical power, the ramp rate of CHP is given by:
r d , i C P i , t e P i , t 1 e r u , i C
where r d , i C and r u , i C are the lower and upper ramp rate limits of CHP unit i respectively.
(2) Constraints of TES:
S min , j S j , t S max , j
P min , j TES P i , t TES P max , j TES
where Sj,t is the capacity of TES j at time t, Smin,j and Smax,j are lower and upper capacity limits of TES j, respectively, P min , j TES and P max , j TES are the lower and upper thermal power limits of TES j, respectively.

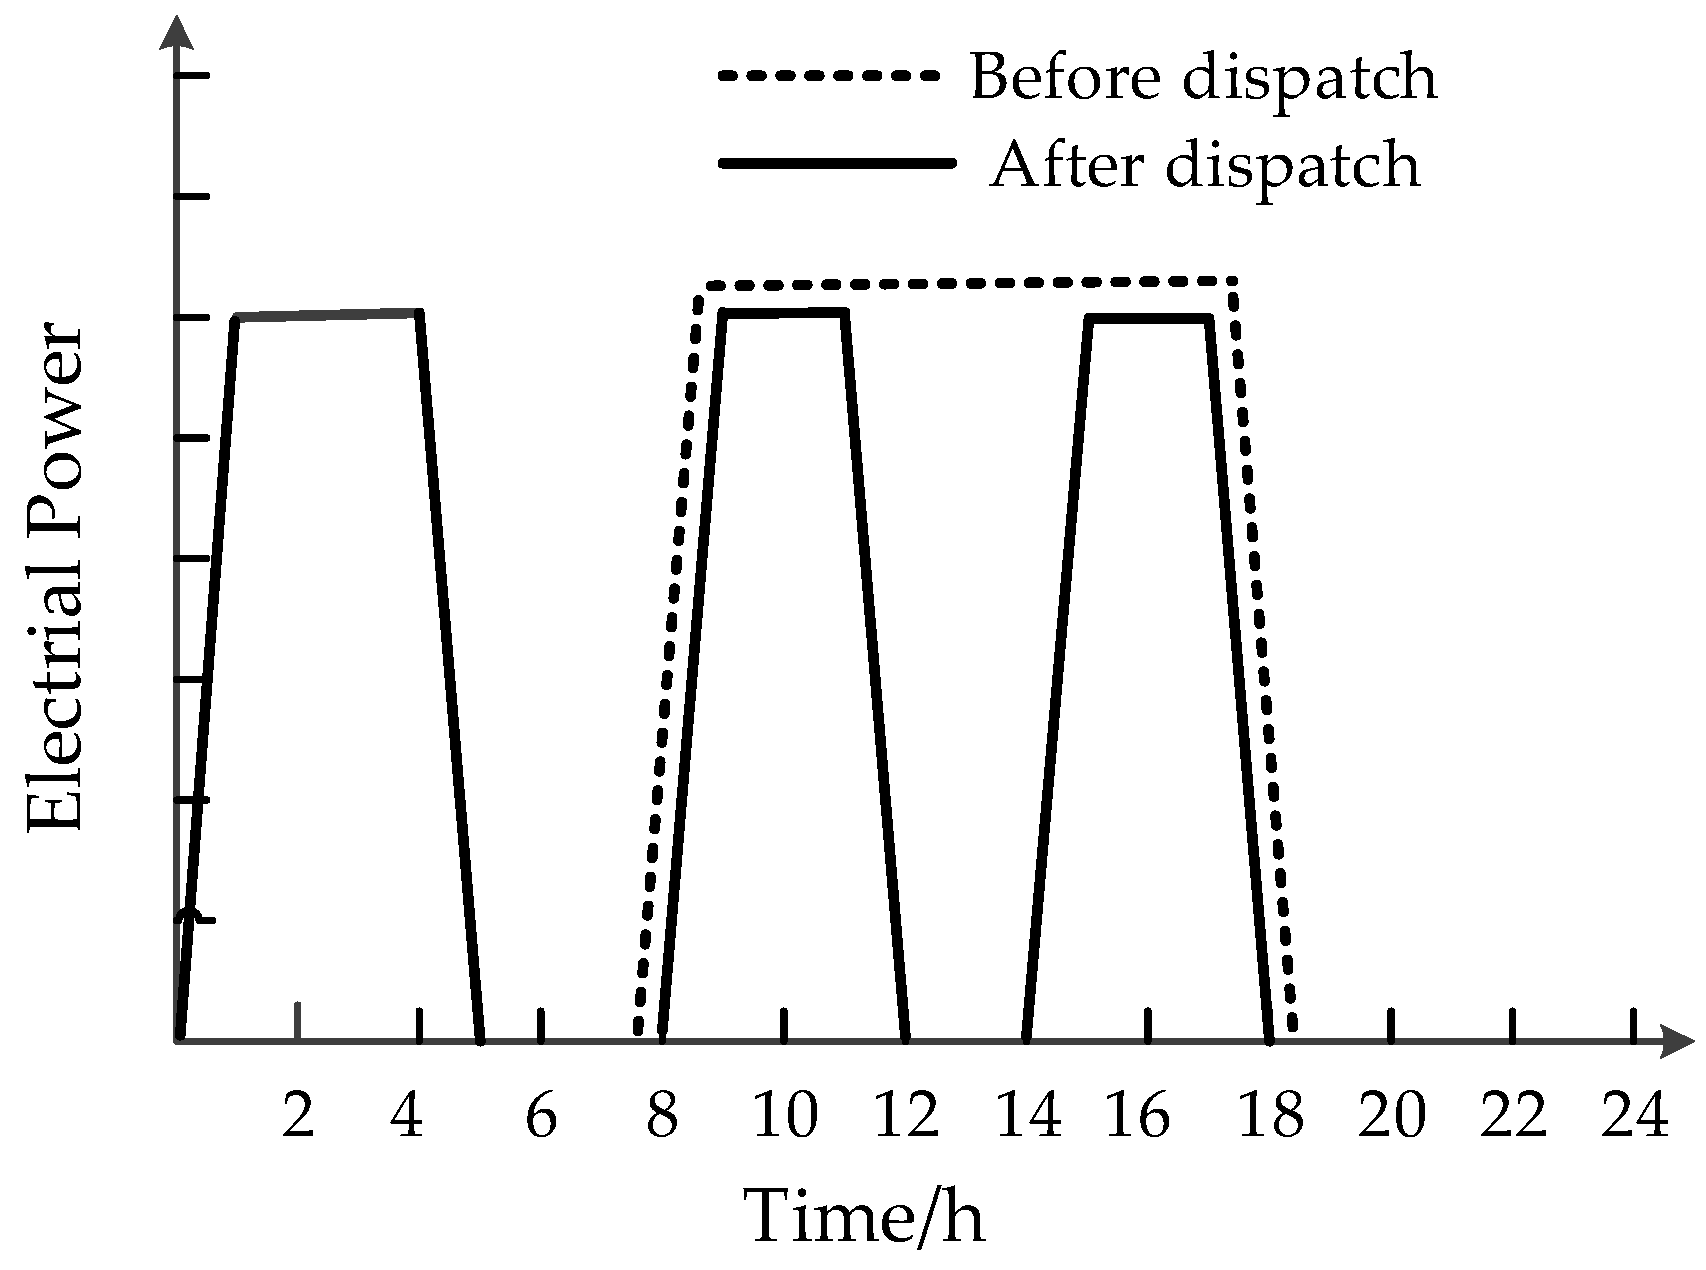
2.2. Incentive-Based DR

In this part, firstly, we analyze the mechanism of incentive-based demand response (DR) participating in power grid dispatch to improve wind power accommodation. Then, the cost formula of incentive-based DR participating in power grid dispatching is given.
Demand response (DR) refers to the behavior of users to change their short-term or long-term electricity consumption mode, through market price incentives or direct instructions from system operators. Usually, DR is divided into two main categories namely the incentive-based and time-based programs [28]. This paper mainly focuses on incentive-based DR, which is implemented voluntarily or compulsorily.
The process of users participating in dispatch can be described as basing on the situation of power generation and consumption in each scheduling period. The load control center issue dispatching instructions to the industrial users who signed the agreement, and provision of compensation. Figure 2 shows the schematic diagram of the industrial load participation schedule.
It can be seen that the load demand in 11:00–13:00 is transferred to 00:00–3:00, when the wind power is greatly abundant. As the “anti-peak regulation” character of wind power, DR can effectively promote wind power accommodation, and reduce the emissions of CO2, SO2, and NOx.
The incentive cost of DR can be described as follow [29]:
F D R = t = 1 T ( ρ P Δ L , t Δ t )
where FDR is the total incentive cost of DR, ρ is the incentive cost coefficient, P Δ L , t is the value of dispatch load at time t, Δ t is the dispatch time interval.
In order to ensure the production efficiency of the industries, P Δ L , t should be within limits:
ς L min P Load , t ± P Δ L , t P Load , t ς L max
t = 1 T P Δ L , t = 0
where PLoad,t is the load demand at time t. ζLmin and ζLmax are the minimum and maximum values of load regulation rate, respectively.

3. Dispatch Model

3.1. Objective Function

As illustrated in Figure 3, thermal power units, CHP units, wind turbines, EES and TES are considered as generating units to support power and heat demands. The CO2 produced by coal is directly discharged into the air, and SO2 and NOx are processed by the desulfurization and denitrification device and then release in the air.
In this paper, a combined dispatch model for reducing the emission of CO2, SO2, and NOx is established. Factors such as the fuel cost of conventional thermal power units, the cost of CHP units with TES, average daily investment and the operation and maintenance cost of EES units, the cost of load dispatch, the emission cost of CO2, SO2, and NOx, the operation cost of desulfurization and denitrification device and the cost of wind curtailment are comprehensively considered.
(1) Cost of thermal power units
As a controllable power source, the thermal power unit can track the changes of grid load through reasonable dispatch. At this time, the generation cost mainly includes the fuel cost of the units:
F 1 = i = 1 n C h , i
where F1 is the fuel cost of thermal power units. i = 1, …, n is the number of thermal power units. Ch,i is the fuel cost of thermal power unit i, which is calculated by Equation (14):
C h , i = t = 1 T ( a i P i , t 2 + b i P i , t + c i )
where ai, bi, and ci are the cost coefficients of thermal power unit i. Pi,t is the power of thermal power unit i at time t.
(2) Cost of EES
The storage capacity of electrical energy storage (EES) makes the wind power have the ability of space-time translation. But there was less use because of the high costs of EES, accordingly. The cost of EES including average daily investment and the operation and maintenance cost is given by:
F 2 = i = 1 m ( F E C , i + F E W , i )
where F2 is the total cost of EES. i = 1, …, m is the number of EES. FEC,i is the average daily investment cost of EES i, which is calculated by Equation (16). FEW,i is the operation and maintenance cost of EES i, which is calculated by Equation (17):
F E C , i = C E P P EES , i R + C E E E EES , i R T E , i
F E W , i = t = 1 T ( C O P i , t ESS )
where CEP and CEE are the power and capacity cost coefficients, respectively. P EES , i R is the rated power, E EES , i R is the rated capacity, and TE,i is the service life of EES i. CO is the operation and maintenance cost coefficient of EES, P i , t EES is the power of EES i at time t.
(3) Carbon cost
In order to maintain a long-term stable supply of energy while avoiding a further deterioration of the environment, the emission cost of CO2 is given by:
F 3 = C C P W C
where F3 is carbon cost, CCP is the environmental cost coefficient of CO2. WC is the emission of CO2, which is calculated by Equation (19):
W C = [ ( F 1 + i = 1 N C c , i ) / β m ] δ C
where βm is the unit-price of coal. δC is the emission of CO2 by a unit mass of coal combustion.
(4) Operation cost of desulfurization and denitrification equipment and the emission cost of SO2 and NOx
Both conventional thermal power units and CHP units will produce pollutants and cause environmental pollution during operation. The use of desulfurization and denitrification equipment can effectively reduce environmental pollution, but at the same time increases the operation cost of the power plant. This cost can be described as a positive linear correlation with the emissions of SO2 and NOx:
F 4 = C S W S β S + C N W N β N + C S P W S ( 1 η ) + C N P W N ( 1 η )
where F4 is the operation cost of desulfurization and denitrification equipment and the emission cost of SO2 and NOx. CS and CN are the operating cost coefficients of desulfurization and denitrification device to remove a unit mass of SO2 and NOx. WS is the emission of SO2, which is calculated by Equation (21), and WN is the emission of NOx, which is calculated by Equation (22). η is the efficiency of desulfurization and denitrification device. CSP and CNP are the environmental cost coefficients of SO2 and NOx:
W S = [ ( F 1 + i = 1 N C c , i ) / β m ] δ S
W N = [ ( F 1 + i = 1 N C c , i ) / β m ] δ N
where δS and δN are the emissions of SO2 and NOx by a unit mass of coal combustion, respectively.
(5) Cost of wind curtailment
The cost of wind curtailment can be described as follows:
F 5 = C Q t = 1 T P Δ Wind , t
where F5 is the cost of wind curtailment. CQ is the unit-cost of wind curtailment. P Δ Wind , t is the wind curtailment at time t.
Summing up Equations (1), (10), (13), (15), (18), (20), (23), the objective function is expressed as follows:
min F = F C T ( P i , t e , P i , t h , P j , t TES ) + F D R ( P Δ L , t ) + F 1 ( P i , t ) + F 2 ( P i , t EES ) + F 3 ( W C ) + F 4 ( W S , W N ) + F 5 ( P Δ Wind , t )
where F is the total cost of the dispatch model.

3.2. Constraints

(1) Power balance
Total generations and electric loads should be balanced at each period:
i = 1 A ( P i , t w P Δ Wind , t ) + i = 1 B P i , t + i = 1 n P i , t e + i = 1 m P i , t EES = P Load , t ± P Δ L , t
where P i , t w is the power of the wind turbine i at time t, P Load , t is load demand at time t.
(2) Thermal power range
Since the thermal inertia of the devices in user-side could maintain the temperatures, the unbalance between thermal power generation and thermal power demand can be accepted [30], but to ensure user comfort, the unbalance should be required within a limited range:
χ H min ( i = 1 N P i , t h + i = 1 M P i , t TES ) P Heat , t P Heat , t χ H max
where PHeat,t is the heat demand at time t. χ H min and χ H max are the lower and upper limited proportions of adjustment of thermal power demand, respectively.
(3) Constraints of conventional thermal power units:
P min , i P i , t P max , i
r d , i P i , t P i , t 1 r u , i
where Pmin,i and Pmax,i are the lower and upper power generation limits of unit i, respectively, rd,i and ru,i are the lower and upper ramp rate limits of thermal power unit i, respectively.
(4) Constraints of EES
S O C min , i S O C i , t S O C max , i
P min , i EES | P i , t EES | P max , i EES
where SOCmin,i, and SOCmax,i are lower and upper limits of the state of charge (SOC) for EES i, respectively, P min , i EES and P max , i EES are the lower and upper power limits for EES i, respectively.
The constraints of CHP with TES and the constraints of dispatch load are shown in Equations (5)–(9). The constraints of demand response are shown in (11) and (12).

4. Analysis of Examples

In this section, the effectiveness of the dispatch model is verified. Firstly, the parameters of the simulation and the forecasts of load demand and wind power in a week are given in Table 1 and Figure 4, respectively. Then, we compare the emission of CO2, SO2, and NOx and the wind power accommodation with traditional dispatch model, in which the environmental cost is not considered. Finally, we select one day for concrete analysis, including the role of environmental costs in economic dispatch and the effect of environmental cost coefficient on the results.

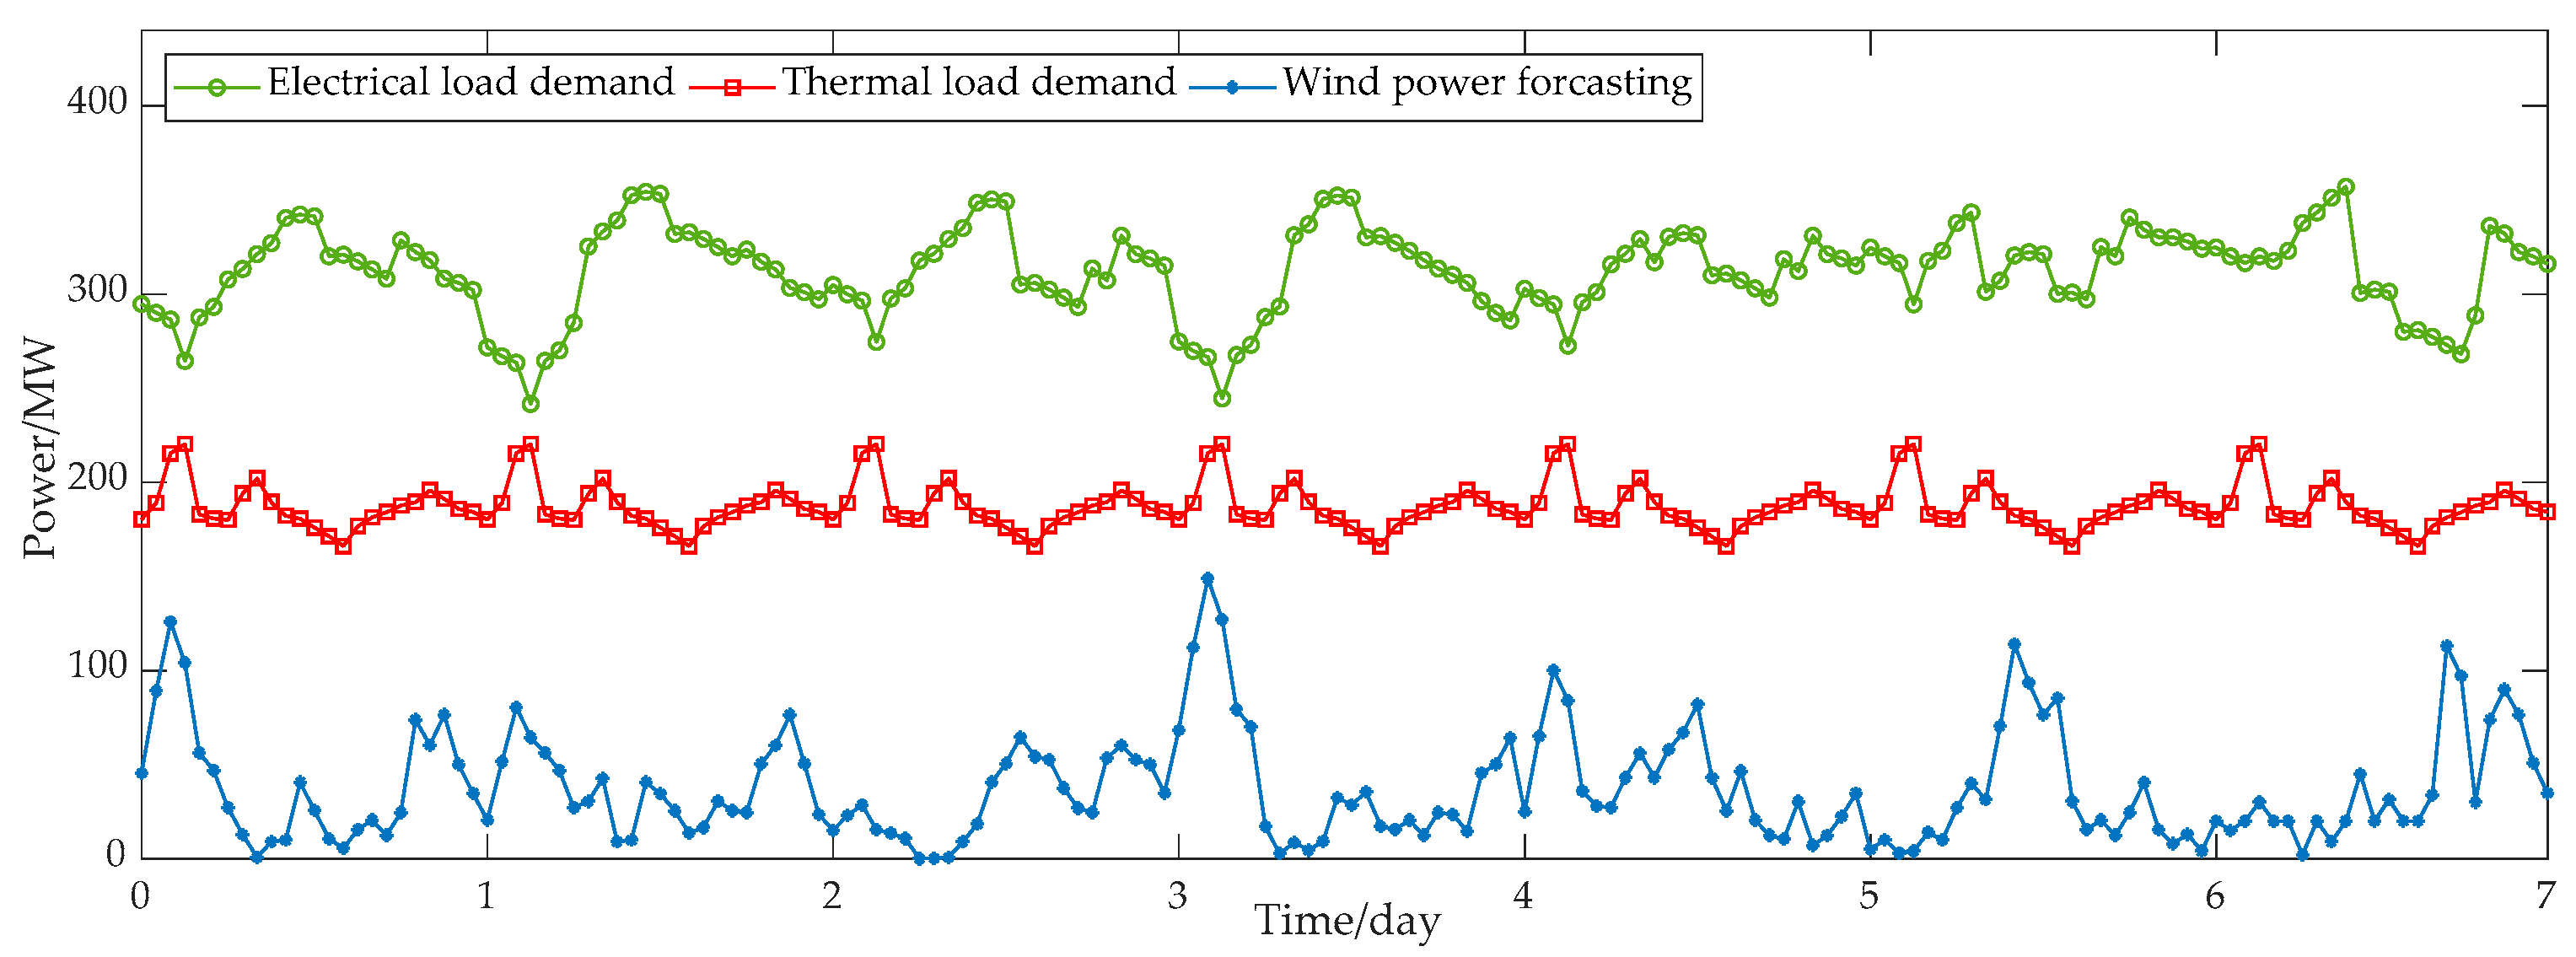
4.1. The Setup of Simulation

In this paper, the input parameters are the forecasts of load demand and wind power generation, which are given in Figure 4, and we assumed the forecasts are precise. To simplify the calculation, one CHP with TES, one thermal power unit, and one EES are performed in this test system. The parameters of the dispatch model are shown in Table 1. And the environmental cost coefficient of CO2, SO2, and NOx are 0.02 USD/kg, 6 USD/kg, and 28 USD/kg, respectively [31,32]; the operating cost coefficient of desulfurization and denitrification device are 2.99 USD/kg and 15 USD/kg, respectively [33]; the efficiency of desulfurization and denitrification device η is 85%; the initial heat storage of TES is 600 MWh; the initial SOC of EES is 0.5; the dispatch time interval is one hour.
The GA-Toolbox in MATLAB 2018a (MathWorks, Natick, MA, USA) is used to solve this optimization, and the relevant parameters of GA are the default values. The steps to optimize the dispatch models are as follows:
  • Firstly, we confirm that the optimization variables are P i , t e , P i , t h , P i , t TES , P Δ L , t , Pi,t, P i , t EES , and P Δ Wind , t . The objective of optimization is to minimize the total dispatching cost.
  • Secondly, the values of the parameters in Table 1 and the environmental cost parameters are substituted into Equations (1), (10), (13), (15), (18), (20), and (23). Then, these formulas are summed as the objective function.
  • Finally, the constraints (5)–(9), (11), (12), (25)–(30) are entered in the GUI interface of the GA-Toolbox in MATLAB 2018a (MathWorks, Natick, MA, USA), so that the solution process is within a reasonable range.

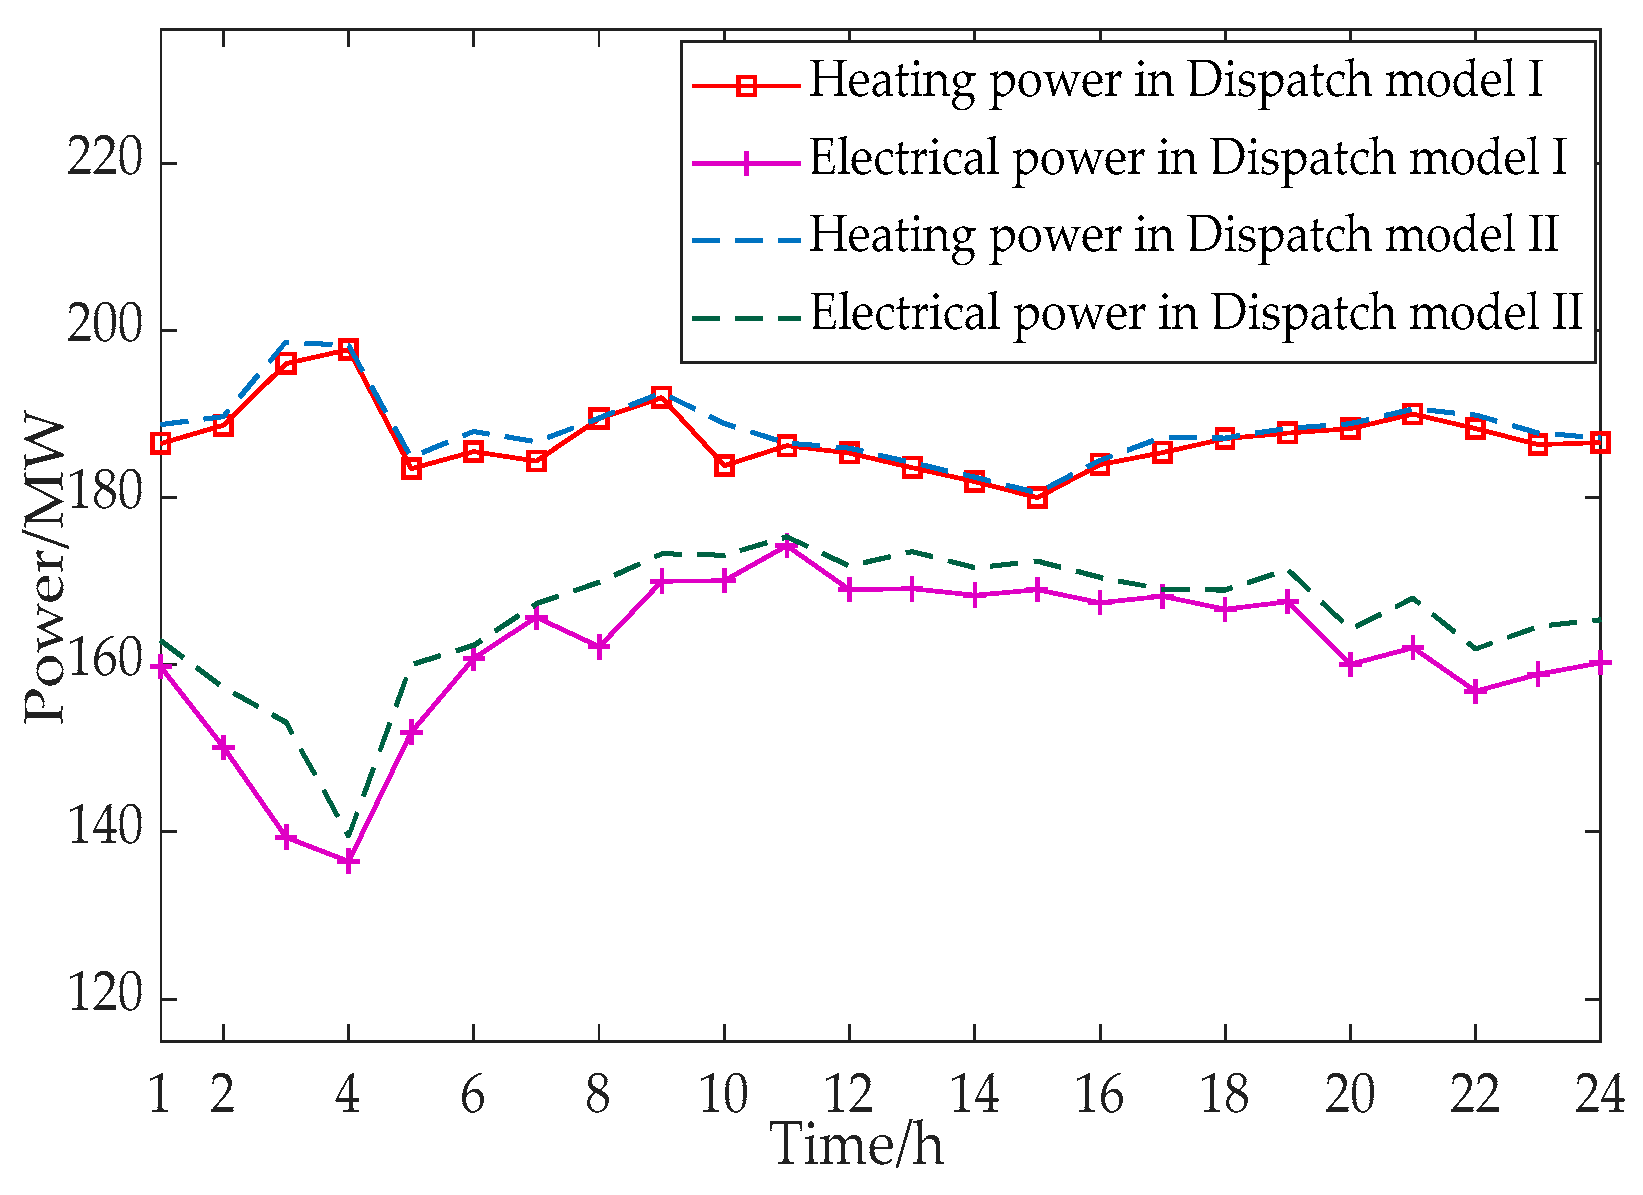
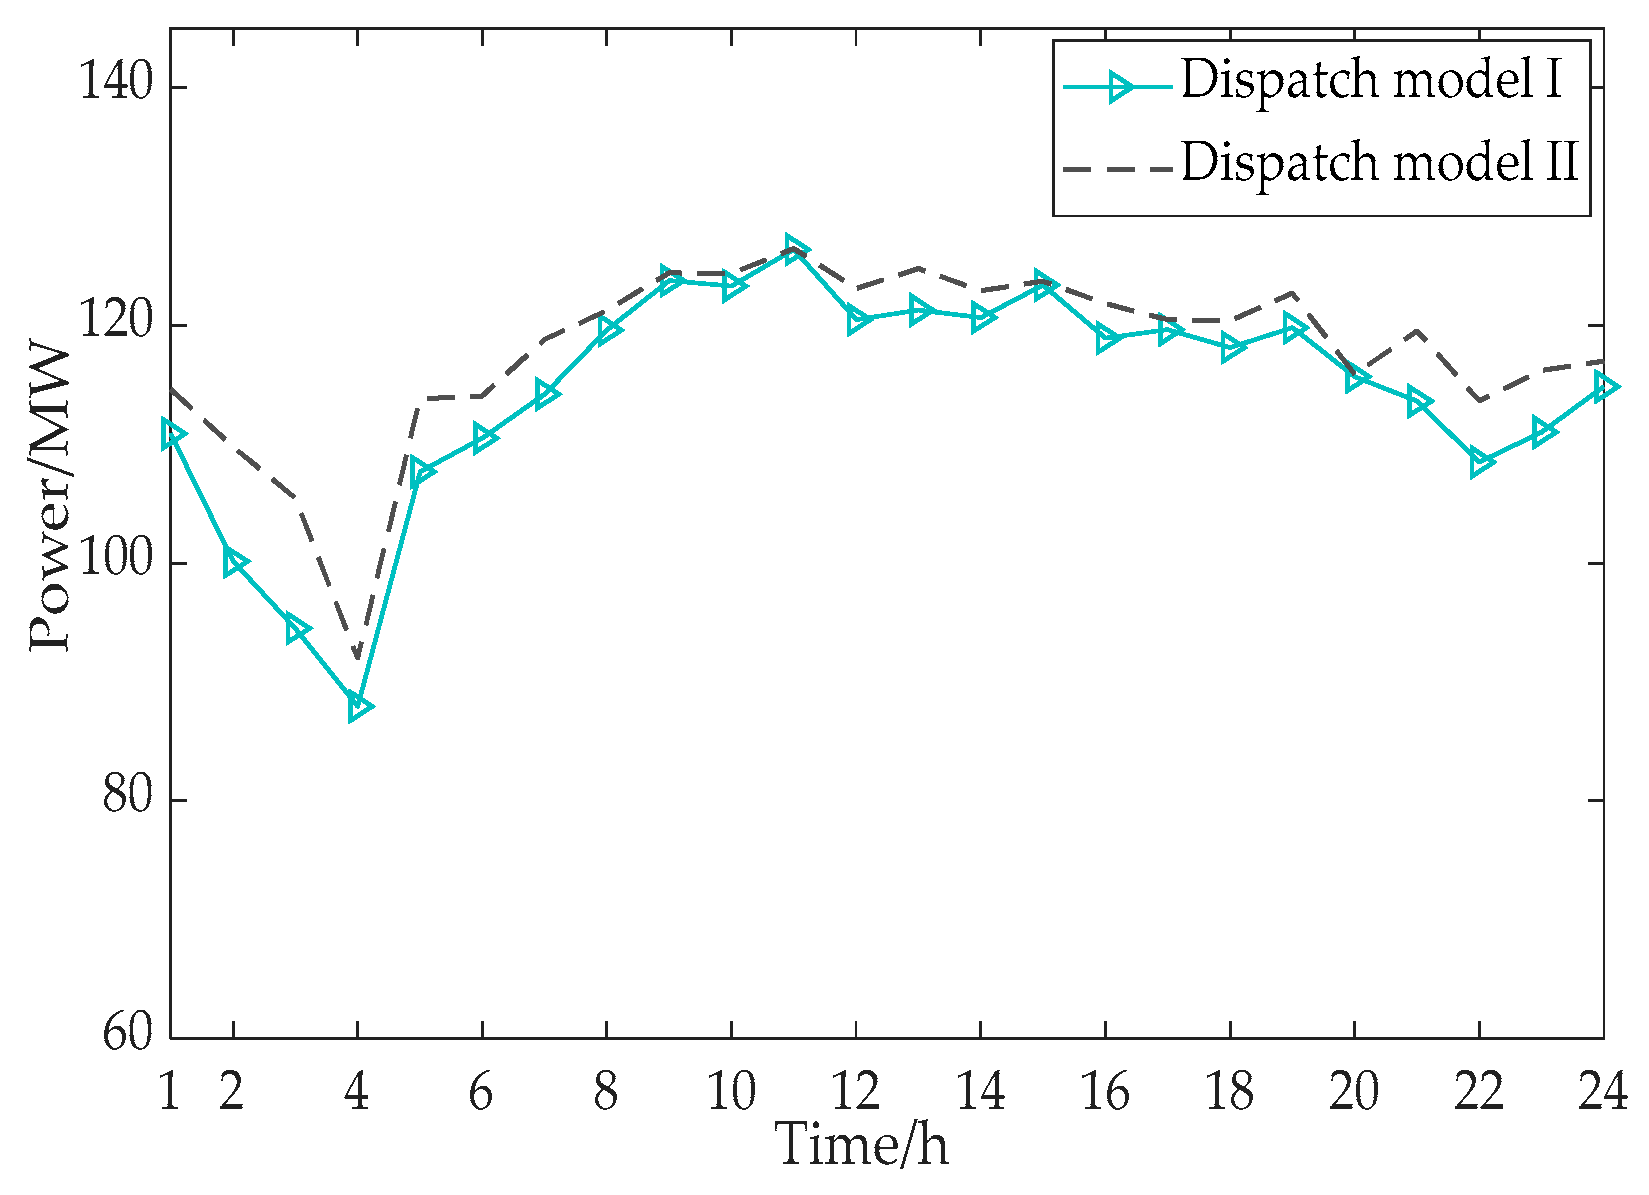
4.2. Comparison of Different Dispatch Models

In order to verify the effect of introducing environmental cost into dispatch model, the dispatch model proposed in this paper is compared with the traditional dispatch model, in which the environmental cost is not considered.
Dispatch model I (DM I): The emission cost of CO2, SO2, and NOx and the operation cost of desulfurization and denitrification equipment are considered in this dispatch model.
Dispatch model II (DM II): Relatively, this dispatch model does not consider the emission cost of CO2, SO2, and NOx and the operation cost of desulfurization and denitrification.
Figure 5, Figure 6 and Figure 7 show the comparison of the emissions of CO2, SO2, and NOx, respectively. It can be seen that the emissions of CO2, SO2, and NOx in dispatch model I are lower than dispatch model II. Concretely, the emissions of CO2, SO2, and NOx are reduced by an average of 14,354.35 kg, 55.5 kg, and 47.15 kg, respectively.
Figure 8 shows the comparison of wind power accommodation. As shown, the wind power accommodation in dispatch model I is higher than that in dispatch model II. As shown in Table 2, the average wind power accommodation proportion in dispatch model I and dispatch model II are 76.74% and 70.18%, respectively. The wind power accommodation is increased by 6.56%.

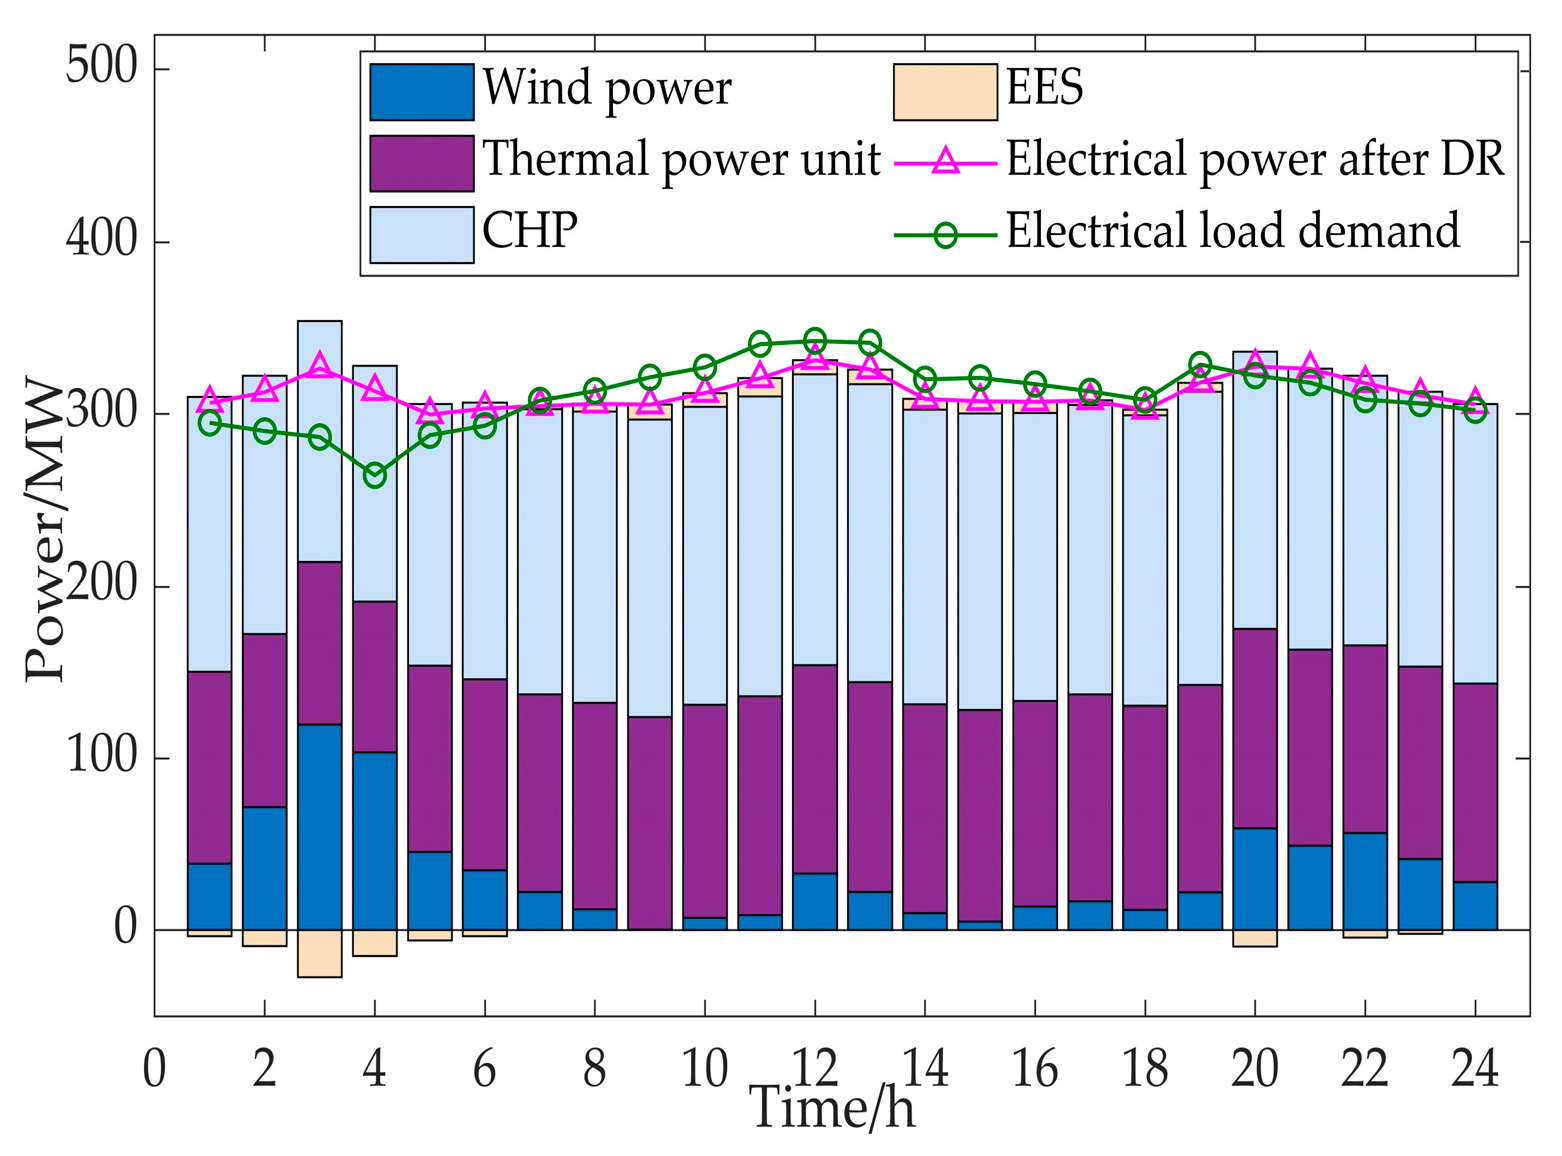
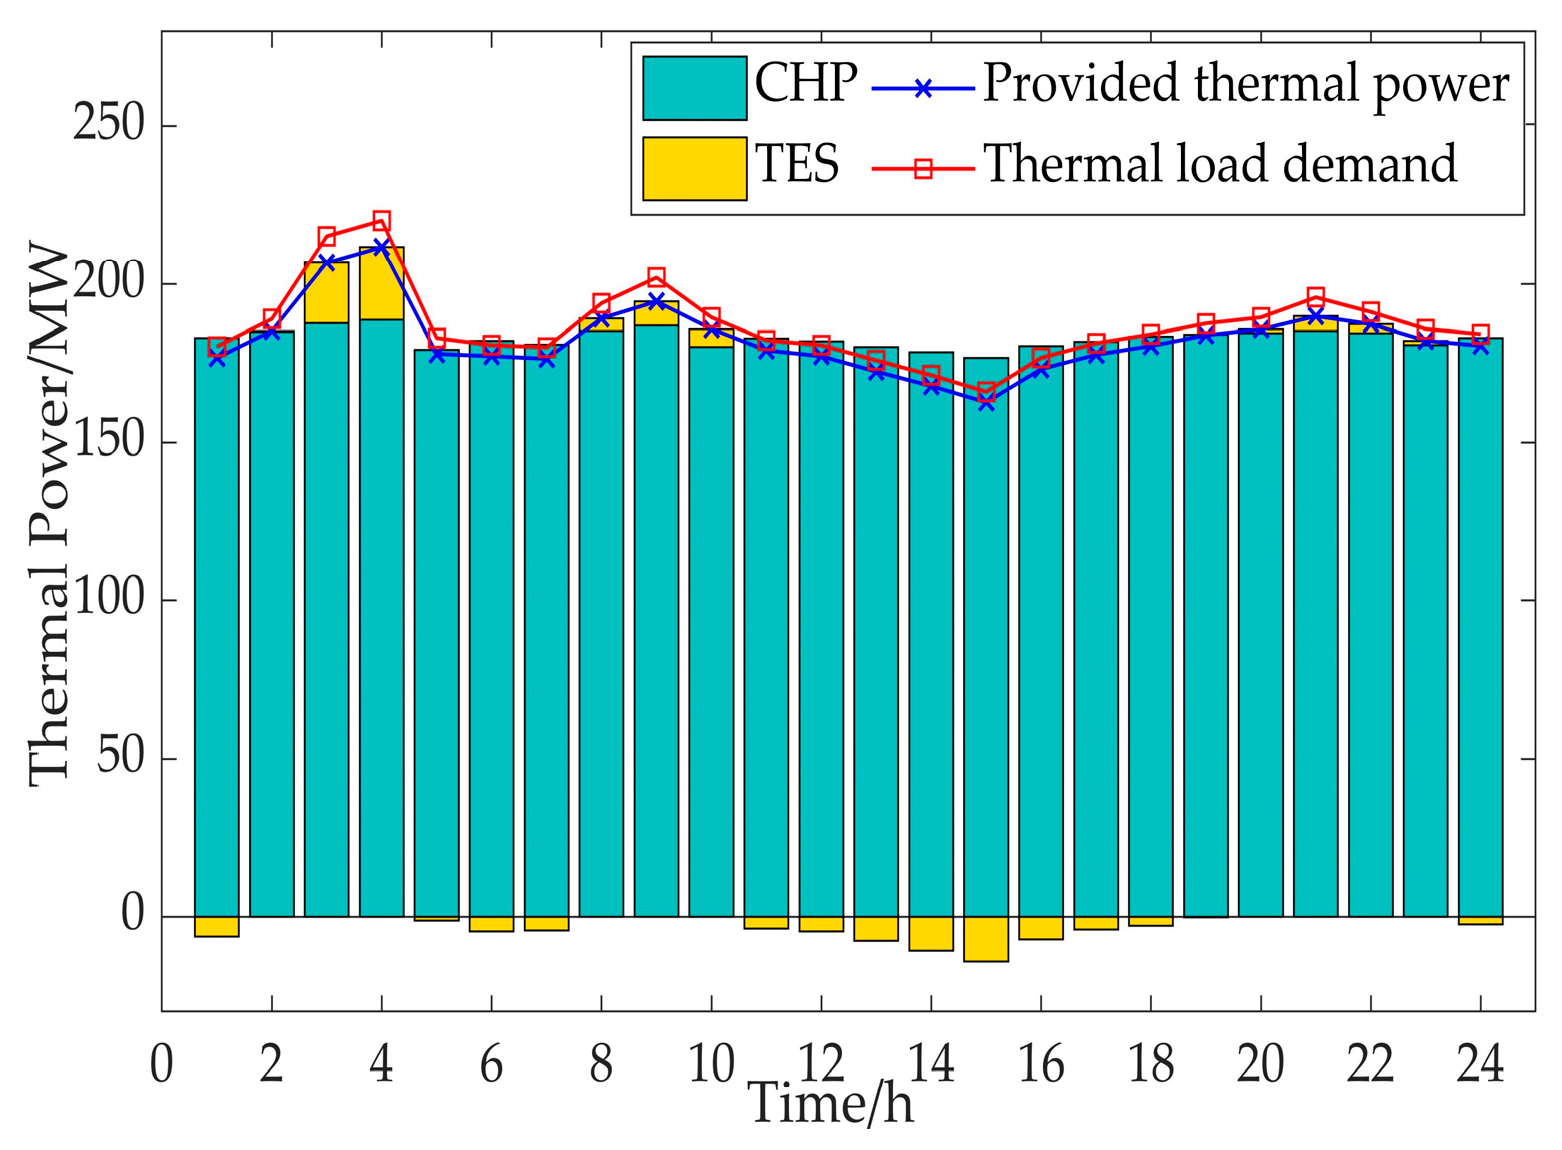
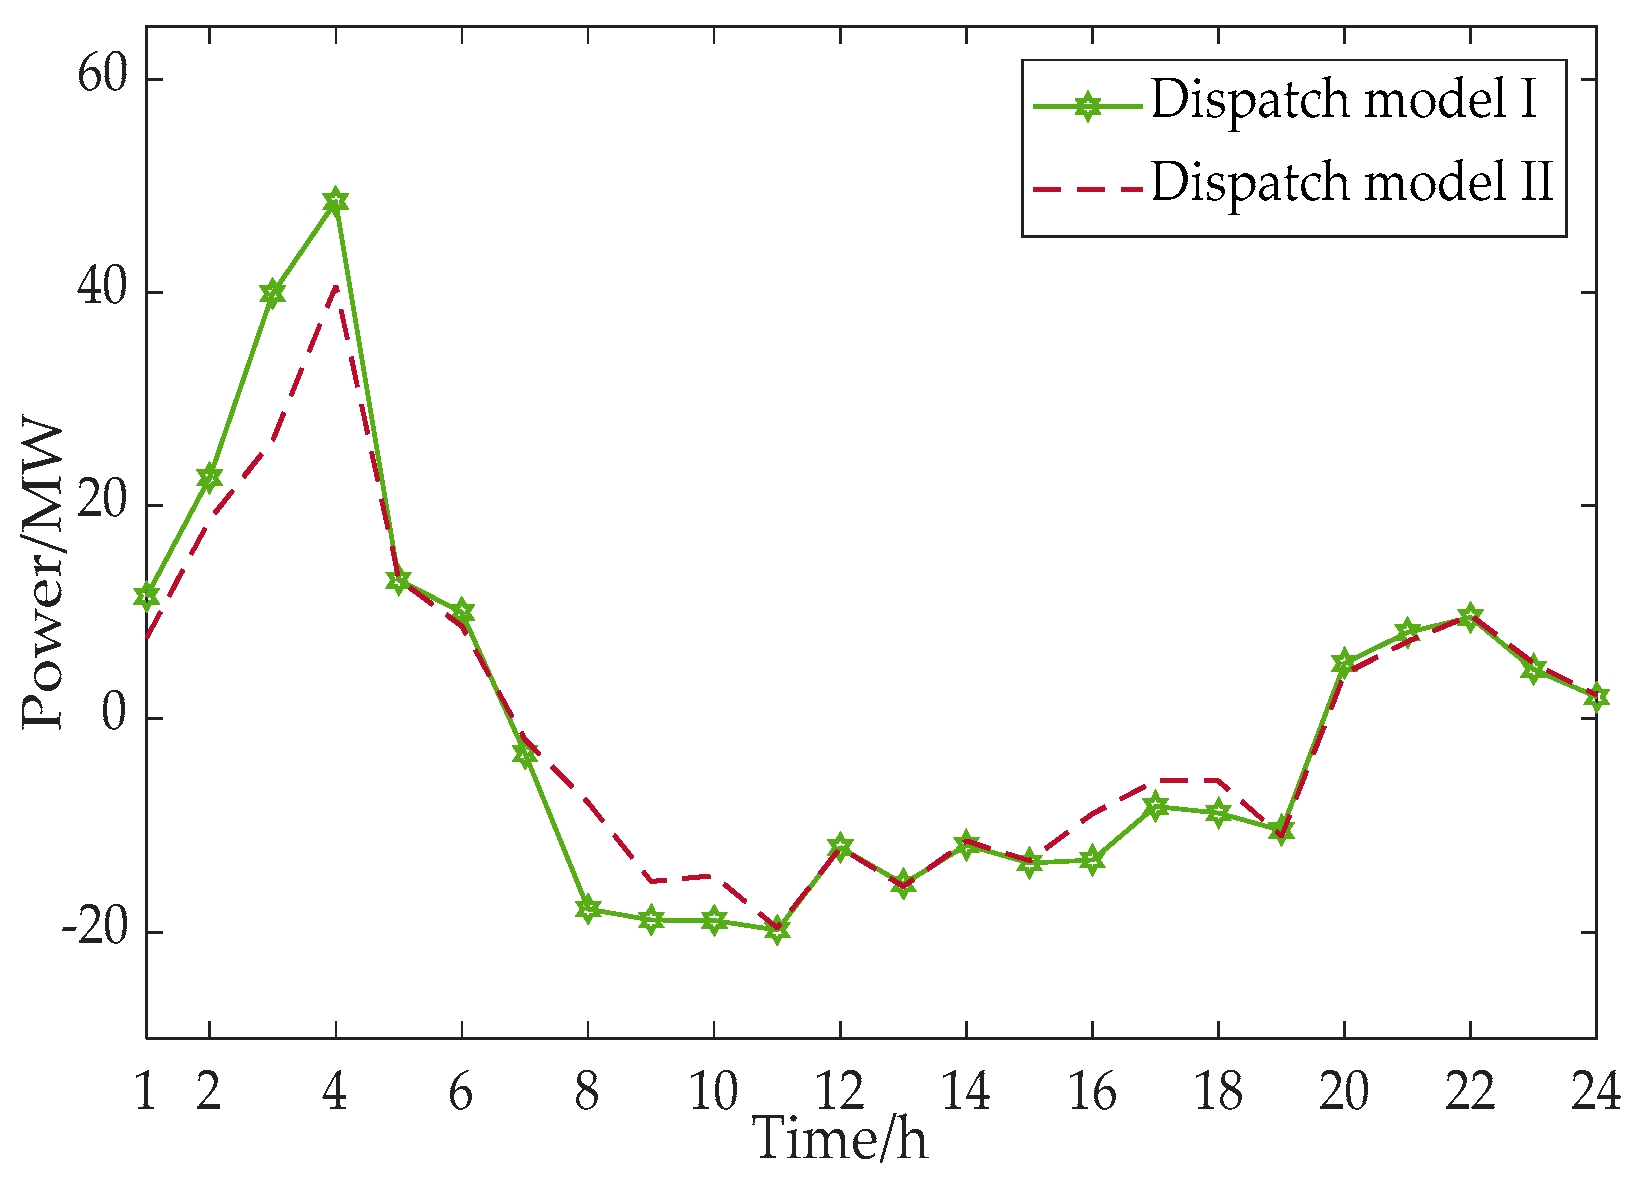
4.3. Analysis of Dispatch Results of One Day

In this part, we select the first day for concrete analysis. For dispatch model I, the optimized electric power of each unit is shown in Figure 9, and the optimized thermal power of each unit is shown in Figure 10.
As shown in Figure 9 and Figure 10, in this dispatch model, the electric power value of the units at each time is equal to the electric load demand, while the heat power value does not need to be equal to the thermal load demand, because of the thermal inertia of thermal generation units. Comparing the two figures, we could find that during the time interval from 1 a.m. to 6 a.m., the electrical power demand is increased and the heating power demand is decreased through the means of DR. The fuel cost of the CHP is significantly lower than that of the thermal power unit, and its thermal power and electric power have certain coupling characteristics. In order to reduce the power of the thermal power unit during the peak load period, it is necessary to increase the electric power of CHP. TES releases heat in the peak period of the electric load, so as to reduce the thermal power of the CHP unit, and then to increase its electrical power, to achieve the goal of reducing the comprehensive operation cost. Concretely, the optimized costs in dispatch model I and dispatch model II are shown in Table 3.
As shown in Table 3, the optimized total dispatching costs in dispatch model I and dispatch model II are 235.94 kUSD and 191.76 kUSD, respectively. The total dispatching cost of dispatch model I is higher than that in dispatch model II. However, the environmental cost is not taken into account in dispatch model II. The environmental cost of dispatch model I is 46.87 kUSD, accounting for 19.87% of the total cost. According to the optimized results, if environmental protection is considered in an economic dispatch model, the proportion of environmental cost cannot be ignored.
Figure 11 and Figure 12 show the comparison of CHP and thermal power unit. It can be seen that the power of CHP and thermal power unit in dispatch model I is lower than that in dispatch model II, especially between 1 a.m. to 8 a.m., the contrast of electrical power is obvious. However, the comparison of thermal power of CHP is not obvious. There are two main reasons: (1) The addition of TES to CHP improves the flexibility of CHP. Therefore, the operation pattern “determining power by heat” of CHP is alleviated; and (2) The operating characteristics of the CHP itself. In Figure 1, we know that when the thermal power is Ph, the feasible region of electrical power is from [ P F e , P E e ]. In other words, the thermal power in both dispatch models, the thermal power of CHP is “Ph” in these dispatch models, and the electrical power varies between P F e and P E e . Therefore, the electrical power of the CHP is more obvious than thermal power.
Figure 13 shows the comparison of DR. The positive value means increasing the load power and the negative value means decreasing the load power. Owning to both of the dispatch models are emphasized on reducing the electrical power of CHP and thermal power unit to reduce the emissions of CO2, SO2, and NOx and promote the wind power accommodation. It can be seen that the fluctuations of DR in dispatch model I are more pronounced than dispatch model II. Especially between 1 a.m. to 5 a.m., when the wind power is sufficient, the electrical load demand based on DR is obviously increased. Between 7 a.m. to 9 a.m., when the electrical load demand is at a peak and the wind power is at a low level, the electrical load demand based on DR is obviously decreased
Thus, the lower output of coal-fired unit will decrease the utilization of coal, meanwhile, the emissions of CO2, SO2, and NOx will also be decreased. In addition, the reduced power of the generator and the increased load based on DR would provide the accommodation space for wind power.
Figure 14 and Figure 15 show the comparison of the emissions of CO2, SO2, and NOx, and Figure 16 shows the comparison of wind power accommodation. It can be seen that the emissions of CO2, SO2, and NOx in dispatch model I are much lower than dispatch model II. The wind power accommodation in dispatch model I is significantly improved. Therefore, taking environmental costs into account can significantly reduce the emissions of CO2, SO2, and NOx and promote wind power accommodation. It meets the development requirements of promoting the development of new energy power generation and energy conservation and emission reduction.

5. Conclusions

An economic power dispatch model considering the environmental cost based on CHP-DR is proposed in this paper. The optimized results show that, compared with the traditional dispatch model, the daily average emissions of CO2, SO2, and NOx are decreased by 14,354.35 kg, 55.5 kg, and 47.15 kg, respectively, and the wind power accommodation is increased by 6.56%. Simulation results demonstrate that the dispatch model is efficient to reduce the emissions of CO2, SO2, and NOx, and increase the wind power accommodation. The following conclusions can be drawn: (1) The emissions of CO2, SO2, and NOx could be reduced, and the wind power accommodation could be promoted, when considering the environmental cost in an economic dispatch model; (2) environmental costs can be counted as the cost of power generation, since the environmental cost is closely related to the amount of coal burned; and (3) environmental cost accounts for a certain proportion of the total economic cost, so it is significative to consider environmental cost in an economic dispatch model.

Author Contributions

All of the authors have contributed to this research. The original ideas were provided by W.L. The revision of the draft was guided by J.Y. Some theoretical analysis was given by H.W. and Y.L. The experiments were designed by W.G. and T.L., M.O.O., J.D., and D.C. helped to analyze the data and revise the paper.

Funding

This research was funded by the Innovation Team Project of Institutions of Higher Learning in Liaoning Province (LT2016009).

Acknowledgments

This work is supported by the Innovation Team Project of Institutions of Higher Learning in Liaoning Province (LT2016009).

Conflicts of Interest

The authors declare no conflict of interest.

Nomenclature

The following nomenclatures are used in this manuscript:
CHPCombined heat and power
TESThermal energy storage
DRDemand response
EESElectric energy storage
SOCState of charge
GAGenetic Algorithm
FCTTotal cost of CHP with TES
N/M/n/mNumber of CHP/TES/thermal power units/EES
TThe number of hours in operation
Cc,iFuel cost of CHP i with TES
FTC,jAverage daily investment cost of TES j
FTW,jOperation and maintenance cost of TES j
am/bm/cmOperation cost coefficients of CHP with TES
P i , t e Electrical power of CHP i at time t
P i , t h Thermal power of CHP i at time t
P min , i e / P max , i e Lower/upper limits of electrical power for CHP i
P min , i h / P max , i h Lower/upper limits of thermal power for CHP i
r d , i C / r u , i C Lower/upper ramp rate limits of CHP i
cvThe linear supply slopes of thermal power and electric power of CHP
P j , t TES Thermal power of TES j at time t
P R , j TES / E R , j TES Rated power/capacity of TES j
CTP/CTEPower/capacity cost coefficients of TES
TT,jService life of TES j
CUOperation and maintenance cost coefficient of TES
Sj,tCapacity of TES j at time t
Smin,j/Smax,jLower/upper capacity limits of TES j
P min , j TES / P max , j TES Lower/upper thermal power limits of TES j
FDRTotal incentive cost of DR
ρThe incentive cost coefficient
P Δ L , t The value of dispatch load at time t
ΔtDispatch time interval
PLoad,t/PHeat,tElectrical load demand/thermal load demand at time t
ζLmin/ζLmaxLower/upper values of load regulation rate
χ H min / χ H max Lower/upper limited proportions of adjustment of thermal power demand
F1Fuel cost of thermal power units
Ch,iFuel cost of thermal power unit i
ai/bi/ciThe cost coefficients of thermal power unit i
Pi,tPower of thermal power unit i at time t
Pmin,i/Pmax,iLower/upper power generation limits of thermal power unit i
rd,i/ru,iLower/upper ramp rate limits of thermal power unit i
F2Total cost of EES
FEC,i/FEW,iAverage daily investment cost/the operation and maintenance cost of EES i
CEP/CEEPower/capacity cost coefficients of EES
P EES , i R / E EES , i R Rated power/capacity of EES i
P i , t EES Power of EES i at time t
TE,iService life of EES i
COOperation and maintenance cost coefficient of EES
SOCmin,i/SOCmax,iLower/upper SOC limits of EES i
P min , i EES / P max , i EES Lower/upper power limits of unit i
F3Carbon cost
CCP/CSP/CNPEnvironmental cost coefficient of CO2/SO2/NOx
WC/WS/WNEmission of CO2/SO2/NOx
δCSNEmission of CO2/SO2/NOx by a unit mass of coal combustion
βmUnit-price of coal
F4Operation cost of desulfurization and denitrification equipment and the emission cost of SO2 and NOx
CS/CNOperation cost of desulfurization and denitrification device to remove unit mass of SO2/NOx
ηEfficiency of desulfurization and denitrification device
F5Cost of wind curtailment
CQUnit-cost of wind curtailment
P Δ Wind , t Wind curtailment at time t

References

  1. Liu, D.; Zhang, G.; Huang, B.; Liu, W. Optimum Electric Boiler Capacity Configuration in a Regional Power Grid for a Wind Power Accommodation Scenario. Energies 2016, 9, 144. [Google Scholar] [CrossRef]
  2. Yang, L.J.; Zhang, X.; Gao, P. Research on Heat and Electricity Coordinated Dispatch Model for Better Integration of Wind Power Based on Electric Boiler with Thermal Storage. IET Gener. Transm. Distrib. 2018, 12, 3736–3743. [Google Scholar] [CrossRef]
  3. Shao, C.Z.; Ding, Y.; Wang, J.H.; Song, Y.H. Modeling and Integration of Flexible Demand in Heat and Electricity Integrated Energy System. IEEE Trans. Sustain. Energy 2018, 45, 361–370. [Google Scholar] [CrossRef]
  4. Lei, S.B.; Hou, Y.H.; Wang, X.; Liu, K. Unit Commitment Incorporating Spatial Distribution Control of Air Pollutant Dispersion. IEEE Trans. Ind. Inform. 2017, 13, 995–1005. [Google Scholar] [CrossRef]
  5. Wang, X.; Li, H. Multi-Objectives Combined Electric Heating Dispatch Model of Wind Power Accommodation with Heat Storage Device. IET J. Eng. 2017, 13, 1539–1545. [Google Scholar] [CrossRef]
  6. Lorestani, A.; Ardehali, M.M. Optimization of Autonomous Combined heat and Power System Including PVT, WT, Storages, and Electric Heat Utilizing Novel Evolutionary Particle Swarm Optimization Algorithm. Renew. Energy 2018, 119, 490–503. [Google Scholar] [CrossRef]
  7. Ma, H.; Chen, Q.; Hu, K.; Dai, Y.H.; Chen, L.; Xu, F. A Dispatch Method of Combined Heat and Power Plants with Heat Storage Facilities for Wind Power Accommodation. In Proceedings of the IEEE, International Conference on Renewable Energy Research and Applications, San Diego, CA, USA, 5–8 November 2017; pp. 262–272. [Google Scholar]
  8. Chen, H.H.; Zhang, R.F.; Li, G.Q.; Bai, L.Q.; Li, F.X. Economic Dispatch of Wind Integrated Power Systems with Energy Storage Considering Composite Operating Costs. IET Gener. Transm. Distrib. 2016, 10, 1294–1303. [Google Scholar] [CrossRef]
  9. Dai, Y.H.; Chen, L.; Min, Y.; Chen, Q.; Hu, K.; Hao, J.H. Dispatch Model of Combined Heat and Power Plant Considering Heat Transfer Process. IEEE Trans. Sustain. Energy 2017, 8, 1225–1236. [Google Scholar] [CrossRef]
  10. Han, L.; Zhang, R.; Wang, X.; Dong, Y. Multi-Time Scale Rolling Economic Dispatch for Wind/Storage Power System Based on Forecast Error Feature Extraction. Energies 2018, 11, 2124. [Google Scholar] [CrossRef]
  11. Dai, Y.H.; Chen, L.; Min, Y.; Mancarella, P.; Chen, Q.; Hu, K.; Hao, J.H. A General Model for Thermal Energy Storage in Combined Heat and Power Dispatch Considering Heat Transfer Constraints. IEEE Trans. Sustain. Energy 2018, 9, 1518–1528. [Google Scholar] [CrossRef] [Green Version]
  12. Li, Z.G.; Wu, W.C.; Shahidehpour, M.; Wang, J.G.; Zhang, B.M. Combined Heat and Power Dispatch Considering Pipeline Energy Storage of District Heating Network. IEEE Trans. Sustain. Energy 2016, 7, 12–22. [Google Scholar] [CrossRef]
  13. Dai, Y.H.; Chen, L.; Min, Y.; Chen, Q.; Hao, J.H.; Hu, K.; Xu, F. Dispatch Model for CHP With Pipeline and Building Thermal Energy Storage Considering Heat Transfer Process. IEEE Trans. Sustain. Energy 2018, 10, 192–203. [Google Scholar] [CrossRef]
  14. Dai, Y.H.; Chen, L.; Min, Y.; Pierluigi, M.; Chen, Q.; Hao, J.H.; Hu, K.; Xu, F. Integrated Dispatch Model for Combined Heat and Power Plant with Phase-Change Thermal Energy Storage Considering Heat Transfer Process. IEEE Trans. Sustain. Energy 2018, 9, 1234–1243. [Google Scholar] [CrossRef]
  15. Tariq, S.; Edward, K.; Petr, S. Automated Demand Response for Smart Buildings and Microgrids: The State of the Practice and Research Challenges. Proc. IEEE 2016, 104, 726–744. [Google Scholar]
  16. Manijeh, A.; Behnam, M.I.; Kazem, Z. Stochastic Scheduling of Renewable and CHP-Based Microgrids. IEEE Trans. Ind. Inform. 2015, 11, 1049–1058. [Google Scholar]
  17. Wang, Y.; Ai, X.; Tan, Z.F.; Yan, L.; Liu, S.T. Interactive Dispatch Models and Bidding Strategy of Multiple Virtual Power Plants Based on Demand Response and Game Theory. IET Gener. Transm. Distrib. 2016, 7, 510–519. [Google Scholar]
  18. Wang, F.; Zhou, L.D.; Ren, H.; Liu, X.L.; Miadreza, S.K.; Catalão, J.P.S. Multi-objective Optimization Model of Source-Load-Storage Synergetic Dispatch for Building Energy System Based on TOU Price Demand Response. IEEE Trans. Ind. Appl. 2018, 54, 1017–1028. [Google Scholar] [CrossRef]
  19. Hamdi, A.; Ehsan, D.; Farid, M. Dynamic Economic Dispatch Problem Integrated with Demand Response (DEDDR) Considering Non-Linear Responsive Load Models. IEEE Trans. Smart Grid 2016, 7, 2586–2595. [Google Scholar]
  20. Srikanth, R.R.; Lokesh, K.P.; Bijaya, K.P.; Rajesh, K. Investigating the Impact of Load Profile Attributes on Demand Response Exchange. IEEE Trans. Ind. Inform. 2018, 14, 1382–1391. [Google Scholar]
  21. Yu, M.M.; Hong, S.H.; Ding, Y.M.; Ye, X. An Incentive-Based Demand Response (DR) Model Considering Composited DR Resources. IEEE Trans. Ind. Electron. 2019, 66, 1488–1498. [Google Scholar] [CrossRef]
  22. Wang, B.B.; Yang, X.C.; Taylor, S.; Yang, S.C. Chance Constrained Unit Commitment Considering Comprehensive Modelling of Demand Response Resources. IET Renew. Power Gener. 2017, 11, 490–500. [Google Scholar] [CrossRef]
  23. Dinh, H.N.; Tatsuo, N.; Michihiro, K. A Distributed Optimal Power Dispatch Control Approach for Environment-Friendly Power Grids. IEEE Soc. Instrum. Control Eng. Jpn. 2016, 258–263. [Google Scholar]
  24. Arash, D.; Cui, Y.; Pegah, A.; Vinod, M.V. Minimizing Electricity Cost and Emissions in Optical Data Center Networks. IEEE/OSA J. Opt. Commun. Netw. 2017, 9, 257–274. [Google Scholar]
  25. Pouya, P.; Farnaz, S.; Behnam, M.I.; Mehdi, A. Reliable Economic Dispatch of Microgrids by Exchange Market Algorithm. In Proceedings of the IEEE Smart Grid Conference, Jeddah, Saudi Arabia, 12–14 December 2017; pp. 1–5. [Google Scholar]
  26. Olegs, L.; Aivars, C.; Sigurds, J.; Polina, I. Possibility of Thermal Energy Storage System Implementation at CHP Plant. In Proceedings of the IEEE 12th International Conference on the European Energy Market, Lisbon, Portugal, 19–22 May 2015; pp. 1–5. [Google Scholar]
  27. Shahab, B.; Aras, S. From Demand Response in Smart Grid Toward Integrated Demand Response in Smart Energy Hub. IEEE Trans. Smart Grid 2016, 7, 650–658. [Google Scholar]
  28. Qin, J.H.; Wan, Y.N.; Yu, X.H.; Li, C.J. Consensus-Based Distributed Coordination between Economic Dispatch and Demand Response. IEEE Trans. Smart Grid 2018, 99, 1. [Google Scholar] [CrossRef]
  29. Wang, J.X.; Zhong, H.W.; Xia, Q.; Kang, C.Q.; Du, E.S. Optimal Joint-Dispatch of Energy and Reserve for CCHP-Based Microgrids. IET Gener. Transm. Distrib. 2017, 11, 785–794. [Google Scholar] [CrossRef]
  30. Al-Roomi, A.R.; El-Hawary, M.E. A Novel Multiple Fuels’ Cost Function for Realistic Economic Load Dispatch Needs. In Proceedings of the IEEE Electrical Power and Energy Conference, Saskatoon, SK, Canada, 22–25 October 2017; pp. 1–6. [Google Scholar]
  31. Yuan, C.C.; Gu, C.H.; Li, F.R.; Bless, K.; Roderick, W.D. New Problem Formulation of Emission Constrained Generation Mix. IEEE Trans. Power Syst. 2013, 28, 4064–4071. [Google Scholar] [CrossRef] [Green Version]
  32. Ismail, Z.; Farid, B.; Amel, G.; Yacine, S. Combined Economic Emission Dispatch with New Price Penalty Factors. In Proceedings of the 2015 4th International Conference on Electrical Engineering (ICEE), Boumerdes, Algeria, 13–15 December 2015; pp. 1–5. [Google Scholar]
  33. Ismail, Z.; Farid, B.; Yacine, S.; Amel, G. Combined Dynamic Economic/Emission Dispatch Using Simulated Annealing Solution. In Proceedings of the 2015 4th International Conference on Systems and Control (ICSC), Sousse, Tunisia, 28–30 April 2015; pp. 302–309. [Google Scholar]
Figure 1. Heat-electricity relationship of CHP unit with TES.
Energies 12 00817 g001
Figure 2. The power curve of the industrial load before and after dispatch.
Energies 12 00817 g002
Figure 3. Structural diagram of the entire system.
Energies 12 00817 g003
Figure 4. Curve of prediction.
Energies 12 00817 g004
Figure 5. Comparison of CO2 emission.
Energies 12 00817 g005
Figure 6. Comparison of SO2 emission.
Energies 12 00817 g006
Figure 7. Comparison of NOx emission.
Energies 12 00817 g007
Figure 8. Comparison of wind power accommodation.
Energies 12 00817 g008
Figure 9. Electric power dispatch result of each unit.
Energies 12 00817 g009
Figure 10. Heat power dispatch results of combined heat and power (CHP) and thermal energy storage (TES).
Energies 12 00817 g010
Figure 11. Comparison of CHP.
Energies 12 00817 g011
Figure 12. Comparison of thermal power unit.
Energies 12 00817 g012
Figure 13. Comparison of demand response (DR).
Energies 12 00817 g013
Figure 14. The emission of CO2.
Energies 12 00817 g014
Figure 15. Comparison of the emissions of SO2 and NOx.
Energies 12 00817 g015
Figure 16. Wind power forecast and accommodation power.
Energies 12 00817 g016
Table 1. The parameters of dispatch models.
ParameterValueParameterValueParameterValueParameterValue
am(USD/MW2)0.0044bi(USD/MW)23.66CTE(USD/MWh)4000ρ(USD/MW)150
bm(USD/MW)13.29ci(USD)16.22TT,i(year)20ζLmin0.9
cm(USD)39Pmin,i(MW)55CU(USD/MW)10ζLmax1.1
cv0.15Pmax,i(MW)150SOCmin,i0.2 χ H min −0.1
P min , i e (MW)100rd,i(MW)−60SOCmax,i0.9 χ H max 0.1
P max , i e (MW)200ru,i(MW)60 P min , i EES (MW)−50δC(kg)2600
P min , i h (MW)150Smin,i(MWH)100 P max , i EES (MW)50δS(kg)8.5
P max , i h (MW)250Smax,i(MWH)800CEP(USD/MW)15,000δN(kg)7.4
r d , i C (MW)−50 P min , j TES (MW)−100CEE(USD/MWh)7000βm(USD/kg)0.6
r u , i C (MW)50 P max , j TES (MW)100TE,i(year)20CQ(USD/MW)100
ai(USD/MW2)0.03CTP(USD/MW)8000CO(USD/MW)26
Table 2. Dispatching results of different cases.
DayEmission of CO2 (kg)Emission of SO2 (kg)Emission of NOx (kg)Wind Power Accommodation
DM IDM IIDM IDM IIDM IDM IIDM IDM II
11,017,394.291,051,038.373326.103436.862895.662991.4276.06%65.51%
21,040,712.351,042,928.913402.313451.562962.723005.2472.56%67.25%
31,063,664.581,066,625.363477.363504.213027.353043.5677.98%72.36%
41,024,336.731,029,335.863348.793365.202915.412929.7071.46%63.59%
51,036,482.571,084,466.213388.503545.372949.993086.5679.46%73.42%
61,073,234.911,077,280.693508.653521.883054.593066.1184.32%80.44%
71,048,089.141,052,719.623426.453441.582983.022996.2075.35%68.70%
Average1,043,416.371,057,770.723411.173466.672969.823016.9776.74%70.18%
Table 3. Optimized costs of dispatch model I and dispatch model II.
ModelFuel Cost (kUSD)Cost of TES (kUSD)Cost of EES (kUSD)Cost of DR (kUSD)Cost of Wind Curtailment (kUSD)Environmental Cost (kUSD)Total Dispatching Cost (kUSD)
I110.874.0221.0252.141.0246.87235.94
II118.903.9823.9743.071.84-191.76

