1. Introduction
In Smart Grig (SG), Demand Side Management (DSM) with the integration of Information and Communication Technologies (ICTs) is considered as its paramount function. Different electric appliances and control services are scheduled and integrated with DSM. These appliances and services are: shiftable loads, charging and discharging of the electric vehicles, smart devices (i.e., smart meters, Distributed Generators (DGs)), etc. With the development of the massive electricity market, multiple entities are involved on the DSM side: NASDAQ trading organizations of OPower,
Energy, etc. [
1,
2,
3]. In order to optimize the energy management on demand side, these organizations apply existing techniques for the bidirectional interactions and online processing facilities. Multiple small businesses and standalone buildings are also contibuting in the electricity market on DSM in order to engage themselves in the development of the SG applications [
4].
There are two significant aspects which are required to be considered in future DSM based on the above-mentioned scenarios. These aspects are the technical aspect and the economical aspect. The technical aspect considers the huge size data of the appliances which means the number of appliances used in the smart buildings, their power ratings, their On and Off status, and scheduling horizons. It needs to be processed by considering the specific time constraints for maintaining its computational complexity. Computational complexity consists of the resources which are required for executing the consumers’ requests. The time required to respond to the requests is considered as Processing Time (PT) in our scenario and it is maintained by fulfilling the consumers’ comfort preferences. Secondly, the economical aspect focuses on most of the newly developed buildings and businesses which are not participating in the ICT framework in new stages. It becomes complex to maintain its reliability without their participation in this case. Hence, allocating the ICT facilities: processing power, storage capacity and availability of the resources are the critical problems [
5,
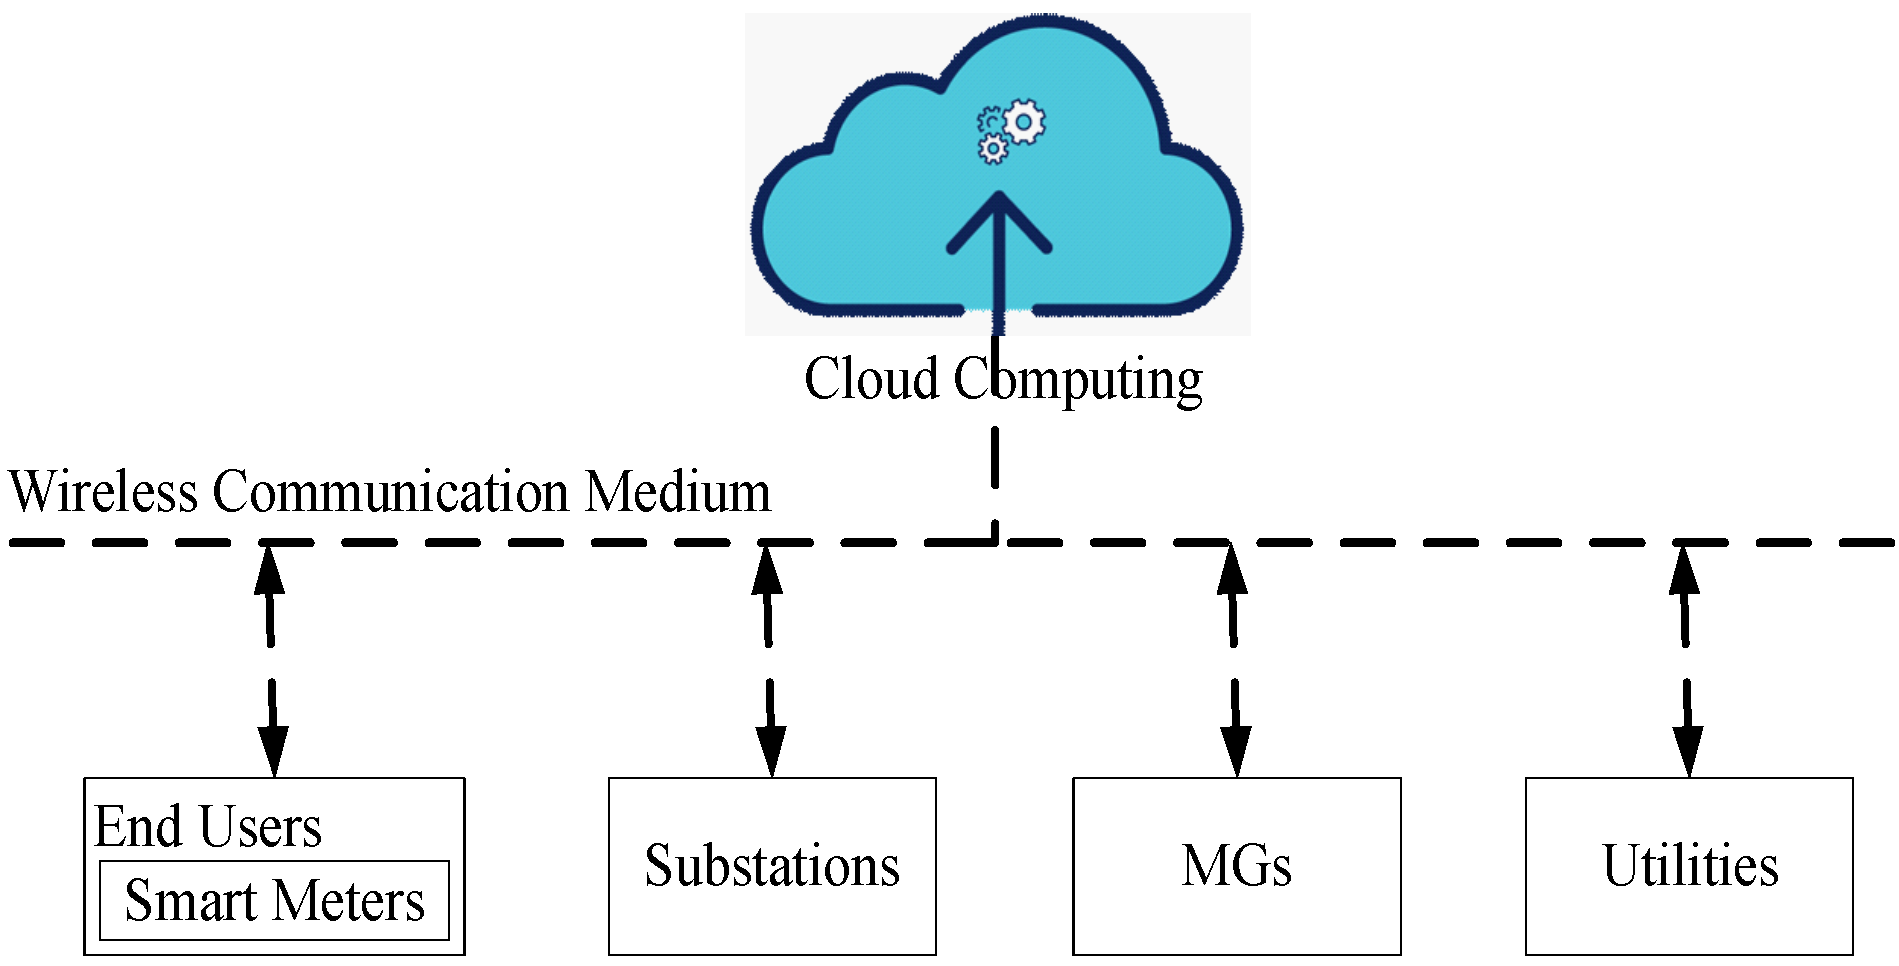
6]. A flow diagram of cloud computing to its entities is shown in
Figure 1.
The management of computation, storage and on-demand resource availability from grid and electricity scheduling for the consumers is handled by cloud computing. Cloud computing resolves both technical and economical aspects of these (computation, storage and on-demand resource availability) problems. It is also the enhanced version of the parallel and grid computing. Fog computing is the specialized model of the cloud computing which is responsible for efficient management of the consumers’ resources on the edge of the network. It upgrades the locality, reliability, security and latency of the consumers’ demands [
7,
8,
9].
1.1. Motivation
Previous studies [
10,
11,
12] have incorporated the cloud services in SG environment. Cloud computing based infrastructure has been presented for the future generation power grid by Luo et al. in [
10]. Authors have considered the charging and discharging schedules of the electric vehicles in a decentralized manner to procure the load shuffling facility [
11]. The scheduling problem is formulated with the help of mixed discrete programming technique. However, they have not incorporated the cloud platforms by organizing the demands of electric vehicles’ customers. Another decentralized algorithm for optimally scheduling the electric vehicles charging has been proposed by Gan et al. [
12] and the proposed algorithm has led to the exploitations in terms of electric vehicles loads for filling the valleys in their load profiles. Fog computing [
13] is integrated as the middle layer between the consumers and cloud environment. It minimizes the latency and improves reliability of the cloud services. All of the aforementioned studies are either based on the cloud or fog based environment. None of the earlier techniques are based on the fog and cloud environment together for the optimal resource allocation. Although, cloud provides on-demand availability of the resources; however, it degrades the latency and effects Response Time (RT) for the consumers which creates frustrations. Fog computing resolves these issues very efficiently. We have proposed the concept of C2F2C based environment in order to minimize the latency and efficient scheduling of the resources in the residential buildings. This study also considers the optimal RT, cost of data transfer, MG and Virtual Machines (VMs), consumers’ requests time and PT, which is provided by fog computing.
1.2. Contributions
In this work (an extension of [
14]), we have proposed and implemented the Consumer to Fog to Cloud (C2F2C) based framework for efficient resource management in residential buildings. Our main contributions are described as below:
The C2F2C based framework is presented for efficient management of the consumers’ demands in the residential buildings.
Six regions of the world are considered for optimal resource allocation of residential users using the fog layer as the middle layer. Fog layer stores the consumers’ SM information on each local region’s fog for the consumers.
MGs are integrated in order to fulfill the consumers’ energy requirements while minimizing the total cost for the end users.
RT, Requests Per Hour (RPH), PT and cost are optimized using the proposed: Shortest Job First (SJF) algorithm. This is also compared with the previous two algorithms: Round Robin (RR) and Equally Spread Current Execution (ESCE). From simulation results, it has been observed that SJF outperformed the RR and ESCE in terms of the aforementioned parameters.
Simulations are conducted for two scenarios to validate the effectiveness of the proposed framework: (1) resource allocation using MGs and (2) resource allocation using MGs, electric vehicles and power storage devices.
The remainder of the manuscript is summarized as follows. In
Section 2, literature review is discussed along with the existing limitations.
Section 3 describes the proposed system model and simulation results are elaborated in
Section 4. Finally, the conclusion and future challenges are described in
Section 5.
2. Literature Review
In order to subsist the intensive demand of the electricity, different methodologies have been studied from existing work. These methodologies are categorized based on their proposed architectures: (1) methodologies for cloud based architecture and (2) methodologies for fog based architecture. So, the techniques for energy management in SG using cloud computing have been discussed first then the techniques for energy management in SG using fog computing have been discussed.
2.1. Methodologies Regarding Cloud Based Architecture
A novel architecture for electric vehicles’ charging and discharging is presented using public supply stations [
15]. For electric vehicles’ charging and discharging, two priority assignment algorithms: (1) random priority attribution and (b) calender priority attribution are developed in the cloud environment. These algorithms are used for monitoring the waiting time of electric vehicles in order to maintain grid stability in peak hours by setting the demand supply graph as a constraint. Smart phone has been considered as a component of the cyberphysical system for dynamic voltage scaling by minimizing the frequency of smart phone which leads to energy minimization [
16]. Authors also develop an energy aware dynamic task scheduling algorithm for minimizing the aggregated energy requirements of the running applications by considering two constraints: (1) time and (2) probability. This work has been restricted to the energy minimization in the smart phone system. It also lacks its applicability in SG energy management domain.
In [
17], one new communication model is proposed which is composed from two models: the cloud based Demand Response (DR) model and distributed DR model for optimizing the communication delay. This model suffers from huge cost for the peak demand scenarios. Further, a cost computation model is also proposed for demand side consumers by the optimal use of the cloud resources. Moreover, this model provides an opportunity for the consumers regarding optimized resource availability which helps in cost minimization. They have designed the modified priority list algorithm which is used for optimal distribution of the cloud resources (instances): on-demand instances and reserved instances. It minimizes the total operational cost of the system.
The idea of nanogrids is presented in sustainable buildings for multi-tenant cloud environment in [
18]. A game theory technique using the collaboration for power management in SG cyberphysical system is proposed in [
19], where payoff function is formulated by investigating each player’s information (i.e., transmission and service delay information) through conditional entropy. Moreover, the dynamic workflow management is designed for executing the tasks via virtual cloud platform. Various VMs are utilized in a coalition for running the jobs in an intelligent way for this scenario. In [
20], the energy hubs are manoeuvred for storage of the consumers’ data in the cloud environment for efficient DSM. Stochastic dynamic programming is used to manage the load in real time environment for reducing the expenses by incorporating the consumers’ participation. This system is particularly designed for cloud environment and our system incorporates the fog in order to minimize the latency, PT and cost.
Some reviews about cloud computing technologies are presented in [
13] along with their challenges. Some limitations of the existing power systems are also described in this work by the cloud computing technologies, for instance; the infrastructure of the power system is weak and there can be blackouts at any time due to uncertain catastrophes. For maintaining the resiliency, cloud computing facilitates the consumers by providing computing, storage and security features.
2.2. Methodologies Regarding Fog Based Architecture
In [
21], authors propose a cloud based DSM system using MGs which manages energy for the consumers from multiple regions in order to minimize the utility and consumers’ cost. This technique also reduces the time and efforts by incorporating the modularity feature for developing smart cities. Bi-level optimization algorithm using linear cost function is also developed and applied in this scheme. Authors in [
22] propose energy management scheme for electricity and natural gas network using integrated DSM. This scheme differentiates the electricity consumption techniques because they consider the consumption regarding each user by considering multiple users’ interactions. Nash Equilibrium (NE) is used in this technique for measuring the interactions of the players. NE is applied for electricity cost and peak load reduction.
Authors present a new SG architecture for electric vehicles’ scheduling in buildings (integrated with MGs) which enable a central SG controller for cloud Data Center (DC) environment [
23]. This system helps the SG users to optimize the load requests in an efficient fashion. It enhances the stability of grid during the high demand intervals. Cloud computing helps the consumers by providing: computing, storage and networking capacities. In addition, there are also some limitations of cloud, i.e., latency, security and downtime problems. In order to ameliorate the latency, reliability, and resiliency of the services, one new strategy is presented in [
24], in which fog platform is utilized by considering the energy management as a service. This strategy also discusses two energy management prototypes: home energy management prototype and MG energy management prototype for electricity bill and delay minimization. Security for the customers’ private data is enhanced through encryption, which improves the flexibility and reliability by augmenting the fog computing principles [
25,
26]. It is also responsible for providing the locality of consumers’ appliances.
Afterwards, a new approach regarding electricity cost reduction problem presents the internet payload requests and SG dynamic electricity pricing mechanism [
27]. This approach also discusses the predictive cost control for the smart charging on both sides: (1) battery energy for the servers and (2) electricity from the power grid. In order to mitigate the overall cost of the system, batteries are charged during the low price rate hours and are discharged during the high price rate hours. In [
28], authors use big data analytics for balancing the energy of the residential, industrial and commercial buildings. Multiple big data anaytics and decision making functions are used for efficiently managing the energy in these buildings. This work also considers the comfort preferences of the consumers using the control configuration and planning processes. This technique is designed for the buildings of smart cities.
The aforementioned schemes are described for the load scheduling of appliances in the buildings. However, integrated cloud and fog based scheme is not described for optimized resource allocation in any of the regions of the world. The proposed work describes the energy management in the residential buildings using C2F2C framework.
3. Proposed System
The C2F2C framework is proposed for intelligently managing the resources regarding the electricity demands of the residential users. In the subsequent subsections, assumptions of the system model, problem formulation and proposed C2F2C framework are described.
3.1. Assumptions
In the proposed work, the following six assumptions have been taken into account.
The world is categorized into six regions on the basis of six continents.
In every region, there is a cluster of buildings considered for the optimal resource allocation.
Integrated cloud and fog environment has been used for optimizing the consumers’ demands.
Residential users are facilitated with the required services (electric power supply) despite the limitations of the cloud. Fogs and MGs are used for responding to the consumers’ requests (i.e., by omitting the latency issues with the integration of fog layer).
Every region has one fog server for efficient resource management.
For high computation, storage and resource management, VMs are assigned with the DC resources.
3.2. Problem Formulation
We have considered the following components for resource allocation in the residential buildings all over the world which are categorized as: set of regions, buildings, VMs, MGs and DCs. Let
indicate the set of VMs and each of them processes the tasks
T, so the sets of the
and tasks
T are mathematically represented by Equations (
1) and (
2):
here, the set of the VMs
and tasks
are between 1 to
n. In this environment, all VMs are working in parallel with each other and have the same capacity. The tasks are executed in a non-preemptive fashion on each VM. Through hypervisor, every VM is monitored and it is assigned to certain tasks, if they are required to be processed. The total tasks assigned to each VM are dependent on the number of consumers’ requests and their PT, RPH and RT. Each of the aforementioned parameters are formulated using the linear programming [
29]. Equation (
5) is computed for the PT using the Equations (
3) and (
4). Equation (
3) represents the tasks and VMs assignment states.
where, “a” indicates the set of the VMs and “b” denotes the set of tasks.
is used to indicate the assignment of VMs and tasks to each VM. The RPH is evaluated by Equation (
4).
indicates the number of VMs assigned to the tasks requested by each consumer in the C2F2C system. After finalizing the RPH and the tasks assignment to each VM in the system, its total PT (
) can be computed by Equation (
5);
represents the PT of the VMs assigned to each task and
indicates the RPH of every VM dedicated to the assigned task. The RT is computed with the help of Equation (
6) as given below:
Here,
is used for denoting the total RT of the VMs in the proposed system and
is the completion time of the tasks. “Makesspan” is a term which describes the aggregated running time of the tasks. The cost of the system is computed via aggregating the VMs cost, MGs cost and data transfer cost. VM cost is computed on the basis of the Multiple Instructions Per Second (MIPS) and the request size, whereas the data transfer cost is computed by considering the total data and the assigned bandwidth to that data. In addition, MG cost is computed based on the number of the installed MGs. So, the total cost of the system is computed by Equation (
7):
Here, the variables:
,
,
and
used for cost in Equation (
7) represent the total cost, data transfer cost, VM cost and MG cost, respectively.
3.3. Proposed C2F2C Framework
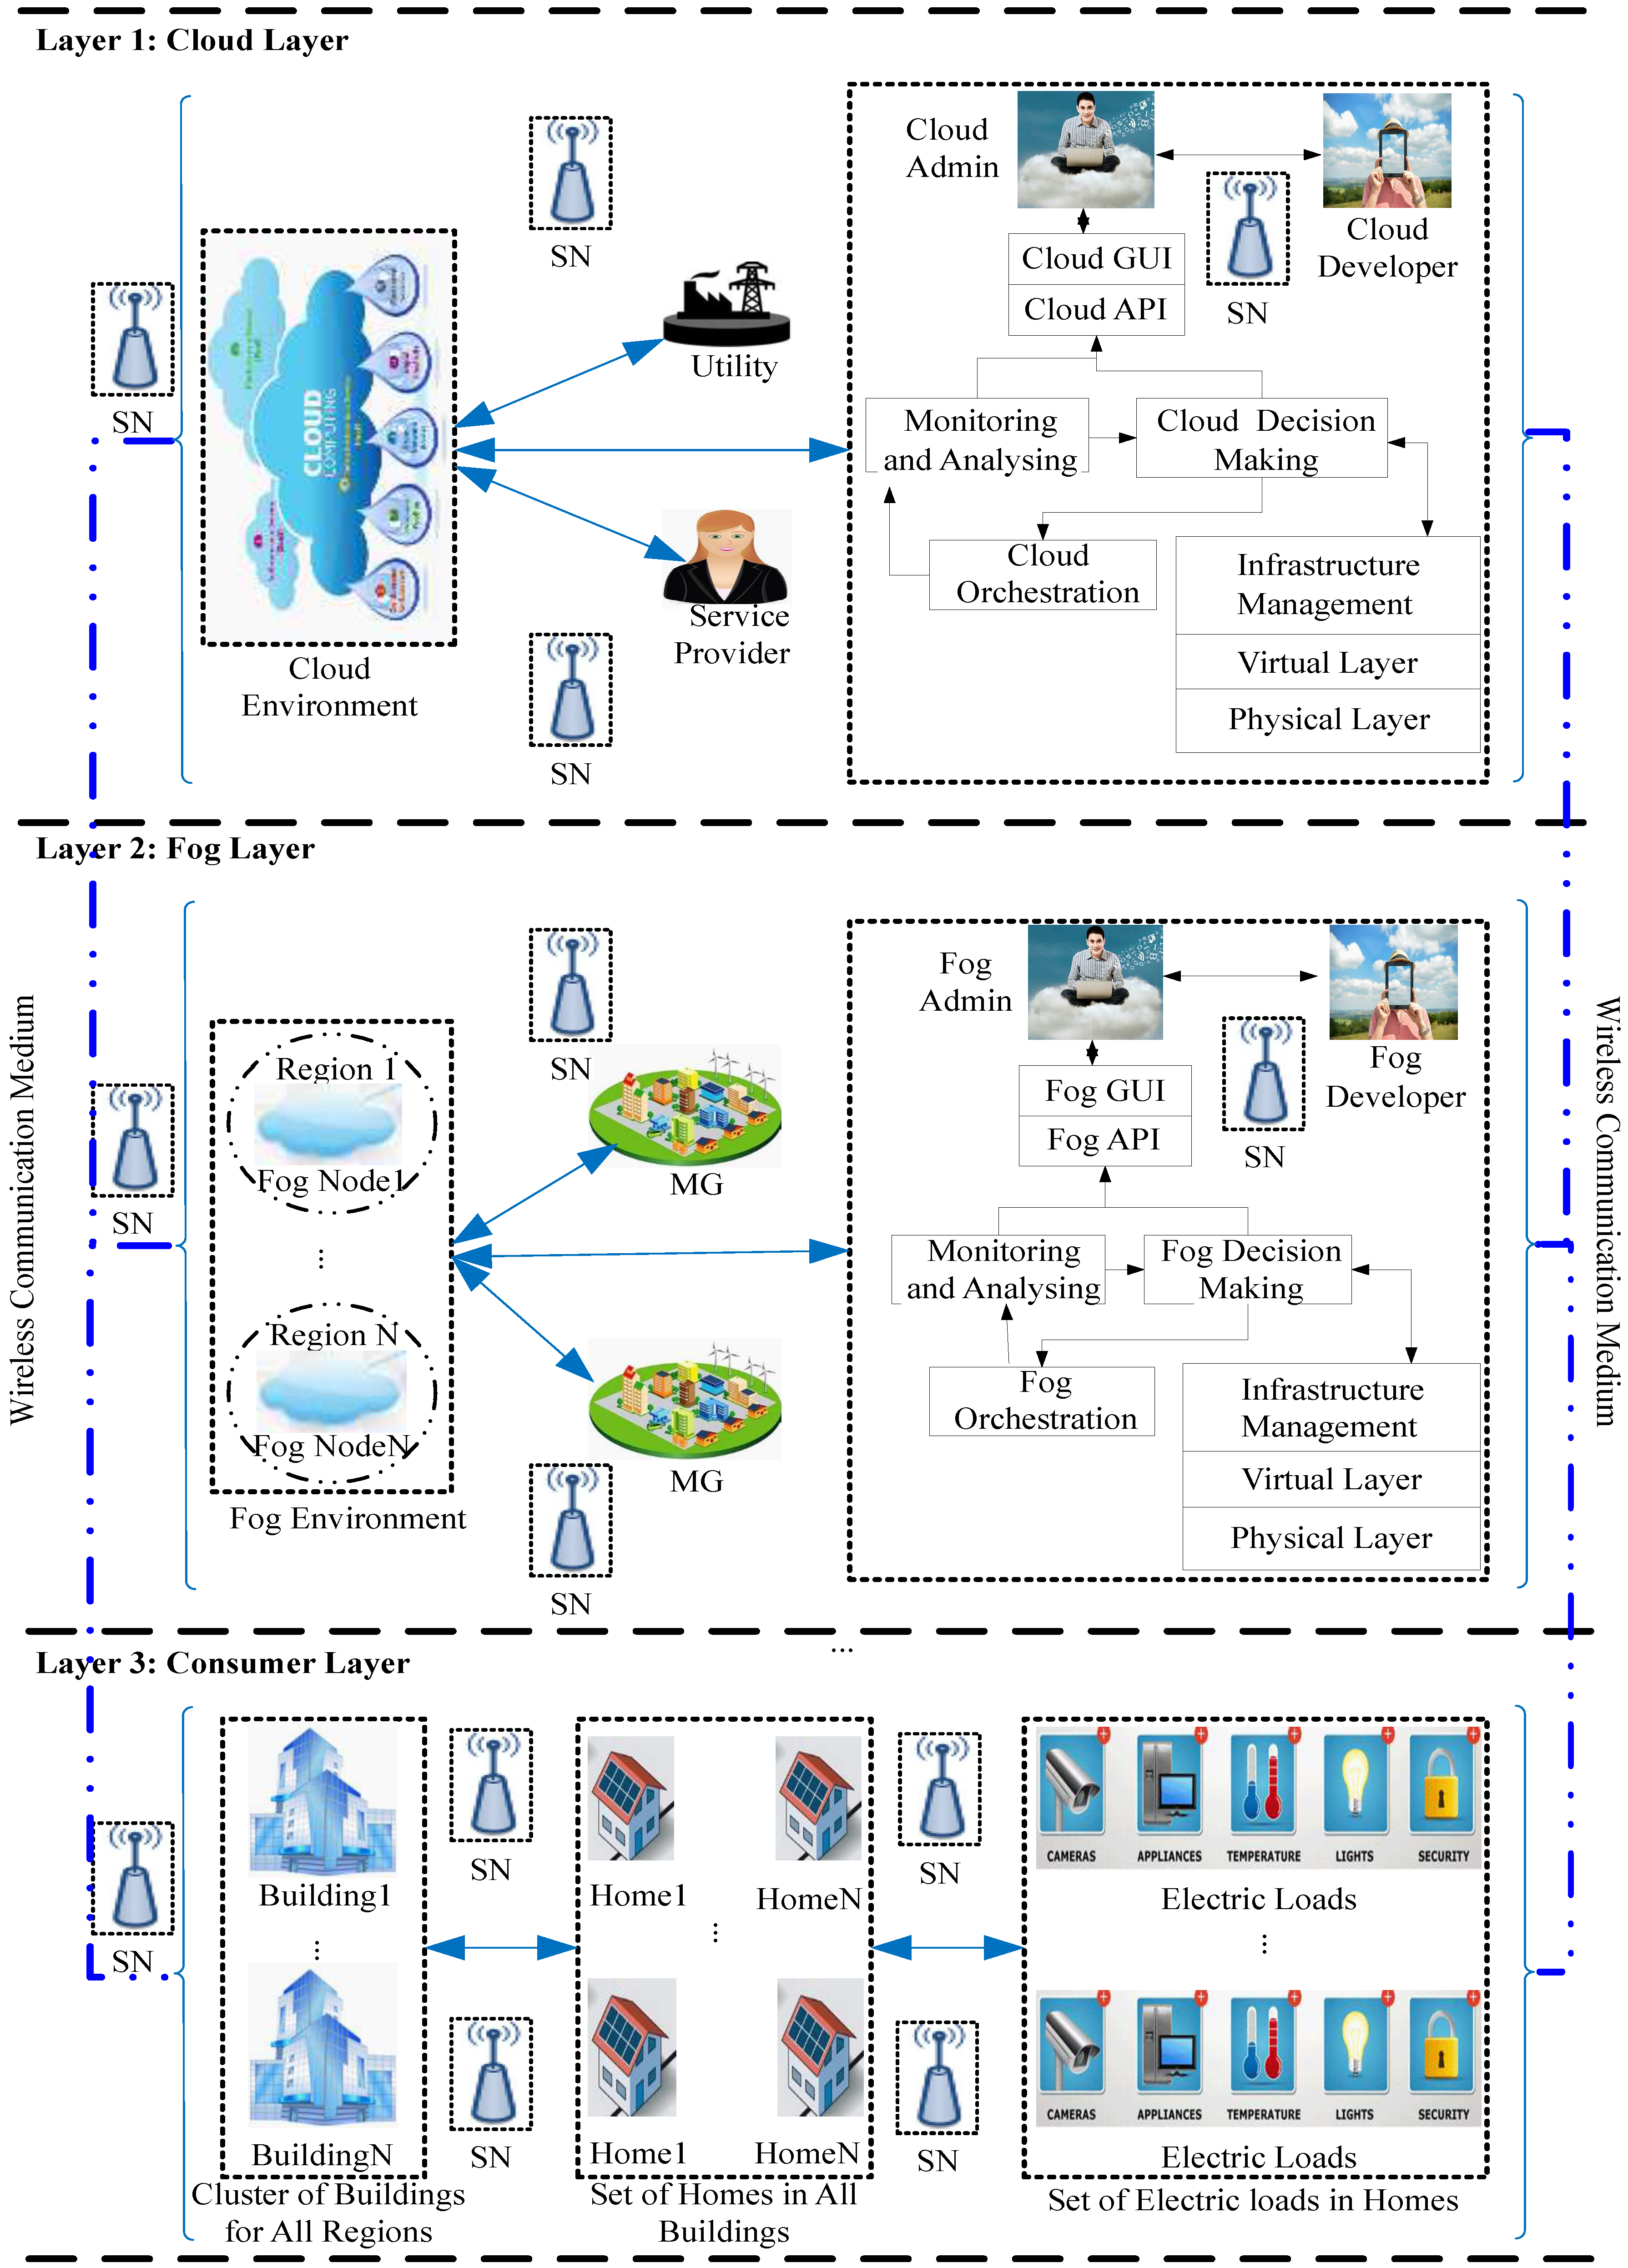
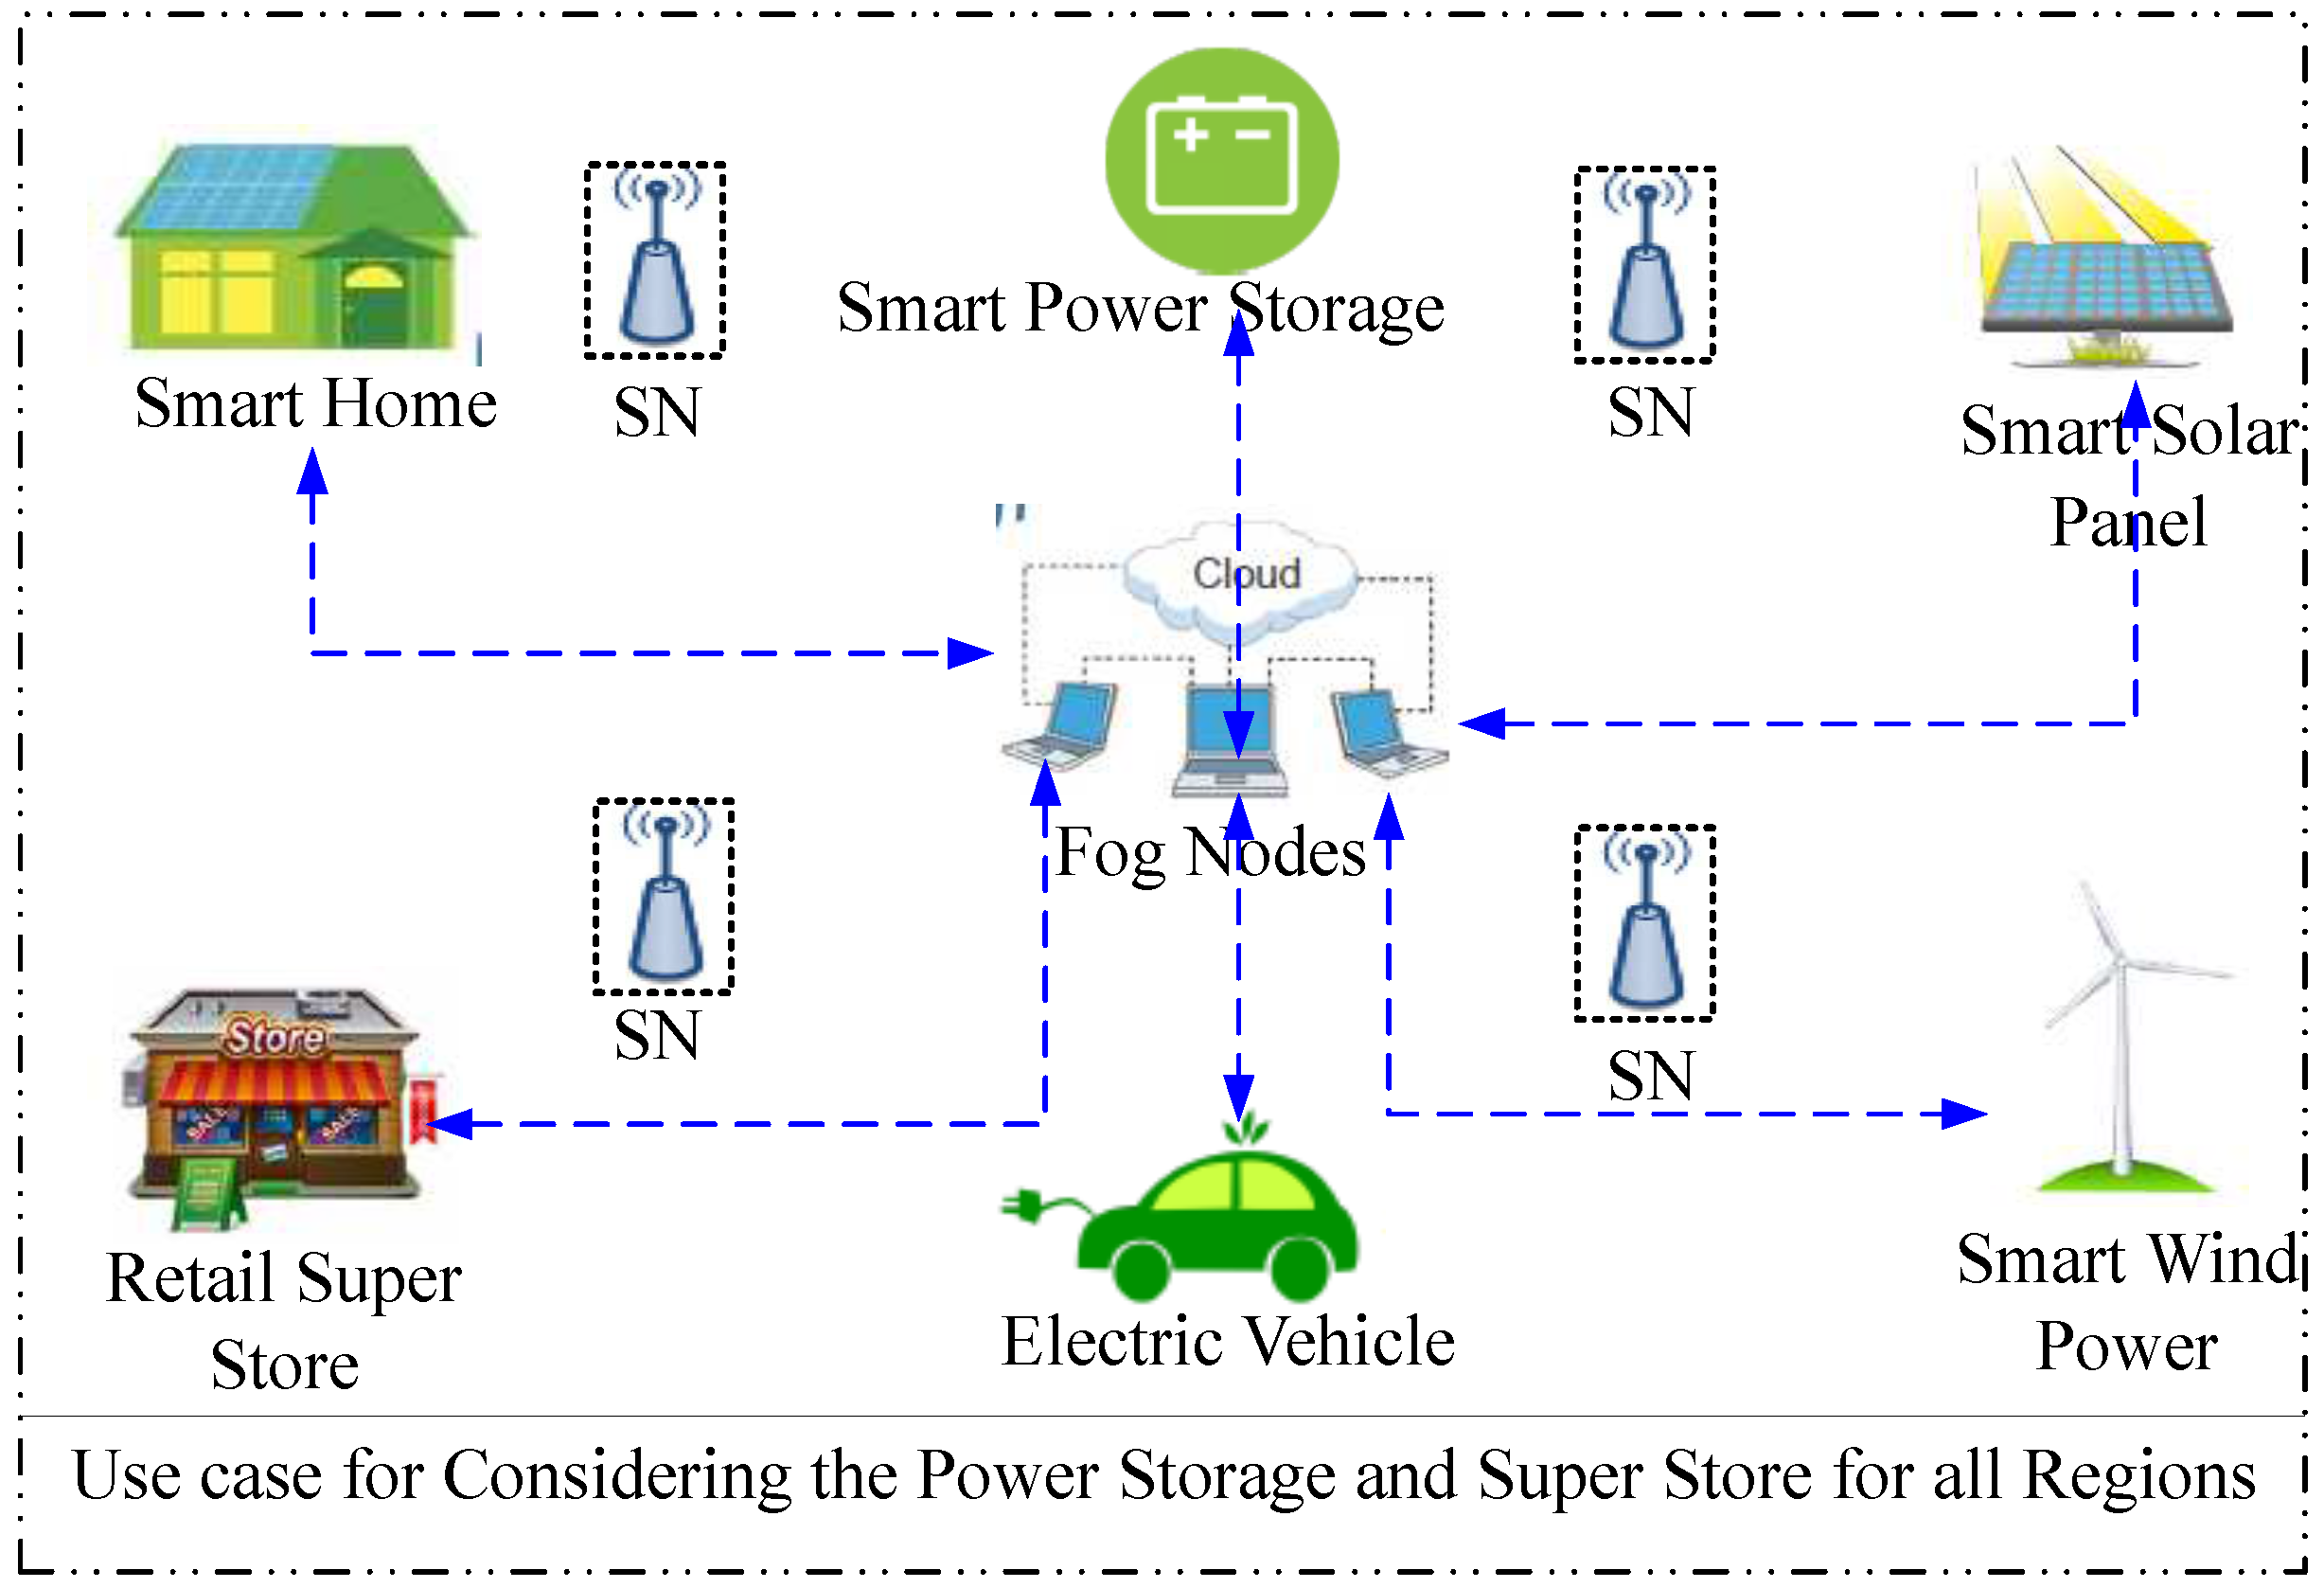
In this paper, a C2F2C framework is proposed for resource allocation in residential areas as shown in
Figure 2. The proposed framework is based on the following resources: electricity and its requested entertaining facilities like MG, cloud and fog for smart buildings. Cloud and fog also have some resources such as computation, storage and networking facilities (between the end devices to the service providers). These resources are responsible for managing the demands of consumers in six regions of the world. The whole framework is comprised of a cloud, six fogs within the regions, set of buildings, set of homes, and their load requests. These six regions are considered for the residential energy consumption and management. Each region has one fog for fulfilling its demands. When clusters of the buildings send load requests to the fog server for completing the load demands, this framework uses MGs on first priority to fulfill the load demands of the consumers, otherwise, it communicates to the cloud for exchanging services with the utilities. There are two MGs which are deployed in each region as shown in
Figure 2. MGs are based on distributed generation, loads, storage devices, etc. and integrated with the residential buildings. In each region, MGs are installed by the users and managed by the fogs. The proposed framework acts as the automation of the energy management services and requests through fog environment.
The proposed framework is comprised of three layers: consumers’ layer, fog layer and the cloud layer. Cloud and fog layers are used for orchestrating and controlling the cloud and fog resources in consideration of the consumers’ requests. Consumers utilize cloud and fog facilities for fulfilling their daily load requirements. Both cloud and fog layers show the cloud and fog admin and developers for maintaining their internal resources as shown in
Figure 2. They maintain their services effectively according to the consumers’ demands. Data is transferred to the cloud when fog’s resources are completely utilized because the fog has limited resources. Fog only communicates to the cloud when all of its resources are utilized and there is an excess demand from the consumers of any region. When requests are sent to the cloud, it does not resolve any of the users’ cost and latency issues; however, for resolving the limited resources unavailability, cloud is utilized. Storage resources are not considered in this work. The third layer depicts the set of buildings, number of homes and their load demands in each region.
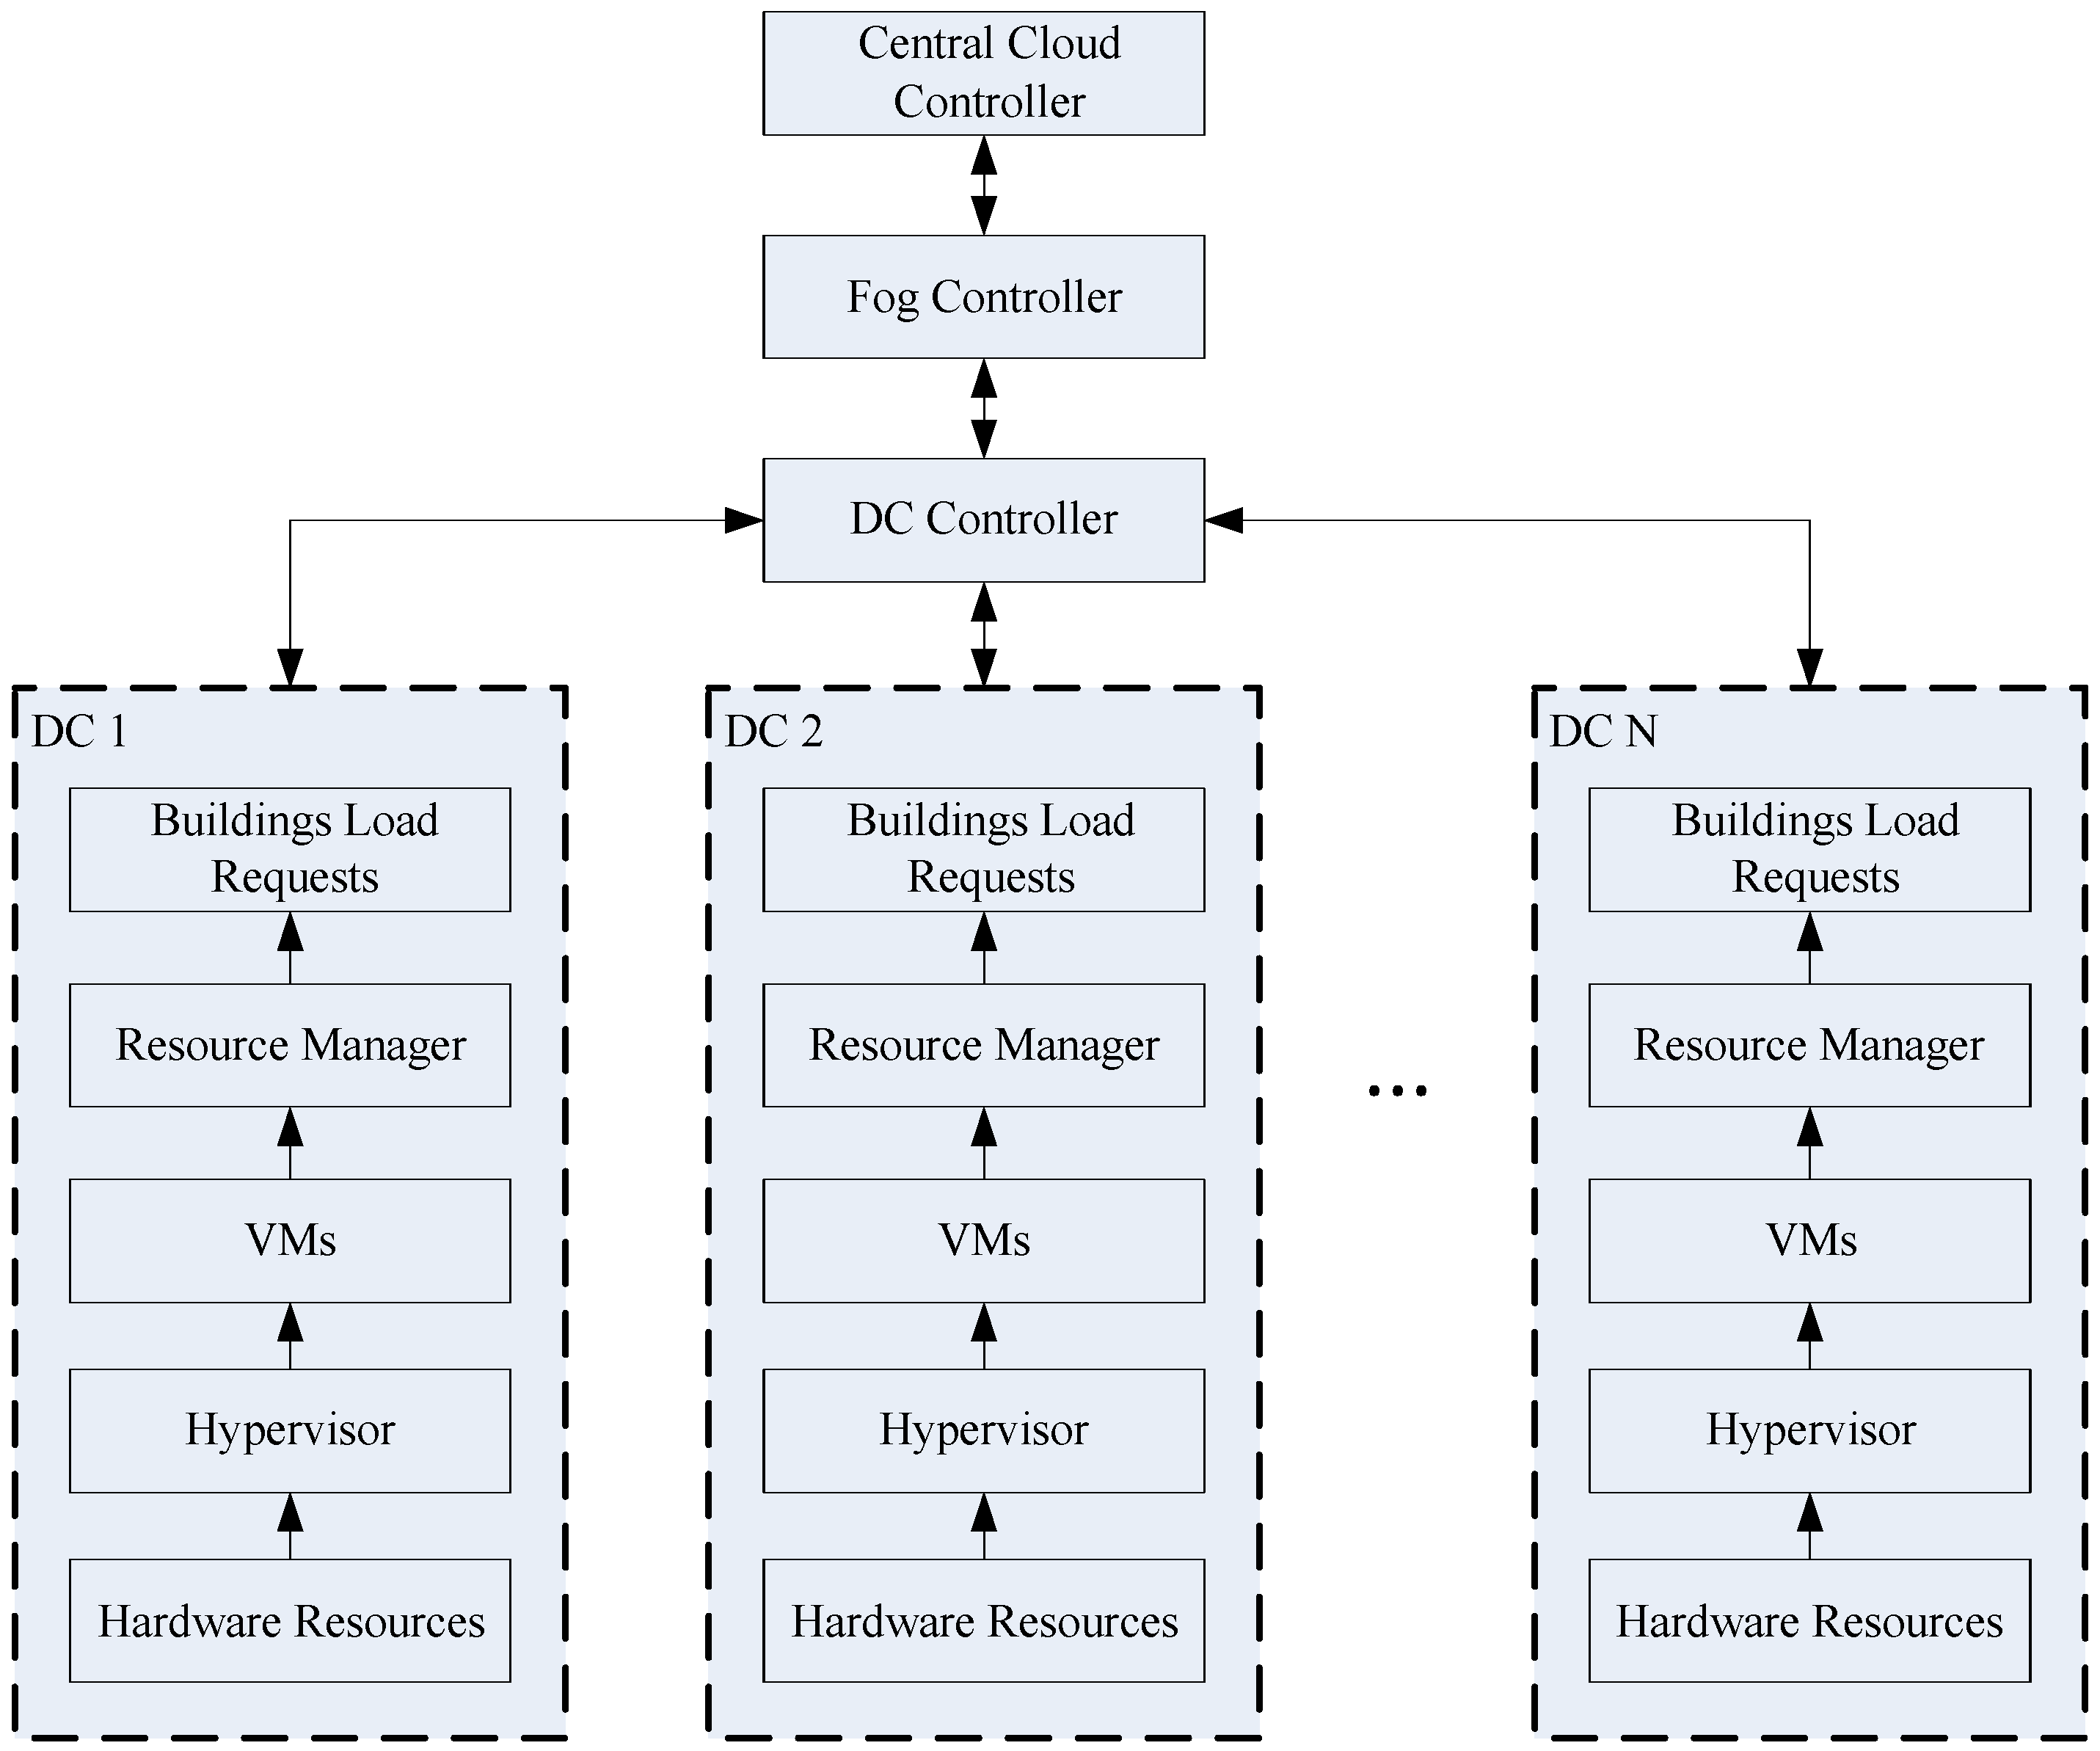
The communication medium is used as the wi-fi for maintaining the communication among all C2C2F layers and their respective components. When any home in the buildings sends requests, it is first received at the fog server, then the availability of resource is checked. After verifying the availability of the requested resource, it is processed through VMs and is also conveyed to the consumers. Hypervisor is used to monitor the task execution states of VMs at the cloud end as shown in
Figure 3. Each fog is responsible for its own region’s services. The region may be any continent which lies in the communication range of that fog. The following kinds of the communications are used in this scenario: fog to cloud, consumer to fog, appliance to appliance and vise versa. Sensors Nodes (SNs) are used in each layer for sensing and sharing the information among components.
There are three types of consumers who are considered in this framework: traditional consumers, consumers with the Home Energy Management System (HEMS) and the consumers who are integrated with the local generation and HEMS. Traditional consumers do not have HEMS or any local generation whereas the consumers that have HEMS and the on-demand cloud services are referred to as smart consumers. In addition, the consumers having both HEMS and the local generation are considered as prosumers and the smart users in the buildings. Traditional consumers do not participate in the energy management programs.
Figure 3 shows the resource management in the cloud and fog DCs where VMs are used as the resource manager and hypervisor is allocated to monitor the VMs according to their existing status. DCs are considered variable in this work. The required hardware resources for each DC are based on fog specification which are elaborated in
Table 1. Two scenarios are used for the resource optimization using this framework. Each scenario is further comprised of two scenarios. One scenario considers the 25 VMs for resource allocation with single DC whereas the second scenario considers the 50 VMs with two DCs for the optimization of the resources in the residential buildings. The extended scenarios are elaborated in the subsequent subsections.
3.4. Twenty Five VMs with Single DC
In this scenario, 25 VMs are considered with the single DC in order to fulfill the load demands of the consumers from every region of the world. Load demands are assigned to the VMs which are responsible for the management of these demands and services. Each VM is monitored by the hypervisor (as discussed earlier) which decides that either it has finished its task or it is in idle state. Every region’s load demands are evaluated using this scenario for validating the proposed framework. Cloud and fog communicate with each other in order to manage the resources whereas fog and consumers interact for assigning the facilities to the requests of consumers. Consumers send requests to each fog in their region from the buildings. Residential buildings in each cluster vary between 80 and 150. The input parameters and their values for the scenario 1 and 2 are given in
Table 1 [
30].
3.5. Fifty VMs with Two DCs
Scenario two is also running with the same simulation setup as in scenario 1. The set of the DCs and VMs are varied for the maximum resource utilization. This scenario integrates the 50 VMs with two DCs. MGs are considered to be the same as the above scenario and communication mechanism of the entities is also similar to scenario 1: consumer to fog, fog to cloud, appliance to appliance and vise versa. In addition, scenario 2 also comprises on the power storage devices and on electric vehicles as described in detail in the simulation section.
Three algorithms have been used for resource allocation in the C2F2C environment: ESCE, RR and SJF algorithms. These algorithms are applied for assignments of the VMs, MGs and other resources in the DCs for the consumers in any region as described in the Algorithms 1–3. When requests are received from the residential buildings, ESCE algorithm first checks the resources and assigns them to the available VMs. RR receives all the requests in an organized (cyclic) fashion and entertains them accordingly. SJF receives the requests, calculates their size for each cluster of the buildings and allocates resources to them.
3.6. The RR Algorithm
RR is used as the demand scheduling algorithm for cloud environment. It is adapted in this work on the basis of specific time schedules (i.e., time quantum) [
30]. The scheduler develops the details of the VMs in an assignment table. In addition, it tries to allocate the jobs equally for the VMs on the DCs; however, it does not confirm completion of their time schedules. Firstly, VM is initiated with the ID of the current VM variable and the requested job is mapped with that VM variable. In some cases, if the IDs of first and last VM resemble then it redefines the current VM ID. It is pre-emptive in nature and if any task has not been completed in the defined time horizon, it reinitiates that task in the next cycle.
| Algorithm 1: RR. |
 |
3.7. The ESCE Algorithm
The ESCE algorithm applies spread spectrum technique and works with the lot of active tasks on the VMs at any time interval [
30]. Using this algorithm, the scheduler records the VMs’ assignment table while maintaining lists of VM IDs with active jobs on any VM. At each time interval, when the jobs are executed, the VM table is modified. When ESCE starts, active job count is zero; however, on the occurrence of every job, the scheduler determines the VM having the minimum job count. When multiple jobs with minimum count are allocated to the VMs then the first VM is selcted for processing the jobs. Multiple job queues are maintained according to the VMs status. It first allocates the available VMs then it tries to evenly distribute the tasks on them.
| Algorithm 2: ESCE. |
 |
3.8. The SJF Algorithm
It executes the jobs by considering their shortest size as the priority and that priority is controlled by analyzing consumers’ requests’ sizes [
31]. It assigns the tasks to the VMs based on their regions, fogs and shortest size. This algorithm is preferred over other algorithms because it has minimum latency. The consumers bear less delay and their comfort standards do not compromise more. The requests having the minimum PT or sizes are served first and then VMs are assigned to them respectively. The scheduler allocates the jobs to various VMs and SJF schedules the jobs by allotting the minimum completion time. It also provides higher efficiency and lower turnaround time. In this way, it enhances the system’s performance.
| Algorithm 3: SJF. |
 |
4. Simulation Results
In this section, six regions are considered for conducting the simulations of the proposed system. Each region is comprised of a cluster of buildings varying between 50 to 150 and every building has 80 to 100 homes in it. The number of buildings and homes are specified as random for validating the system performance. Simulations are performed for 24 h in a complete day by considering the performance parameters: RT, PT, RPH and cost (i.e., cost of VM, total number of MG installed and total data transfer). These parameters are computed through the Equations (
1)–(
7). The information about regions is described in
Table 2.
For performing the simulations, optimized RT resource allocation policy is used whereas the load balancing algorithms are used as RR, ESCE and our proposed algorithm SJF. Our proposed algorithm gives the minimum latency as compared to the other two algorithms. It helps in maintaining consumers’ comfort preferences. As there exists randomness for multiple epochs of these algorithms, that is why, we have taken the average of 10 times. The simulations of the proposed work are based on the following scenarios.
4.1. Scenario 1: Resource Allocation Using MGs
Scenario 1 is comprised of the MGs without any storage resources (i.e., batteries) whereas scenario 2 is comprised of storage resources along with the MGs. Each scenario is further incorporating the two sub-scenarios: 25 VMs with single DC and 50 VMs with two DCs. Now, the RT of all algorithms is computed first then all other performance metrices are calculated later.
4.1.1. Scenario 1(1): 25 VMs for Single DC
In scenario
1(1), 25 VMs with one DC are considered for intelligent resource utilization. Among the six clusters, the RT of all fogs is optimized using the MGs installed in the regions. It is observed that during peak hours, users have higher demands as compared to low peak hours. The details of peak and off peak hours regarding each region are taken from [
30]. Since the fog accomodates efficiency in latency while communicating to the cloud environment, this framework gives a reliable solution in the energy management and resource allocation as displayed in
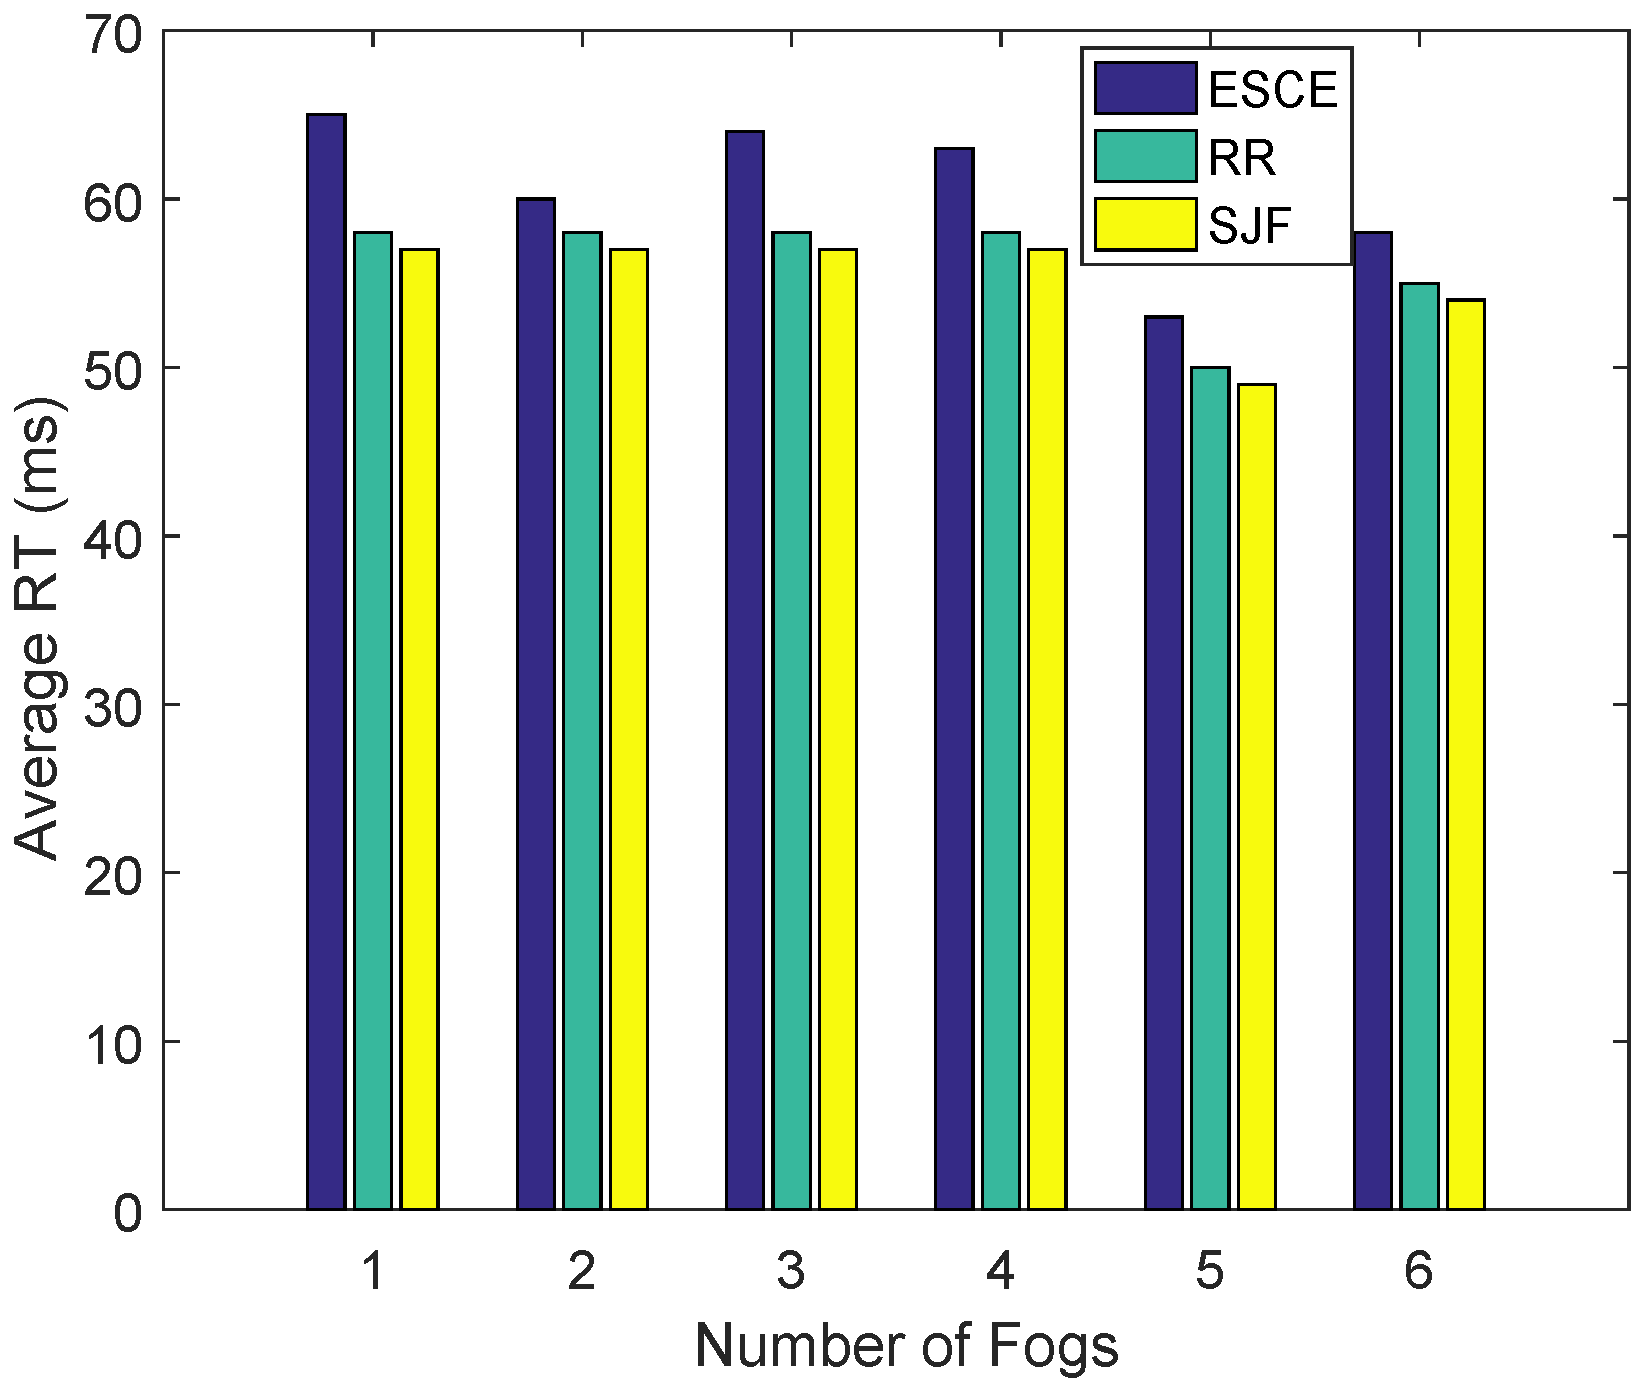
Figure 2. The RT of the SJF algorithm is more efficient than the RR and ESCE. SJF processes the requests with the minimum completion time and entertains the other requests which are having the largest PT. Further, RR entertains all the cloudlets in a cyclic order based on their request time. In addition, ESCE checks the free VMs and equally distributes all requests to them. Two MGs are installed in each region to fulfill the demands of consumers. The RT obtained by the ESCE, RR and SJF algorithms throughout the simulations is: 65 ms, 58 ms and 57 ms for fog 1; 60 ms, 58 ms and 57 ms for fog 2; 64 ms, 58 ms and 57 ms for fog 3; 63 ms, 58 ms and 57 ms for fog 4; 53 ms, 50 ms and 49 ms for fog 5; and 58 ms, 55 ms and 54 ms for fog 6. The RT is totally based on the number of the requests for each hour. So, the requests are based on the population of all clusters as shown in
Table 2. For fog 1, SJF is 13% more efficient than the ESCE; whereas it is 2% more efficient than RR. For fog 2, it is 5% and 2% more intelligent than the previous two algorithms. SJF outperforms ESCE and RR up to 11% and 2% for fog 3. In fog 4, SJF beats the previous algorithms: ESCE and RR up to 10% and 2%. For fog 5, SJF obtains the efficient RT of 8% and 2% as compared to ESCE and RR. SJF is 7% and 2% more efficient than ESCE and RR algorithm for fog 6. It is observed that SJF can handle more requests easily and outperforms the previous algorithms as shown in
Figure 4 because the regions: 0, 2 and 3 have the maximum population and it shows better results for them as compared to the previous algorithms.
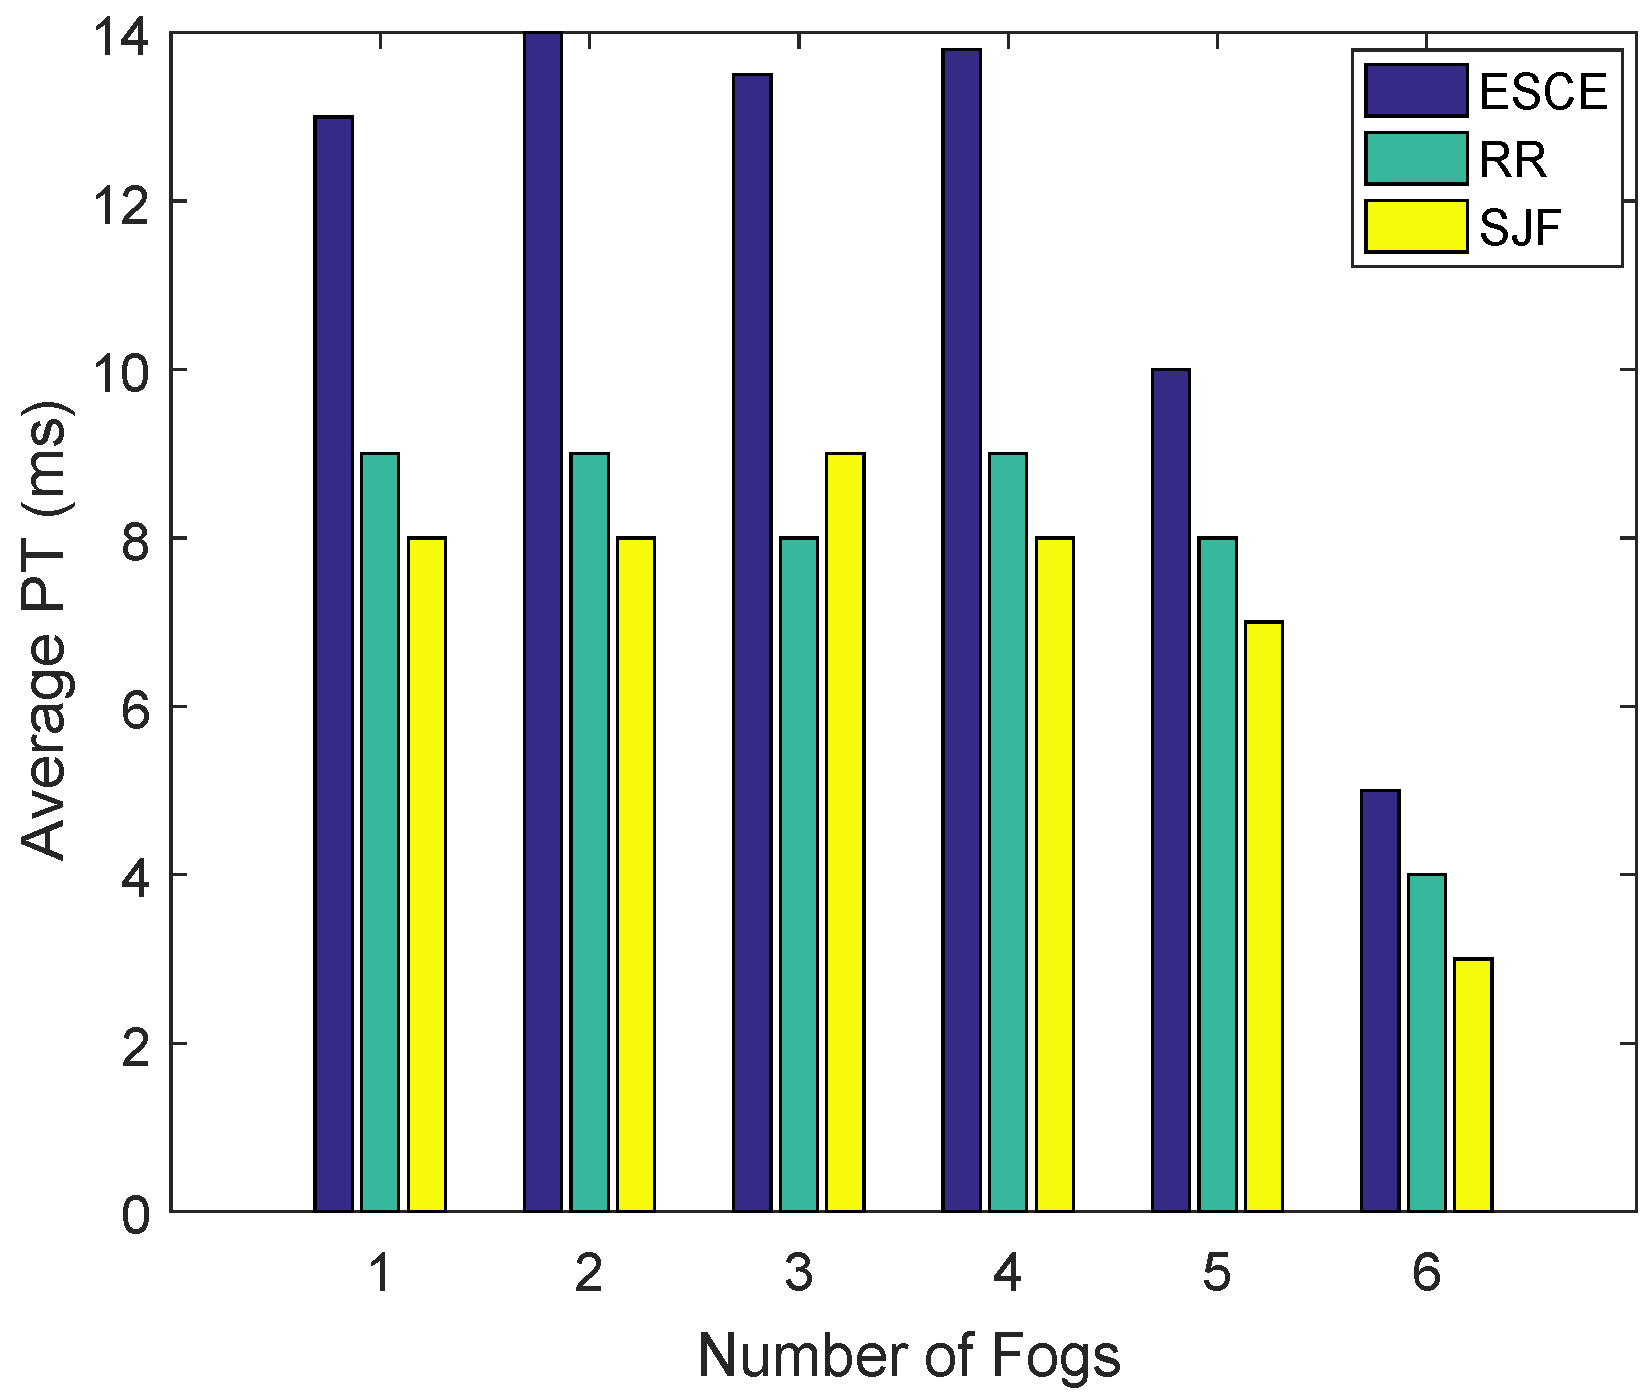
The average PT of each fog according to the users’ requests is displayed in
Figure 5 for the whole day using the aforementioned algorithms. The average PT of the fog 1 is 13 ms, 9 ms and 8 ms using the ESCE, RR and SJF algorithms. Fog 2 also has the effective PTs which are optimized by these algorithms as 14 ms, 9 ms and 8 ms using ESCE, RR and SJF. SJF outperforms the other algorithms for computing the requests of region 3 consumers in 13.5 ms, 8 ms and 9 ms using the above-mentioned algorithms. ESCE, RR and SJF obtain the optimized PT from the fog 4 up to 13.8 ms, 9 ms and 8 ms. Fog 5 obtains the efficient PT using the SJF as compared to the ESCE and RR upto 7 ms, 10 ms and 8 ms. All algorithms provide 5 ms, 4 ms and 3 ms optimized PT for Fog 6. From these results, it can be concluded that SJF gives more optimized results for all of the fogs in the respective regions. All regions have sufficient population and the proposed algorithm gives efficient results as compared to the previous algorithms. For example: it outperforms the ESCE and RR up to 39% and 2% for fog 1; 37% and 2% for fog 2; 41% and 2% for fog 3; 43% and 2% for fog 4; 93% and 13% for fog 5; and 40% and 25% for fog 6.
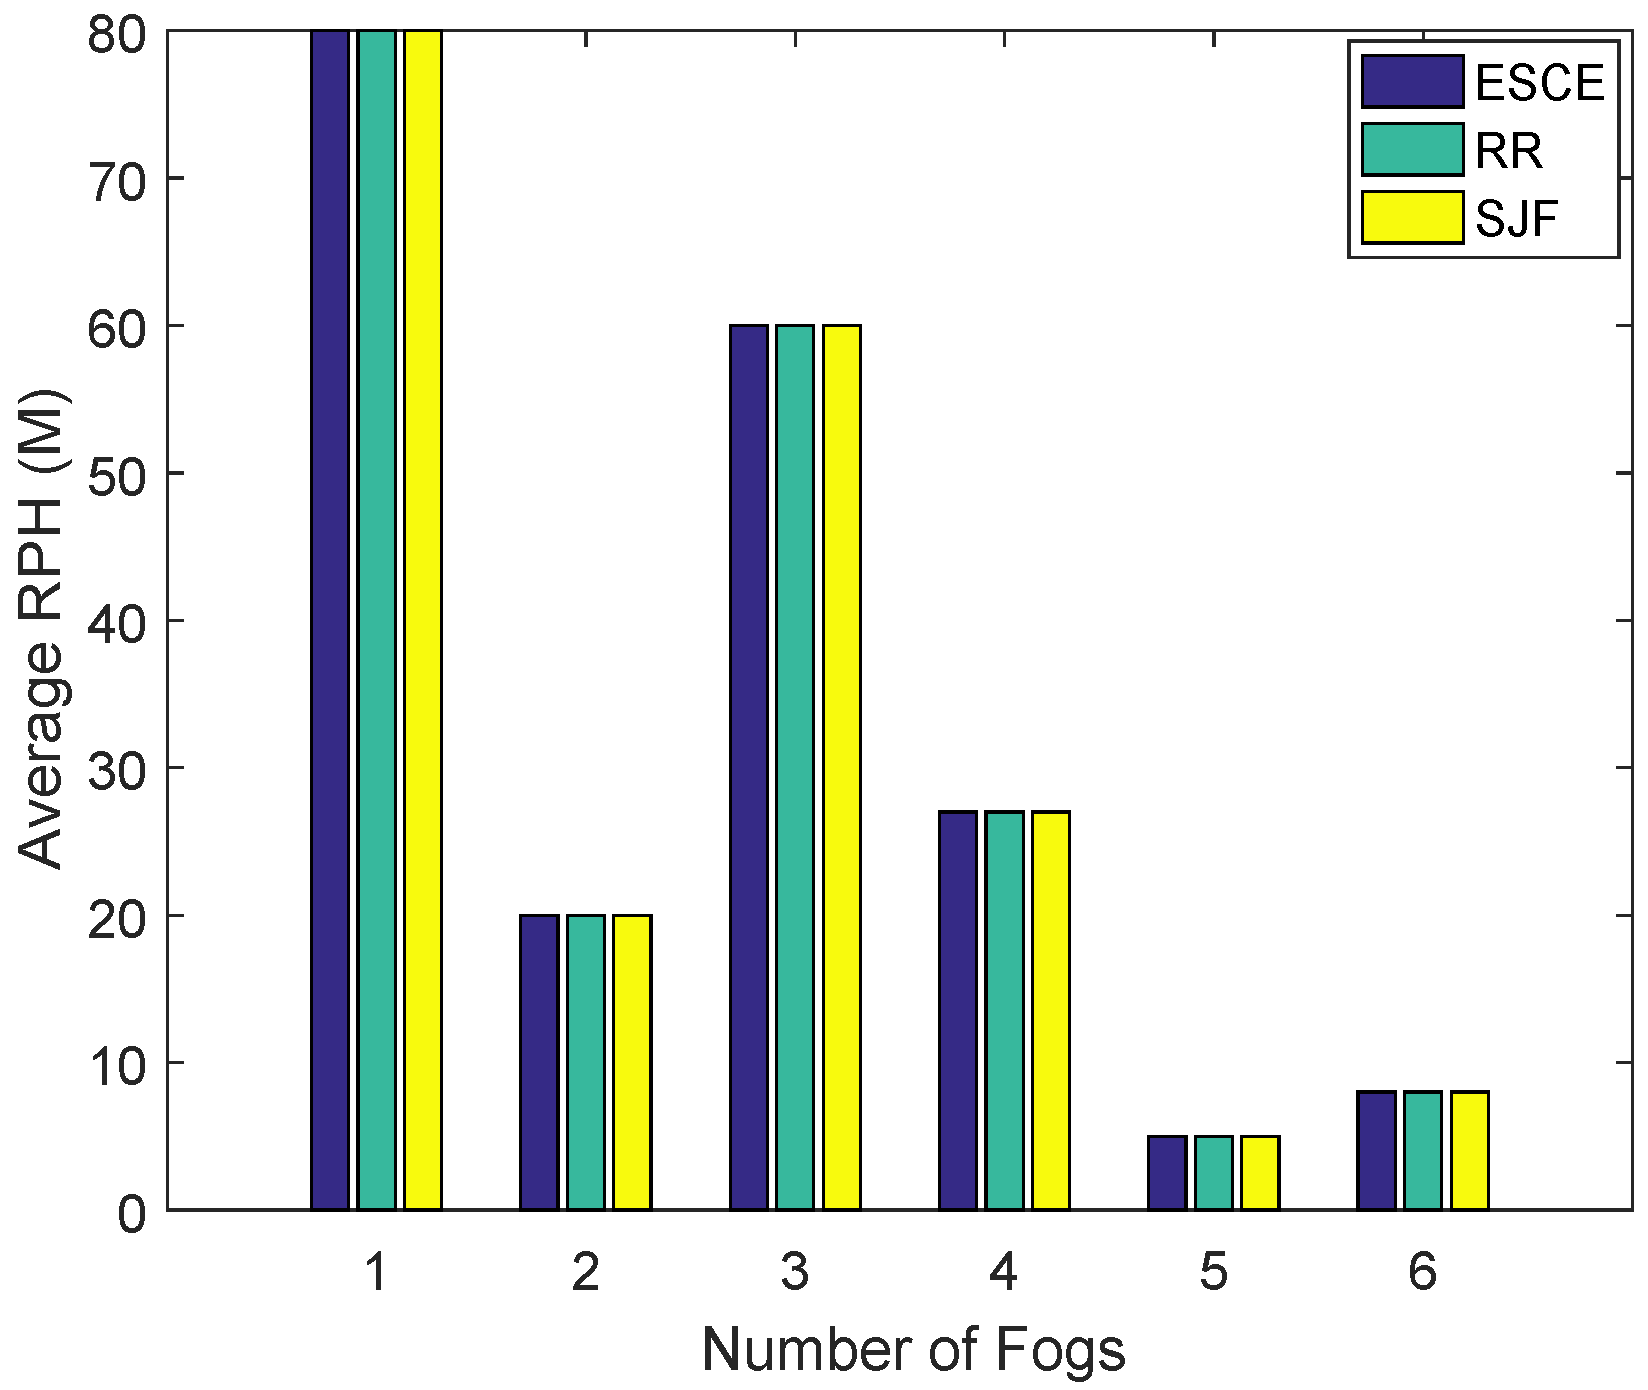
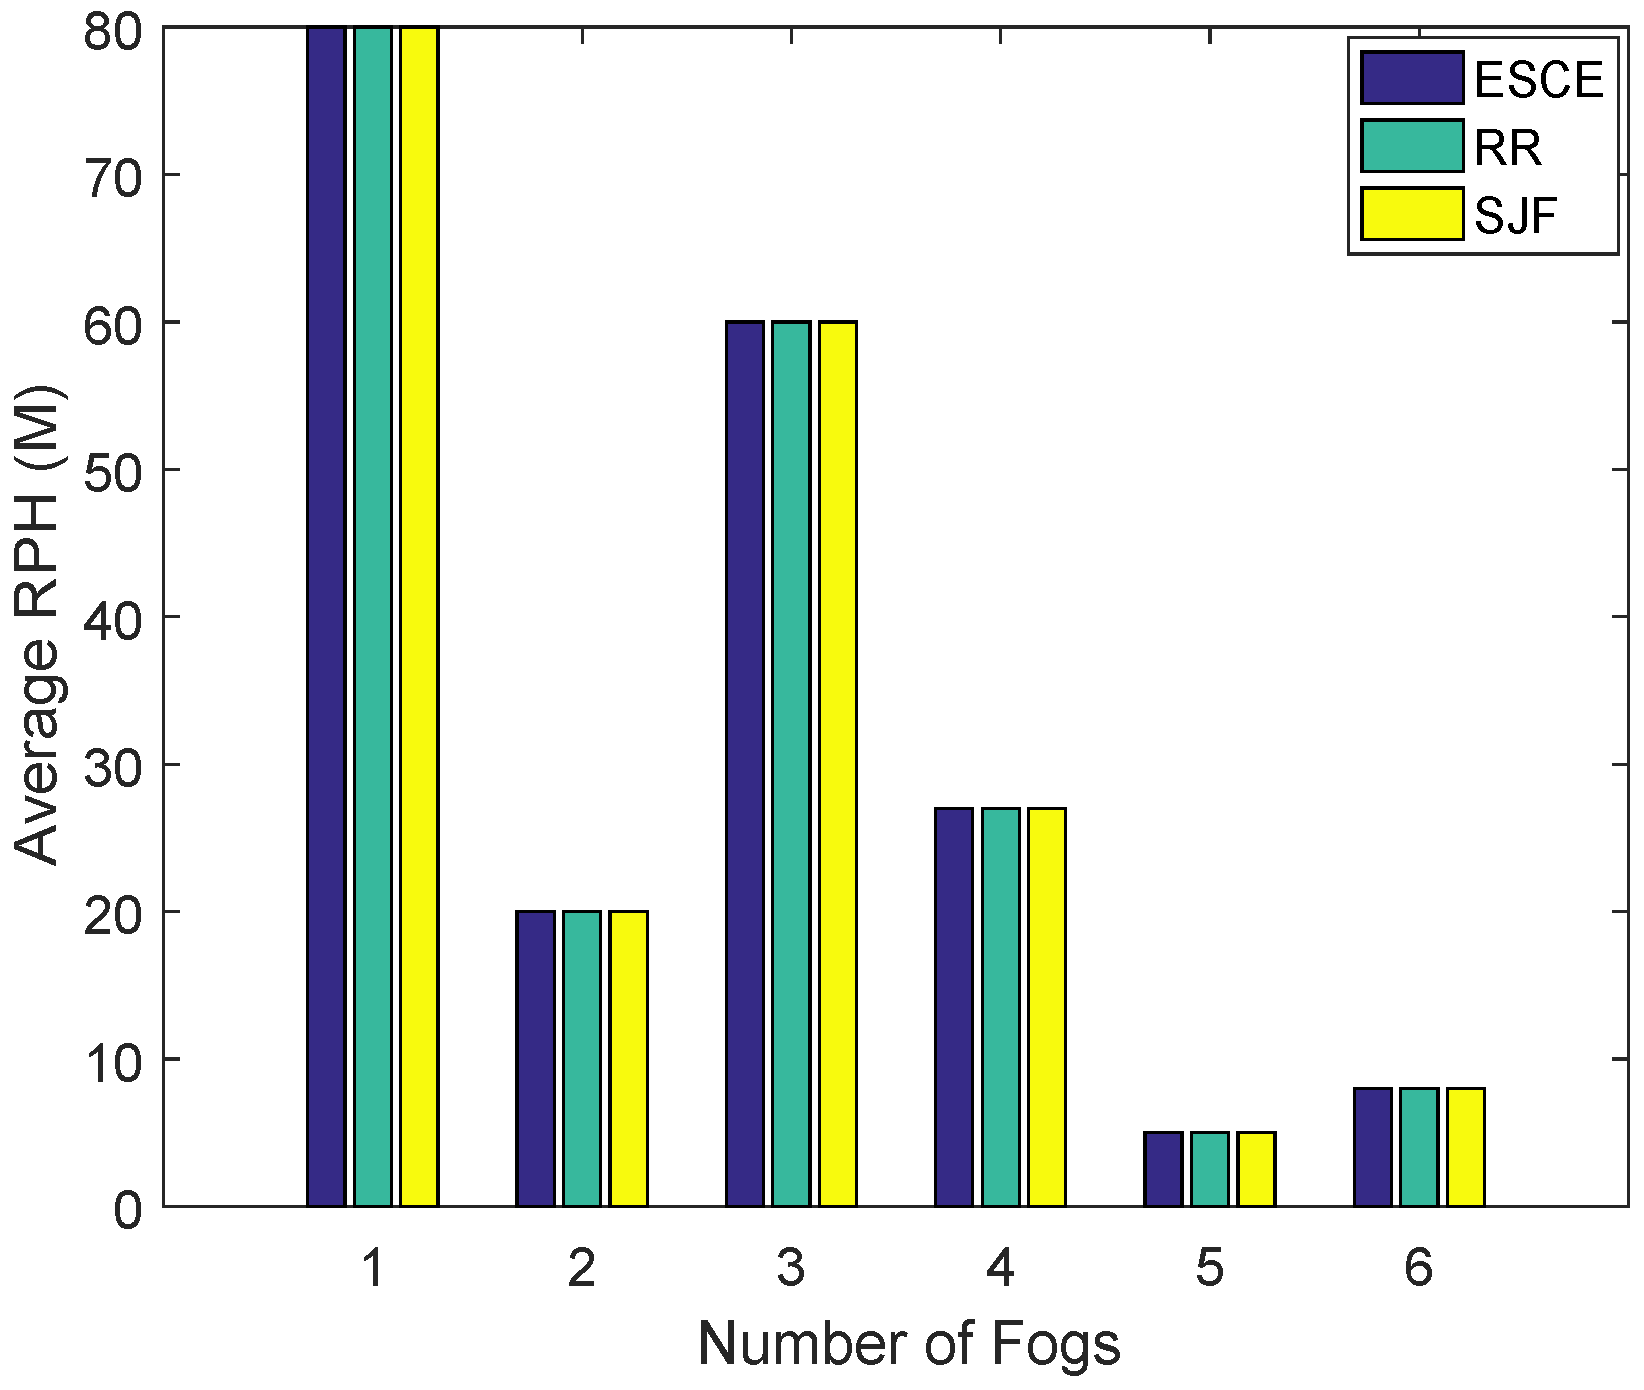
Consumers’ RPH is shown in
Figure 6 for all the fogs installed in the respective regions. Fog loading is done as per the number of requests received from the buildings. The number of buildings and homes are considered random; however, their requests are taken as fixed in each time interval. The fog loading phase is initiated after the requests’ receiving phase and then tasks’ computation is performed. The maximum population is considered from each region for getting the maximum number of requests and the number of VMs, MGs and other relevant services are available on the fog and cloud DCs for fulfilling the requests. The requests from each region are based on the number of consumers living in that region as shown in
Figure 6.
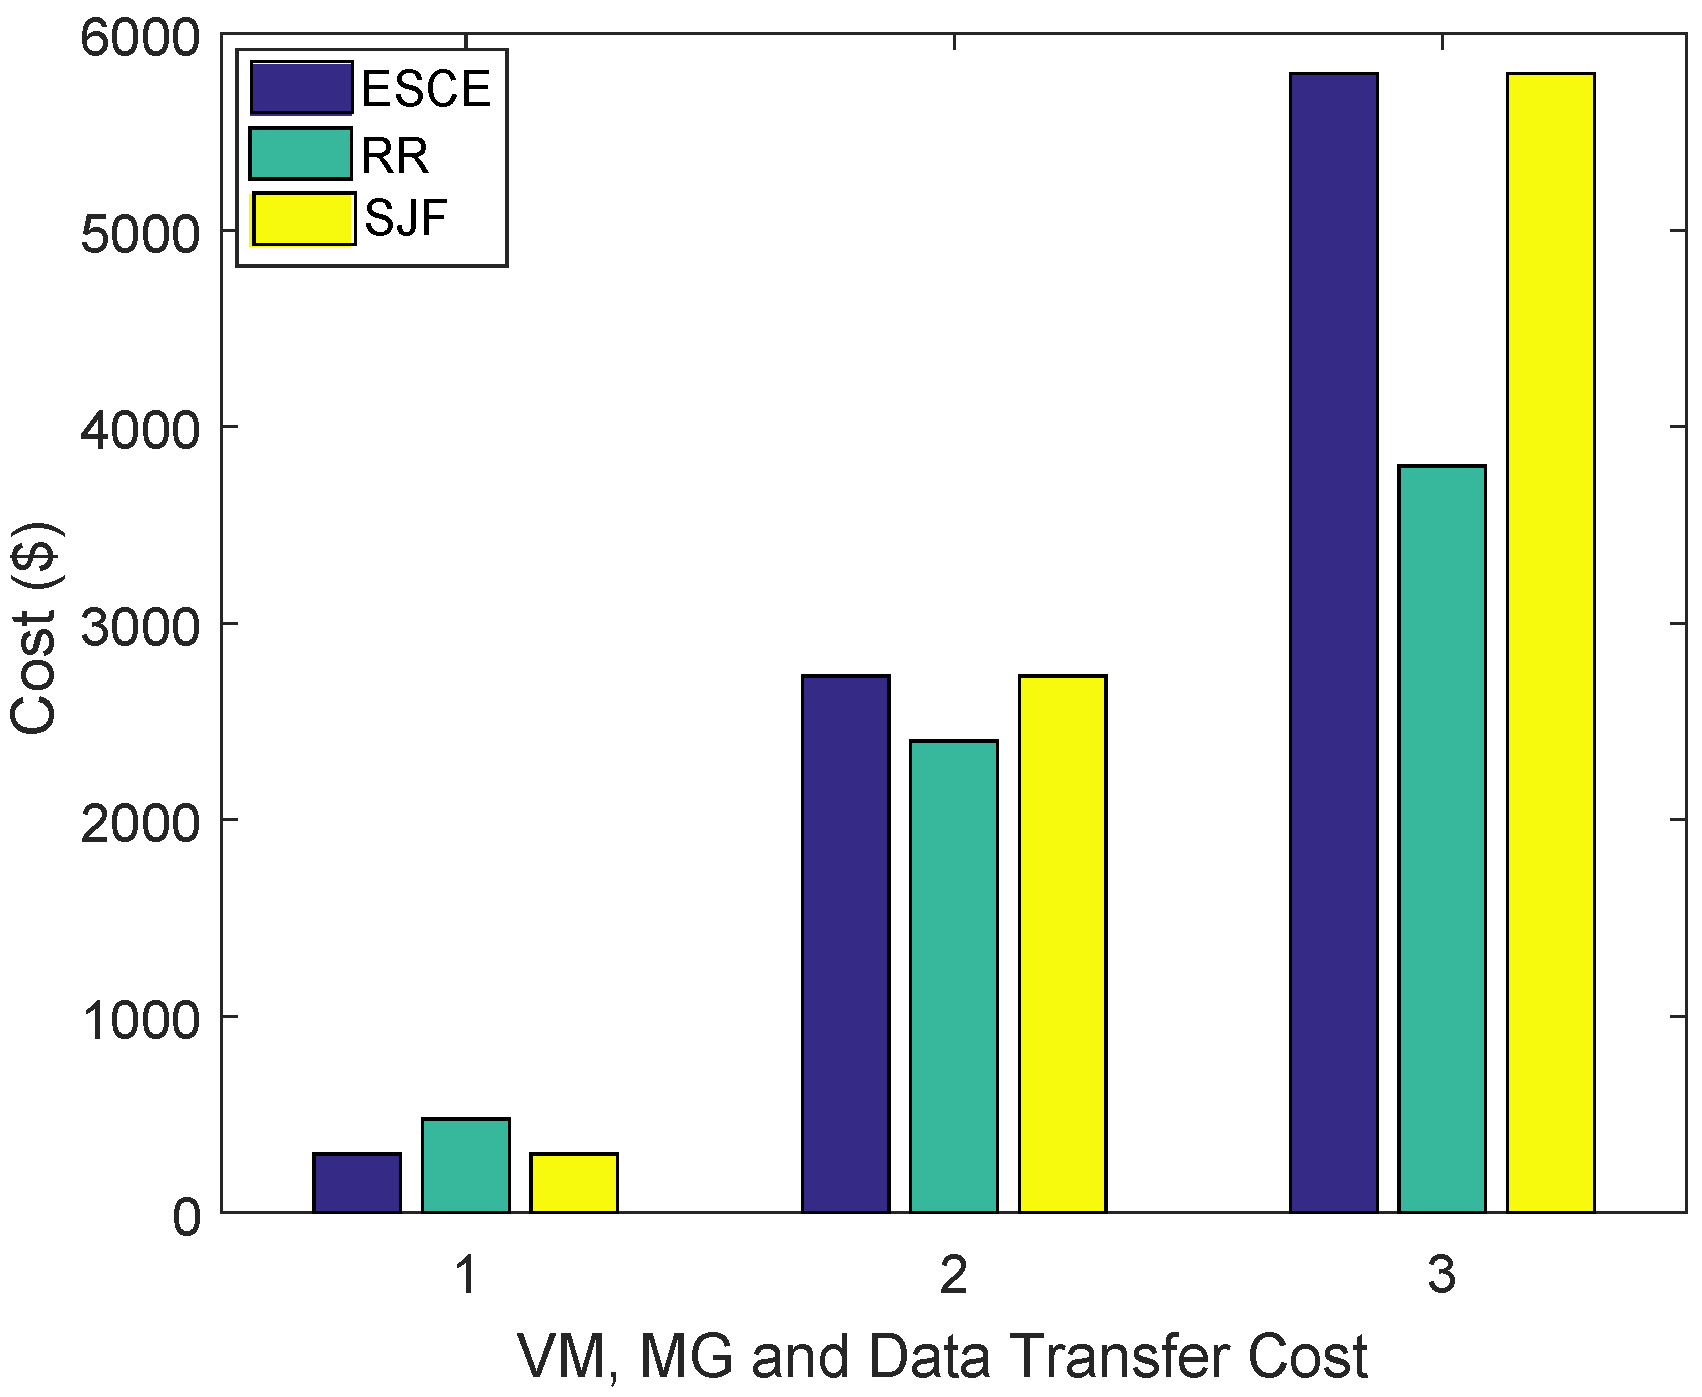
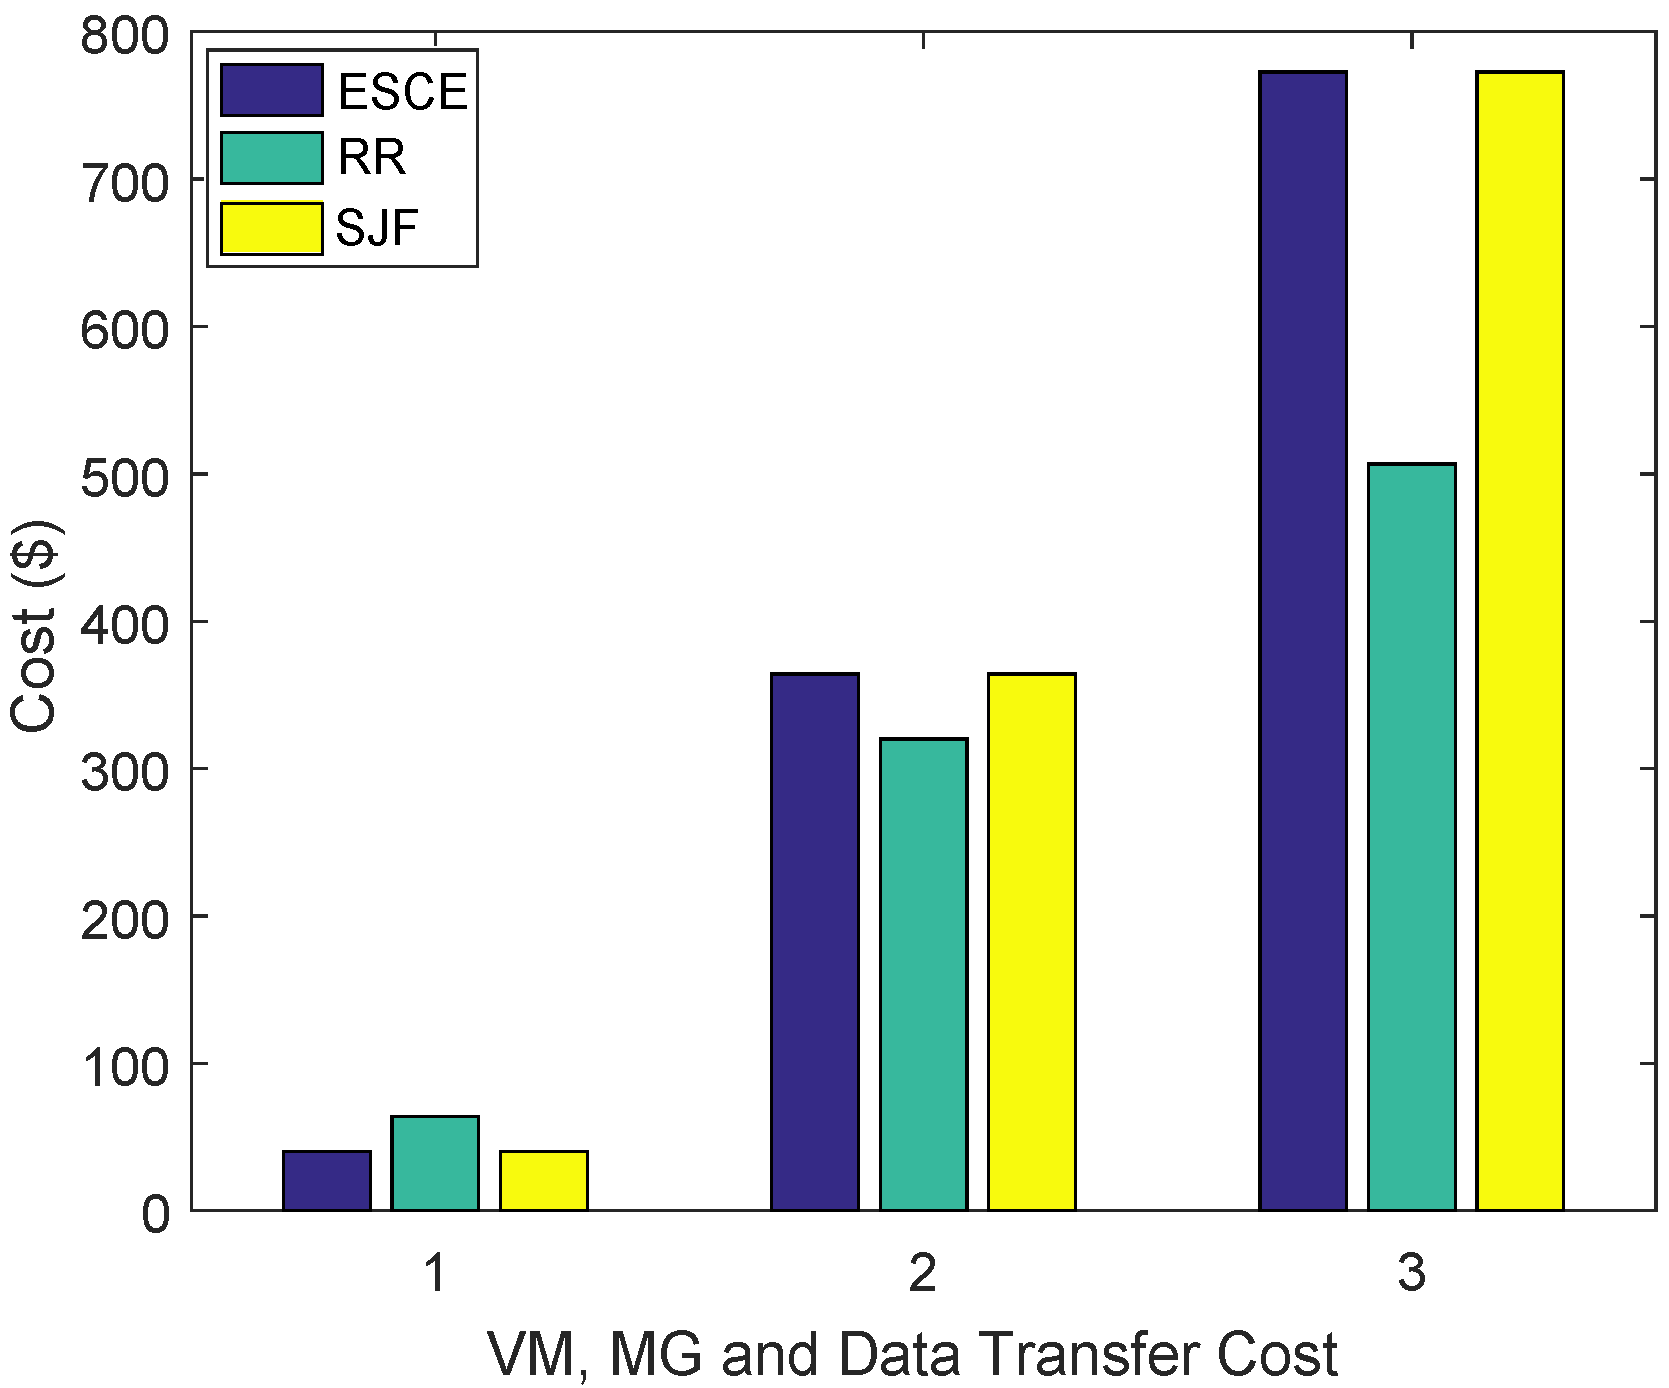
Using the six fogs for six regions, the proposed system’s total cost is comprised of the VMs cost, MGs cost and data transfer cost. The number of MGs, VMs and all the other allocations relevant to users’ requests along with their costs are calculated and analyzed. There is a trade-off in the VMs cost using the SJF algorithm; since it receives the tasks with the small size priority and allocates those tasks to the available VMs, it has a high cost. The VMs cost obtained by the ESCE, RR and SJF is 300
$, 478
$ and 300
$. MG cost is computed as: 2731.94
$, 2400
$ and 2734.31
$ respectively. The data transfer cost is calculated as 5795.75
$, 3800.53
$ and 5795.79
$. In addition, computation cost for the MG and data transfer cost for the other two algorithms is not very high because they do not consider the request’s size priority. Aggregated cost for all three algorithms is shown in
Figure 7.
4.1.2. Scenario 1(2): 50 VMs with Two DCs
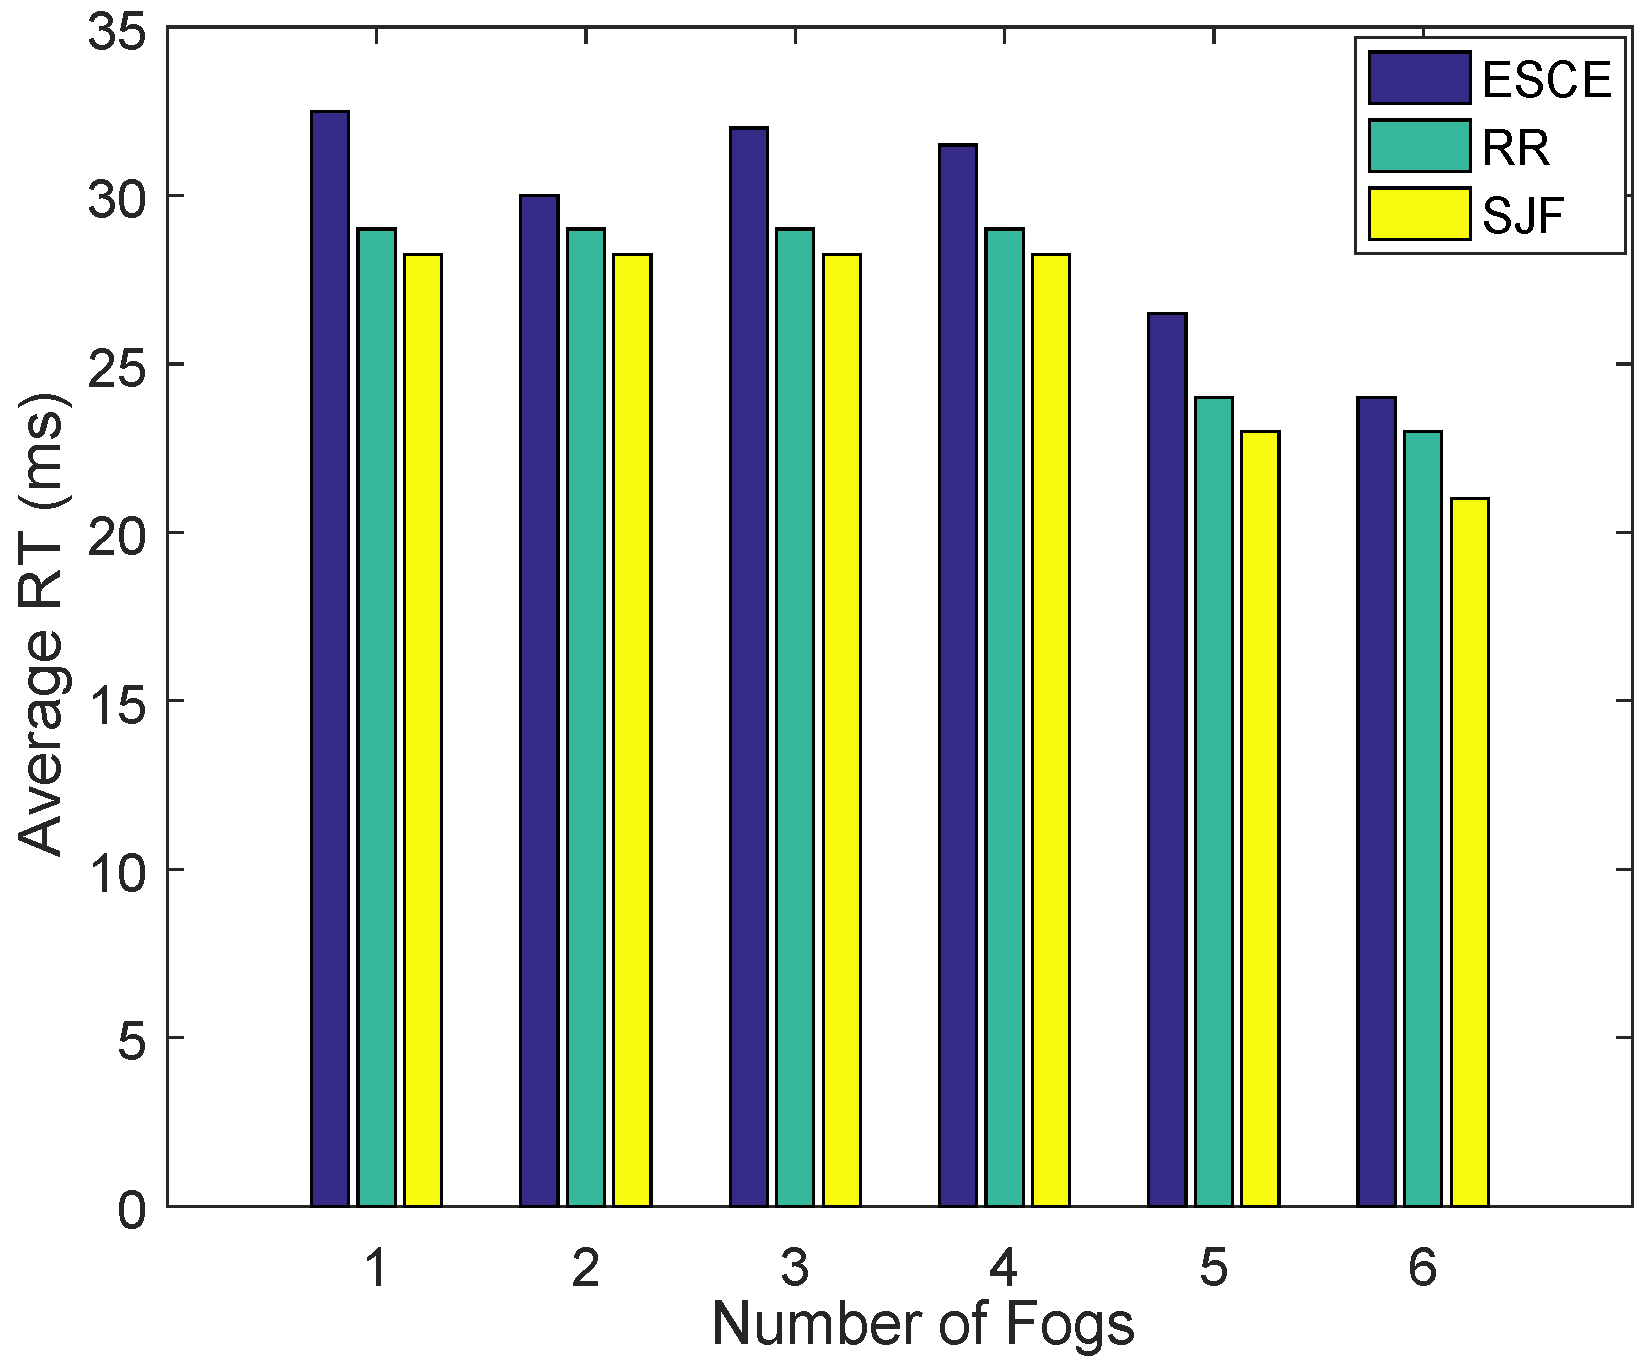
In this scenario, 50 VMs are used with two DCs in order to check the efficiency of the proposed C2F2C framework. First the RT of all the fogs is computed as shown in
Figure 8. The RT of all fogs calculated according to the above-mentioned algorithms: ESCE, RR and SJF is 32.5 ms, 29 ms and 28.25 ms for fog 1; 30 ms, 29 ms and 28.25 ms for fog 2; 32 ms, 29 ms and 28.25 ms for fog 3; 31.5 ms, 29 ms and 28 ms for fog 4; 26.5 ms, 24 ms and 23 ms for fog 5; and 24 ms, 23 ms and 21 ms for fog 6. In this case, SJF outperforms all algorithms efficiently as it is also observed from all of the previous fogs results. SJF outperforms ESCE and RR: 14% and 3% for fog 1; 6% and 3% for fog 2; 12% and 3% for fog 3; 12% and 3% for fog 4 similar to fog 3; 14% and 3% for fog 5; and 3% using both algorithms for fog 6, respectively.
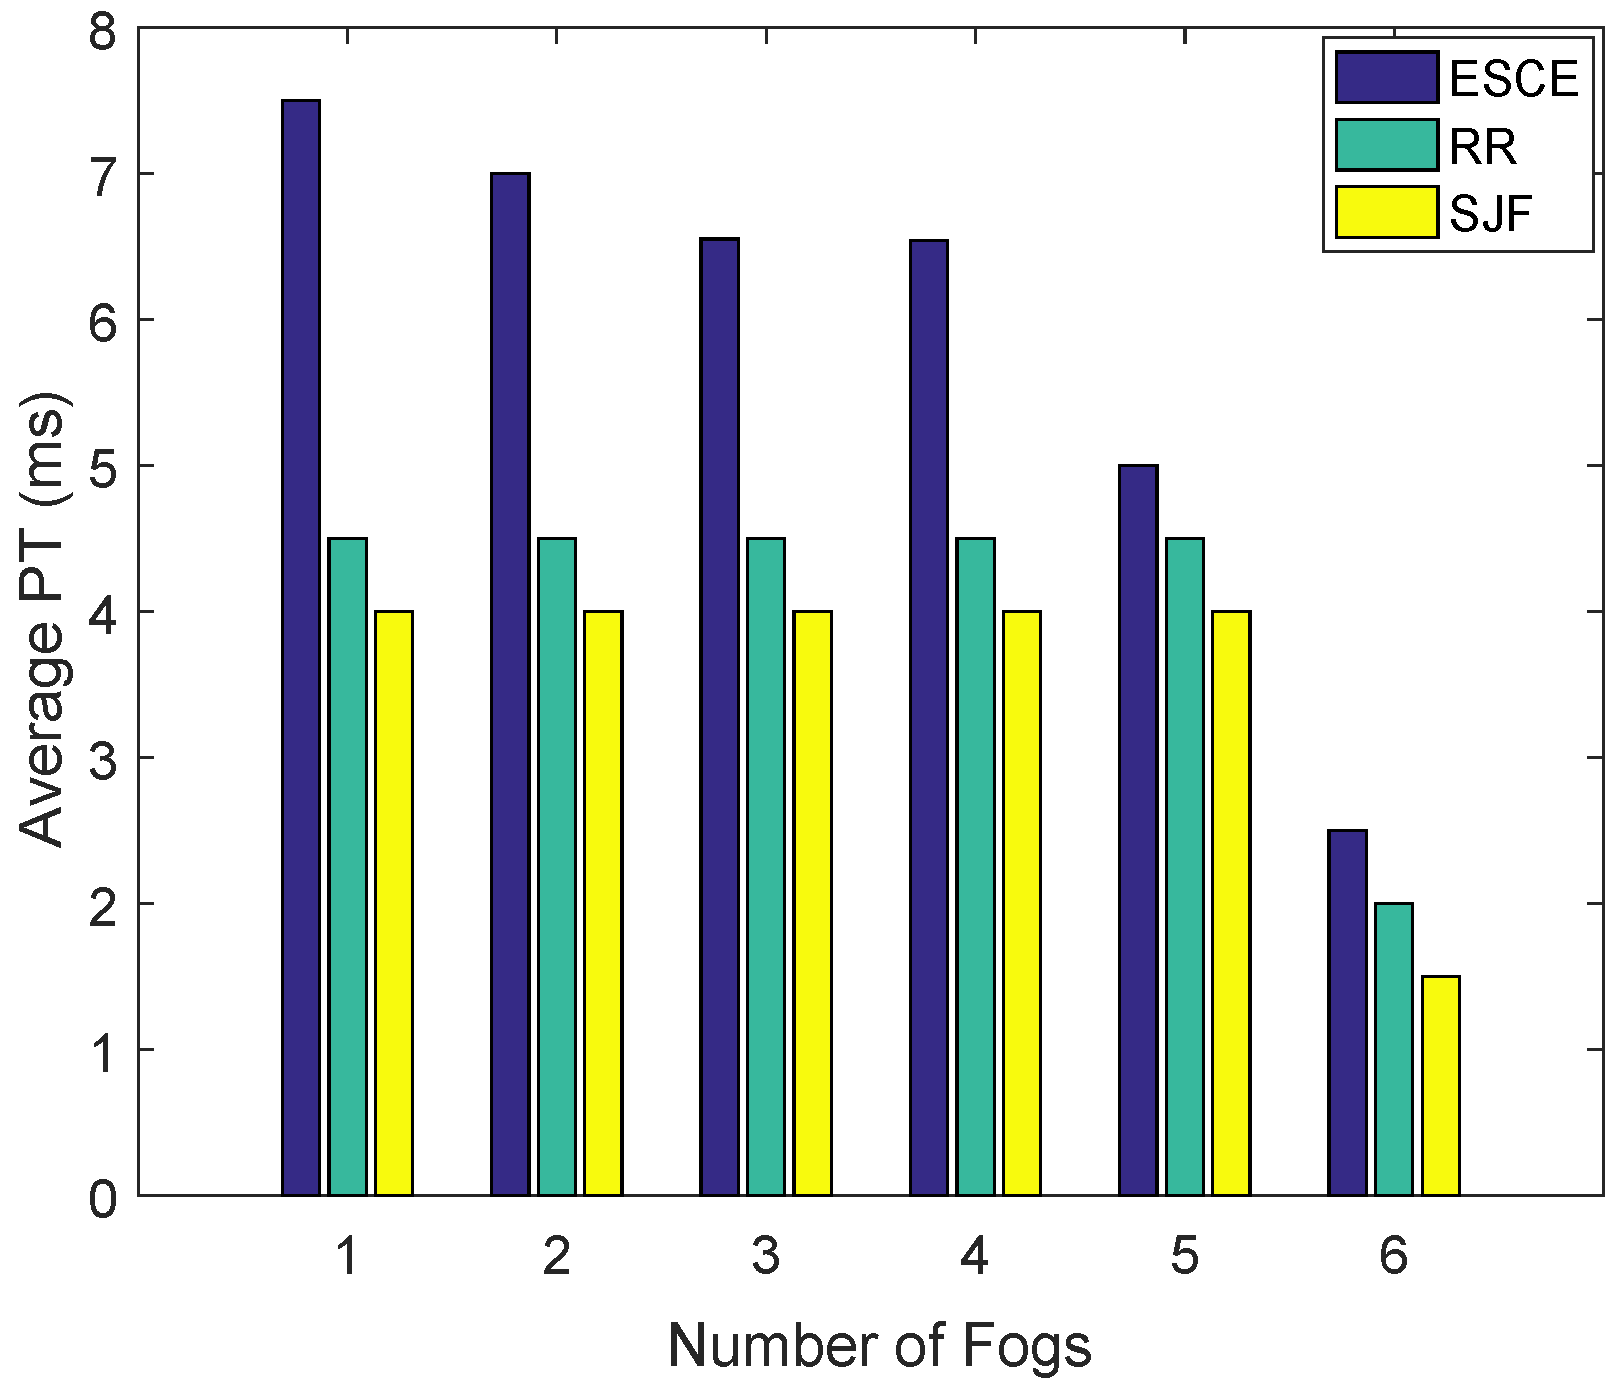
After computing the RT of the scenario, the PT of each fog is also computed as displayed in
Figure 9. The PT for fog 1 is computed as: 7.5 ms, 4.5 ms and 4 ms using these algorithms. For fog 2–6, it is calculated as: 7 ms, 4.5 ms and 4 ms for fog 2; 6.55 ms, 4.5 ms and 4 ms for fog 3; 6.54 ms, 4.5 ms and 4 ms for fog 4; 5 ms, 4.5 ms and 4 ms for fog 5; and 2.5 ms, 2 ms; and 1.5 ms for fog 6 through ESCE, RR and SJF algorithms. These algorithms have optimized the proposed work efficiently, especially SJF algorithm performs better then the other two algorithms. For fog 1–6, it performs 47% and 12%; 43% and 12%; 39% and 12%; 82% and 12%; and 94% and 25% better than ESCE and RR. This scenario gives the more optimal results in terms of the resource allocation because more resources are utilized and consumers are entertained more efficiently as compared to the first scenario.
Figure 10 shows the RPH of the consumers which is kept the same as in scenario 1. For the sake of simplicity, RPH is kept similar to all scenarios in this work.
As mentioned above, the aggregated cost is comprised of the VMs cost, MGs cost and data transfer cost in this system. For this scenario, the resources are used twice as compared to the resources used in scenario
1(2), so, it costs almost double to the scenario
1(1); however, it maximizes the RT and PT of the consumers’ requests. The total cost for this scenario is shown in
Figure 11. The cost computed for VMs, MGs and data transfer is: 600
$, 756
$ and 600
$; 5463.88
$, 4800
$ and 5468.62
$; and 11591.5
$, 7601.06
$ and 11591.58
$. This scenario has achieved more optimized results as compared to the scenario
1(1); however, it compromises the cost.
4.2. Scenario 2: Resource Allocation Using MGs and Power Storage Devices
The second use case scenario for the proposed framework is demonstrated in
Figure 12. In this scenario, a power storage system (i.e., a battery system) is integrated for improving the RT, PT and cost of the consumers’ requests. The components of the system are smart homes, power storage devices, smart solar panel, wind power, electric vehicle and retail super store. The smart homes’ users request the electricity from the fog at the regional level where fog is installed to fulfill their demands. Fog is connected to the MGs, electric vehicles and battery storage resources which are used to facilitate the consumers’ requests. Fog first sends requests to MGs or battery storage devices to fulfill the demands of the consumers. If these are sufficient then it does not take any power from the utility. In the case that there is surplus power, then it is stored in the batteries and it can be sold back to the utility for the sake of the power trading. The stored power is also utilized in the peak hours in this work. Power trading is not the focus of this work. Here, the focus of this work is making the power system more sustainable and flexible for residential buildings. Electric vehicle and retail super store are directly connected to the fog and are solely based on the MGs and battery storage devices for procuring electricity services. Because of this, these are considered as sustainable stations in any region. Electric vehicles are used for fulfilling the travel requirements of the consumers in any residential region. These are not directly connected to the main grid for utilizing the power from main grid. These are consumers and prosumers of the residential area. The parameters are considered as the same as those considered in scenario
1(1) and
1(2).
4.2.1. Scenario 2(1): 25 VMs for Single DC and Power Storage
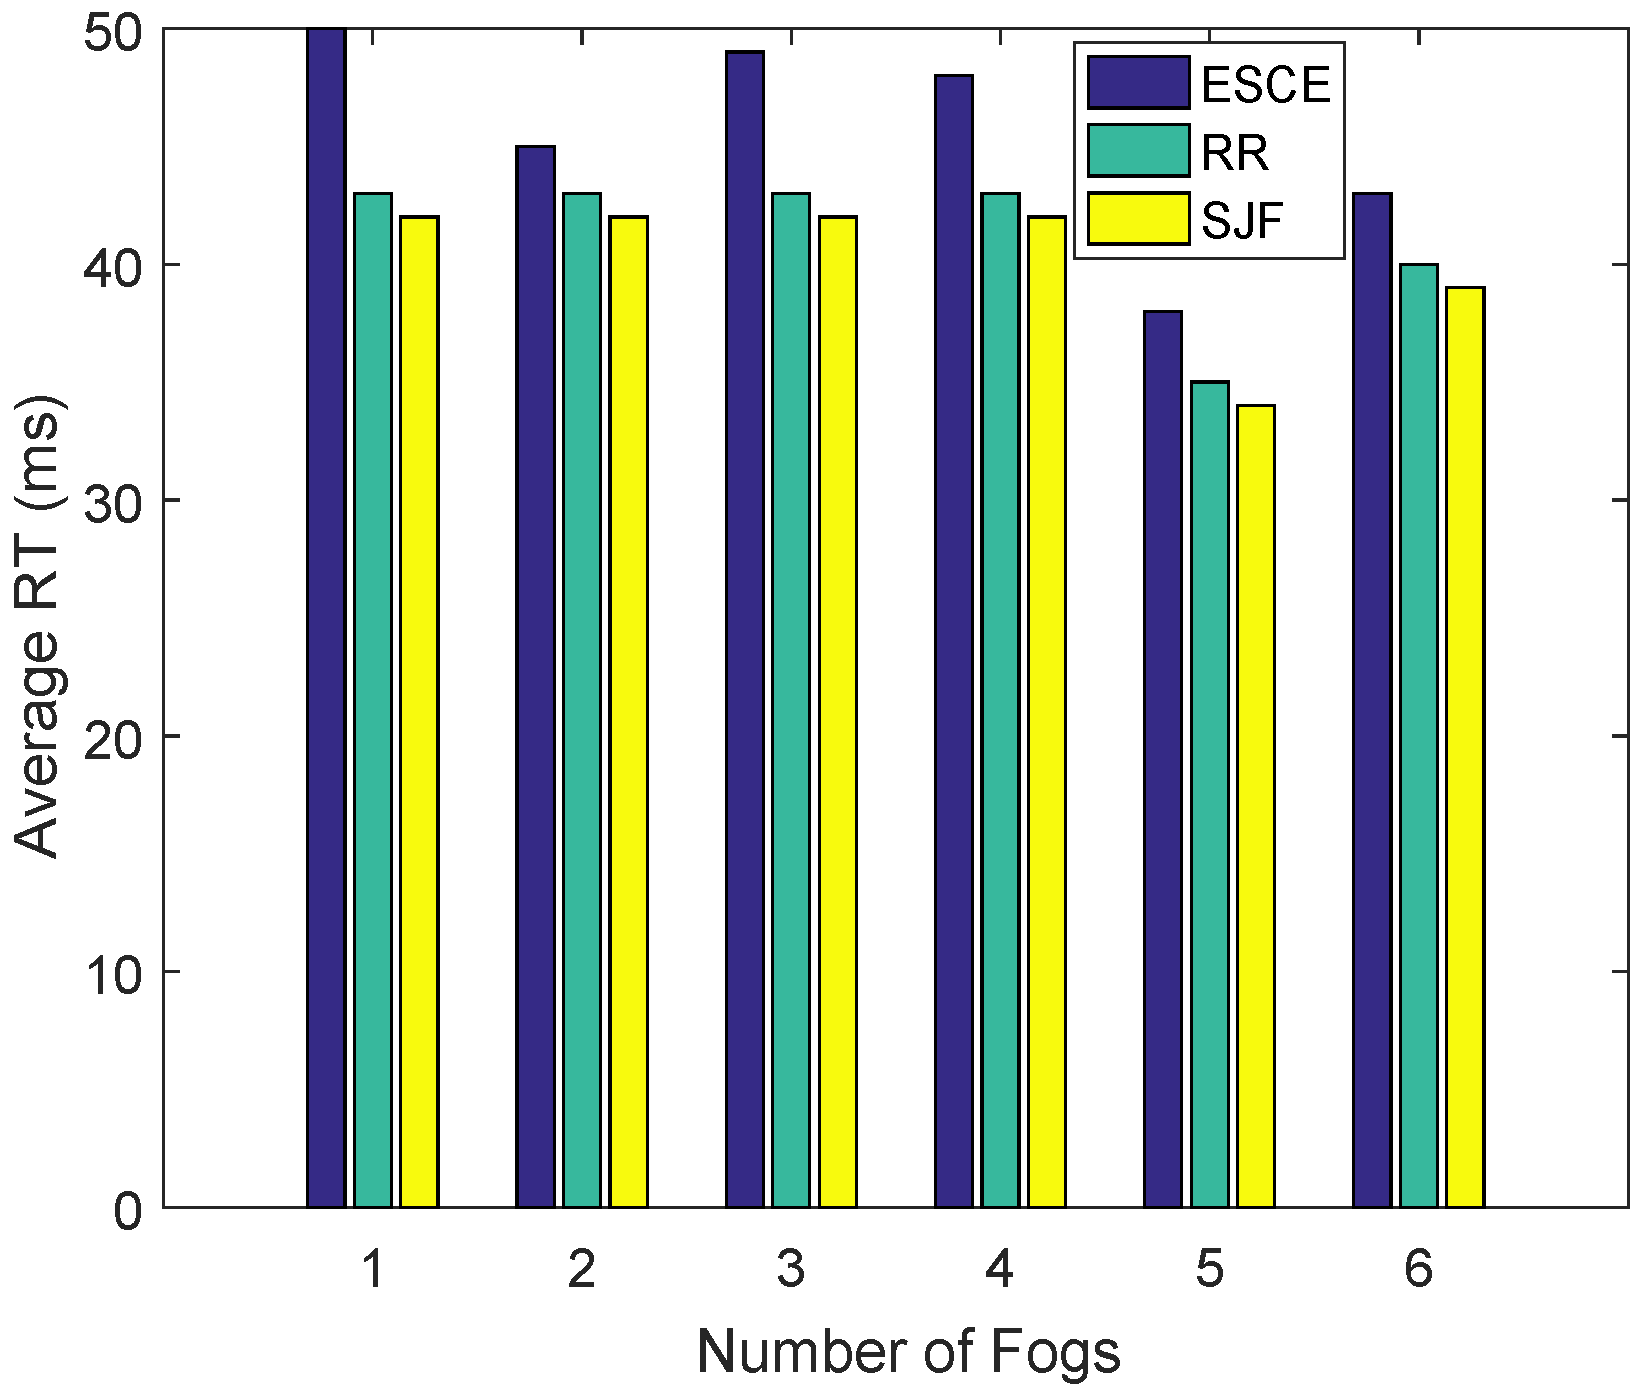
In this scenario, the effect of battery storage devices has been verified through simulations using the same performance metrices. Firstly, RT of the system is computed which is shown in
Figure 13. RT of the system is optimized using the ESCE, RR and SJF algorithms which are used in the previous scenario. The RT of fog 1 is 50 ms, 43 ms and 42 ms; fog 2 is 45 ms, 43 ms and 42 ms; fog 3 is 49 ms, 43 ms and 42 ms; fog 4 is 48 ms, 43 ms and 42 ms; fog 5 is 38 ms, 35 ms and 34 ms; and fog 6 is 43 ms, 40 ms and 39 ms, respectively. Here SJF beats the other algorithms: ESCE and RR up to 16% and 14% for fog 1; 7% and 14% for fog 2; 15% and 14% for fog 3; 13% and 14% for fog 4; 11% and 14% for fog 5; and 10% and 14% for the fog 6, respectively.
Analysing the RT of the scenario, it is observed that SJF outperforms the other two algorithms due to the incorporation of the battery storage resources. RPH of this scenario is displayed in
Figure 14 which is kept as the same according to the population of each region.
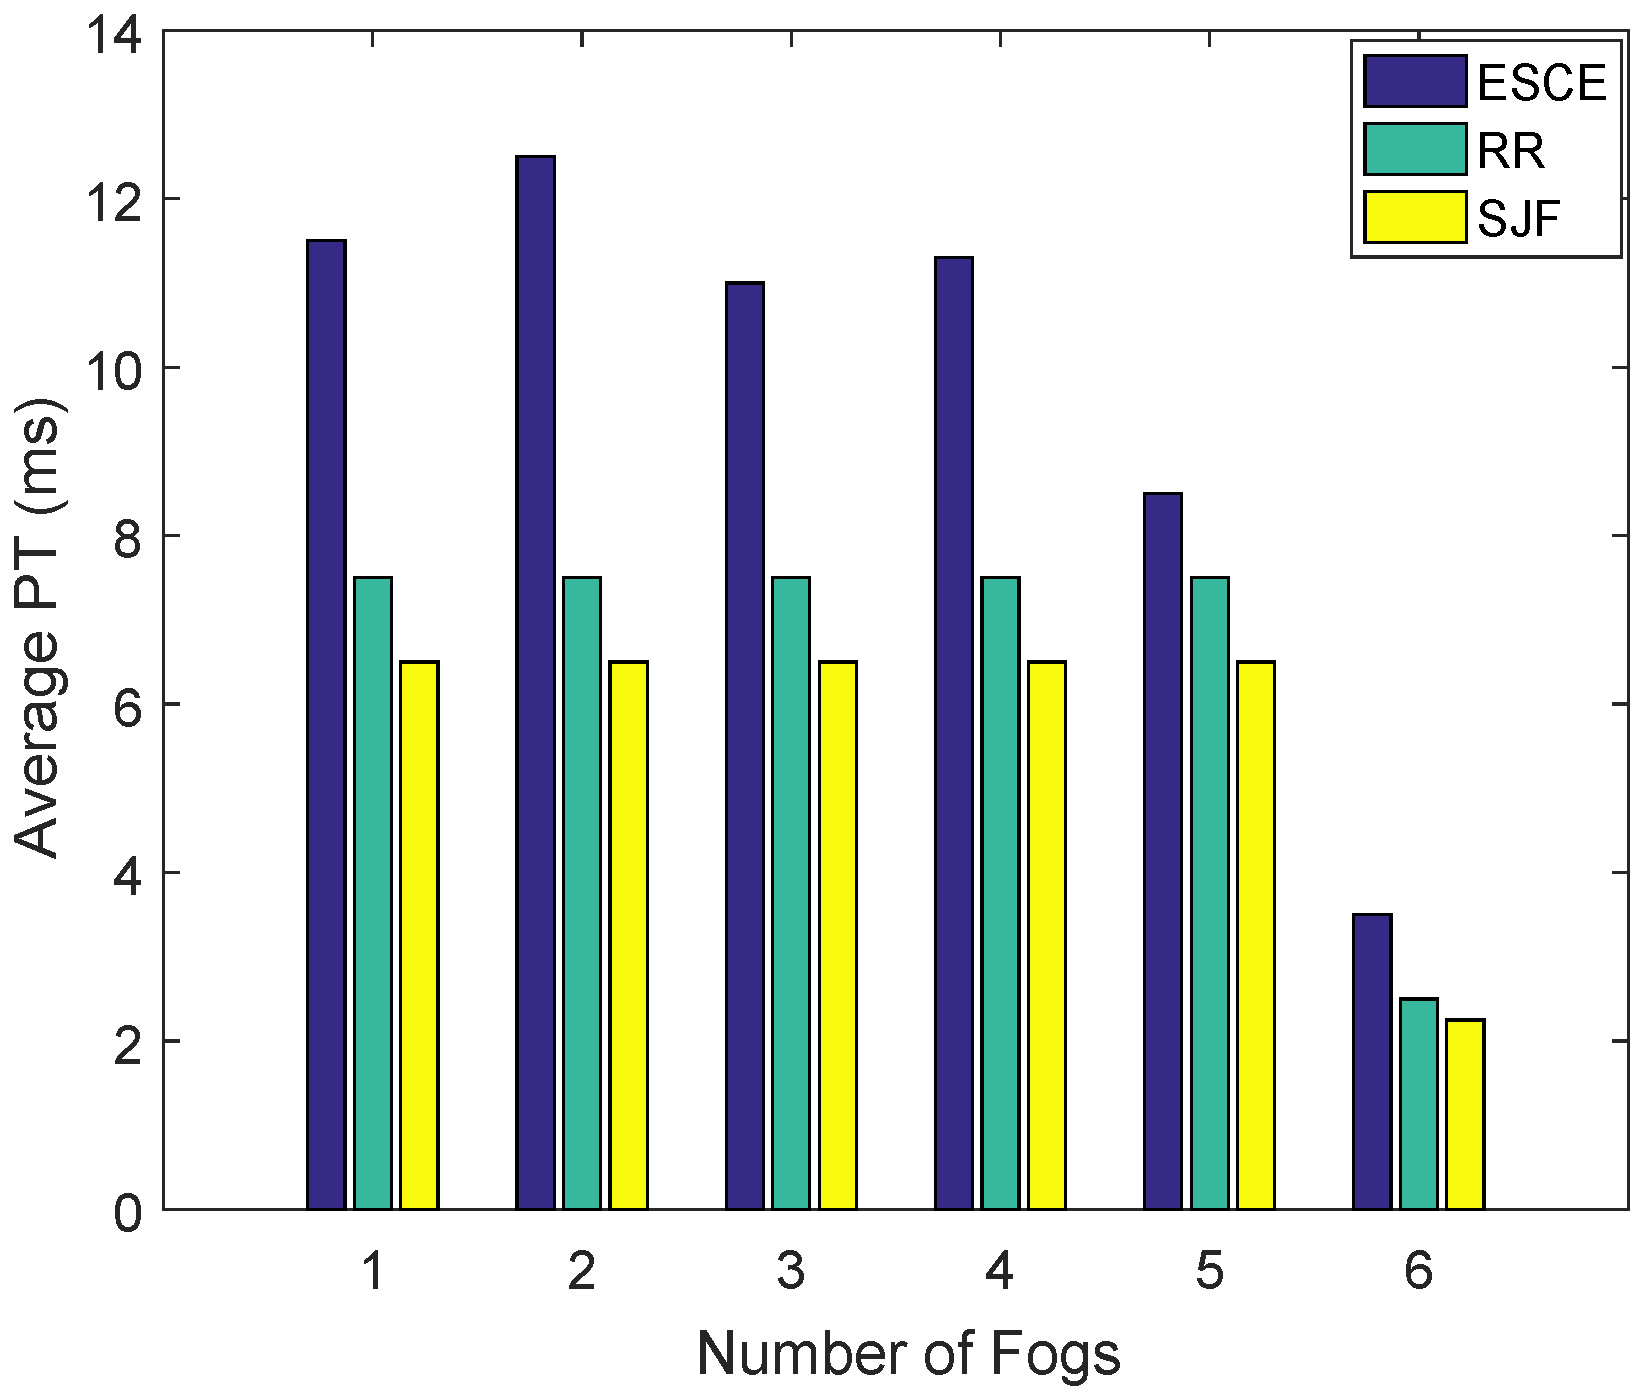
Now the PT of each fog has been optimized for this scenario using these algorithms: ESCE, RR and SJF as shown in
Figure 15. Each fog has optimal PT as: 11.5 ms, 7.5 ms and 6.5 ms for fog 1; 12.5 ms, 7.5 ms and 6.5 ms for fog 2; 11 ms, 7.5 ms ad 6.5 ms for fog 3; 11.3 ms, 7.5 ms and 6.5 ms for fog 4; 8.5 ms, 7.5 ms and 6.5 ms for fog 5; and 3.5 ms, 2.5 ms and 2.25 ms for fog 6. SJF beats the ESCE and RR upto 44% and 14% for fog 1; 46% and 14% for fog 2; 41% and 14% for fog 3; 43% and 14% for fog 4; 24% and 14% for fog 5; and 36% and 10% for fog 6.
The cost is also minimized up to 15% of the total cost of the scenario
1(1) with the incorporation of the battery storage resources. It is displayed in
Figure 16. Overall, RT and PT of this scenario have improved up to 15% with the integration of the battery storage resources as compared to scenario
1(1).
4.2.2. Scenario 2(2): 50 VMs for Single DC and Battery Storage
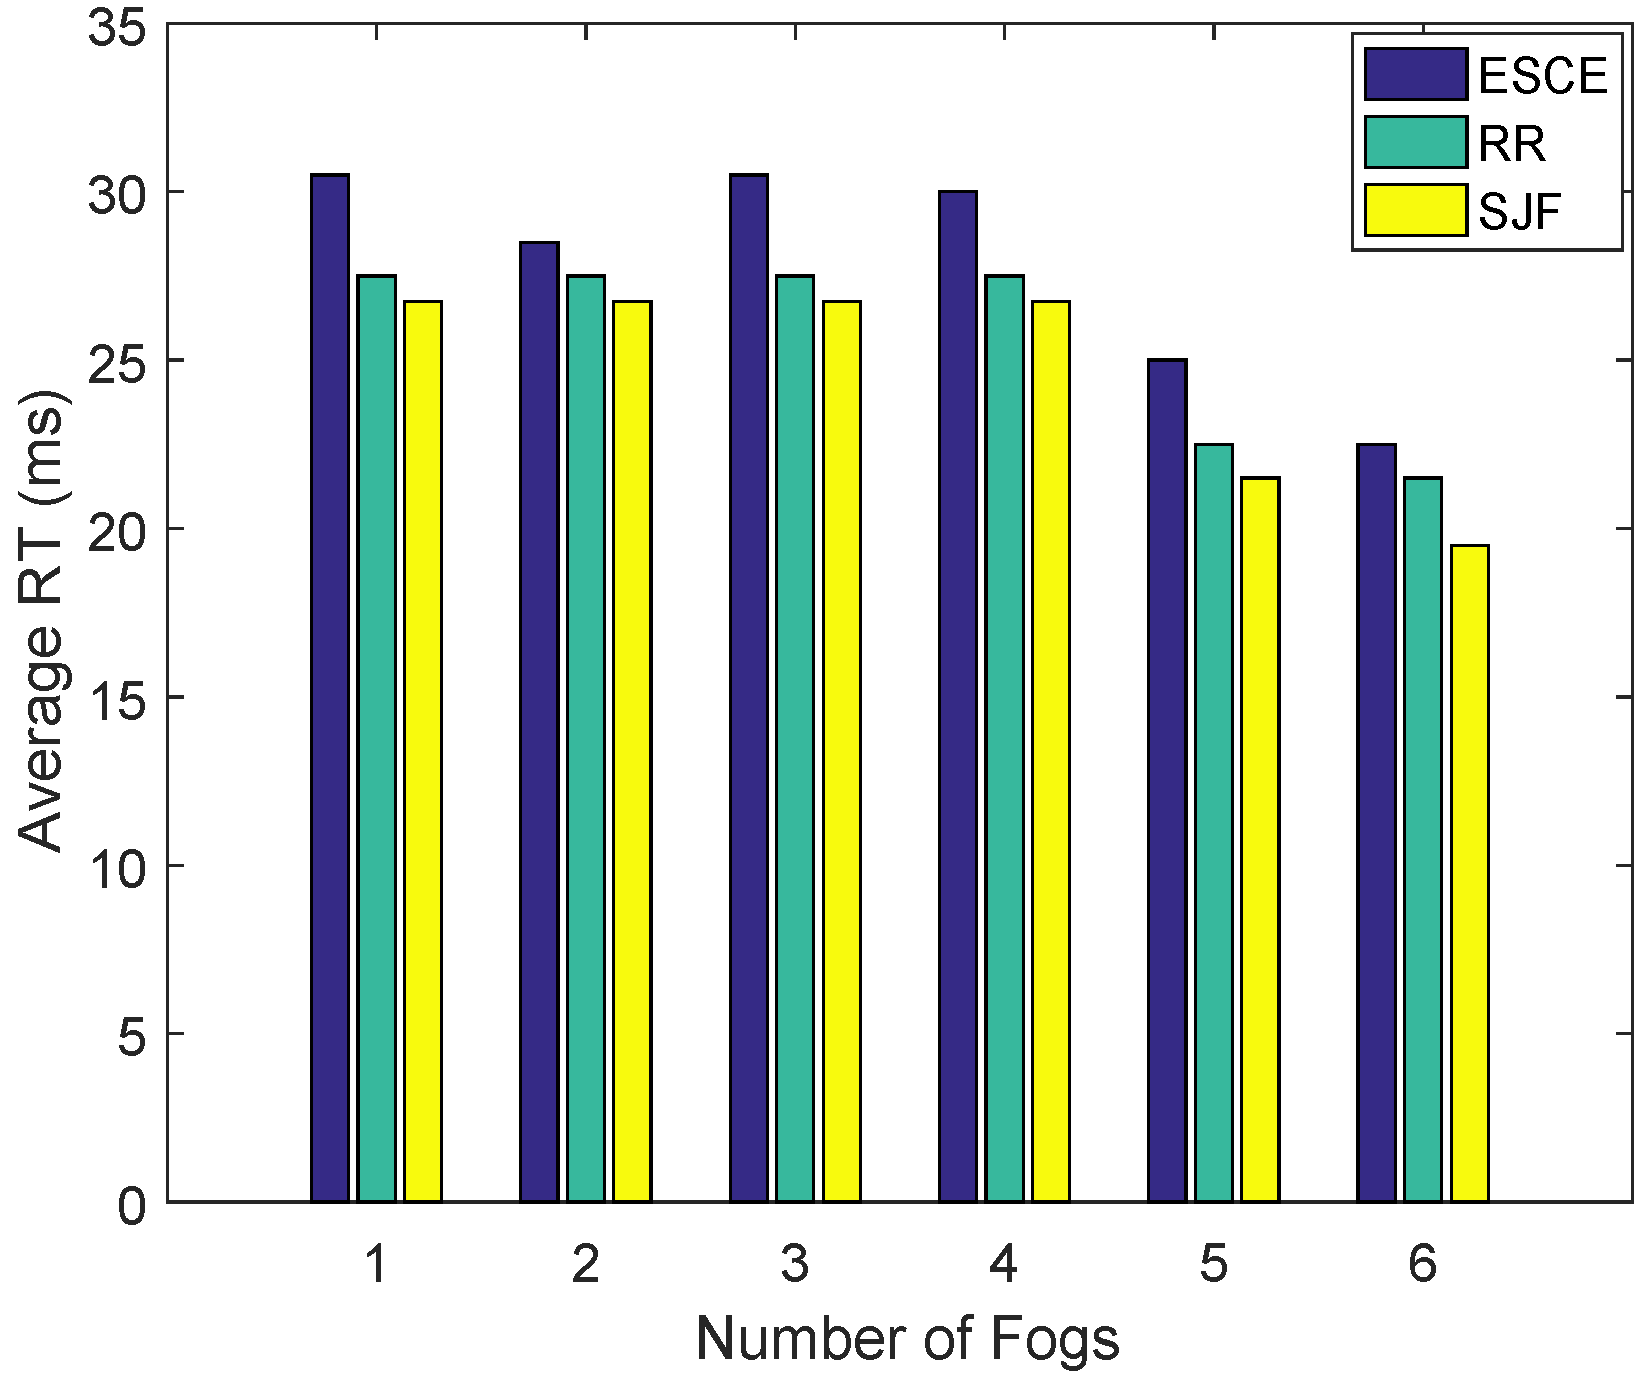
In this scenario, battery storage devices are used with the increased number of VMs and DCs as compared to the scenario
2(1). The purpose of this scenario is also based on the optimization for the similar performance parameters. The RT is computed as: 30.5 ms, 27.5 ms and 26.75 ms for fog 1; 28.5 ms, 27.5 ms and 26.75 ms for fog 2; 30.5 ms, 27.5 ms and 26.75 ms for fog 3; 30 ms, 27.5 ms and 26.75 ms for fog 4; 25 ms, 22.5 ms and 21.5 for fog 5; and 22.5 ms, 21.5 ms and 19.5 ms for fog 6 as demonstrated in
Figure 17. From these three algorithms, our proposed algorithm performs the best. It outperforms ESCE and RR up to: 13% and 3% for fog 1; 7% and 3% for fog 2; 13% and 3% for fog 3 which is similar to fog 1; 11% and 3% for fog 4; 14% and 3% for fog 5; and 14% and 10% for fog 6.
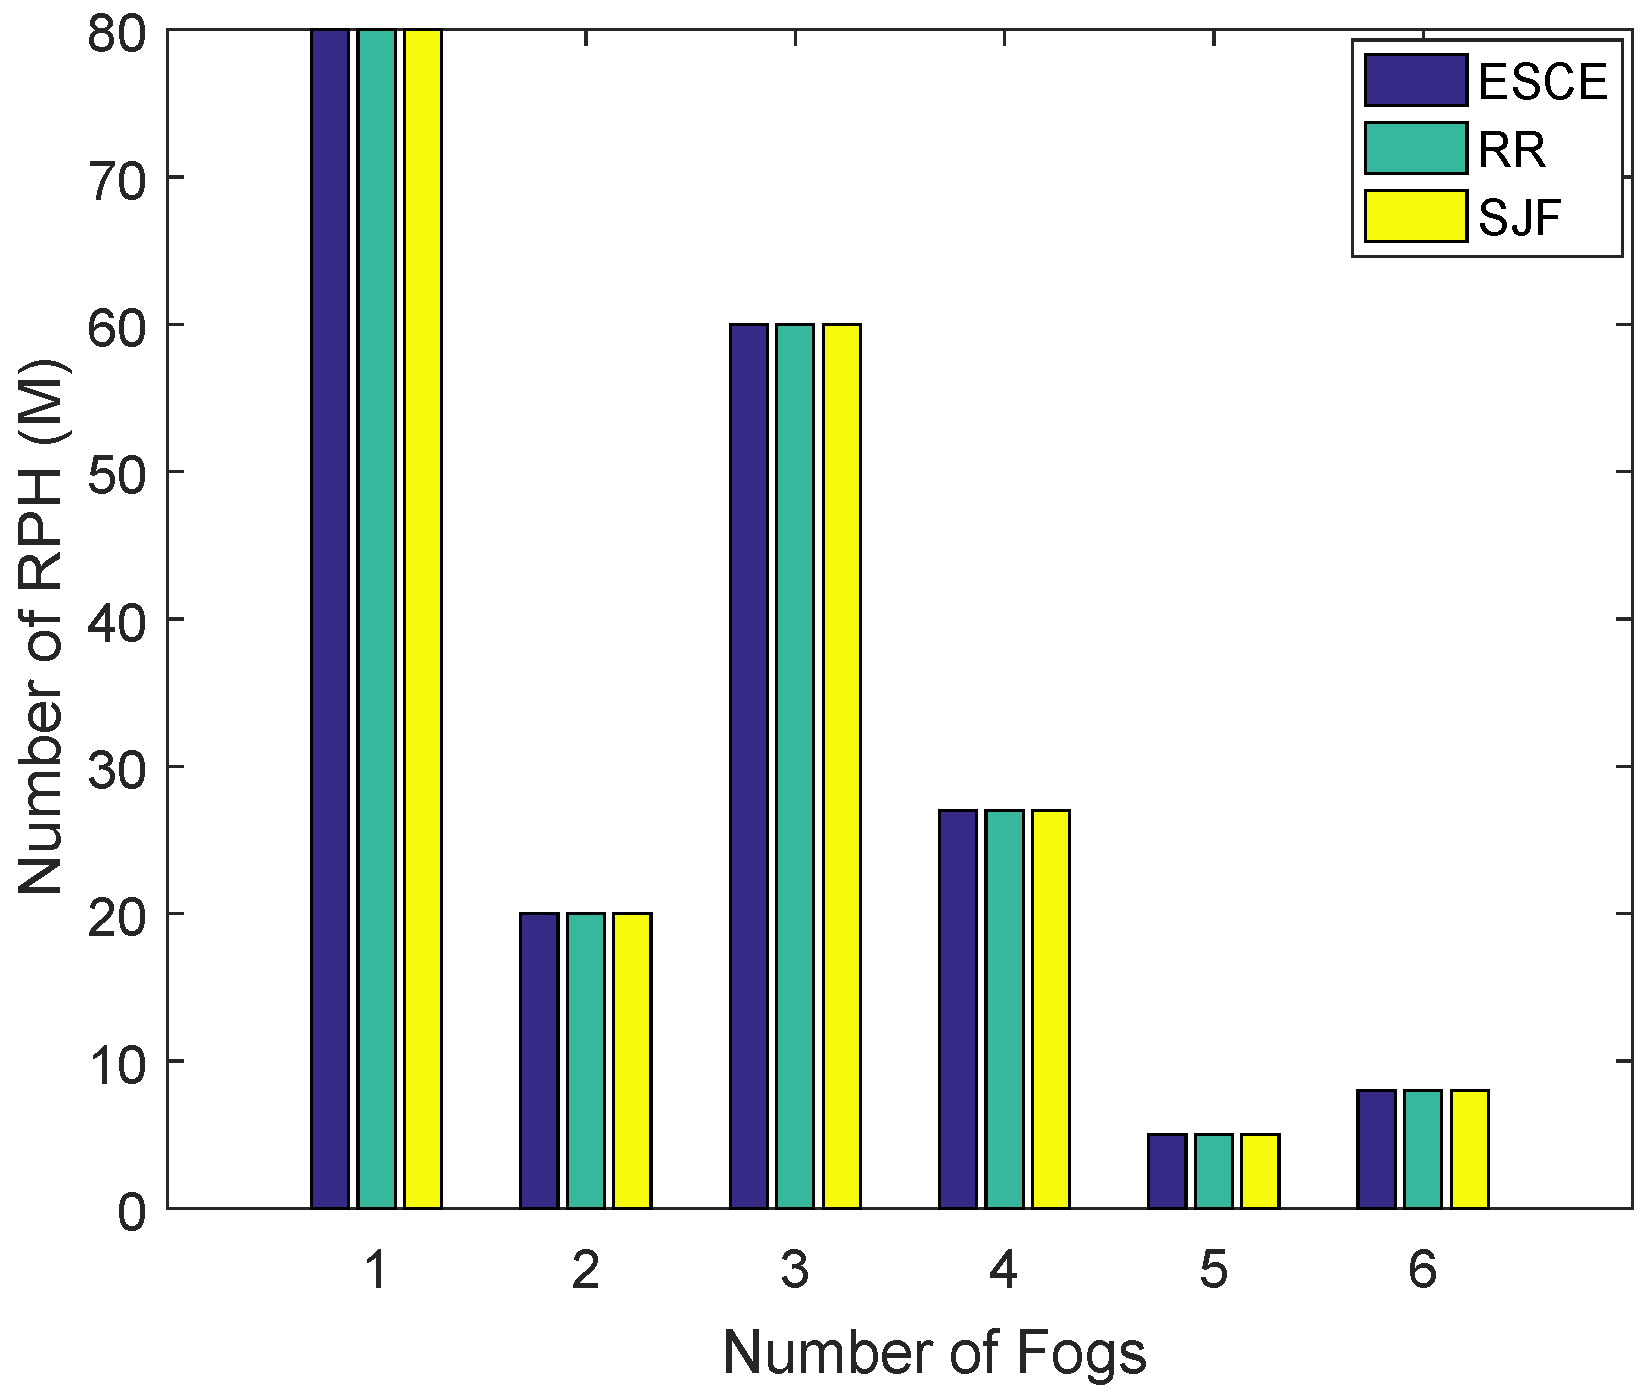
RPH is also kept similar in this case as displayed in
Figure 18 for each region throughout the simulation.
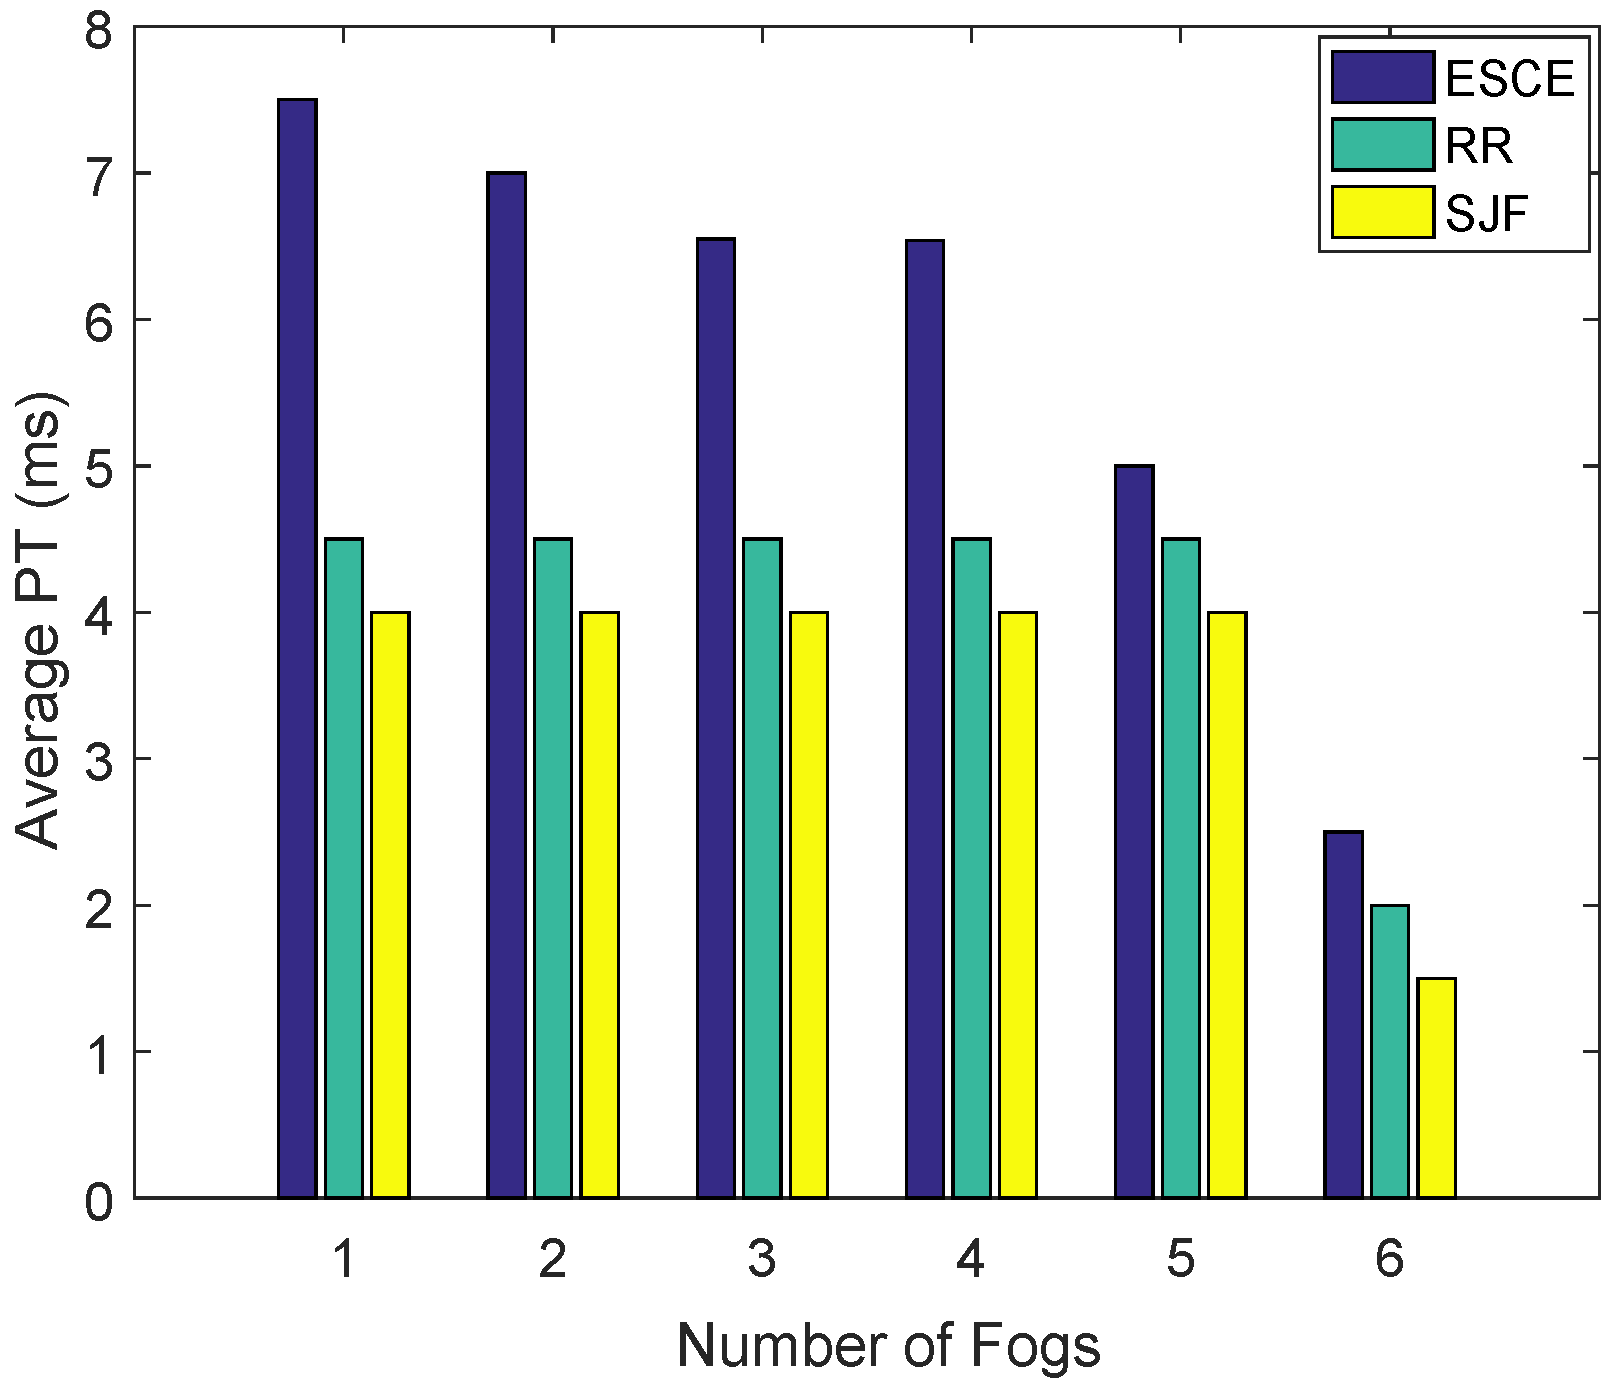
After discussing the RPH and RT, PT of the proposed framework is computed which is shown in
Figure 19. The PT for all fogs is computed as: 6 ms, 3 ms, and 2.5 ms for fog 1; 5.5 ms, 3 ms and 2.5 ms for fog 2; 5.15 ms, 3 ms, and 2.5 ms for fog 3; 5.15 ms, 3 ms and 2.5 ms for fog 4; 3.5 ms, 3 ms and 2.5 ms for fog 5; and 1.5 ms, 1 ms and 0.75 ms for fog 6. In this case, previous algorithms compromise the performance where SJF performs efficiently using the storage devices. SJF outperforms ESCE and RR up to: 59% and 50% for fog 1; 55% and 50% for fog 2; 52% and 50% for fog 3; 52% and 50% for fog 4 which is similar to fog 3; 29% and 3% for fog 5; and 50% and 25% for fog 6, respectively.
The total system cost is shown in
Figure 20. It improves the cost up to 15% of the scenario
1(2) by installing the battery storage resources and by considering the electric vehicles.
4.3. Critical Analysis
After conducting the simulations of the proposed framework, the following pros and cons are analysed from the fog and cloud integrated environment, scheduling algorithms and their performance parameters’ effects.
The idea of fog is used for minimizing the latency; however, it has minimum resources which requires more alternatives.
After conducting the simulations of the proposed algorithm, it is observed that it minimizes the latency. On the other hand, it utilizes more resources which may be a burden to the whole system.
Using the scenarios 1(2) and 2(2), although more of the system’s resources increase the PT and RT of the system, they also increase the overall system cost.
The RT and PT of the system increase 50% more efficient performance in scenarios 1(2) and 2(2) as compared to the performance of scenario I; however, they compromise the MG and data transfer cost.
5. Conclusions, Future Work and Future Challenges
A C2F2C based framework has been proposed and implemented for intelligently allocating the resources in the residential buildings. This framework is based on three layers where consumers’ requests have been considered constant for every hour of a day. Two control parameters: clusters of buildings and load requests are considered from any region. Whereas the performance parameters are RPH, RT, PT and the cost (i.e., VMs, MGs and data transfer). The optimization of these parameters have been performed by the SJF, ESCE and RR algorithms in this study. Two scenarios are considered for simulations: resource allocation using MGs and resource allocation using MGs, electric vehicles and power storage resources. Each scenario is further categorized into two other scenarios: one DC with 25 VMs and two DCs with 50 VMs. The performance of the proposed framework has increased, i.e., 50% in scenarios 1(2) and 2(2) as compared to the scenarios 1(1) and 2(1) in terms of RT and PT. Tradeoff occurs in the PT, as our system has processed and received more requests and it takes a lot of time to process the consumers’ demands. In scenarios 1(2) and 2(2), tradeoff occurs in cost due to maximum resource utilization using proposed algorithm. Simulation results also show that our technique has outperformed the prior techniques in terms of the aforementioned parameters as shown in the simulation section.
We described a C2F2C framework with simulations to support our idea. We believe that there are many other modern solutions; e.g., use of SDNs or blockchain that could replace the role of the cloud. This is one of our future interests.
For substantiating the implications of this study, the following future challenges need to be tackled intelligently.
How can individual appliances be made smarter in order to maintain the comfort level of consumers in any region using the proposed framework?
How can the PT be improved by increasing the number of requests?
How will cost be optimized using the multiple resources as considered in scenarios 1(2) and 2(2)?
Which strategies will be applicable for optimizing the tradeoffs of this work, i.e., tradeoffs between PT, RT and cost?
What will be the effects of multi-objective optimization for mitigating the existing work’s tradeoffs?
What will be the effects of this framework on energy management if it will be investigated with the big data analytics along with other techniques?

 ,
, 


