Communication

Snapshot of Photovoltaics—February 2019 †

by
Arnulf Jäger-Waldau
European Commission, Joint Research Centre (JRC), Via E. Fermi 2749, I-21027 Ispra (VA), Italy
The scientific output expressed is based on the current information available to the author, and does not imply a policy position of the European Commission.
Energies 2019, 12(5), 769; https://doi.org/10.3390/en12050769
Submission received: 8 February 2019 / Accepted: 19 February 2019 / Published: 26 February 2019
(This article belongs to the Special Issue Photovoltaic and Wind Energy Conversion Systems)

Abstract

:
Over the last two decades, grid-connected solar photovoltaic (PV) systems have increased from a niche market to one of the leading power generation capacity additions annually. In 2018, over 100 GW of new PV power capacity was added. The annual PV capacity addition in 2018 was more than the total cumulative installed PV capacity installed until the mid of 2012. Total installed PV power capacity was in excess of 500 GW at the end of 2018. Despite a 20% decrease in annual installations, China was, again, the largest market with over 44 GW of annual installations. Decentralized PV electricity generation systems combined with local battery storage have substantially increased as well.

1. Introduction

The urgent need for a de-carbonization of the power sector was stressed again during the 24th session of the Conference of the Parties (COP24) meeting in Katowice, Poland in December 2018. In 2015, the average CO2 emission per kWh of electricity was about 506 g globally [1]. The World Energy Outlook 2017 New Policy Scenario of the International Energy Agency (IEA) predicts that those emissions should decrease to 325 g CO2/kWh by 2040. The situation looks somewhat better in Europe. There, the emissions per kWh of electricity should decrease form 344 g CO2/kWh in 2016 to roughly 150 g CO2/kWh in 2040. However, such a decrease is still not sufficient for the necessary reduction of CO2 emissions. To honor the Paris Agreement, a maximum of 65 g CO2/kWh is allowed [2]. The only scenario that meets this requirement is the Sustainable Development Scenario. Under this scenario the emissions from electricity production in Europe have to decrease to 45 g CO2/kWh.
The crucial role of solar photovoltaics (PVs) to achieve this goal in a cost-effective manner was outlined in a number of 100% renewable energy source (RES) scenarios. Solar PV power generation has the potential to increase from about 600 TWh (2.4%) in 2018 to 6300 TWh (22%) in 2025, and surpassing 40,000 TWh (up to 70%) in 2050 [3]. To achieve such ambitions, the corresponding PV power capacities have to increase from slightly more than 500 GW at the end of 2018 to more than 4 TW by 2025, and to 21.9 TW by 2050 world-wide. This requires a growth of the annual market from slightly over 100 GW in 2018 to a few hundred GW thereafter.
Over the last two decades, the growth dynamics of PV deployment has changed from government driven incentive programs to market driven investment decisions. Besides the financial aspects and changing political framework conditions, the rapid growth was made possible by thorough technology achievements. Major achievements in material and solar cell research, and progress in manufacturing technology, have made the transition possible. Environmental and health concerns over the use of fossil energy sources, the increased volatility and upward pressure of fossil energy prices, and the commitment of many countries to the Paris Agreement are all adding momentum to it.

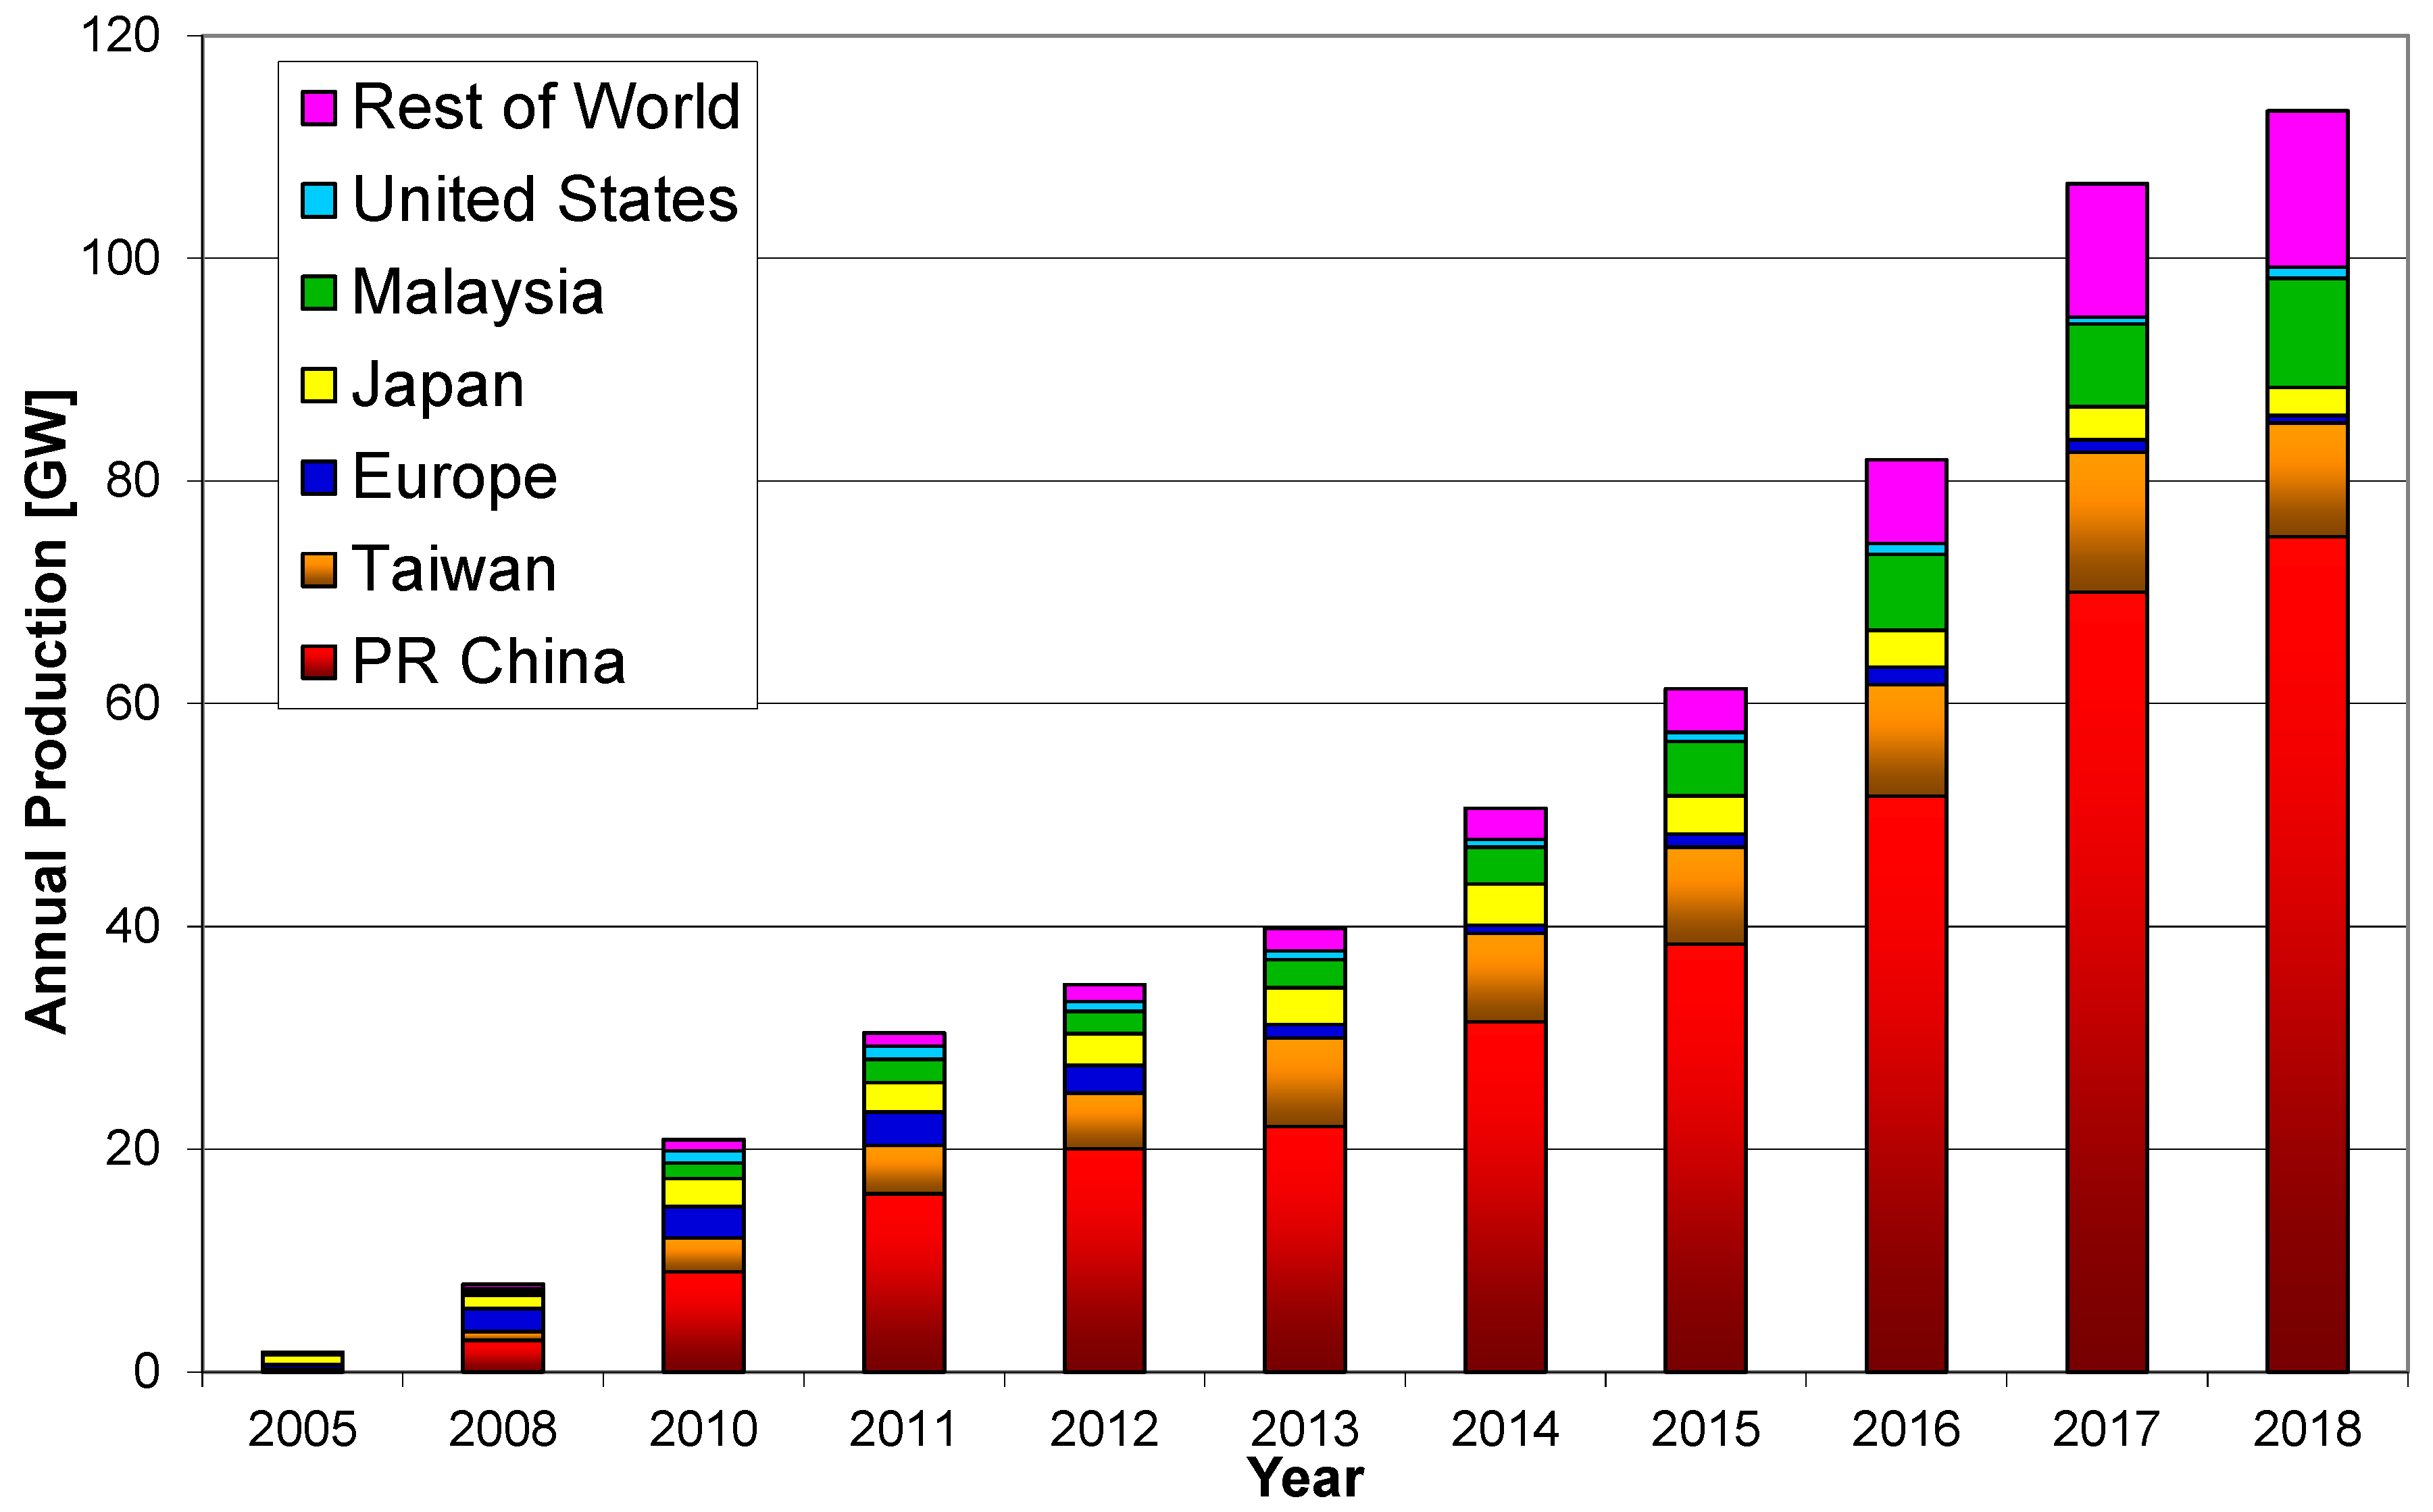
2. Photovoltaic Solar Cell Production

Reports of global solar cell production in 2018 vary between 110 GW and 120 GW. As more and more companies go private, manufacturing data collection gets more complicated. In addition, there is no common reporting format. Only a few companies report production figures, whilst others report shipment or sales figures. This explains the considerable uncertainty in this data.
Manufacturing data for this communication were collected through public stock market reports, commercial market reports, as well as through personal contacts. The different data sets were then compared, and this resulted in an estimate of 113 GW produced in 2018 (Figure 1). This corresponds to an annual increase of about 7% compared to 2017.
Production Statistics Uncertainties:
  • Solar cell or thin film module production data are reported by a few companies only.
  • Products in stock, but produced in the previous year, can be included in shipment data.
  • The report of “solar products” in the shipment figures, which is often used, in general does not differentiate between the different products like wafers, cells, or modules.
  • The risk of double counting has increased with the major uptake of original equipment manufacturing (OEM).
Solar system hardware prices have declined by over 80% over the last two decades. Over the last 10 years the Levelized Cost of Electricity (LCoE) benchmark has decreased by over 75% to USD 69/MWh. These developments were made possible by the rapid increase of countries embracing solar energy, and the rapid growth of the PV manufacturing industry in China after 2005. However, the consequence was not only a massive market growth, but a severe price pressure, which resulted in a major consolidation in the PV manufacturing industry [4]. Despite a significant number of bankruptcies and low profit margins in the manufacturing part of the PV value chain, there is a significant number of new market entrants.
One of the fastest growing companies is Tongwei Solar. The company was set up just six years ago in 2013 as part of the Tongwei Group. The latter is a private company that has its core business in agriculture and new energy. In 2011, Tongwei Group and the Xinjiang Government agreed on an integrated PV strategic cooperation project. This project included the setup of a 50,000 ton solar-grade polysilicon plant, a 3 GW manufacturing capacity for solar wafers and solar cells, and last but not least, 5 solar power plants. In 2018, Tongwei Solar reported an increase of its annual production capacity to 80,000 tons of polysilicon, and 12 GW for solar cells and solar modules. With a polysilicon production of about 17,000 tons and solar cell shipments of 3.85 GW, the company has already ranked 6th for both products in 2017 [4].
Overall, there are still new capacity announcements, which will increase the total manufacturing capacity significantly. The rational for these expansion plans are the expectations of an annual 40 to 50 GW market in China, a continuation of market growth in India, and new markets in Africa, the Middle East, and South America. Further manufacturing cost reductions are expected through Manufacturing 4.0 factories, improved solar cell efficiencies, and reduced material consumption along the whole cell and module manufacturing process. PV manufacturers with older production equipment are suffering the most as they have to compete with new entrants, which have the advantage of a lower manufacturing capital expenditure (CAPEX) and higher efficiency products. For example, CAPEX in 2018 for a polysilicon plant with an annual production capacity of 10,000 tons has decreased by 90%, compared to the USD 1.5 billion in 2006–2007. Electricity represents about 20% to 40% of wafer and polysilicon production costs; therefore, the industry is looking for manufacturing sites with the lowest costs. This can be seen in China. The country’s northwestern and southwestern regions have attracted major investments in new manufacturing plants for polysilicon and wafers due to the fact that power prices can be up to 90% lower than in the Eastern coastal regions [5].
The overall number of jobs in solar photovoltaic electricity will significantly increase in line with the expanding PV markets. However, most of the jobs will be downstream in the value chain. The main reason for this development is the increasing implementation of manufacturing 4.0 with a low workforce for solar cell and module manufacturing.

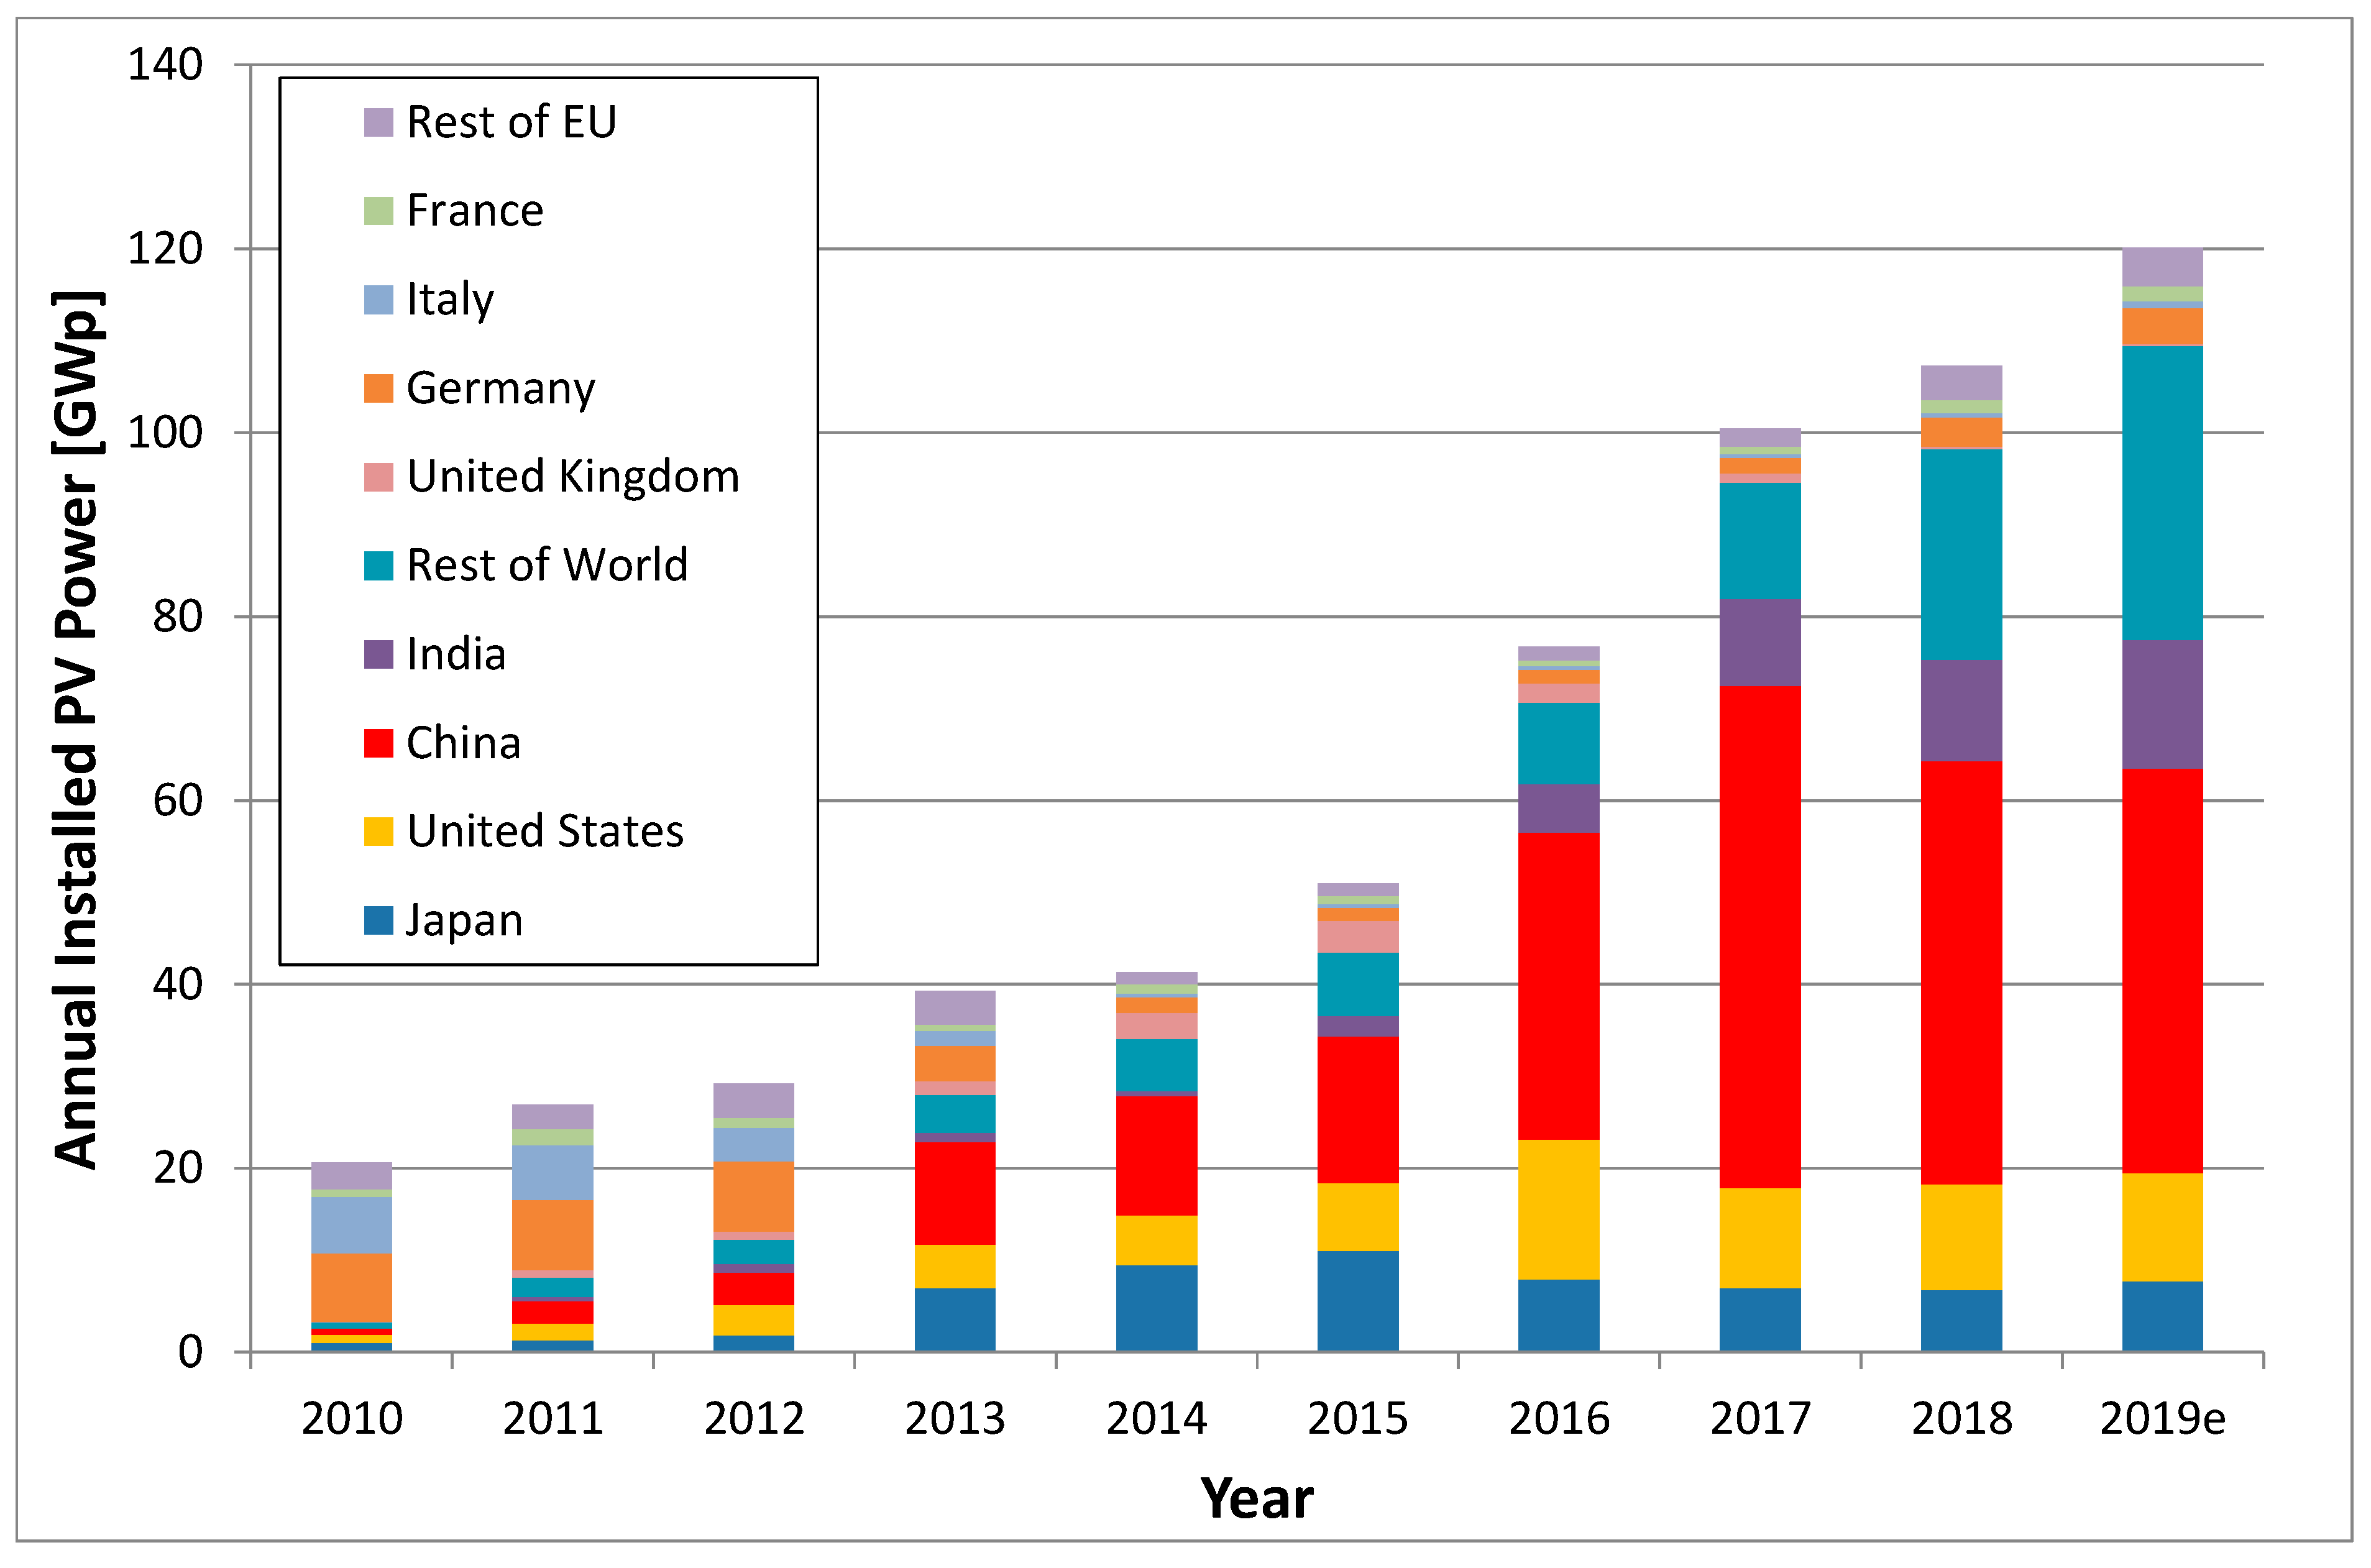
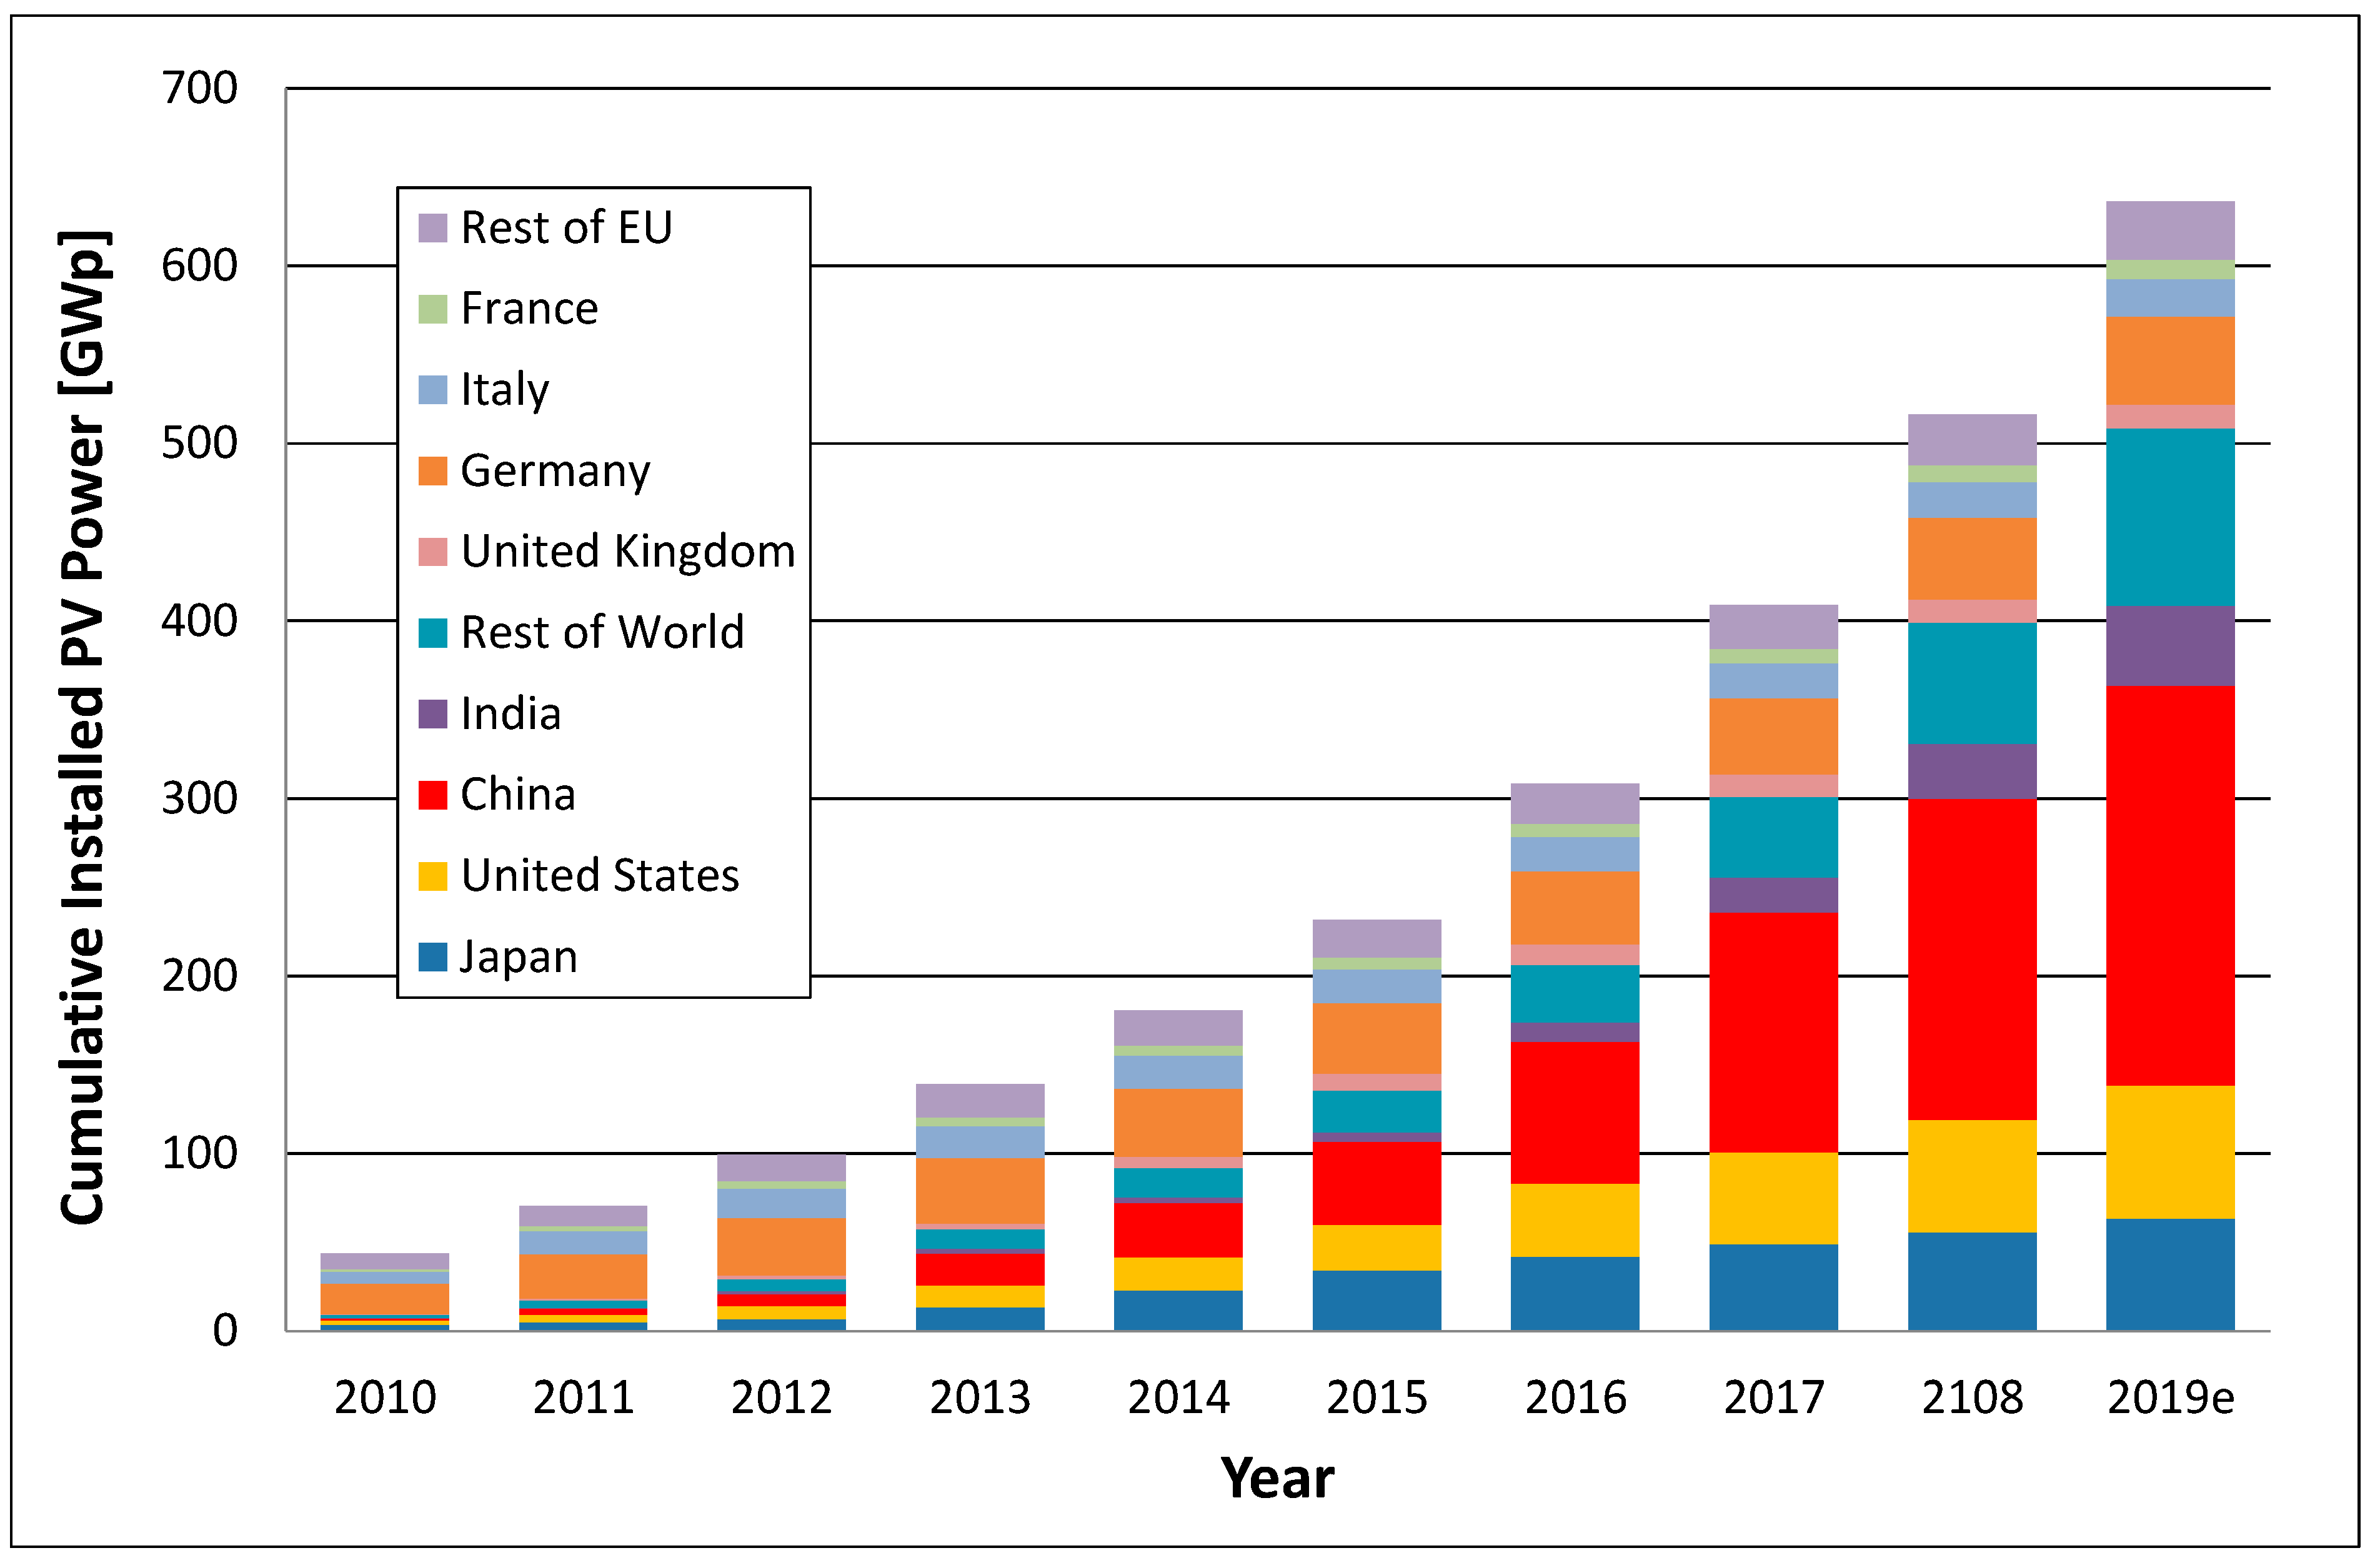
3. Solar PV Electricity generation and Markets

Since 2009, the weighted benchmark levelized costs of electricity (LCOE) for non-tracking crystalline silicon PV systems has decreased from about USD 225/MWh in the first half of 2009 to USD 60/MWh in the second half of 2018 [6,7]. This corresponds to a reduction of almost 75% over the last decade.
Actual electricity generation costs from photovoltaic systems depend on various factors like solar radiation, type of system, fixed operation and maintenance (O&M) costs, as well as finance conditions, which can differ significantly from country to country. In the second half of 2018, the range of LCoE for non-tracking systems varied between USD 38/MWh and USD 147/MWh, and between USD 41/MWh and USD 83/MWh for 1-axis tracking systems [7].
The prices for Power Purchase Agreements (PPA) can be even lower, especially in sunnier regions of the world with low financing costs. An example of the importance of stable and low-cost financing conditions is the result of the PV tender in Senegal, where the projects will be financed under the International Finance Corporation (IFC)-backed Scaling Solar initiative [8]. In April 2018, Senegal’s Commission de Régulation du Secteur de l’Electricité (CRSE) announced the tender results to build two 60MW solar PV plants. The winning bids were EUR 38.026/MWh and EUR 39.83/MWh (USD 43.28/MWh and USD 45.33/MWh).
Despite a decrease of investments in solar energy to USD 130.8 billion (−24%), the annual installations modestly increased, by about 10%, to 109 GW in 2018 (Figure 2) [9]. The reasons for the decline were the lower capital costs for solar photovoltaic systems on the one side, and a decline of the PV installations in China by roughly 20%, compared to 2017, on the other side.
Most, but not all, market analysts expect a larger growth rate in 2019. New installations are forecasted to be between 107 GW and 140 GW [9,10]. The IEA’s Renewable Energy Market Report 2018 forecasts a new photovoltaic power capacity between 575 and 720 GW that will be installed globally between 2018 and 2023 [11].
Market Statistics Uncertainties:
  • Some statistics report system hardware installations, others report the actual connection to the grid or the start of electricity delivery. Missing grid capacities or administrative reasons have a major impact on the later.
  • The installation figures in this communication report the physical installation of the PV system.
  • Capacity figures can either be reported in nominal DC peak power (Wp) under standard test conditions (1000 W irradiance, air mass 1.5 light spectrum, and 25 °C device temperature) or utility peak AC power. In some statistics, both capacities are sometimes mixed, e.g., Eurostat.
  • PV capacity figures in this communication are nominal DC peak power (Wp) for reasons of consistency.
  • Not all countries have official PV capacity statistics, system installations, nor sales statistics.
At the end of 2018, China was home to roughly one-third of global installed PV capacity (about 180 GW). The European Union was second with about 23% (or 117 GW), followed by the United States of America with 12% (or 63 GW) (Figure 3).
Africa: Africa has vast solar resources, and the electricity generation from solar photovoltaic systems can be twice as high in large parts of Africa compared to Central Europe. Despite these advantages, solar photovoltaic electricity generation is still limited. Solar home systems (SHS) or solar lanterns were the main applications until the end of the last decade. The statistics for these applications are extremely imprecise, or even non-existent. Major policy changes have occurred since 2012, and the number of utility-scale PV projects, which are in the planning or realization stages, have increased considerably. In 2018 about 1.6 GW of new PV capacity was installed. The main markets were Egypt (>600 MW), Algeria (>200 MW), and Rwanda (180 MW).
Total African (documented) operational PV power capacity was close to 4.5 GW by the end of 2018. For 2020, the targeted capacity is currently in excess of 10 GW.
Asia and Pacific Region: Despite the 20% decrease in new photovoltaic electricity system installations in China, the market remained almost stable due to significant market increases in Australia, India, and South Korea, as well as market uptakes in a number of countries in the Middle East and Southeast Asia. With over 44 GW, China was, again, the largest market, followed by India with almost 11.7 GW, Japan with over 6.7 GW, and Australia at 3.8 GW. For 2019, a slight increase to about 80 GW could be possible under stable policy conditions.
European Union: On 14 June 2018, the negotiators from the Commission, the European Parliament, and the Council reached a political agreement regarding the increase of renewable energy use in the European Union [15]. The new, renewable energy target for the EU for 2030 was set at 32%. However, this target is only binding for the EU as a whole, not on Member State levels. The revised renewable energy directive, which included a review clause by 2023 for an upward revision of the EU-level target, was published on 21 December 2018 [16].
After its peak in 2011, when PV installations in the EU accounted for 70% of worldwide installations, six years of market decreases and stagnation followed [17]. This trend was finally reversed when the PV market in the European Union increased almost 50%, from about 6 GW in 2017 to 8.8 GW in 2018. The increase was due to stronger than expected markets in Germany (3.1 GW), the Netherlands (1.4 GW), France (>1 GW), and Hungary (>0.5 GW).
In November 2018, the European Commission published its Vison for 2050, A Clean Planet for All, which outlined that the use of renewable energy sources has to exceed 60% by 2050 to reach an average increase of 1.5 °C, or net zero emissions [18]. To meet the EU’s new energy and climate targets for 2030, Member States were required to prepare and submit by the end of 2018 a National Energy and Climate Plan (NECP) for the period from 2021 to 2030.
Americas: Markets in North and South America increased by over 25% and added about 17.5 GW of new solar photovoltaic power in 2018. The three largest markets were the USA (11.4 GW), Mexico (2.5 GW), and Brazil (1.5 GW). The number of countries embracing solar photovoltaic energy in Central and South America is increasing, and six countries had a PV market larger than 100 MW in 2018.

4. Conclusions

There is a general consensus amongst investment and energy analysts that solar photovoltaic energy will continue to grow faster than the overall energy demand in the coming years. Various industry associations, as well as Bloomberg New Energy Finance (BNEF), the European Renewable Energy Council (EREC), the Energy Watch Group with Lappeenranta University of Technology (LUT), Greenpeace, and the International Energy Agency have all published scenarios showing the possible growth of PV power capacity [19,20,21,22,23]. In Table 1 the numbers of the different scenario studies are compared. An interesting development can be observed looking at the IEA scenarios, which show a significant increase from the 2016 to 2018 scenario. However, IEA expectations are still at the lower end.
With forecasted world-wide new installations between 270 and 310 GW in 2019 and 2020, only the 100% RES Power Sector scenario for 2020 is out of reach [9]. Global solar electricity production in 2018 was around 600 TWh and could reach 1000 TWh (or 4%) by 2020.

Funding

This research received no external funding.

Conflicts of Interest

The author declares no conflict of interest.

References

  1. International Energy Agency. CO2 Emissions from Fuel Combustion; International Energy Agency: Paris, France, 2017; ISBN 978-92-64-27819-6. [Google Scholar]
  2. International Energy Agency. World Energy Outlook 2017; International Energy Agency: Paris, France, 2017; ISBN 978-92-64-28230-8. [Google Scholar]
  3. Breyer, Ch.; Bogdanov, D.; Aghahosseini, A.; Gulagi, A.; Child, M.; Oyewo, A.S.; Farfan, J.; Kristina Pasi Vainikka, S. Solar photovoltaics demand for the global energy transition in the power sector. Prog. Photovolt. Res. Appl. 2017, 1–19. [Google Scholar] [CrossRef]
  4. Jäger-Waldau, A. PV Status Report 2018; Publications Office of the European Union: Luxembourg, 2018; ISBN 978-92-79-97466-3. [Google Scholar]
  5. Hwang, A. Solar Wafer Production to See Over-Capacity by Year-End 2018. DIGITIMES, 9 January 2018. [Google Scholar]
  6. New Energy Finance. Q3 Levelised Cost of Energy Outlook; EU: Brussels, Belgium, 2009. [Google Scholar]
  7. Bloomberg New Energy Finance. 2H 2018 LCOE Update: PV; EU: Brussels, Belgium, 2018. [Google Scholar]
  8. Scaling Solar Senegal, Latest Tender Results. 3 April 2018. Available online: http://www.finergreen.com/wp-content/uploads/2017/04/18-04-06-Senegal-Scaling-Solar-Tender-Results.pdf (accessed on 21 February 2019).
  9. Bloomberg New Energy Finance. 4Q 2018 Global PV Market Outlook; EU: Brussels, Belgium, 2018. [Google Scholar]
  10. Solar Power Europe. Global Market Outlook for Solar Power 2018–2022; Solar Power Europe: Brussels, Belgium, 2018. [Google Scholar]
  11. International Energy Agency. Renewable Energy Market Report 2018—Market Trends and Projections to 2023; International Energy Agency: Paris, France, 2018; 210p, ISBN 978-92-64-30684-4. [Google Scholar]
  12. Solar Power Europe. Global Market Outlook for Photovoltaics; Solar Power Europe: Brussels, Belgium, 2018. [Google Scholar]
  13. Masson, G.; Kaizuka, I.; Lindahl, J.; Jaeger-Waldau, A.; Neubourg, G.; Ahm, P.; Donoso, J.; Tilli, F. A Snapshot of Global PV Markets—The Latest Survey Results on PV Markets and Policies from the IEA PVPS Programme in 2017. In Proceedings of the 2018 IEEE 7th World Conference on Photovoltaic Energy Conversion, WCPEC 2018—A Joint Conference of 45th IEEE PVSC, 28th PVSEC and 34th EU PVSEC, Waikaloa, HI, USA, 10–15 June 2018; Article number 8547794. pp. 3825–3828. [Google Scholar] [CrossRef]
  14. EurObserverPhotovoltaic Energy Barometer 2018. In Systèmes Solaires, le Journal du Photovoltaique; PE Barometer: London, UK, 2018.
  15. European Commission Statement/18/4155. 14 June 2018. Available online: http://europa.eu/rapid/press-release_STATEMENT-18-4155_en.htm (accessed on 30 January 2019).
  16. DIRECTIVE (EU) 2018/2001 of the European Parliament and of the Council of 11 December 2018 on the Promotion of the Use of Energy from Renewable Sources (Recast). Off. J. Eur. Union 2018, 328, 82–209.
  17. De Santi, G.; Jäger-Waldau, A.; Taylor, N.; Ossenbrink, H. Realizing solar power’s potential in the European Union. Philos. Trans. R. Soc. A 2013. [CrossRef] [PubMed]
  18. European Commission Communication. A Clean Planet for all—A European Strategic Long-Term Vision for a Prosperous, Modern, Competitive and Climate Neutral Economy; European Commission Communication: Brussels, Belgium, 2018. [Google Scholar]
  19. Greenpeace International; European Renewable Energy Council (EREC); Global Wind Energy Council (GWEC). Energy [R]evolution, 5th Edition 2015 World Energy Scenario, October 2015. Available online: http://www.greenpeace.org/international/en/publications/Campaign-reports/Climate-Reports/Energy-Revolution-2015 (accessed on 21 February 2019).
  20. Ram, M.; Bogdanov, D.; Aghahosseini, A.; Oyewo, A.S.; Gulagi, A.; Child, M.; Fell, H.-J.; Breyer, C. Global Energy System Based on 100% Renewable Energy—Power Sector; Lappeenranta University of Technology: Lappeenranta, Finland, 2017. [Google Scholar]
  21. Bloomberg New Energy Finance. New Energy Outlook 2018; EU: Brussels, Belgium, 2018. [Google Scholar]
  22. International Energy Agency. World Energy Outlook; International Energy Agency: Paris, France, 2016; ISBN 978-92-64-26495-3. [Google Scholar]
  23. International Energy Agency. World Energy Outlook; International Energy Agency: Paris, France, 2018; ISBN 978-92-64-30677-6. [Google Scholar]
Figure 1. World photovoltaic (PV) cell/module production from 2005 to 2018.
Energies 12 00769 g001
Figure 2. Annual photovoltaic installations from 2010 to 2019 (data source: [12,13,14], and own analysis).
Energies 12 00769 g002
Figure 3. Cumulative photovoltaic installations from 2010 to 2019 (data source: [12,13,14], and own analysis).
Energies 12 00769 g003
Table 1. Projected evolution scenarios of the world-wide cumulative solar electrical capacities through 2040.
Year2018
[GW]
2020
[GW]
2025
[GW]
2030
[GW]
2040
[GW]
Actual Installations516----
Greenpeace (reference scenario)-332413494635
Greenpeace (advanced [r]evolution scenario)-844200037256678
LUT 100% RES Power Sector-11683513698013,805
BNEF NEO 2018-759135321444527
IEA New Policy Scenario 2016-4817159491405
IEA 450 ppm Scenario 2016 *-51781412782108
IEA New Policy Scenario 2018 *-665110915892540
IEA Sustainable Development Scenario 2018 *-750147223464240
Note: * 2025 value is interpolated, as only 2020 and 2030 values are given.

