Abstract
Due to the multiple benefits on energy, well-being, comfort, and the economy, the utilization of daylight remains an imperative topic of architectural design. With the remarkable ability of drawing and increasing daylight deep into the core of buildings, atriums with a large proportion of glazing have become one of the most preferred design forms. The concomitant and unexpected visual discomfort in modern buildings, however, has drawn increasing concerns. Therefore, this study investigated the relation between glazing proportion and daylight performance, as well as the impact of building height and atrium types on daylight performance in atrium buildings by using an annual dynamic simulation method and metrics. It was found that extending glazing proportion had prominent effectiveness in the enhancement of daylighting; building height had a negative influence; round and square types of buildings performed much better than rectangular ones. Moreover, to inform a practical design, we analyzed the link between increasing daylight and visual comfort from the perspective of balancing them, and then proposed a design guide for atrium roof-glazing sizing.
1. Introduction
The benefits and advantages of daylighting, including energy saving, health improvement, and cost saving, have been verified by a number of previous studies [1,2,3,4,5,6,7,8,9]. Southern California Edison produced a survey in 2008 and reported that sufficient utilization of daylight could produce a 6% and 80% range of energy saving for office spaces [1]. Moreover, daylighting improves productivity and sales [1,2]. One of the studies from the Center for Building Performance and Diagnostics at Carnegie Mellon University identified that better-lighting environments could create 0.7%–23% productivity gains, and a 40% increase in sales [1]. Enhancing daylighting is also a fundamental strategy for sustainable building design [3,10].
Atrium buildings firstly emerged in the 19th century [10]. The Chartered Institution of Building Services Engineers (CIBSE) [11] defines atriums as an interior space enclosed by building walls that permit the entry of daylight, linking spaces from transparent openings on the roof or sides. Thus, an atrium can draw daylight to both interior and adjacent spaces and provide better connections to interior spaces [12]. These features make atriums a ubiquitous architectural component, used in various building types [4,10,11,13,14,15], and it has been increasingly seen from modern commercial buildings [1,13]. However, acquiring daylighting from atriums has one recognized problem: the daylight amount received by each floor of a building significantly varies. Spaces on the upper floors are usually overlit and suffer from visual discomfort, whereas lower floors cannot receive sufficient daylight [12,15,16]. Regarding this concern, CIBSE reported in Lighting Guide 10 [16] that further strategies are required to balance the issues of overlighting on the upper floors and insufficient daylight on the lower floors in atrium building design.
To evaluate and strategically optimize the complex daylight performance of an atrium building, a number of studies [11,12,15] investigated and reached some conclusions on determined interior elements. They can be categorized into four aspects: (1) roof fenestration system, (e.g., type, glazing size, and transmittance), (2) atrium geometry, volume, and shape, (3) optical properties of atrium enclosing surfaces, and (4) optical properties of the surfaces of adjoining spaces. Mohsenin and Hu [13] stated that the functions of the atrium well index (WI), atrium type, and aperture type in daylighting performance have been well-studied, but the impact of roof-glazing size is still rarely studied. Furthermore, by reviewing the current daylighting guides, for example, the CIBSE Lighting Guide 10: Daylighting [16], it was found that, although they contain sections about roof light and atriums, they do not provide details on how to size up roof glazing. In addition, with the development of rating systems, design teams greatly tend to use them as design guides [17]. However, rating systems such as Leadership in Energy and Environmental Design (LEED) were originally developed to provide a framework for building-performance assessment. They merely provide a threshold to pass or achieve credits without offering guidance for design decision-making [3]. A survey conducted by Galasiu and Reinhart on current daylighting design practices showed that professionals of daylighting design are still using rules of thumb. Design guides, especially for complex scenarios with atriums, are still lacking [18].
To explore the complicated daylighting performance, four assessing methods were commonly used in previous studies: full-scale models, scale models, mathematical models, and computer simulations [5,16,19,20,21,22]. Among these methods, full-scale models produce the most reliable and practical results, but they are only applicable for existing buildings, with nonchangeable building parameters, such as shape, height, size, and key element form [5,16]. Scale models are much easier to build, but technical issues, along with scaling in geometry, material choice, and furniture, limit their accuracy [5,16]. Some research uses mathematical formulas to calculate the results, but verification of the calculation process is challenging, and the work is usually huge [5]. The computer-simulation method is currently becoming a popular tool in daylighting-performance evaluation [5,16]. Although computer simulations have limitations, such as concerns about the accuracy of the result data [23], they allow predictions on the performance of a future building at the design stage. This method also has the potential to provide dynamic predictions, which is especially useful in implementing a parametric design to evaluate the impact of different design parameters or conditions upon building performance [5,13,16,23,24,25]. The reliability of some advanced daylight-simulation tools, e.g., RADIANCE, DAYSIM, and DIVA for Rhino, have been validated and proven by comparing the simulated results with site measurements [20,26].
To evaluate daylighting performance in terms of daylight quantity and visual comfort (quality), various daylight metrics have been developed and implemented over the past few years [3,6,16,27]. To assess daylight quantity, the most commonly used method is Daylight Factor (DF). It quantifies the amount of diffuse daylight at points within a space under an overcast-sky condition [11]. However, DF disadvantages like being insensitive to climate, and building orientation and location make it unfavorable. The concept of Climate-Based Daylight Modelling (CBDM) was developed around 20 years ago [11,28]. CBDM is defined as the prediction of luminous quantity while considering the variability of sun and sky conditions, which makes it possible to quantify space daylight performance with practical weather data [28]. Accordingly, a series of CBDM metrics, such as daylight autonomy (DA) and useful daylight illuminance (UDI), were proposed to determine daylight levels and replace the use of DF [29,30,31,32]. Sustainable building rating system LEED updated its required daylighting-evaluation metric to spatial daylight autonomy (sDA) from the fourth version [3]. To assess visual comfort, discomfort glare probability (DGP) can be used to indicate the level of visual discomfort from glare [9,33,34], but the limitations are still noticeable. For example, the calculation of DGP is complex, needing luminance values that are difficult to acquire [35]. Moreover, calculation has to be based on a specific time point and sky condition [34]. Though some prediction tools could provide annual DGP calculation, it uses an approach of closing ambient calculation and repeating the point-in-time calculation for each hour of a year, which is time-consuming [32,34]. Another significant barrier from a practical level is that DGP requires a certain defined scene (e.g. specific observer’s position, view direction, and furniture), which poses important challenges and difficulties for using DGP in the frame of design and optimization processes [6,34], and makes it unsuitable in cases where occupants are movable [8,35]. Moreover, according to some studies [9,35], DGP is inaccurate when there is direct sunlight or specular reflection in the space. Thus, in practical spaces with many reflective materials (e.g., glass) that may easily cause specular reflection, or in cases with large roof glazing areas that are difficult to avoid direct sunlight, DGP may not be suitable. Proposed by Rogers, DAmax indicates that illuminance equals to ten times the target illuminance of a space during the annual schedule time [9,17,30,32], which can also be used to assess daylight quality. Reinhart et al. [17] argued that it can be a criterion to measure the occurrence of direct sunlight or other potential discomfort conditions. Zomorodian and Tahsildoost [7] claimed that DAmax is a metric indicating that whether the quality of daylight in interior spaces is sufficient. Furthermore, Dubois and Flodberg [36] used DAmax as the indicator of visual comfort risk to investigate the daylighting utilization in perimeter office rooms and the design optimization of the impact elements.
Attempting to balance the issue of atrium daylighting that overlights the top floors but provides insufficient daylight at lower floors, this study investigated the impact of the roof-glazing size of atriums, atrium shapes, and building heights on building daylighting performance, and proposes an intuitional atrium roof-glazing sizing guide for making design decisions at an early stage. The investigation focused on two aspects of daylighting performance, simultaneously maximizing daylight and minimizing visual discomfort. To implement a parametric design and evaluate the contribution of different design parameters or conditions at an early design stage, the study adopted a dynamic simulation method (i.e., using DIVA for Rhino) with real weather data. CBDM metrics were used to evaluate daylighting performance based on the dynamic simulation results. This study may be seen as a first step in developing architectural guidance that seeks to provide designers with a rough reference when they are making decisions about atrium roof-glazing size in early design stages.
2. Simulation Methods
This study investigated the influence of roof-glazing size, atrium shapes, and building height on building daylighting performance. The annual dynamic simulation was conducted using DIVA for Rhino, which is a highly advanced annual daylighting modelling plug-in. Illuminance calculation is based on RADIANCE backward ray tracing techniques, which have been widely validated by previous studies [31,32]. Two illuminance-based dynamic metrics, sDA and DAmax, were chosen to indicate the quantity and visual discomfort of daylight performance.
2.1. Tested Models
Generic shapes, dimensional proportions, and fenestration systems can be seen as the three main architectural determinants to an atrium [1,15]. According to the taxonomy of the rectilinear form developed in the 1980s, atriums can be identified as four types: four-sided, three-sided, two-sided, and linear [1]. The four-sided enclosed atrium type was chosen as the study object, and three most common forms, Rectangle, Square, and Round, were taken into account (Figure 1). The roof aperture type was set to horizontal. Moreover, in all models, the atrium ground-floor area was fixed to 500 m2, and the building ground-floor area was fixed to 1500 m2. Accordingly, the plan view dimensions (length, width, or diameter) of the three atriums were 50 m × 10 m (set the length to width scale is 5:1), 22.36 m × 22.36 m, and 25.2 m in diameter. The dimensions of the three buildings were 86.6 m × 17.32 m, 38.73 m × 38.73 m, and 38.73 m × 38.73 m. Figure 1 shows the plan and 3D views of the three atrium types.
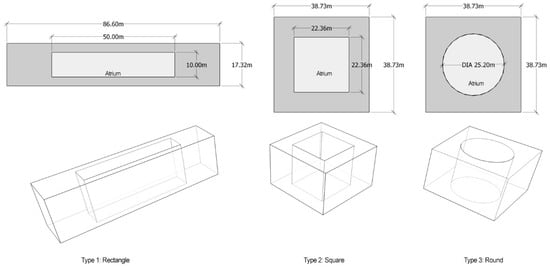
Figure 1.
Plan and 3D views of the three atrium types.
Figure 2 illustrates the 3D model section diagram by taking a square 24 m height atrium type as a sample. Because the pedestrian corridor in the atrium is an essential element of a commercial building, a 4 m wide corridor is set in each floor of the models as an important analysis part. Spaces between atrium surfaces and building facades are the adjoining spaces. All interior floors and corridors were set as the target analysis areas, which are marked with oblique lines in Figure 2.
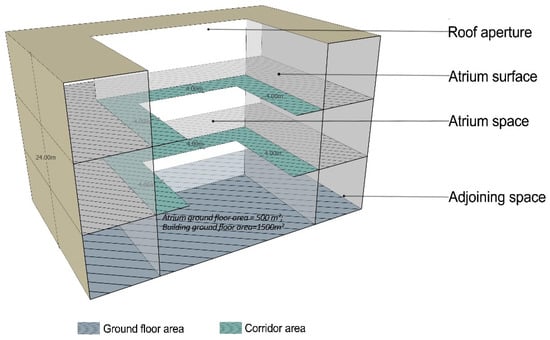
Figure 2.
Diagram of a sample model section.
The atrium roof-glazing area is expressed as the percentage of atrium-roof aperture area (equals to an atrium ground-floor area of 500 m2). The change range was set from 20% to 100% with a 20% interval. Thus, the roof-glazing area was calculated as the percentage times 500 m2. This means that, when the roof-glazing area is 100%, the atrium roof is fully glazed. When the roof-glazing area is 20%, the glazed part occupies 20% of the atrium roof. Then, the roof-glazing size of each model can be calculated based on area and shape. Five building heights, from 24 to 56 m, were also set for each atrium type. A total of 75 models were included. Table 1 shows the model information in detail.

Table 1.
Model information of Rectangle, Square, and Round atrium types.
2.2. Simulation Settings
Surface reflectance is the key factor of affecting daylight distribution in spaces. The simulation adopted generic material-surface reflectance, with the floor at 20%, outdoor walls at 35%, ceiling at 80%, and roof glazing at 65% transmittance double-glazing pane low E. The partitions between the atrium and the adjoining spaces are typically transparent glazing in a commercial building, so an 88% transmittance single-glazing pane was assumed.
To analyze the space, analysis points were set over the entire target analysis area. Since occupants in commercial buildings are mostly pedestrians, the points were set to 1.5 m height above the floor. The grid was 1.5 m × 1.5 m. Figure 3 provides the analysis point grid diagram.
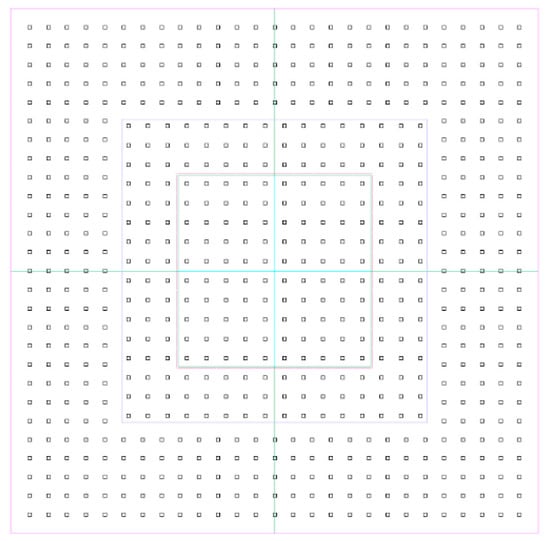
Figure 3.
Analysis point grid diagram.
By considering the real running hours of a commercial mall, the simulation schedule was designed from 10:00 to 20:00 during 365 days. In total, 3650 h were calculated for each model. Shanghai was set as the simulation location, and typical TMY3 format weather data were used [37].
2.3. Daylight Metrics
In this study, the main concerns and objectives regard both daylight quantity and visual comfort, so the two corresponding metrics were selected. With reference to the IES standard [38] and LEED reference guide [3], the sDA with a threshold of 300 lux, 50% was used to analyze daylight quantity (written as “sDA(300 lux, 50%)”). Based on the IES definition, sDA represents the annual sufficiency of interior ambient daylight levels. This is defined as the percentage of a target space area that meets the minimum daylight illuminance level for a specified fraction of operating hours per year. It is a parameter based on floor-area percentage instead of time percentage, in contrast to DA. sDA(300 lux, 50%) was then reported as the percentage of analysis points across the analysis area that meet or exceed the 300 lux value for at least 50% of the analysis period [3,34,38].
In terms of visual comfort, there is still no formal or universally accepted way to actually quantify it [39]. This study selected DAmax as the indicator of visual discomfort. DAmax was first proposed by Rogers with an acceptable limit of 5% (written as “DAmax > 5%”) [9,17]. It represents the percentage of a target space area that receives daylight illuminance over 10 times the target illuminance for a specified fraction of operating hours per year. Target illuminance was 300 lux in this study [30,32]. DAmax > 5% was then reported as the percentage of analysis points across the analysis area where illuminance is over 3000 lux (10 times 300 lux), and appeared in more than 5% of the analysis period in this study.
3. Results
3.1. Simulation Results
Table 2 illustrates all calculation results of sDA(300 lux, 50%) and DAmax > 5%, in which values represent the percentage of the analysis space area. A high result value means that the space area met the sDA(300 lux, 50%) or DAmax > 5% requirement. Thus, balancing daylight quantity and visual discomfort means maximizing sDA(300 lux, 50%) values and minimizing DAmax > 5% values. Each model creates an sDA(300 lux, 50%) value and a DAmax > 5% value. In total, 75 sDA(300 lux, 50%) values and 75 DAmax > 5% values were achieved, as shown in Table 2. Line charts were used for analysis, as follows.
Table 2.
Simulation results.
According to the above results, Figure 4 shows the relation between building height and daylight illuminance (sDA(300 lux, 50%))/visual discomfort (DAmax > 5%) in different glazing areas. The x-axis represents the atrium roof-glazing area, while the y-axis represents the sDA(300 lux, 50%) values, shown in Figure 4a, and DAmax > 5% values, shown in Figure 4b. The average values of the three atrium types were used, as shown in Figure 4, to show the overall impact of building height.
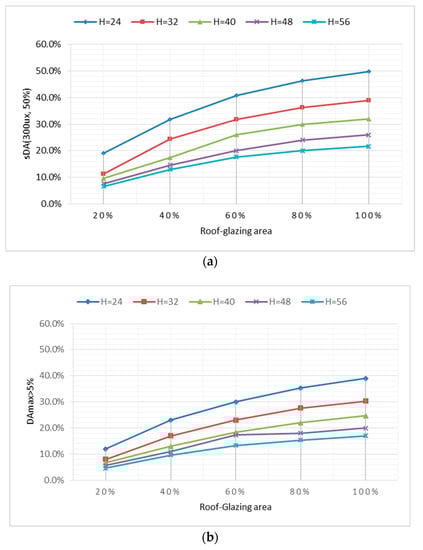
Figure 4.
Daylighting-performance comparison of building height. (a) sDA(300, 50%) values in different building heights; (b) DA_MAX > 5% values in different building heights.
With the growth of glazing proportions, it is obvious that both sDA(300 lux, 50%) and DAmax > 5% rose in all five building heights. Focusing on growth trends along the glazing proportion, they were nonlinear and tended to be flat, which indicates that the average rate of change () was reducing. The detailed calculation results of the average rate of change are shown in Table 3. Thus, growth slowed down in both sDA(300 lux, 50%) and DAmax > 5%. Moreover, by comparing differences caused by building height, it is obvious that the H = 24 m groups had the highest values in both metrics, followed by 32, 40, 48, and 56 m. This indicates that lower building height is easier to achieve more daylight. The sDA(300 lux, 50%) and DAmax > 5% values decreased with the increase of building height, and the increase of the two metrics was synchronous.
Table 3.
Average rate of change of sDA(300 lux, 50%) and DAmax > 5%.
Figure 5 indicates the impact of atrium shapes upon the amount of daylight illuminance (sDA(300 lux, 50%)) and visual discomfort (DAmax > 5%) in different roof-glazing areas. The average values of the five building heights were used to show the overall impact of atrium types. It can be seen that the sDA(300 lux, 50%) and DAmax > 5% values increased with the growth of glazing proportion in all three atrium types, but the roof-glazing area had nonlinear correlation with both sDA(300 lux, 50%) and DAmax > 5% (Figure 5). Same as the results shown in Figure 4, growth trends tended to be flat, and the average rate of change () reduced along the change of the roof-glazing areas, so growth slowed down. Moreover, when comparing the difference results from the atrium types, it was shown that the round atrium type produced the highest values in both metrics, followed by the square and the rectangular types. In addition, spacing between square atriums and round atriums is quite small, while large spacing appeared between the rectangular type and the other two. It indicates that square and round atrium types have similar daylighting performance and rectangle atrium type creates much worse daylighting performance than the other two. Besides, the increases of the two metrics are synchronous in Figure 5.
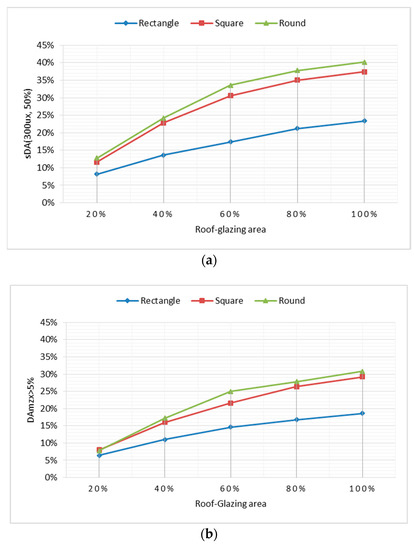
Figure 5.
Daylight performance comparison of atrium types. (a) sDA(300 lux, 50%) values in different atrium types; (b) DA_MAX > 5% values in different atrium types.
3.2. Glazing Sizing Guide
To balance the daylight quantity and visual discomfort, the key point is to figure out the relation of the increases between sDA(300 lux, 50%) and DAmax > 5%. Although the two increases are synchronous, the average rates of change of growth curves are different. Thus, the average rates of change of two metrics in different heights and atrium types are calculated. Table 3 explains the result charts. It can be seen that with the increasing of roof-glazing proportion, an intersection is generated in the most of charts. The increase of sDA(300 lux, 50%) is higher than DAmax > 5% before this intersection, and it is lower than DAmax > 5% after this intersection. This means that before the intersection, the increase of roof-glazing size creates more spaces that meet the daylight-quantity requirements than those with visual discomfort; after the intersection, the increase of roof-glazing size creates more spaces with visual discomfort than those that meet the daylight-quantity requirements. Therefore, this intersection is the critical point to attain the daylighting performance with maximum quantity and minimum visual discomfort.
Based on the above analysis, the roof-glazing area values of the intersections were calculated as roof-glazing size guidance for atrium design. Table 4 demonstrates the results, and values are presented in percentages. Designers can refer to Table 4 to define the roof-glazing size when they are designing atrium buildings. Regarding how to use this guide, an example is provided in the following: a 40 m tall atrium building is designed, and the designer decides to use a square atrium shape. The suggested roof-glazing size is 80% of the atrium-roof aperture area if referring to Table 4. For rectangular atriums, 100% of atrium-roof aperture areas are suggested to be glazed. Regarding square and round atrium types, the recommended glazing size varies with building height, and a fully glazed roof is not suggested.
Table 4.
Glazing-size guide for atriums.
This guidance can also serve as a benchmark to see whether glazing is insufficient or excessive. If the designed glazing area of an atrium roof is smaller than the recommended values, then fewer interior spaces may be able to obtain enough daylight for one year. If the designed glazing area of the atrium roof is greater than the suggested values, then designers may need to pay extra attention to visual-comfort issues, and more strategies, such as shading, lower transmittance, and high U-value glazing, may be needed to balance the issues.
4. Discussion
This study investigated building daylighting performance for different atrium-roof glazing sizes, building heights, and atrium shapes, and showed the impact of these parameters on daylighting performance. Further, we proposed atrium roof-glazing size guidance from the perspective of balancing daylight quantity and visual discomfort of indoor environments. The findings and proposed design guidance intend to provide designers with preliminary reference for the early design process when they are designing atrium roof glazing. It can be seen as the first step in developing relevant architectural guidance.
Daylighting design is a complex process. A successful design should have comprehensive consideration and integration of all corresponding parameters and technologies, including glazing properties, shading, materials, and artificial lighting-control systems. Glazing size is merely one of them, so the utilization of the proposed glazing-size guide is far from a good daylighting effect. Usually, further analyzing and assessing of the overall performance of design schemes are worthy to be considered in design.
The study still has shortcomings. For example, the proposed design guide is not sophisticated enough. The glazing change intervals could be reduced, and the range of building heights and atrium shapes could be expanded. Visual discomfort is an intricate concept that correlates with various types of factors –for example, direct sunlight, light uniformity, and physical perception. Yet this study only considers those caused by direct sunlight, which can be expanded in future work. Furthermore, shading designs and thermal effects are two other important aspects of daylighting, which could be considered for integration in future work.
Although the utilized computer-based simulation method provides an effective and efficient way to assess daylight performance in an entire year, as well as taking climate data into consideration, the required amount of effort and time is noticeable. Generally, the simulation time of generating a set of annual climate-based daylight-performance data is decided by the target areas, model complexity, monitoring nodes, schedules, and computer performance.
5. Conclusions
This study explored the influence of atrium roof-glazing size, building heights, and atrium shapes on the daylighting performance of large atrium buildings through a dynamic computer-simulation method. DIVA for Rhino was used to measure daylight performance. The following findings could be drawn:
- Increasing glazing proportion is an effective way to improve daylight in all types of models;
- Unexpected visual discomfort increases along with the increase of daylight quantity;
- Growth of daylight quantity and visual discomfort slows down with the increase of glazing areas;
- Shorter atrium buildings can draw more daylight for more spaces; and
- Round and square atrium types are superior to rectangular ones in drawing daylight to interior environments.
Based on the calculation results, an atrium roof-glazing size guide was proposed for balancing daylight quantity and visual discomfort in early-design decision making. In conclusion, the findings and proposed guide offer designers a reference when sizing atrium roof glazing. This study provides the first step in developing architectural design guidance in related fields.
The proposed guidance is based on limited model types, and this study restricts itself to taking two other closely related daylighting aspects, thermal issues and shading integration, into consideration.
Author Contributions
Conceptualization, J.L.; data curation, J.L.; formal analysis, J.L. and Q.B.; methodology, J.L.; resources, Q.B. and X.(J.)C.; software, J.L.; supervision, J.L.; validation, Q.B., X.(J.)C. and J.Y.; visualization, J.Y.; writing—original draft, J.L.; writing—review and editing, J.L., Q.B., X.(J.)C., and J.Y.
Funding
This research received no external funding.
Conflicts of Interest
The authors declare no conflict of interest.
References
- Boubekri, M. Daylighting Design: Planning Strategies and Best Practice Solution; Birkhauser Verlag GmbH: Basel, Switzerland, 2014. [Google Scholar]
- Edwards, L.; Torcellini, P. A Literature Review of the Effects of Natural Light on Building Occupants; National Renewable Energy Laboratory: Golden, CO, USA, 2002. [Google Scholar]
- U.S.G.B. Council. LEED Reference Guide for Building Design and Construction v4; U.S.G.B. Council: Washington, DC, USA, 2003; pp. 723–756. [Google Scholar]
- Samant, S.; Yang, F. Daylighting in atria: The effect of atrium geometry and reflectance distribution. Light. Res. Technol. 2007, 39, 147–157. [Google Scholar] [CrossRef]
- Wong, I.L. A review of daylighting design and implementation in buildings. Renew. Sustain. Energy Rev. 2017, 74, 959–968. [Google Scholar] [CrossRef]
- Andersen, M.; Kleindienst, S.; Yi, L.; Lee, J.; Bodart, M.; Cutler, B. An intuitive daylighting performance analysis and optimization approach. Build. Res. Inf. 2008, 36, 593–607. [Google Scholar] [CrossRef]
- Zomorodian, Z.S.; Tahsildoost, M. Assessing the effectiveness of dynamic metrics in predicting daylight available and visual comfort in classrooms. Renew. Energy 2019, 134, 669–680. [Google Scholar] [CrossRef]
- Jakubiec, J.A.; Reinhart, C.F. The ‘adaptive zone’—A concept for assessing discomfort glare throughout daylit spaces. Light. Res. Technol. 2012, 44, 149–170. [Google Scholar] [CrossRef]
- Galatioto, A.; Beccali, M. Aspects and issues of daylighting assessment: A review study. Renew. Sustain. Energy Rev. 2016, 66, 852–860. [Google Scholar] [CrossRef]
- Berardi, U.; Wang, W. Daylighting in an atrium-type high performance house. Build. Environ. 2014, 76, 92–104. [Google Scholar] [CrossRef]
- Sudan, M.; Mistrick, R.G.; Tiwari, G.N. Climate-based daylight modeling (CBDM) for an atrium: An. experimentally validated novel daylight performance. Solar Energy 2017, 158, 559–571. [Google Scholar] [CrossRef]
- Ghasemi, M.; Noroozi, M.; Kazemzadeh, M.; Roshan, M. The influence of well geometry on the daylight performance of atrium adjoining spaces: A parametric study. J. Build. Eng. 2015, 3, 39–47. [Google Scholar] [CrossRef]
- Mohsenin, M.; Hu, J. Assesing daylight performance in atrium buildings by using climate based daylight modeling. Solar Energy 2015, 119, 553–560. [Google Scholar] [CrossRef]
- Yi, R.; Shao, L.; Su, Y.; Riffat, S. Daylighting performance of atriums in subtropical climate. Int. J. Low-Carbon Technol. 2009, 4, 230–237. [Google Scholar] [CrossRef]
- Samant, S. A critical review of articles published on atrium geometry and surface reflectances on daylighting in an atrium and its adjoining spaces. Archit. Sci. Rev. 2010, 53, 145–156. [Google Scholar] [CrossRef]
- CIBSE. Lighting Guide 10: Daylighting—A Guide for Designers; CIBSE: London, UK, 2014. [Google Scholar]
- Reinhart, C.F.; Mardaljevic, J.; Rogers, Z. Dynamic daylight performance metrics for sustainable building design. Leukos 2006, 3, 7–31. [Google Scholar]
- Galasiu, A.D.; Reinhart, C.F. Current daylighting design practice: A survey. Build. Res. Inf. 2008, 36, 159–174. [Google Scholar] [CrossRef]
- Aghemo, C.; Pellegrino, A.; LoVerso, V.R.M. The approach to daylighting by scale models and sun and sky simulators: A case study for different shading systems. Build. Environ. 2008, 43, 917–927. [Google Scholar] [CrossRef]
- Chen, Y.Y.; Liu, J.; Pei, J.; Cao, X.; Chen, Q.; Jiang, Y. Experimental and simulation study on the performance of daylighting in an industrial building and its energy saving potential. Energy Build. 2014, 73, 184–191. [Google Scholar] [CrossRef]
- Li, D.H.W.; Cheung, A.C.; Chow, S.K.; Lee, E.W. Study of daylight data and lighting energy savings for atrium corridors with lighting dimming controls. Energy Build. 2014, 72, 457–464. [Google Scholar] [CrossRef]
- Kazanasmaz, T. Fuzzy logic model to classify effectiveness of daylighting in an office with a movable blind system. Build. Environ. 2013, 69, 22–34. [Google Scholar] [CrossRef]
- Xu, Y.; Su, Y.H. Daylight availability assessment and its potential energy saving estimation—A literature review. Renew. Sustain. Energy Rev. 2015, 52, 494–503. [Google Scholar]
- Sun, Y.Y.; Shanks, K.; Baig, H.; Zhang, W.; Hao, X.; Li, Y.; He, B.; Wilson, R.; Liu, H.; Sundaram, S. Integrated semi-transparent cadmium telluride photovoltaic glazing into windows: Energy and daylight performance for different architecture designs. Appl. Energy 2018, 231, 972–984. [Google Scholar] [CrossRef]
- Sun, Y.Y.; Liang, R.; Wu, Y.; Wilson, R.; Rutherford, P. Development of a comprehensive method to analyse glazing systems with Parallel Slat Transparent Insulation material (PS-TIM). Appl. Energy 2017, 205, 951–963. [Google Scholar] [CrossRef]
- Reinhart, C.; Fitz, A. Findings from a survery on the current use of daylight simulations in building design. Energy Build. 2006, 38, 824–835. [Google Scholar] [CrossRef]
- E.D. Resources. Design Brief: Understanding Daylight Metrics. Available online: https://energydesignresources.com/media/1702/EDR_DesignBriefs_daylightmetrics.pdf (accessed on 10 January 2019).
- Costanzo, V.; Evola, G.; Marletta, L.; Pistone Nascone, F. Application of climate based daylight modelling to the refurbishment of a school building in Sicily. Sustainability 2018, 10, 2653. [Google Scholar] [CrossRef]
- Sun, Y.Y.; Wu, Y.P.; Wilson, P. A review of thermal and optical characterisation of complex window systems and their building performance prediction. Appl. Energy 2018, 222, 729–747. [Google Scholar] [CrossRef]
- Yun, P. Lighting Environment Simulation of Building; China Building Industry Press: Beijing, China, 2010. [Google Scholar]
- DIVA User Guide. Available online: http://diva4rhino.com/user-guide (accessed on 23 May 2018).
- Rhino Training. Available online: http://solemma.net/TrainingRhino.html (accessed on 23 May 2018).
- Kruisselbrink, T.; Dangol, R.; Rosemann, A. Photometric measurements of lighting quality: An overview. Build. Environ. 2018, 138, 42–52. [Google Scholar] [CrossRef]
- Carlucci, S.; Causone, F.; de Rosa, F.; Pagliano, L. A review of indices for assessing visual comfort with a view to their use in optimization processes to support building integrated design. Renew. Sustain. Energy Rev. 2015, 47, 1016–1033. [Google Scholar] [CrossRef]
- Sun, Y.Y.; Wu, Y.P.; Wilson, R. Analysis of the daylight performance of a glazing system with parallelslat transparent insulation material (PS-TIM). Energy Build. 2017, 139, 616–633. [Google Scholar] [CrossRef]
- Dubois, M.C.; Flodberg, K. Daylight utilisation in perimeter office rooms at high latitudes: Investigation by computer simulation. Light. Res. Technol. 2013, 45, 52–75. [Google Scholar] [CrossRef]
- EnergyPlus-Weather Data. Available online: https://energyplus.net/weather (accessed on 25 May 2018).
- I.D.M. Committee. IES LM-83 Approved Method: IES Spatial Daylight Autonomy (sDA) and Annual Sunlight Exposure (ASE); Illuminating Engineering Society: New York, NY, USA, 2012. [Google Scholar]
- Lindelöf, D.; Morel, N. Bayesian estimation of visual discomfort. Build. Res. Inf. 2007, 36, 83–96. [Google Scholar] [CrossRef]


© 2019 by the authors. Licensee MDPI, Basel, Switzerland. This article is an open access article distributed under the terms and conditions of the Creative Commons Attribution (CC BY) license (http://creativecommons.org/licenses/by/4.0/).