1. Introduction
The European Union’s common goal is to achieve a more competitive, secure and sustainable energy system. In order to achieve get safer, more secure, sustainable and affordable energy, EU countries agreed and committed themselves to reduce greenhouse gas emissions for 40% compared to the 1990 levels, to increase the share of renewable energy to at least 27% of the overall energy consumption and to cut projected energy consumption by at least 27% until 2030 [
1]. Increasing energy efficiency in the building sector is essential for achieving the 2030 targets since buildings are responsible for 40% of EU energy consumption [
2].
The Member States were, therefore, required to set national energy efficiency targets and a range of measures in various sectors, including those related to the building sector, which contributed to achieving the overall EU energy efficiency targets. District heating systems for distributing heat generated in a centralized location for residential and commercial requirements are recognized as an important area for achieving energy efficiency within Europe. Thus, the Croatian legislation had also introduced measures to achieve rational energy consumption and savings in the heating sector. In Croatia, all multi-apartment buildings supplied by heat energy from district heating networks were legally obliged to install heat cost allocators (HCA) or individual heat meters [
3]. Individual heat meters were installed directly on the heating conductor and can precisely measure thermal energy consumption in an individual unit. On the other hand, a heat allocator is an auxiliary device that does not measure any physical parameters, but is able to estimate a proportional amount of the total heating consumption for each unit in the whole building. In older buildings, installing individual heat meters was usually not technically or economically viable and the only alternative was installing heat cost allocators.
Croatian legal provision regarding individual metering is in accordance with European regulation—in particular the European energy efficiency directive (EED) [
4]. Article 9 of the EED states that individual heating meters (if this is technically feasible) or individual heat cost allocators should be installed in multi-apartment and multi-purpose buildings with heating from central heating sources or district heating networks on each radiator, but if one of these two options is cost-efficient. There is a growing body of literature elaborating the technical feasibility or cost-efficiency of individual metering systems or HCA. Depending on the coverage, research showed that an average savings ranging between 15 and 30% of heat energy consumption could be achieved in Denmark, the Netherlands [
5], France [
6], Lithuania [
7] and Poland [
8]. Research for Sweden showed that introducing the individual metering and charging system in existing buildings would not be cost-effective [
9]. The literature also discusses and investigates the use of heat energy and estimates energy savings potential from other perspectives. Celenza et al. [
10] notice that energy savings estimations in different papers vary considerably due to different types of buildings and/or households, the level of temperature control and the frequency of consumption readings.
Some papers discuss the problem of “stolen energy” between apartments, the necessity to reallocate the heating costs between apartments and the possibilities of making corrections in transferring heat between adjacent apartments. Although HCAs should result in a more transparent and fairer system of allocation of the total heating costs between flats in multifamily buildings, the methodology for heating costs allocation between flats shows many shortcomings and often causes some households in the same building to pay more and some pay less after the HCA installation [
11]. Real heat consumption and real heat costs depend on many factors. Thus Siggleston [
11] and Michnikowski [
12] propose a change in the methodology for heat cost allocation by making corrections for heat transfer through walls between flats in the same multifamily building. Fairness in heat cost allocation between tenants is not easy to achieve also due to the “stolen energy” effect which arises from the fact that the heat transfer direction depends on the temperature difference in neighboring flats [
13] and the energy gained from pipes [
14]. The heat flow between apartments is difficult to estimate [
15].
Papers have also investigated or estimated the impact of tenant behavior on energy consumption in the USA [
16], Denmark [
17], Norway [
18,
19] and Japan [
19]. Besides building characteristics which determine almost half of the energy use, tenant characteristics and behavior determine almost 5% of the energy use for space and water heating ([
17] for Denmark).
The problem of energy inefficiency of old buildings has been identified in all EU countries. Around 35% of the building stocks in the EU are over 50 years old [
2]. Similarly, in Croatia almost 40% of multi-apartment buildings were built before 1970, while less than 20% of multi-apartment buildings were built after 1990 [
20]. There is a lack of research analyzing the effects of the installation of HCAs which compare data for the same flats in the period before and after the installation of HCA. The effects of the installation of HCAs depend on consumer behavior and their decision whether or not to decrease the indoor temperature of the apartment and thus cut the energy consumption. It is difficult to analyze the effects more precisely without any actual consumption data in the period before and after the installation of the HCAs. Estimates are further complicated by the fact that consumer behavior changes over time. This paper contributes to the consideration of the effect of HCAs installation in a way that it estimates the cost effectiveness on a large sample of flats and in different cities in Croatia. Monitoring the consumption throughout several different heating seasons in the same flats provided a pattern that allowed a neutralization of the impact of specific tenant behavior.
The paper estimates the effects of introducing the HCAs to reduce energy consumption in multi-apartment buildings that are heated through district heat systems. Based on the representative sample of Croatian heat energy users, the paper provides empirical evidence on the propensity of users to change their behavior and decrease energy consumption. In addition, the aim of the paper is to estimate the cost effectiveness of HCAs installation using the net present value methodology and actual data on energy requirements of various buildings and relative prices of heat energy and HCA equipment in Croatia. While most of the previous studies are focused on the effects of the HCA installation in highly developed economies such as Germany or Sweden, the goal of this study was to estimate the cost effectiveness of the HCA installation for an underdeveloped economy where a lower household income coupled with a significant share of heat energy costs in a family’s budget could result in more pronounced effects. While most of the previous studies were based on ex-ante analyses or case studies including a limited number of sampled buildings, a novelty of this research is in its orientation to the ex-post analyses based on actual data on heat energy consumption prior to and after the HCA installation for a large sample of buildings covering over 20% of the district heat energy users. By this approach, heterogeneity of many factors resulting in the specific energy requirements and its effects to the cost effectiveness of the HCA installation is accounted for. The study analyses effects of HCA installation in an economy where 88.8% of the households are owners of the dwelling units in which they live (while an additional 5% of inhabitants are personally related to the owner (parents, brothers and sisters etc.) and do not pay market rent. Although approximately 10% of households use the service of district heat energy (approximately 150,000 users out of the 1.5 million total number of Croatian households), in large urban areas, such as the cities covered in this study, the share of households using district heat energy is significant. For example, in Zagreb, approximately one third of the households use district heat systems as the main source of heat energy (approximately 100,000 users out of 303,000 households).
The estimation refers to the installation of a minimum set of equipment specified by the European Union Directive, which includes a heat cost allocator and a thermostatic valve on each heating element/radiator. Cost efficiency is estimated by a baseline scenario of savings, but also by additional scenarios that show a robustness of results. The estimation of heat cost allocator installation is made for eight Croatian cities, since the cost-effectiveness depends on specific parameters for each city, which is described in more detail in the methodological part of the paper.
The paper consists of four parts. After the introductory section, the second part presents the methodology and describes the data sources. The third part contains the results of estimating the cost effectiveness of the installation of HCA. The paper ends with concluding remarks.
2. Methodology and Data Sources
The cost-effectiveness of installing the heat cost allocators was assessed based on the concept of the net present value. The net present value methodology compared the initial value of the investment associated with the HCA installation and discounted the monetary value of energy savings during equipment’s life-time. Users could achieve benefits such as a decreased heat energy bill during the HCA lifetime, as result of more responsible behavior. On an annual level, the net benefits for consumers are defined as the difference between energy savings and annual operating costs. Annual costs include the costs of meter reading and equipment maintenance. In economic studies, differences in time preferences are reflected in the cost of capital and benefits expected in the future period should be discounted to the net present value using the appropriate discount factor. Assessing the cost-effectiveness depends on the initial specific energy requirements, the prices of equipment and the prices of heat energy. Most of the equipment is usually available in all regions of Croatia at a uniform unit price and the costs of the investment can vary depending on different building characteristics. Contrary, prices of heat energy delivered on local markets differ substantially which affect the estimates of the regional cost-effectiveness. The net present value analysis covers 8 cities: the City of Zagreb, Velika Gorica, Samobor, Zaprešić, Osijek, Sisak, Karlovac and Rijeka. The sum of heat energy consumed in the sampled cities represents over 97% of the total Croatian consumption of heat energy in multifamily buildings distributed by district heat energy systems.
In the decision whether or not to install HCA, property owners were primarily concerned with the financial viability of the investment. If future savings on heat energy, expressed in monetary terms, exceeds the initial investment costs of HCA installation, a rational investor would undertake the investment and vice versa. When there is a legal obligation to install HCAs, the investor’s decision is not based on the expected financial viability. Apartment owners are faced with very high sanctions if they do not comply with the legal requirements. The Croatian law prescribes that owners of dwelling units in multi-apartment buildings could be penalized with an amount which is much higher than HCA installation costs.
The total investment value besides the costs of the metering equipment also includes the costs of the thermostatic valves for effective control of the indoor temperature which were rarely applied in Croatian buildings heated by district systems before. While the costs of the HCA and thermostatic valves are based on the number of heating units and could be identified for each individual apartment, total investments for a building additionally include a central processing unit for remote impulse reading. A typical cost statement for HCA installation for each building includes items presented in
Table 1.
All the investments and operating costs of the installation of HCAs are to be covered entirely by apartment owners according to Croatian law. Possible financial losses, if costs are higher than the benefits, could cause dissatisfaction and perception of owners that such a legal obligation is unfair, despite its positive social contribution to environmental protection and the decrease in the dependence of imported energy inputs.
The European regulation on energy efficiency states that individual heat cost allocators shall be used for measuring heat consumption, unless it is shown that the installation of such heat cost allocators would not be cost-efficient. The European Commission supported the publication of Guidelines on good practice in cost-effective cost allocation and billing the individual consumption of heating, cooling and domestic hot water in multi-apartment and multi-purpose buildings [
21].
From the users’ point of view, the installation of HCAs enables them to pay only part of the thermal energy consumption which they actually consume. Information on their individual costs could induce more rational behavior resulting in energy savings. The benefits consist of a reduced heat energy bill in the future period, which are to be discounted to the net present value. The lifetime period of the equipment for individual metering is according to [
22] set at 10 years, so there is no residual value of the investment after the end of the period.
The methodological approach in this paper uses a standard formula for calculating the net present value as applied in many other studies on financial viability of the installation of HCA [
9]:
Standard symbols used are:
R0 is the initial investment in the period when the HCA are installed.
R1 to R10 are the annual net savings as a sum of the energy savings costs minus the annual operating costs: services related to the reading of devices and billing and maintenance costs.
The expected lifetime of the measure is 10 years as defined by standard [
22] and proposed by [
23].
i is the discount rate: 4% is used in the baseline scenario as suggested by [
23] and 3% in the sensitivity analysis.
The baseline scenario applies the assumption on constant relative prices of energy during the entire lifetime of HCAs. Heat energy prices in Croatia are partially controlled by a government and haven’t changes since 2012 and there hasn’t been an announcement about a potential increase in tariffs in the foreseeable future.
Beside the baseline scenario, two additional scenarios are included in order to conduct the sensitivity analysis on the potential variation of the two most important factors:
The methodology is applied on a regional level (8 cities) for a representative building, i.e., a building with the average characteristics regarding energy requirements. Additionally, the analysis is extended in the way that the estimate net present value for a variety of combinations of initial energy requirements and savings is achieved after the installation of HCA. In order to isolate the effect of the installation of HCAs from the effect of weather conditions, the data on energy consumption in different periods is normalized by using the number of heating degree days (HDD)—a measurement unit designed to quantify the demand for energy needed to heat a building. Heating degree days are defined as a number of heating days multiplied by the difference between the actual outside temperature and the agreed base interior air temperature (depending on the buildings purpose but usually set at 20 °C for residential buildings). Conventionally, the calculation of HDD includes only days when temperatures have been under 12 °C:
if
if
is the mean external temperature of day i while N is the number of days included in the period of interest (month, heating season etc.). A temperature of denotes the assumed standard internal temperature for residential objects.
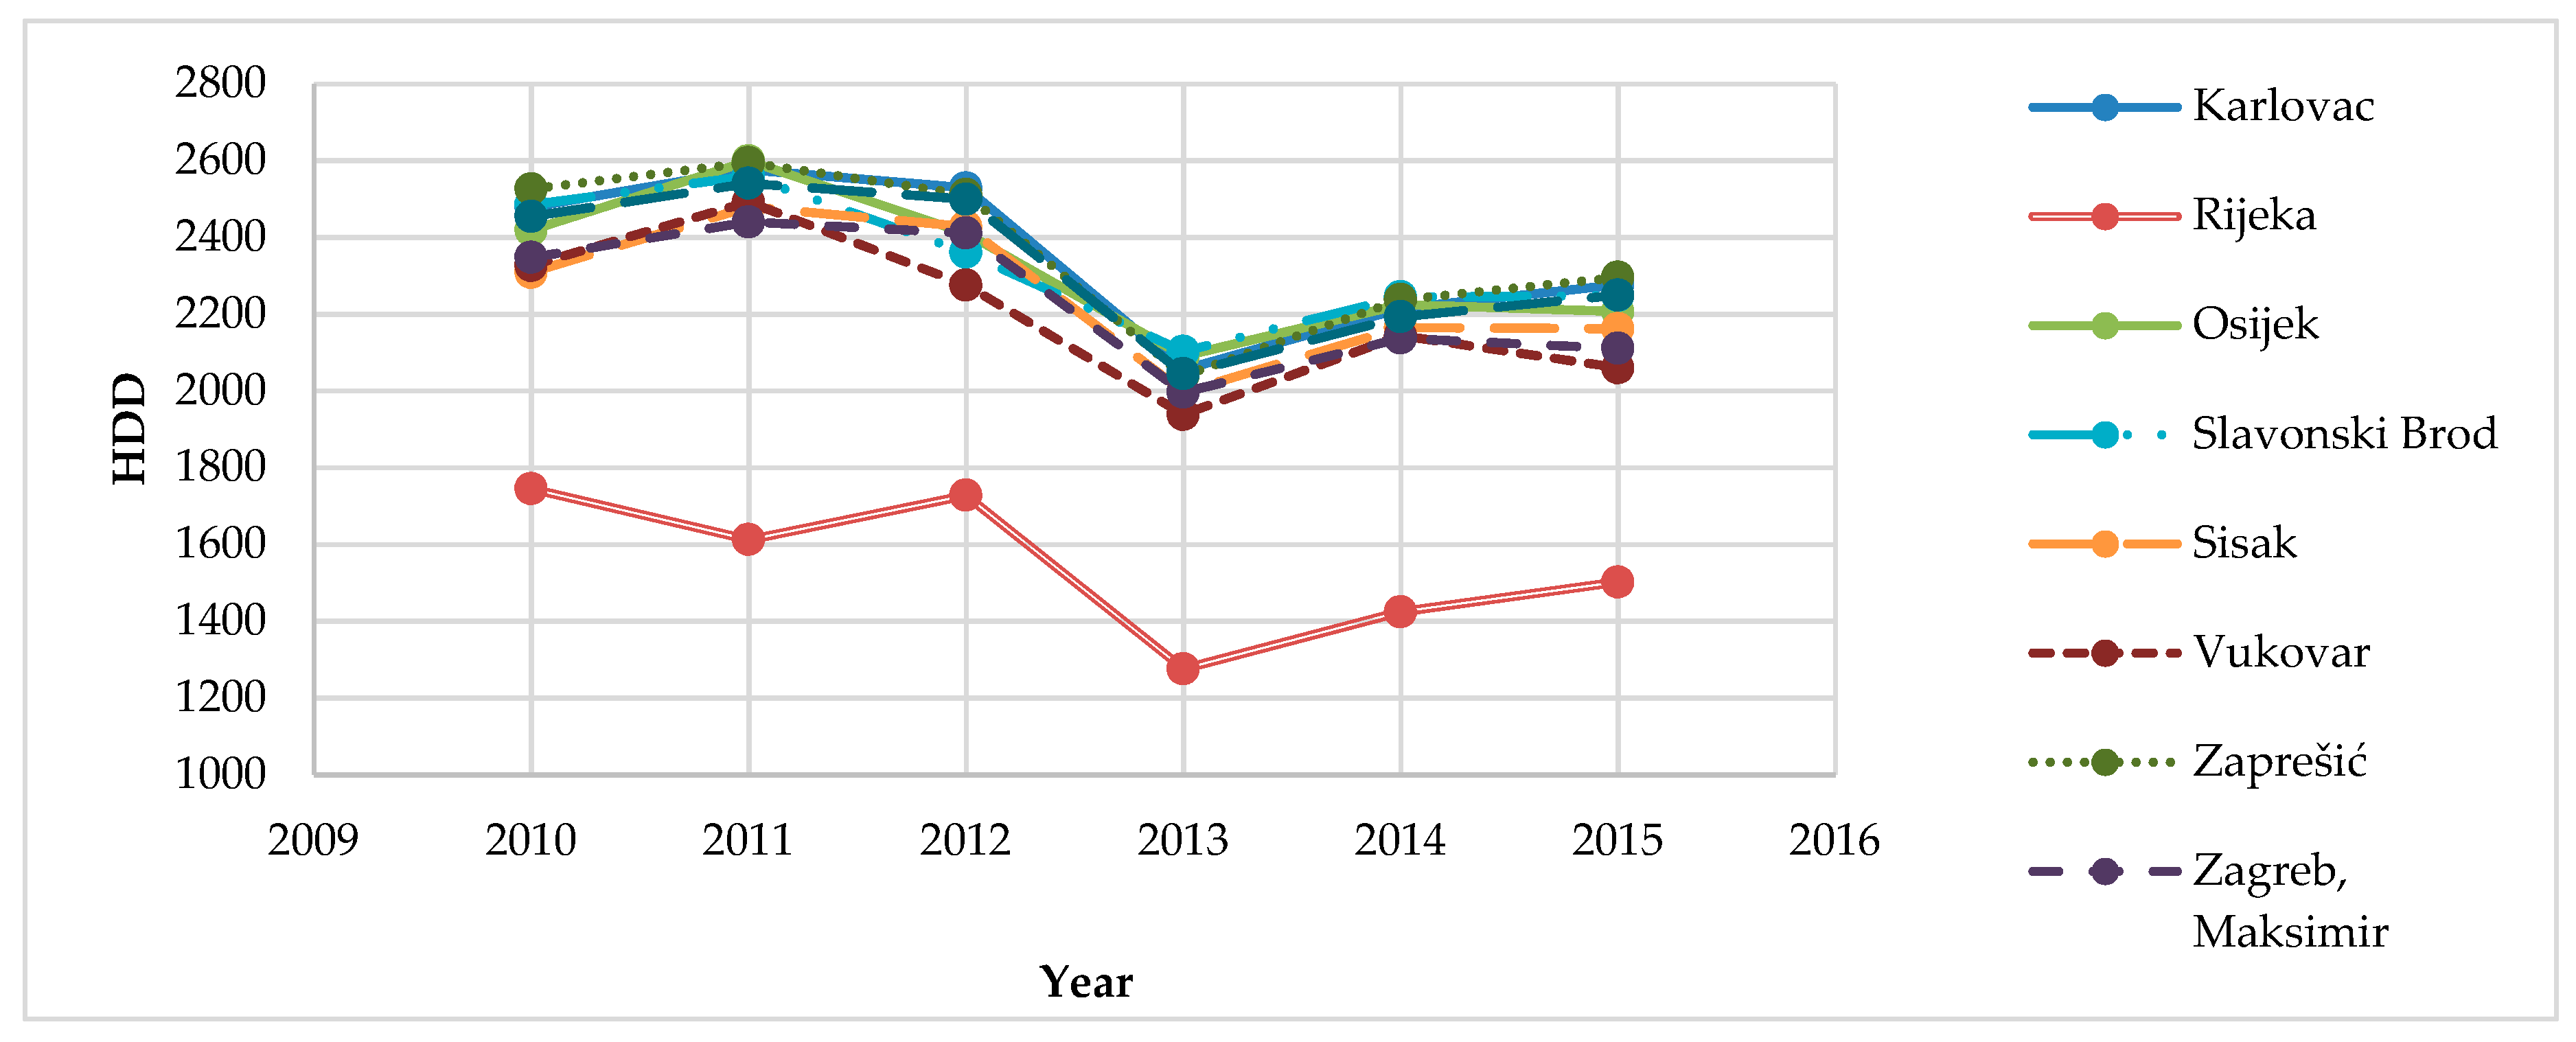
Heating degree days indirectly account for the duration of the heating period and provide a solid ground for a comparative analysis of arbitrary selected periods. A calculation of the HDD is based on the average air temperature on a daily basis in each individual town for the period from the 1st of November to the 1st of April for heating seasons starting from 2010 to 2016.
Figure 1 presents the HDD for each season. The lowest amount of HDD (the mildest winter) in each town is recorded for the 2013/2014 season. On average, winters have been colder in the first three seasons. Rijeka, as the only town located on the Adriatic coast of Croatia has a more favorable climate condition and the number of HDD is approximately 30% lower in comparison to cities located in Continental Croatia.
Savings in the consumption of heat energy is calculated on a monthly basis for each individual apartment. The sample excludes only those units for which data set includes missing observations for variables of interest. The number of units excluded from the sample is minimal (less than 1% of the total sampled units). Data deficiencies are primarily related to missing observations for the apartment area or the energy consumption within the specific months. The exact period when the HCA was applied for billing purposes for the first time is available for each apartment. In order to calculate savings, a heat energy consumption corrected for HDD is compared to the period prior and after the HCA installation. The approach applied on the individual data eliminates the effects of the weather conditions and provides a robust estimate of energy savings which are to be treated solely as an effect of installing HCA.
where:
—%age of energy savings after HCA installation;
—Average heat energy consumption per m
2 corrected for weather conditions in heating seasons before HCA installation;
—Average heat energy consumption per m
2 corrected for weather conditions in heating seasons after HCA installation;
—Average heat energy consumption in heating seasons before HCA installation (in kWh);
—Average heat energy consumption in heating seasons after HCA installation (in kWh) and
—Dwelling area (in m
2).
The analysis of the effects of HCA covers 276 buildings in eight cities and includes a total of 22,475 apartments (
Table 2). The sample encompasses a minimum of 20% of buildings that installed HCAs in each city included in the analysis. Data about monthly consumption for each apartment and building for the period from November 2010 to December 2016 was used for the analysis of heat consumption. This means that the analysis was performed for the heating seasons 2010/2011–2016/2017. Heat cost allocators were not installed in most of the buildings during the first four analyzed heating seasons.
The data about heat energy consumption, the price of heat energy, the price of equipment and operating costs, the data describing building characteristics and the average daily temperature in Croatian cities was used for analyzing the financial viability of the installation of HCAs. A detailed description of variables and data sources along with the methodology and assumptions are presented in
Table 3.
An estimation of cost-effectiveness of the installation of HCAs largely depends on the average specific consumption of the building before the HCA is installed. Generally, unit prices of the equipment can be considered equal for each apartment. The saving potential is higher in buildings with a higher average consumption. Based on the indicators of the average specific consumption, this would mean that the same %age of savings, as a result of more rational behavior, will result in greater benefits in cities with higher specific energy requirements located in Continental Croatia. On the other hand, the same level of rationality in consumption would have smaller savings potentially in Rijeka, the only city located in Adriatic Croatia where specific heat energy consumption is lower.
The heat energy prices for households depend on the consumption category of the household, the type of heating system, the distribution area and the contracted scope of activities [
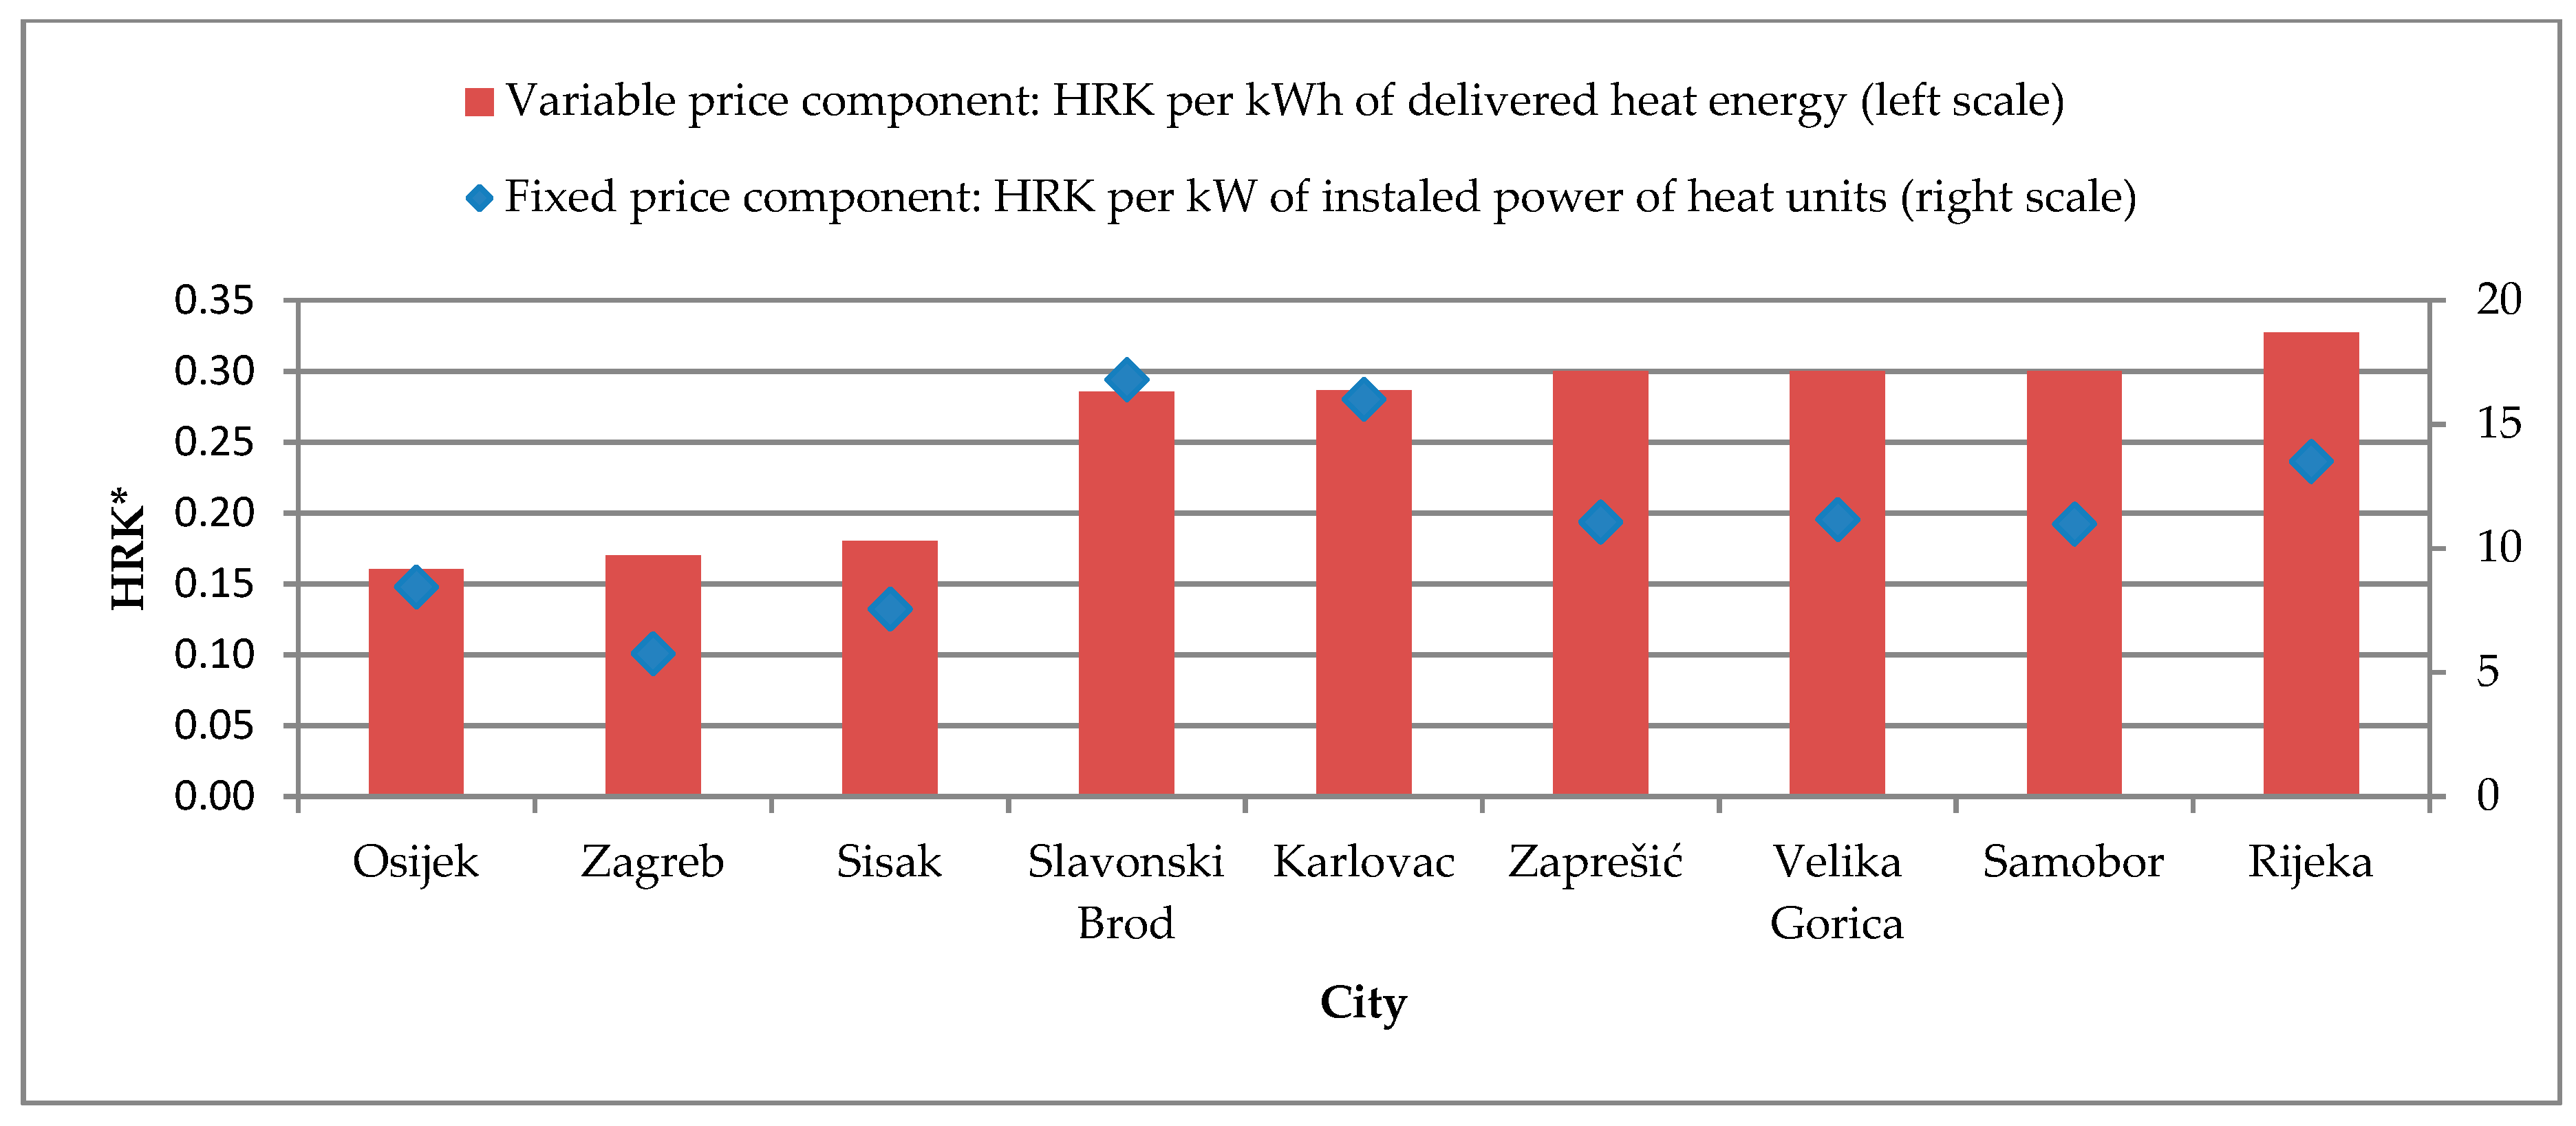
26]. The total cost of heat energy includes a fixed and variable part. In addition to the cost of heat energy delivered to the apartment, each user pays a fixed amount based on the installed power of all the heat units in the apartment. Therefore, a user can influence only the variable part of the total cost by energy savings. There is a significant difference in the price of the heating energy between the analyzed cities. The price for delivering heat energy is the lowest in Zagreb, Osijek and Sisak, while it is almost two times higher in the other cities analyzed (
Figure 2). Such a large difference in heating energy prices could be attributed to the fact that HEP-Toplinarstvo d.o.o. (the major heat energy supplier in Croatia delivering approximately 90% of heat energy in Croatia) for the aforementioned cities uses a large share of energy produced in cogeneration plants with lower production costs and hence can have a lower selling price.
Specific energy consumption (kWh per m
2) is calculated from individual monthly data on heat energy consumption and the dwelling area for each individual apartment and building. The data presented in
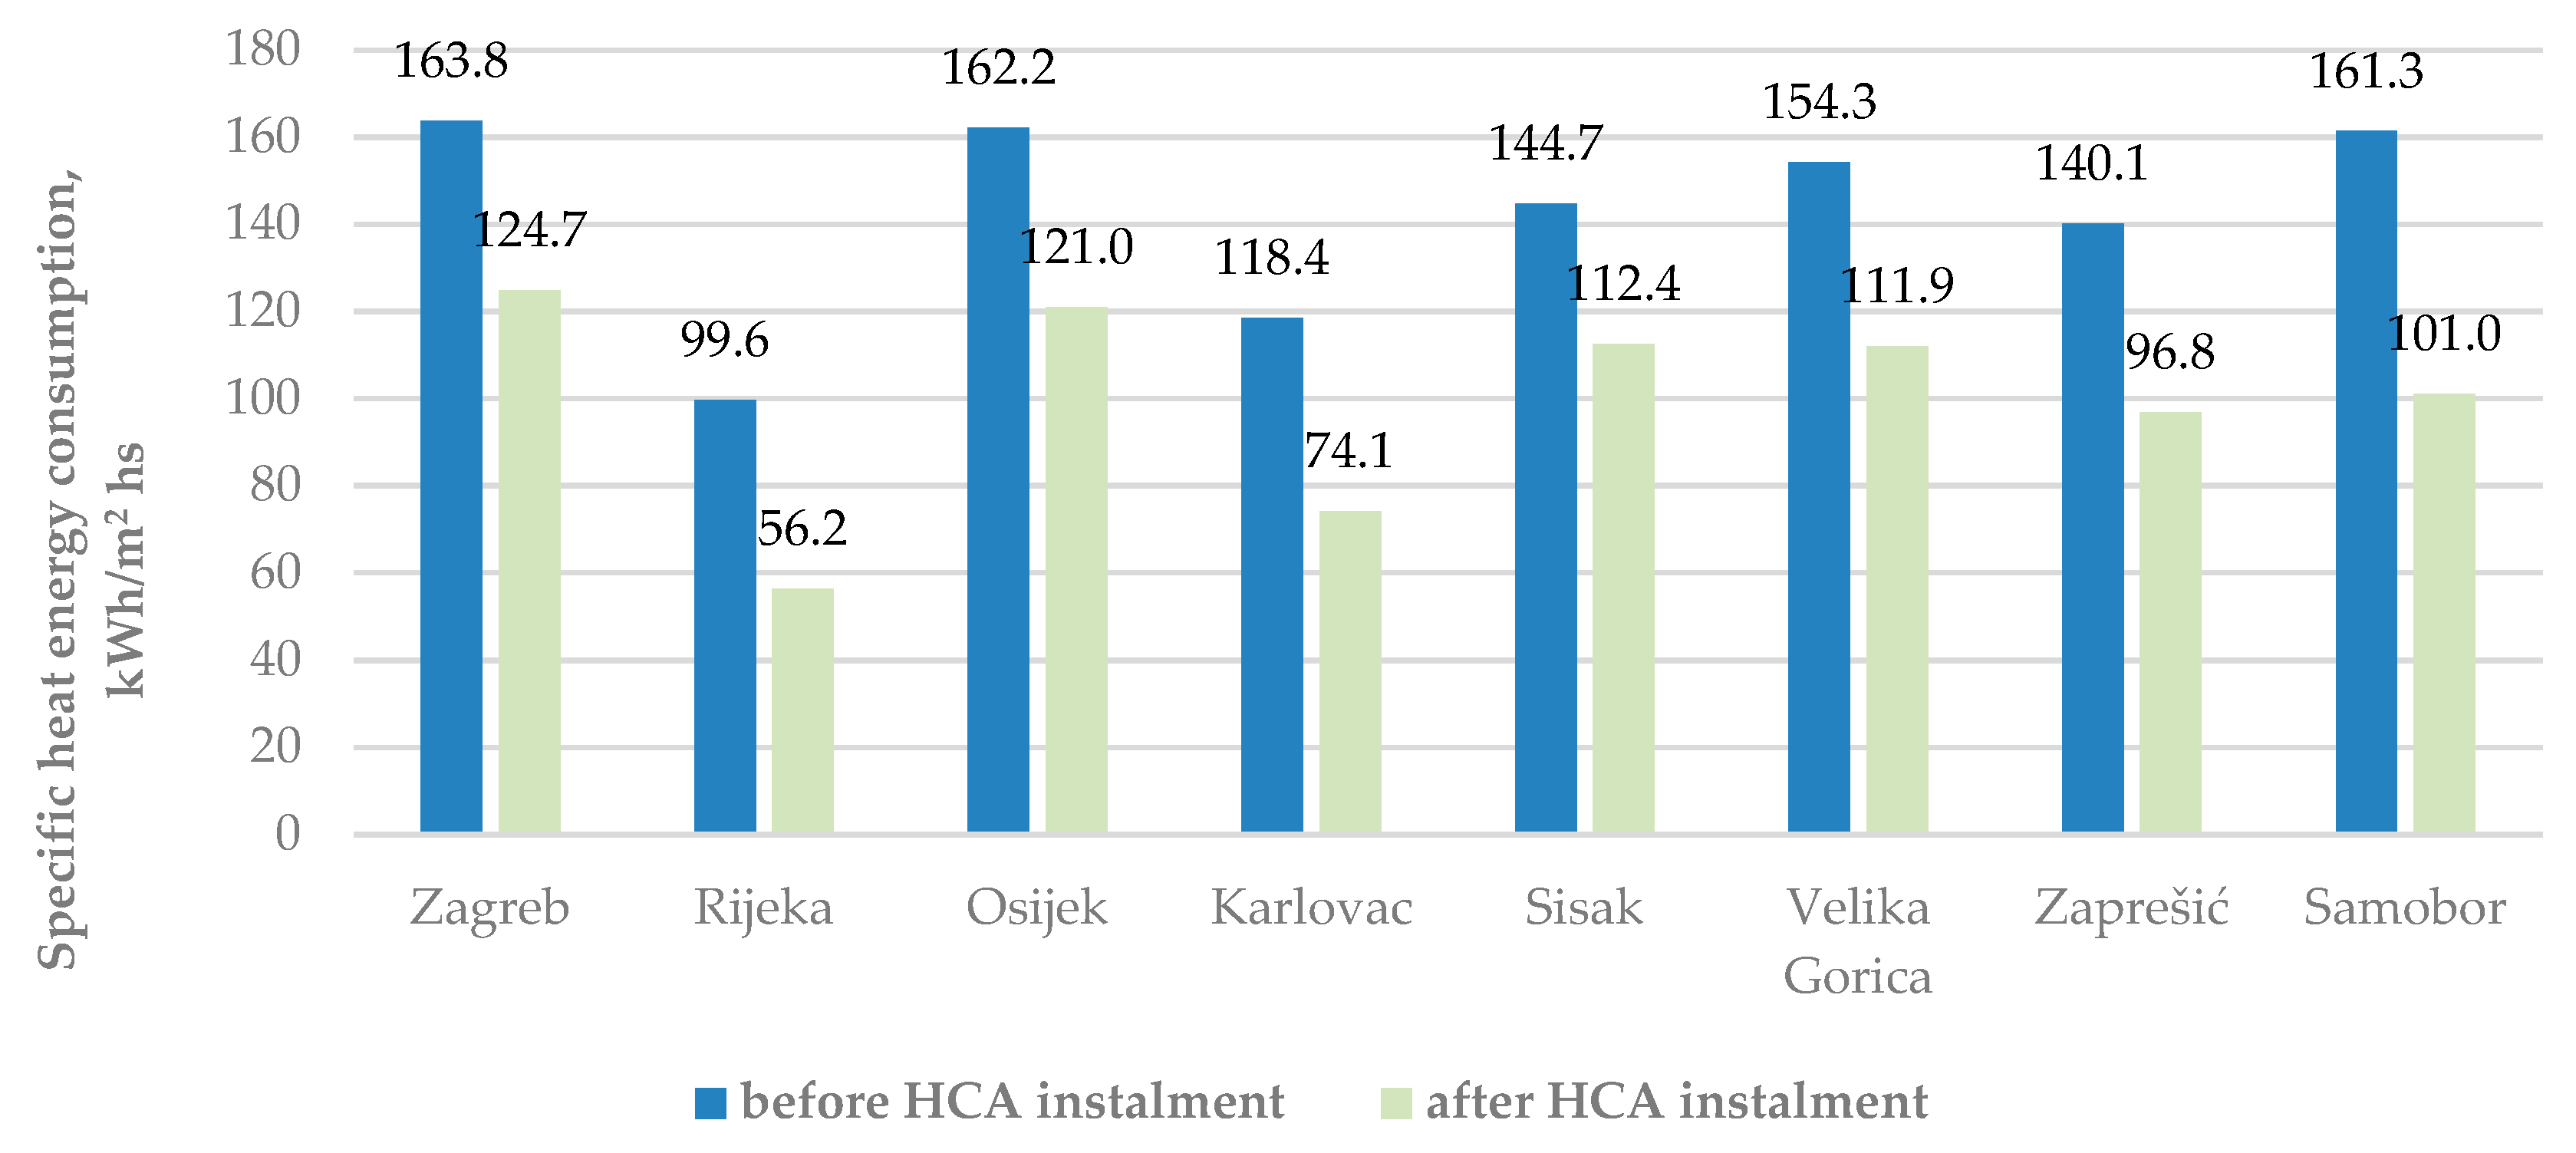
Table 4 is derived as an average of specific energy consumption for all the dwelling units included in the sample of units located in a certain city. Although individual buildings installed HCA in various heating seasons, a majority of the sampled units installed HCA in the 2014/2015 season. Therefore, a simplified approximation of the effects of installing HCA on heat energy demand could be derived by a comparison of the average consumption before the introduction of the legal obligation for installing HCAs (seasons 2010/2011–2012/2013) to the average consumption in the period after the introduction of the legal obligation.
The financial viability of installing HCAs differs amongst buildings and even more amongst various apartments. In order to provide comparable regional results, the estimated NPV for different towns is based on the reference building, i.e., on a representative building which has typical characteristics regarding size, number of dwellings, type and materials of construction and other technical properties. The features of a representative building for Continental and Adriatic Croatia are described in the [
27]. The most important factors which determine the financial viability of installing HCAs in different cities are:
Climate conditions and specific energy requirements which affect the current energy demand and are measured by specific heat energy consumption in the period prior to the HCA installation. If the energy consumption is higher because of severe climate conditions, the potential for savings is more pronounced. The same %age of energy savings after HCA installation results in higher savings expressed both in energy (kWh of the heat energy consumed) and monetary terms.
The price of heat energy on the local market. Higher prices of heat energy induce higher value of potential future energy savings.
Based on the climate and market conditions, the regions included in the assessment of financial viability could be classified into the following groups:
Buildings located in the cities of Continental Croatia where the energy requirements are high but a significant part of the heat energy is delivered from cogeneration plants because the price of heat energy is lower: Zagreb, Osijek and Sisak. Consumers located in those three cities consume more than 80% of the total heat energy in Croatia
Other cities of Continental Croatia where both the energy requirements and prices of heat energy are high: Velika Gorica, Samobor, Zaprešić and Karlovac
The city of Rijeka, as the only town in the Adriatic Croatia where a district heat energy system is available. The price of heat energy in Rijeka is significantly higher compared to the prices in the first group but the energy requirements are lower due to more favorable climate conditions.
3. Results
3.1. Specific Energy Requirements and Savings after Installing HCAs
The average specific heat energy consumption in cities located in Continental Croatia were in a range between 118 and 164 kWh/m
2 per heating season before installing HCAs (
Figure 3). In the period after 2014, the demand for energy was reduced at 74 to 125 kWh/m
2. This reduction was not only due to installing HCAs in the area. The demand for energy depends heavily on the weather conditions (exterior air temperature). In order to significantly compare consumption before and after installing HCAs, the difference in weather conditions must be included in the model as presented in the next chapter. Furthermore, individual buildings installed HCA in various heating seasons and the calculation should be based on the comparison of heat consumption before and after installing HCAs in each building individually. Although a majority of the sampled buildings introduced HCA starting from the heating season of 2014/2015, some of them installed HCAs even before while others used the transition period allowed by law.
Part of the heat energy savings which can been affected with the installation of HCAs could be better estimated by a ratio of energy consumed after and before installing HCAs when the energy consumed is corrected for specific weather conditions in each season. Additionally, an analysis of individual cases provides the possibility to identify the exact heating season when each individual building introduced HCA for the allocation of costs. The heat energy demand would be higher in periods when winters are colder and vice versa. An analysis of the effects of installing HCAs is based on heat energy consumption corrected for heating degree days (
Figure 4).
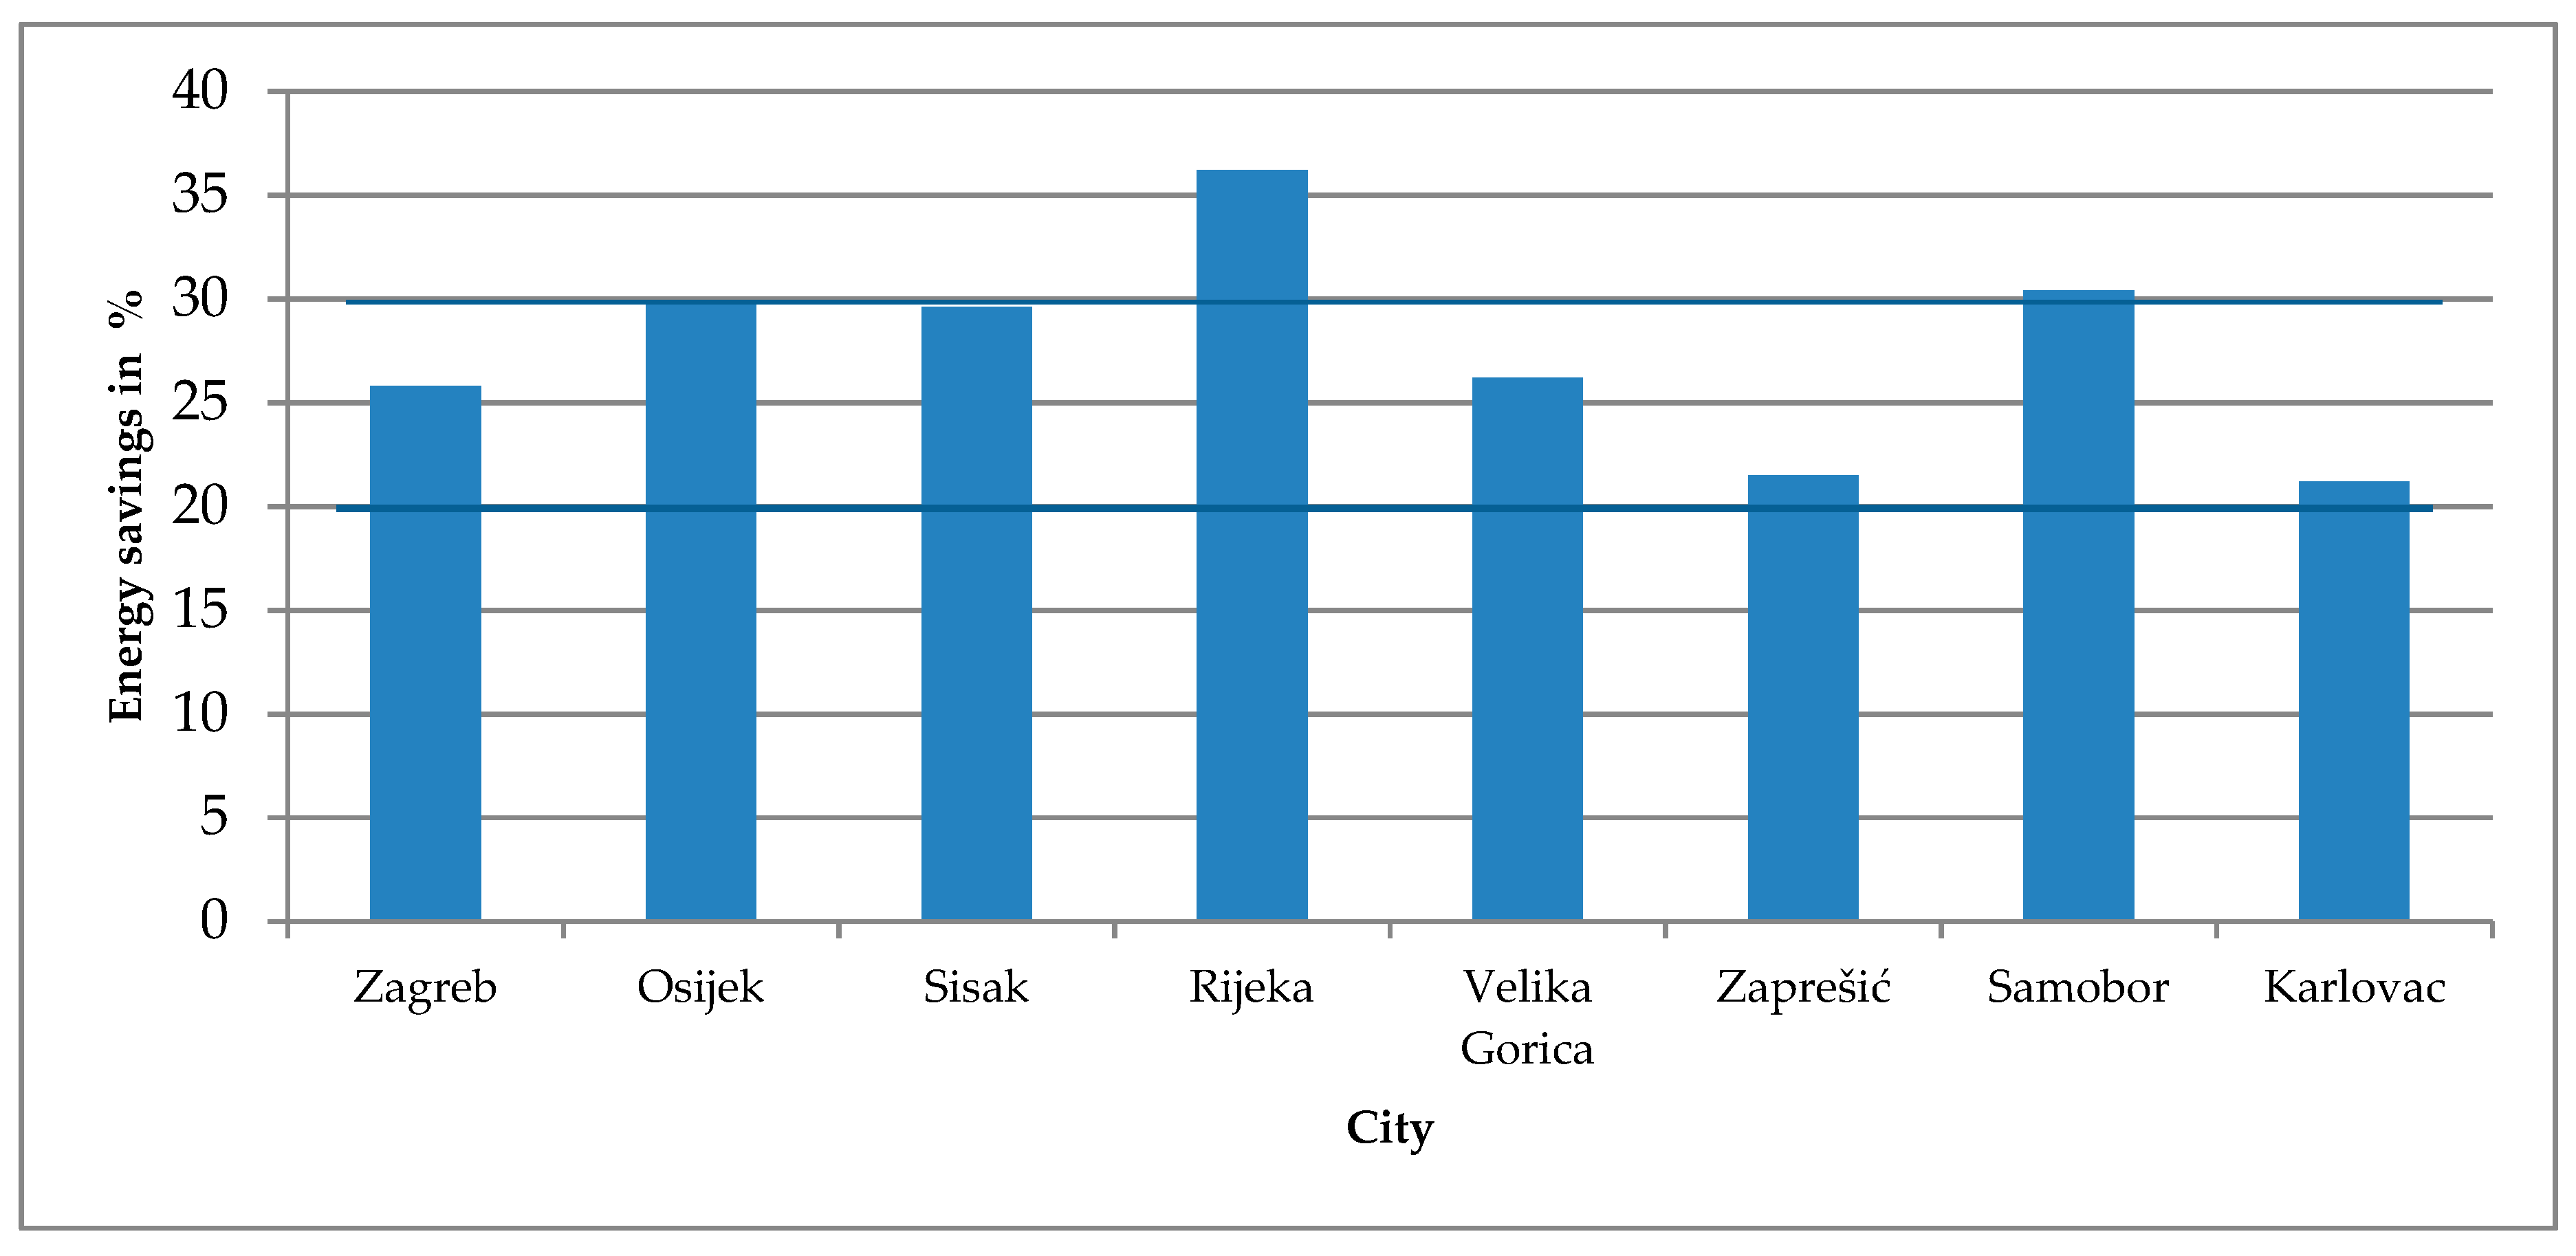
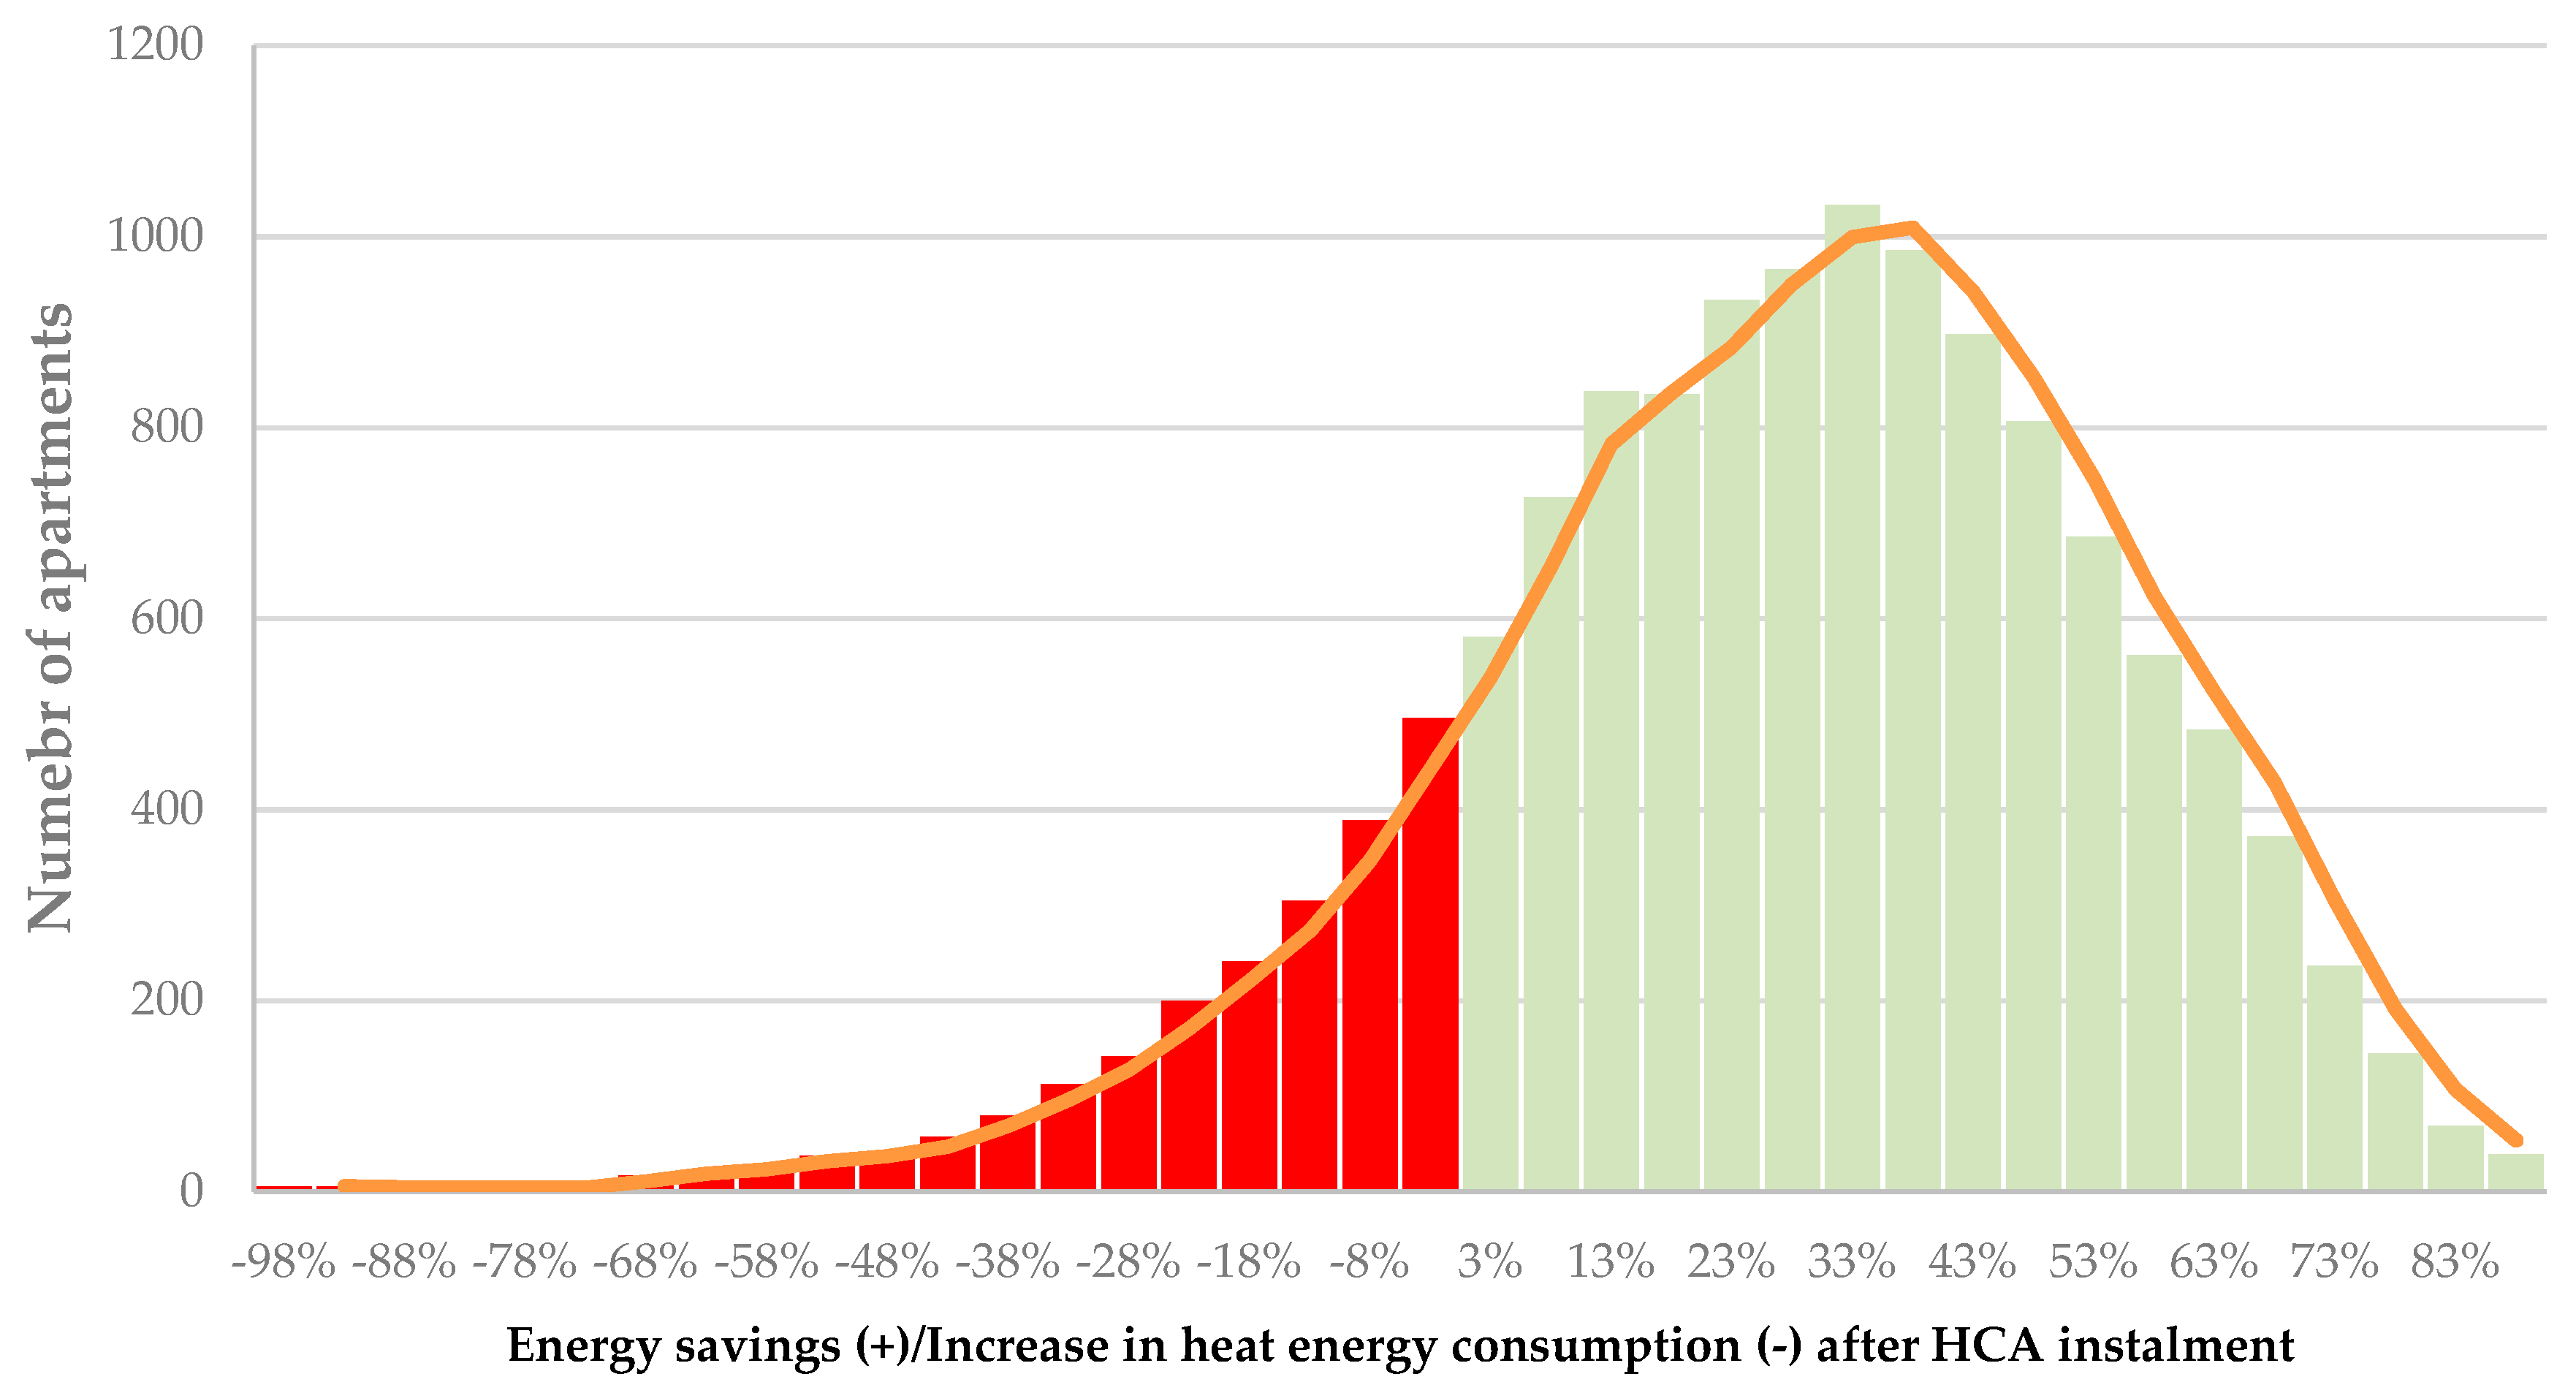
The results present a significant variation in energy savings achieved in individual apartments and different cities. If we simply compare an average of savings achieved in all the apartments located in a specific town, the energy savings are estimated in the range between 20 to 30% for all the towns except Rijeka where they were even higher than 36%.
However, a significant variation of heat energy savings can be noticed on the level of individual apartments. In each city, a certain proportion of the apartments (from 12% in Rijeka to 25% in Karlovac) were faced to increased bills for heat energy after installing HCA. The distribution of savings achieved in individual apartments in Zagreb, are presented in
Figure 5. The main factor behind the increased consumption in most cases is the unfavorable location of the apartment in the building. The difference in energy requirements related to the position of the flat in the building is broadly discussed within the literature [
10,
12,
13,
28].
The share of apartments with higher heat energy consumption in different cities is generally below 20% in all cities, except Karlovac. On the other side of the savings distribution are apartments which recorded extremely low energy consumption after installing HCA or practically do not consume any heat energy. One part of the apartments is not used and the owners of those apartments benefit significantly from installing HCA. Before installing HCA the owners of the apartments without residents participated in the total amount of the heat energy based on the dwelling area even if all the heat units were not active. The owners of the apartments situated at the central position of the building and surrounded by other apartments from all sides also achieved high savings.
3.2. Investment Costs
The costs of installing HCA significantly differ amongst the sampled units because of various technical characteristics of the sampled apartments. The highest amount of the investment is the price of the HCA or the thermostatic valve which could be directly allocated to each of the individual owners of the apartments. However, certain items, such as the central processing unit, costs of balancing pressure in the heating system or the thermostatic valves installed in halls or other areas which are generally available to all building occupants, are to be treated as common costs of the building. The most important source of variability in the investment costs per building is related to the variability of technical parameters: the size of a building and individual apartments, the internal heating system in the building, the number of heating units per apartment and many other factors. The configurations of the system for individual metering also differs amongst the buildings. While some buildings incorporated only a minimal set which includes only HCA and a central processing unit (if the thermostatic valves were installed before), other buildings incorporated complete systems for the pressure and temperature control in the secondary circle.
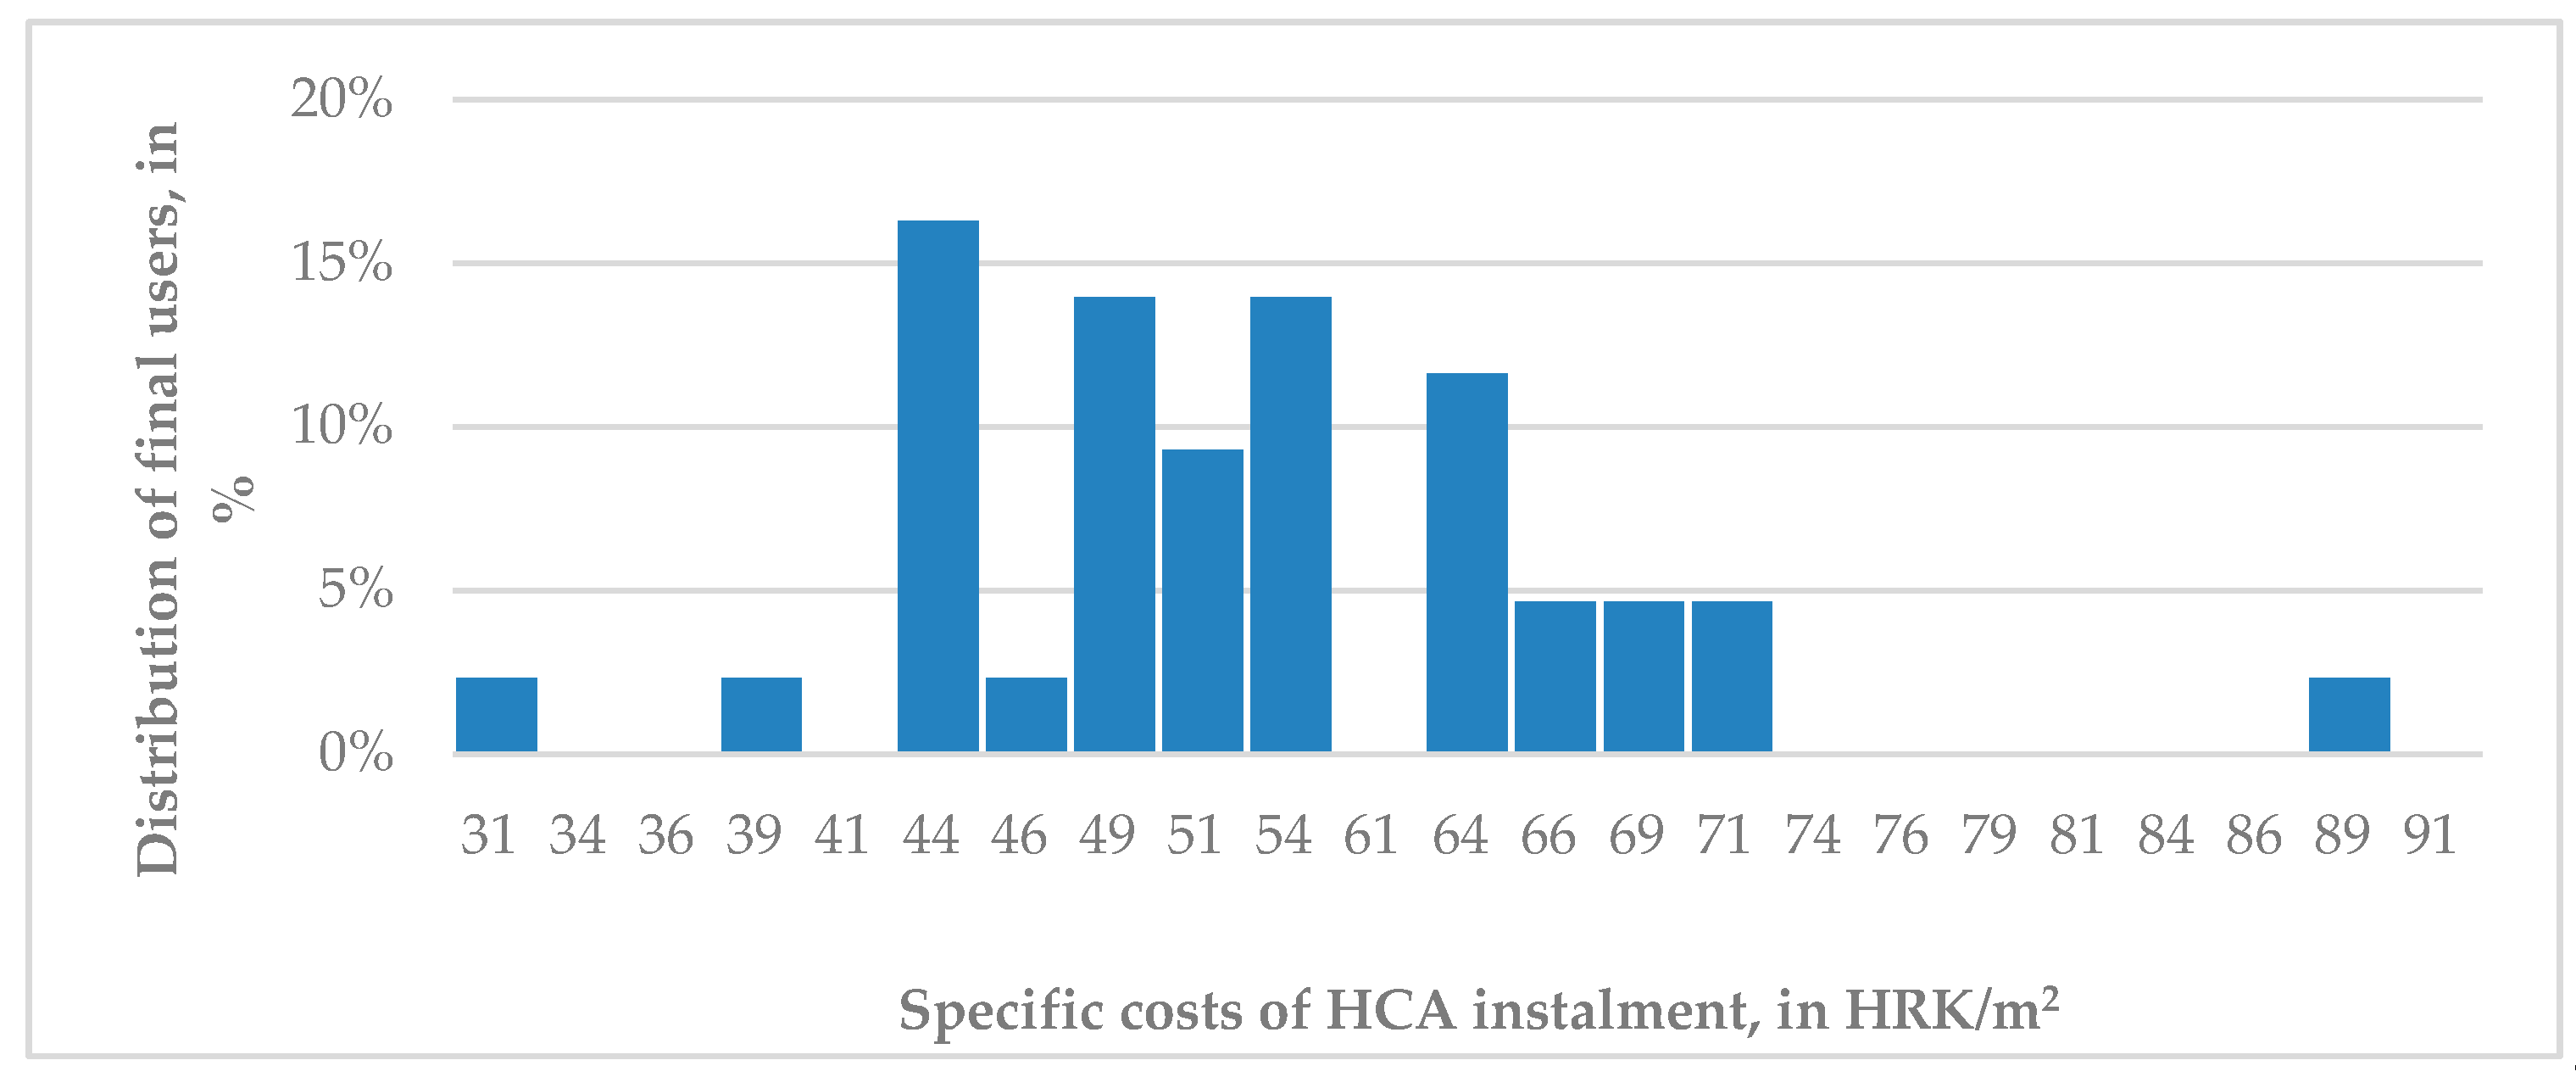
Specific costs of installing HCA are based on the sample of buildings for which actual data on quantity and the type of equipment installed were available. The database on investment costs include information about the total number of heating units in the building, the quantity of HCAs installed, important technical parameters (e.g., the number of verticals), the period when the HCAs were installed, supplier of the equipment and many other variables. The prices of equipment differ regarding the exact type of equipment and producer. In order to calculate the average prices, a broad set of actual prices of equipment delivered by all dominant suppliers in Croatia are collected, including data on the prices per unit labor costs for the HCA installation and programing services. In order to compare investment costs in various buildings, an indicator of specific costs (investment value per m
2) is used. The average cost of installing HCAs for all buildings included in the sample is estimated at 54.1 HRK per m
2 (approximately 0.72 Euro). However, a distribution of the estimated average costs per m
2 is wide as presented in
Figure 6.
3.3. Net Present Value of HCA Installation in a Reference Building
The results of the financial viability analysis are shown in
Table 5. Savings in heat energy consumption should be relatively high in the cities of Continental Croatia where the price of heat energy is low if the investment is to result in positive net present value. In the City of Zagreb even high energy savings of 25.8%, as achieved in the first few years after installing HCAs, do not result in a positive return on investment. For the reference building, in the lifetime of HCAs of 10 years, about 5% of investment costs will remain uncovered. In Osijek and Sisak (other towns belonging to the first group), consumers have reduced heat consumption by almost an average of 30%, which ensures a positive net financial flow, although the monetary value of savings exceed the investment costs only in the last year of the HCA lifetime.
Consumers in other cities in Continental Croatia, where the price of heat energy is higher (the second group) generally realize the positive net value of the investment. An average return period of the investment for those consumers is estimated from 3.8 to 10.8 years. Nevertheless, in Karlovac, with lower energy needs in comparison to other towns in Continental Croatia, an average consumer does not achieve a positive return on investment over the lifetime of the HCA even with relatively solid energy savings of 21.2%.
In Rijeka, the only city in the sample located by the Adriatic, an average building achieved a positive net present value of the investment, as the average consumption decreased by more than 36%.
3.4. Net Present Value of HCA Installation for a Different Combination of Energy Requirements and Savings
An estimation of NPV for various combinations of initial energy requirements and savings could provide a more in-depth insight into the variability of results depending on different features. If the initial specific heat energy consumption is high, a positive net present value could be achieved even with moderate energy savings and the legal obligation for installing the HCA is justified. On the other hand, a group of buildings in a specific location where the initial specific consumption is low could achieve a positive net present value only by extremely high energy savings.
The individual bill for heat energy consumption differed significantly for each tenant after installing the HCA. The actual energy consumption depends on a number of factors, such as the characteristics of the apartment (size, insulation), the position of the apartment in the building (geographical orientation, internal location of the flat), socioeconomic situation of tenants and individual propensity to energy savings.
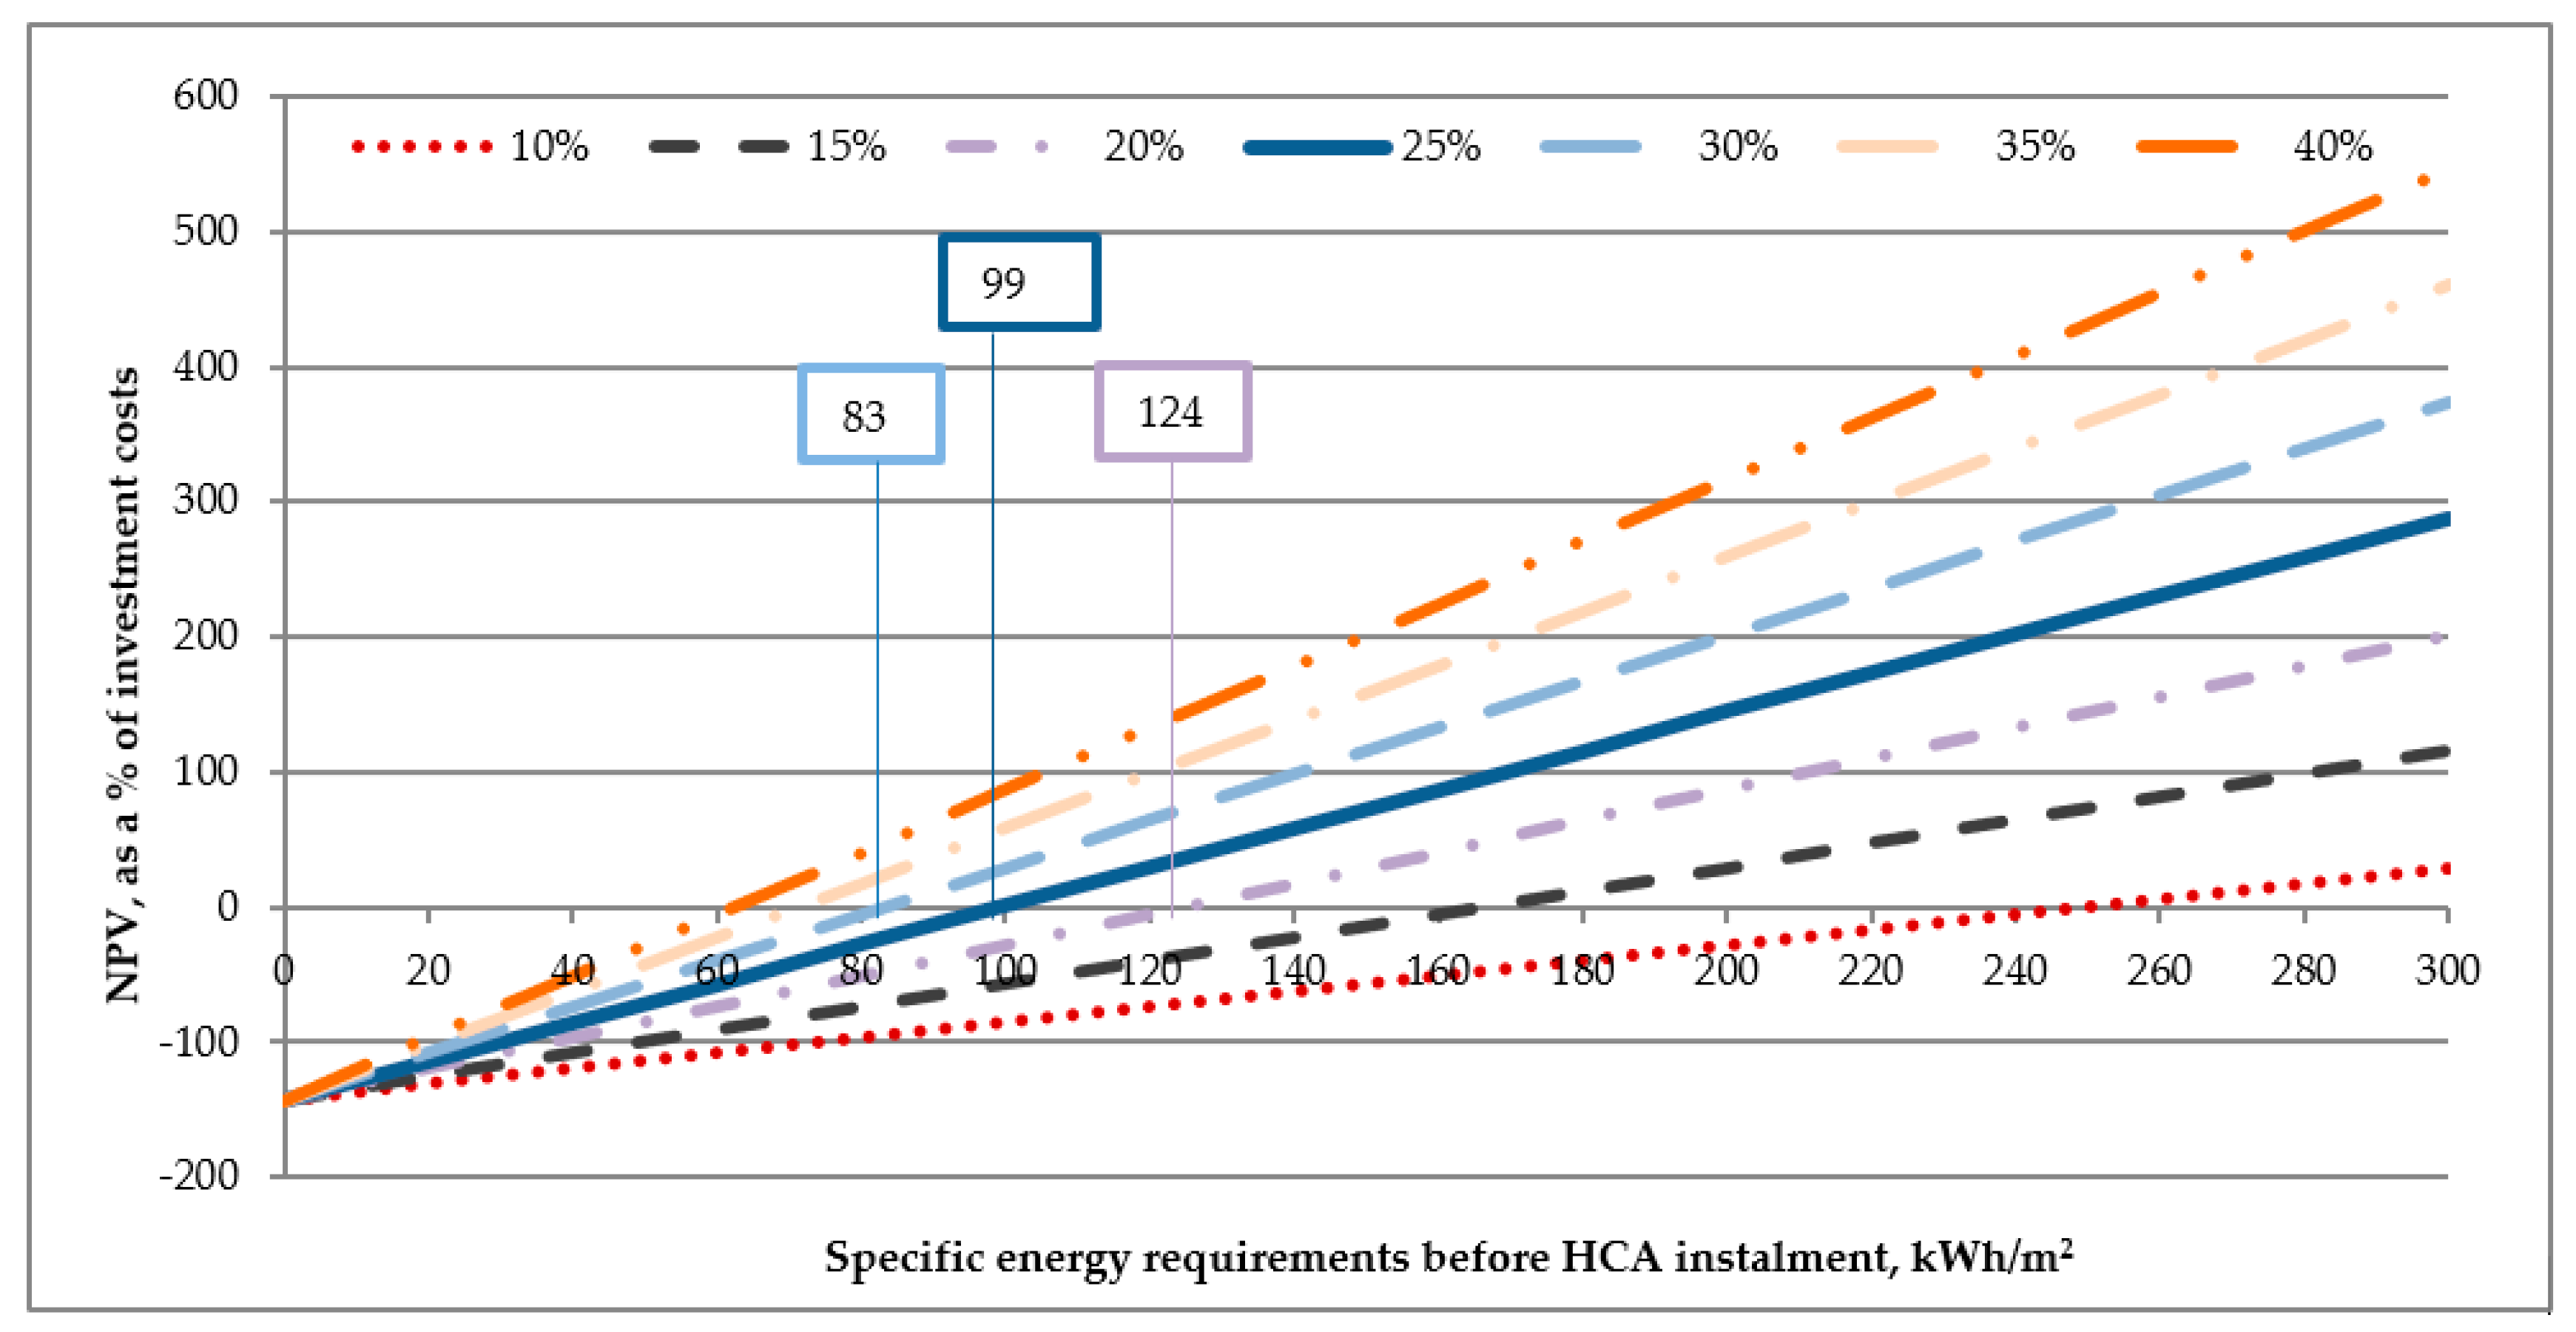
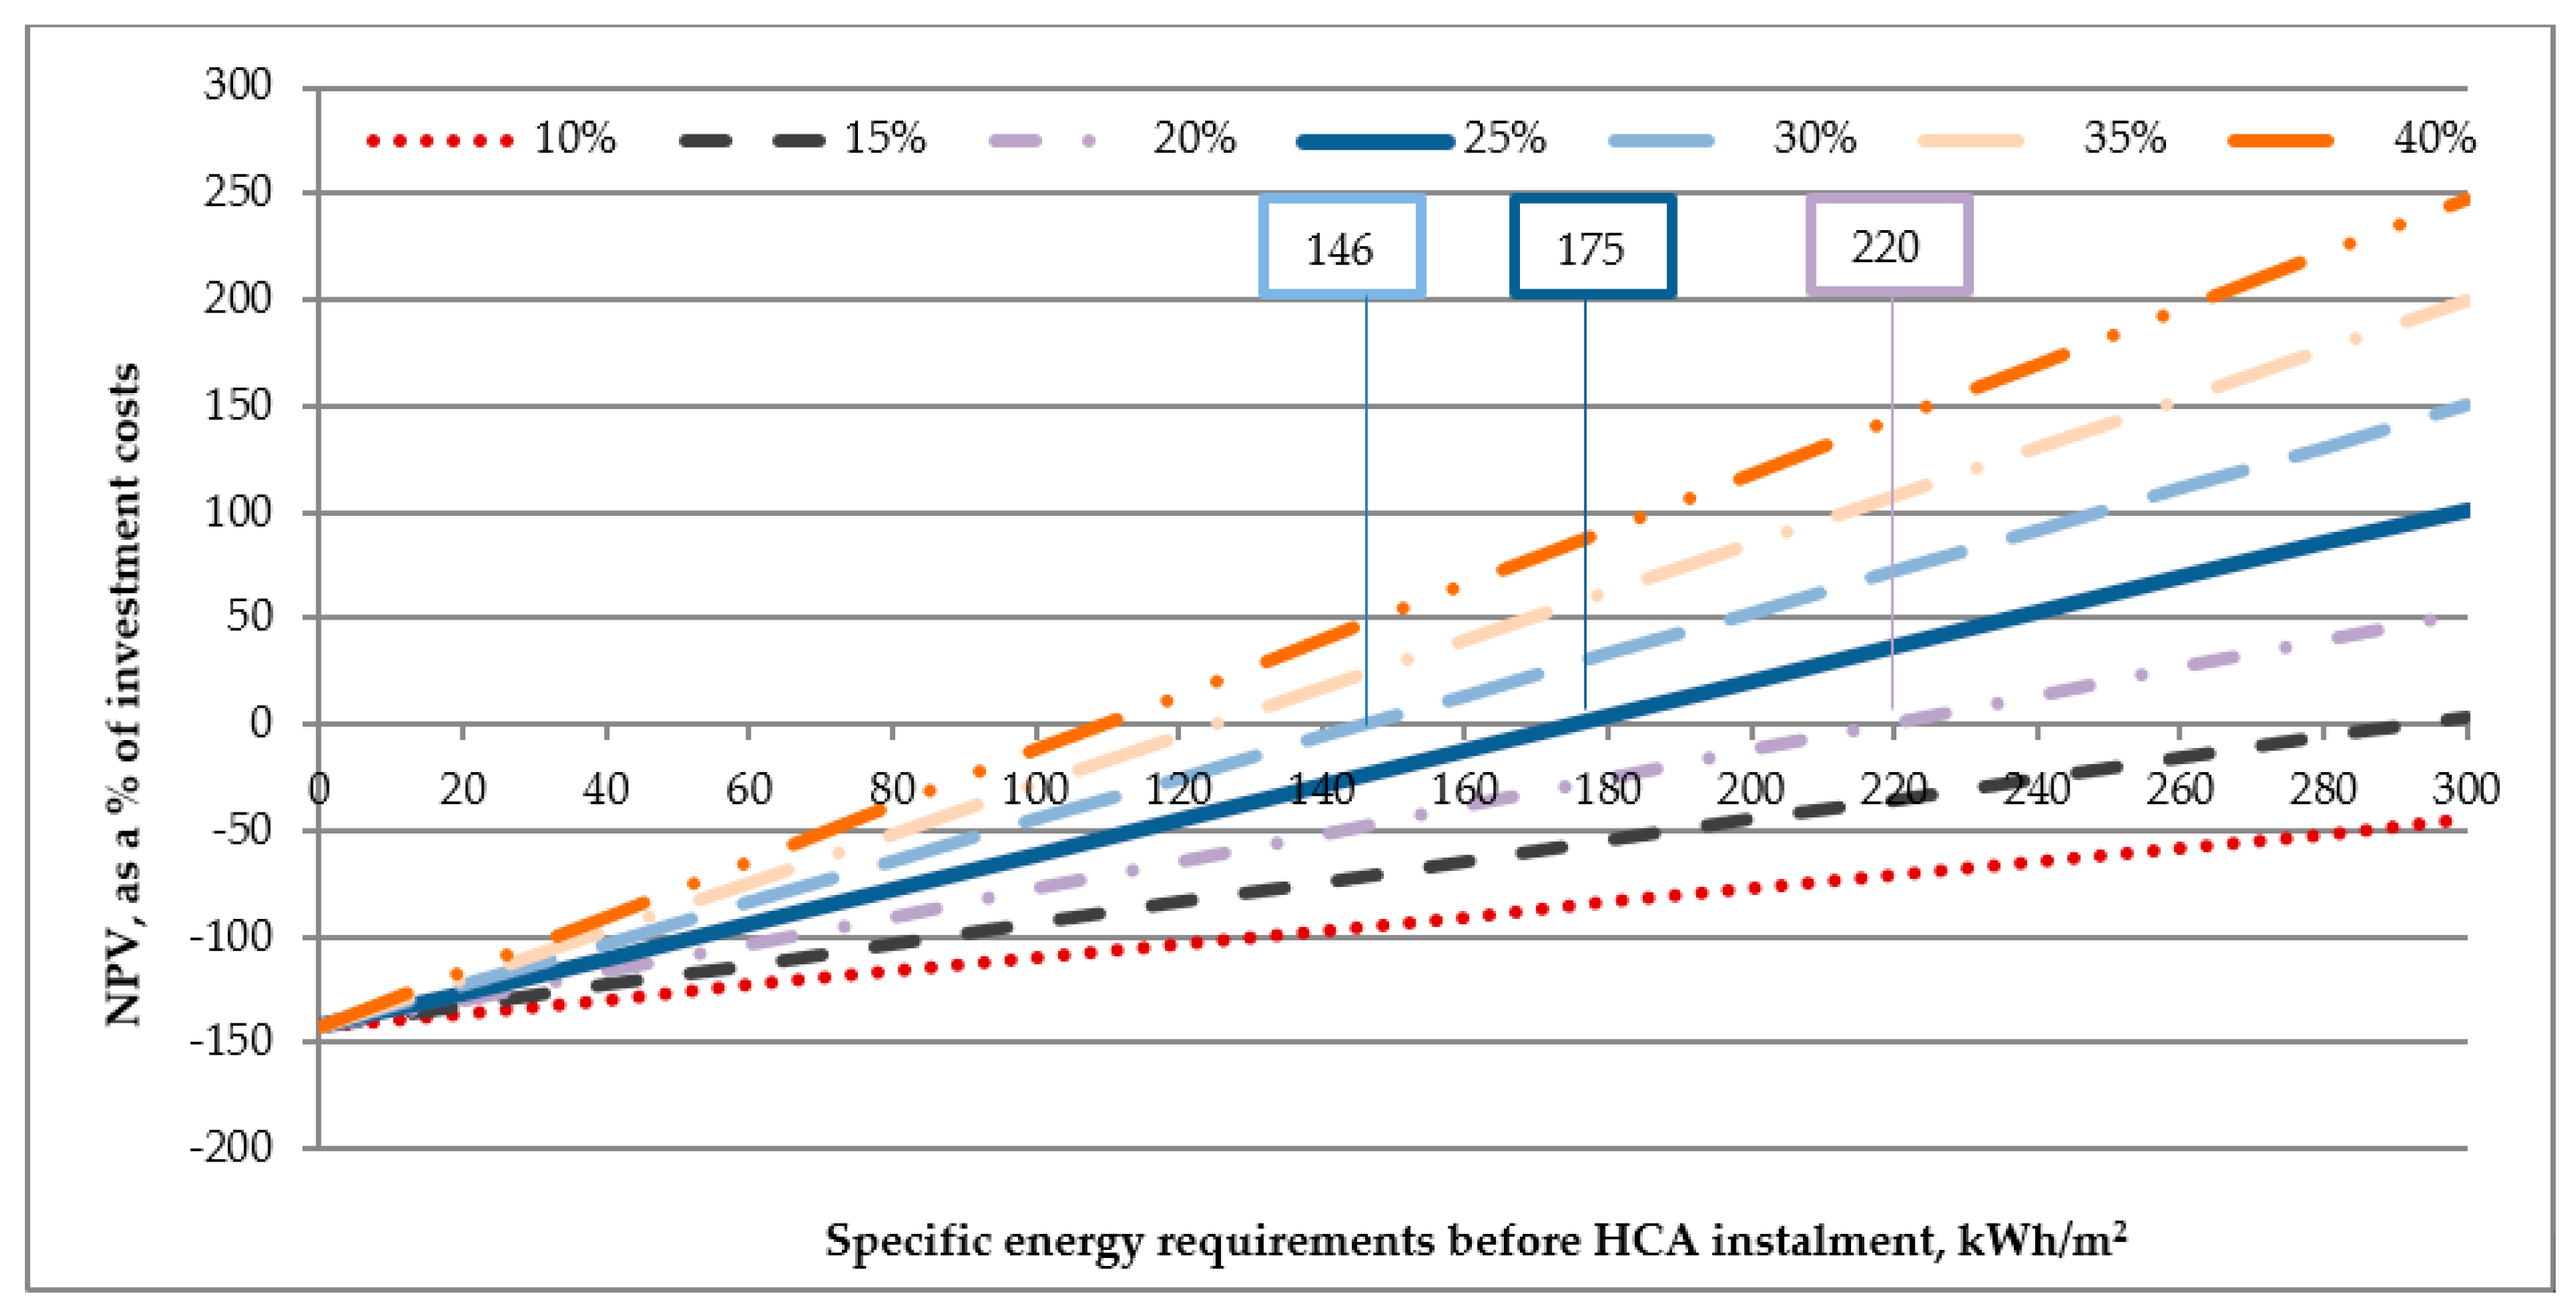
Figure 7 shows the net present value that corresponds to the different combinations of initial specific consumption for a building located in the City of Zagreb before the introduction of individual metering. While the scenario analysis of the NPV presented in
Table 5 relates to the reference building consuming 163.8 kWh/m
2,
Figure 7 estimates the cost-effectiveness for buildings whose specific energy consumption differs from the reference building. One can notice that the results from
Table 5 could be read as the corresponding values of the vertical line that would cut the figure at the specific consumption level of 163.8 kWh/m
2. For example, the 25% savings level corresponds to the point on the vertical corner (163.8) and the direction marked as 25%, in which the combined net present value is −9.4 (see
Table 5).
Generally, higher initial heat energy consumption and higher savings result in a positive net present value. If not coupled with other investments such as the insulation of the building or optimizing the overall heating system in the building, an upper limit of energy savings that does not result in adverse effects on the quality of life and a negative impact on the building due to under-heating of interior space exists. According to European guidelines regarding potential savings, it should be noted that the savings above the reference values from the cost-benefit assessment guide [
23], resulting in a reduction of more than 1.10 K, or a reduction in the ventilation effect for a coefficient greater than 0.25, can result in adverse effects in terms of humidity and the overall quality of life in such buildings. With such parameters, previous studies for Germany estimate the possibility of achieving savings of about 20% [
6]. Although the technical data on the construction period and materials which determine insulation characteristics of the sampled buildings for Croatia are not fully available, it can be assumed that, due to more favorable climatic conditions (less HDD) the potential savings calculated for Croatia could be even lower than those estimated for Germany. An experimental study conducted in Poland during 17 heating seasons show that the HCA instalment in a multifamily building could result in achieving savings of around 26% on average and the effects are even higher if external walls of the building have been insulated [
8].
If this upper limit is estimated at 25%, it can be seen that the initial level of consumption per m2 in the City of Zagreb should be at least 175 kWh/m2, in order to achieve a positive net present value of the investment. Buildings with lower energy requirements would probably realize a negative net present value if savings of 25% are achieved. Buildings with average initial energy consumption lower than 146 kWh/m2 could not ensure a positive net present value of investment even if 30% of energy savings are achieved. Therefore, it is highly questionable whether the legal obligation for individual metering could be justified for buildings with the initial energy requirements under 146 kWh/m2 in the City of Zagreb. The same model applied for Osijek and Sisak (the first group of cities with lower heat energy prices) results in the same conclusion.
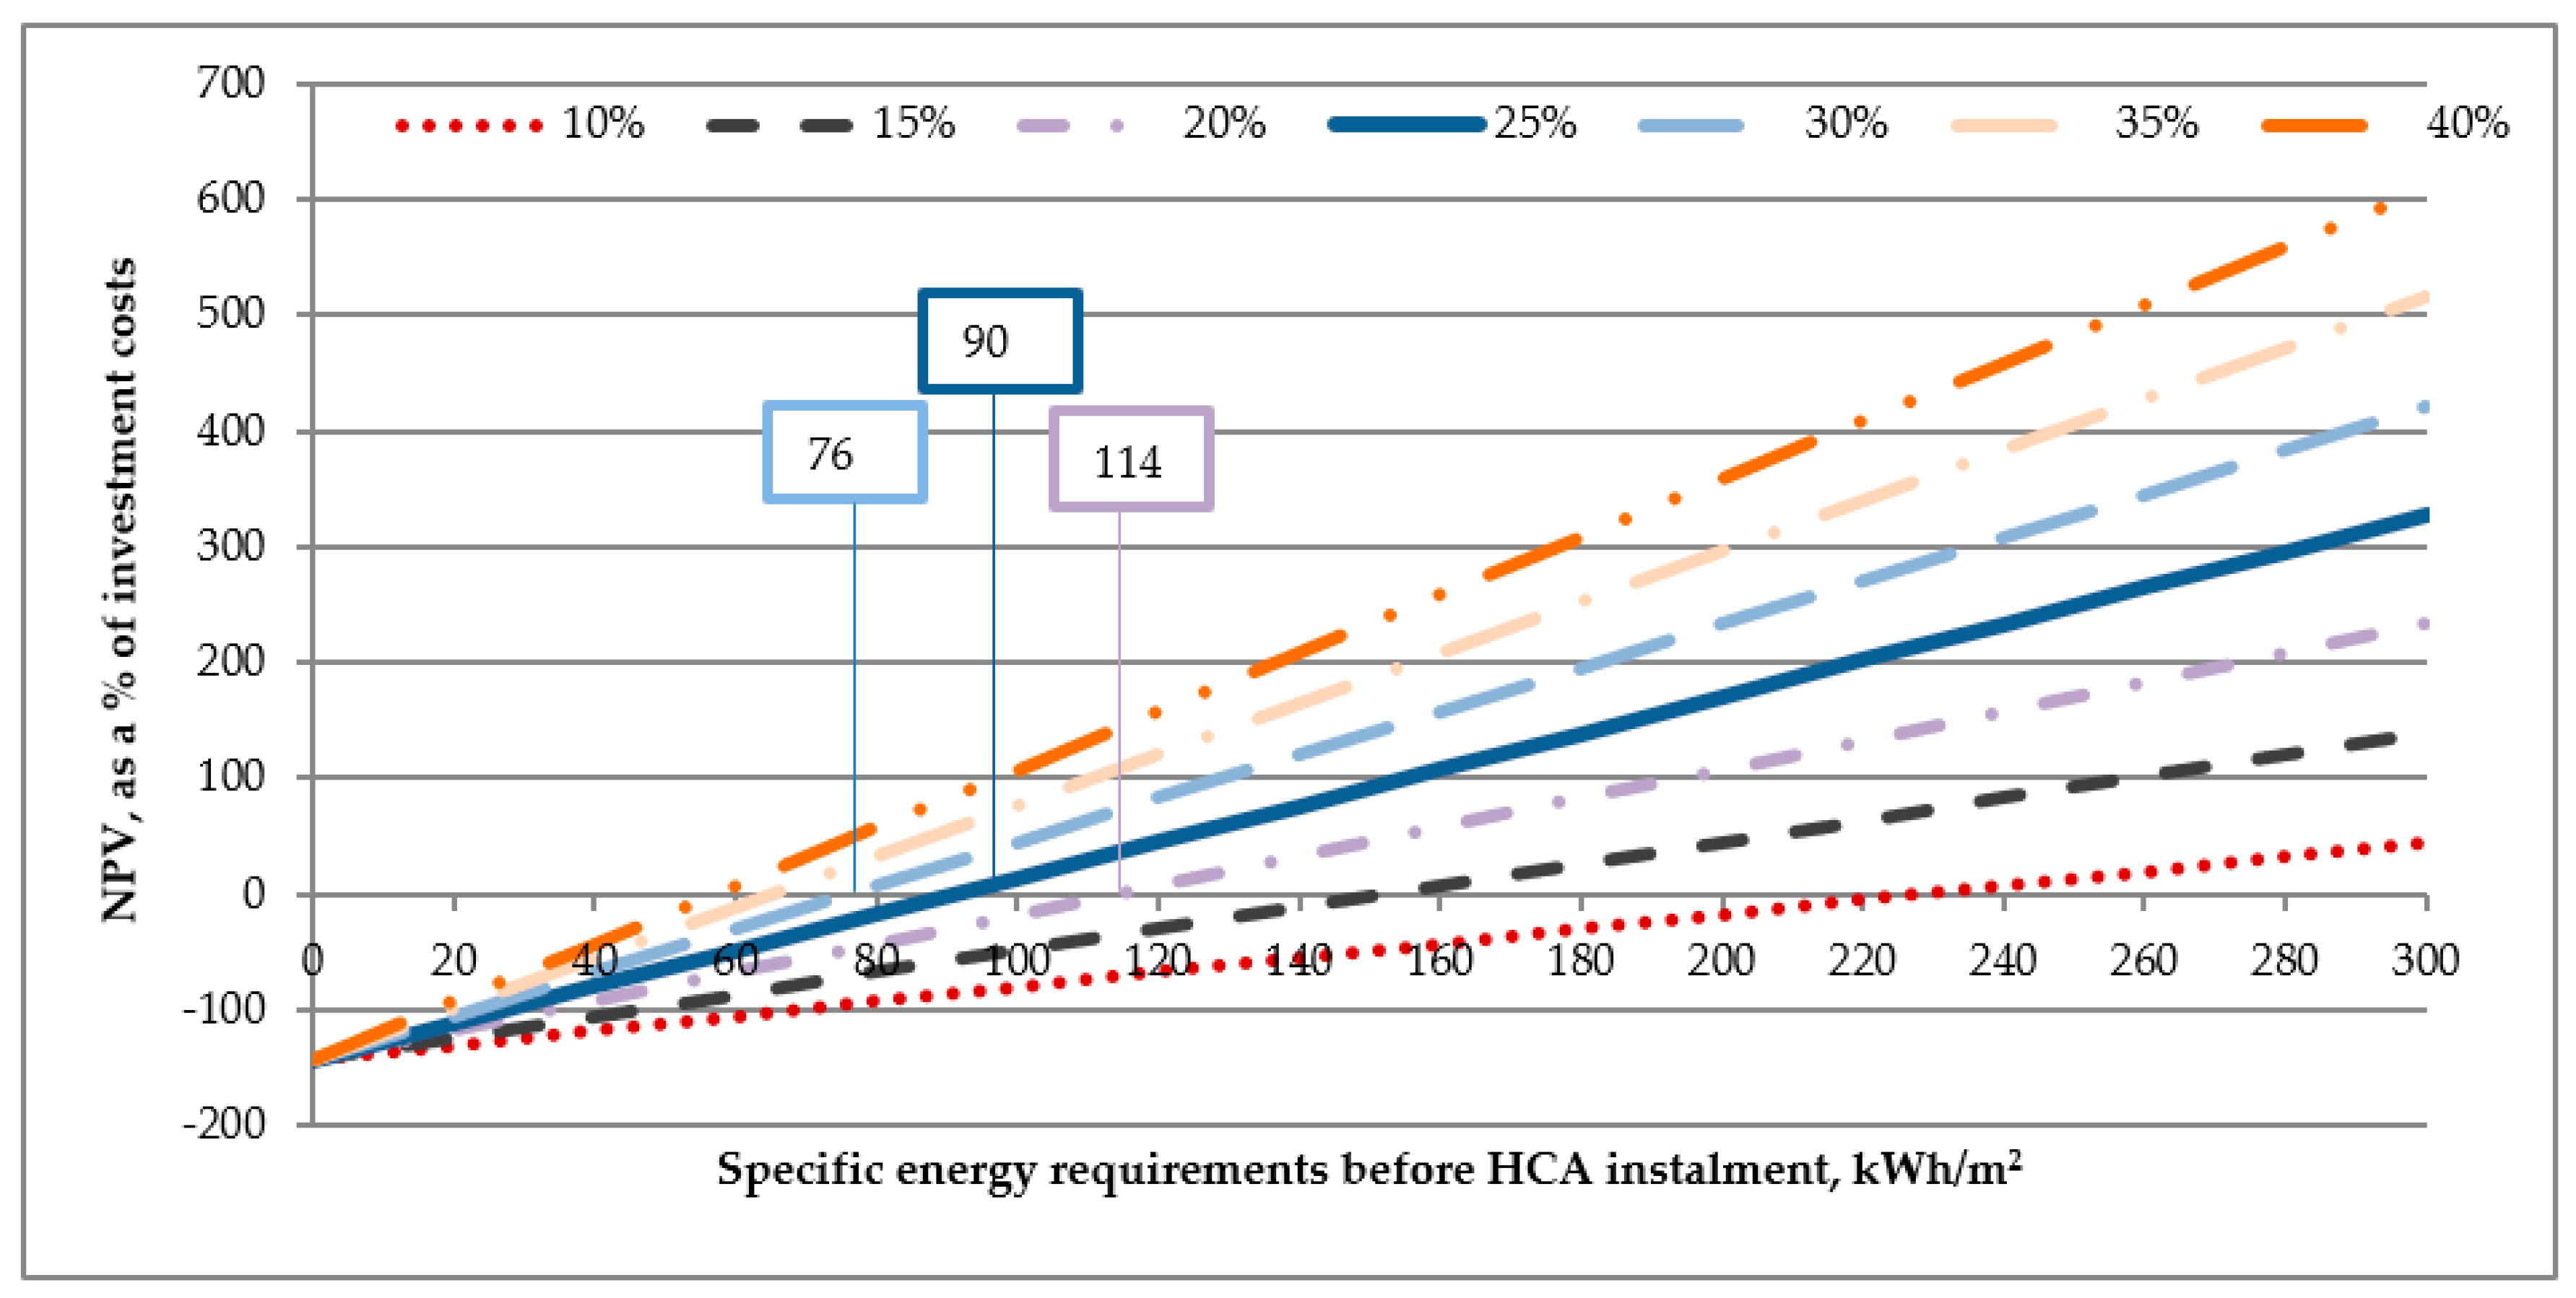
The price of energy in Rijeka is considerably higher, and the same %age of savings resulted in a more positive net present value of the investment. However, most of the buildings in Rijeka have significantly lower initial levels of specific energy needs due to more favorable climate conditions. For buildings with energy consumption higher than 90 kWh/m
2, energy savings above 25% would generally result in a positive net present value. On the other hand, buildings with initial energy requirements under 76 kWh/m
2 couldn’t realize a positive net present value even if energy consumption is decreased by 30% as a result of individual metering (
Figure 8).
Higher heat energy prices in the cities of Continental Croatia with more expensive heat energy contribute to the positive results of the cost-effectiveness analysis. Thus, in Velika Gorica, where the price of the kWh price is significantly higher in comparison to the first group of cities, the investment resulted in a savings of 25% which will induce the positive net present value of the investment even if an initial energy requirement was under 100 kWh/m
2. According to the data from the sample, the largest number of buildings had an initial specific consumption over 100 kWh/m
2, and generally 25% of savings ensures a net positive value for most of the buildings located in Continental Croatia where a higher market price of heat energy is applied (
Figure 9).
3.5. Sensitivity Analysis
The sensitivity analysis (
Table 6) points to the conclusion that the application of a lower discount factor or assumed increase in relative prices of heat energy improves the assessment of financial viability of the HCA installation. The results are more sensitive to potential growth in heat energy prices. However, prices of heat energy are partially regulated and do not automatically react to changes in market conditions. The last correction in heat energy prices in the first group of towns (Zagreb, Osijek and Sisak) was recorded in the 2012/2013 heating season. The assumption on constant growth of relative prices is not realistic because the regulation of heat energy prices in Croatia is in some degree used as an instrument of social policy. An average consumer of heat energy in Zagreb, Osijek and Sisak, towns which approximately consume 80% of the total heat energy in Croatia, should decrease its energy consumption for more than 25% in order to recover total investment costs of the HCA installation even if the energy price will increase at an annual rate of 2.5%. On the other hand, in towns of Continental Croatia, an average consumer could recover investment costs even with moderate energy savings of approximately 15%. In Rijeka, energy savings in range of 20–25% could ensure that installing HCA results in a positive NPV if relative energy prices increase by 2.5% annually.
4. Discussion and Conclusions
The energy savings achieved in Croatia as a result of applying the heat cost allocators could be assessed by comparing the results presented in previous studies. The savings in Croatian cities ranged between 21 and 36%. However, the distribution of savings of buildings, and particularly apartments, presents a significant variability. The variability of energy savings could be attributable to the differences in technical characteristics of buildings, socio-economic categories of tenants and their propensity to save energy.
Most of the buildings applied HCAs only for the last two or three years. The analysis of a longer series including more heating seasons in the future period would provide an answer to the question on long-term sustainability of energy savings achieved in the short-term. As documented in previous researches related to long-term sustainability of energy savings, a certain proportion of rebound effect in energy consumption could be potentially expected in the future [
29,
30]. An unfavorable social position of a certain proportion of Croatian users of energy delivered by district heating systems (especially for low income pensioners and unemployed persons) could be a factor behind their motivation to reduce heat energy consumption to the level which significantly decreases their quality of life but ensures a short return period of the HCA investment. Energy savings over 25% under unchanged energy properties of a building could indicate a reduction in the interior temperature of an apartment for up to 4 °C. In certain proportion, the reliability of the results could be limited by the approach applied—a total decrease in the specific energy consumption (corrected for weather conditions) is assumed to be related exclusively to HCA installation. Some other factors such as changes in the relative price of heat energy, the income of the inhabitants, better insulations of buildings or other variables could also affect trends in energy consumption. Prices of heat energy in Croatia are controlled by the government agency and have been unchanged for the last 7 heating seasons and the impact on the trends in heat energy consumption is not significant. On the other hand, an increase in the employment rate and labor income as a result of upward phase in economic cycle could decrease the motivation for savings. Better insulation conducted for a certain %age of buildings in the recent period could also result in the decrease of energy consumption. Unfortunately, the database of local distributors of heat energy do not provide additional information on the socioeconomic status of residents, the current status or improvements in energy efficiency of buildings. If available, those variables could be used in econometric modelling and thus improve the reliability and robustness of estimates.
An average energy savings of 25% or even more promoted by installing HCAs positively contribute to the realization of the strategic goals in the field of energy efficiency. The social benefits related to the reduction in emission of this policy measure are high and it in some degree contributed to the [
2] conclusion that Croatia is on the right track to achieve the required cumulative energy savings by 2020.
The cost-effectiveness assessment of installing the HCAs on the regional market significantly differs. For the cities located in Continental Croatia where the heat energy costs are low due to a higher share of deliveries from cogeneration plants, it can be concluded with certainty that savings of 25% due to individual metering do not ensure a positive net present value if the initial specific energy requirements are lower than 170 kWh/m2. Having in mind the distribution of buildings regarding initial energy consumption, the legal obligation to install heat cost allocators probably resulted in a certain share of buildings that do not fully recover the investment costs. For buildings in this group of cities, with a specific consumption of less than 146 kWh/m2 even savings of 30% results in a negative NPV.
In the other towns located in Continental Croatia with higher market prices of heat energy, individual metering generally could be assessed as cost-effective if savings higher than 20% are achieved. In the city of Rijeka, where the energy requirements are lower due to milder winters, energy savings of 25% result in a positive net present value for an initial consumption of over 95 kWh/m2.
According to the Croatian law on heat energy, final heat energy users are responsible to bear all costs and investment risks related to installing HCAs while local heat energy suppliers practically do not have any role in the process of transformation towards individual metering. The final users are required not only to invest funds into HCAs and other equipment but also to engage a third party (usually the company which delivered the equipment) for regularly reading the devices and delivering the data to the local heat energy operators. This way, the cost of the billing services has been doubled, while the local heat energy operators take no responsibility for potential errors in the HCA impulse reading. The Croatian legislation on individual metering is expected to change in 2019. Despite the legal obligation, one third of the buildings still haven’t installed HCA. Based on the findings of this research, the Croatian government should reconsider the possibility of subsidizing HCA installation, at least for buildings where specific energy consumption is below the national average and in areas where the price of heat energy is low.
A more comprehensive analysis of all the processes including the production, distribution and consumption of heat energy in future research could provide a more in-depth assessment of the entire district heat energy network efficiency. It could be increased not only by the reduced consumption of the final users but also by investing into new technologies in the process of heat energy production and reconstructing the old distribution infrastructure which are responsible for certain losses in heat energy because of their physical deterioration. The sustainable use of energy and combating climate changes according to the European strategic goals require the application of different measures. The socio-economic impact of energy saving renovation measures on the Croatian economy have been analyzed in Mikulic et al. [
20]. A comparative analysis of the costs and benefits of such investments in relation to the funds invested in HCA would contribute to a better understanding of the overall heat energy system and the assessment of social costs and benefits of the alternative energy policy measures.


