Article

Comparison Study of Induction Motor Models Considering Iron Loss for Electric Drives

1
College of Mechanical and Electronic Engineering, Shandong University of Science and Technology, Qingdao 266590, China
2
Qingdao VECCON Electric Co., Ltd., Qingdao 266200, China
3
College of Electrical Engineering and Automation, Shandong University of Science and Technology, Qingdao 266590, China
*
Authors to whom correspondence should be addressed.
Energies 2019, 12(3), 503; https://doi.org/10.3390/en12030503
Submission received: 10 January 2019 / Revised: 26 January 2019 / Accepted: 30 January 2019 / Published: 5 February 2019
(This article belongs to the Special Issue Progresses in Advanced Research on Intelligent Electric Vehicles)

Abstract

:
In a variety of motor models, the effects of iron-loss (ILS) on motor control accuracy and efficiency are generally ignored. This makes it difficult for the motor control system to obtain accurate control parameters (especially on high speed and low load conditions), and limits the improvement of motor control accuracy. This paper aims to clarify the influence of different ILS modeling and observation methods on motor control performance. Three equivalent models of motors with iron losses are compared. These models are: A parallel model, a series model and the simplified traditional model. Three tests are conducted to obtain the effect of ILS perturbation on ILS estimation results, and then to derive the sensitivity of the motor state and torque to the perturbation. These test conditions include: Ideal no-load, heavy-load, locked-rotor, and ILS perturbations during speed regulation. Simulation results show that the impedance and excitation characteristics of the series model and the parallel model are similar, and the traditional model has the best speed regulation smoothness. The ILS estimation errors of the series model is nearly constant and easy to compensate. For accurate ILS observation results, the series model can achieve better control accuracy.

1. Introduction

Motor control systems characterized with high-speed and high-efficiency are needed in centrifugal equipment and electric vehicles [1,2]. As an important part of the model parameters and motor losses, iron-loss (ILS) affects the flux observation [3], parameter identification [4], real-time torque and speed control [5], speed sensor less control [6] accuracy and efficiency optimal control [7,8], and, to some extent, performance.
The loss model is dominated by the parallel model [9], the Γ model [10], and the inverse Γ model [11]. In [12], a simplified model that ignores leakage inductance was used to simplify the loss analysis, but it had significant errors in a high-speed region [13]. As an improvement, the study [13] used a simplified model that can be seen as ignoring the shunt effect of the parallel ILS resistance or the partial pressure effect of series ILS resistance, but the accuracy of this model was still less than that of a series or parallel model. The series loss model [14] is relatively simple, but the difference in ILS estimation based on series model and parallel model has not been accurately explored.
The parallel model has many different circuit forms [3,9,15,16]. Two studies [10,17] transformed the circuit into a stationary coordinate system for further simplification and equivalent relationship analysis. Since voltage and current control quantities are given in the rotating coordinate system, it is difficult to apply such a circuit directly to vector control. However, it can avoid the equivalent circuit difference caused by the different expression of the coupling electromotive force. At this point, the circuit is simpler and easier to categorize and compare. It can be clearly seen from the vector circuit in the stationary coordinate system that the parallel model is equivalent to the Γ model and the inverse-Γ model. These models can be traced back to the modeling methods proposed by an earlier study [18] that considered ILS and magnetic saturation.
By taking an approximation of the inductance effect and model parameters, the T-form transient equivalent circuit was obtained in [19,20]. Compared with the parallel model, the series model reduced the order, and simplified the structure, while it also weakened the applicable conditions. In this model, the magnetizing inductance that changed with the frequency was regarded as invariable, as a result, it leads to different degrees of distortion with different frequencies. This kind of error and distortion will inevitably adversely affect control performance and loss estimation.
Unlike loss analysis, the motor control, state observation, and parameters identification rely more on models in state-space forms. For the parallel model, the air gap flux vector was reserved as an additional state variable in [3,17]. The parallel model had a more detailed description of the motor, but a higher model order and a scalar matrix with many zero elements. This meant a redundant description capability. The system matrix parameters can be very complex while deriving the state Equation from the series circuit model directly. In order to simplify the parameters, one study [21] made use of the steady-state circuit Equations of the series model, while [22] omitted the smaller leakage inductance product term in the derivation process. In the state space models derived, as an important use of the ILS resistance, the matrix of the two models were both simplified by compensating the deviation of the traditional model state, but the latter has more accurate transient compensation than the former. In addition, there was a π model with ILS resistors in parallel with the stator inductance [23]. It can be transformed into a simple T-form transient circuit by using power transfer, and has a state Equation in which the transmission matrix is not zero. However, as a simplified parallel model, the π model has more specific circuit parameters and matrix parameters, which mean that it has no obvious advantage in accuracy, convenience, and universality. There are also further studies on improved models that consider pulse-width modulation (PWM) power supply [24,25] and spatial harmonics [26,27]. This is helpful for providing methods that can calculate loss under non-ideal conditions, but at present, the calculation accuracy of the ILS under the basic sinusoidal or fundamental wave also needs improving.
It is noteworthy that eddy current losses account for a large proportion of ILS [19]. In [5,20], they showed that ILS can also be described by the equivalent resistance when considering the hysteresis and eddy currents of both the stator and rotor. In this case, the resistance was the parallel connection of all. The eddy current winding modeling method can describe various models uniformly and reflects the rationality and significance of a parallel and series model.
The influence of ILS on the motor efficiency and the accuracy of the control system is complex. Different models have their own advantages and disadvantages. Using appropriate models to quantify the impact of ILS, and then proposing corresponding improvements for different applications, is the current research priority.
This paper aims to clarify the influence of different ILS modeling and observation methods on motor control performance. Three types of motor equivalent models related to ILS are comparatively studied. They include the parallel and series models and the traditional simplified models. MATLAB scripts and Simulink S-Function simulation models were written for comprehensive testing. The deviation of the flux observation introduced by the model simplification, the frequency characteristics of the excitation functions of the three models, as well as the frequency characteristics of the impedance function, were also tested to provide a reference for torque control deviations. These tests consider ideal no-load, heavy-load, and locked-rotor conditions. It can reflect the effect of ILS in the motor control system under different loads and power frequencies.

2. State Equations and Transfer Relations of the Models

Three excitation winding representations were derived from three models. The transient equivalent circuit is shown in Figure 1. Under the approximate conditions, the topology and parameters were the same except for the excitation and the ILS branch. It is also considered that the excitation inductance of the three models are the same.
The three models are described by a third-order vector state Equation [28]. The standard form of the state Equation is
x ˙ = A x + B u y = C x
where x = [is ψr im]T, u = us, y = is, the output matrix C = [1  0  0], and the state matrix and input matrix of the three models are shown in Table 1.
The vector form of the torque Equations [28,29] for the three models are given by (2)
t e = p 0 L m L r σ Im ( ψ r * i m ) t e = p 0 Im ( ψ r * i r ) = p 0 Im [ ψ r * ( 1 L r j R M ψ r L m j R M L r j R M i s ) ] t e = p 0 L m L r Im ( ψ r * i s )
From the state Equation (1) and the parameters in Table 1, the driving point admittance functions for the parallel and series model are derived as (3) and (4), and the function of the traditional model can be obtained letting Rm = 0 in the series model.
i s u s = 1 L s σ j ω s + R s + R F e R F e [ 1 + L m j ω f / ( L r σ j ω f + R r ) ] j ω s L m / R F e + 1 + L m j ω f / ( L r σ j ω f + R r )
i s u s = 1 R s 1 + T r j ω f + j R m / ( ω s L r ) 1 σ T s T r ω s ω f σ T s R m / L r + j R m / ( ω s L r ) + T r j ω f + T s j ω s
The stator current excitation functions are derived as (5) and (6). The transfer function of the stator voltage to the rotor flux is the product of the driving point admittance function (3) or (4) and the corresponding stator current excitation function (5) or (6).
ψ r i s = R r L m ( L m j ω s / R F e + L r / L r σ ) ( L r σ j ω f + R r ) L m R r / L r σ
ψ r i s = L m T r j ω f + 1 + j R m / ( ω s L r )
The relationship between the ILS branch currents and state variables of the parallel and series model are
i F e = i s L r L r σ i m + 1 L r σ ψ r
i M = 1 L r j R M ψ r L r σ L r j R M i s
In addition, in the parallel model
i m = ( j ω f L r σ + R r ) / ( R r L m ) ψ r
Substituting (9) into (7) eliminates im. To get the relationship between the ILS current and the rotor flux, then substitutes (7) into (5) and (8) into (6). Letting P stand for the parallel and S for the series model variable, the expressions are shown by (10).
i F e = G P ( j ω s ) ψ r P ,   i M = G S ( j ω s ) ψ r S
where, G P ( j ω s ) = ( L m j ω s / R F e + L r / L r σ ) ( L r σ j ω f + R r ) L m R r / L r σ R r L m L r L r σ j ω f L r σ + R r R r L m + 1 L r σ and G S ( j ω s ) = 1 L r j R M L r σ L r j R M T r j ω f + 1 + j R M / L r L m .
In the parameter sensitivity analysis of the observer, the flux-ratio function is often introduced to measure the amplitude and phase deviation of flux observations [30]. Derived by dividing the two voltage excitation functions, the ψrS/ψrP function is significant in the steady state analysis of the flux and ILS deviations for different models and observers. ILS ratio function PFeS/PFeP was introduced to measure the accuracy of ILS estimation. Since PFeP = RFe × iFe × iFe, PFeS = Rm × iM × iM, then
P F e S P F e P = R m R F e ( | G S ( j ω s ) G P ( j ω s ) | | ψ r S ψ r P | ) 2

3. Experimental Setup

To compare the differences in the model characteristics, the MATLAB (R2017b, MathWorks, Natick, MA, USA) script and Simulink S-Function simulation model were written based on the Equations (2). The ILS resistance empirical perturbation assumption was adopted to simulate and test the model. The power supply is an ideal sine wave. For discrete simulation, the first-order forward Euler method was used for discretization, and the sampling time was 10μs. The 0 and 1 slips were to simulate the ideal no-load and locked-rotor respectively, and the 5% slip was to simulate the heavy load. The rated parameters of the motor used are shown in Table 2. The simulation contents and methods are shown in Table 3.
The empirical perturbation used the empirical formula of the hysteresis and eddy current loss of the electrical machinery PFe = kf1.3B2m, and the ILS resistance can be expressed as RFe = RFe0(f/f0)0.7, so as to simulate the value of the ILS equivalent resistance cannot be known [31]. Assuming that only the stator ILS is considered, the relationship between the steady state ILS resistance of the series model and the ILS resistance of the parallel model can be approximated as Rm ≈ (ωsLm)2/RFe [19].

4. Results and Discussion

4.1. Impedance Characteristics and Excitation Characteristics

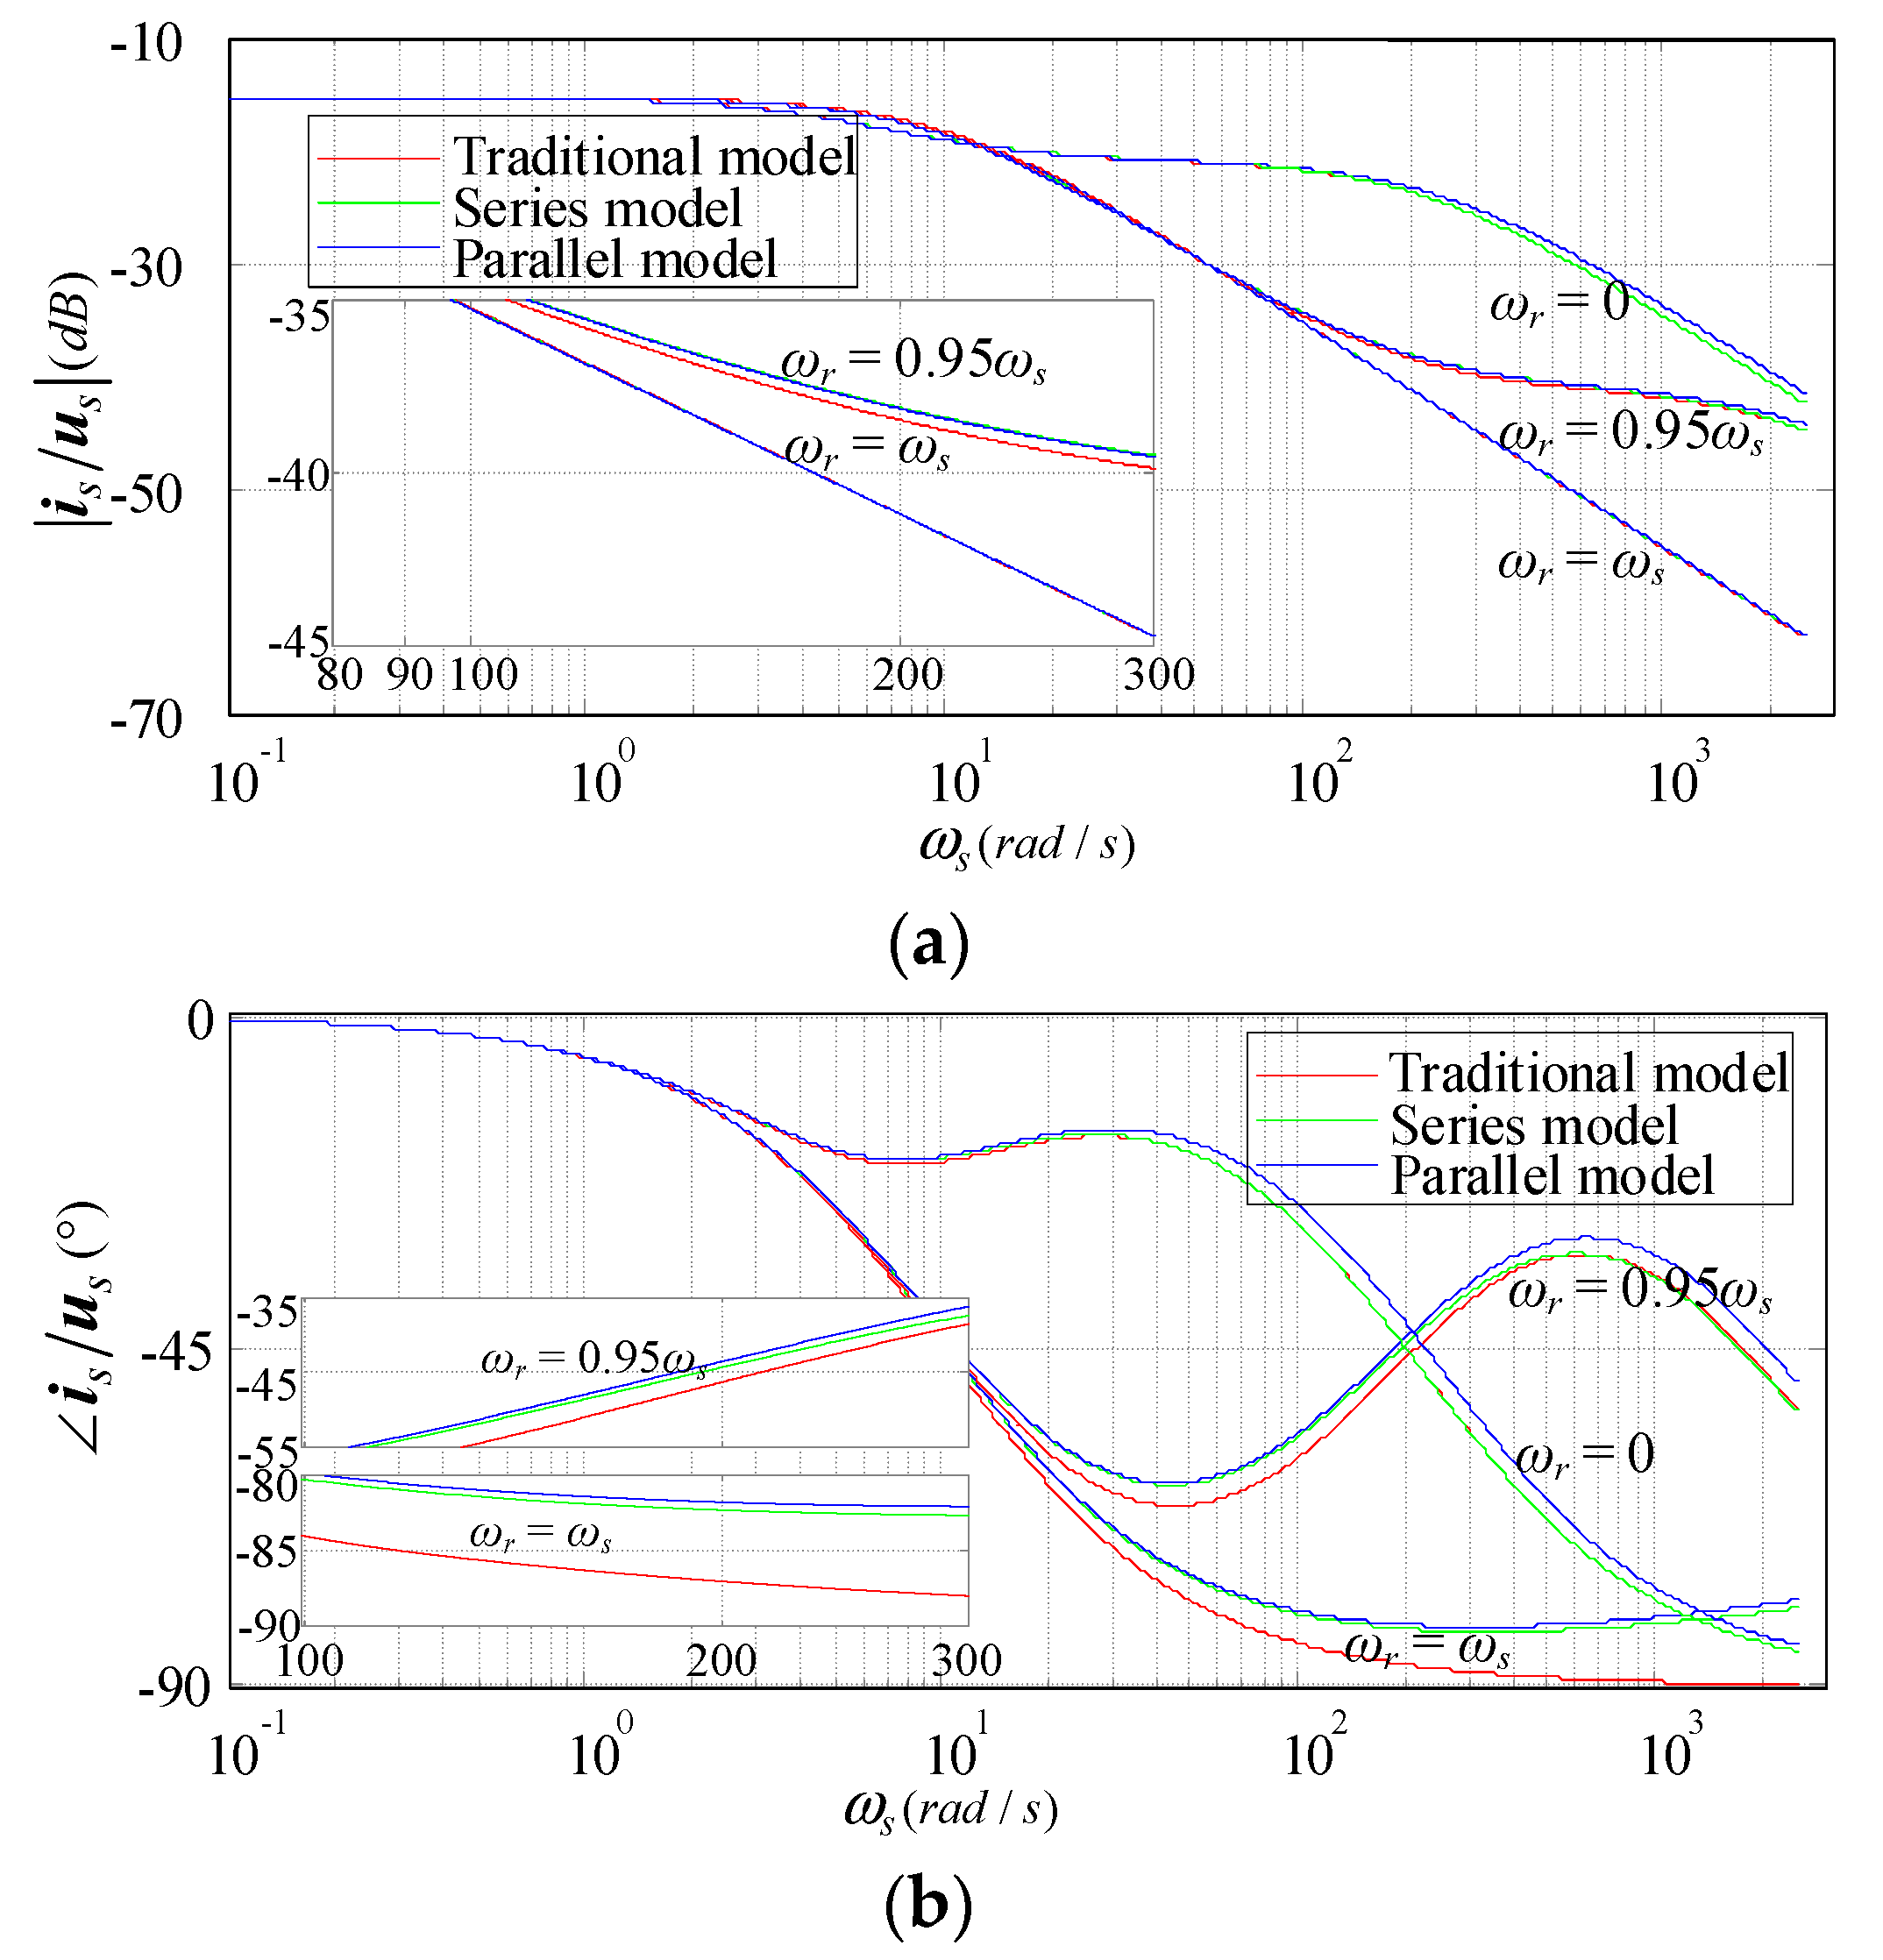
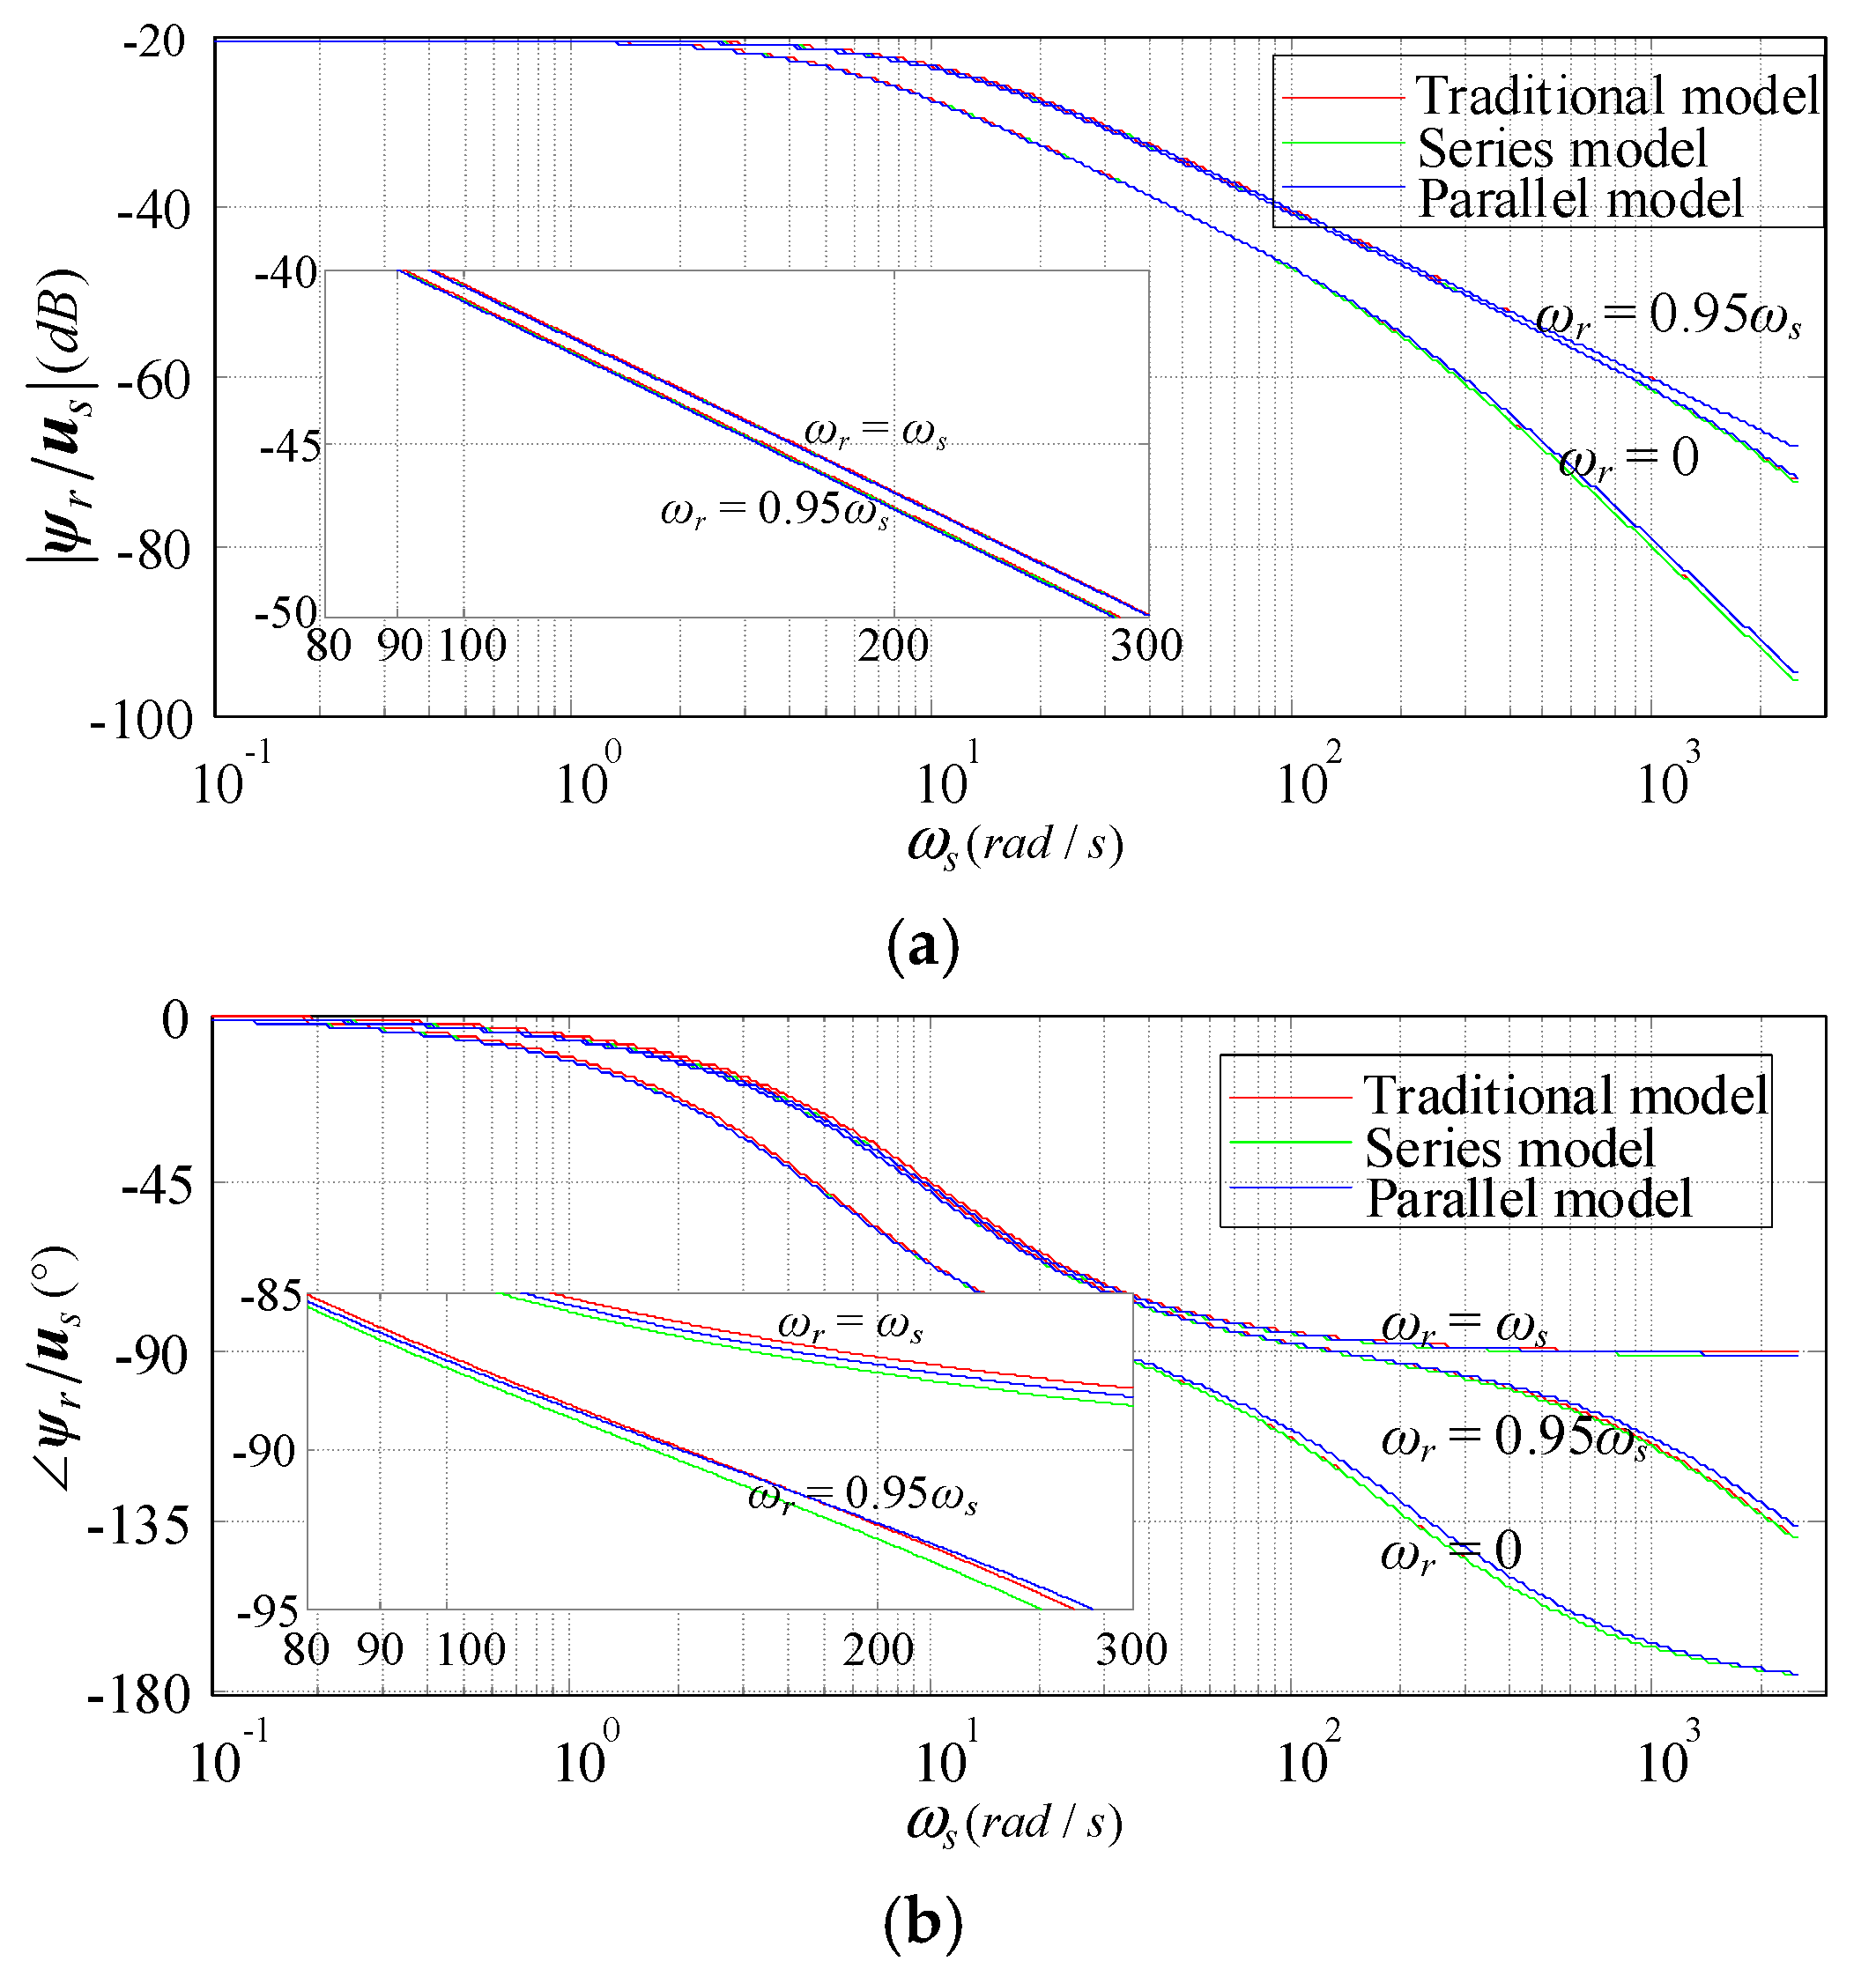
According to the driving point admittance function (3) and (4) and the motor parameters in Table 3, a Bode plot under empirical perturbation is shown in Figure 2. In the figure, different models are distinguished by color, and curves for each model under ideal no-load, heavy-load, and locked-rotor are plotted, respectively. The curves for locked-rotor characteristic and the above-mentioned part of the fundamental frequency are only used as reference and contrast without practical significance. The important part (about 15 to 48 Hz) in the fundamental frequency range is highlighted at the lower left corner of the figure, which is convenient for observing the specific magnitude of the deviation. Similarly, the Bode plot for the voltage excitation characteristic is shown in Figure 3.
According to Figure 2, it can be seen that the characteristics of different models were far less affected by the frequency than the slip conditions, and the amplitude and phase differences caused by different models under the same conditions increased with increasing frequency. In Figure 2a, the amplitude-frequency characteristics of the three models under ideal no-load were almost completely coincident. The parallel and series models agreed well under heavy load, and the maximum deviation of the traditional model was only about 1 dB. The results in Figure 2b show that the load had a large influence on the power factor of the motor, and the phase-frequency characteristics of the three operating conditions had different trends. The no-load and heavy-load finally tend to −90° and −45°, respectively. The maximum deviation of the series model relative to the parallel model was only about 1° under the two conditions, while the maximum deviation of the traditional model was about 7° in high-frequency and no-load condition. Different from the steady-state one-port equivalent transformation, the reduced order simplification of the dynamic model will have slight deviations. However, unlike the locked-rotor characteristic, this deviation is negligible under normal conditions. There are some differences in frequency characteristics as a result of the simplification of series-to-traditional model. From the parallel, the series to the traditional model, the amplitude gain decreased, and the phase lag increased in turn. That is, model transformation and simplification make the impedance modulus and impedance angle slightly larger. In general, this deviation is small relative to the true value. In other words, the three models had a consistent description of the motor characteristics, and it is reasonable and scientific that the vector control based on the traditional model can be widely used. Converting the ILS resistance in the driving point admittance function (3) (4) into a similar form, it can be seen that the difference between the parallel and series models was only a coefficient of the leakage inductance level, and the product of this coefficient and the synchronous angular frequency will make the difference slightly larger at high frequencies. The difference between the series model and the traditional model is the transient ILS resistance in series, was no more than 0.01. However, the ILS resistance is a function of the synchronous angular velocity, which will amplify the influence of frequency on the impedance and cause the traditional model to have a certain deviation.
It can be seen from Figure 3 that the excitation characteristics of the three models were very close and the deviation was smaller than the impedance characteristic. Increasing the slip will increase the flux lag angle and will hardly change the amplitude gain. In Figure 3a, neither the model nor the operating conditions in the fundamental frequency range had any effect on the amplitude-frequency characteristics of the excitation. The six curves were almost completely coincident. It can be seen from the enlarge figure that the amplitude deviation between the high slip and no-load conditions was only about 0.5 dB. The deviation in the phase-frequency characteristic Figure 3b was also much smaller than the impedance angle deviation. The series model and the traditional model were in close proximity to the parallel model curve. In detail, under the no-load condition, the lag angle of the traditional model was slightly smaller and the series model was slightly larger. Under the heavy load condition, the lag angle of the traditional model swung near the parallel model and that of the series model was slightly larger, but the maximum error was only about 1°. The results show that the ILS had less influence on the excitation and the flux had a characteristic of large damping. It can be seen that the observation error of traditional flux observer was not large, and the current control deviation will be the main reason that affects the control performance. Since the ILS affects the excitation branch in the series model, the simplification of the dynamic model will have some distortion in the excitation characteristics, and the phase deviation of the traditional model is comparable to the series model occasionally.

4.2. ILS Characteristics

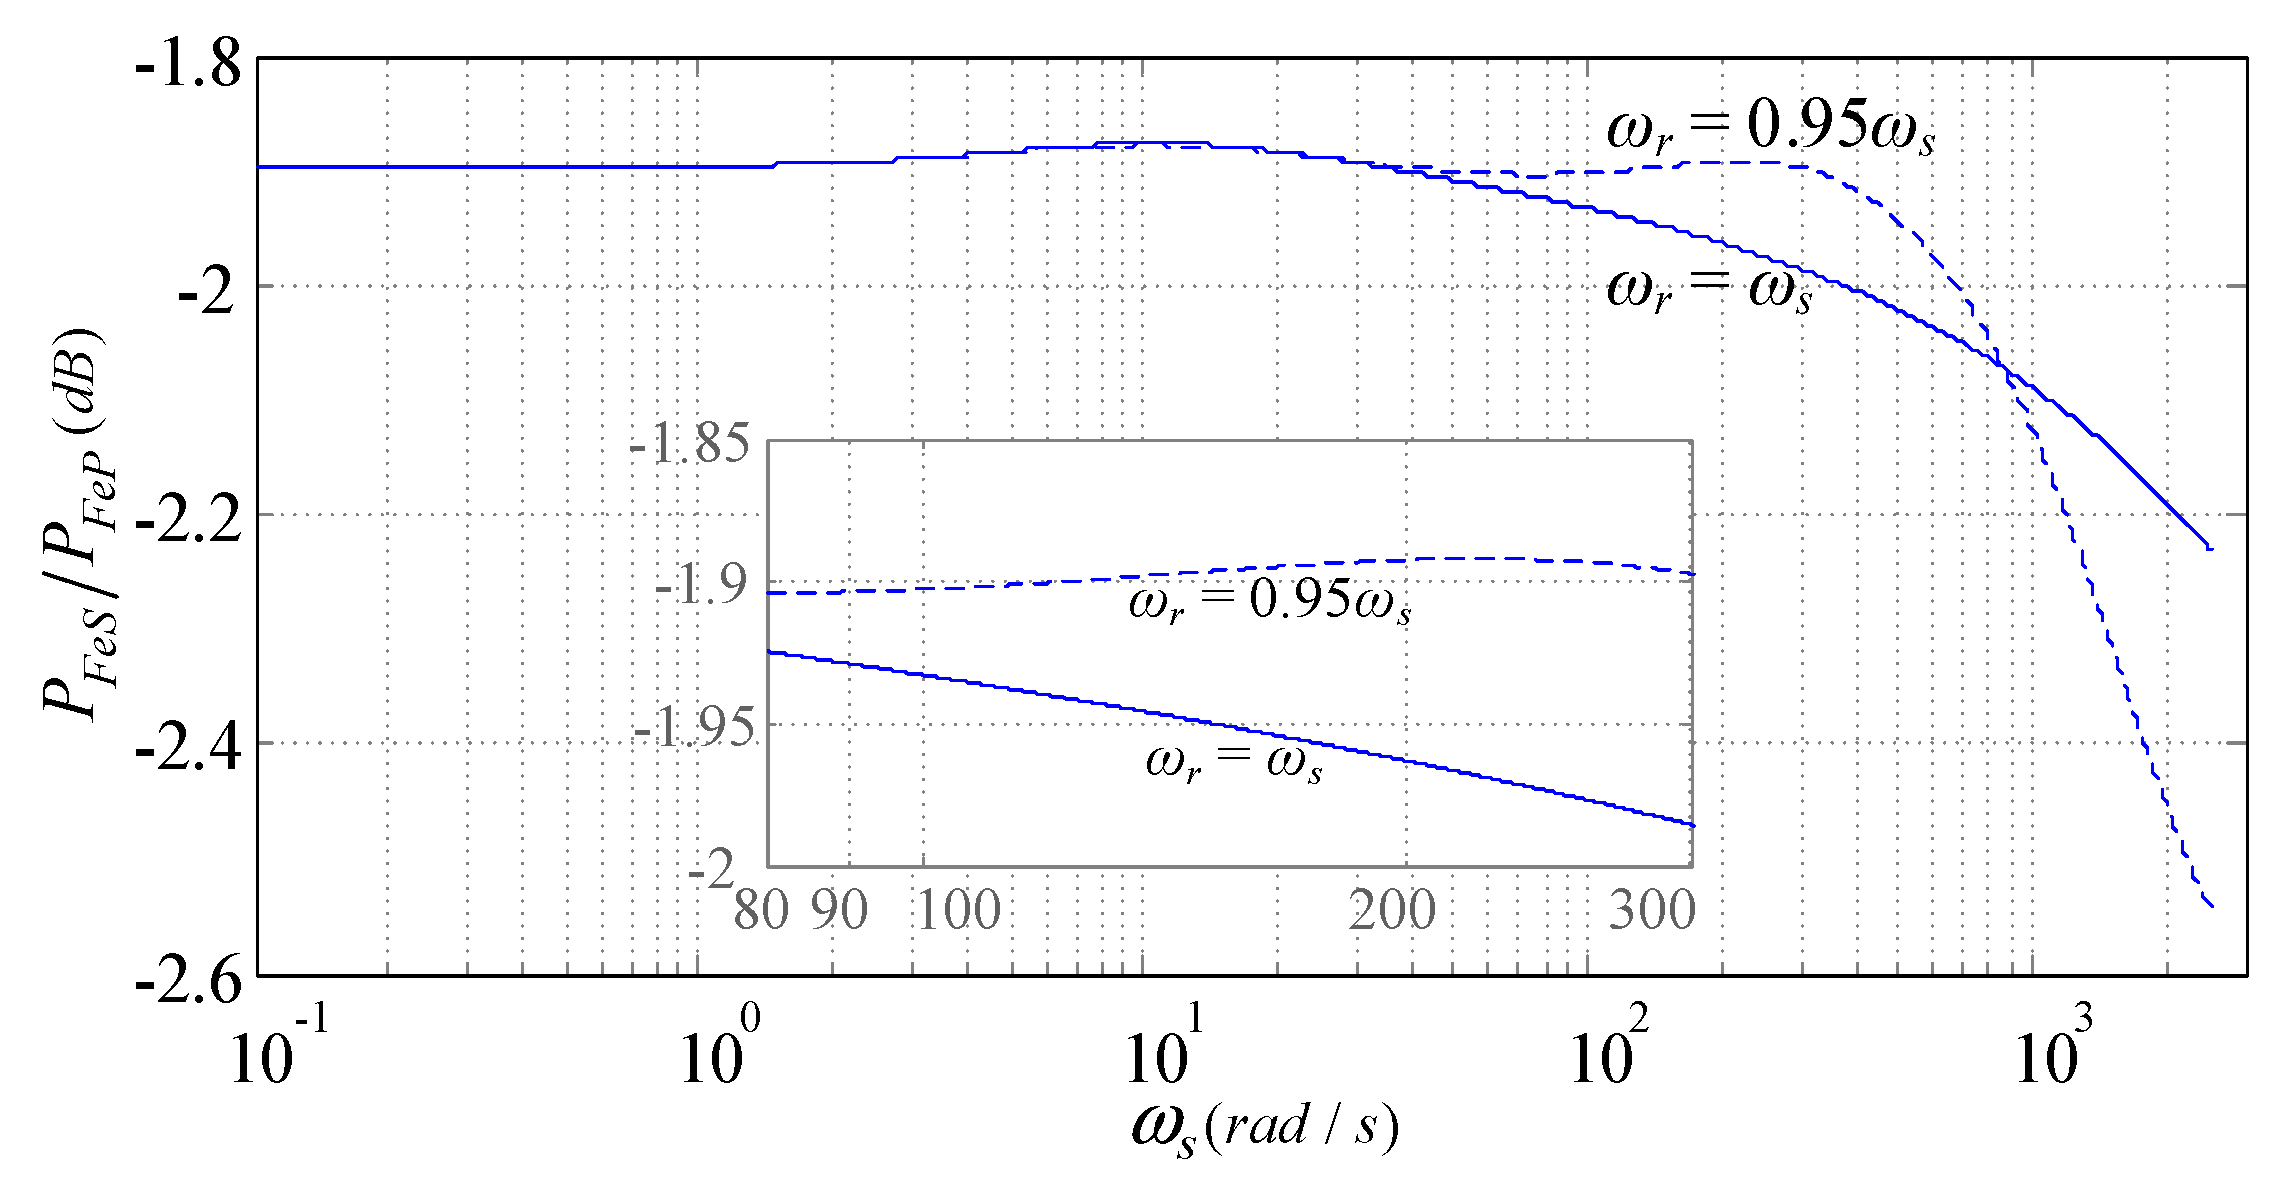
The ILS ratio function curve in logarithmic coordinates is plotted as shown in Figure 4. It can be seen in Figure 4 that the ILS of the series model was smaller than that of the parallel model. It means that the model transformation had some deviations in the expression of ILS. In detail, the ILS under heavy load condition was relatively stable, and the gain value in the fundamental frequency range was basically −1.9 dB above and below; while under no-load conditions, it was weakly attenuated with increasing frequency, and the fundamental frequency gain was approximately −1.998 dB. The actual gains under the two operating conditions were not significantly different, with all being around 0.8. From (11), since the flux deviation is very small, the difference mainly comes from the transfer function (10). Similar to the impedance characteristic, if the deviation of the leakage inductance is completely omitted in the transfer function, the ILS ratio is approximately 20%. The deviation should essentially be related to the two approximations from parallel to series conversion and series circuit to state Equation conversion, and as a quadratic quantity, the power has an amplification effect on the error. In Section 4.1, the amplitude was less affected by the load than the phase in each transfer relationship. The power is equivalent to the product of the square of the current vector magnitude and the resistance, as a result, the ILS ratio should be less affected by the load.

4.3. Dynamic Characteristics

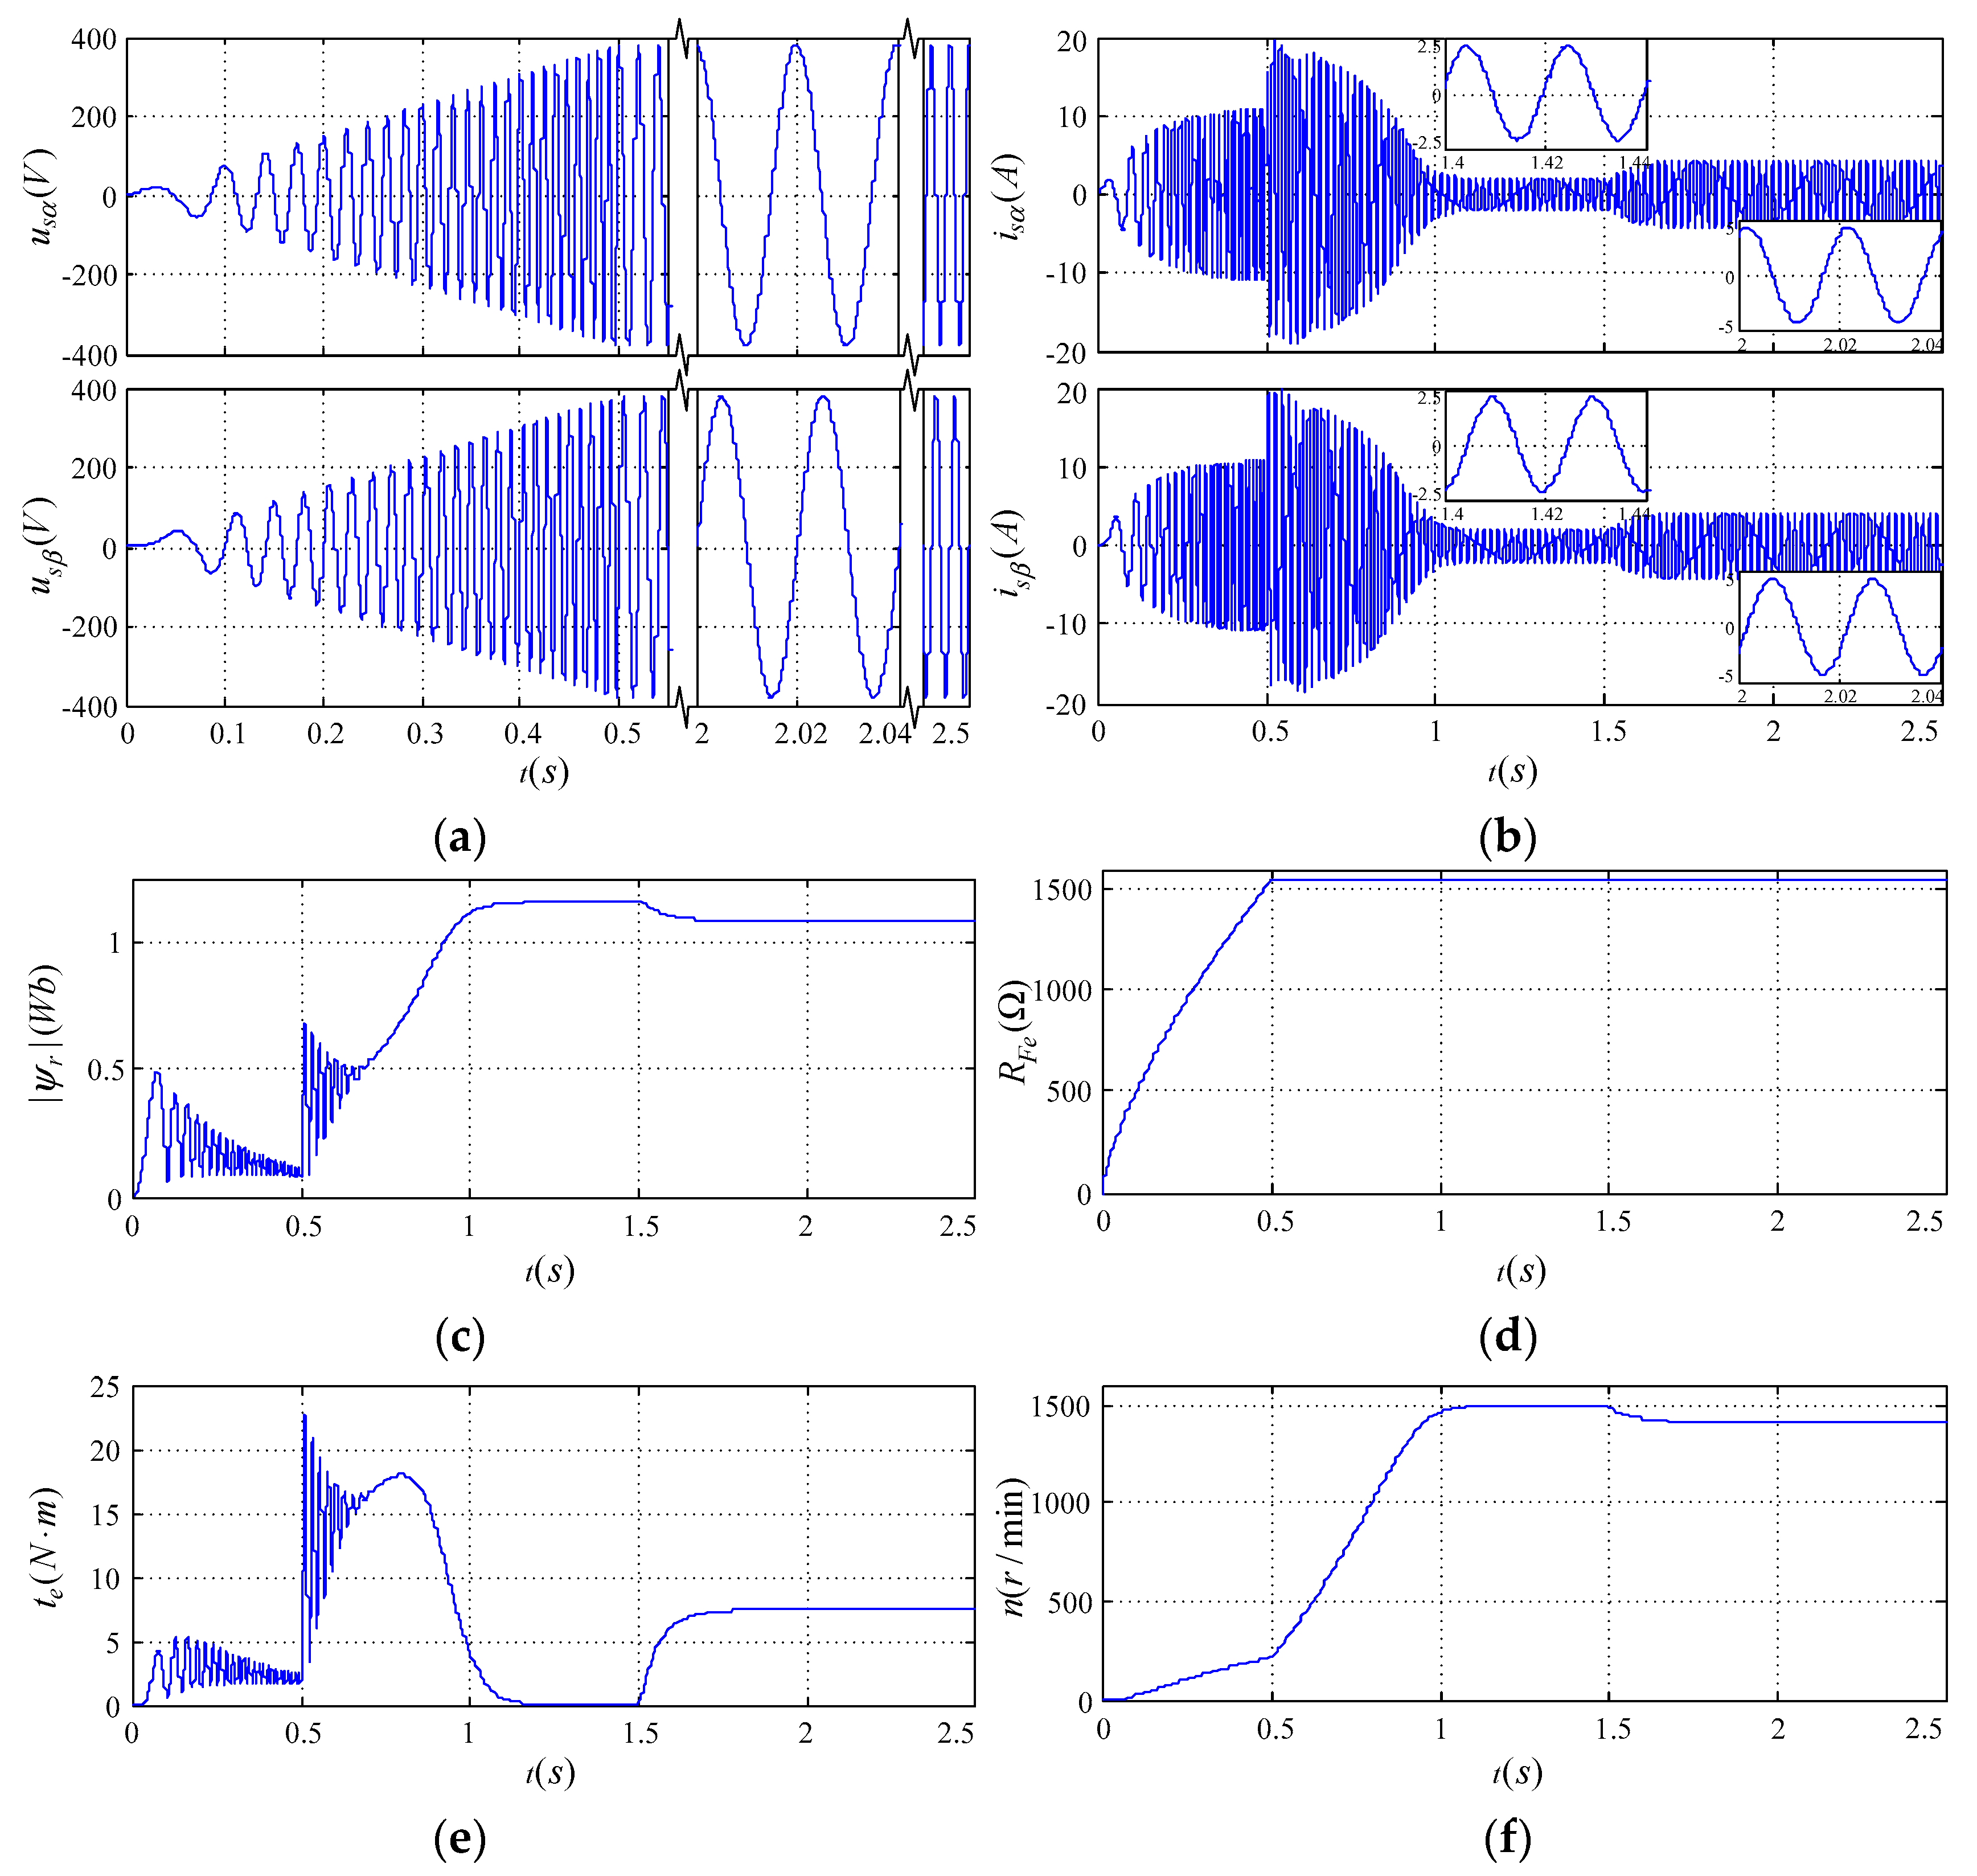
The Simulink simulation model was constructed based on the state Equation (1) and the parameters in Table 1, and the dynamic response of the parallel model was tested with the method in Table 2. Under the action of a ramp input, the motor response is shown in Figure 5.
In the discrete simulation test, the stability range of the parallel state Equation was related to the ILS resistance and sampling time. For example, the Equation was stable when the sampling time was less than 10 μs and the ILS resistance was less than 2500 Ω. The reason for this is that the matrix parameters of the state space model were closely related to the ILS resistance and leakage inductance. Among them, many of the state matrix parameters in Table 1 contain the product of the reciprocal of the leakage inductance or even the square of the reciprocal leakage inductance and the ILS resistance, and the input matrix coefficient was also the reciprocal of the stator leakage inductance. This makes the matrix parameter of the parallel model very large, resulting in large and sensitive discrete errors, requiring more precise numerical algorithms and smaller sampling times.
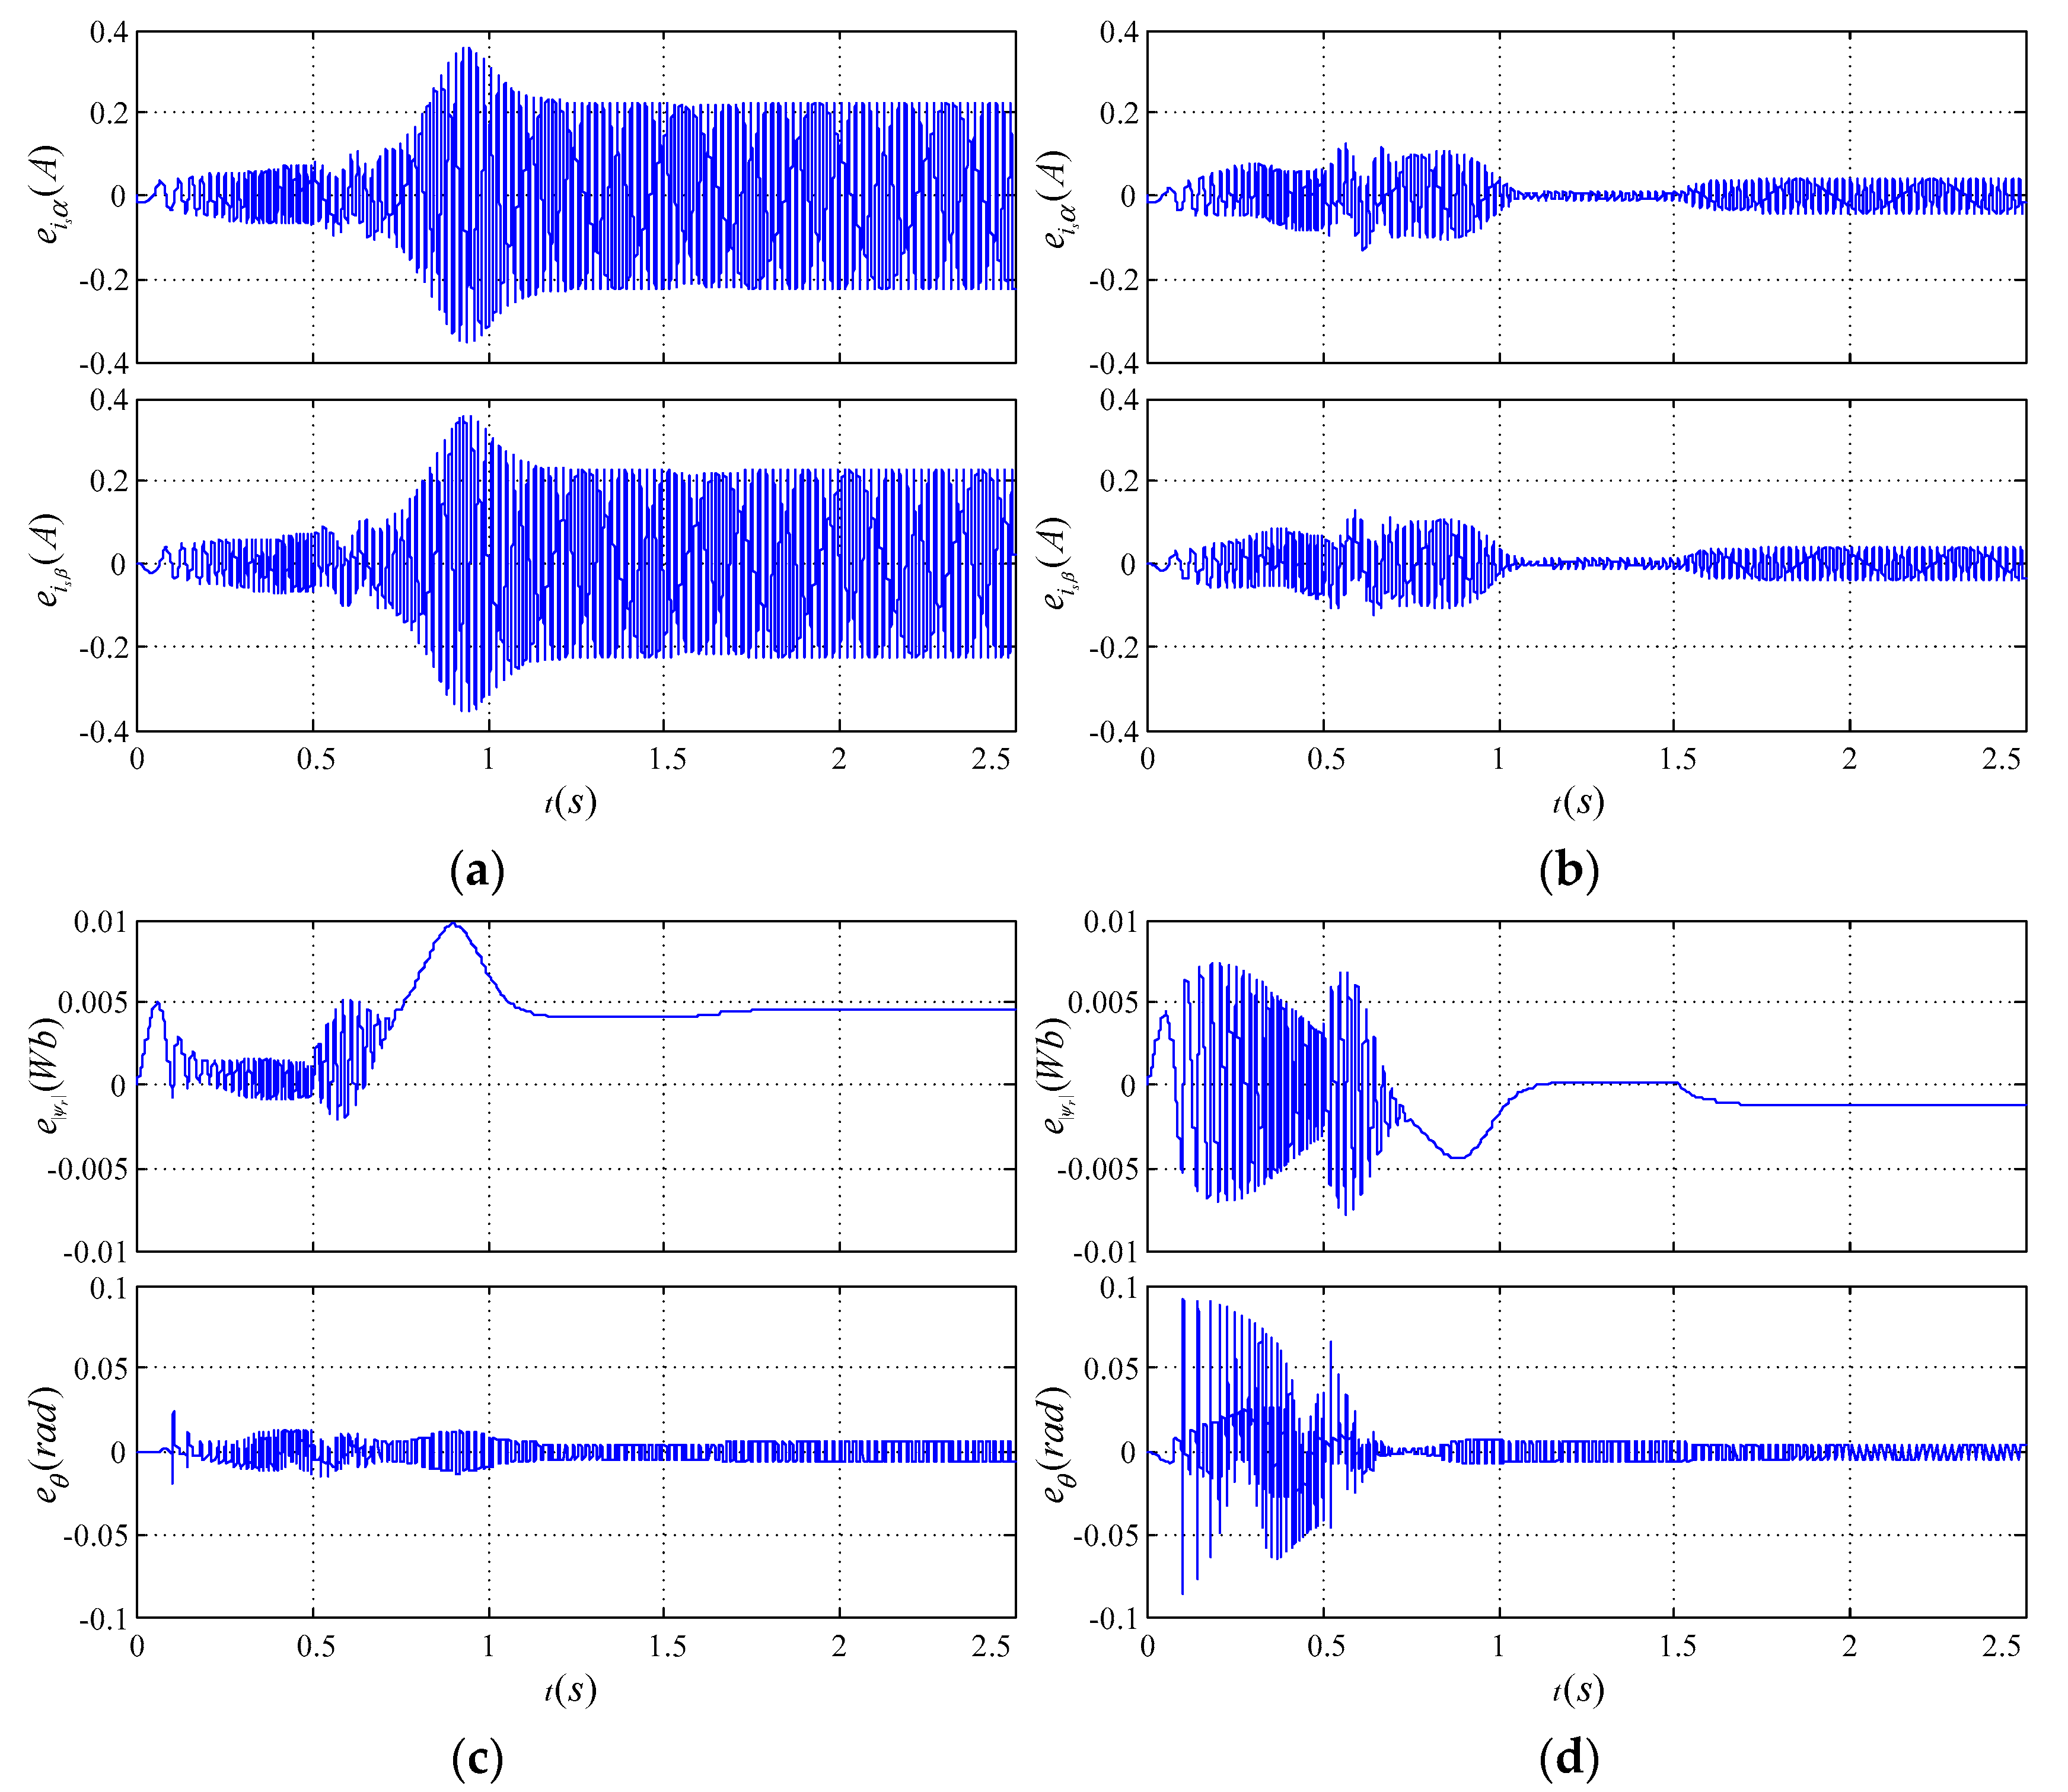
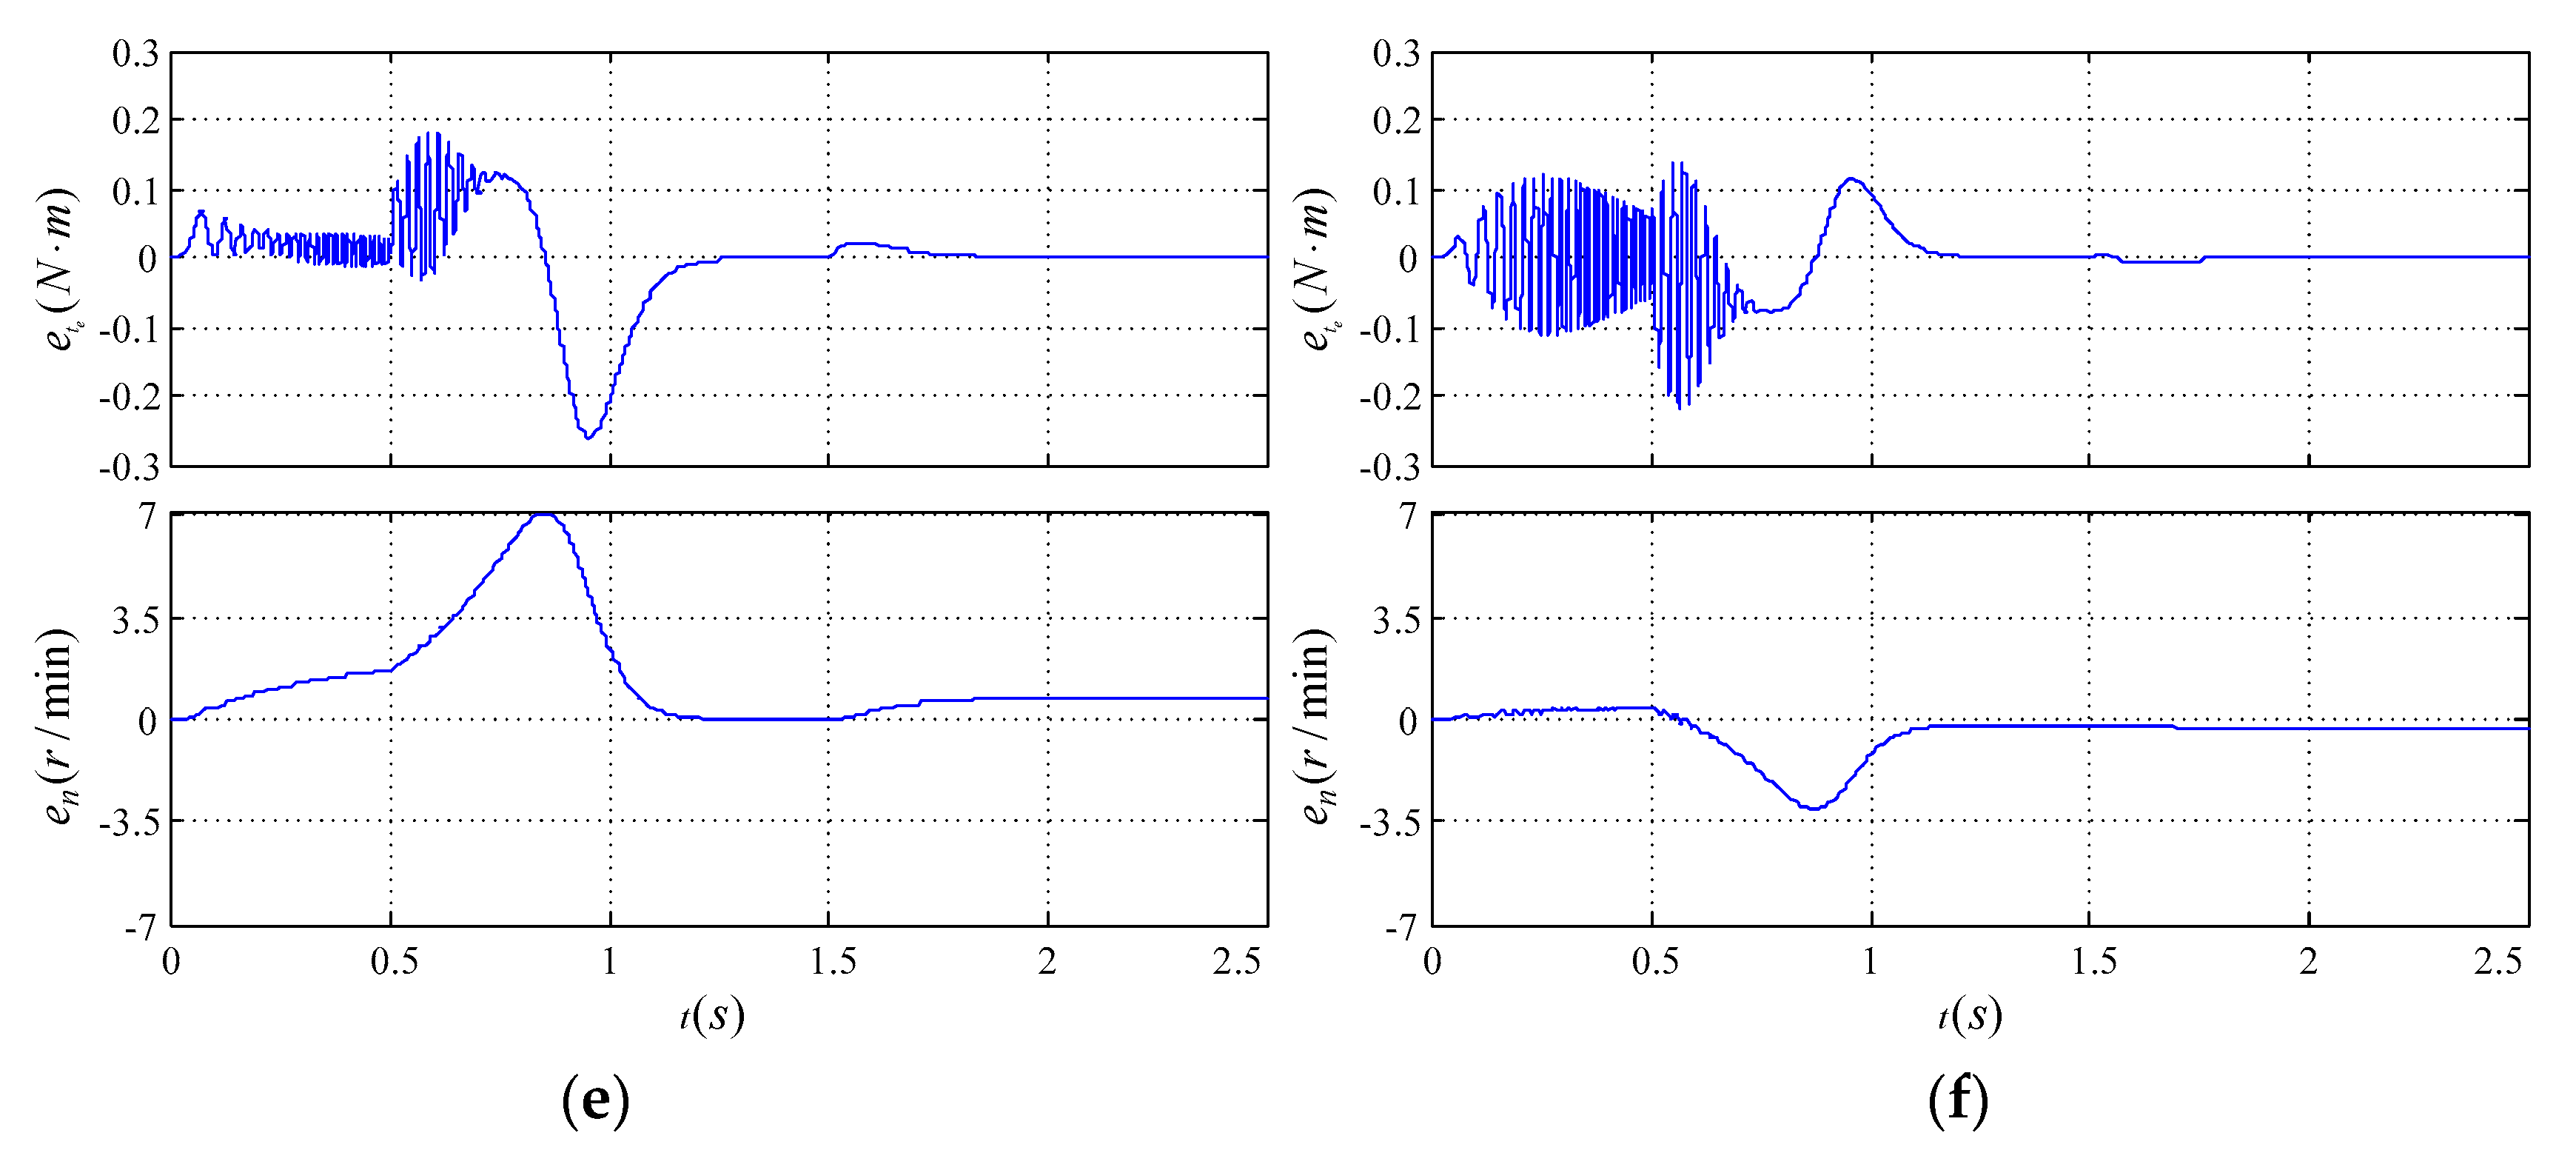
Taking the parallel model as a benchmark, the error response curves of the relative parallel model of the series model and the traditional model are plotted respectively in Figure 6.
From the error responses of the traditional model and the series model in Figure 6, the trend of each error waveform and the time at which the peak appears were basically the same, and the errors are in the same order of magnitude. The steady-state error of the series model was significantly smaller than that of the traditional model, but the dynamic deviation was slightly larger and it oscillated back and forth between positive and negative values. In the figure, the current, torque, speed, and flux error peaks all occurred around 0.9 s. According to the given conditions and responses of the parallel model in Figure 5, this was the final period for the response process getting into a steady state. Among them, the traditional model peak time sequence was rotation speed, flux linkage, current, and torque. The peak time of the speed and the flux of the series model occurred earlier and was not much different There was no obvious peak time for the current error, and the torque peak occurred later. The response oscillation was essentially related to the intrinsic characteristics of the ILS resistance in the series model. The ILS resistance under dynamic had the inductive characteristics of coupling between the two axes, and the magnitude was a function of frequency, which directly determined that the dynamic response in the frequency conversion process was not smooth enough.
Comparing Figure 5a with Figure 5b, it is known that the current error of the two models during the constant V/F phase is comparable, but there were errors, several times that of the series model, in the response of traditional model while getting into a steady state and loading process. Comparing Figure 5c with Figure 5d, the error sign of the magnetic flux amplitude of the two models was opposite. The dynamic error of the series model was larger than the traditional model, but the steady-state error was smaller than the traditional model. The deviation of the flux rotation angle of the series model showed positive and negative oscillations in the dynamic process and this is comparable to the traditional model in the steady state. From Figure 5e,f, the torque error of the traditional model during the start-up process was from positive to negative and the series model was the opposite. Since it is the derivative of the rotational speed, the zero crossing of the torque determines the peak value of the speed error. It can also be seen that the speed of the traditional model was greater than the parallel model and the series model was smaller than the parallel model. In the dynamic process, the torque error of the series model also showed positive and negative oscillations, but the speed error was smaller than the traditional model. In the loading process after 1.5 s, both the torque and the speed error of the series model were smaller than the traditional model. The steady-state speed errors of both models were less than 1 r/min. The error of the series model electromagnetic torque is generally smaller than the traditional model. As a large-inertia mechanical variable, the speed was hardly affected by the torque oscillation generated by the ILS resistance. Its dynamic and steady-state characteristics were superior to the traditional model. Comparing the torque Equation (2) for each model, the expression of the traditional model was equivalent to calculating the electromagnetic torque by replacing the excitation current vector with the stator current vector of the parallel model and ignoring the transfer relationship between the two variables. The series model used the transient ILS resistance to correct the torque dynamic deviation, which can be seen as an approximate expression of the above current transfer relationship. This shows that the compensation of the series model was effective, and the mechanical characteristics presented by the series model were similar to the parallel model and superior to the traditional model. The ILS deviation will affect the relationship between real torque and given torque in speed control system. A reasonable compensation can guarantee the linear relationship between the given torque and the real torque for good system performance.

5. Conclusions

In this paper, three types of motor equivalent models related to ILS were studied; a parallel model, series model and the simplified traditional model. An ideal sinusoidal power supply was used in the simulation test, and the ILS resistance perturbation was simulated using the empirical formula of ILS proportional to frequency 1.3 power. Test results show that:
  • Under ideal no-load and heavy-load, the impedance and excitation characteristics of the series model were closer to the parallel model. Compared with the parallel model, the deviation of the excitation characteristics of the traditional model was small, that is, the observation error of the traditional flux observer was not large, and the torque control accuracy was greatly affected by the current control deviation.
  • Compared with the parallel model, there was an error in estimating ILS using the series model, but the error was, approximately 20% constant, insensitive to load and frequency. As the error is easy to compensate, series model can be used directly as a loss model.
  • The discretization of the parallel model required a smaller sampling time or a more accurate numerical algorithm. In the speed open-loop and constant V/F speed regulation process, the dynamic response smoothness of the series model was not as good as that of the traditional model due to the influence of the equivalent ILS parameter. However, the speed compensation of the state Equation and the ILS effect compensation of the torque Equation were significant. Therefore, the series model can effectively replace the complex parallel model to improve the control accuracy of the traditional model under the condition that the ILS resistance is described accurately.
In addition, treating ILS as a parametric perturbation instead of a structural deviation in parallel model, the series model has the advantage of simplifying analysis. It is also easy to benefit from previous research results because of the similarity of the series model and traditional model in structural characteristics and analytical ideas.

Author Contributions

Conceptualization, R.H. and Z.Y.; methodology, R.H.; software, K.W.; validation, X.Z., F.L. and L.Z.; formal analysis, R.H. and K.W.; investigation, Z.Y.; resources, Z.Y. and R.H.; data curation, Z.Y. and K.W.; writing—original draft preparation, K.W.; writing—review and editing, Z.Y.; visualization, L.Z. and F.L.; supervision, R.H.; project administration, Z.Y.; funding acquisition, Z.Y. and R.H.

Funding

This work was funded by Natural Science Foundation of Shandong Province, grant number ZR2017MEE072, ZR2017MEE025; the National Natural Science Foundation of China, grant number 51575323, 51774193 and 61305129; and the Project of Shandong Province Higher Educational Science and Technology Program, grant number J15LN18.

Conflicts of Interest

The authors declare no conflict of interest.

References

  1. Zhong, Y.; Huang, S.; Luo, D. Stabilization and speed control of a permanent magnet synchronous motor with dual-rotating rotors. Energies 2018, 11, 2786. [Google Scholar] [CrossRef]
  2. Liu, B.; Badcock, R.; Shu, H.; Fang, J. A superconducting induction motor with a high temperature superconducting armature: Electromagnetic theory, design and analysis. Energies 2018, 11, 792. [Google Scholar] [CrossRef]
  3. Pablo, M.; Bossio, G.R.; Solsona, J.A.; García, G.O. On-line iron loss resistance identification by a state observer for rotor-flux-oriented control of induction motor. Energy Convers. Manag. 2008, 49, 2742–2747. [Google Scholar]
  4. Chatterjee, D. Impact of core losses on parameter identification of three-phase induction machines. IET Power Electronics 2014, 7, 3126–3136. [Google Scholar] [CrossRef]
  5. Chen, W.L.; Cheng, K.M.; Chen, K.F. Derivation and verification of a vector controller for induction machines with consideration of stator and rotor core losses. IET Electric Power Appl. 2018, 12, 1–11. [Google Scholar] [CrossRef]
  6. Yamamoto, S.; Hirahara, H.; Tanaka, A.; Ara, T.; Matsuse, K. Universal Sensorless Vector Control of Induction and Permanent-Magnet Synchronous Motors Considering Equivalent Iron Loss Resistance. IEEE Trans. Ind. Appl. 2015, 51, 1259–1267. [Google Scholar] [CrossRef]
  7. Wang, Z.; Lv, H.; Zhou, X.; Chen, Z.; Yang, Y. Design and modeling of a test bench for dual-motor electric drive tracked vehicles based on a dynamic load emulation method. Sensors 2018, 18, 1993. [Google Scholar] [CrossRef]
  8. Torrent, M.; Perat, J.I.; Jimenez, J.A. Permanent magnet synchronous motor with different rotor structures for traction motor in high speed trains. Energies 2018, 11, 1549. [Google Scholar] [CrossRef]
  9. Farasat, M.; Trzynadlowski, A.M.; Fadali, M.S. Efficiency improved sensorless control scheme for electric vehicle induction motors. IET Electric Syst. Trans. 2014, 4, 122–131. [Google Scholar] [CrossRef]
  10. Qu, Z.; Ranta, M.; Hinkkanen, M.; Luomi, J. Loss-Minimizing Flux Level Control of Induction Motor Drives. IEEE Trans. Ind. Appl. 2012, 48, 952–961. [Google Scholar] [CrossRef]
  11. Uddin, M.N.; Nam, S.W. New Online Loss-Minimization-Based Control of an Induction Motor Drive. IEEE Trans. Power Electron. 2008, 23, 926–933. [Google Scholar] [CrossRef]
  12. Garcia, G.O.; Luis, J.C.M.; Stephan, R.M.; Watanabe, E.H. An efficient controller for an adjustable speed induction motor drive. IEEE Trans. Ind. Electron. 1994, 41, 533–539. [Google Scholar] [CrossRef]
  13. Lim, S.; Nam, K. Loss-minimising control scheme for induction motors. IEE Proceed. Electric Power Appl. 2004, 151, 385–397. [Google Scholar] [CrossRef]
  14. Aissa, K.; Eddine, K.D. Vector control using series iron loss model of induction motors and power loss minimization. World Acad. Sci. Eng. Technol. 2009, 52, 142–148. [Google Scholar]
  15. Liu, Y.; Bazzi, A.M. A General Analytical Three-Phase Induction Machine Core Loss Model in the Arbitrary Reference Frame. IEEE Trans. Ind. Appl. 2017, 53, 4210–4220. [Google Scholar] [CrossRef]
  16. Sung-Don, W.; Myoung-Ho, S.; Dong-Seok, H. Stator-flux-oriented control of induction motor considering iron loss. IEEE Trans. Ind. Electron. 2001, 48, 602–608. [Google Scholar] [CrossRef]
  17. Piazza, M.C.D.; Luna, M.; Pucci, M. Electrical Loss Minimization Technique for Wind Generators Based on a Comprehensive Dynamic Modeling of Induction Machines. IEEE Trans. Ind. Appl. 2017, 53, 3696–3706. [Google Scholar] [CrossRef]
  18. Slemon, G.R. Modelling of induction machines for electric drives. IEEE Trans. Ind. Appl. 1989, 25, 1126–1131. [Google Scholar] [CrossRef]
  19. Mizuno, T.; Takayama, J.; Ichioka, T.; Terashima, M. Decoupling control method of induction motor taking stator core loss into consideration. IEEJ Trans. Ind. Appl. 1989, 109, 841–848. [Google Scholar] [CrossRef]
  20. Jung, J.; Nam, K. A vector control scheme for EV induction motors with a series iron loss model. IEEE Trans. Ind. Electron. 1998, 45, 617–624. [Google Scholar] [CrossRef]
  21. Kubota, K.; Matsuse, K. Compensation for core loss of adaptive flux observer-based field-oriented induction motor drives. In Proceedings of the 1992 International Conference on Industrial Electronics, Control, Instrumentation, and Automation, San Diego, CA, USA, 9–13 November 1992; Volume 61, pp. 67–71. [Google Scholar]
  22. Hasegawa, M.; Yamasaki, H.; Doki, S.; Okuma, S. Compensation of stator iron loss of vector-controlled induction motor using robust flux observer. Electrical Eng. Japan 2001, 137, 59–66. [Google Scholar] [CrossRef]
  23. Reed, D.M.; Hofmann, H.F.; Sun, J. Offline Identification of Induction Machine Parameters WITH Core Loss Estimation Using the Stator Current Locus. IEEE Transactions Energy Conversion 2016, 31, 1549–1558. [Google Scholar] [CrossRef]
  24. Lin, C.-K.; Yu, J.-T.; Huang, H.-Q.; Wang, J.-T.; Yu, H.-C.; Lai, Y.-S. A dual-voltage-vector model-free predictive current controller for synchronous reluctance motor drive systems. Energies 2018, 11, 1743. [Google Scholar] [CrossRef]
  25. Hildebrand, E.N.; Roehrdanz, H. Losses in three-phase induction machines fed by PWM converter. IEEE Trans. Energy Convers. 2001, 16, 228–233. [Google Scholar] [CrossRef]
  26. Wang, W.; Wang, W. Compensation for inverter nonlinearity in permanent magnet synchronous motor drive and effect on torsional vibration of electric vehicle driveline. Energies 2018, 11, 2542. [Google Scholar] [CrossRef]
  27. Lee, S.J.; Kim, J.M.; An, D.K.; Hong, J.P. Equivalent Circuit Considering the Harmonics of Core Loss in the Squirrel-Cage Induction Motor for Electrical Power Steering Application. IEEE Trans. Magnetics 2014, 50, 1–4. [Google Scholar] [CrossRef]
  28. Zhao, J.; Hua, M.; Liu, T. Research on a sliding mode vector control system based on collaborative optimization of an axial flux permanent magnet synchronous motor for an electric vehicle. Energies 2018, 11, 3116. [Google Scholar] [CrossRef]
  29. Xu, Y.; Shi, T.; Yan, Y.; Gu, X. Dual-Vector predictive torque control of permanent magnet synchronous motors based on a candidate vector table. Energies 2019, 12, 163. [Google Scholar] [CrossRef]
  30. Sun, W.; Yu, Y.; Wang, G.; Li, B.; Xu, D. Design Method of Adaptive Full Order Observer with or without Estimated Flux Error in Speed Estimation Algorithm. IEEE Trans. Power Electron. 2016, 31, 2609–2626. [Google Scholar] [CrossRef]
  31. Maraaba, L.; Al-Hamouz, Z.; Abido, M. An efficient stator inter-Turn fault diagnosis tool for induction motors. Energies 2018, 11, 653. [Google Scholar] [CrossRef]
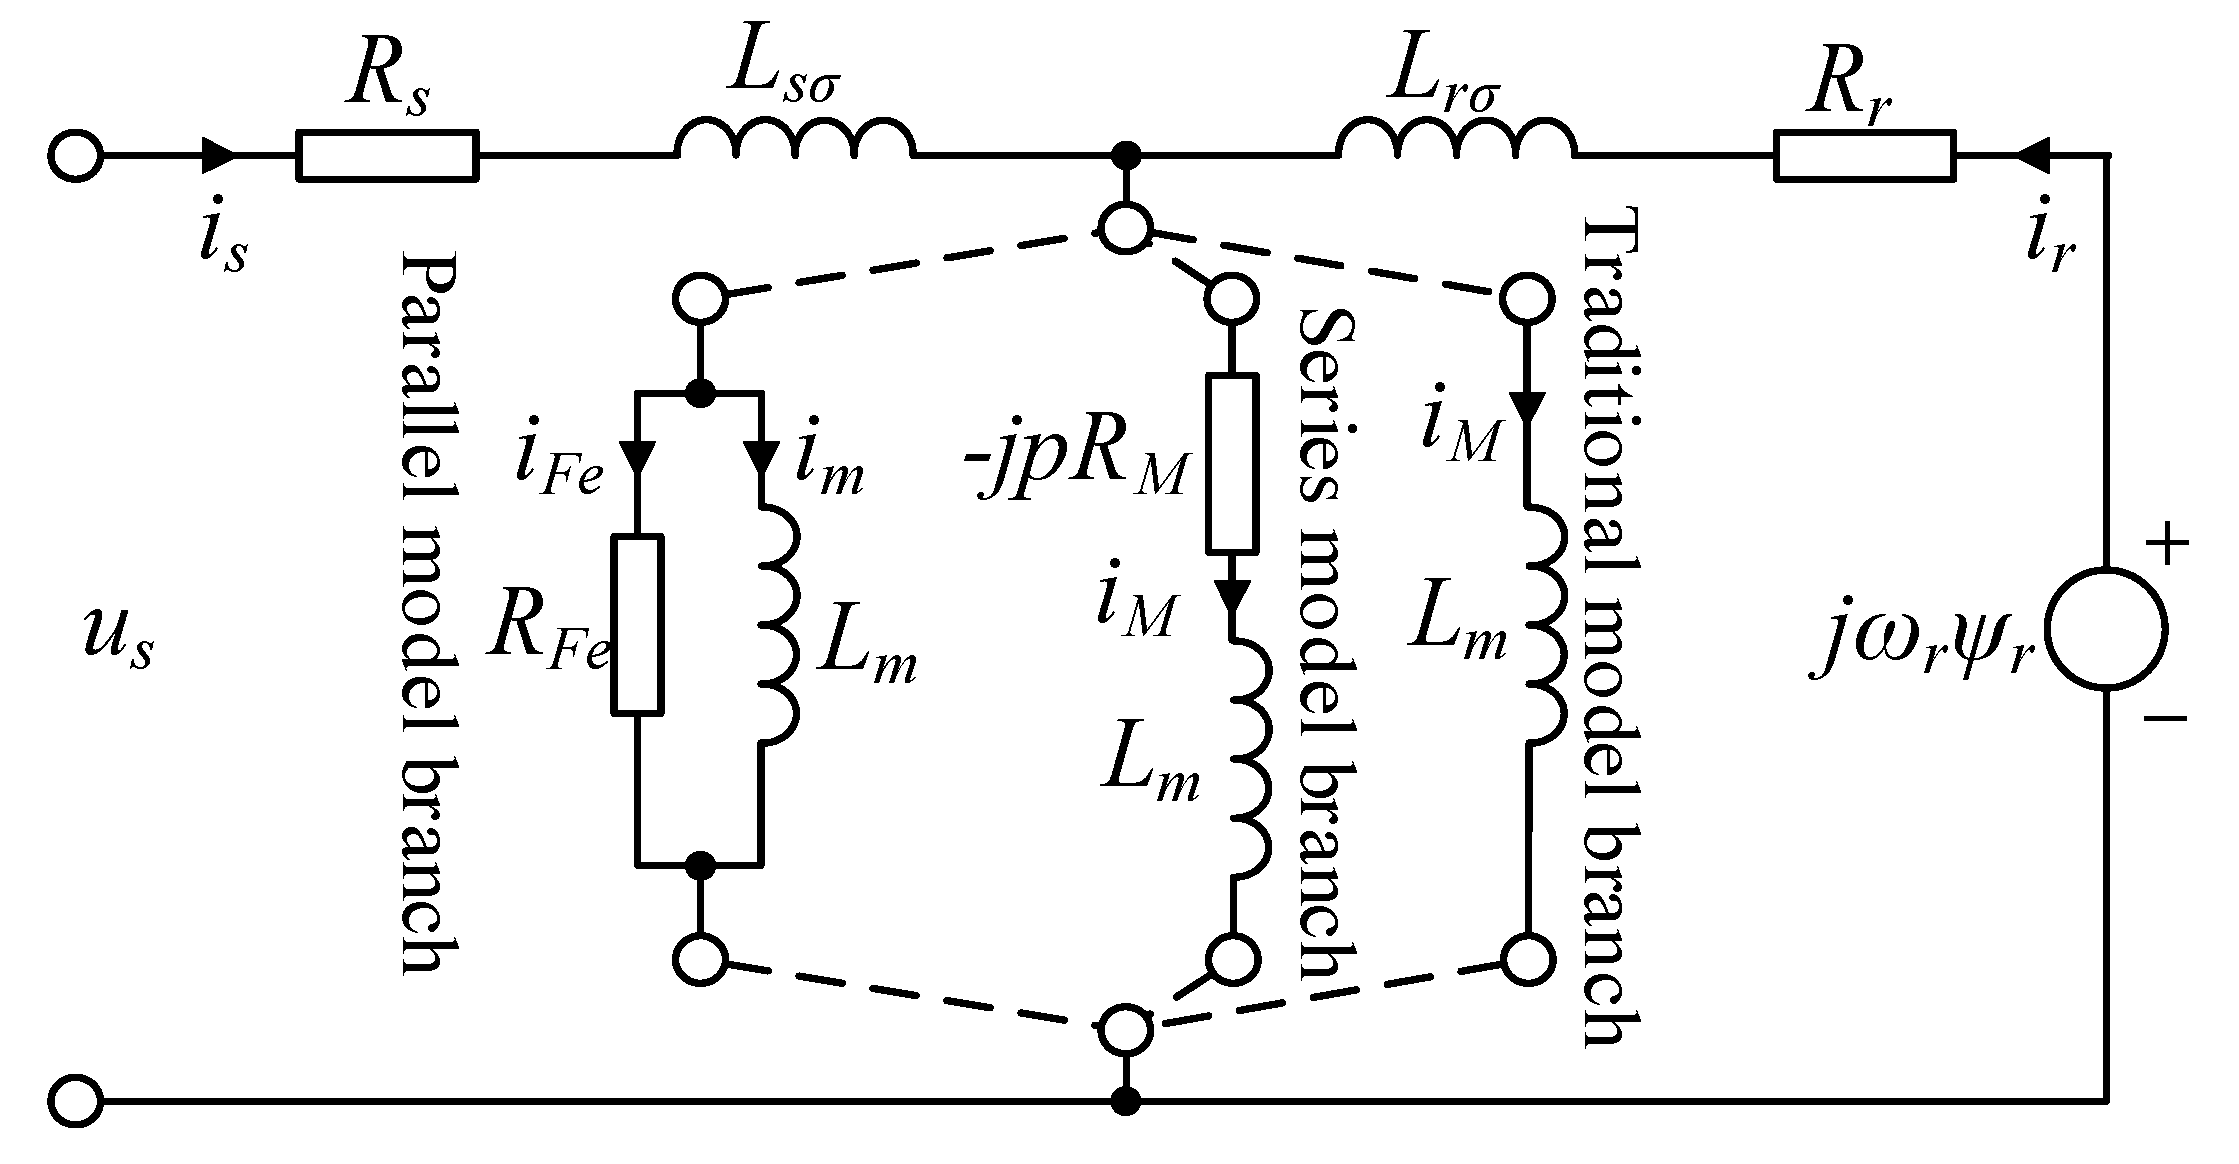
Figure 1. Transient equivalent circuits for parallel, series, and conventional model.
Energies 12 00503 g001
Figure 2. Bode plot of driving point admittance function. (a) Magnitude-frequency characteristic; (b) Phase-frequency characteristic.
Energies 12 00503 g002
Figure 3. Bode plot of stator voltage excitation function. (a) Magnitude-frequency characteristic; (b) Phase-frequency characteristic.
Energies 12 00503 g003
Figure 4. Iron-loss (ILS) ratio function of series model and parallel model.
Energies 12 00503 g004
Figure 5. Response of parallel model under given conditions. (a) Stator voltage; (b) Stator current; (c) Magnetic flux amplitude; (d) ILS equivalent resistance; (e) Electromagnetic torque; (f) Speed.
Energies 12 00503 g005
Figure 6. Dynamic response errors between parallel model, traditional model, or series model. (a) Traditional model stator current error; (b) Series model stator current error; (c) Traditional model flux linkage error; (d) Series model flux linkage error; (e) Traditional model torque and speed error; (f) Series model torque and speed error.
Energies 12 00503 g006aEnergies 12 00503 g006b
Table 1. Matrix parameters comparison of the three models.
MatrixLevi Parallel ModelHasegawa Series ModelTraditional Model
State matrix A [ a 11 a 12 a 13 0 a 22 a 23 a 31 a 32 a 33 ] [ a ¯ 11 a ¯ 12 + d 1 0 a ¯ 21 a ¯ 22 + d 2 0 0 0 0 ] [ a ¯ 11 a ¯ 12 0 a ¯ 21 a ¯ 22 0 0 0 0 ]
Input matrix B [ b 1 0 0 ] T [ b ¯ 1 0 0 ] T [ b ¯ 1 0 0 ] T
Note: a 11 = ( R s + R F e ) / L s σ , a 12 = R F e / ( L s σ L r σ ) , a 13 = L r R F e / ( L s σ L r σ ) , a 22 = j ω r R r / L r σ , a 31 = R F e / L m , a 32 = R F e / ( L m L r σ ) , a 33 = L r R F e / ( L m L r σ ) ; a ¯ 11 = 1 / ( σ T s ) ( 1 σ ) / ( σ T r ) , a ¯ 12 = ( 1 / T r j ω r ) ( 1 σ ) / ( σ L m ) , a ¯ 21 = L m / T r , a ¯ 22 = j ω r 1 / T r ; d 1 = j R M ( 1 σ ) / ( σ L m L r T r ) , d 2 = j R M / ( L r T r ) , b 1 = 1 / L s σ , b ¯ 1 = 1 / ( σ L s ) , R m = ω s R M .
Table 2. Rating parameters of the motor used in simulation.
ParameterRated ValueParameterRated Value
Rs5.9 ΩRr5.6 Ω
RFe01546 ΩRm0 ≈ ωs02Lm2/RFe019.31 Ω
RM0 = Rm0s00.061 Ω·rad/sLm0.55 H
Ls0.574 HLr0.58 H
n01500 r/min (1400 r/min)tL07.5 N·m
P01.1 kWp02.0 kW
Table 3. Experimental contents and assumptions.
Test PurposesMethods and Conditions
Impedance characteristicsPlot and compare the Bode plots of the driving point admittances for the three models under ideal no-load, heavy-load, and locked-rotor conditions.
Excitation characteristicsPlot and compare the Bode plots of the stator voltage excitation function for the three models under ideal no-load, heavy-load, and locked-rotor conditions.
ILS characteristicsPlot and observe the characteristic curve of the ILS ratios of the series model and parallel model in the logarithmic coordinate system with the motor operating frequency changing under ideal no-load and heavy-load conditions.
Dynamic characteristicsPlot and compare the dynamic response of the three models under speed regulation conditions with speed open-loop and constant V/F. From 0 to 0.5 s is the ramp response test, and the frequency rise from 0 to nominal value. After the speed stabilized, the rated load is applied at 1.5 s