Article

An Optimization Model for Construction Stage and Zone Plans of Rockfill Dams Based on the Enhanced Whale Optimization Algorithm

State Key Laboratory of Hydraulic Engineering Simulation and Safety, Tianjin University, Tianjin 300350, China
*
Author to whom correspondence should be addressed.
Energies 2019, 12(3), 466; https://doi.org/10.3390/en12030466
Submission received: 4 December 2018 / Revised: 25 January 2019 / Accepted: 28 January 2019 / Published: 1 February 2019

Abstract

:
Rockfill dams are among the most complex, significant, and costly infrastructure projects of great national importance. A key issue in their design is the construction stage and zone optimization. However, a detailed flow shop construction scheme that considers the opinions of decision makers cannot be obtained using the current rock-fill dam construction stage and zone optimization methods, and the robustness and efficiency of existing construction stage and zone optimization approaches are not sufficient. This research presents a construction stage and zone optimization model based on a data-driven analytical hierarchy process extended by D numbers (D-AHP) and an enhanced whale optimization algorithm (EWOA). The flow shop construction scheme is optimized by presenting an automatic flow shop construction scheme multi-criteria decision making (MCDM) method, which integrates the data-driven D-AHP with an improved construction simulation of a high rockfill dam (CSHRD). The EWOA, which uses Levy flight to improve the robustness and efficiency of the whale optimization algorithm (WOA), is adopted for optimization. This proposed model is implemented to optimize the construction stages and zones while obtaining a preferable flow shop construction scheme. The effectiveness and advantages of the model are proven by an example of a large-scale rockfill dam.

1. Introduction

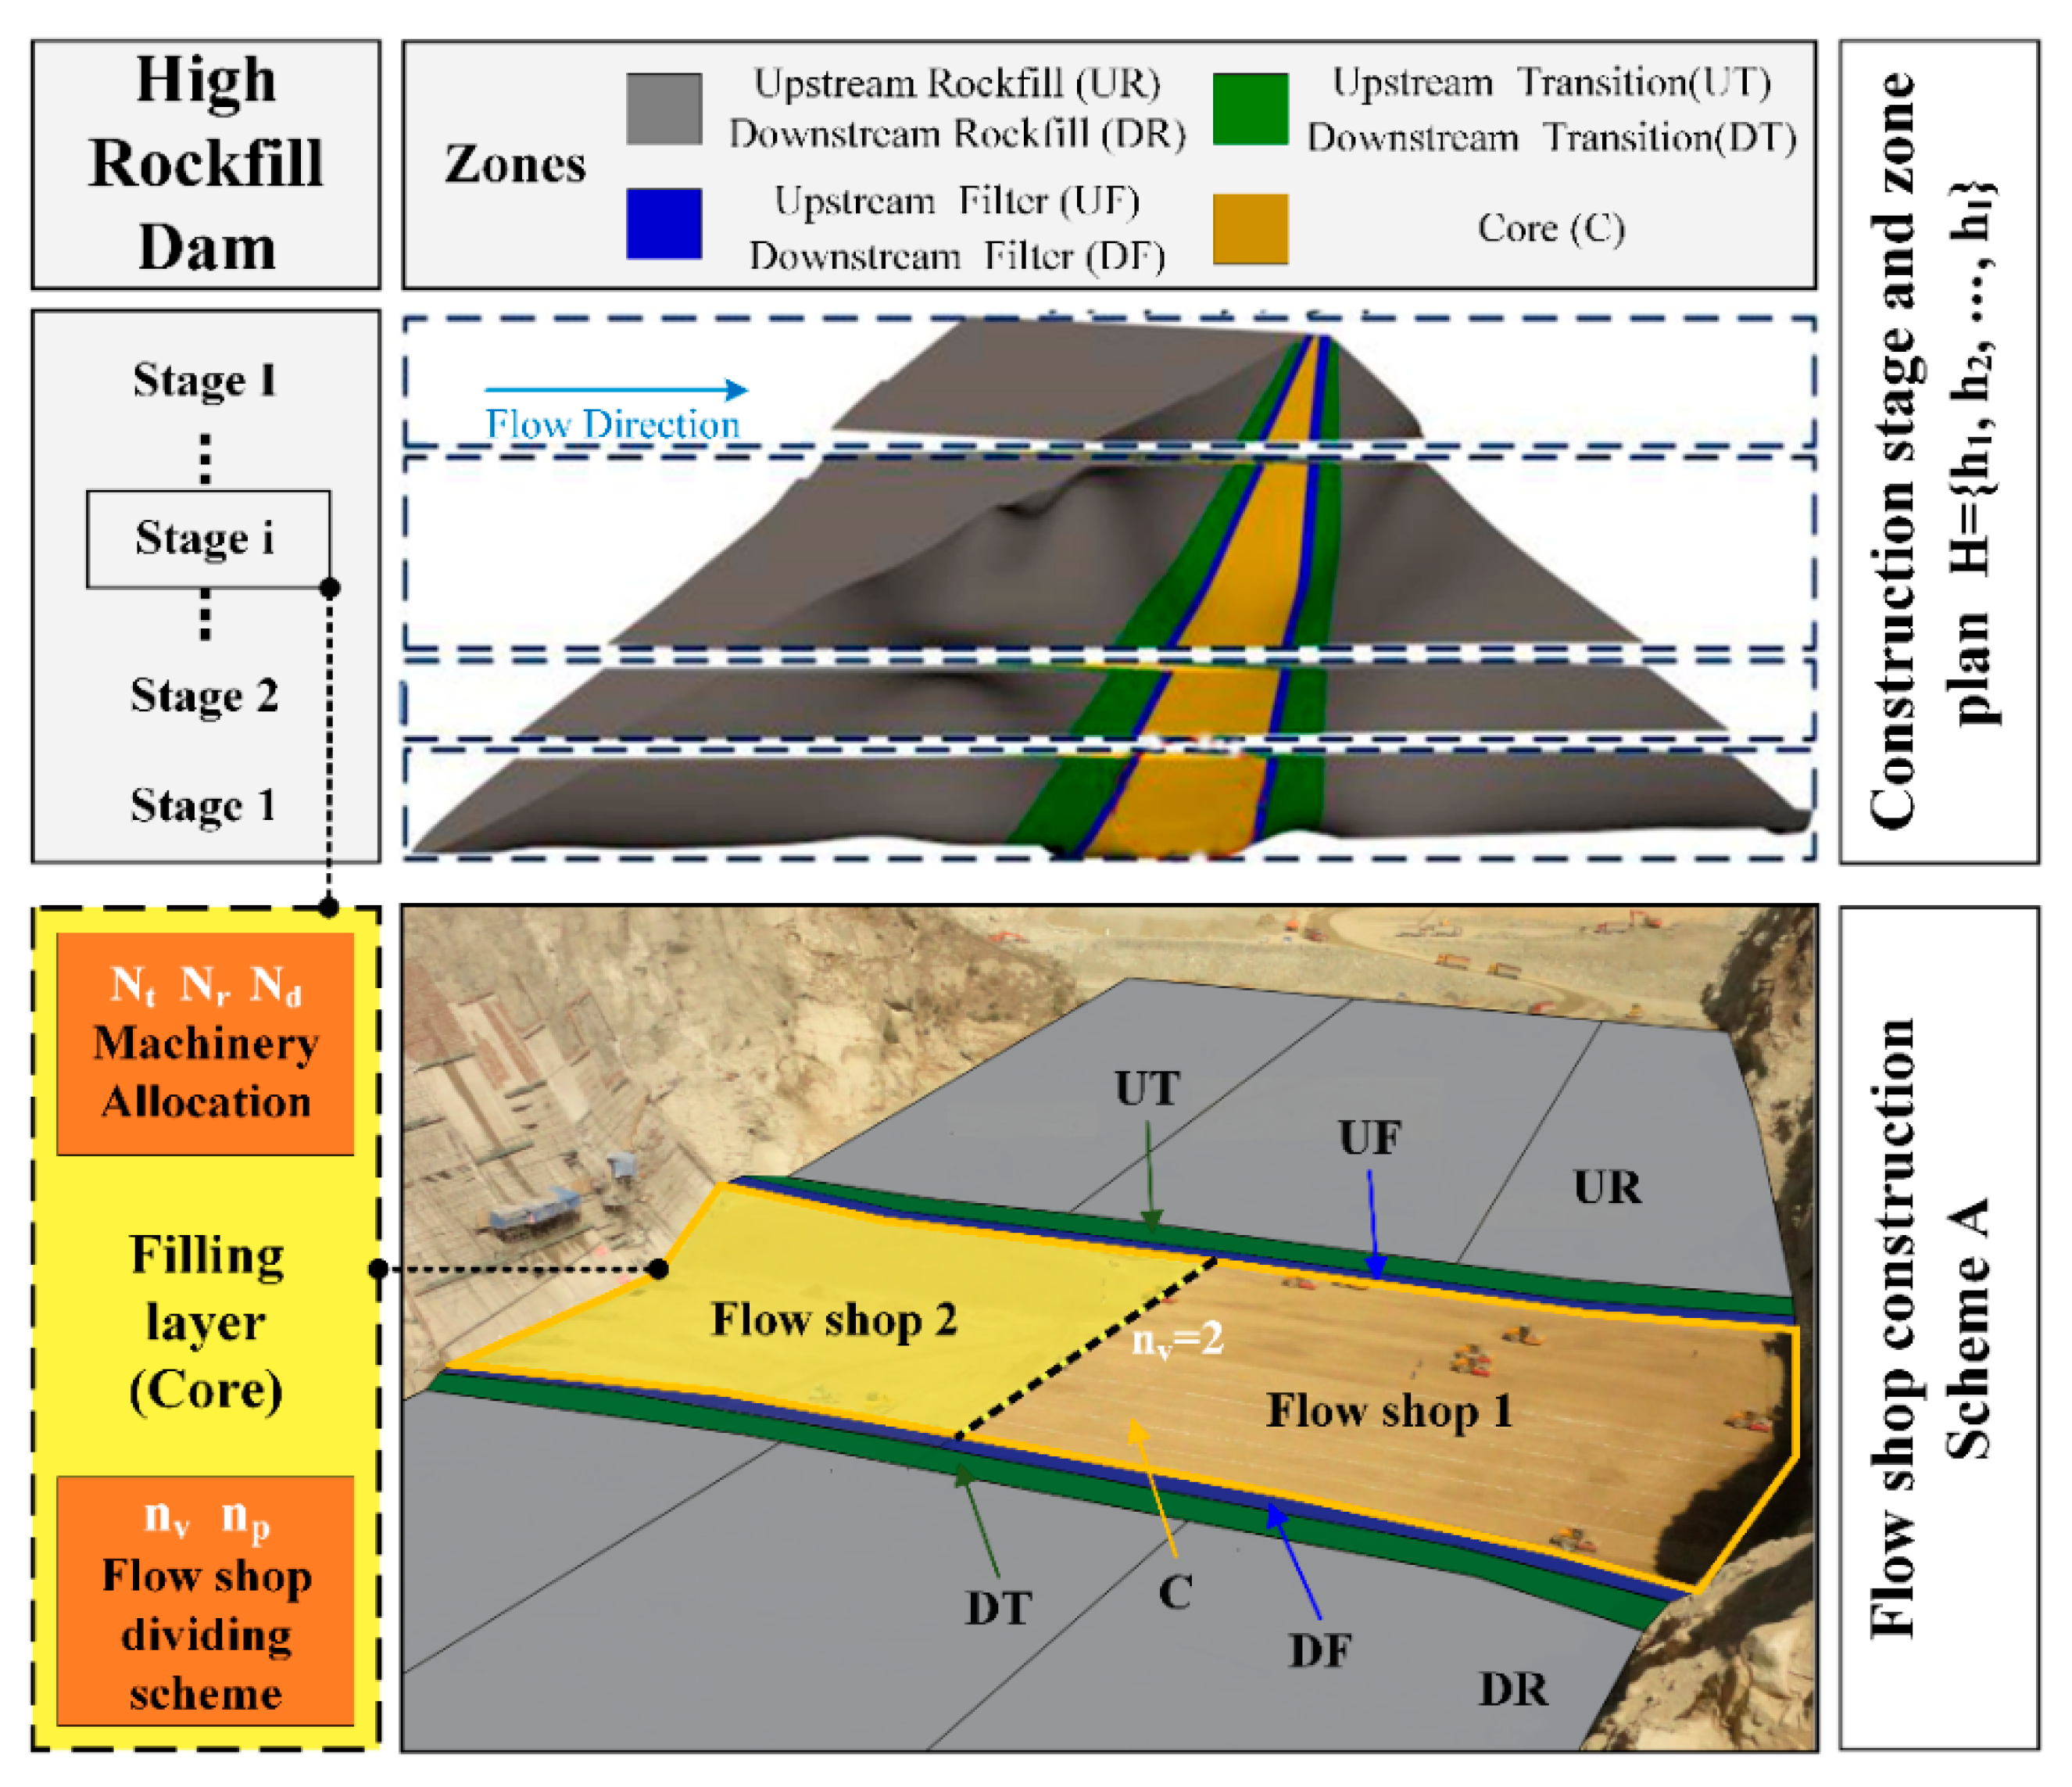
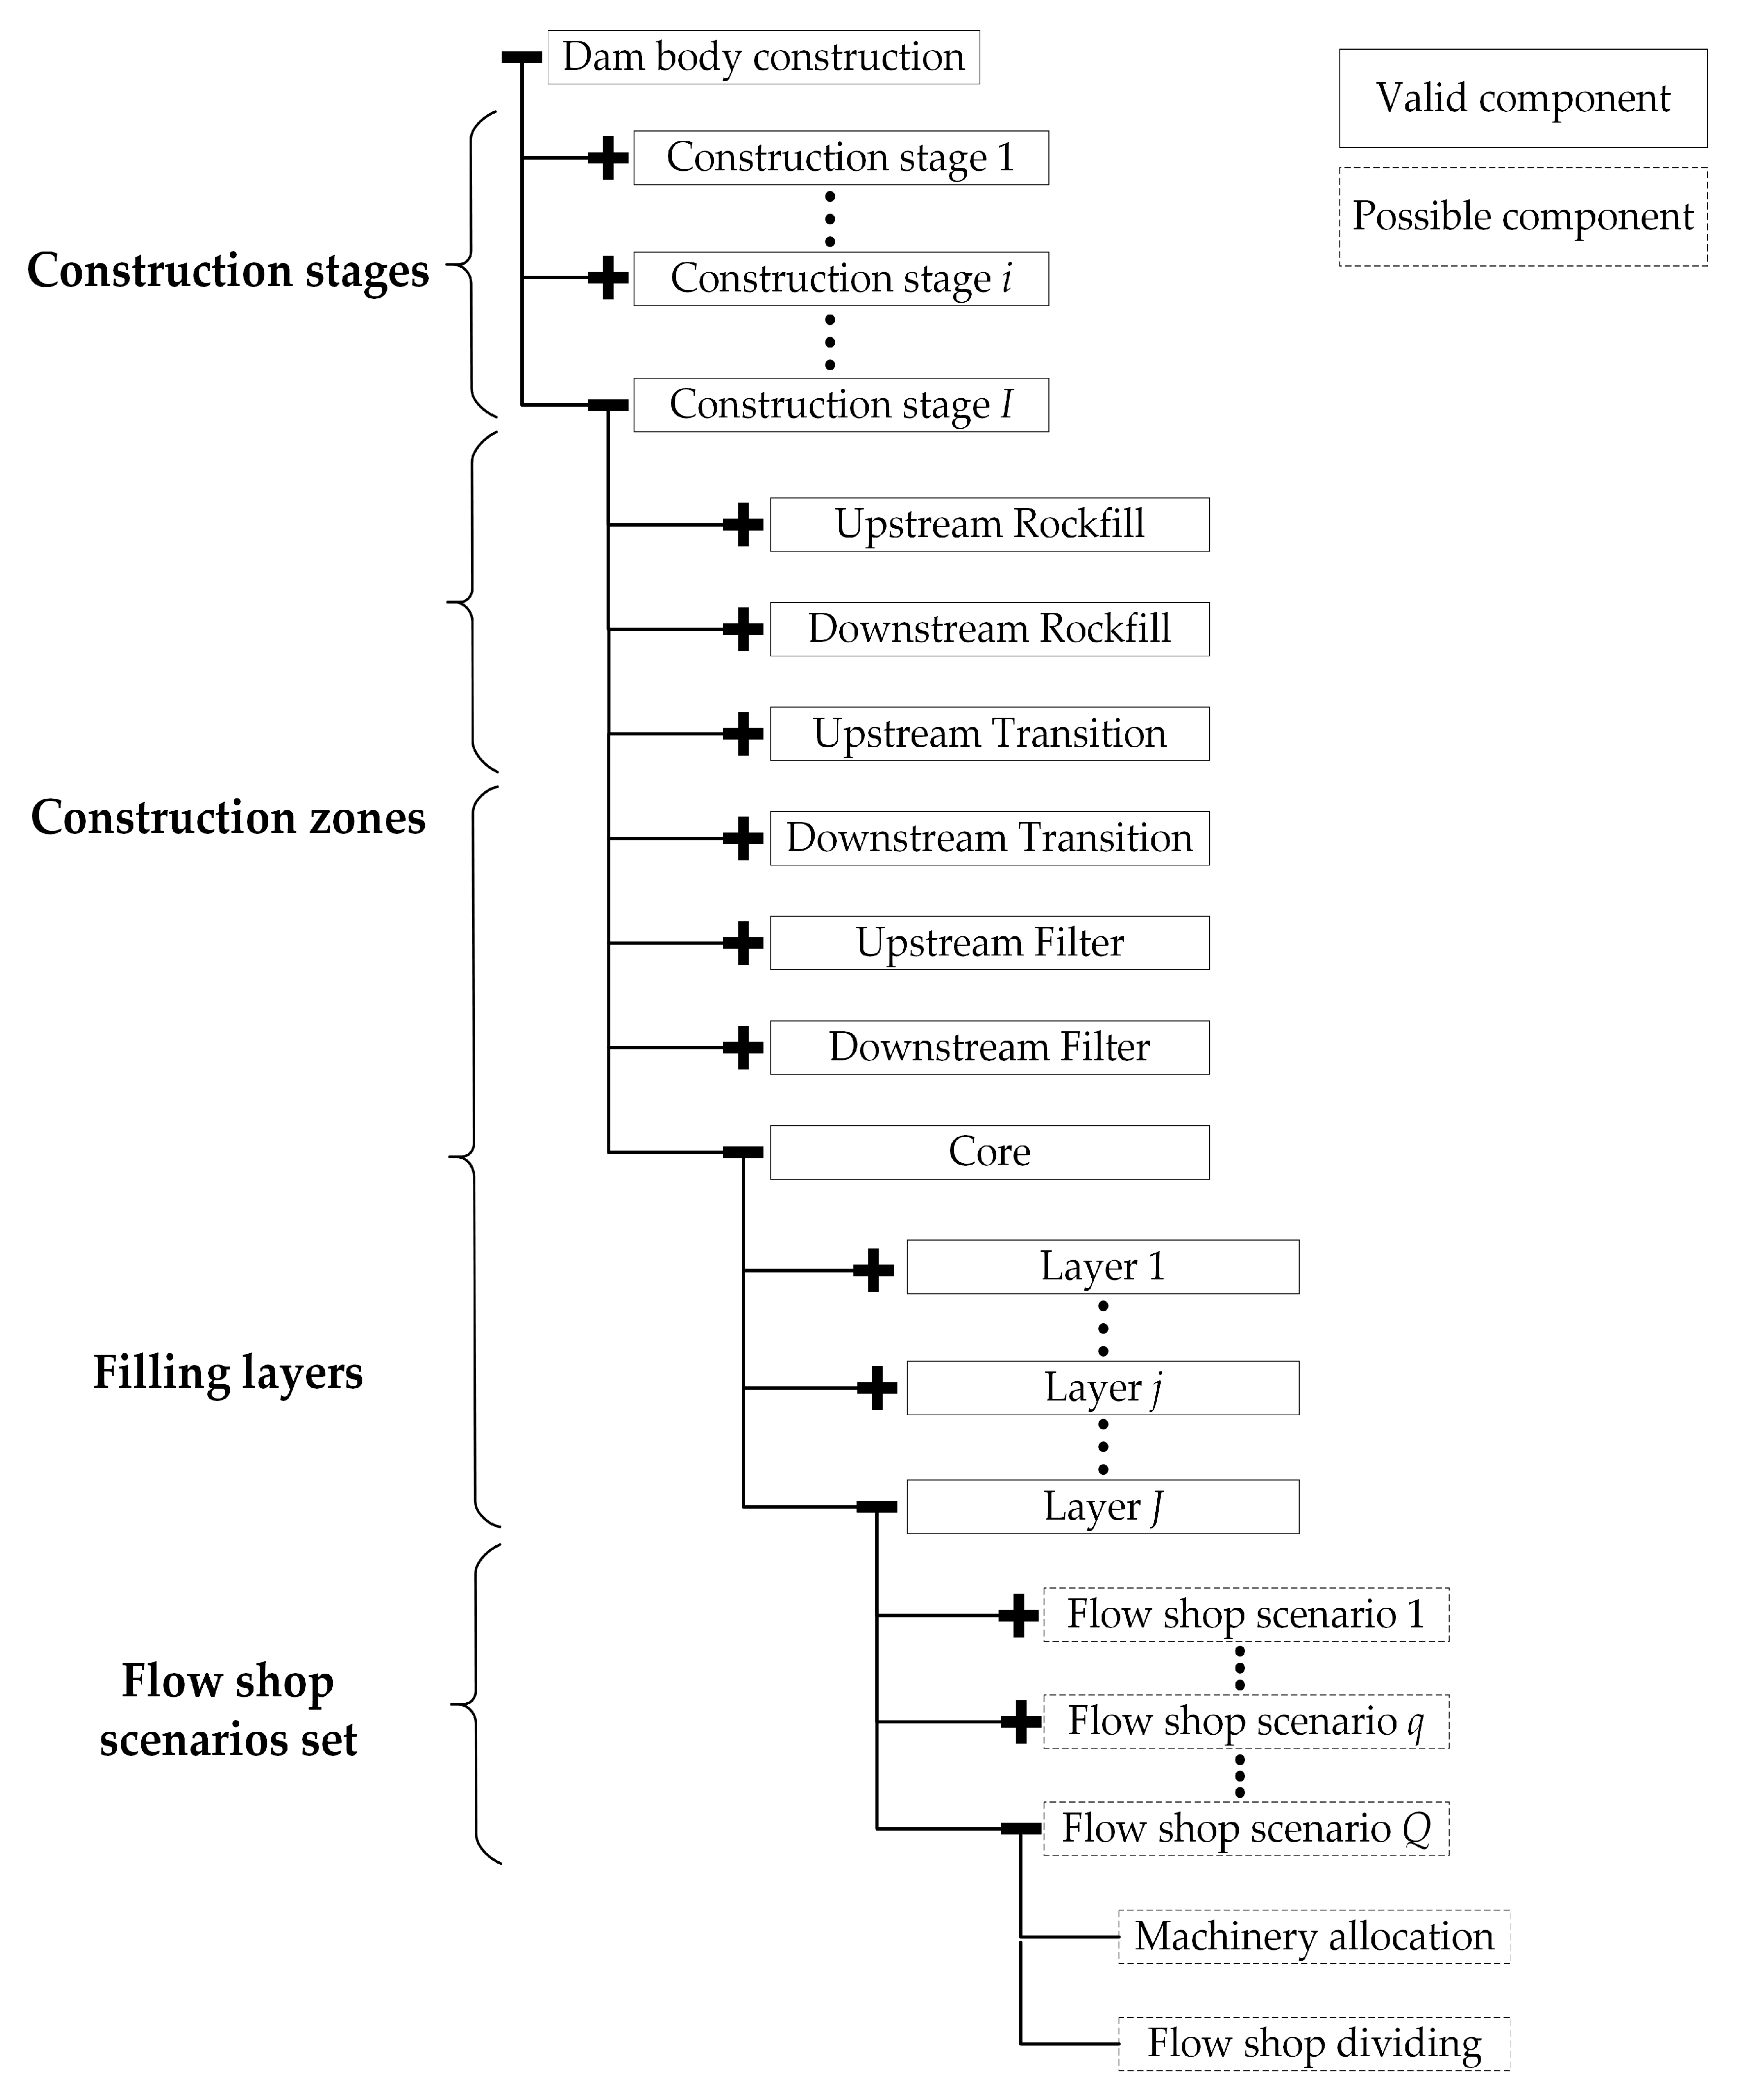
Hydropower is an advantageous option for clean energy. Rockfill dams have become a popular type of hydropower infrastructure because their raw materials are abundant [1,2]. In recent years, rockfill dams have grown in size, and their construction time may exceed a decade [3]. Therefore, the construction process of rockfill dams is divided into several stages to ensure an efficient and successful construction, while the dam body is divided into several zones for different functions. The arrangement of time for each stage and the division of zones by height represent the problem of the rockfill dam construction stage and zone optimization, which is critical in planning the construction process of rockfill dams. Figure 1 illustrates the work breakdown structure (WBS) of a high core rockfill dam construction as an example. Each zone is constructed in the sequence of filling layers, while each filling layer is constructed by means of flow shop. It is beneficial to determine a flow shop construction scheme derived from every filling layer’s alternative. Traditional design of the construction stages and zones is mainly based on expert experience of similar engineering [4], lacking scientific basis. To address this problem, a construction stage and zone optimization model was proposed in Reference [5]. Particle swarm optimization (PSO) and its enhanced variant, heterogeneous particle swarm optimization (HPSO), have been used to solve the optimization model [6,7,8]. However, these researches simplified the filling process of rockfill dam construction, resulting in the difficulty of obtaining the flow shop construction scheme.
Construction simulation of a high rockfill dam is regarded as an ideal tool to help analyze and plan the dam construction process, due to its advantages of considering the elevation difference constraints of each zone and the restrictions of time and space. Zhong [3] proposed construction simulation of a high rockfill dam (CSHRD) based on CYCLONE. The CSHRD mainly considered the effect of the haulage subsystem and simplified the placement subsystem. Based on the CSHRD, an improved CSHRD that considers the haulage subsystem and placement subsystem by refining flow shop construction is developed and applied [9,10]. Du [9] introduced the improved CSHRD to analyzed flow shop construction and used a genetic algorithm (GA) to optimize the construction stages and zones. Although this research obtained a detailed flow shop scheme while construction stage and zone optimization, a preferable flow shop scheme cannot be selected based on the opinions of decision makers.
On the basis of different decision indicators obtained from rockfill dam construction simulation, preferences of decision makers need to be considered to determine the flow shop construction schemes at different elevations. This is a typical multi-criteria decision-making (MCDM) process. The improved CSHRD is used to compute different flow shop construction scheme evaluation criteria for each filling layer. Then, an MCDM approach is needed to identify the criteria and integrate expert assessments, during which objective data are integrated with subjective judgments. With respect to the construction scheme design, many MCDM approaches have been used, including the weighted sum method, the analytical hierarchical process (AHP), the analytic network process (ANP), ESORD and technique for order performance by similarity to ideal solution (TOPSIS) [11,12,13,14]. Shapira and Goldenberg [15] developed an equipment selection model for construction projects based on the AHP. Lashgari et al. [16] used fuzzy TOPSIS to establish an MCDM model for equipment selection. Zhong et al. [17] applied TOPSIS and AHP to determine the best compromise construction scheme. Prascevic and Prascevic [18] improved the fuzzy AHP based on the eigenvalue and eigenvector approach and applied it to rank and select alternatives in construction project management. In these cases, alternative solutions and corresponding decision indicators are countable and limited and can be immediately obtained, allowing the MCDM approach to be applied directly. However, regarding the decision-making process of flow shop construction schemes, the number of filling layers is enormous, and the procedure to obtain decision indicators of solutions is complex. Consequently, both the efficiency of collecting and aggregating the information and the effectiveness of combining the subjective and objective weights to evaluate decision alternatives are challenges that need to be addressed. Accordingly, a data-driven method and the analytical hierarchy process extended by D numbers (D-AHP) [19] are introduced in this paper. The D-AHP method extends the AHP method with D numbers-based fuzzy preferences [20], which overcomes the shortcomings of the AHP method that cannot represent and handle the uncertain objective data. D numbers is a new representation of uncertain information developed by Deng [21], which overcomes the deficiencies of the Dempster–Shafer evidence theory [22,23] and contains the exclusiveness hypothesis and completeness constraint. Improving the traditional AHP and Dempster–Shafer theories, the D-AHP method has been proven effective in various areas, including the evaluation of the scientific research ability of universities [24], curtain grouting efficiency assessment [25] and construction management [26]. Therefore, the D-AHP method is used in this paper to integrate hard data with subjective judgments, which may be uncertain and fuzzy in the MCDM process for flow shop construction schemes. Moreover, a data-driven method is introduced to improve the D-AHP. The data-driven method uses simulation results data to generate the D matrix automatically instead of collecting information according to decision makers’ intuition, which will improve the efficiency of the MCDM process.
After determining the optimal flow shop construction scheme, construction filling intensity can be obtained through the improved CSHRD model. Different plans of construction stages and zones will be assigned different values of filling intensity disequilibrium, which is an important indicator reflecting resource balance. The minimum of filling intensity disequilibrium is taken as the objective of construction stage and zone optimization. At present, a number of meta-heuristic algorithms inspired by phenomena in nature have been presented, such as Cuckoo Search (CS) [27], Genetic algorithm (GA) [28], Simulated annealing (SA) [29], Ant colony algorithm (ACA) [30], Bacteria Foraging Optimization Algorithm (BFOA) [31] Harmony Search (HS) [32], Grasshopper Optimization Algorithm (GOA) [33], Salp Swarm Algorithm (SSA) [34], Particle Swarm Optimization (PSO) [35], Ant Lion Optimization (ALO) [36], Grey Wolf Optimization (GWO) [37], Enhanced Grey Wolf Optimization (EGWO) [38], Whale Optimization Algorithm (WOA) [39] and so on. These meta-heuristic algorithms have played an important role in engineering optimization problems due to their minimal requirements for quantities of input parameters and higher computational efficiency [40,41,42]. Among them, GA [9,17,43,44,45], ACA [46] and PSO [47] are usually used in construction plan optimization. Besides, a smart BFOA is developed for dam construction [48]. SA and GA were used to improve the quality of prediction [49]. SSA was utilized to locate and optimize the size of renewable distributed generators (RDGs) [50]. HS was applied to training an echo estate neural network [51]. GWO and its enhanced variants were utilized in various of researches, such as optimizing controllers [52,53,54], solving Combined Heat and Power Dispatch (CHPD) problem [55] and so on. Motived by the enormous success of meta-heuristic algorithms, a more mature meta-heuristic algorithm with stronger ability to overcome the universal deficiencies existed, such as local optimum points and prematurity, is interesting to be tried in the problem of construction stage and zone optimization. The whale optimization algorithm (WOA), proposed by Mirjalili [39], has proved to be a competitive metaheuristic algorithm in different applications [56,57]. The parameters of the WOA are adaptive during the iterative process, which guarantees a good relationship between the exploration and exploitation of the WOA. However, as noted by [58,59,60], the WOA has one major drawback, namely, premature convergence, which reduces its robustness. Levy flight is a random walking strategy discovered by Benoît Mandelbrot, widely employed in metaheuristic algorithms to prevent a local optimal solution [61,62,63]. The step lengths of Levy flight have a heavy power law tail distribution, and the large steps occasionally help an algorithm to jump out of the local optimum and improve robustness. Therefore, the Levy flight trajectory is used in this paper to improve the WOA, thus, a more robust optimization method for construction stage and zone optimization is obtained.
To summarize, a detailed flow shop construction scheme that considers decision-makers’ opinions has not been obtained in previous rockfill dam construction stage and zone optimization studies. Additionally, a more efficient and robust meta-heuristic algorithm is worth to be developed for construction stage and zone optimization. In view of the problems mentioned above, this research develops a construction stage and zone optimization model that considers the flow shop construction scheme decision. A flow shop construction scheme is determined by balancing different decision criteria, then the optimal construction stage and zone design with a minimum disequilibrium degree of filling intensity is achieved. The main aim of this paper is to:
  • Establish a new construction stage and zone optimization model to determine detailed flow shop construction scheme that considers decision-makers’ opinions while optimizing construction stages and zones.
  • Present an automatic flow shop construction scheme optimization method integrated with an improved CSHRD and data-driven D-AHP to determine a preferable flow shop scheme for each filling layer and settle the decision-making efficiency problem caused by the enormous number of filling layers.
  • Develop a competitive meta-heuristic algorithm, named the enhanced whale optimization algorithm (EWOA), to optimize the construction stage and zone plan efficiently.
The proposed model is applied to a core rockfill dam in southwestern China and the optimal construction stage and zone optimization as well as the construction scheme containing the division of flow shop and the machinery allocation are obtained efficiently. Compared to other optimization methods, the EWOA optimization model performs best in terms of both efficiency and robustness.

2. Research Framework

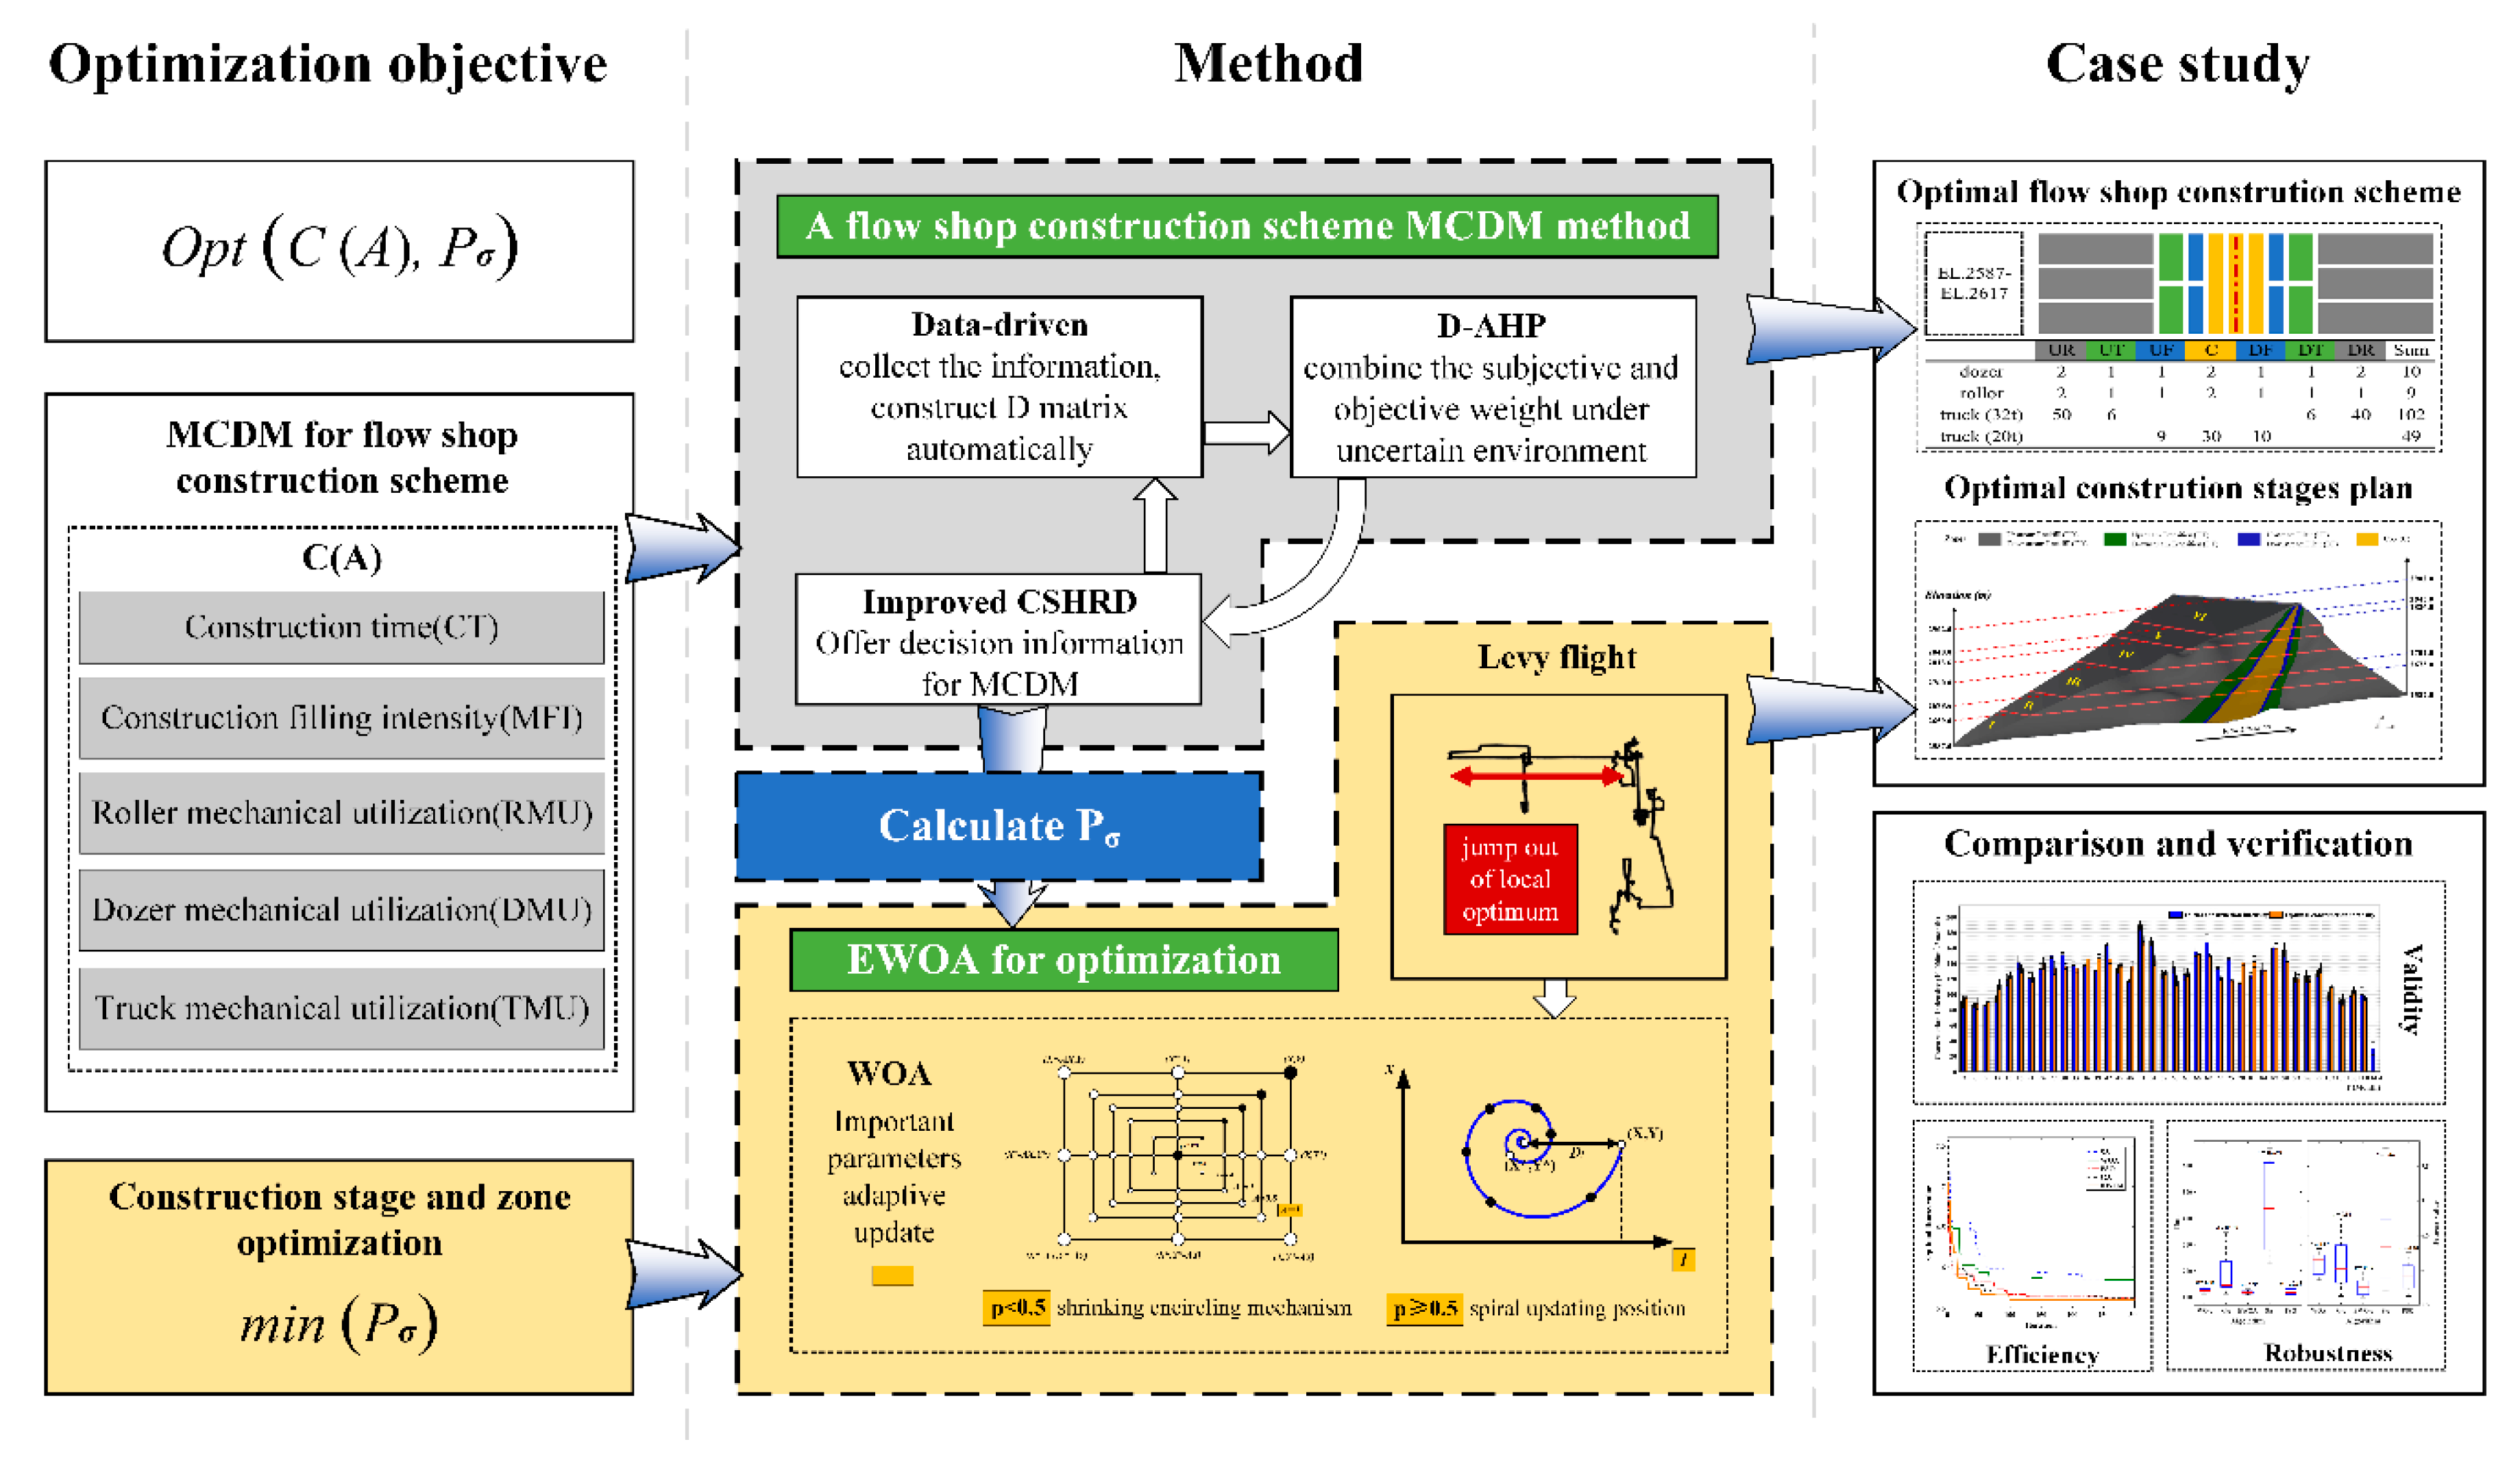
In this work, a construction stage and zone optimization model based on the data-driven D-AHP and EWOA is proposed, which can determine a preferable flow shop construction scheme for each filling layer while achieving the optimal construction stage and zone design. The research framework is composed of three levels: optimization objective, method, and case study, as shown in Figure 2.
At the optimization objective level, the objectives are divided into two parts: the objective of the flow shop construction scheme MCDM, which aims at reducing the construction time, decreasing the construction filling intensity and balancing the machinery allocation; and the objective of the construction stage and zone optimization, which aims to reduce the filling intensity disequilibrium degree.
At the method level, the flow shop construction scheme MCDM method is proposed, which integrates the data-driven D-AHP and improved CSHRD; this method automatically generates and collects decision information, effectively combines subjective information with objective preferences in an uncertain environment, and determines a preferable flow shop construction scheme for each filling layer. An EWOA is proposed that uses the Levy flight trajectory to improve the efficiency and robustness of the WOA to optimize the construction stage and zone plan.
At the case study level, the proposed model is applied to a large-scale rockfill dam in southwestern China, and the optimal plan of construction stages and zones as well as the construction scheme that contains the division of the flow shop and machinery allocation is obtained. Compared with the scheme made based on experience, the validity of the model is verified. Compared to other optimization approaches, the EWOA optimization approach demonstrates the best performance in both efficiency and robustness.

3. Methodology

This section presents the general description of the problem of construction stage and zone optimization. And the improved CSHRD and the data-driven D-AHP are introduced for MCDM of the flow shop construction scheme; Then the EWOA is presented for construction stage and zone optimization. A total flowchart of the proposed construction stage and zone optimization model is presented in the end of this section.

3.1. Problem Formulation

As shown in Figure 3, the problem of rockfill dam construction stage and zone optimization is how to schedule each stage and how to divide the zones by height. With the help of the improved CSHRD, a detailed flow shop construction scheme can be determined. EWOA is used to reduce the filling intensity disequilibrium degree Pσ in construction stage and zone optimization. In this process, elevation node H is the optimization variable, which will influence monthly filling intensity pimon and construction time CT, month. Determining a flow shop construction scheme requires that the method of dividing flow shops (nv, np) and the allocating machinery be determined, including roller number Nr, truck number Nt and dozer number Nd. Different criteria C will be comprehensively evaluated through the improved CSHRD and the data-driven D-AHP. Results of the improved CSHRD, such as construction time (CT), maximum filling intensity (MFI), truck utilization rate (TUR), dozer utilization rate (DUR) and roller utilization rate (RUR), are taken as decision criteria in the MCDM process of the flow shop scheme. Symbols used are listed in Table 1.
The objective function of the problem for the construction stage and zone optimization is expressed as follows:
{ O p t ( P σ , C ( A ) ) P σ = ( i = 1 I m o n = 1 m i | p i m o n μ i | / m i ) / I ,   i = 1 , , I C = { C 1 , C 2 , , C j , , C J } ,   j = 1 , , J   ( J 2 ) A = { A 1 , A 2 , , A q , , A Q } ,   q = 1 , , Q   ( Q 2 ) A q = { n v q , n p q , N q } N q = { N r q , N d q , N t q }
Constraints of the objective function are listed as follows:
  • Feeding intensity limits
The actual feeding intensity of the material field x in stage i, Pi(x) should be less than the specified maximum intensity Psi(x).
P i ( x ) P s i ( x ) ,   i   =   1 , , I ,   x   =   1 , , X
  • Filling intensity limits
The filling intensity of the elevation h in zone k, P( H k i ) should be less than the specified maximum intensity Ps( H k i ).
P ( H k i ) P s ( H k i ) ,   i   =   1 , , I ,   k   =   1 , , K
  • Road transport intensity limits
The transport intensity of road y in stage i, Proadi(y) should be less than the specified maximum intensity Psroadi(y).
P r o a d i ( y ) P s r o a d i ( y ) ,   i   =   1 , , I ,   y   =   1 , , Y
  • Elevation limits
The elevation of stage i, Hki should meet the limit progress of the minimum height H k i m i n and the maximum height H k i m a x .
H k i m i n H k i H k i m a x ,   i   =   1 , , I ,   k   =   1 , , K
  • Limits to the elevation difference of adjacent zones
The elevation difference of the adjacent zones should be less than the height of the thicker filling layer.
| H k i H k 1 i | δ ,   i   =   1 , , I ,   k   =   1 , , K
  • Machinery number limits
N r q N r c ,   q   =   1 , , Q
N t q N t c ,   q   =   1 , , Q
N d q N d c ,   q   =   1 , , Q
  • Flow shop dividing limits
n v q n p q = 0 ,   q   =   1 , , Q
n v q + n p q > 0 ,   q   =   1 , , Q
Int ( L / L m a x ) n v q Int ( L / L m i n ) ,   q   =   1 , , Q
1 n p q min { Int ( B / C m i n ) , Int ( B / B m i n ) } ,   q   =   1 , , Q

3.2. MCDM of the Flow Shop Construction Scheme Based on the Data-Driven D-AHP

Under the influence of the shape and size of the filling layers and construction resources, each filling layer has more than one flow shop construction scheme, which consists of the division of the flow shop and machinery allocation. This study proposes a flow shop construction scheme MCDM method based on the data-driven D-AHP, which can determine a preferable flow shop construction scheme via the balancing of different conflicting decision criteria. The proposed method consists of two parts: the calculation of flow shop construction scheme decision criteria and MCDM of the flow shop construction schemes. In the first part, different flow shop construction scheme decision indicators for each filling layer are obtained through the improved CSHRD. Based on the first part, Pearson correlation coefficients are calculated to filter out indicators that have high correlation; then, an optimal flow shop construction scheme is selected through the data-driven D-AHP.

3.2.1. Calculation of Flow Shop Construction Scheme Decision Criteria

An improved CSHRD [16], which has been proven to accurately simulate the construction process, is implemented to calculate decision criteria. The improved CSHRD considers the haulage and placement of the rockfill subsystem. As shown in Figure 4, the haulage subsystem is simulated with CYCLONE, which provides constraints for the placement subsystem when the filling intensity exceeds the transport intensity. The placement subsystem simulates flow shop construction using the event marching method with the shortest time. In this process, the dam is constructed by filling layers, and each filling layer is divided into several flow shops according to the construction environment. The construction of each flow shop consists of five steps: unloading, paving, spreading, compacting, and checking. Assuming the placement of the rockfill subsystem is the dominant process at the beginning, construction time (CT) equals Tp. If the transport intensity of any road exceeds the prescribed transport intensity, then there is a traffic jam; the dominant process changes to haulage of the rockfill subsystem, and the construction time (CT) equals Th. Based on the improved CSHRD, evaluation criteria for each flow shop construction scheme is achieved, including the CT, TUR, DUR, RUR, max filling intensity (MFI), average filling intensity (AFI), and IUF. Among them, the mechanical utilization rates, such as TUR, DUR and RUR, are the ratio of the mechanical working time to the construction period, and the IUF is the ratio of the MFI to the AFI.

3.2.2. MCDM of Flow Shop Construction Schemes

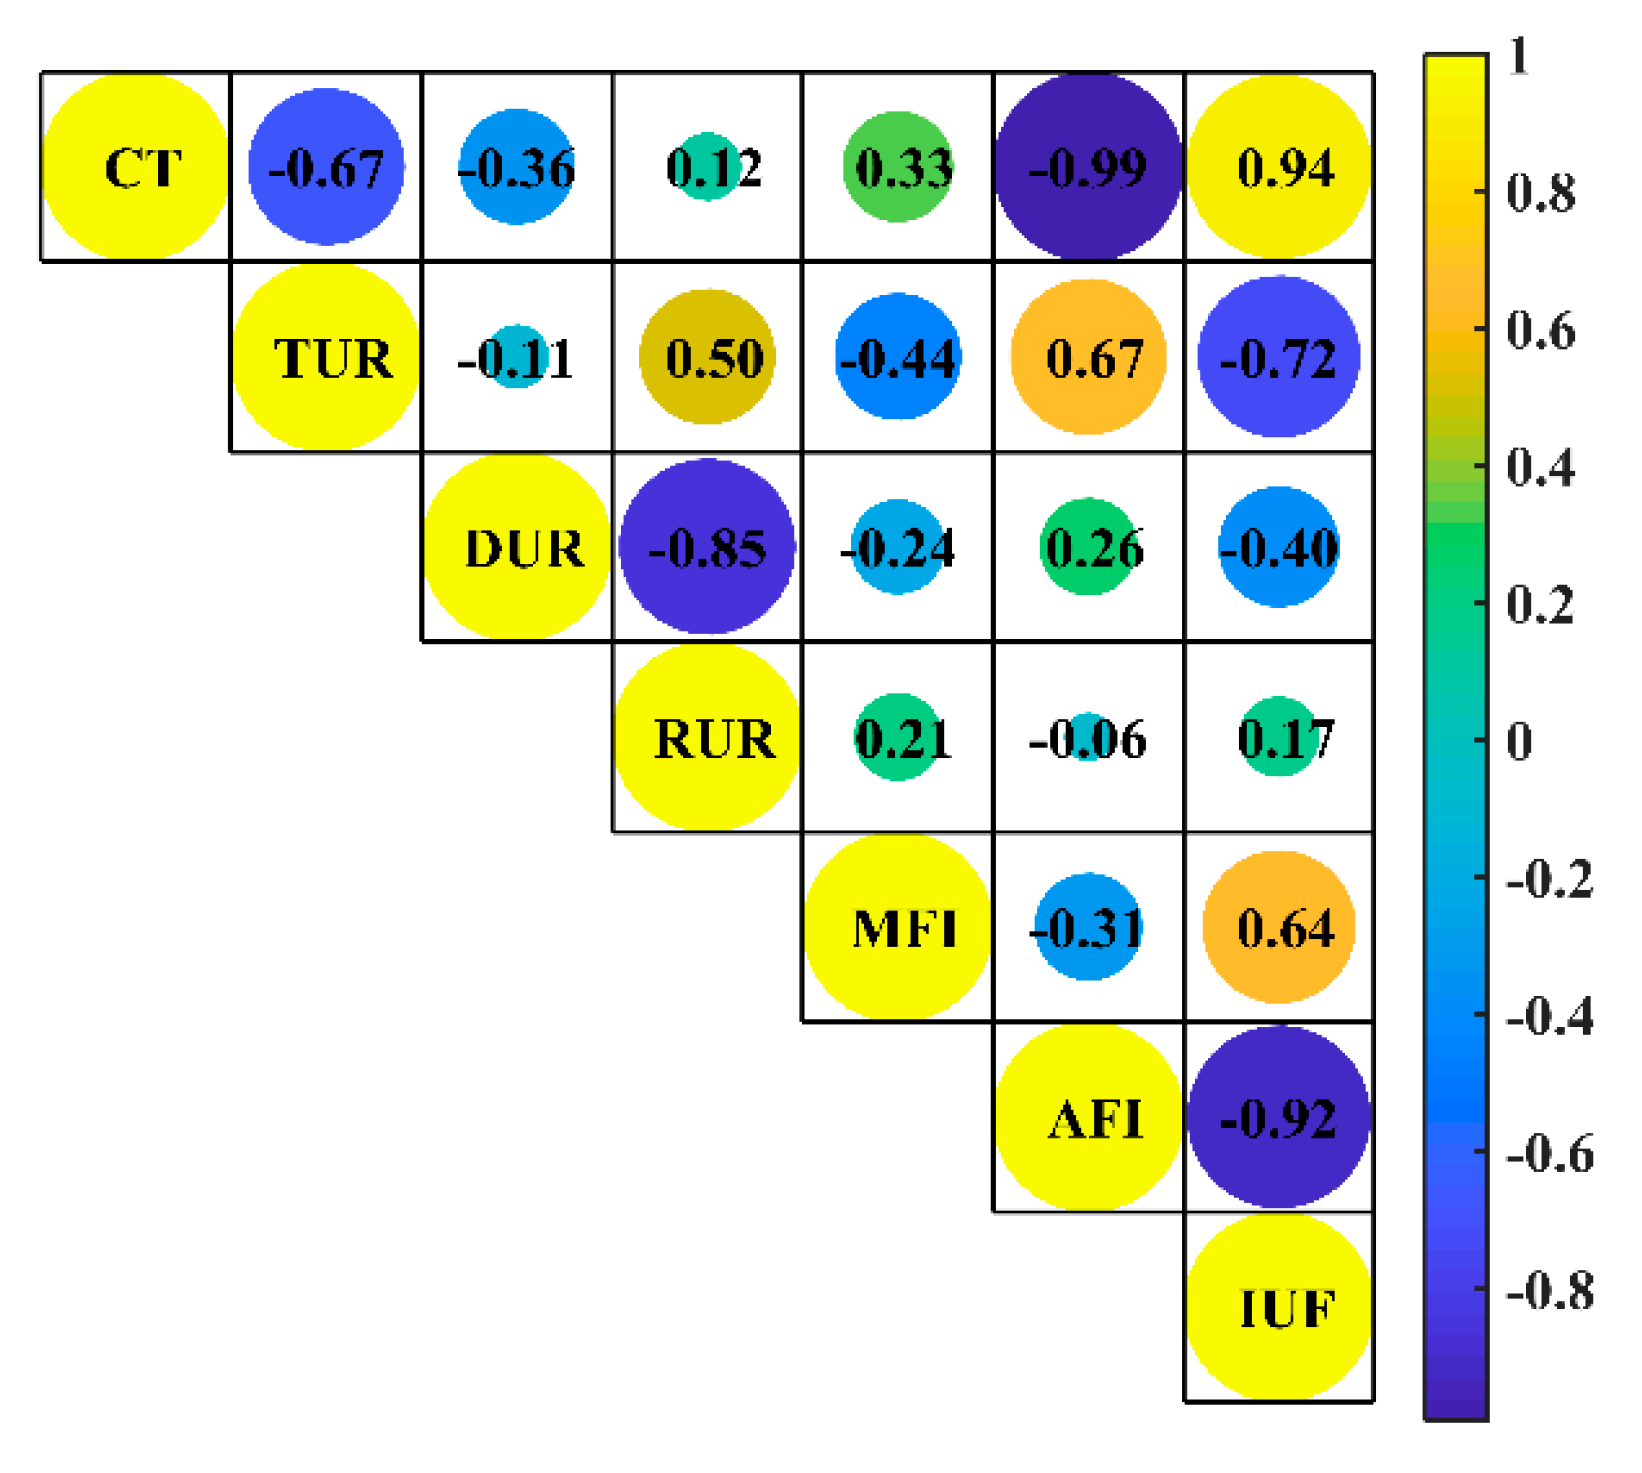
First, Pearson correlation coefficients are calculated to filter out the highly correlated indicators. A Pearson correlation matrix was built, as shown in Figure 5. The numbers in the matrix diagram represent the Pearson correlation coefficients between the parameters, and the radius of “○” represents the magnitude of the correlation among the parameters. Three indicators of CT, AFI and IUF are strongly correlated because the AFI is the ratio of construction quantity (constant) to the CT and the IUF is the ratio of the MFI to the AFI. Both indicators of the AFI and IUF are removed to avoid the repetitive effect of the indicators of strong correlation and to improve accuracy of the evaluation results.
Then, a hierarchical structure is built for the flow shop construction scheme MCDM, and a data-driven method is used to construct the D matrix, whose detailed steps will be explained in Section 4.1. Finally, a D-AHP method is used to calculate the priority weights and rank the schemes. The detailed procedures of the D-AHP method can be divided into four steps, as described by [19]:
  • convert the D matrix to a crisp matrix by using the integration representation of D numbers;
  • construct a probability matrix based on the derived crisp matrix;
  • determine the ranking of alternatives using the triangularization method;
  • calculate the priority weights of the alternatives to determine the optimal solution.
Some basic knowledge regarding the D-AHP is given as follows:
Definition 1.
Let Ω be a finite nonempty set, and a D number is a mapping formulated by
D : Ω [ 0 ,   1 ]
with
B Ω D ( B ) 1   a n d   D ( ϕ ) = 0
where ∅ is an empty set and B is a subset of Ω.
For a discrete set Ω   = { b 1 , b 2 , , b i , b n } , D numbers can simply be denoted as:
D = { ( b 1 , v 1 ) , ( b 2 , v 2 ) , ,   ( b i , v i ) , ,   ( b n , v n ) }
where b i     R , whose value represents the evaluation of the object by the ith expert in the MCDM process; and b i   b j if i ≠ j; vi > 0, whose value represents the credibility of bi, and i = 1 n v i 1 .
Definition 2.
The D numbers preference relation RD on a set of alternatives A is represented by a D matrix on the product set A × A, whose elements are formulated by
R D : A × A D
The D numbers preference relation in matrix form is
R D = A 1 A 2 A n A 1 A 2 A n [ D 11 D 12 D 1 n D 21 D 22 D 2 n D n 1 D n 2 D nn ]
where Dij = {(b1ij, v1ij),( b2ij, v2ij), …,(bmij, vmij)}, Dji = {(1 − b1ij, v1ij),(1 − b2ij, v2ij), …,(1 − bmij, vmij)}, i,j ∈ {1,2,…,n}; bkij ∈ [0, 1], k ∈ {1,2,…,m}, bkij indicates the priority of the alternative Ai compared to the alternative Aj based on the indicator k; and vkij represents the credibility of bkij.

3.3. Construction Stage and Zone Optimization Based on EWOA

In this section, a new optimization referred to as the EWOA is proposed for the construction stage and zone optimization, which uses Levy flight to improve the robustness and global optimization ability of the WOA. Then, the validity and superiority of the EWOA is demonstrated by comparison with the PSO, grey wolf algorithm (GWO) and WOA. Finally, detailed procedures of the construction stage and zone optimization based on the EWOA are provided.

3.3.1. Enhanced Whale Optimization Algorithm (EWOA)

The WOA [39] is a metaheuristic algorithm inspired by the bubble-net hunting technique of humpback whales. The WOA updates the population position through the bubble-net attacking method, which contains the shrinking encircling mechanism and the spiral updating position mechanism. The WOA can provide very competitive results in solving optimization problems.
However, as with most metaheuristic algorithms, this approach has a shortcoming of premature convergence. Levy flight can maximize the diversification of search agents, which help the algorithm efficiently explore the search location and avoid local minima. Therefore, the Levy flight trajectory is used to improve the WOA. The Levy flight produces a set of straight flight paths punctuated by a sudden 90° turn, which allows it to jump out of the local optimum. Combining Levy flight with the WOA algorithm can increase the diversity of the population and improve the robustness and global optimization ability of the WOA algorithm. The WOA algorithm improved by Levy flight is named the EWOA, whose pseudo code is shown in Appendix A. The EWOA contains three phases, namely the strategy of encircling prey, the strategy of bubble-net attacking the prey and the strategy of searching for prey improved by levy flight.
  • The strategy of encircling prey
To model the humpback whale behavior in which whales swim around the prey within a shrinking circle and along a spiral-shaped path simultaneously, a parameter p is used to generate a probability of 50% to choose between either the shrinking circle or the spiral model to update the whales’ position. When p < 0.5, the EWOA updates the position of the current search agent with the shrinking encircling mechanism represented by Equations (19) and (20). A and C are calculated with Equations (20) and (21) when |A| is smaller than one.
X ( t + 1 ) = X * ( t ) A · D
D = | C · X * ( t ) X ( t ) |
A = 2 a · r a
C = 2 · r
  • The strategy of bubble-net attacking the prey
When p ≥ 0.5, the position of the current search agent is updated with the spiral updating position mechanism represented by Equations (23) and (24).
X ( t + 1 ) = e b l · cos ( 2 π l ) · D ΄ + X * ( t )
D ΄ = | X * ( t ) X ( t ) |
  • The strategy of searching for prey improved by levy flight
When p ≥ 0.5 and |A| is greater than one, the search agent enters into the exploration phase. The Levy flight is used to improve the global optimization capability. Whales in this phase update their positions with Equations (25) and (26). A and C are calculated with Equations (21) and (22).
X ( t + 1 ) = X rand A · D
D = | C · X rand X |
X ( t + 2 ) = X ( t + 1 ) + d · levy ( λ )
In Equation (27), d is the walk step and levy (λ) is a random searching path that can be calculated according to Mantegna’s algorithm:
levy ( λ ) = μ | v | 1 / β
where β is a constant, and μ = N(0,   σ μ 2 ) and v = N(0, σ v 2 ) are both normal stochastic distributions with:
{ σ μ = [ Γ ( 1 + β ) × sin ( π × β / 2 ) Γ ( 1 + β / 2 ) × β × 2 ( β 1 ) / 2 ] 1 / β σ v = 1
where Γ(x) = (x − 1)!

3.3.2. Evaluation of the Proposed EWOA

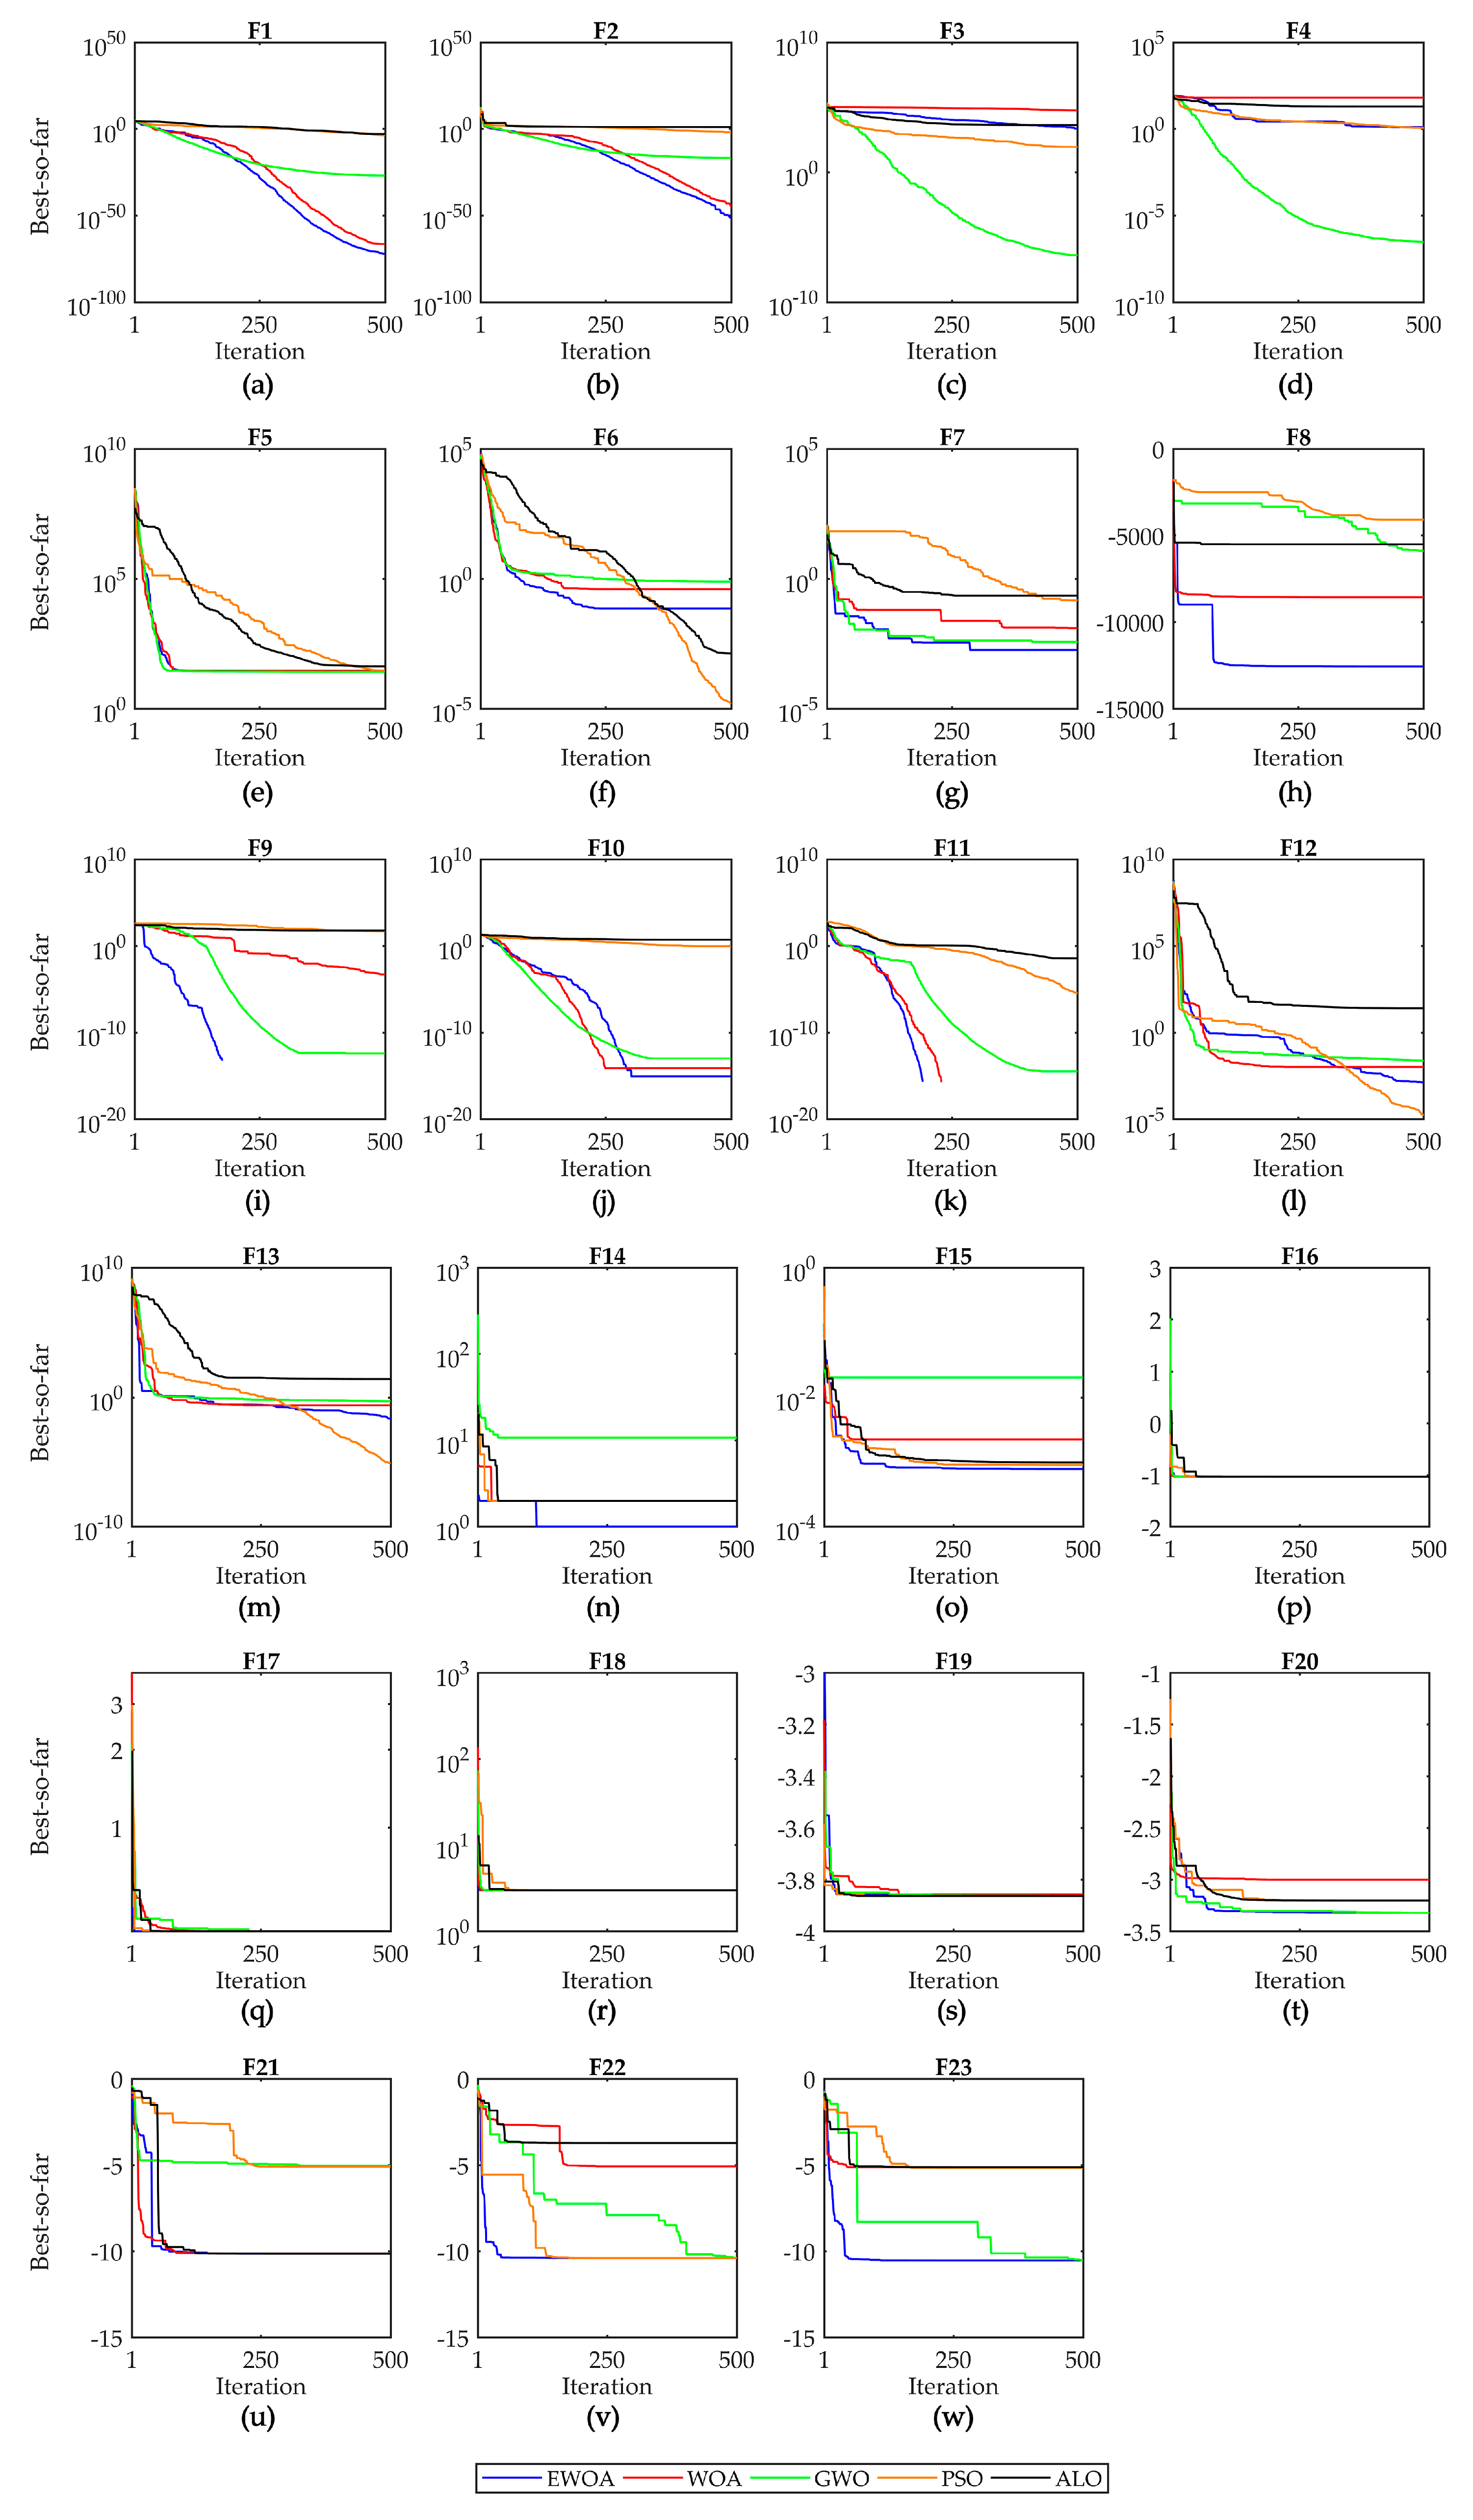
The numerical efficiency of the EWOA developed above in this study was tested on 23 mathematical optimization problems, which are classical benchmark functions utilized in related literature [64,65]. PSO [35], GWO [37], ALO [36], WOA [39] were selected for comparison with the EWOA. For all algorithms, the population size is 30, and the maximum iteration is 500. The 23 benchmark functions are depicted in detail in Appendix B. For each benchmark function, each algorithm was repeated 30 times. The convergence curves of the test are shown in Figure 6.
Unimodal test functions (F1–F7) allow the exploitation capability to be evaluated. As shown in Figure 6, the EWOA is very competitive with other algorithms. In particular, the EWOA has the fastest convergence rates for functions F1, F2, F5 and F7.
Multimodal functions (F8-F23) are very useful to evaluate the exploration capability because they have many local optima. In particular, F14-F23 are multimodal functions with fixed dimensions which can reflect the ability of an algorithm to avoid a quantity of local optima. In Figure 6, it is clear that the EWOA outperforms other algorithms in most of the functions F8-23 and is at least the second best optimizer. The results shows that the EWOA has a strong ability to avoid local optima and enter the global optimum.

3.3.3. Construction Stage and Zone Optimization

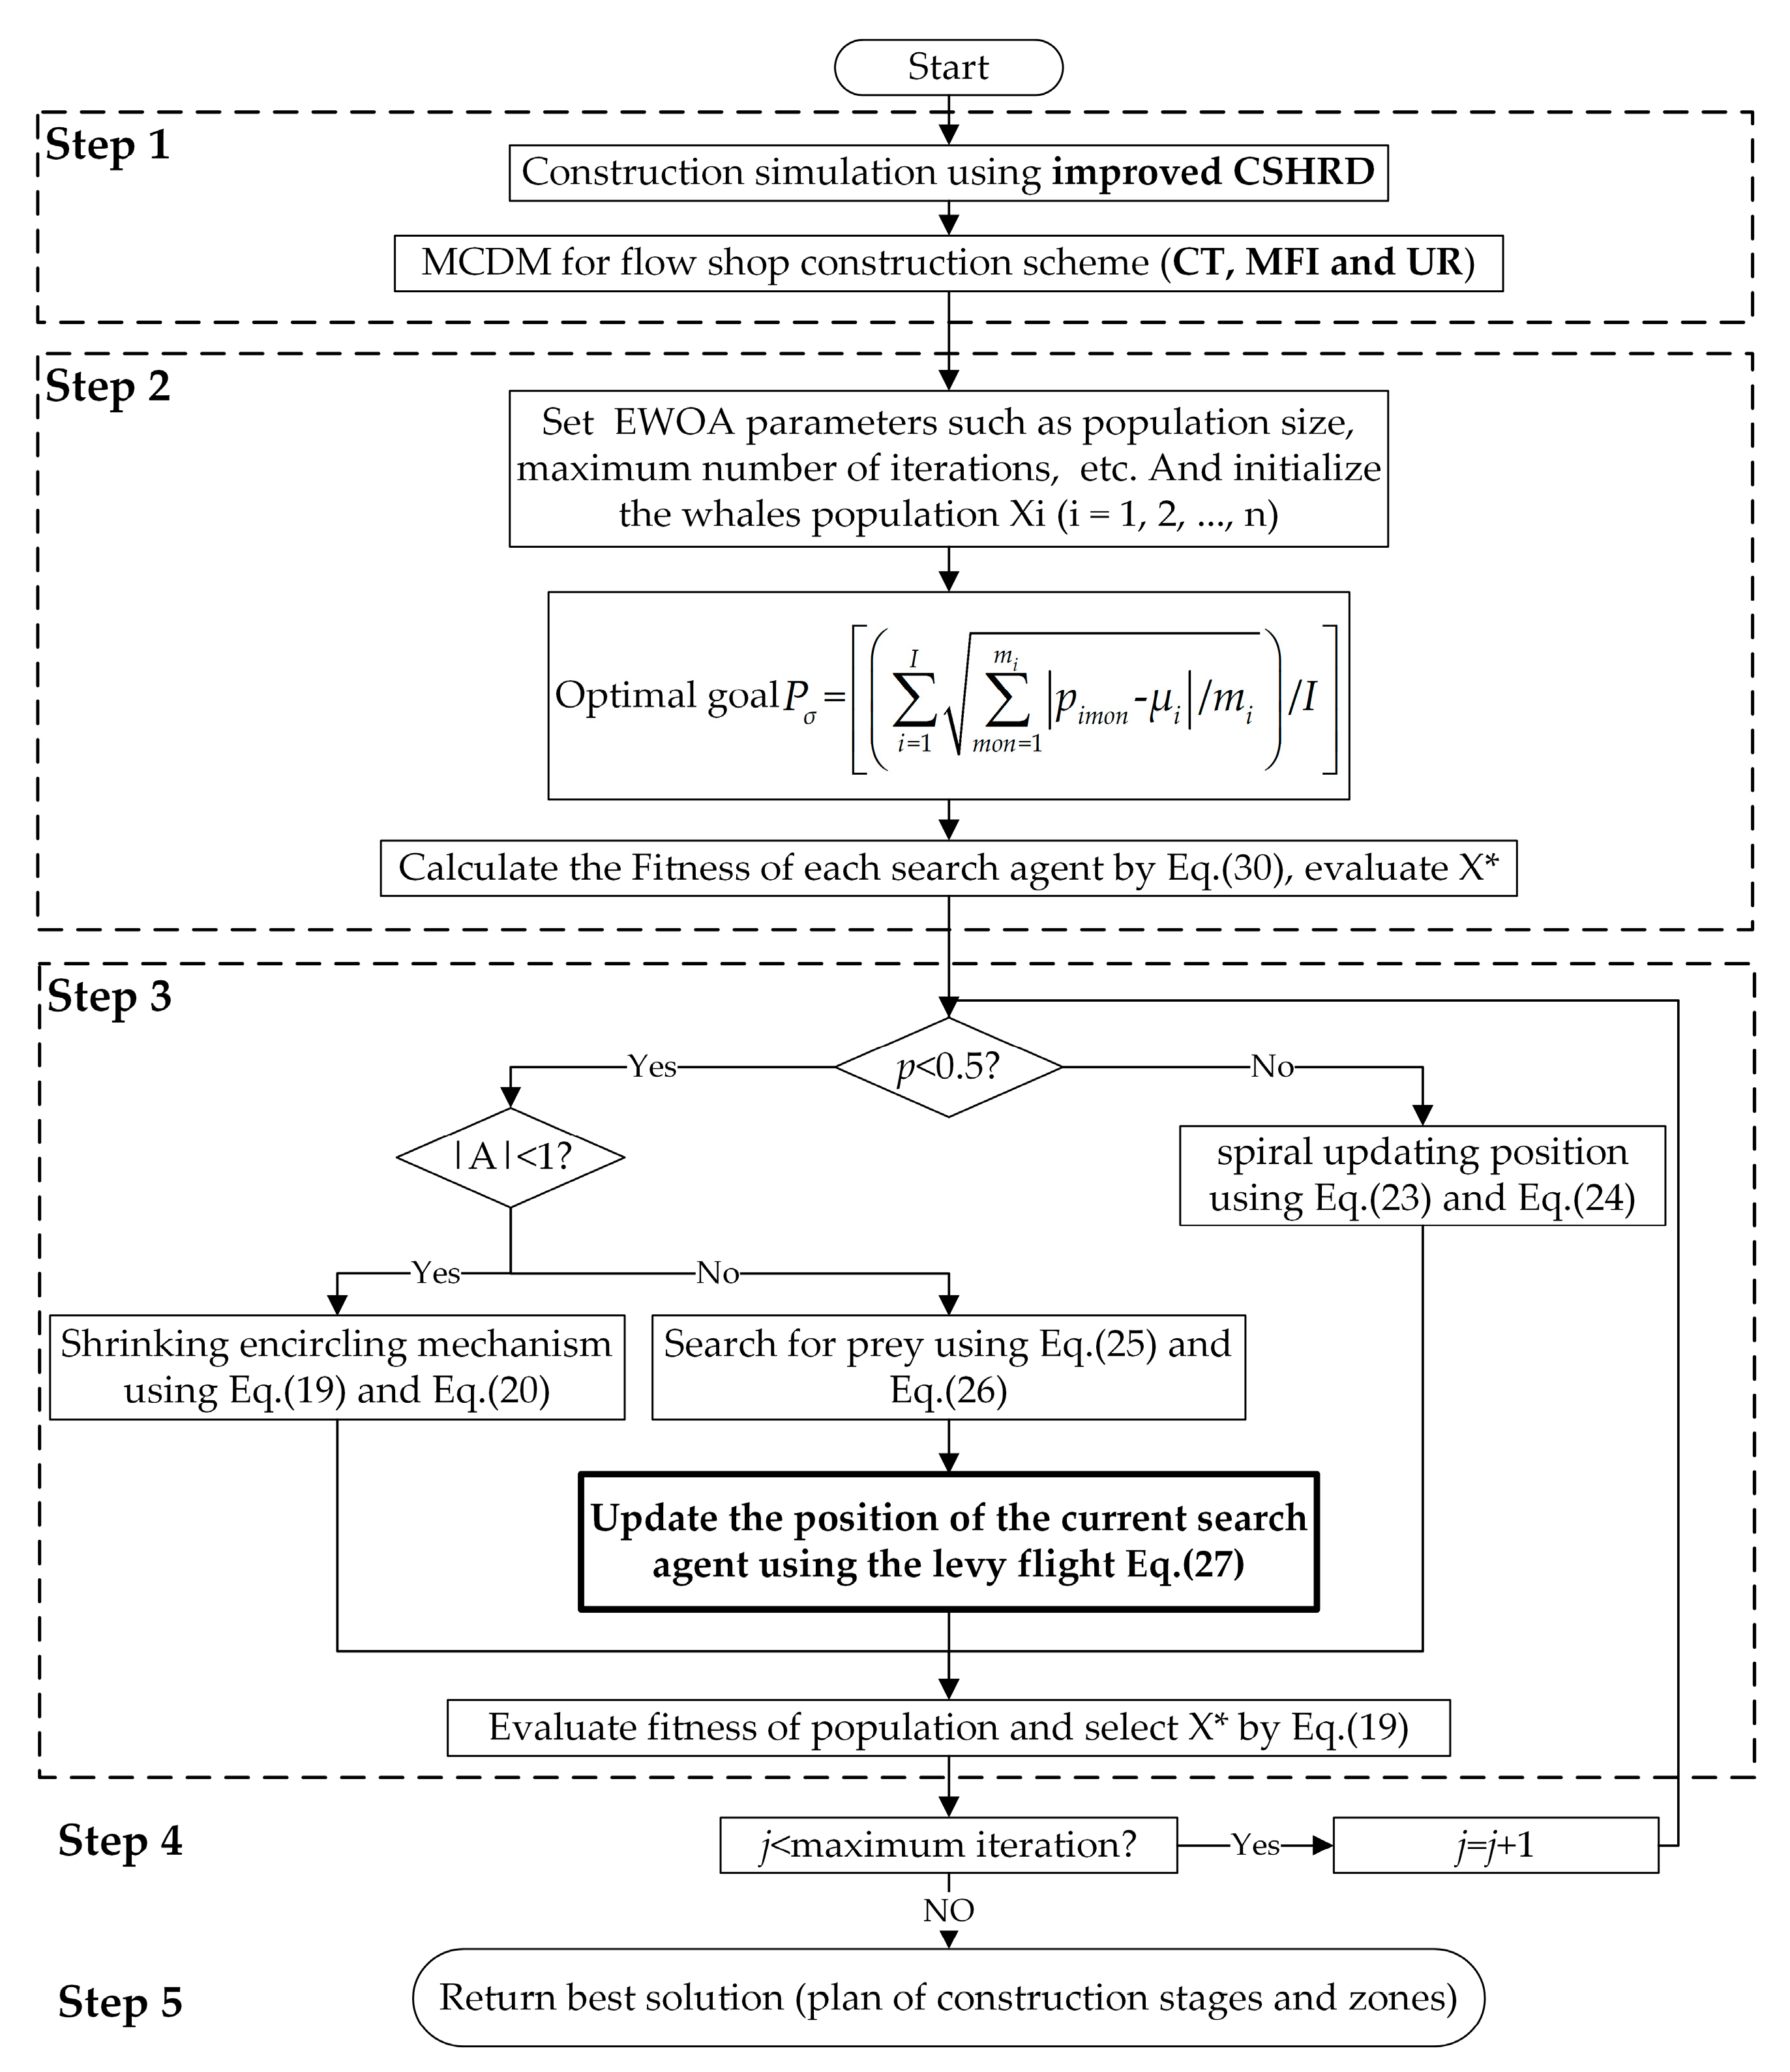
The proposed EWOA is applied to the construction stage and zone optimization, in which a penalty function is used to prevent excessive advancement and the lag of the construction progress to ensure that the simulation results of the dam meet the constraints. The specific steps are shown in Figure 7.
  • Determine the preferable flow shop construction scheme: Determine the preferable flow shop construction scheme through the method proposed in Section 3.2. Then, construction filling intensity can be obtained using the improved CSHRD model.
  • Initialization and evaluation: First, initial parameters are set, including the number of populations n, the maximum number of iterations M, the logarithmic spiral shape constant b, the current number of iterations j, and the algorithm termination conditions. Then, the initial whale population is randomly generated; specifically, the n initial schemes Xi (i = 1,2,…,n) under the constraints of the construction stages and zones are randomly generated. Next, the fitness function of each initial construction stage and zone plan is calculated. The fitness function f δ consists of two parts: the objective function P σ and the penalty function:
    f δ = min ( P σ + δ t = 1 m i = 1 x max ( 0 , g i ) )
    g i ( q i t ) = min ( q i t Q i c t 1 , Q i c t 2 q i t )
    where Pσ is the filling intensity disequilibrium degree, which is calculated by Equation (1); δ is the penalty factor; m is the number of stages, x is the number of constraints; qit is the simulation result of qi at time t; Qict1 is the permitted minimum qi of dam at time t; Qict2 is the permitted maximum qi of dam at time t; and qi represents strictly constrained variables including schedule and elevation, obtained from the simulation results of the optimal flow shop construction scheme, which are normalized by the deviation standardization method in the calculation process. The filling strength constraint, the upper dam strength constraint and mechanical constraints are set in the improved CSHRD.
The fitness function of each scheme is compared, and the best position X* is recorded.
3.
Update of the position: Update a, A, C, and l and p when j ≤ M. If p ≥ 0.5, then update the whale positions with Equation (12). If p < 0.5 and |A| < 1, then update the whale positions with Equation (8). If p < 0.5 and |A| > 1, select a random search agent Xrand and update the position of the current search agent by Levy flight, which is calculated using Equation (14).
4.
Judgment of the termination condition: Calculate the fitness of each search agent using Equation (17), and the best search agent position X* is found and saved. Determine whether the algorithm satisfies the termination condition. If yes, go to step 4; otherwise, let j = j + 1 and repeat steps 2–3.
5.
Output: Output the best fitness and its position X*; X* is the best construction stage and zone plan.

4. Case Study

In this section, the proposed construction stage and zone optimization model based on the data-driven D-AHP and EWOA is applied to a core rockfill dam in southwestern China during the design period. The maximum dam height of the core wall rockfill dam is 315.0 m, and the total length of the dam is 666.2 m. The total volume is approximately 48.51 million m3. To manage the construction process efficiently and satisfy the structural requirements, the dam needs to be divided into several stages and zones. The proposed model is used to obtain the preferable flow shop construction scheme while optimizing the construction stages and zones.

4.1. MCDM of the Flow Shop Construction Scheme

MCDM will be implemented repeatedly for each filling layer. Because the number of dam filling layers is huge, perhaps exceeding one thousand, the MCDM process of the flow shop construction scheme is illustrated by taking the 2780–2790 elevation section of the core area as an example. Table 2 shows the detailed flow shop construction schemes, including the division method of flow shops and mechanical allocation, and Table 3 shows the simulation results from the improved CSHRD.
Construction of the D matrix is the key to using the D-AHP method for MCDM. A data-driven method is used to construct the D matrix, which makes it easy to combine with the simulation and increase the efficiency of the MCDM process. The procedures are as follows:
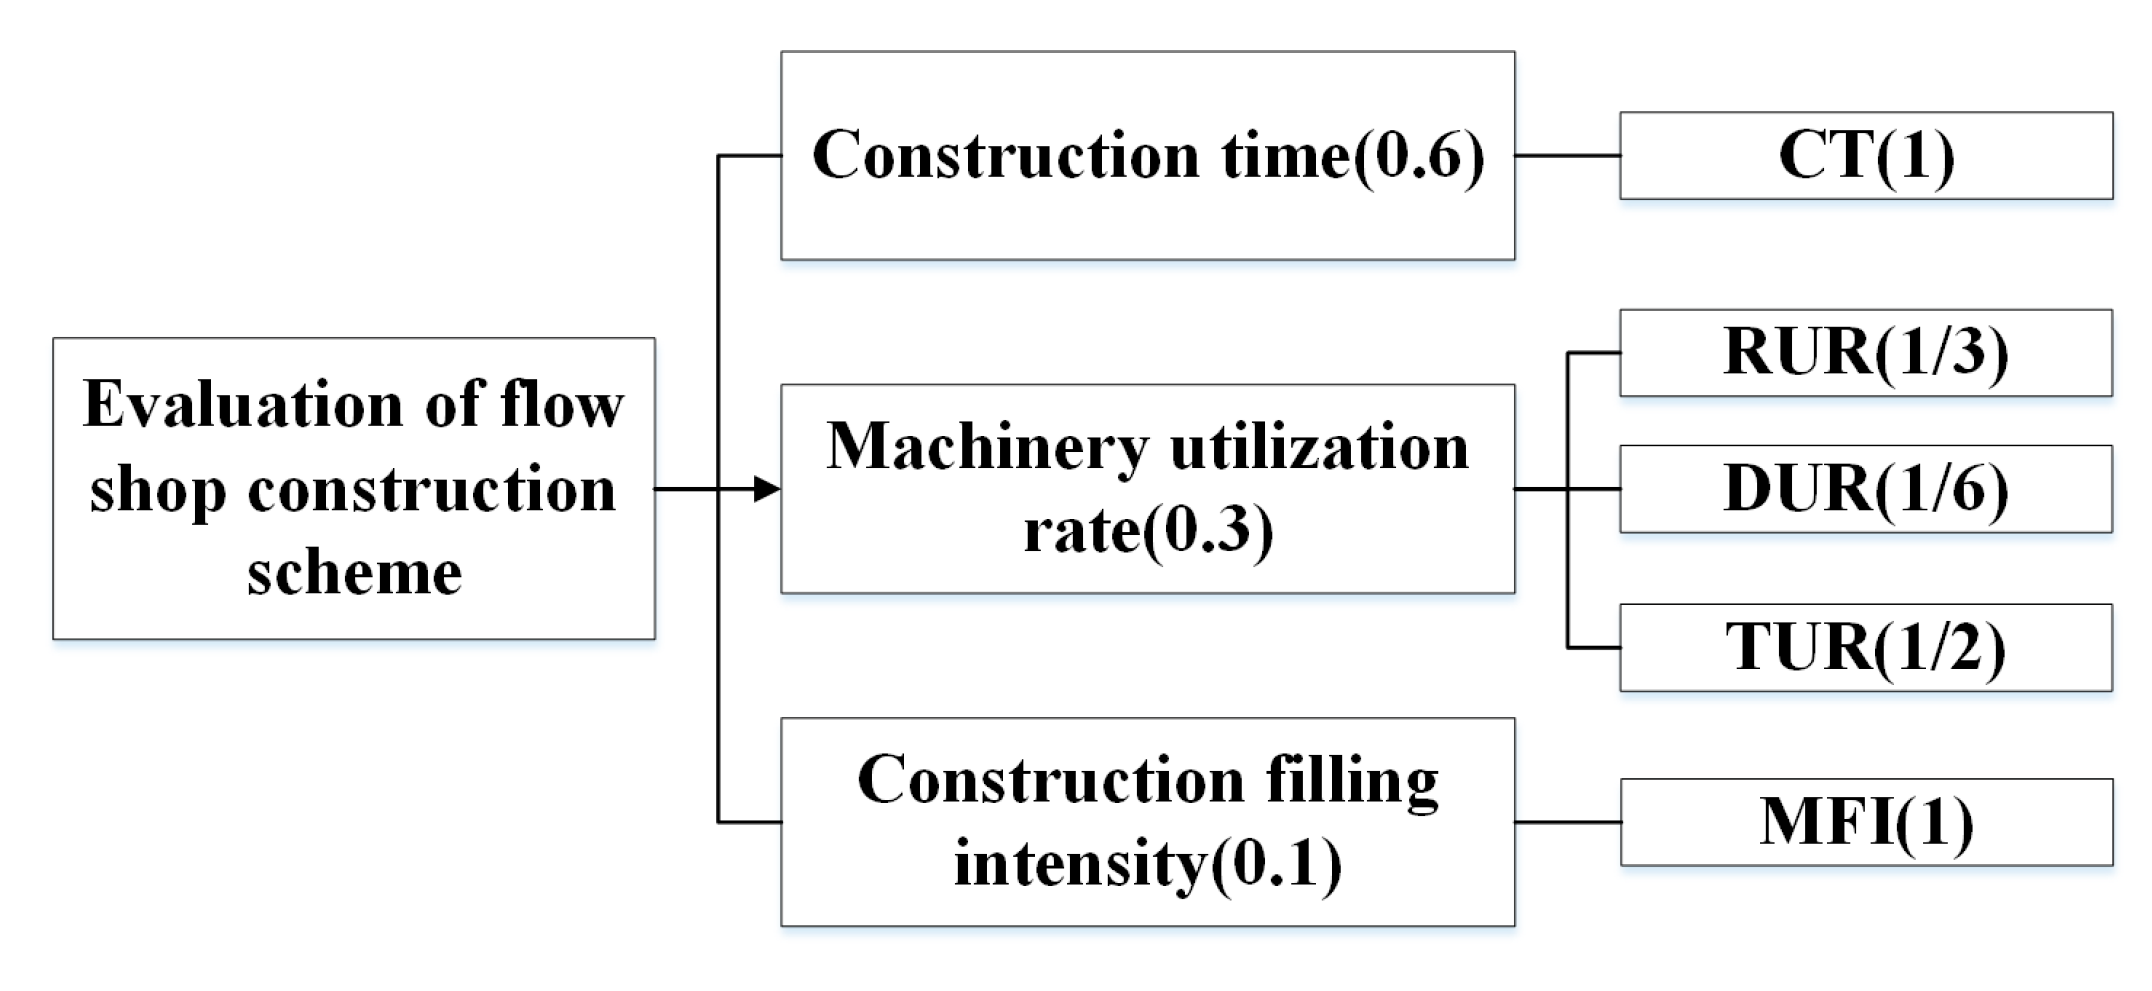
A hierarchical structure for flow shop construction MCDM is built according to expert experience, as shown in Figure 8. According to Figure 8, the absolute weight of each subfactor can be calculated, including CT (0.6), TUR (0.15), DUR (0.05), RUR (0.1) and MFI (0.1).
The D matrix between scheme 1 and scheme 2 is taken as an example to illustrate how to construct a D matrix with a D-AHP method. According to Table 3, the CT of scheme 1 (A1) is 150 days and CT of scheme 2 (A2) is 169 days. A1 performs better than A2 with a preference degree of 0.5298, which is calculated by 169/(150+169). A2 performs better than A1 with a preference degree of 0.4702. Therefore, u(A1,A2) = 0.5298, and u(A2,A1) = 0.4702. As the absolute weight of the CT is 0.60, the belief of u(A1, A2) = 0.5298 should be 0.60. Therefore, similarly, we have the following:
On TUR, the belief of u(A1, A2) = 0.5662 is 0.15; On DUR, the belief of u(A1, A2) = 0.4994 is 0.05; On RUR, the belief of u(A1, A2) = 0.5764 is 0.1; On MFI, the belief of u(A1, A2) = 0.5007 is 0.1; As a result, the D matrix of A1 over A2 is
D ( A 1 , A 2 ) = [ 0.5298 0.6 0.5662 0.15 0.4994 0.05 0.5764 0.1 0.5007 0.1 ]
Through the above methods, D matrixes among A1, A2, A3, A4 and A5 can be built and converted into a crisp matrix:
R c =             A 1               A 2             A 3             A 4             A 5 A 1 A 2 A 3 A 4 A 5 [ 0.5000 0.5355 0.5394 0.5851 0.5604 0.4645 0.5000 0.5039 0.5503 0.5266 0.4606 0.4961 0.5000 0.5480 0.5228 0.4149 0.4497 0.4520 0.5000 0.4675 0.4396 0.4734 0.4772 0.5325 0.5000 ]
Next, the crisp matrix Rc is converted to a probability matrix Rp, which represents the preference probability between pairwise alternatives according to the following rules: (i) if Rc(i,j) > 0.5; and (ii) if Rc(i,j) ≤ 0.5. Moreover, the triangularization method is used to convert the probability matrix Rp to the triangular matrix of probability RTp:
R p T = A 1 A 2   A 3   A 5   A 4 A 1 A 2 A 3 A 5 A 4 [   0     1     1   1     1     0   0   1 1   1   0   0   0 1   1   0   0   0 0   1   0   0   0 0   0 ]
According to RTp, the ranking of schemes is obtained:
A 1 A 2 A 3 A 5 A 4
As Equation (23) shows, scheme 1 (A1) is the best flow shop construction scheme.
Furthermore, the priority weight of each scheme can be obtained quantitatively through the D-AHP method. In conformity with RTp, the crisp matrix Rc is converted into a triangular matrix RTc:
R c T =             A 1             A 2             A 3               A 5               A 4 A 1 A 2 A 3 A 5 A 4 [ 0.5000 0.5355 0.5394 0.5604 0.5851 0.4645 0.5000 0.5039 0.5266 0.5503 0.4606 0.4961 0.5000 0.5228 0.5480 0.4396 0.4734 0.4772 0.5000 0.5325 0.4149 0.4497 0.4520 0.4675 0.5000 ]
A weight vector W = ( w 1 , w 2 , w 3 , w 4 , w 5 ) T is defined to represent the priority weight of each scheme, where w i is the priority weight of A i . The elements adjacent to the main diagonal in the triangulated crisp matrix (i.e., 0.5355, 0.5039, 0.5228, 0.5325) represent the weight relationships of the different schemes, as follows:
{ λ ( w 1 w 2 ) = 0.5355 0.5 λ ( w 2 w 3 ) = 0.5039 0.5 λ ( w 3 w 5 ) = 0.5228 0.5 λ ( w 5 w 4 ) = 0.5325 0.5 w 1 + w 2 + w 3 + w 4 + w 5 = 1 λ > 0 w i 0 , i { 1 , 2 , 3 , 4 , 5 }
By solving the above equation set, we have:
{ w 1 = 1 / 5 + 0.04636 / λ w 2 = 1 / 5 + 0.01086 / λ w 3 = 1 / 5 + 0.00696 / λ w 4 = 1 / 5 0.04834 / λ w 5 = 1 / 5 0.01584 / λ λ [ 0.2417 , + )
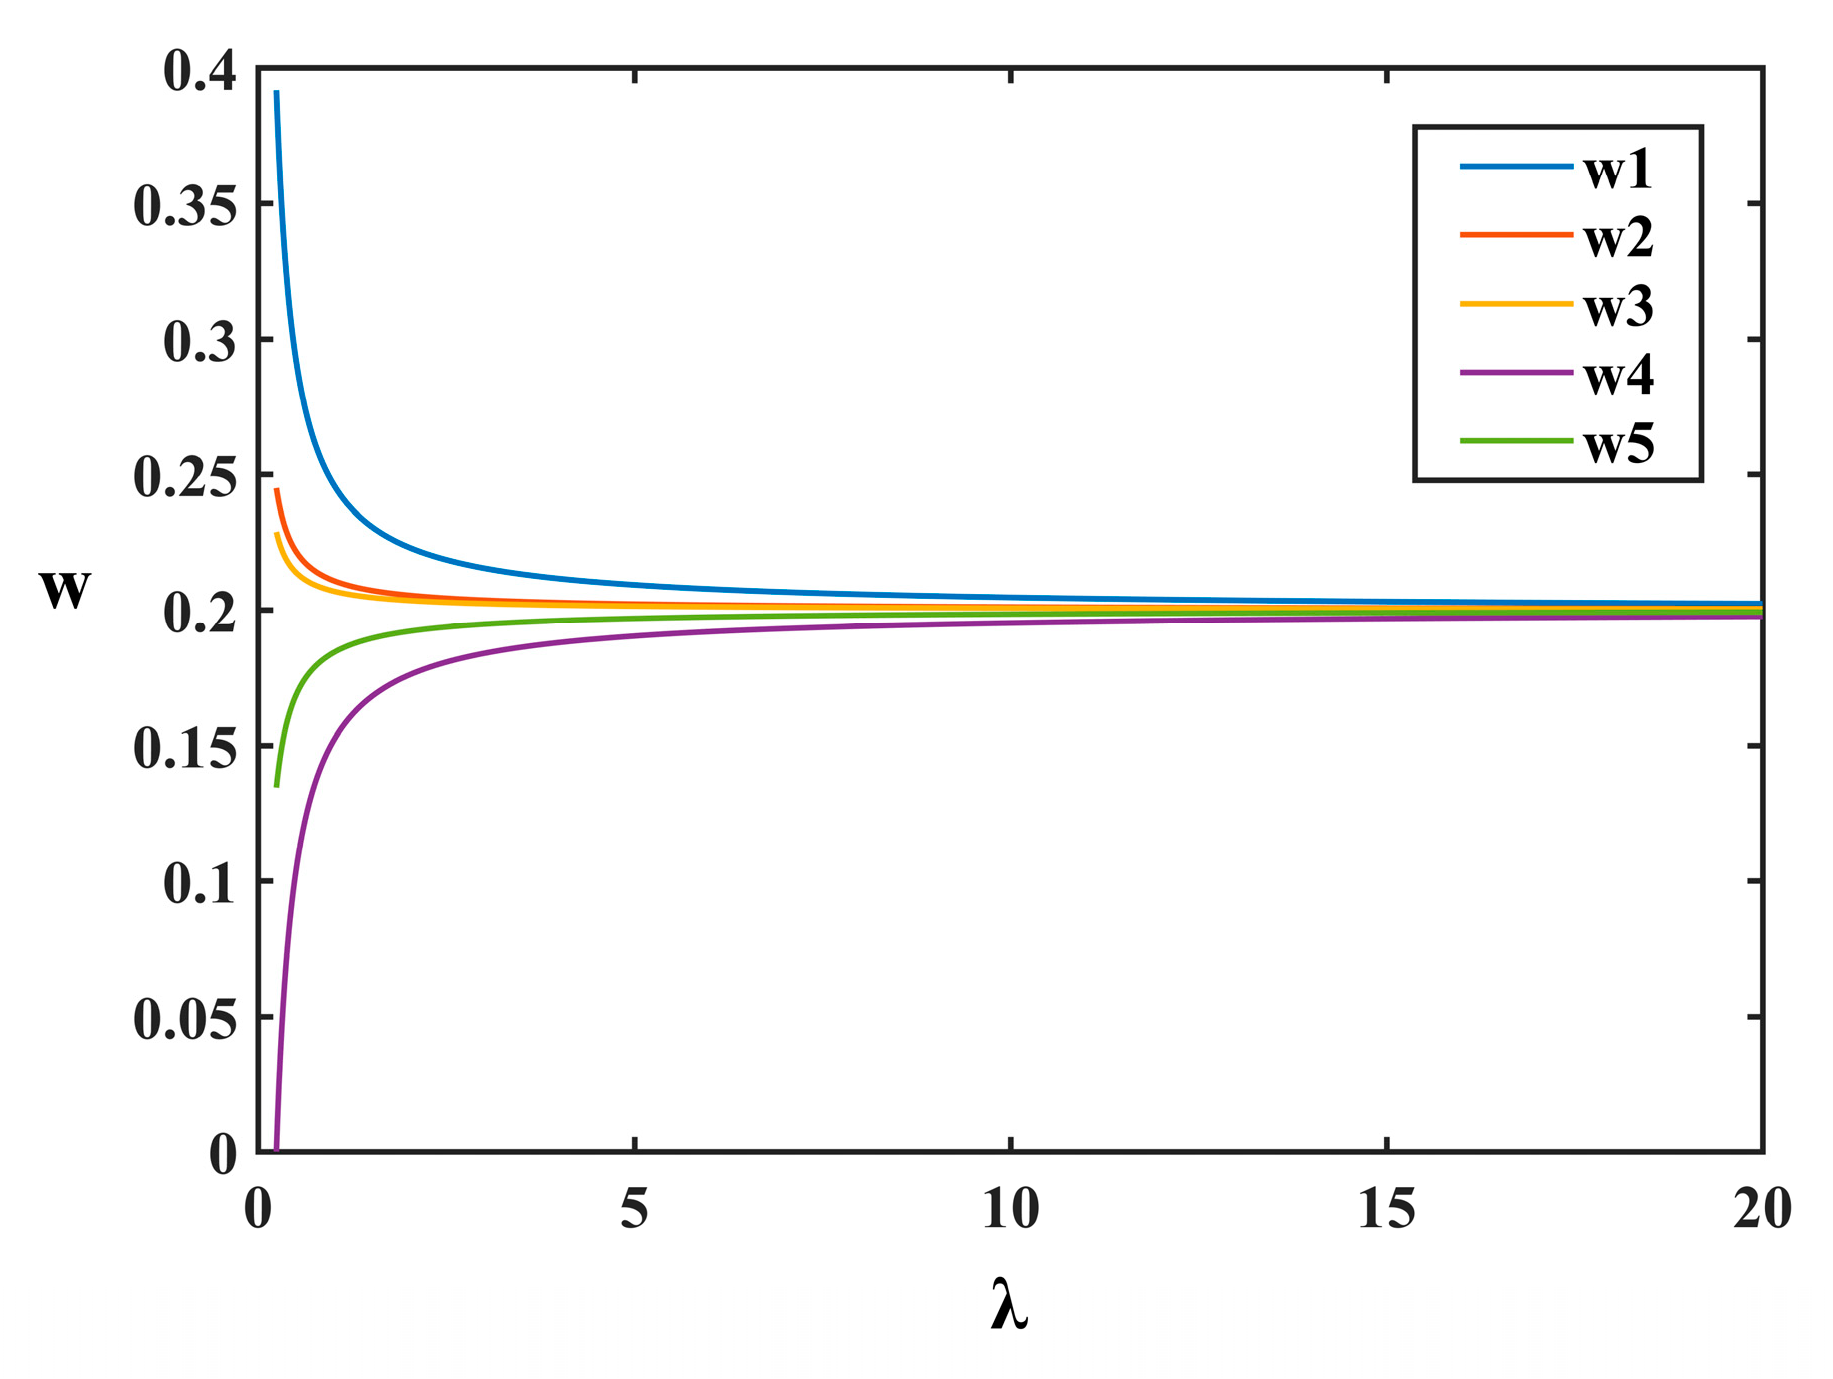
where parameter λ represents the credibility of information and is related to the level of experts providing information. The greater the credibility of the information is, the smaller the value of λ is. In this study, along with the changing value of λ, the priority of the scheme changes, as shown in Figure 9. Although the priority of the scheme is increasingly less distinguished along with the decrease in the credibility of the information, the rank of schemes is always unchanged. Since the simulation model data have higher credibility, λ = 0.25 is taken, and the priorities of the schemes are 0.39, 0.24, 0.23, 0.01 and 0.13.
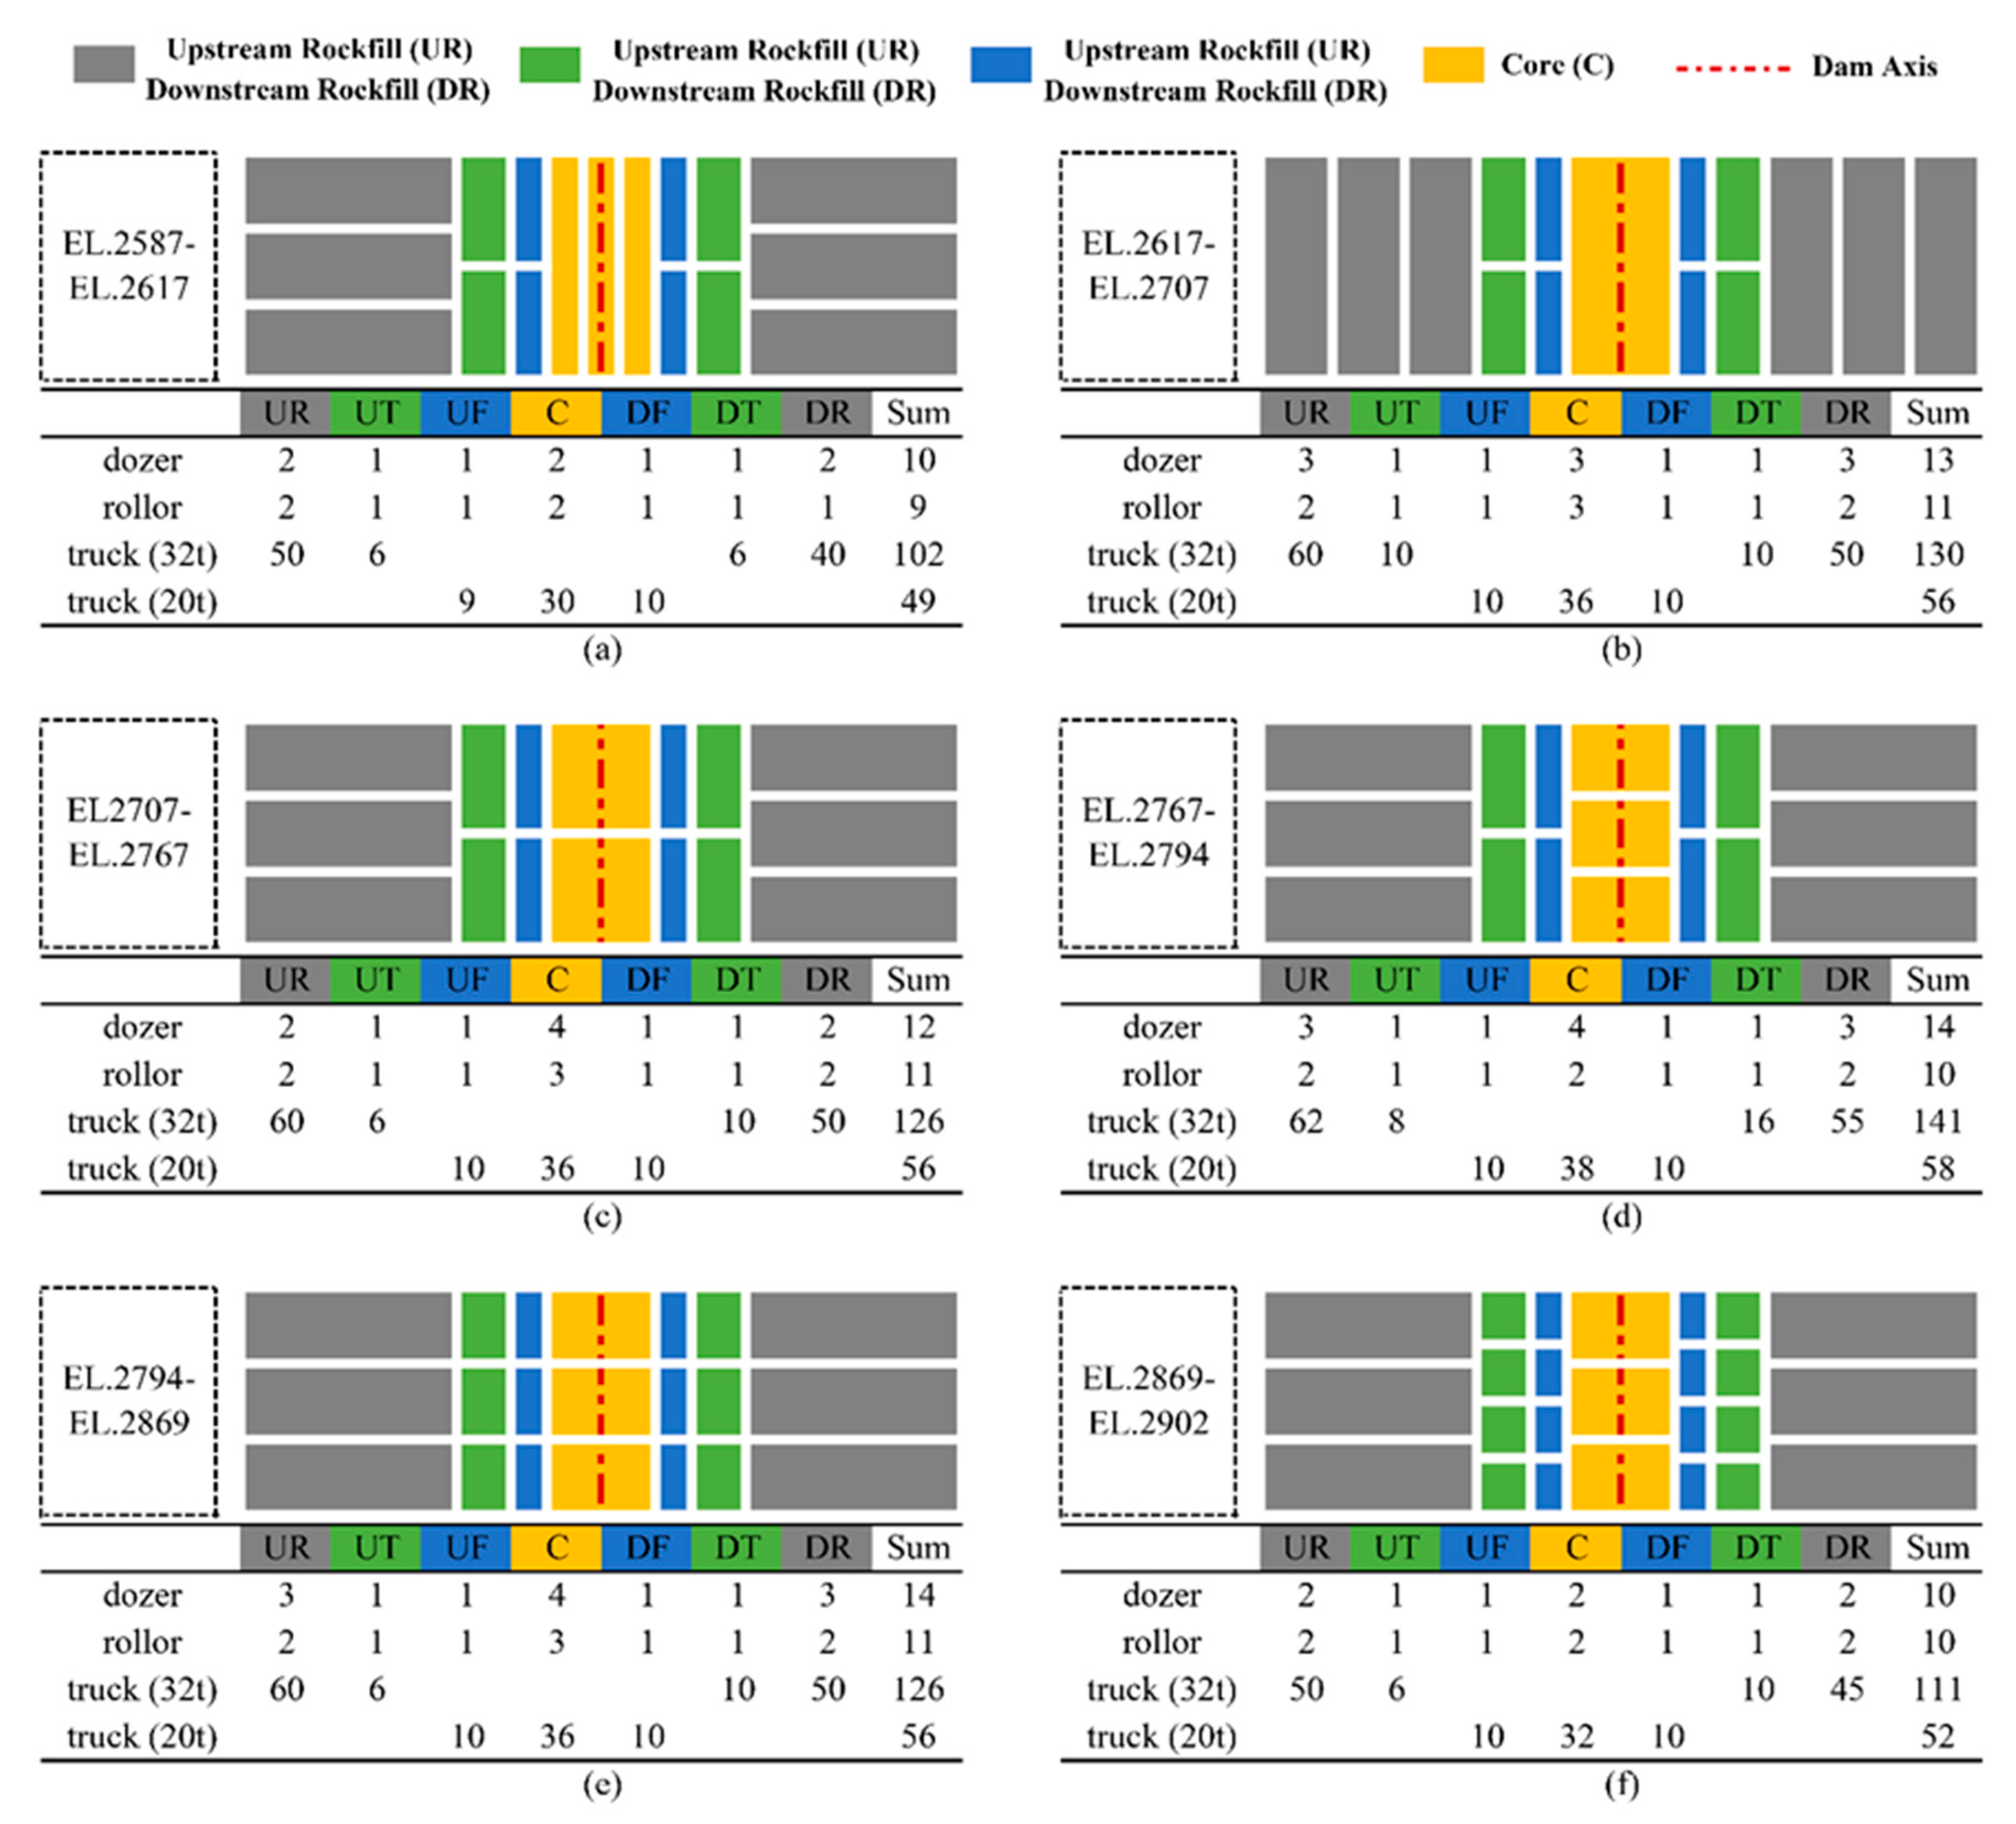
According to the above process, the flow shop construction scheme for each filling layer can be selected. If the flow shop construction schemes of a continuous filling layer are the same at a certain elevation, these filling layers are classified into a group, and the final result of the flow shop construction scheme MCDM is shown in Figure 10.

4.2. Construction Stage and Zone Optimization

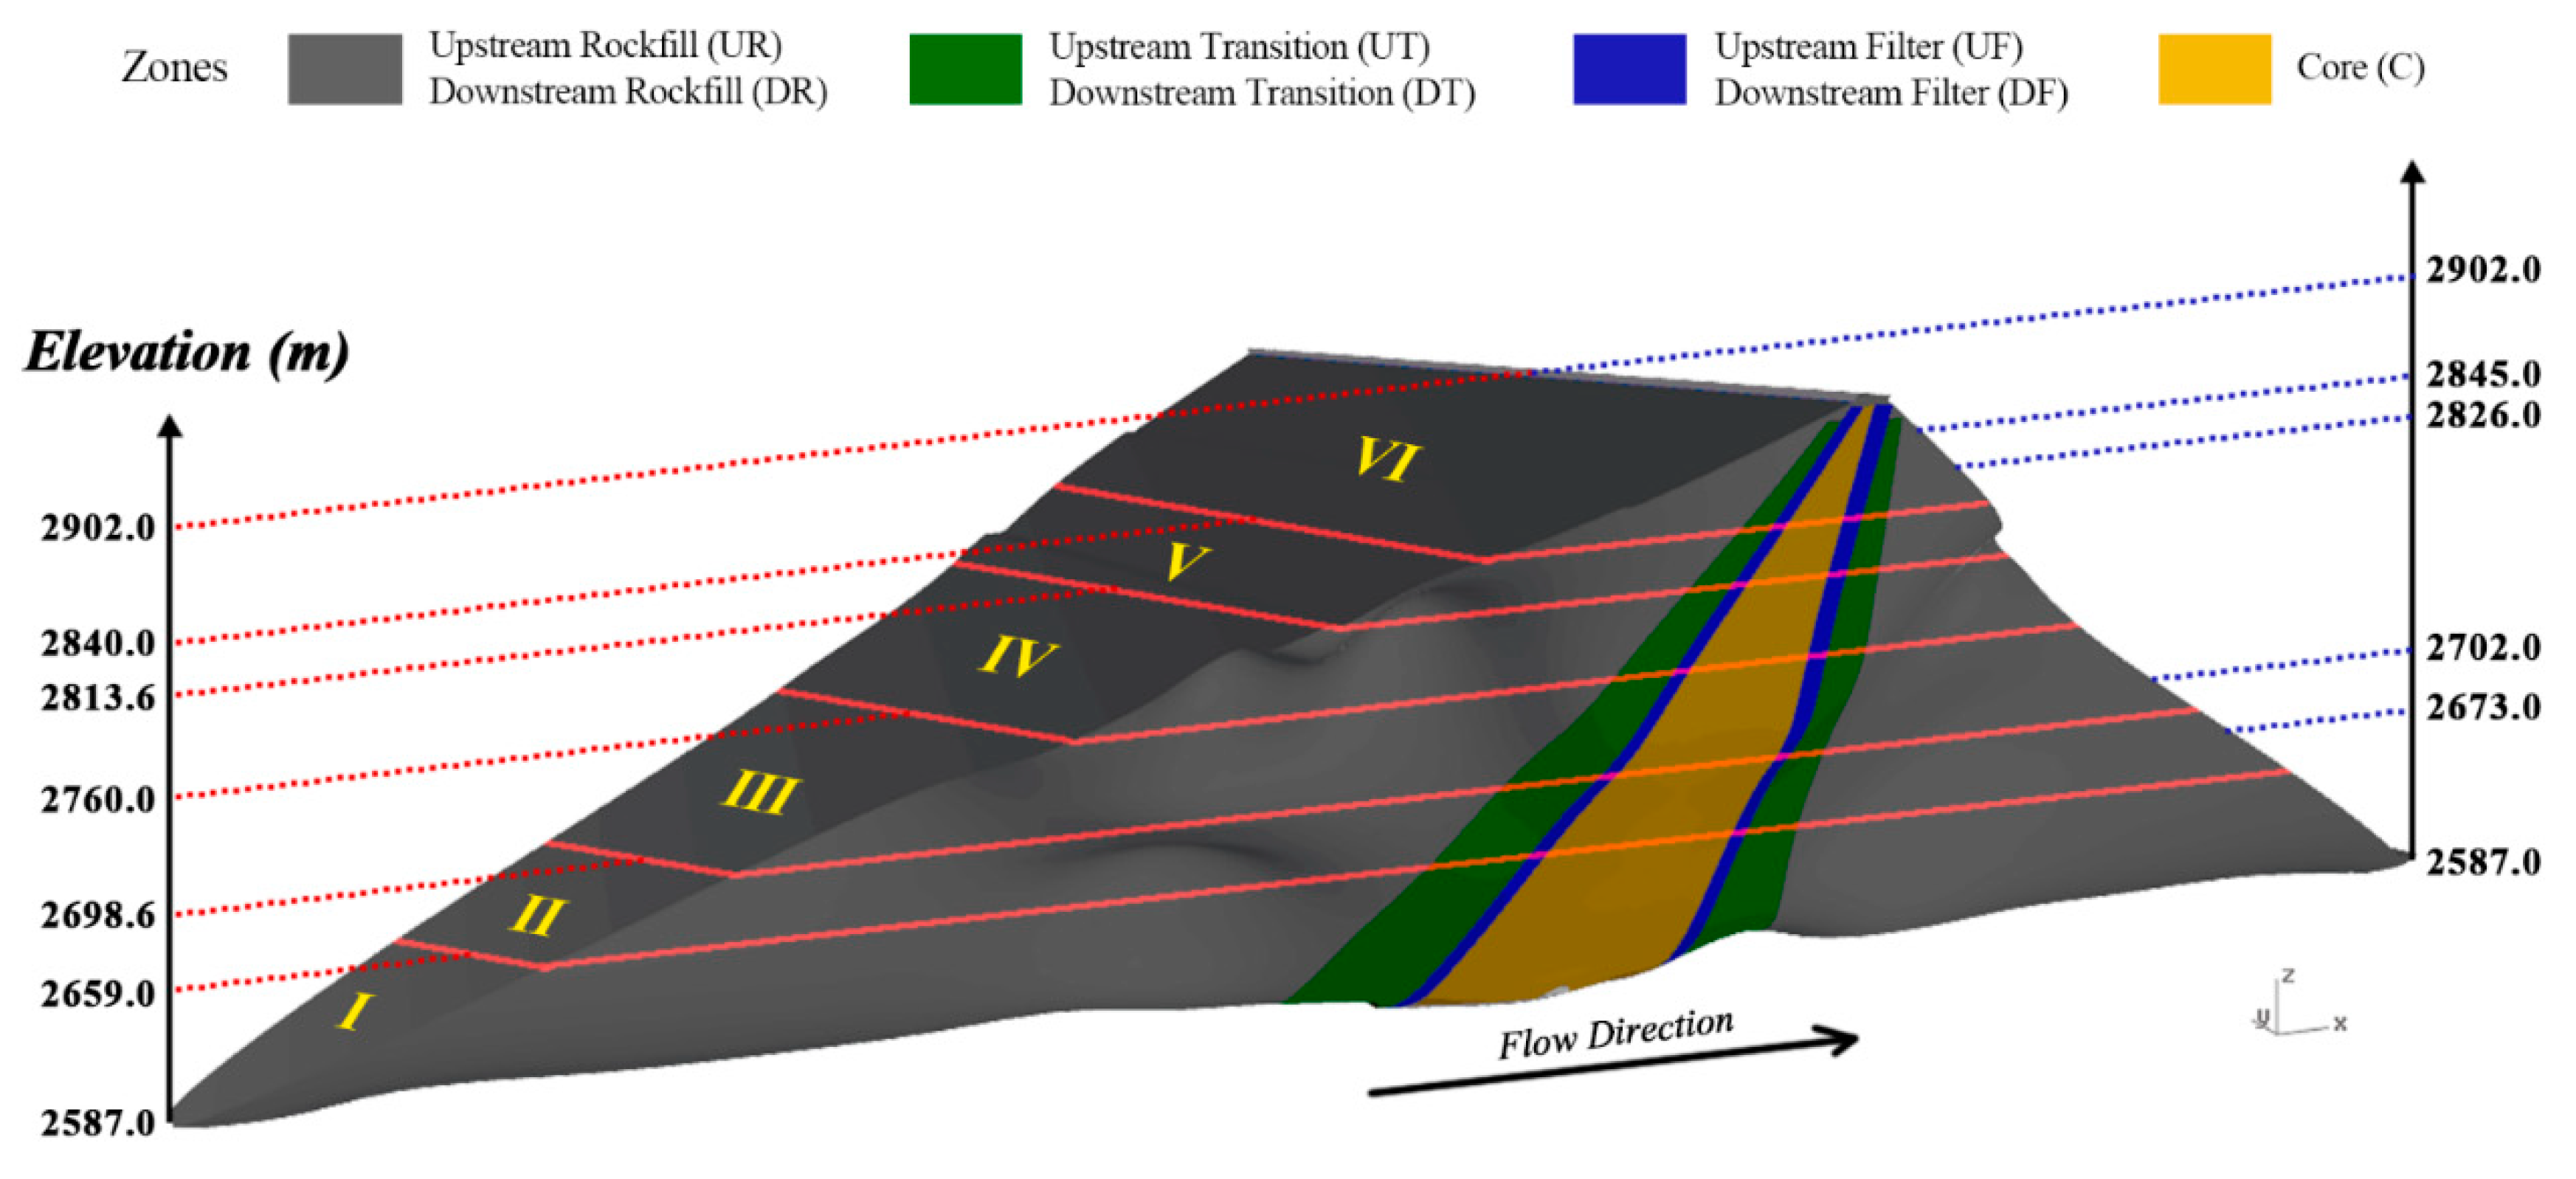
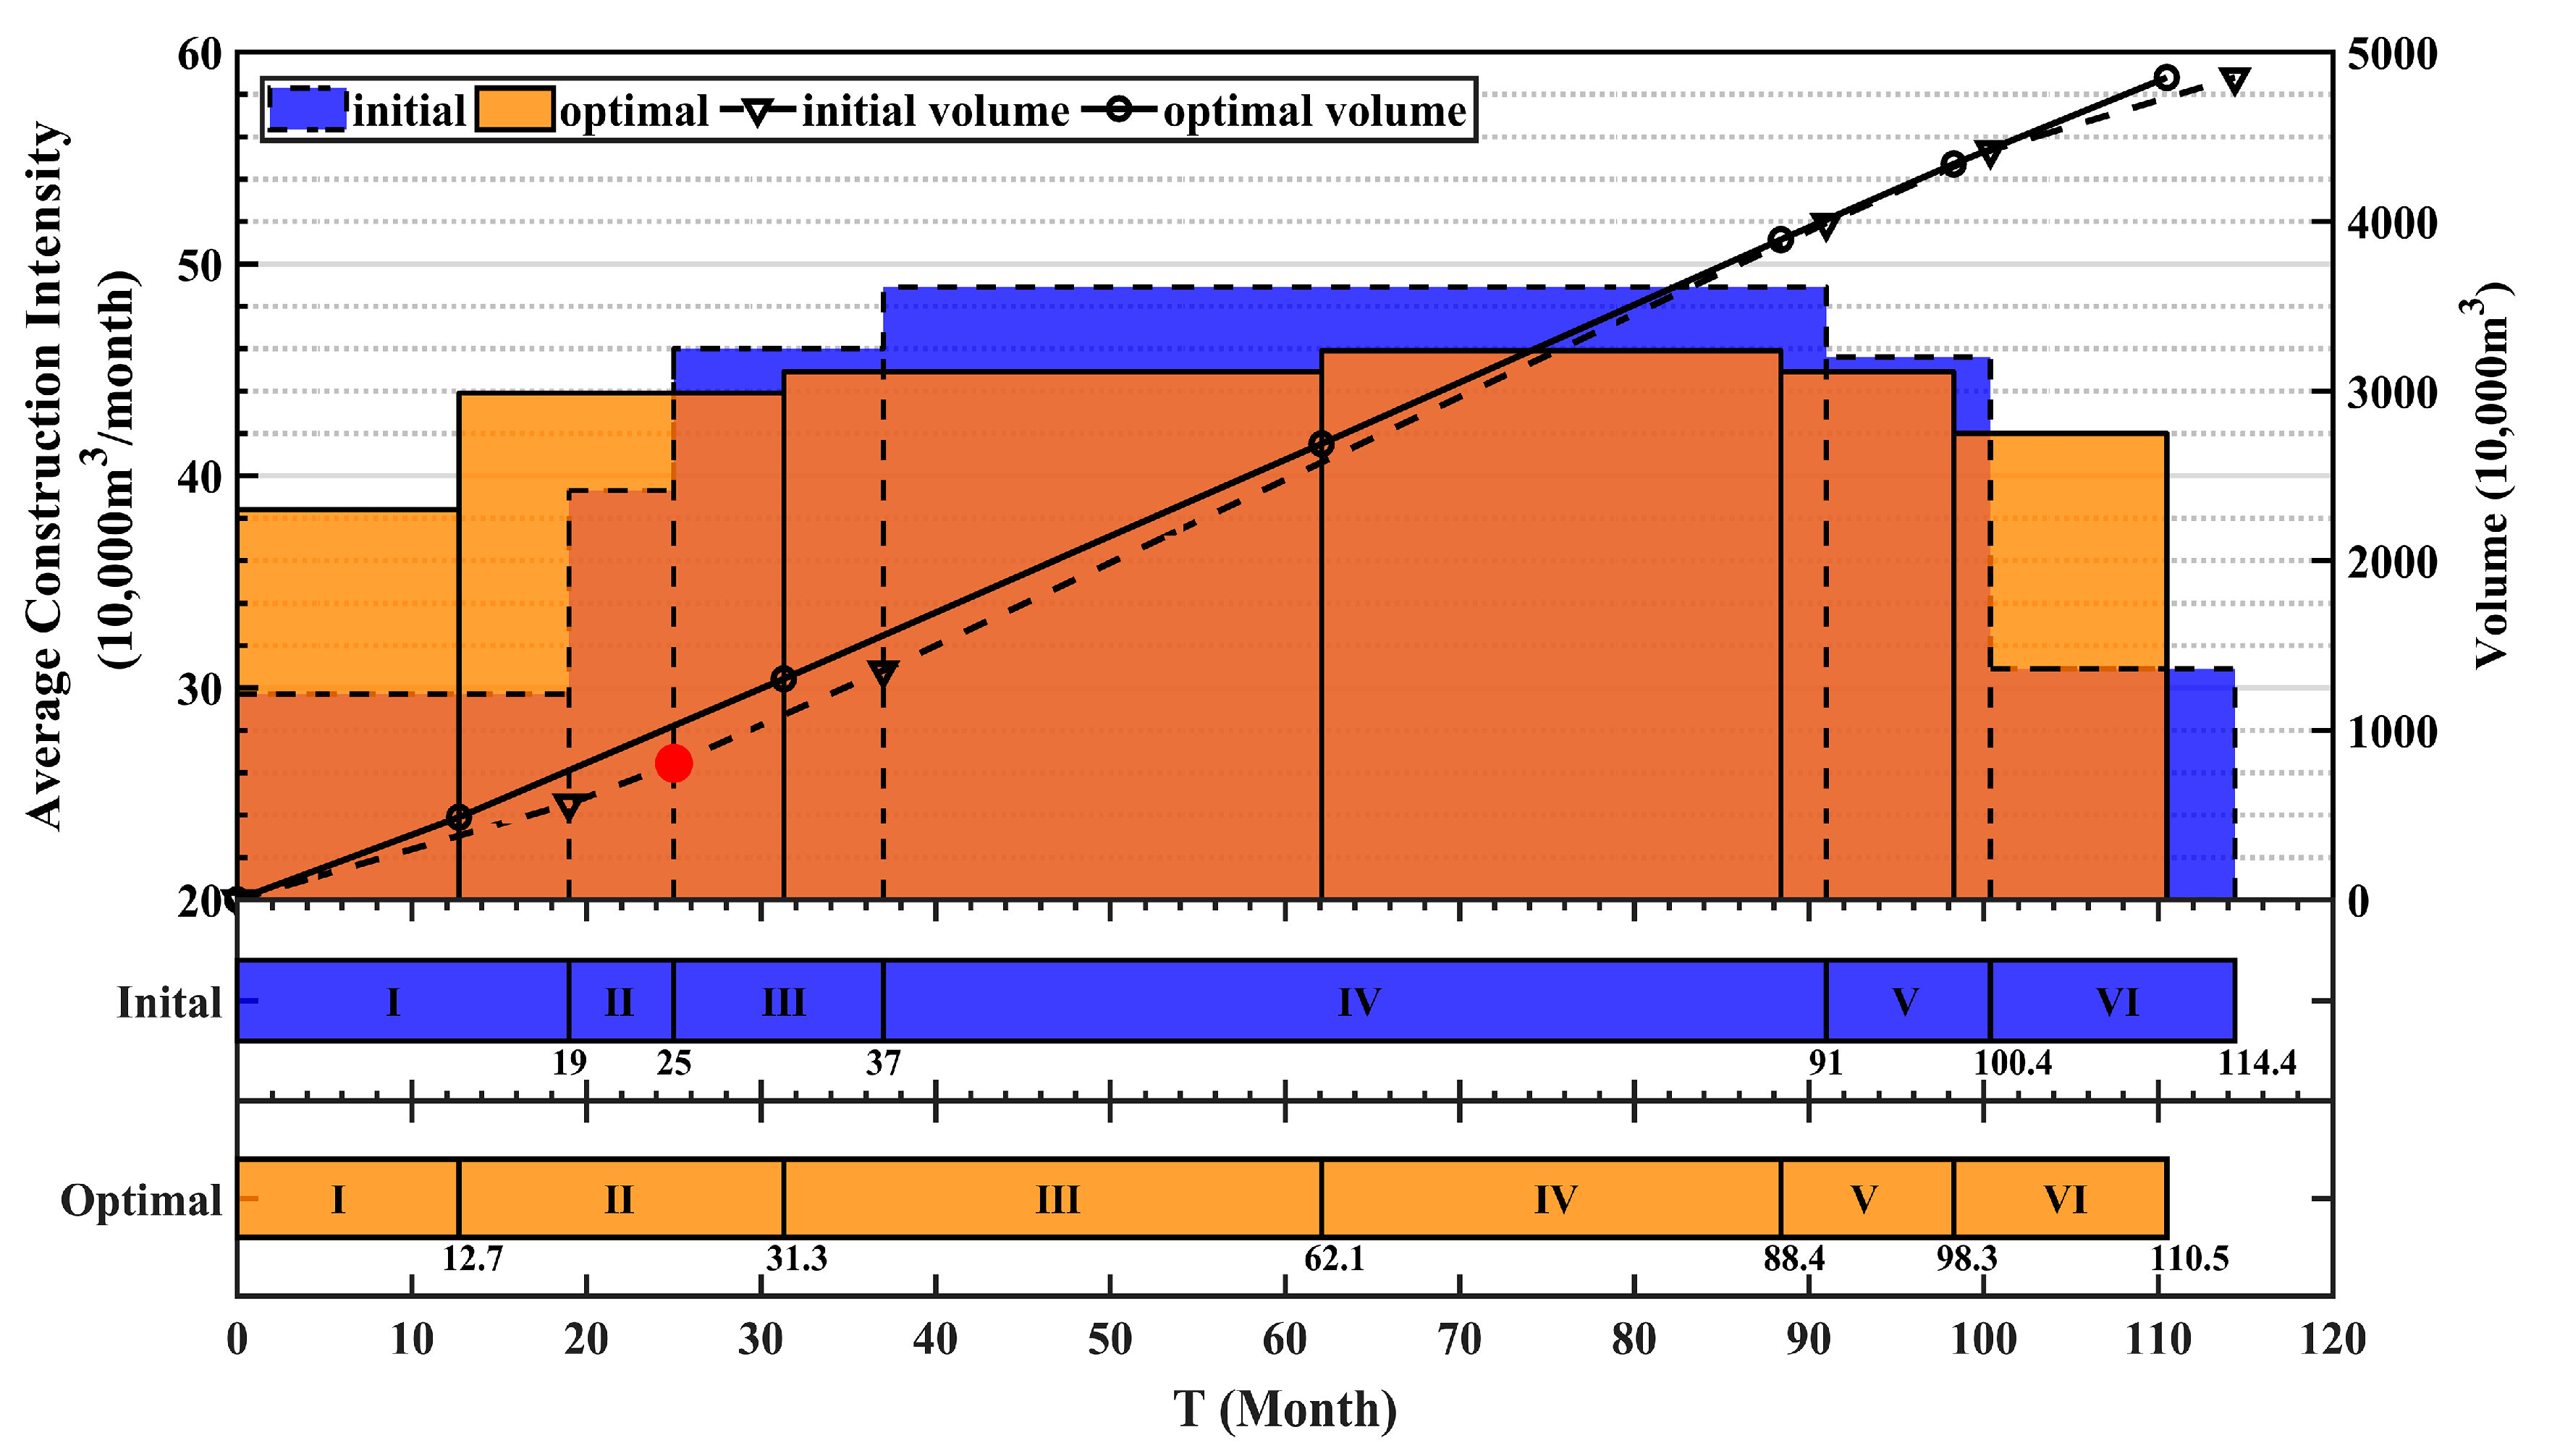
The entire construction process of the core rock fill dam is divided into six stages, and there are five key elevation constraints, as shown in Table 4. First, 10 initial populations are randomly generated by the EWOA within the elevation limits, then the fitness function value of each initial construction stage and zone plan is calculated with the simulation results of the optimal flow shop construction scheme. Second, new populations are continually generated by EWOA until the optimal solution is found. Optimization results are displayed as control elevations, and the comparison elevations of each period of the optimal and initial plans are shown in Figure 11.

4.3. Discussion

The construction progress of the rockfill dam is mainly restricted by the core construction, which can be seriously impacted by cold and rainy weather. According to hydrological data, the peak of effective days for core construction occurs in April, May, and October. Other zones are less affected by the rainy season, and the peak period of construction is from April to October, as shown in Figure 12. The initial construction stage and zone plan depends on the experts’ experience. The test of the EWOA and the experiment of the case study were implemented in MATLAB R2017a (MathWorks, Natick, MA, USA) on Windows 7 with 3.60 GHz Intel® Core™ i7-4790 processor and 16.0GB RAM (Microsoft, Redmond, WA, USA). The results are as follows.

4.3.1. Comparison between the Optimal and the Initial Plan

As shown in Figure 13, the optimal plan is more balanced than the initial one. The total duration of the optimization plan is 3.9 months less than the total duration of the initial plan. In the optimization scheme, the filling heights of the 1st to 6th phases are 72 m, 39.7 m, 61.4 m, 53.6 m, 26.4 m and 62 m, respectively. The maximum filling volume is 13.855 million m3 in the third phase, and the longest construction stage is 30.8 months. The minimum filling volume is 4.462 million m3 in the 5th stage, whose CT is 9.9 months.
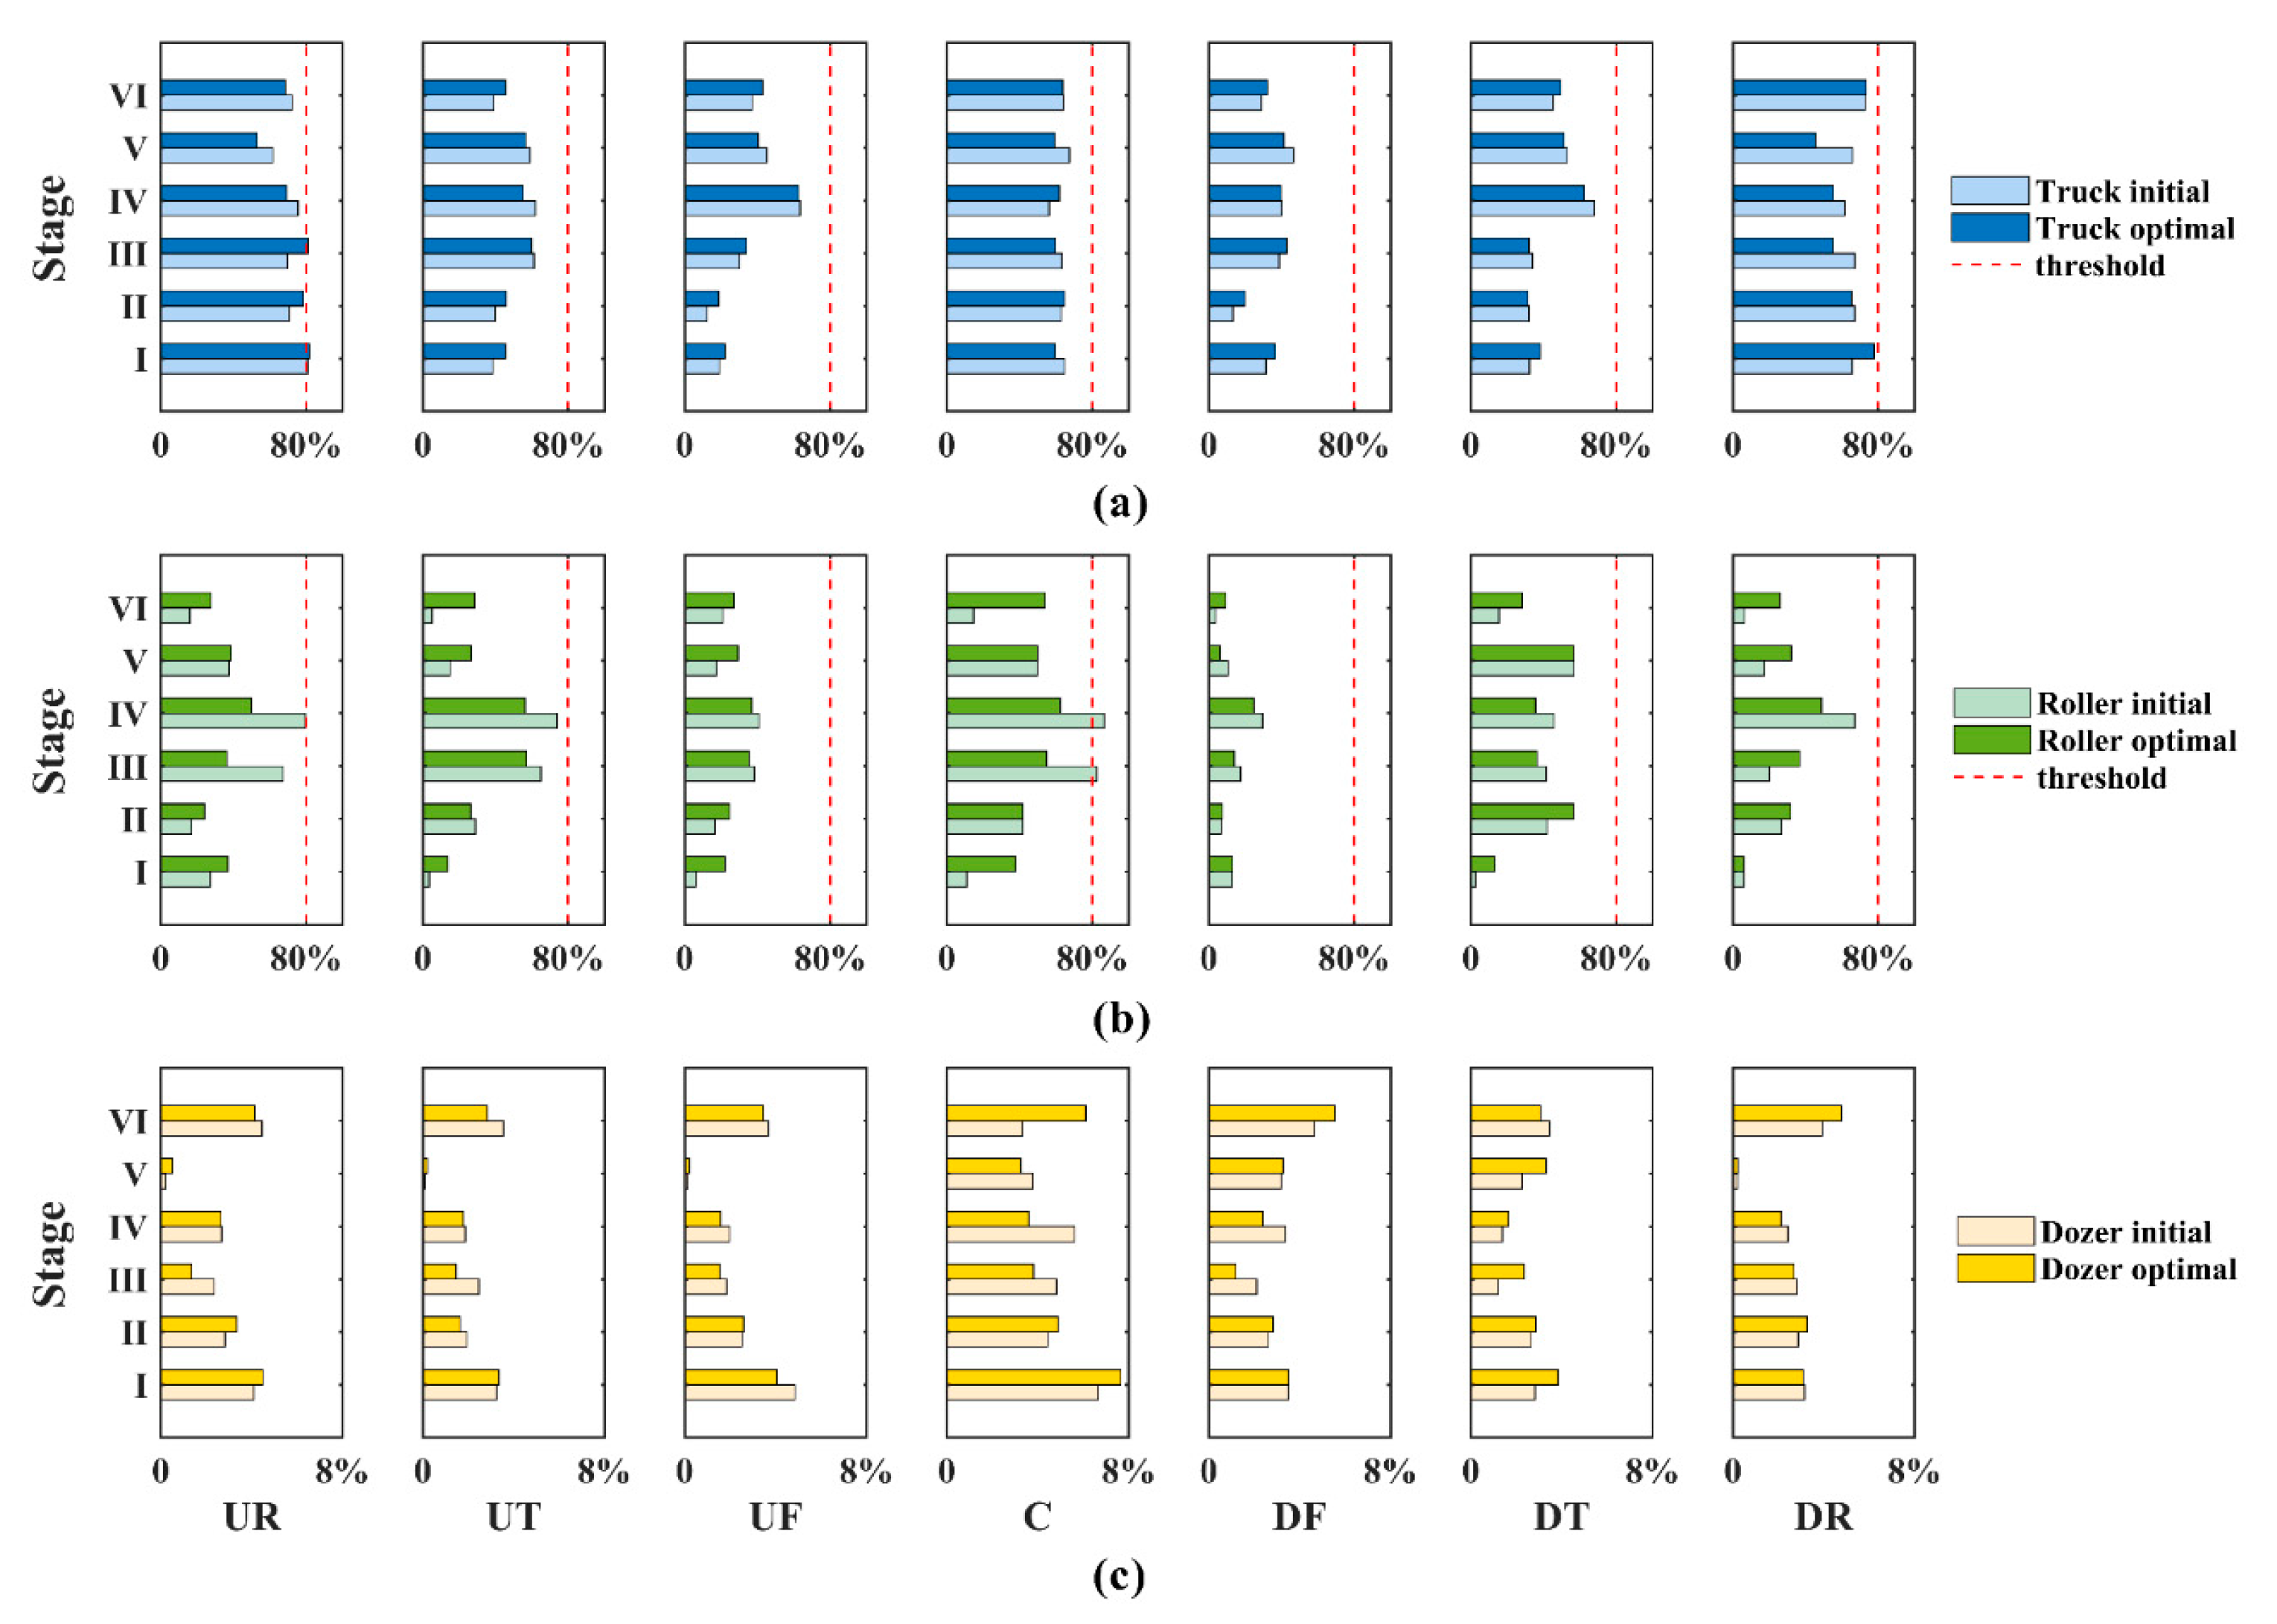
A comparison of average machinery utilization rates between the optimization scheme and the initial scheme is shown in Figure 14. The TUR and RUR are important indicators to control because of the intensive use of trucks and rollers during construction. To prevent mechanical failure caused by high intensity work, the TUR and RUR should be restricted to less than 80%. The TUR and RUR of the optimal scheme are well restricted within 80%, while some RUR and TUR of the initial scheme exceed the maximum threshold. In addition, the TUR, RUR and DUR of the optimal scheme all confer more balance than in the initial scheme, which is conducive to the normal use of machinery.
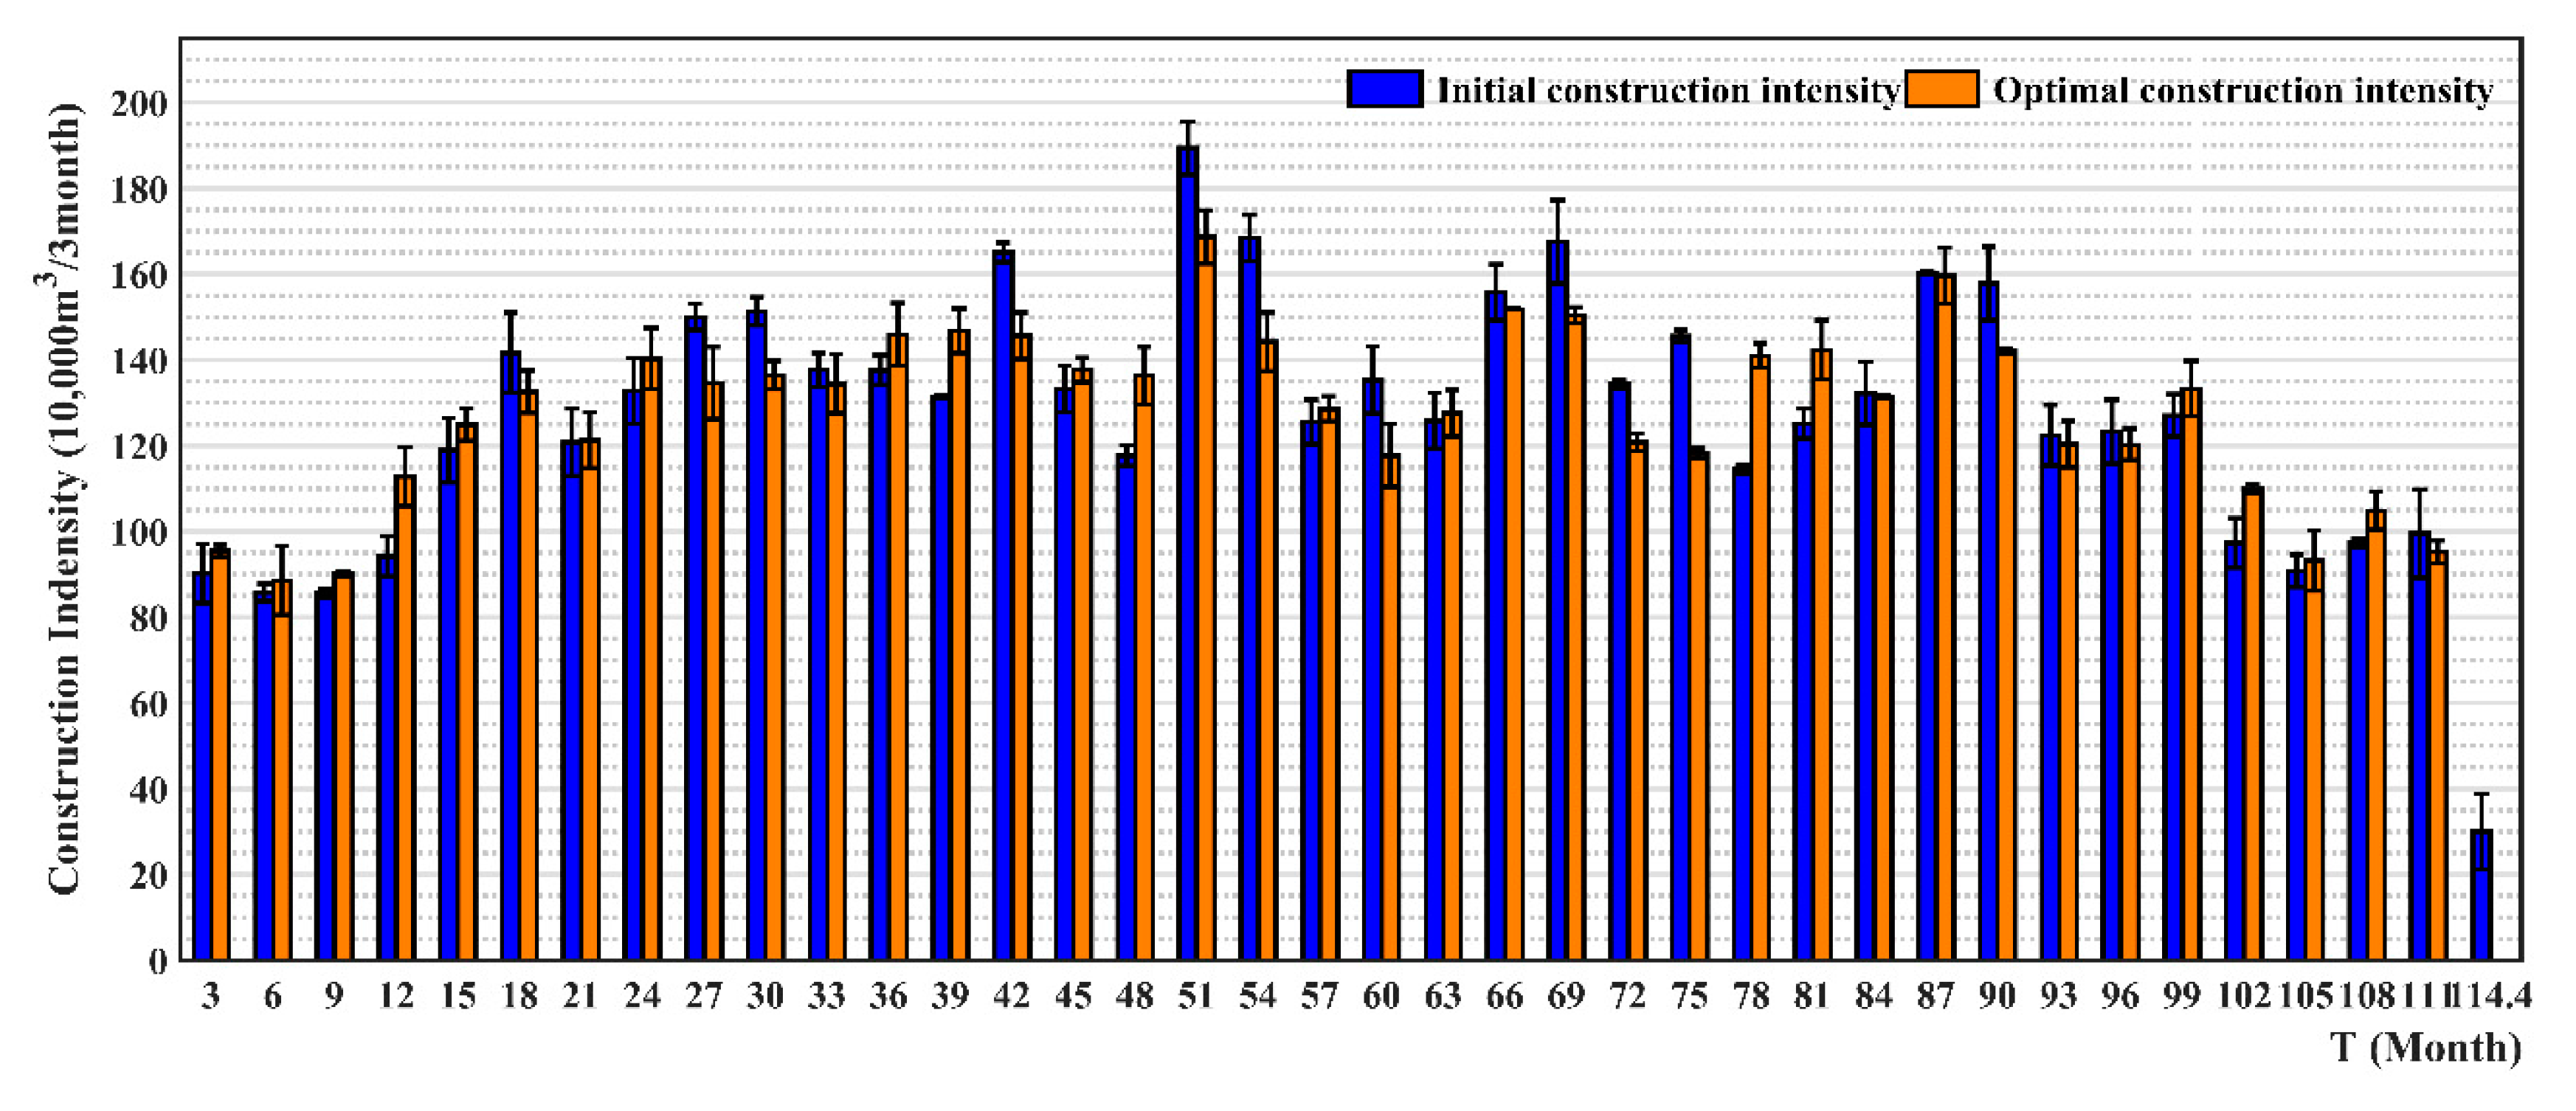
A comparison of filling intensity between the optimization scheme and the initial scheme is shown in Figure 15. The values are the means ± the standard deviations (SDs) of the quarterly filling intensity, which are calculated 50 times through construction simulation. The filling intensity disequilibrium degree of the optimization scheme is 5.60, which is 29.6% lower than the initial scheme of 7.96. The initial construction is less intensive at the initial stage of construction, and the filling intensity increases after the 12th month. In the 51st month, the filling strength is as high as 1.893 million m3/3 month. In contrast, the optimal scheme obtained through optimization is more balanced in each period, and the difference between the maximum filling strength and the minimum filling strength is 801,000 m3/3 month. The difference between the maximum intensity and the minimum intensity of the initial solution is 1.593 million m3/3 month, which is more conducive to the balanced allocation of resources, making construction more efficient. The maximum filling intensity of the optimization scheme is 1.686 million m3/3 month, which is 207,000 m3/3 month less than the maximum filling strength of the initial scheme. This effect can alleviate the problems of unstable construction quality and human-machine fatigue caused by high-strength construction.

4.3.2. Algorithm Comparison

Four optimization algorithms, including the GA, simulated annealing algorithm (SA), PSO and WOA, are employed instead of the EWOA to solve the stage and zone optimization problem to verify the effectiveness and advantage of the EWOA in the rockfill dam stage and zone optimization study. The iteration number of each algorithm is set as 300 for optimization, and a comparison of the evolution curves of the fitness value are shown in Figure 16a. Considering the randomness of the simulation model, it is necessary to verify the repeatability of the optimization algorithm. Each algorithm is repeatedly calculated 50 times. Optimal fitness value results and their SDs are shown in Figure 16c. Additionally, the time spent calculating the fitness values and their SDs are shown in Figure 16b.
  • Figure 16a shows the convergence results of the EWOA, GA, SA, PSO and WOA. Notably, all the convergence curves in this picture are optimal curves. We can see that the SA (5.84) and WOA (5.85) fell into a local optimum, while the EWOA (5.60), GA (5.62), and PSO (5.62) found the global optimum with consistency. In terms of the convergence rate, the EWOA exhibited the fastest convergence rate when finding the global optimum, and thus, we can conclude that the EWOA outperformed all of the other four algorithms.
  • Figure 16b shows the calculation time of the EWOA, GA, SA, PSO and WOA. The EWOA has a maximum run time of 120.32 s and a minimum run time of 108.7 s, which is the shortest average time. Compared with the SDs of WOA (8.08), GA (83.79), SA (167.92) and PSO (10.15), the EWOA (6.95) demonstrated the smallest calculation time standard deviation. The above results indicate that the EWOA has the highest optimization efficiency and the most stable run time.
  • Figure 16c shows the optimal fitness value results of the EWOA, GA, SA, PSO and WOA. Due to the randomness of the construction simulation, the results of the optimization fluctuated within a certain range. The median of the EWOA optimization results is 5.76; this result is better than those provided by the WOA (6.14), GA (6.02), SA (6.34) and PSO (5.90). The EWOA’s standard deviation is clearly lower than that of the other four algorithms. Most optimization results of the EWOA are concentrated between 5.6 and 5.73, except for a poorer value of 5.862; this algorithm is more stable and robust than the other algorithms.

5. Validation

The case in Reference [3] was taken as an example to verify the model proposed. The optimal result was compared with actual process data collected from the real-time monitoring system. The analysis of schedule, machinery utilization rate, and construction disequilibrium degree is discussed as follows.
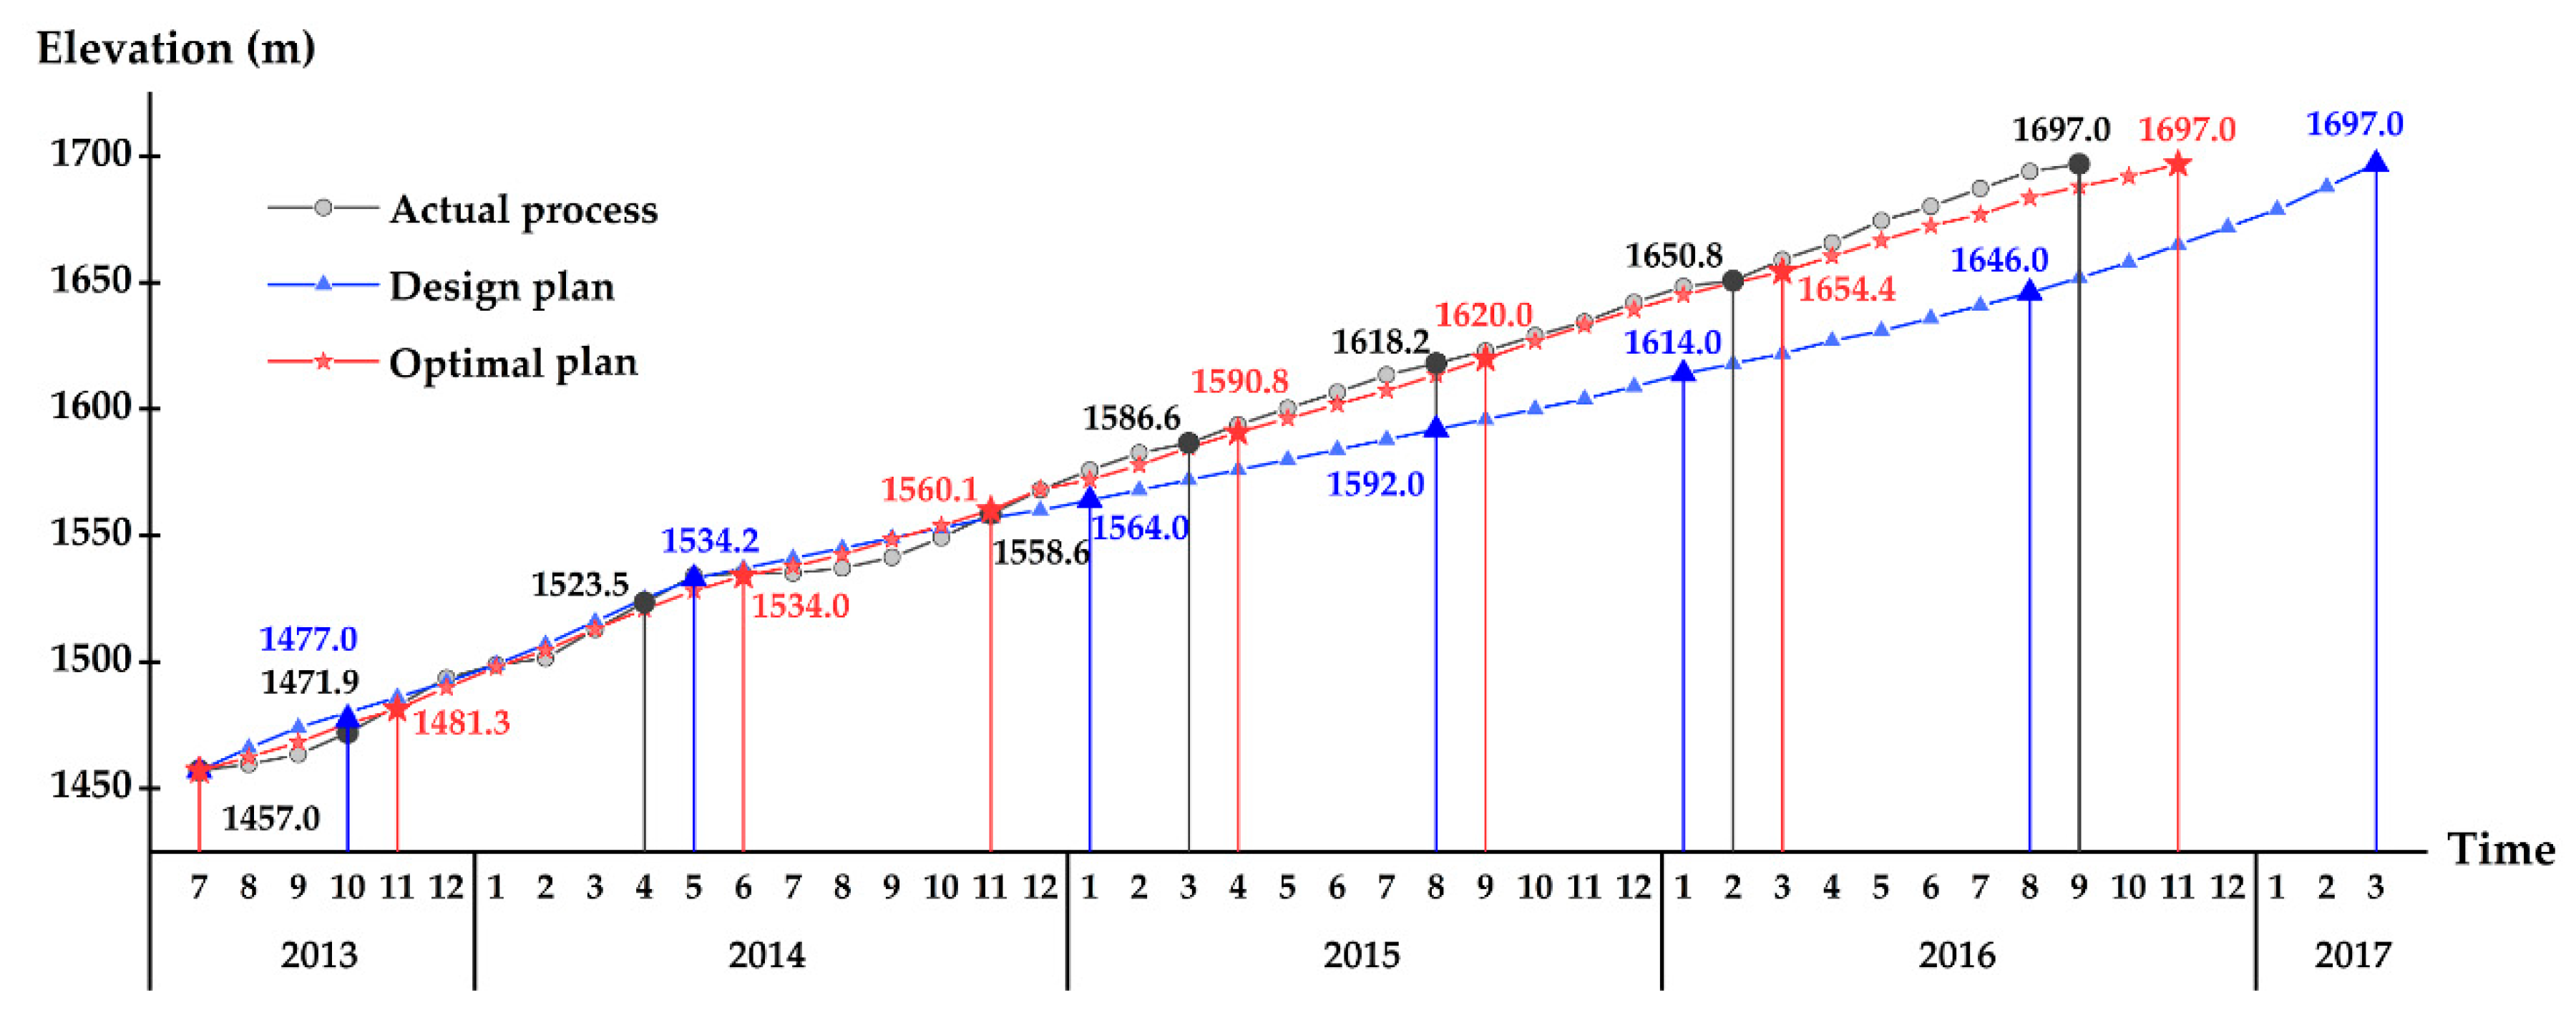
In terms of schedule, the dam body construction was completed in September 2016. As shown in Figure 17. The filling elevation of the optimization plan was basically consistent with the actual construction. However, monthly filling elevation was unbalanced in the actual construction process due to the problem of construction organization, especially in the early stage of construction. Total construction period of the optimization plan was 41 months, 4 months shorter than the design plan and 2 months longer than the actual process.
With respect to the machinery utilization rate, the utilization rate of the core wall is taken as a comparison. Because the construction quality control of the core wall, whose role is to prevent seepage, is the most strict, the construction of core is the critical path in dam body construction. Moreover, trucks and rollers are busier than dozers, so our main concern is TUR and RUR. As shown in Table 5, the TUR and RUR of the optimal plan are not much different from the actual situation and are more balanced among stages.
Regarding the disequilibrium degree, the filling disequilibrium degrees of actual construction, the initial plan and the optimal plan can be obtained with Equation (2), with values of 2.9, 1.8, and 1.21 respectively.
The reasonability of the propose construction stage and zone optimization model based on the data-driven D-AHP and EWOA was able to be validated through comparison between the above three indicators. Consequently, the model proposed could provide guidance for the design and construction of a rockfill dam.
6. Conclusions

To ensure efficient and successful construction, the construction of a rockfill dam must be divided into several stages and zones due to its long construction period and large engineering scale. This study proposes a construction stage and zone optimization model based on the data-driven D-AHP and EWOA, which can optimize the construction stages and zones while determining a preferable flow shop construction scheme for each filling layer. The major contributions of this study are summarized as follows:
  • An automatic flow shop construction scheme MCDM method is presented based on a data-driven D-AHP and an improved CSHRD; this method ensures both the efficiency of collecting and aggregating information and the effectiveness of combining subjective and objective weights to evaluate decision alternatives. Based on the optimal flow shop construction scheme, an accurate filling intensity disequilibrium degree, which requires optimization during the construction stage and zone optimization, is generated.
  • An EWOA is proposed by using the Levy flight trajectory to overcome the trend of the local optimum in the WOA. Compared to the construction stage and zone optimization model with the GA, SA, PSO and WOA, the efficiency and robustness of the EWOA are greater.
  • A construction stage and zone optimization model based on the data-driven D-AHP and EWOA is proposed using the proposed automatic flow shop construction scheme MCDM method. The model has been successfully applied to the construction stage and zone scheme optimization of a hydropower project in China. Comparative results show that this model can shorten the CT, improve machinery utilization and reduce the filling intensity disequilibrium degree.
In future research, if the proposed model is embedded into a decision support system for engineering scheme optimization, then it can be conveniently used by designers and project managers, and its advantage of automation will be apparent.

Author Contributions

D.Z. and J.Z. conceived and designed the study; J.Z. proposed the algorithm, implemented the experiment and wrote the paper; M.Z., J.Y. and F.L. played important roles in revising the paper.

Funding

This research was funded by the Yalong River Joint Funds of the National Natural Science Foundation of China, grant number U1765205; the National Natural Science Foundation of China, grant number 51439005 and the Groups of the National Natural Science Foundation of China, grant number 51621092.

Conflicts of Interest

The authors declare no conflict of interest.

Appendix A

Pseudo code of EWOA
Initialize the whale population Xi (i=1,2,…,n)
Calculate the fitness of each search agent
X* = the best search agent
While (t < max number of iterations)
for each search agent
 Update a, A, C, I and P
  If1 (p < 0.5)
   If2 (|A| < 1)
   Update the position of the current search agent by the Equations (19) and (20)
   else if2 (|A| ≥ 1)
   Select a random search agent(Xrand)
   Update the position of the current search agent by the Equations (25) and (26)
   Update the position of the current search agent using the levy flight Equation (27)
   end if2
  else if1(p ≥ 0.5)
  Update the position of the current search by Equations (23) and (24)
  end if1
end for
 Check if any search agent goes beyond the search space, and amend it
 Calculate the fitness of each search agent
 Update X* if there is a better solution
 t = t + 1
end while
return X*

Appendix B

The benchmark functions.
FunctionDimensionRangefmin
F 1 ( x ) = i = 1 n x i 2 −30[−100, 100]0
F 2 ( x ) = i = 1 n | x i | + i = 1 n | x i | 30[−10, 10]0
F 3 ( x ) = i = 1 n ( j = 1 i x j ) 2 30[−100, 100]0
F 4 ( x ) = max i { | x i | , 1 i n } 30[−100, 100]0
F 5 ( x ) = i = 1 n 1 [ 100 ( x i + 1 x i 2 ) 2 + ( x i 1 ) 2 ] 30[−30, 30]0
F 6 ( x ) = i = 1 n ( [ x i + 0.5 ] ) 2 30[−100, 100]0
F 7 ( x ) = i = 1 n i · x i 4 + random [ 0 , 1 ] 30[−1.28, 1.28]0
F 8 ( x ) = i = 1 n x i sin ( | x i | ) 30[−500, 500]−12569
F 9 ( x ) = i = 1 n [ x i 2 10 cos ( 2 π x i ) + 10 ] 30[−5.12, 5.12]0
F 10 ( x ) = 20 exp ( 0.2 1 n i = 1 n x i 2 ) exp ( 1 n i = 1 n cos ( 2 π x i ) ) + 20 + e 30[−32, 32]0
F 11 ( x ) = 1 4000 i = 1 n x i 2 i = 1 n cos ( x i i ) + 1 30[−600, 600]0
F 12 ( x ) = π n { 10 sin ( π y 1 ) + i = 1 n ( y 1 1 ) 2 [ 1 + sin 2 ( π y i + 1 ) ] + ( y n 1 ) 2 } + i = 1 n u ( x i , 10 , 100 , 4 ) y i = 1 + x i + 1 4 ,   u ( x i , a , k , m ) = { k ( x i a ) m x i > a 0 a < x i < a k ( x i a ) x i < a 30[−50, 50]0
F 13 ( x ) = 1 10 { sin 2 ( 3 π x i ) + i = 1 n ( x i 1 ) 2 + [ 1 + sin 2 ( 3 π x i + 1 ) ] + ( x n 1 ) 2 [ 1 + sin 2 ( 2 π x n ) ] } + i = 1 n u ( x i , 5 , 100 , 4 ) 30[−50, 50]0
F 14 ( x ) = ( 1 500 + j = 1 25 1 j + i = 1 2 ( x i a i j ) 6 ) 1 2[−65, 65]1
F 15 ( x ) = i = 1 11 [ a i x 1 ( b i 2 + b i x 2 ) b i 2 + b i x 3 + x 4 ] 2 4[−5, 5]0.0003
F 16 ( x ) = 4 x 1 2 + 2.1 x 1 4 + 1 3 x 1 6 + x 1 · x 2 4 x 2 2 + 4 x 2 4 2[−5, 5]−1.0316
F 17 ( x ) = ( x 2 5.1 4 π 2 x 1 2 + 5 π x 1 6 ) 2 + 10 ( 1 1 8 π ) cos ( x 1 ) + 10 2[−5, 5]0.398
F 18 ( x ) = [ 1 + ( x 1 + x 2 + 1 ) 2 ( 19 14 x 1 + 3 x 1 2 14 x 2 + 6 x 1 x 2 + 3 x 2 2 ) ] × [ 30 + ( 2 x 1 3 x 2 ) 2 ( 18 32 x 1 + 12 x 1 2 + 48 x 2 36 x 1 x 2 + 27 x 2 2 ) ] 2[−2, 2]3
F 19 ( x ) = i = 1 4 c i exp ( j = 1 3 a i j ( x j p i j ) 2 ) 3[0, 1]−3.86
F 20 ( x ) = i = 1 4 c i exp ( j = 1 6 a i j ( x j p i j ) 2 ) 6[0, 1]−3.32
F 21 ( x ) = i = 1 5 [ ( x a i ) ( x a i ) T + c i ] 1 4[0, 10]−10.1532
F 22 ( x ) = i = 1 7 [ ( x a i ) ( x a i ) T + c i ] 1 4[0, 10]−10.4028
F 23 ( x ) = i = 1 10 [ ( x a i ) ( x a i ) T + c i ] 1 4[0, 10]−10.5363

References

  1. Zhong, D.; Cui, B.; Liu, D.; Tong, D. Theoretical research on construction quality real-time monitoring and system integration of core rockfill dam. Sci. China Ser. E 2009, 52, 3406. [Google Scholar] [CrossRef]
  2. Charles, J.A. The engineering behaviour of fill materials: The use, misuse and disuse of case histories. Géotechnique 2008, 58, 541–570. [Google Scholar] [CrossRef]
  3. Zhong, D.; Zhang, P.; Wu, K. Theory and practice of construction simulation for high rockfill dam. Sci. China Ser. E-Technol. Sci. 2007, 50, 51–61. [Google Scholar] [CrossRef]
  4. Construction Handbook for Water Resources and Hydroelectric Project; China Power Press: Beijing, China, 2002.
  5. Wang, R.; Liu, J.; Li, S. Optimization model for substage-zoning filling design of high core rockfill dams. China Civ. Eng. J. 2008, 41, 105–110. [Google Scholar]
  6. Wang, L.; Zeng, J.; Xu, L. A decision support system for substage-zoning filling design of rock-fill dams based on particle swarm optimization. Inf. Technol. Manag. 2011, 12, 111–119. [Google Scholar] [CrossRef]
  7. Zeng, J.; Wang, L.; Wang, T.; Fan, W.; Gao, H. Particle swarm optimization-based machine arrangement for filling construction of rock-fill dams. In Proceedings of the IEEE International Conference on Industrial Engineering and Engineering Management, Hong Kong, China, 8–11 December 2009; pp. 1772–1775. [Google Scholar]
  8. Pan, F.F.; Wang, R.C.; Zhang, Z.L.; Li, S.Q. Research on staged filling section optimization of high concrete-faced rock-fill dams. J. Hydroelectr. Eng. 2014, 33, 227–234. [Google Scholar]
  9. Du, R.; Zhong, D.; Yu, J.; Tong, D.; Wu, B. Construction Simulation for a Core Rockfill Dam Based on Optimal Construction Stages and Zones: Case Study. J. Comput. Civ. Eng. 2015, 30, 05015002. [Google Scholar] [CrossRef]
  10. Zhang, J.; Zhong, D.; Wu, B.; Lv, F.; Cui, B. Earth Dam Construction Simulation Considering Stochastic Rainfall Impact. Comput.-Aided Civ. Infrastruct. Eng. 2017, 33, 459–480. [Google Scholar] [CrossRef]
  11. Zavadskas, E.; Turskis, Z.; Kildienė, S. State of art surveys of overviews on MCDM/MADM methods. Technol. Econ. Dev. Econ. 2014, 20, 165–179. [Google Scholar] [CrossRef]
  12. Saaty, T. The Modern Science of Multicriteria Decision Making and Its Practical Applications: The AHP/ANP Approach. Oper. Res. 2013, 61, 1101–1118. [Google Scholar] [CrossRef]
  13. Ksiąźek, M.; Nowak, P.; Kivrak, S.; Rosłon, J.; Ustinovichius, L. Computer-aided decision-making in construction project development. J. Civ. Eng. Manag. 2015, 21, 248–259. [Google Scholar] [CrossRef]
  14. Liu, K.S.; Hsueh, S.L.; Wu, W.C.; Chen, Y.L. A DFuzzy-DAHP decision-making model for evaluating energy-saving design strategies for residential buildings. Energies 2012, 5, 4462–4480. [Google Scholar] [CrossRef]
  15. Shapira, A.; Goldenberg, M. AHP-Based Equipment Selection Model for Construction Projects. J. Constr. Eng. Manag. 2005, 131, 1263–1273. [Google Scholar] [CrossRef]
  16. Lashgari, A.; Yazdani–Chamzini, A.; Fouladgar, M.; Zavadskas, E. Equipment Selection Using Fuzzy Multi Criteria Decision Making Model: Key Study of Gole Gohar Iron Mine. Inz. Ekon. 2012, 23, 125–136. [Google Scholar] [CrossRef]
  17. Zhong, D.; Hu, W.; Wu, B.; Li, Z.; Zhang, J. Dynamic time-cost-quality tradeoff of rockfill dam construction based on real-time monitoring. J. Zhejiang Univ. Sci. A 2017, 18, 1–19. [Google Scholar] [CrossRef]
  18. Prascevic, N.; Prascevic, Z. Application of fuzzy AHP for ranking and selection of alternatives in construction project management. J. Civ. Eng. Manag. 2017, 23, 1123–1135. [Google Scholar] [CrossRef]
  19. Deng, X.; Hu, Y.; Deng, Y.; Mahadevan, S. Supplier selection using AHP methodology extended by D numbers. Expert Syst. Appl. 2014, 41, 156–167. [Google Scholar] [CrossRef]
  20. Deng, X.; Lu, X.; Chan, F.; Sadiq, R.; Mahadevan, S.; Deng, Y. D-CFPR: D numbers extended consistent fuzzy preference relations. Knowl. Based Syst. 2015, 73, 61–68. [Google Scholar] [CrossRef] [Green Version]
  21. Deng, Y. D numbers: Theory and applications. J. Inf. Comput. Sci. 2012, 9, 2421–2428. [Google Scholar]
  22. Dempster, A.P. Upper and Lower Probabilities Induced by a Multivalued Mapping. In Classic Works of the Dempster-Shafer Theory of Belief Functions; Yager, R.R., Liu, L., Eds.; Springer: Berlin, Germany, 2008; Volume 219, pp. 57–72. [Google Scholar]
  23. Shafer, G. A Mathematical Theory of Evidence; Princeton University Press: Princeton, NJ, USA, 1976; pp. 4–33. [Google Scholar]
  24. Zong, F.; Wang, L. Evaluation of university scientific research ability based on the output of sci-tech papers: A D-AHP approach. PLoS ONE 2017, 12, e0171437. [Google Scholar] [CrossRef]
  25. Fan, G.; Zhong, D.; Yan, F.; Yue, P. A hybrid fuzzy evaluation method for curtain grouting efficiency assessment based on an AHP method extended by D numbers. Expert Syst. Appl. 2016, 44, 289–303. [Google Scholar] [CrossRef]
  26. Chatterjee, K.; Zavadskas, E.; Tamošaitienė, J.; Adhikary, K.; Kar, S. A Hybrid MCDM Technique for Risk Management in Construction Projects. Symmetry 2018, 10, 46. [Google Scholar] [CrossRef]
  27. Yang, X.S.; Deb, S. Cuckoo Search via Lévy Flights. In Proceedings of the 2009 World Congress on Nature and Biologically Inspired Computing, Coimbatore, India, 9–12 December 2009; pp. 210–214. [Google Scholar]
  28. Nithya, S.; Akhtar, K.; Aladin, Z. Triple Bottom Line Analysis and Optimum Sizing of Renewable Energy Using Improved Hybrid Optimization Employing the Genetic Algorithm: A Case Study from India. Energies 2019, 12, 349. [Google Scholar]
  29. Kirkpatrick, S.; Gelatt, C.D.; Vecchi, M.P. Optimization by simulated annealing. Science 1983, 220, 671–680. [Google Scholar] [CrossRef] [PubMed]
  30. Dorigo, M.; Birattari, M. Ant Colony Optimization. In Encyclopedia of Machine Learning; Sammut, C., Webb, G.I., Eds.; Springer: Boston, MA, USA, 2011; pp. 36–39. [Google Scholar]
  31. Passino, K.M. Biomimicry of bacterial foraging for distributed optimization and control. IEEE Contr. Syst. Mag. 2002, 22, 52–67. [Google Scholar]
  32. Damodaran, S.K.; Sunil Kumar, T.K. Hydro-Thermal-Wind Generation Scheduling Considering Economic and Environmental Factors Using Heuristic Algorithms. Energies 2018, 11, 353. [Google Scholar] [CrossRef]
  33. Jumani, T.A.; Mustafa, M.W.; Rasid, M.M.; Mirjat, N.H.; Leghari, Z.H.; Saeed, M.S. Optimal Voltage and Frequency Control of an Islanded Microgrid using Grasshopper Optimization Algorithm. Energies 2018, 11, 3191. [Google Scholar] [CrossRef]
  34. Mirjalili, S.; Gandomi, A.H.; Mirjalili, S.Z.; Saremi, S.; Faris, H.; Mirjalili, S.M. Salp Swarm Algorithm: A bio-inspired optimizer for engineering design problems. Adv. Eng. Softw. 2017, 114, 163–191. [Google Scholar] [CrossRef]
  35. Kennedy, J.; Eberhart, R. Particle swarm optimization. In Proceedings of the 1995 IEEE International Conference on Neural Networks, Perth, WA, Australia, 27 November–1 December 1995; pp. 1942–1948. [Google Scholar]
  36. Mirjalili, S. The ant lion optimizer. Adv. Eng. Softw. 2015, 83, 80–98. [Google Scholar] [CrossRef]
  37. Mirjalili, S.; Mirjalili, S.M.; Lewis, A. Grey wolf optimizer. Adv. Eng. Softw. 2014, 69, 46–61. [Google Scholar] [CrossRef]
  38. Joshi, H.; Arora, S. Enhanced grey wolf optimization algorithm for global optimization. Fund. Inform. 2017, 153, 235–264. [Google Scholar] [CrossRef]
  39. Mirjalili, S.; Lewis, A. The whale optimization algorithm. Adv. Eng. Softw. 2016, 95, 51–67. [Google Scholar] [CrossRef]
  40. Guo, W.; Chen, M.; Wang, L.; Mao, Y.; Wu, Q. A survey of biogeography-based optimization. Neural Comput. Appl. 2017, 28, 1909–1926. [Google Scholar] [CrossRef]
  41. Venkrbec, V.; Galić, M.; Klanšek, U. Construction process optimisation–review of methods, tools and applications. Građevinar 2018, 70, 593–606. [Google Scholar]
  42. Obradovic, D. A review of nature-inspired optimization algorithms. Electron. J. Fac. Civ. Eng. Osijek-e-GFOS 2018, 9, 15. [Google Scholar]
  43. RazaviAlavi, S.; AbouRizk, S. Site layout and construction plan optimization using an integrated genetic algorithm simulation framework. J. Comput. Civil. Eng. 2017, 31, 04017011. [Google Scholar] [CrossRef]
  44. Fairbairn, E.M.; Silvoso, M.M.; Toledo Filho, R.D.; Alves, J.L.; Ebecken, N.F. Optimization of mass concrete construction using genetic algorithms. Comput. Struct. 2004, 82, 281–299. [Google Scholar] [CrossRef]
  45. Hegazy, T.; Kassab, M. Resource optimization using combined simulation and genetic algorithms. J. Const. Eng. M. 2003, 129, 698–705. [Google Scholar] [CrossRef]
  46. Wei, G.; Yingren, Z. Ant colony algorithm and its application into optimization of construction order for underground house groups. Chin. J. Rock. Mech. Rock. Eng. 2002, 4, 2. [Google Scholar]
  47. Zhang, H.; Xing, F. Fuzzy-multi-objective particle swarm optimization for time–cost–quality tradeoff in construction. Automat. Constr. 2010, 19, 1067–1075. [Google Scholar] [CrossRef]
  48. Wang, J.; Zhong, D.; Adeli, H.; Wang, D.; Liu, M. Smart bacteria-foraging algorithm-based customized kernel support vector regression and enhanced probabilistic neural network for compaction quality assessment and control of earth-rock dam. Expert Syst. 2018, 35, e12357. [Google Scholar] [CrossRef]
  49. Hosen, M.A.; Khosravi, A.; Nahavandi, S.; Creighton, D. Improving the quality of prediction intervals through optimal aggregation. IEEE Trans. Ind. Electron. 2015, 62, 4420–4429. [Google Scholar] [CrossRef]
  50. Tolba, M.; Rezk, H.; Diab, A.; Al-Dhaifallah, M.A. Novel Robust Methodology Based Salp Swarm Algorithm for Allocation and Capacity of Renewable Distributed Generators on Distribution Grids. Energies 2018, 11, 2556. [Google Scholar] [CrossRef]
  51. Saadat, J.; Moallem, P.; Koofigar, H. Training Echo State Neural Network Using Harmony Search Algorithm. Inter. J. Artif. Intell. 2017, 15, 163–179. [Google Scholar]
  52. Roman, R.C.; Precup, R.E.; David, R.C. Second order intelligent proportional-integral fuzzy control of twin rotor aerodynamic systems. Procedia Comput. Sci. 2018, 139, 372–380. [Google Scholar] [CrossRef]
  53. Vrkalovic, S.; Lunca, E.C.; Borlea, I.D. Model-free sliding mode and fuzzy controllers for reverse osmosis desalination plants. Int. J. Artif. Intell. 2018, 16, 208–222. [Google Scholar]
  54. Precup, R.E.; David, R.C.; Szedlak-Stinean, A.I.; Petriu, E.M.; Dragan, F. An easily understandable grey wolf optimizer and its application to fuzzy controller tuning. Algorithms 2017, 10, 68. [Google Scholar] [CrossRef]
  55. Jayakumar, N.; Subramanian, S.; Ganesan, S.; Elanchezhian, E.B. Grey wolf optimization for combined heat and power dispatch with cogeneration systems. Int. J. Elec. Power. 2016, 74, 252–264. [Google Scholar] [CrossRef]
  56. Zhao, H.; Guo, S.; Zhao, H. Energy-Related CO2 Emissions Forecasting Using an Improved LSSVM Model Optimized by Whale Optimization Algorithm. Energies 2017, 10, 874. [Google Scholar] [CrossRef]
  57. El-Amary, N.H.; Balbaa, A.; Swief, R.A.; Abdel-Salam, T.S. A Reconfigured Whale Optimization Technique (RWOT) for Renewable Electrical Energy Optimal Scheduling Impact on Sustainable Development Applied to Damietta Seaport, Egypt. Energies 2018, 11, 535. [Google Scholar] [CrossRef]
  58. Ling, Y.; Zhou, Y.; Luo, Q. Lévy Flight Trajectory-Based Whale Optimization Algorithm for Global Optimization. IEEE Access 2017, 5, 6168–6186. [Google Scholar] [CrossRef]
  59. Ding, T.; Chang, L.; Li, C.; Feng, C.; Zhang, N. A Mixed-Strategy-Based Whale Optimization Algorithm for Parameter Identification of Hydraulic Turbine Governing Systems with a Delayed Water Hammer Effect. Energies 2018, 11, 2367. [Google Scholar] [CrossRef]
  60. Oliva, D.; Abd El Aziz, M.; Ella Hassanien, A. Parameter estimation of photovoltaic cells using an improved chaotic whale optimization algorithm. Appl. Energy 2017, 200, 141–154. [Google Scholar] [CrossRef]
  61. Jensi, R.; Jiji, G.W. An enhanced particle swarm optimization with levy flight for global optimization. Appl. Soft Comput. 2016, 43, 248–261. [Google Scholar] [CrossRef]
  62. Li, Z.; Zhou, Y.; Zhang, S.; Song, J. Lévy-Flight Moth-Flame Algorithm for Function Optimization and Engineering Design Problems. Math. Probl. Eng. 2016, 2016, 1–22. [Google Scholar] [CrossRef]
  63. Salgotra, R.; Singh, U.; Saha, S. New cuckoo search algorithms with enhanced exploration and exploitation properties. Expert Syst. Appl. 2018, 95, 384–420. [Google Scholar] [CrossRef]
  64. Digalakis, J.G.; Margaritis, K.G. On benchmarking functions for genetic algorithms. Int. J. Comput. Math. 2001, 77, 481–506. [Google Scholar] [CrossRef]
  65. Test Functions for Optimization Needs. Available online: http://new.zsd.iiar.pwr.wroc.pl/files/docs/functions.pdf (accessed on 25 January 2019).
Figure 1. Work breakdown structure (WBS) of high core rockfill dam construction.
Energies 12 00466 g001
Figure 2. Research framework.
Energies 12 00466 g002
Figure 3. Sketch of construction stage and zone optimization.
Energies 12 00466 g003
Figure 4. Principle of the improved construction simulation of high rockfill dam (CSHRD).
Energies 12 00466 g004
Figure 5. Pearson correlation matrix.
Energies 12 00466 g005
Figure 6. Comparison of convergence curves of enhanced whale optimization algorithm (EWOA) and literature algorithms obtained in some of the benchmark problems. (a) Curves of the fitness values for F1; (b) Curves of the fitness values for F2; (c) Curves of the fitness values for F3; (d) Curves of the fitness values for F4; (e) Curves of the fitness values for F5; (f) Curves of the fitness values for F6; (g) Curves of the fitness values for F7; (h) Curves of the fitness values for F8; (i) Curves of the fitness values for F9; (j) Curves of the fitness values for F10; (k) Curves of the fitness values for F11; (l) Curves of the fitness values for F12; (m) Curves of the fitness values for F13; (n) Curves of the fitness values for F14; (o) Curves of the fitness values for F15; (p) Curves of the fitness values for F16; (q) Curves of the fitness values for F17; (r) Curves of the fitness values for F18; (s) Curves of the fitness values for F19; (t) Curves of the fitness values for F20; (u) Curves of the fitness values for F21; (v) Curves of the fitness values for F22; (w) Curves of the fitness values for F23.
Energies 12 00466 g006
Figure 7. Flow chart of construction stage and zone optimization with enhanced whale optimization algorithm (EWOA).
Energies 12 00466 g007
Figure 8. A hierarchical structure for flow shop construction multi-criteria decision making (MCDM).
Energies 12 00466 g008
Figure 9. The priority weight of each criterion with a change of λ.
Energies 12 00466 g009
Figure 10. Results of the flow shop construction scheme MCDM. (a) Optimal flow shop at Elevation 2587–2617; (b) Optimal flow shop at Elevation 2617–2707; (c) Optimal flow shop at Elevation 2707–2767; (d) Optimal flow shop at Elevation 2767–2794; (e) Optimal flow shop at Elevation 2794–2869; (f) Optimal flow shop at Elevation 2869–2902.
Energies 12 00466 g010
Figure 11. Elevation of each period of the optimal and initial plan.
Energies 12 00466 g011
Figure 12. Prescribed monthly effective days for construction.
Energies 12 00466 g012
Figure 13. Comparison of the optimal construction stages and initial stages.
Energies 12 00466 g013
Figure 14. Average machinery utilization rate comparison between the optimal and initial plans. (a) Comparison of TUR; (b) Comparison of RUR; (c) Comparison of DUR.
Energies 12 00466 g014
Figure 15. Monthly filling intensity comparison of the optimal and initial plans.
Energies 12 00466 g015
Figure 16. Optimization algorithm result comparison. (a) Curves of optimal fitness value; (b) Box diagram of calculation time; (c) Box diagram of optimal fitness.
Energies 12 00466 g016
Figure 17. Comparison of filling elevation.
Energies 12 00466 g017
Table 1. The meaning of symbols proposed in this paper.
SymbolMeaning
i, k, j, q, x, y, sIndex of stage, zone, evaluation indicator, feasible construction scheme, material field, road and constrained variable
I, K, J, Q, X, Y, Stotal number of stages, zones, evaluation indicators, feasible construction schemes, material fields, roads and constraints
H k i ,   H k i m i n ,   H k i m a x elevation of zone k in stage i and the minimum and maximum elevation of zone k in stage i
Pσfilling intensity disequilibrium degree
pimonmonthly filling intensity in stage i, 10,000 m3/month
minumber of months in stage i
μiaverage monthly filling intensity in stage i, 10,000 m3/month
Cjevaluation indicator j
Aqfeasible construction scheme q
nvq, npqnumber of flow shops vertical or parallel to the dam axis in one filling layer in Aq
Nqmachinery allocation in Aq
Nrq, Ndq, Ntqnumber of rollers, dozers and transportation trucks in Aq
Nrc, Ndc, Ntc,number of available rollers, dozers and transportation trucks
Pi(x), P( H k i ), Proadi(y)feeding intensity of material field x in stage i, filling intensity of elevation h in zone k and transport intensity of road y in stage i
Psi(x), Ps( H k i ), Psroadi(y)specified maximum intensity of feeding, filling and transport
δheight of the thicker filling layer
L, Blength of a zone parallel or vertical to the dam axis
Lmax, Lminmaximum and minimum economic length of compacting operations
Bmin, Cminminimum economic width of compacting operations and minimum width for transportation truck operations
Tp, Thconstruction time when placement or haulage subsystem domains
tp, ts, td, tr, teperiod of preparation, spreading, paving, compacting and checking
k1, b1, k2, b2, k3, b3k1, b1, k2, b2, k3, b3 are the coefficients of the linear equation when calculating tp, ts, te
Pd, Prwork efficiency of dozer and roller
Azarea of a zone
f(nvq + npq)function of work efficiency affected by the number of flow shops
Kt, Kpcoefficient of time used and coefficient of slope influence
vd, vrspeed of dozer and roller.
Cdbucket capacity of the dozer
Brroller width
nrcompactor pass
pa random probability value in [0, 1]
X, X*, Xrandinitial agent position selected randomly, each agent position vector and position vector of the best solution obtained so far
aa variable in [0, 2]
rrandom vector in [0, 1]
blogarithmic spiral shape constant
lrandom number in [−1, 1]
A, Ca variable in [−2, 2], a random number in [0, 2]
dwalkstep
levy(λ)random searching path calculated as Mantegna’s algorithm
μ, vnormal stochastic distributions
βconstant in Mantegna’s algorithm
σ μ 2 ,   σ v 2 variance of μ and v
Γ(x)Gamma function
fδfitness function
θpenalty factor
Mnumber of constraints
qtss th normalized strictly constrained variable at time t
Q t m i n s ,   Q t m a x s permitted minimum and maximum qts of dam
Note: for any variable x, x means that x is a vector or that x is calculated with vectors.
Table 2. Flow shop construction schemes in the core wall at Elevation 2740 m to Elevation 2759 m.
SchemeDivision of Flow ShopsTruck (20 t)DozerRoller
Scheme 1Flow shop vertical to the dam axis (nv = 3)3634
Scheme 2Flow shop vertical to the dam axis (nv = 4)3424
Scheme 3Flow shop vertical to the dam axis (nv = 5)3323
Scheme 4Flow shop parallel to the dam axis (np = 1)3022
Scheme 5Flow shop parallel to the dam axis (np = 2)3622
Table 3. Simulation results of schemes in the core wall at Elevation 2740 m to Elevation 2759 m.
SchemeCT (d)UR (%)FI(10,000 m3/Month)
CTTURDURRURMFI
Scheme 115066.424.0052.9811.27
Scheme 216950.894.2138.9311.30
Scheme 318660.404.1249.9712.20
Scheme 423545.833.9850.0212.68
Scheme 521657.534.0648.6810.56
Table 4. Stages elevation limits.
Elevation Constraints (m)
Minimum265826972760281028402902
Maximum266027072770282628502902
Table 5. Comparison of machinery utilization rate in core.
URStage1Stage2Stage3Stage4Stage5Stage6Stage7
Optimal plan TUR91.51%85.77%90.83%76.14%90.86%87.75%74.58%
Actual TUR90.5%84.8%93.86%76.14%95.83%85.77%95.51%
Optimal plan RUR65.79%66.38%61.73%62.06%57.49%58.36%80.2%
Actual RUR77.99%74.92%57.49%62.06%61.73%66.38%65.79%