Article

Impact Analysis of Survivability-Oriented Demand Response on Islanded Operation of Networked Microgrids with High Penetration of Renewables

Department of Electrical Engineering, Incheon National University, 12-1 Songdo-dong, Yeonsu-gu, Incheon 406840, Korea
*
Authors to whom correspondence should be addressed.
Energies 2019, 12(3), 452; https://doi.org/10.3390/en12030452
Submission received: 20 December 2018 / Revised: 28 January 2019 / Accepted: 31 January 2019 / Published: 31 January 2019
(This article belongs to the Special Issue Electricity Demand Side Management)

Abstract

:
Microgrids have the potential to withstand the power outages due to their ability of islanding and potential to sustain the penetration of renewables. Increased penetration of renewables can be beneficial but it may result in curtailment of renewables during peak generation intervals due to the limited availability of storage capacity while shedding loads during peak load intervals. This problem can be solved by adjusting the load profiles, i.e., demand response (DR) programs. In contrast to the existing studies, where DR is triggered by market price signals, a local resource-triggered survivability-oriented demand response program is proposed in this paper. The proposed DR program is triggered by renewable and load level of the microgrid with an objective to minimize the load shedding and curtailment of renewables. The uncertainties in load and renewables are realized via a robust optimization method and the worst-case scenario is considered. The performance of the proposed method is compared with two conventional operation cases, i.e., independent operation case and interconnected operation case without DR. In addition, the impact of renewable penetration level, amount of shiftable load, and load absorption capacity on the performance of the proposed method are also analyzed. Simulation results have proved the proposed method is capable of reducing load shedding, renewable curtailment, and operation cost of the network during emergencies.

1. Introduction

Microgrids (MGs) are considered as a practical solution to cope with power outages due to their ability of islanding and potential to sustain the penetration of renewables [1]. Islanded operation of microgrids is considered as one of the complementary benefits of the MGs. MGs can be isolated from the main grid during system contingencies and local resources can be utilized to feed the local loads. It can enhance the survivability of the local loads, especially the critical loads. During outages, especially natural disasters, the fuel supply to dispatchable generators in MGs may also be interrupted [2]. Therefore, enhanced penetration of renewables is required to enhance the survivability of local loads, especially the critical loads. Energy storage systems are also required to deploy along with renewables to cater the intermittent nature of the renewables. However, due to higher capital investment costs, limited storage capacity can be deployed.
In order to address the problems mentioned in the previous paragraph, the interconnection of several neighboring microgrids is proposed in the literature [3,4,5]. During outages, microgrids having an excess of power can share their excess power with other microgrids of the network having power deficit [3]. This can reduce the load shedding amount in the microgrids having lesser resources or lower renewable power generation. The interconnection of microgrids is more beneficial if microgrids with different load profiles or different renewable output power profiles are interconnected [4]. Due to the vicinity of interconnected microgrids, the weather conditions are similar in all the microgrids, thus resulting in a similar renewable output power pattern. In addition, generally, similar renewable resources (wind, photovoltaic, biomass, etc.) are integrated into all the microgrids due to favorable environmental conditions for that particular type of renewable.
Due to the availability of limited size of energy storage system and profile dependent performance of interconnected microgrids, shedding of loads and curtailment of renewables may be inevitable. During peak renewable generation intervals, renewables are curtailed to maintain the frequency of the system while shedding loads during peak load intervals. Even some of the critical loads may also be shed if renewables are not available or limited amount of renewables is available. Curtailment of renewables results in a reduction of benefit to the owners of the renewables. Similarly, shedding of loads results in discomfort to the residents of the microgrids. In addition, both curtailment of renewables and shedding of loads result in a monitory loss to the microgrids operators due to the imposition of penalties for both the cases. Similarly, the output power of renewables, especially solar and wind, is subjected to the environmental conditions and is difficult to control their output. Therefore, demand-side management is required to fully utilize the available renewables.
Demand response (DR) has recently attracted the attention of many researchers due to its lower implementation cost in comparison to the deployment of additional energy storage elements or building a new power plant [6]. DR programs are broadly categorized as price-based DR programs and incentive-based DR programs [7]. Price based DR programs are beneficial for grid-connected mode operation of microgrids, where market prices are varied over time to shift loads from peak intervals to off-peak intervals [8,9]. Similarly, incentive-based DR programs are also applied to microgrids, where the consumers are incentivized to reduce their load profiles during DR triggered intervals [10,11]. Customers may also be incentivized to inject more power into the network during DR triggered intervals via their local generations [12]. Both types of DR programs are widely applied to grid-connected microgrids to reduce the operation cost of the microgrids [8,9,10,11,12].
DR programs are recently applied to islanded microgrids also, where either voltage regulation [13,14] and/or frequency regulation are/is considered [15,16]. In addition, resilience-oriented DR programs are also available in the literature [17,18,19,20]. In reference [17], an event-driven emergency DR program is proposed for preventing voltage collapse in power systems. A table of various DR actions against different possible events is developed and demand reduction (load curtailment) is considered as a measure to prevent voltage collapse. However, microgrids could also have non-critical and time insensitive loads, which can be shifted across different intervals of the day, which is not considered in this study. A DR provider is considered in [18] for generating a list of possible predicted electricity prices and a competitive model (game process) is utilized for determining the electricity prices in each microgrid. However, during emergencies, cooperative models could be more beneficial to assist the on-emergency microgrids. Market price-triggered DR programs are proposed in [19,20], where self and cross elasticities of loads in response to change in price signals are realized. Higher prices are considered for event period and lower prices for normal periods, thus loads are shifted from event period to non-event periods. This requires the information of event occurrence and/or event clearance times, which is difficult to obtain, especially for major outage events (resiliency-oriented events). Therefore, instead of price-triggered DR programs, local resource-triggered DR programs could be more beneficial for cooperative microgrid networks.
DR programs can be triggered by analyzing the amount of locally available power and load demand for shifting loads. This shifting can potentially enhance the utilization of renewables on one hand and it can reduce the load shedding amount of microgrids on the other hand. In addition, networking of microgrids can be considered to better utilize the resources of the network, especially by connecting microgrids with different load patterns. Reduction in renewable curtailment and load shedding amount is beneficial for microgrid operators, renewable owners, and power consumers. It can potentially enhance the service reliability of consumers, reduce penalty cost for curtailing renewables and loads for microgrid operators, and enhance the benefit of renewable owners by enhancing utilization of renewables.
In order to address the problems mentioned in the previous paragraphs and to achieve the mentioned benefits, a local resource-triggered survivability-oriented DR program is proposed in this study. The major contributions of the proposed local resource-triggered survivability-oriented DR program in comparison to the existing literature are as follows:
  • In contrast to the existing literature, where DR is triggered by market price signals, DR is triggered by renewable power and load amount in this study. To the best of the author’s knowledge, this is the first study on local-resource triggered DR programs. The major advantages of the local-resource triggered DR program are as follows:
    The proposed model doesn’t require any prior information of event occurrence and clearance times. Instead, the proposed model can be activated after detecting the event and can be deactivated after event clearance.
    The proposed model maintains the linear tractability of the model and can be implemented using commercial optimization software tools like CPLEX, which guarantee the global optimality of the solution.
    Each microgrid can adjust its local demand profile, thus eliminating the need for additional external DR Manager. Surplus or deficit in individual microgrids can be adjusted by sharing power among other microgrids of the network.
  • The uncertainties in load and renewable output power are realized via a robust optimization method and the worst-case scenario is considered. In addition, three different scenarios (independent operation, interconnected operation without DR, and the proposed method) are realized and their performance is evaluated.
  • Sensitivity analysis of renewable penetration level, amount of shiftable loads, and load absorption level in each microgrid is carried out to evaluate the performance of the proposed method under different conditions.

2. Microgrid Network and Survivability-Oriented Demand Response

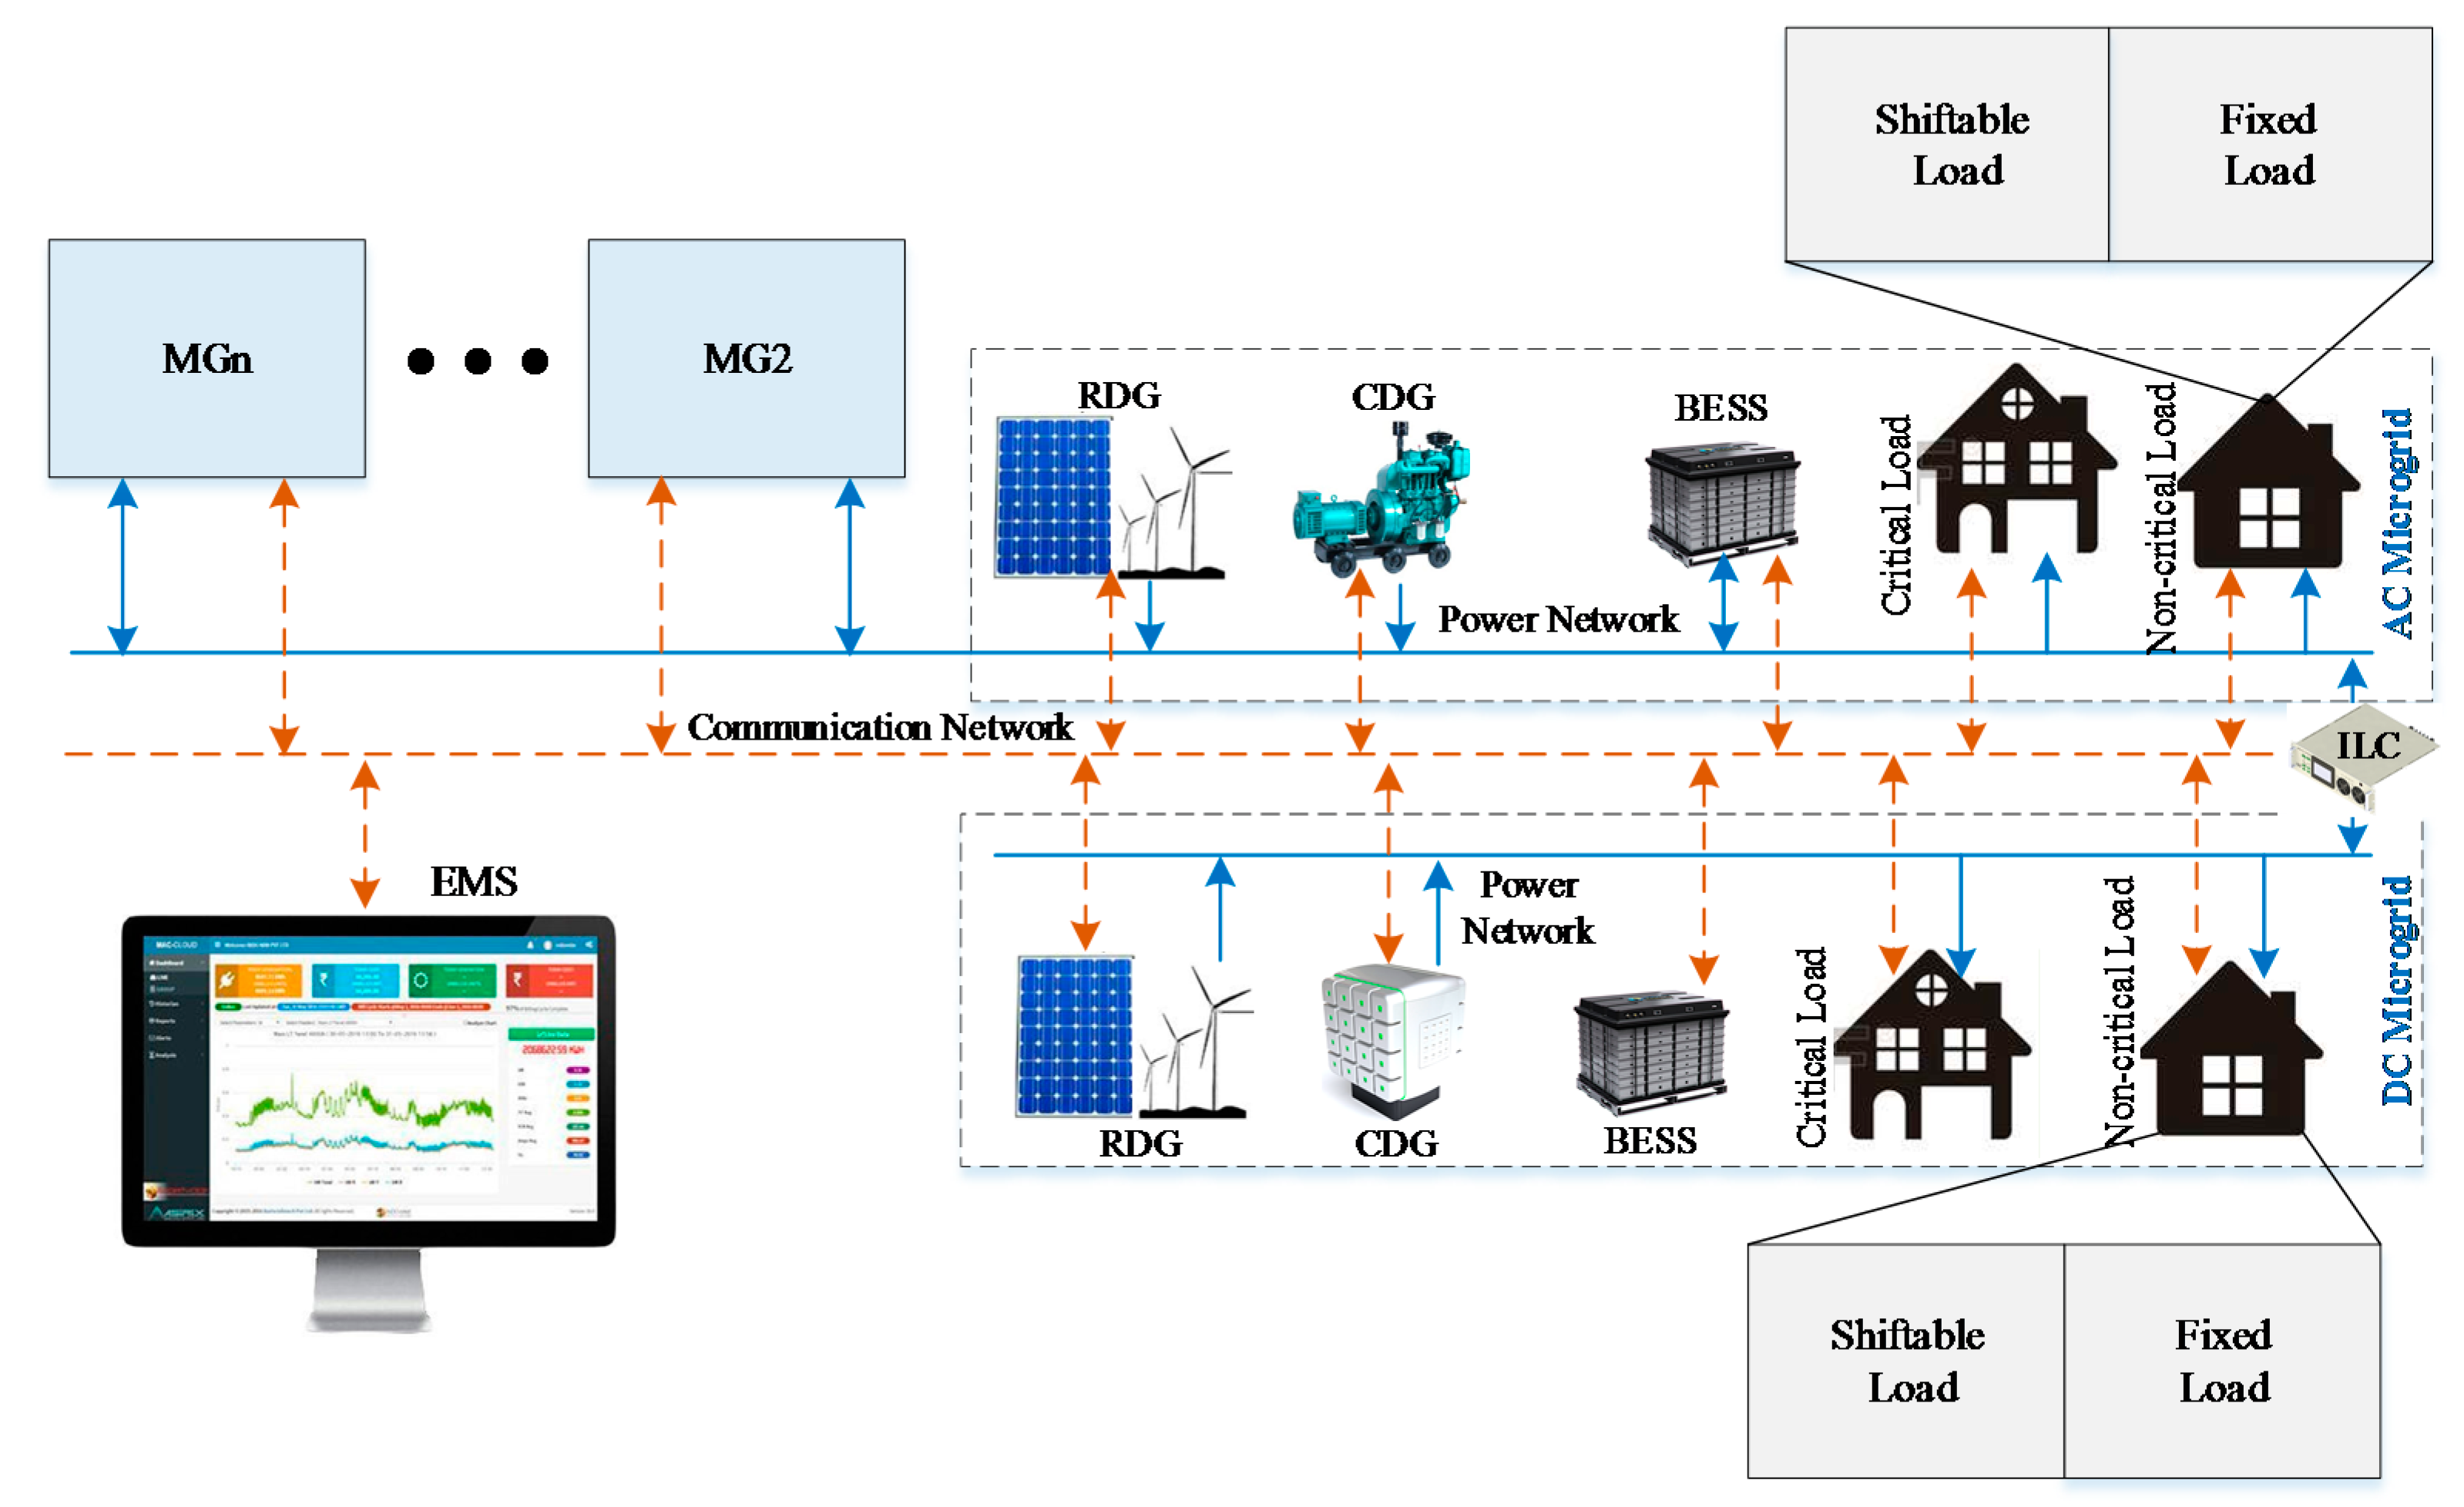
2.1. Network Configuration

The configuration of the islanded microgrid network considered in this study is shown in Figure 1. Due to the merits of AC/DC hybrid microgrids, as highlighted in [21,22,23], a network of AC/DC hybrid microgrid is considered in this study. Both AC and DC microgrids contain controllable distributed generators (CDGs), renewable distributed generators (RDGs), battery energy storage system (BESS), and loads. Diesel generators are CDGs for the AC side microgrids and fuel cell are CDGs for the DC side microgrids. RDGs are either wind turbines, photovoltaic (PV) arrays, or a combination of both. Loads in both AC and DC microgrids are decomposed into critical and non-critical loads. Non-critical loads are further decomposed into fixed and shiftable loads. Where the fixed loads cannot be shifted from one interval to another but can be curtailed if generation is lesser than the load. However, the shiftable loads can be shifted from one interval to another interval in order to enhance their survivability. Critical loads are not shiftable and their priority is higher than the non-critical loads. Therefore, these loads will be shed as the last resort to assure the stable operation of the system. The AC and DC microgrids are connected via an interlinking converter (ILC). All the microgrids of the network are interconnected through their respective AC microgrids. DC microgrids can exchange power with other microgrids of the network via their ILCs.
Energy management systems (EMSs) are utilized to carry out the operation of single/networked microgrids. Various EMS architectures are available in the literature, each having their own merits and demerits. Among various types of EMS architectures, cooperative networked microgrid communities have gained popularity due to their merits, as mentioned in [24,25]. Especially, for islanded microgrids due to their ability to better utilize system level resources and ability to assist the on-emergency microgrids of the network. Therefore, a cooperative microgrid community is considered in this study also for the proposed islanded microgrid network. Data from all the microgrids of the network are gathered by the EMS and optimal schedules are decided for each component of the microgrid. The EMS is also responsible for shifting the load patterns of individual microgrids based on the availability of shiftable loads in each microgrid. Due to the networking of microgrids, they can also exchange power with other microgrids of the network. The optimal power transfer among microgrids of the network is controlled by the EMS. All the components follow the commands received from the EMS.

2.2. Demand Response for Survivability Enhancement

A survivability-oriented DR program is proposed in this paper, which can enhance the utilization of renewables, thus reducing the load shedding amount. In contrast to the existing literature, where price signals are utilized to trigger DR programs, renewable generation amount and load level are utilized to trigger the proposed DR program, i.e., survivability-oriented DR program. The proposed DR program can reduce the curtailment of renewables by shifting loads from lesser renewable generation intervals. Similarly, it will reduce the load shedding amount by shifting load from peak load intervals. This reduced renewable curtailment and reduced load shedding will benefit the microgrid operators, renewable owners, and power consumers. The detailed process of the proposed survivability-oriented DR program is shown in Figure 2.
The proposed DR program can be logically decomposed into a set of actions, which can be utilized to understand the principal of the survivability-oriented DR. The sequence of actions taken to incorporate the proposed survivability-oriented DR program in the EMS is composed of three major steps. The details of all the three steps are presented in the following paragraphs.
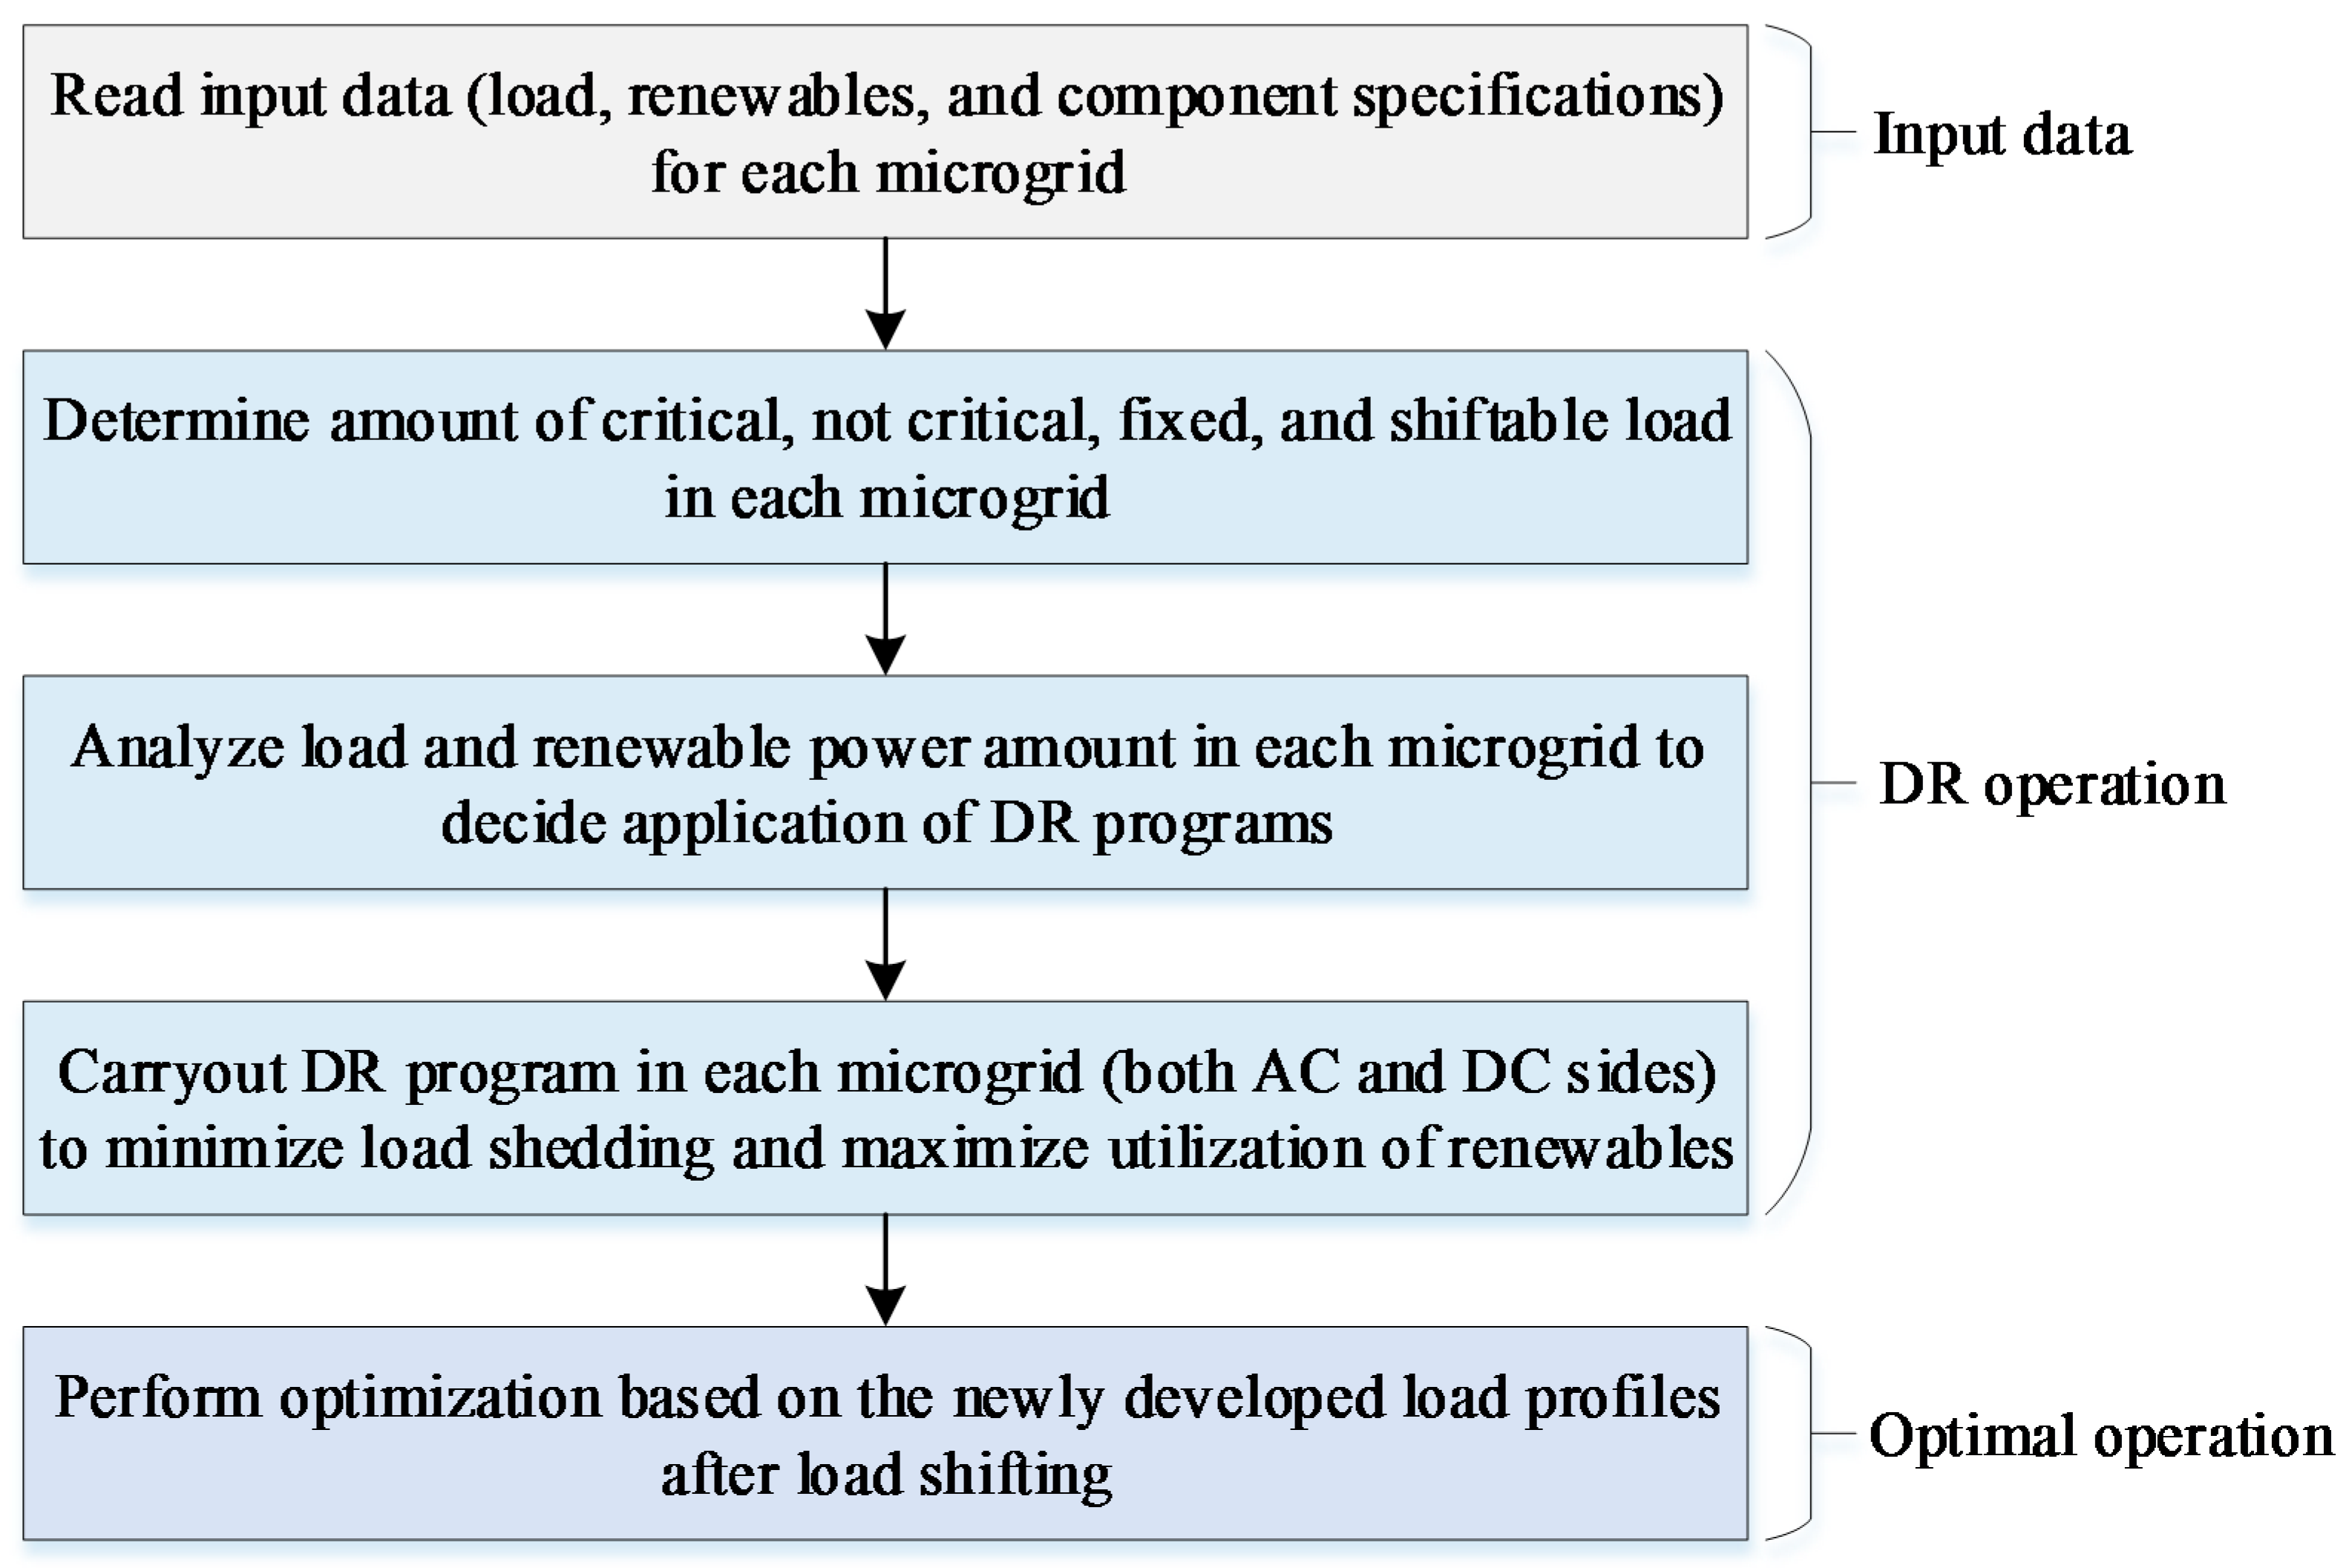
  • Input Data: The first step is to read the input data of each microgrid. Input data is comprised of loads (AC, DC, and decomposition of each), renewables output power, component parameters, and penalty costs for load shedding and renewable curtailment. This information is transferred to the next step, where DR operation is carried out.
  • DR Operation: The DR operation phase is further decomposed into three steps. In the first step, the ratio of critical and non-critical loads along with fixed and shiftable load ratios are analyzed. Then, the amount of renewable power is analyzed against the amount of load present in each microgrid, which was determined in the previous step. The load shifting is decided to maximize the utilization of renewables and minimize the load shedding amount. This will result in reshaping of the original load profiles. The reshaped load profiles of each microgrid are transferred to the next step, where the optimal operation of the microgrid network is carried out.
  • Optimal Operation: In this step, the new load profiles from the previous step are utilized and the available resources are scheduled to minimize the load shedding amount. Load shedding of the whole network for the entire scheduling horizon is carried out in this step. In the islanded mode, service reliability is a major concern. Therefore, the relationship between penalties of load shedding and generation cost of CDGs, defined in the first step, plays an important role to assure the precedence of service reliability over operation cost in the emergency period.

3. Problem Formulation

Initially, a deterministic model is developed, which is then transformed to a robust counterpart to cater the uncertainties in loads and renewables. Due to the advantages of the robust optimization over other uncertainty handling techniques, as noted in [26,27,28], robust optimization is utilized in this study.

3.1. Deterministic Model

3.1.1. Objective Function

Throughout the mathematical model, X is used as a microgrid identifier, which can be replaced with A for AC side microgrids and with D for DC side microgrids. The first term of the objective function contains the generation cost, start-up cost, and shutdown cost of CDGs of all the microgrids. The second term contains the penalty cost for shedding critical loads, non-critical loads, and curtailment of renewables, respectively. The third term contains the penalty cost for shifting load from interval t to t′. The penalty identifier for load shifting v m X   ( t , t ) is set to a minute value if load shifting is allowed and set to a very large value otherwise. This minute value indicates the inconvenience caused to the microgrid power consumers even if the load shifting is allowed. Equation (3) defines the relationship between the penalty cost of critical loads, non-critical loads, and generation cost of CDGs. This relationship ensures the precedence of service reliability over the operation cost of the network during islanded operation.
min t = 1 T m = 1 M g = 1 G ( P U C m , g X D G ( p m , g X D G ( t ) ) + S U C m , g X D G ( t ) + S D C m , g X D G ( t ) ) + t = 1 T m = 1 M ( C C P · p m X C S ( t ) + C N P · p m X N S ( t ) + C R P · p m X R S ( t ) ) + t = 1 T t = 1 T m = 1 M v m X   ( t , t ) · p m X S h i f t ( t , t )
v m X   ( t , t ) = { ε         if   shifting   is   allowed                                               otherwise ;   m , t , t
C C P > C N P > max [ P U C m , g X D G ] ;   m , g

3.1.2. Load Balancing Constraints

In each microgrid, the adjusted load amount on the AC side needs to be balanced with the generation amount of CDG units, RDGs, BESS charging/discharging, power transferred among microgrids, power transfer among AC and DC microgrids, and shedding of loads, as given by (4). The adjusted load in at time t can be computed by using Equation (5). It contains critical load, non-critical load, the amount of load shifted from other time intervals (t′) to t, and the amount of load shifted from t to other time intervals. Similarly, the DC side power balancing is given by (6). The adjusted load in DC side microgrid can be computed using Equation (7).
p m A _ A d j L ( t ) = g = 1 G   p m , g A D G ( t ) + p m A R G ( t ) p m A B C ( t ) + p m A B D ( t ) p m S E ( t ) + p m R E ( t ) + η m I L C · p m T A C ( t ) p m T D C ( t ) + p m A C S ( t ) + p m A N S ( t ) ;   m , t
p m A _ A d j L ( t ) = p m A C L ( t ) + p m A N L ( t ) + t = 1 T p m A S H F ( t , t ) t = 1 T p m A S H F ( t , t ) ;   m , t t
p m D _ A d j L ( t ) = g = 1 G   p m , g D D G ( t ) + p m D R G ( t ) p m D B C ( t ) + p m D B D ( t ) + η m I L C · p m T D C ( t ) p m T A C ( t ) + p m D C S ( t ) + p m D N S ( t ) ;   m , t
p m D _ A d j L ( t ) = p m D C L ( t ) + p m D N L ( t ) + t = 1 T p m D S H F ( t , t ) t = 1 T p m D S H F ( t , t ) ;   m , t t

3.1.3. Constraints for Controllable Generators

The constraints of dispatchable generators are given by Equations (8)–(12). Equation (8) indicates the maximum and minimum generation bounds of gth CDG on side X. In these equations, s m , g X ( t ) ,     s u m , g X ( t )   and   s d m , g X ( t ) are respectively the commitment, start-up, and shutdown status indicators of gth CDG on X side of mth microgrid. Commitment status can be used to determine the startup and shutdown status of that particular CDG. Equation (12) indicates that simultaneous start-up and shutdown of the same generator is not allowed.
min [ P m , g X D G ] · s m , g X   ( t ) p m , g X D G ( t )   max [ P m , g X D G ] ·   s m , g X ( t ) ; s m , g X ( t ) { 0 , 1 } ;   m , g , t
s u m , g X ( t ) s d m , g X ( t ) = s m , g X   ( t ) s m , g X ( t 1 ) ;   m , g , t
S U C m , g X D G ( t ) U C m , g X D G ( t ) · ( s m , g X ( t ) s m , g X ( t 1 ) ) ;   S U C m , g X D G ( t ) 0 ;   m , g , t
S D C m , g X D G ( t ) D C m , g X D G ( t ) · ( s m , g X ( t 1 ) s m , g X ( t ) )   ;   S D C m , g X D G ( t ) 0 ;   m , g , t
s u m , g X ( t ) + s d m , g X ( t ) 1 ;   s u m , g X ( t ) , s d m , g X ( t ) { 0 , 1 } ;   m , g , t

3.1.4. Energy Trading Constraints

The power transfer between microgrids is constrained by the capacity of the line connecting the pair of microgrids, as given by Equation (13). Similarly, power transfer from AC to DC side or DC to AC side is constrained by the capacity of the interlining converter, as given by Equation (14). Finally, Equation (15) shows that the total amount of power transfer among the microgrids of the network should be balanced.
0 p ( m , n ) S E ( t ) P ( m , n ) C A P ;     0 p ( m , n ) R E ( t ) P ( m , n ) C A P ;   m , n , t ;   m n
0 p   m T A C ( t ) P I L C C A P ;   0 p   m T A C ( t ) P I L C C A P ;   m , t
m = 1 M n = 1 N p ( m , n ) R E ( t ) = n = 1 N m = 1 M p ( n , m ) R E ( t ) ;   m , n , t ;   m n

3.1.5. Battery Constraints

The state-of-charge (SOC) limits of X-side BESS in mth microgrid are given by (16). The SOC at any time interval t can be computed using the information of the amount of electricity charged/discharged at that time interval and SOC of the previous time step. The amount of power, which can be charged at any time interval t can be computed using (18). Similarly, the amount of power, which can be discharged at t can be computed using (19). Equation (20) shows the initial SOC of BESS units for the starting interval of the scheduling horizon. Finally, Equation (21) indicates that simultaneous charging and discharging of BESS is not possible.
min [ P m X B E S S ] p m X S O C ( t ) max [ P m X B E S S ] ;   m , t
p m X S O C ( t ) = p m X S O C ( t 1 ) + p m X B C ( t ) · η m X C p m X B D ( t ) η m D C R ;   m , t
0 p m X B C ( t ) ( max [ P m X B E S S ] p m X S O C ( t 1 ) η m X C ) · c m ( t ) ;   m , t
0 p m X B D ( t ) ( ( p m X S O C ( t 1 ) min [ P m X B E S S ] ) ) · η m X D · d m ( t ) ;   m , t
p m X S O C ( t 1 ) = P m X I N I T   if   t = 1 ;   m , t
c m ( t ) + d m ( t ) = 1 ; c m ( t ) ,   d m ( t ) { 0 , 1 } ;   0 η m X C , η m X D   1 ;   m , t

3.1.6. Demand Response Constraints

The net load amount shifted from other time intervals ( t ) to time interval t should be lesser than or equal to the net non-critical load, as given by Equation (22). The net non-critical load on X-side microgrid at t can be computed using Equation (23). The maximum amount of load which can be shifted from any time interval t is constrained by the amount of available shiftable load at that interval, as given by Equation (24). Finally, Equation (25) indicates that load shifting to any interval having load shedding is not allowed. This is to assure the avoidance of shedding of loads after shifting the loads. If there is no load shedding at time interval t, then load shifting is constrained by the absorption capacity of that interval, as given by Equation (25).
t = 1 T p m X S H F ( t , t ) p m X N e t L ( t ) ;   m , t t
p m X N e t L = { 0   if   p m X R G ( p m X C L + p m X N L ) p m X R G ( p m X C L + p m X N L )   e l s e }
t = 1 T p m X S H F ( t , t ) F R X m a x ( t ) = p m X _ S L ( t ) ;   m , t t
t = 1 T p m X S H F ( t , t ) = { 0   if   p m X N S ( t ) > 0 T O X m a x ( t )     e l s e } ;   m , t t

3.2. Uncertainty Modeling

3.2.1. Uncertain Variables and Uncertainty Bounds

The output power of renewables and forecasted values of the load in the load balancing equations of AC and DC microgrids are subjected to uncertainties. In robust optimization, uncertainties can be realized using deterministic bounds. The bounded variables for X-side load ( p ^ m X L O A D ( t ) ) and renewable power ( p ^ m X R G ( t ) ) are given by Equations (26) and (27), respectively. Where, p _ m X L O A D ( t ) and p ¯ m X L O A D ( t ) are lower and upper uncertainty bounds for load. Similarly, p _ m X R G ( t ) and p ¯ m X R G ( t ) are lower and upper uncertainty bounds for renewables.
p ^ m X L O A D ( t ) = p m X L O A D + p m X L O A D ( t ) Where ,     (   p m X L O A D p _ m X L O A D ( t ) ) p m X L O A D ( t ) ( p ¯ m X L O A D ( t )   p m X L O A D ( t ) ) ;   m , t
p ^ m X R G ( t ) = p m X R G ( t ) +   p m X R G ( t ) Where ,   (   p m X R G ( t ) p _ m X R G ( t ) ) p m X R G ( t ) ( p ¯ m X R G ( t )   p m X R G ( t ) ) ;   m , t

3.2.2. Worst-Case Identification and Problem Transformation

Robust optimization is a worst-case scenario-oriented optimization method. Although the conservatism of the solution can be controlled by adjusting the value of the budget of uncertainty, which will be discussed later. The worst-case in X-side microgrid ( p m X W C ( t ) ) will occur for the power balancing of the deterministic model when the loads take the upper uncertainty bounds and renewables take the lower uncertainty bounds, as given by Equation (28).
p m X W C ( t ) = max { ( p _ m X L O A D ( t ) · z _ m X L O A D ( t ) + p ¯ m X L O A D ( t ) · z ¯ m X L O A D ( t ) ) ( p _ m X R G ( t ) · z _ m X R G ( t ) + p ¯ m X R G ( t ) · z ¯ m X R G ( t ) ) } ;   m , t
Equation (28) introduces a maximization function in the load balancing equation and the overall problem is a minimization problem. It transforms the original minimization problem into a minimum-maximum problem, which is hard to solve. The inner maximization problem can be treated as a sub-problem and it can be transformed into a minimization problem. Equation (28) can be taken as the objective function of the sub-problem and following two equations as constraints. Where, Г m ( t ) is called the budget of uncertainty, which is used to control the conservatism of the solution. Higher values indicate a more conservative solution and lower probabilities of infeasible solution and vice versa.
z _ m X L O A D ( t ) + z ¯ m X L O A D ( t ) + z _ m X R G ( t ) + z ¯ m X R G ( t )   Г m X ( t ) [ 0 , k ] ;   m , t
0 z _ m X R G ( t ) , z ¯ m X R G ( t ) , z _ m X L O A D ( t ) ,   z ¯ m X L O A D ( t ) 1 ;   m , t
In order to transform the inner maximization problem into a minimization problem, its dual needs to be computed. By applying the linear duality theory, the dual of the inner sub-problem can be computed as given by Equations (31)–(34). Where, Equation (31) is the objective function of the dual problem and Equations (32)–(34) are the constraints.
min ( ζ m X ( t ) ·   Г m X ( t ) + λ m X l + ( t ) + λ m X l ( t ) + λ m X r + ( t ) + λ m X r ( t ) ) ;   m , t
ζ m X ( t ) + λ m X l ( t ) p _ m X L O A D ( t ) ;   ζ m X ( t ) + λ m X l + ( t ) p ¯ m X L O A D ( t ) ;   m , t
ζ m X ( t ) + λ m X r ( t ) p _ m X R G ( t ) ;   ζ m X ( t ) +   λ m X r + ( t ) p ¯ m X R G ( t ) ;   m , t
ζ m X ( t ) , λ m X l + ( t ) , λ m X l ( t ) , λ m X r + ( t ) ,     λ m X r ( t ) 0 ;   m , t

3.2.3. Tractable Robust Load Balancing

The objective function of the dual problem is added to the left side of the load balancing equation of both AC and DC side microgrids. The trackable robust load balancing of AC side is given by Equation (35) and that of the DC side by Equation (36). By incorporating the dual variables in the load balancing equations, the uncertainties in loads and renewables can be realized.
p m A L O A D ( t ) + ζ m A ( t ) ·   Г m A ( t ) + λ m A l + ( t ) + λ m A l ( t ) + λ m A r + ( t ) + λ m A r ( t ) = g = 1 G   p m , g A D G ( t ) + p m A R G ( t ) p m A B C ( t ) + p m A B D ( t ) p m S E ( t ) + p m R E ( t ) + η m I L C · p m T A C ( t ) p m T D C ( t ) + p m A C S ( t ) + p m A N S ( t ) ;   m , t
p m D L O A D ( t ) + ζ m D ( t ) ·   Г m D ( t ) + λ m D l + ( t ) + λ m D l ( t ) + λ m D r + ( t ) + λ m D r ( t ) = g = 1 G   p m , g D D G ( t ) + p m D R G ( t ) p m D B C ( t ) + p m D B D ( t ) + η m I L C · p m T D C ( t ) p m T A C ( t ) + p m D C S ( t ) + p m D N S ( t ) ;   m , t

3.3. Final Tractable Robust Counterpart

The final tractable robust counterpart is obtained by incorporating the trackable robust load balancing equations in the deterministic load balancing equations. The additional constraints introduced due to the transformation of the inner sub-problem are also included in the final trackable robust counterpart. The objective function is identical to that of the deterministic model. The final tractable robust counterpart of the deterministic model is summarized as follows.
min   Equation   ( 1 )
Subject to:
Equations   ( 2 ) ,   ( 3 ) ,   ( 8 ) ( 27 ) ,   ( 29 ) ,   ( 30 ) ,   ( 32 ) ( 36 )
The final tractable robust counterpart is a mixed integer linear programming problem, which can be easily implemented by using commercially available tools like CPLEX.

4. Numerical Simulations

A network of three AC/DC hybrid microgrids is considered in this study to evaluate the performance of the proposed survivability-oriented operation scheme. Generally, a network having a minimum of three microgrids is considered as a representative network for evaluating the performance of any developed algorithm for interconnected microgrids, as in [5,19,20,29]. Therefore, in this study also, a network of three hybrid microgrids is considered, where each microgrid contains two sub-microgrids, i.e., AC and DC microgrids. However, the proposed model can be applied to any finite number of microgrids. Similarly, in order to make suitable scheduling for microgrids, where several decisions like market prices and DR participation intervals are considered as 1 h, a scheduling horizon of one day with 24-time slots is considered [5,11,14,19,20]. Therefore, in this study also a scheduling horizon of 24 h with a time interval of 1 h is considered. The worst-case scenario for all the uncertain parameters is considered for the simulation cases, i.e., ( Г m X = 24 ). All the test cases are coded in NetBeans [30] in Java environment and CPLEX [31] is used as an optimization tool.

4.1. Input Data

The worst-case load and renewable profiles of the microgrids are shown in Figure 3a,b and Figure 4a,b. The load and renewable profiles along with the parameters of CDGs and BESS units are taken from [29] and scaled to simulate a high renewable penetrated system. Similarly, the parameters of CDGs and BESS units are accordingly adjusted against the increased penetration level of renewables. The uncertainty bounds for load and renewables are decided based on the history data and generally, an uncertainty of ±10% is considered for loads [1,22] and a higher bound is considered for renewables, as in [1,22]. Due to decomposition of loads as critical and non-critical loads in this study, a narrower uncertainty bound (±7) is considered for critical loads and a wider bound (±15%) is considered for non-critical loads. Similar to [22], the uncertainty bound for renewables is taken as ±25%, which is slightly wider than that of [1]. The original load and renewable profiles can be computed by using the information of respective uncertainty bounds and worst-case data, as shown in Figure 3a,b and Figure 4a,b. The parameters of CDGs of the microgrid network are shown in Table 1. Similarly, the parameters of BESS units in the microgrid network are shown in Table 2. It can be observed from Table 2 that in microgrid 1, only the DC side microgrids contains a BESS unit. Similarly, in microgrid 2, only the AC side microgrid contains a BESS unit while both AC and DC side microgrids contain BESS units in case of microgrid 3. The microgrids having renewable energy sources contain a BESS unit. Due to the presence of renewables in both AC and DC sides of microgrid 3, the generation capacities of CDGs in microgrid 3 are lower as compared to other two microgrids.

4.2. Impact of Interconnection and Demand Response on Survivability

In order to analyze the performance of the proposed survivability-oriented demand response program, three cases are simulated in this study. In the first case (Case 1), independent operation of microgrids is considered. In this case, the microgrids cannot exchange power, i.e., they can only utilize their local resources. In the second case (Case 2), microgrids are interconnected, i.e, microgrids can exchange power among other microgrids of the network. In the third case (Case 3), the proposed survivability-oriented demand response is introduced for the interconnected microgrids. A summary of all the three cases considered in this study is shown in Figure 5. The performance of the microgrid network for all the three cases is explained in the following sections.

4.2.1. Case 1: Independent Operation

The generation pattern of CDGs in all the microgrids is controlled by the load amount and available renewable power. It can be observed from Figure 6a,b that the CDGs in MG1 and MG2 are generating maximum power throughout the day, except the last few intervals. Due to the presence of higher renewable power in the last few intervals, the generation is reduced by both the microgrids. The generation pattern of MG3 is different from other two microgrids due to the presence of renewables on both AC and DC sides. During higher renewable generation intervals, CDGs are set to their minimum level and power from renewables is utilized to fulfill the load demand.
Due to the inability of the microgrids to share power in this case, load shedding of even the most critical loads is observed for MG2 during intervals 4, 5, and 8, as shown in Figure 7a. Load shedding of non-critical loads is also carried out by all the microgrids due to the scarcity of resources, as shown in Figure 7b. The power transfer between AC and DC microgrids is shown in Figure 8a, where positive power indicates that power is sent from AC to DC microgrid and vice versa. It can be observed from Figure 8a that in case of MG1, power is mostly sent from DC to AC microgrid and vice versa for MG2. This is due to the presence of renewables in only DC and AC sides, respectively. In the case of MG3, both sides exchange power depending on the excess amount of renewables in that side. Figure 8b shows that BESS units are also utilized to shift power from intervals having a higher power to intervals having higher load demand. In Figure 8b, MG3a, and MG3d indicate the BESS units on AC and DC sides, respectively.

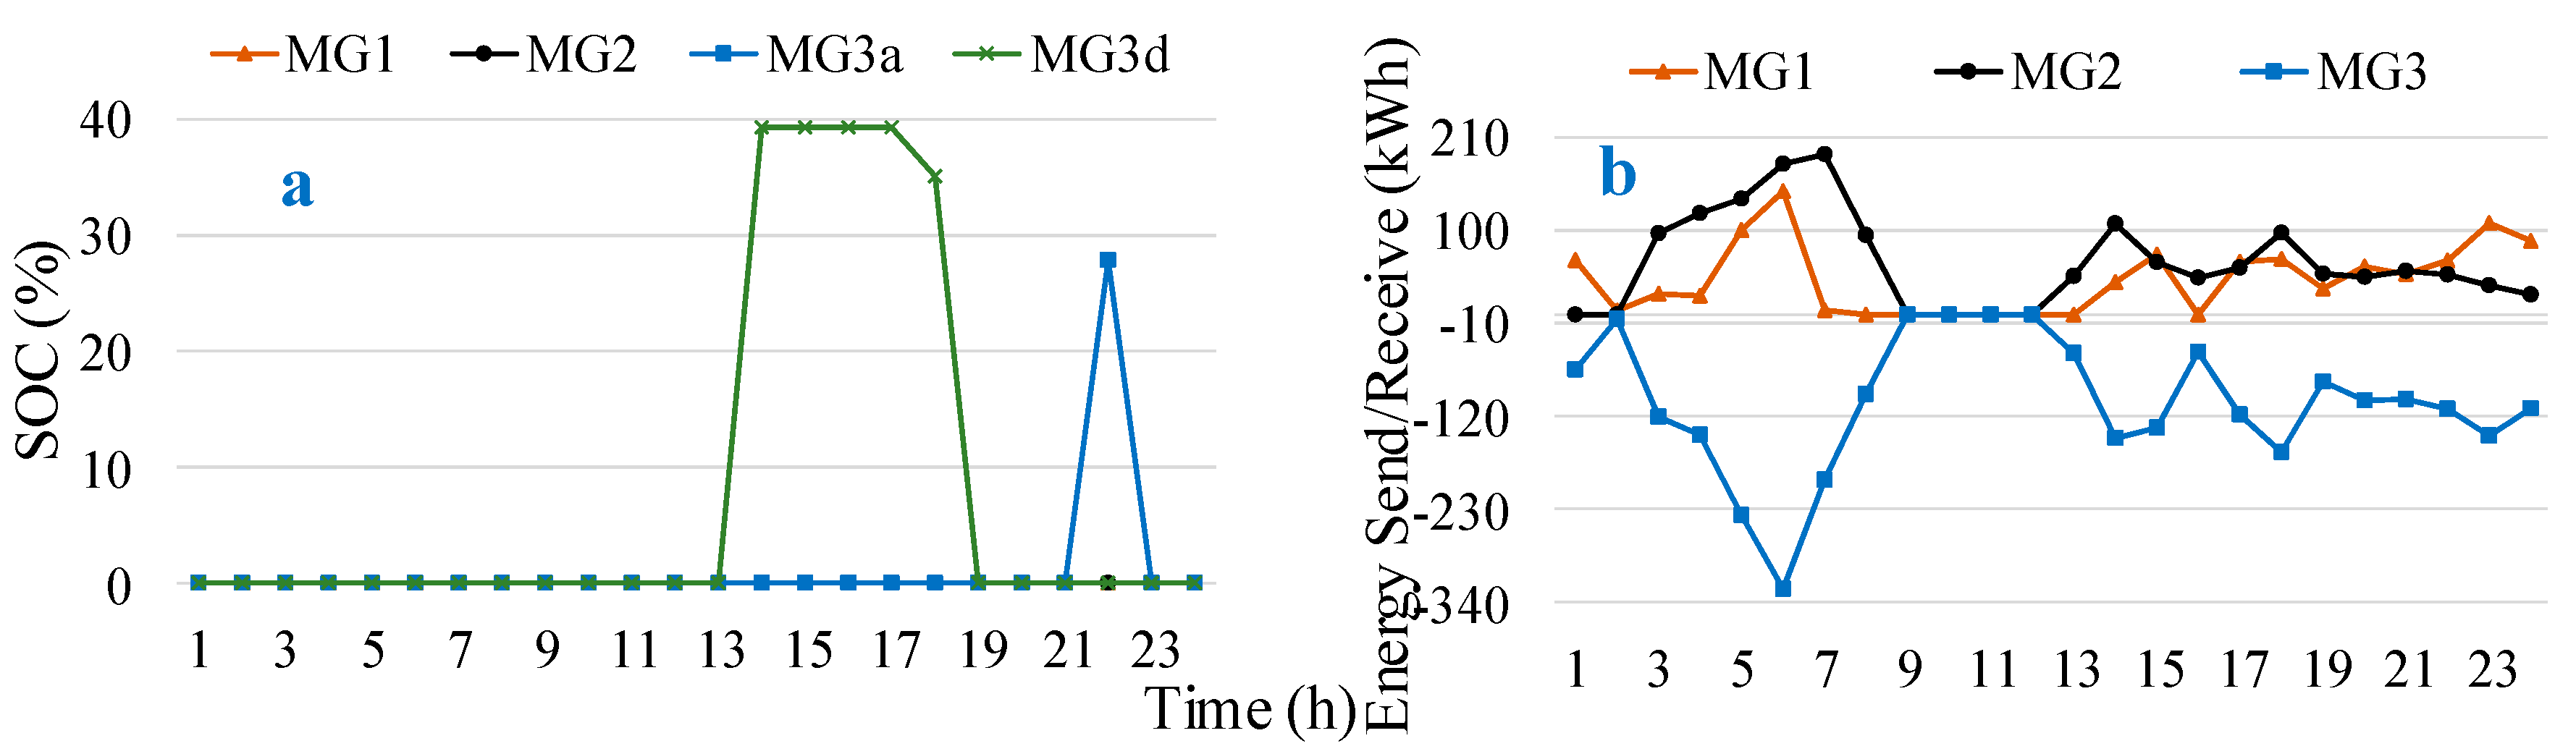
4.2.2. Case 2: Interconnected Operation

In the interconnected case, the CDGs of both AC and DC side microgrids are generating maximum power throughout the day, except the last few intervals, as shown in Figure 9a,b. In the last few intervals, the reduced generation is due to the excess of renewable power during those intervals. As compared to the independent operation case, generation of CDGs in MG3 has increased due to the ability of the MGs to share power with other microgrids of the network.
The power transfer between AC and DC sides in each microgrid follows a similar pattern to that of the previous case except MG3, as shown in Figure 10a. In the case of MG3, power is transferred to other microgrids having more power shortage. Due to the absence of load shedding of critical loads, in this case, it is not shown in the results. The load shedding of non-critical loads is shown in Figure 10b. It can be observed from Figure 10b that load shedding of non-critical loads is carried out by MG3 during intervals 4, 5, and 8 and power is transferred to MG2 to survive the critical loads of MG2. This behavior is opposite to that of case 1, where MG2 has shed its critical loads during those intervals.
Due to the ability of microgrids to share power, BESS units are less frequently used to avoid charging/discharging losses. Only the BESS units of MG3 are utilized due to excess of renewable energy in MG3, as shown in Figure 11a. The power sent/received by microgrids is shown in Figure 11b, where positive sign indicates power is being received by that microgrid and vice versa. Due to the presence of higher renewable power, MG3 is sending power to other MGs, as shown in Figure 11b.

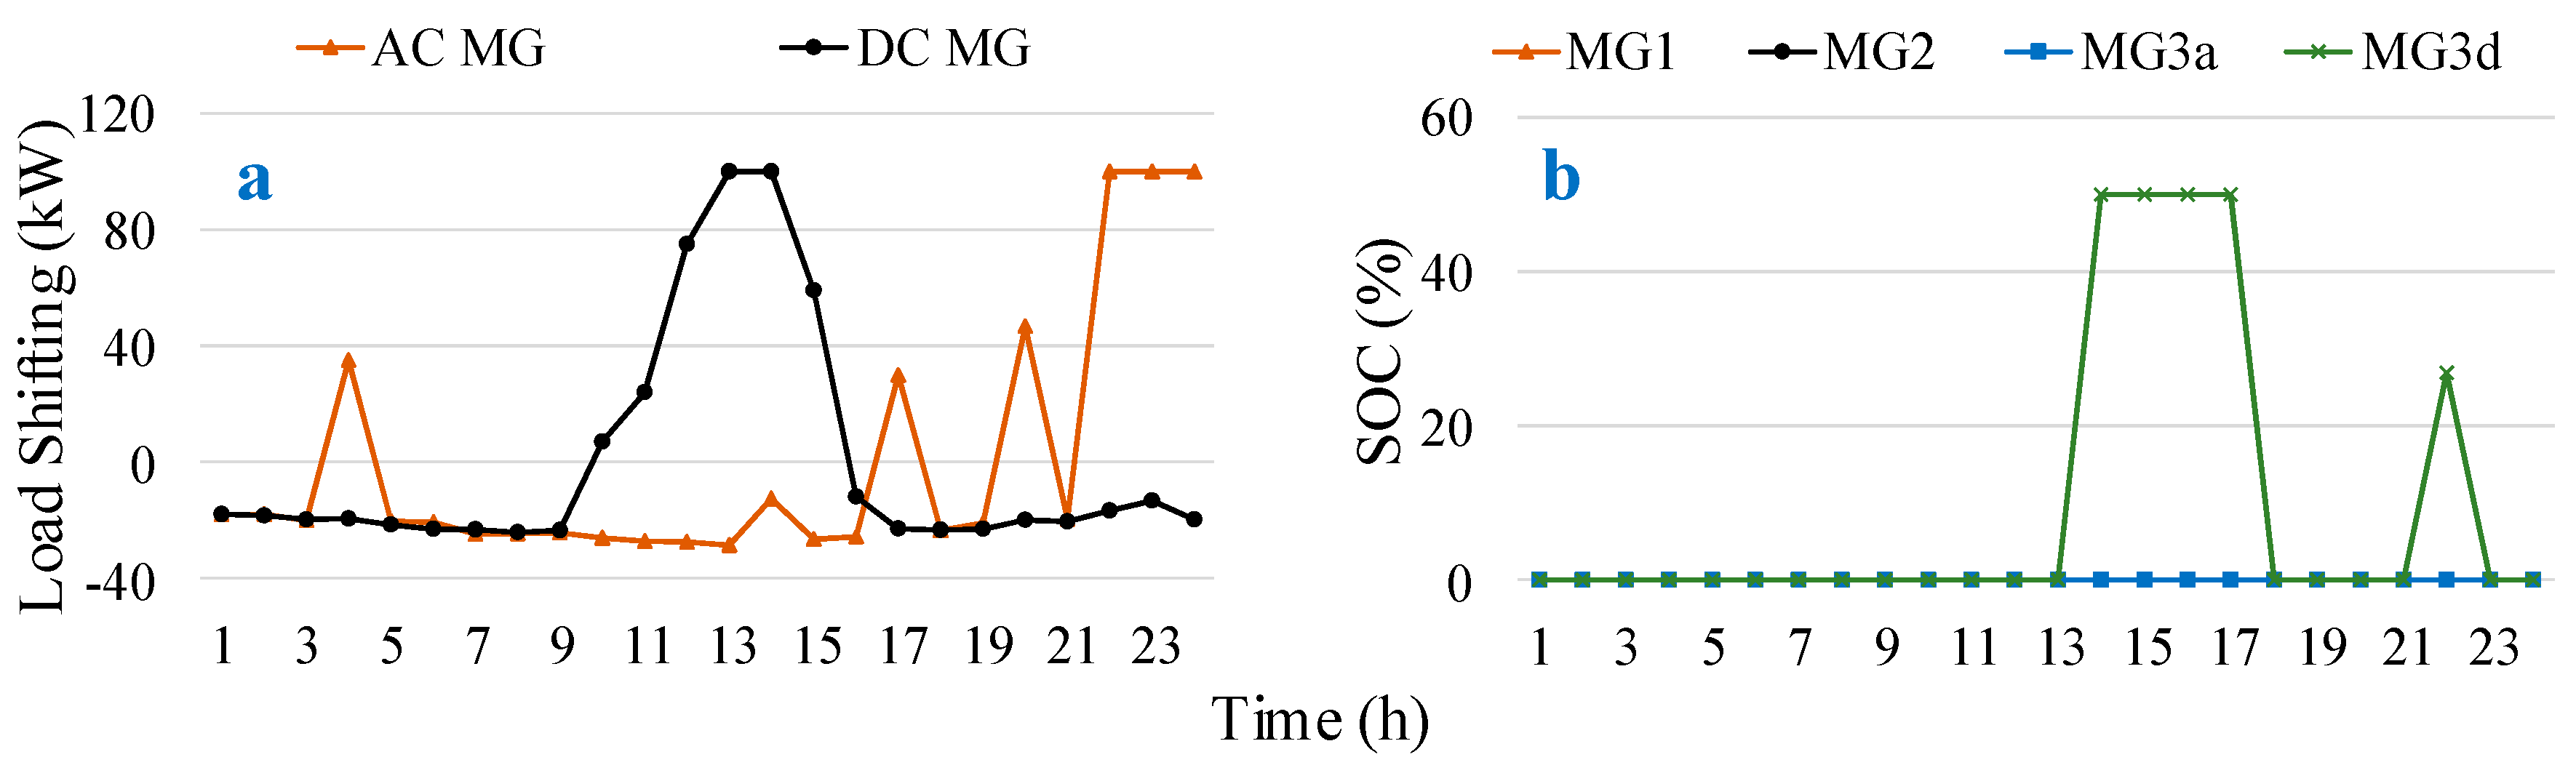
4.2.3. Case 3: Interconnected with DR Operation

The CDGs are generating maximum power throughout the day in this case, as shown in Figure 12a. This is due to the ability of the microgrids to shift loads from one interval to another. The power transfer between AC and DC microgrids follows a similar pattern to that of the previous two cases, as shown in Figure 12b. However, the magnitude of power transfer has reduced in this case due to better management of local loads via shifting across different intervals in addition to transferring from one microgrid to another microgrid.
Load shedding pattern is also similar to those of the previous cases with lower magnitudes, as shown in Figure 13a. The reduced load shedding amount is due to the ability of the microgrids to shift loads from higher load intervals to higher renewable power intervals. The power transfer among microgrids during this case is shown in Figure 13b. It can be observed in Figure 13b that more power transfer occurs towards the end of the scheduling horizon due to the availability of higher renewable power during those intervals.
Figure 14a,b show that both MG1 and MG2 shift their loads from initial intervals to the end intervals due to the availability of higher renewables towards the end of the scheduling horizon. In the previous two cases, this excess of power was curtailed due to the inability of load shifting, i.e., absence of the proposed survivability-oriented operation scheme. In the case of MG3, the load is shifted from initial intervals to the middle intervals (10–15) due to excess of renewable power (PV) during those intervals. Similarly, load from 17–19 is shifted to the last three intervals due to access of wind-based renewables during those intervals, as shown in Figure 15a. The utilization of BESS units is further reduced due to the ability of the microgrids to better utilize their resources by adjusting loads, as shown in Figure 15b.

4.2.4. Performance Comparison

In order to summarize the performance of the three test cases analyzed in the previous sections, four major parameters are compared in this section. The four major parameters analyzed in this section are load shedding of critical loads, load shedding of non-critical loads, curtailment of renewables, and operation cost of the network. It can be observed from Figure 16a that only in the first case (independent operation), 26.06 kWh of critical loads are shed due to the inability of the microgrids to share power. The load shedding amount of non-critical loads is reduced to 6.08 MWh in case 2, which was 7.02 MWh in case 1, as shown in Figure 16b. It is further reduced to 4.8 MWh in the third case by shifting loads and utilizing the excess of renewable power, which was otherwise wasted. The amount of renewable power curtailed in each case is shown in Figure 16c. The curtailment in the independent operation case is highest due to the inability of the MGs to share excess renewables, which was reduced in the interconnected case. The proposed operation strategy has reduced the curtailment of renewables to zero by adjusting loads. Zero renewable curtailment and non-zero load shedding indicate that further penetration of renewables and/or increase in shiftable load amount can enhance the performance of the network. Finally, the reduction in operation cost is shown in Figure 16d considering the operation cost of case 1 as the reference case. The operation cost was reduced by 9% in the second case, which was further reduced to 19% by utilizing the proposed operation scheme.
It can be concluded from the operation results and comparison in this section that the proposed operation scheme is capable of reducing load shedding and curtailment of renewables during emergency operations. This reduction in load shedding increases the comfort to the consumers while reducing operation cost of the microgrid network due to the reduction in penalty costs. Similarly, the reduction in renewable curtailment increases the benefit of renewable owners.

4.3. Discussion and Analysis

It can be observed from the previous section that the performance of the proposed survivability-oriented operation scheme is superior to the two conventional operation schemes. However, the performance is subjected to some of the control and input parameters. The major performance-affecting factors are the amount of shiftable load in microgrids, penetration level of renewables, and capacity of intervals to absorb the additional load. In this section, the performance of the proposed scheme is analyzed in terms of the above-stated three parameters.

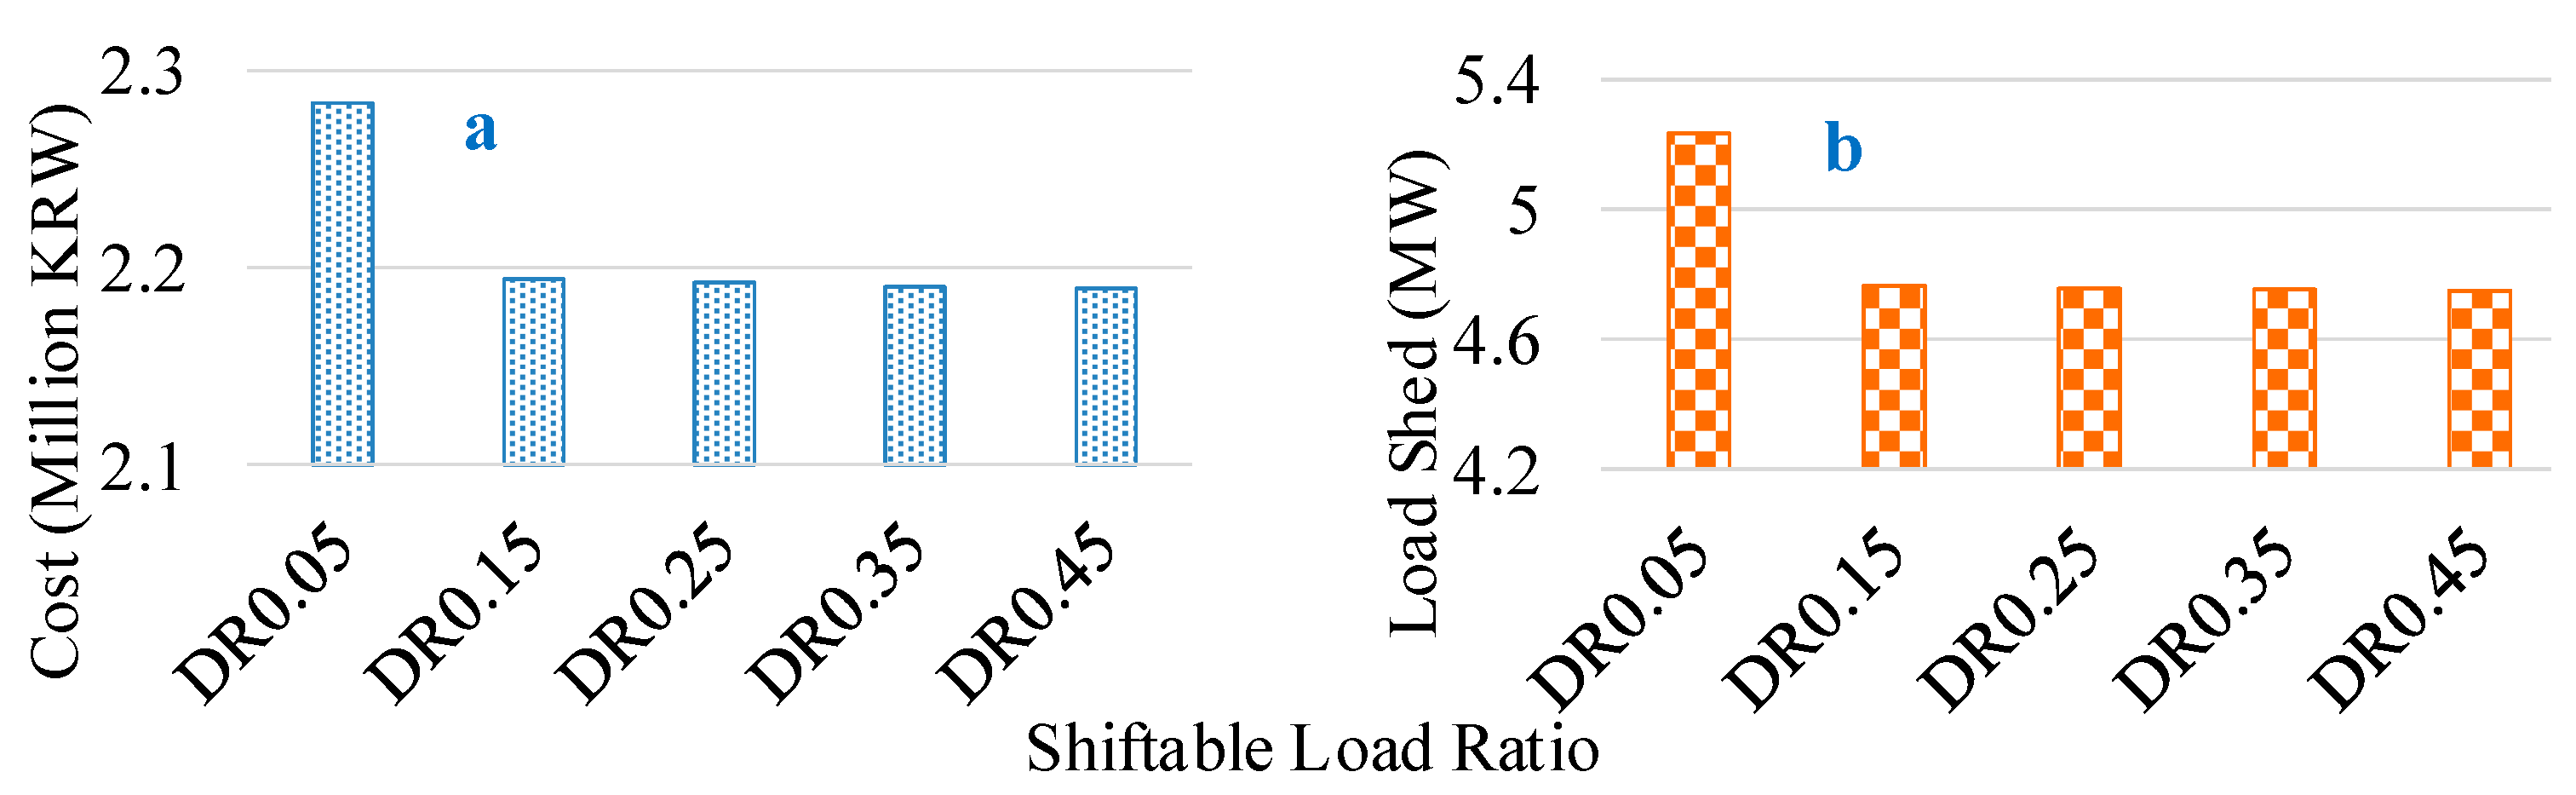
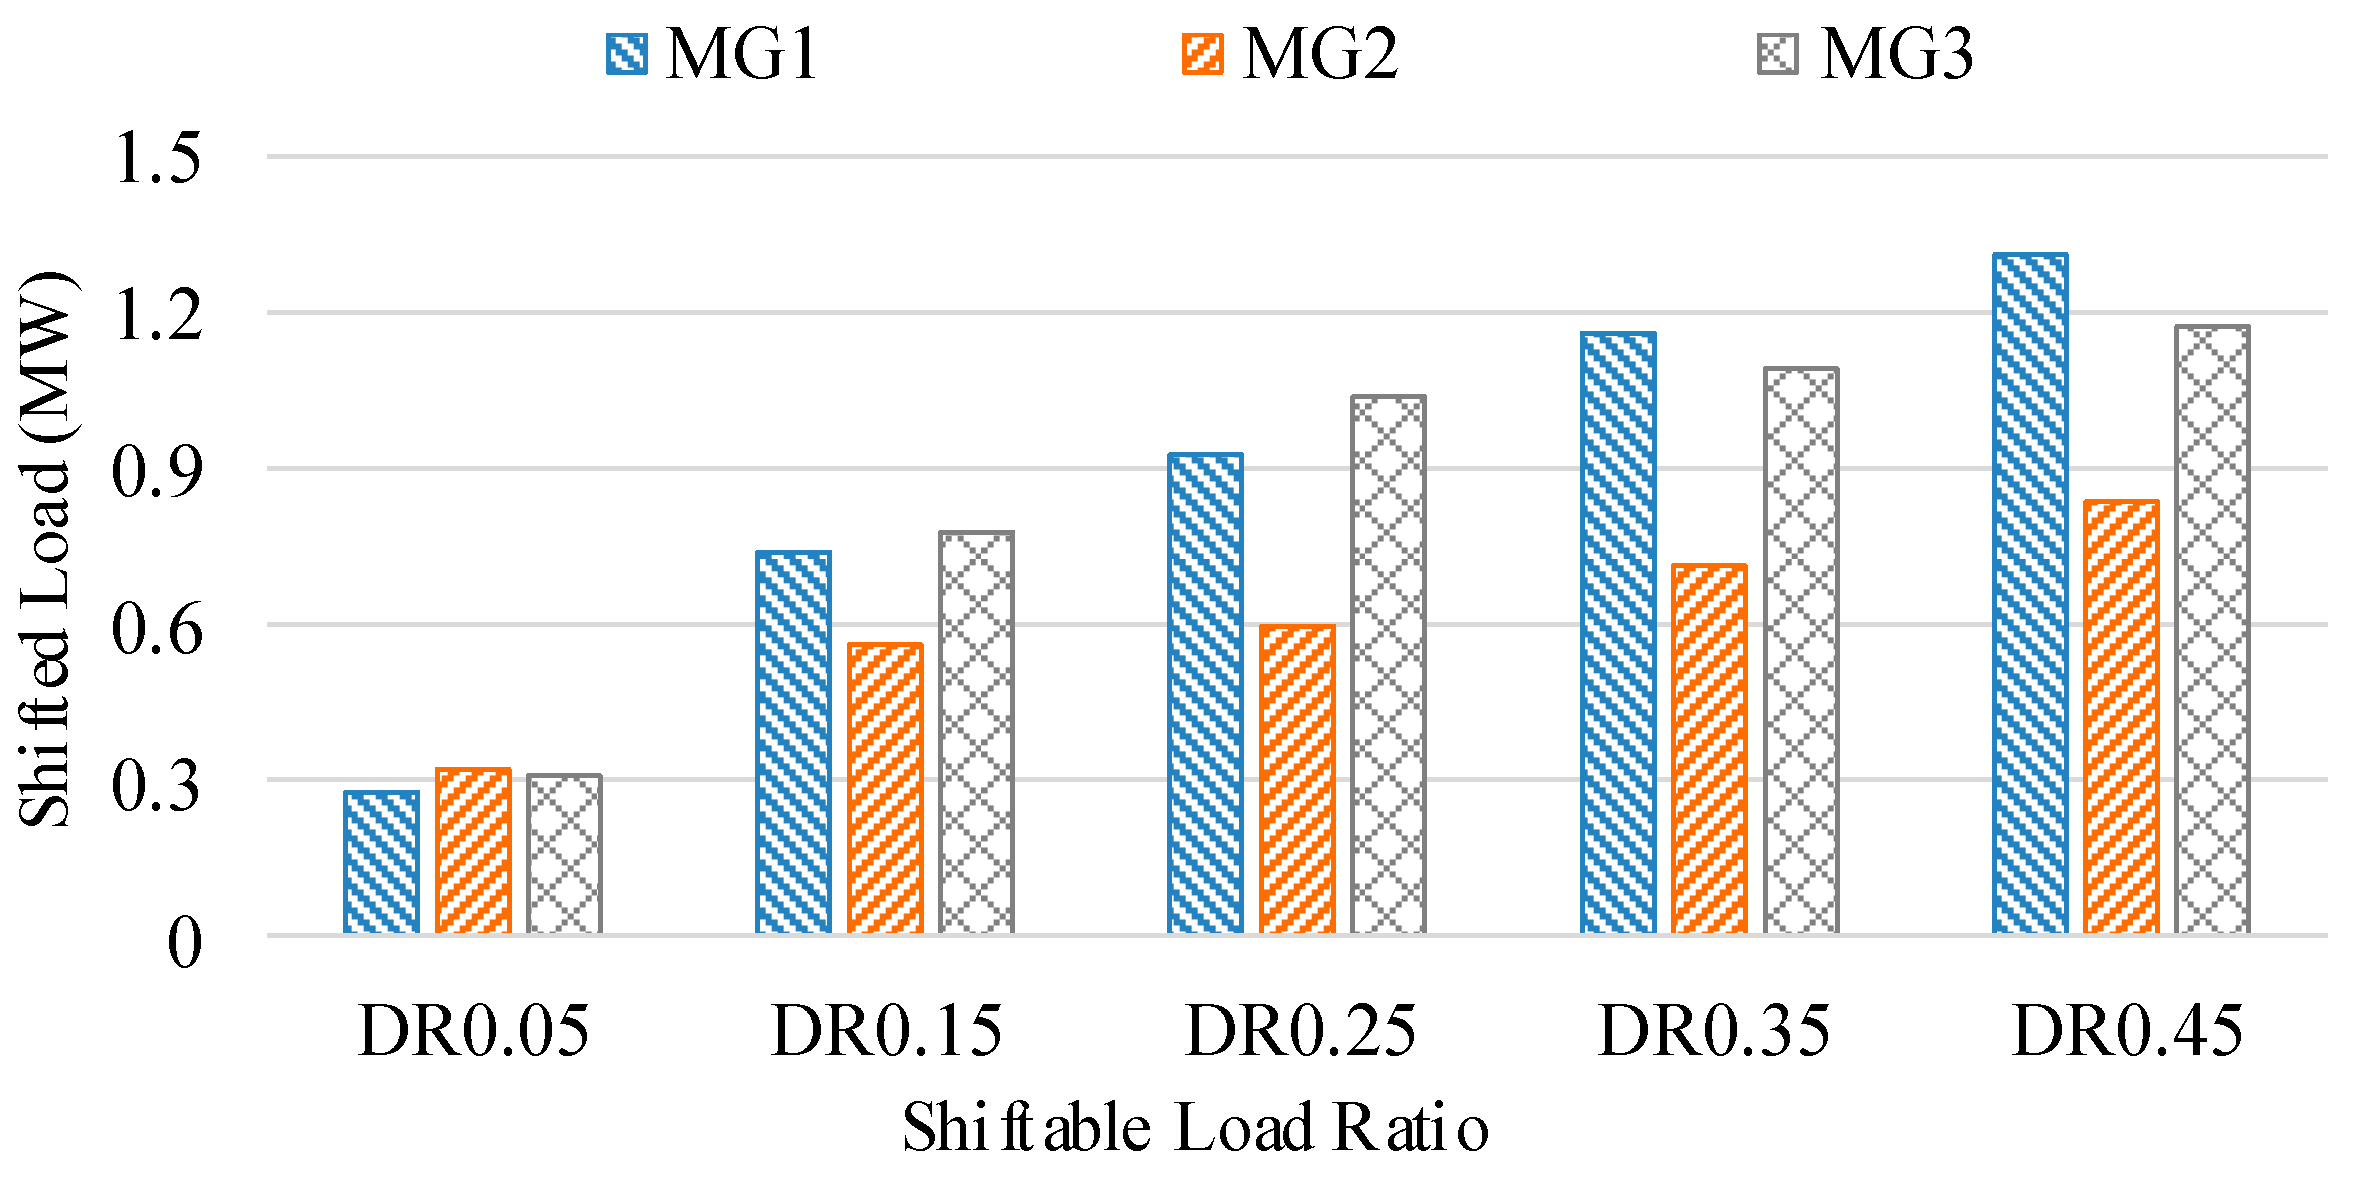
4.3.1. Shiftable Load Ratio

In order to analyze the performance of the proposed method with different ratios of shiftable load, five cases are simulated in this section. In these cases, 5%, 15%, 25%, 35%, and 45% of the non-critical load of each microgrid is considered as the shiftable load, respectively. It can be observed from Figure 17a that the operation cost reduces with increase in the shiftable load ratio, as expected. However, the reduction is not significant from 15% to 45%, which indicates that with the fixed renewable amount more load shifting is not beneficial. The same trend is shown by the load shedding of non-critical loads (Figure 17b) due to the full utilization of renewables with 15% shiftable loads.
The power transfer between microgrids increases with increase in the shiftable load amount, as shown in Figure 18a. This is due to the presence of higher renewable power in some microgrids as compared to other microgrids. The amount of power generated by CDGs follows a similar pattern to the amount of load shed, as shown in Figure 18b,c shows that minute amount of renewables are curtailed with 5% shiftable load case. However, renewable curtailment has reduced to zero in all the remaining cases, which indicates that further penetration of renewables can be absorbed by the network. Finally, the amount of shifted load in all the microgrids also increases with increase in the shiftable load ratio, as shown in Figure 19. By analyzing the results of this case, it can be concluded that 15% of shiftable loads are enough to get the desired results with the given load and renewable profiles. Further increase in shiftable load shows minute improvements.

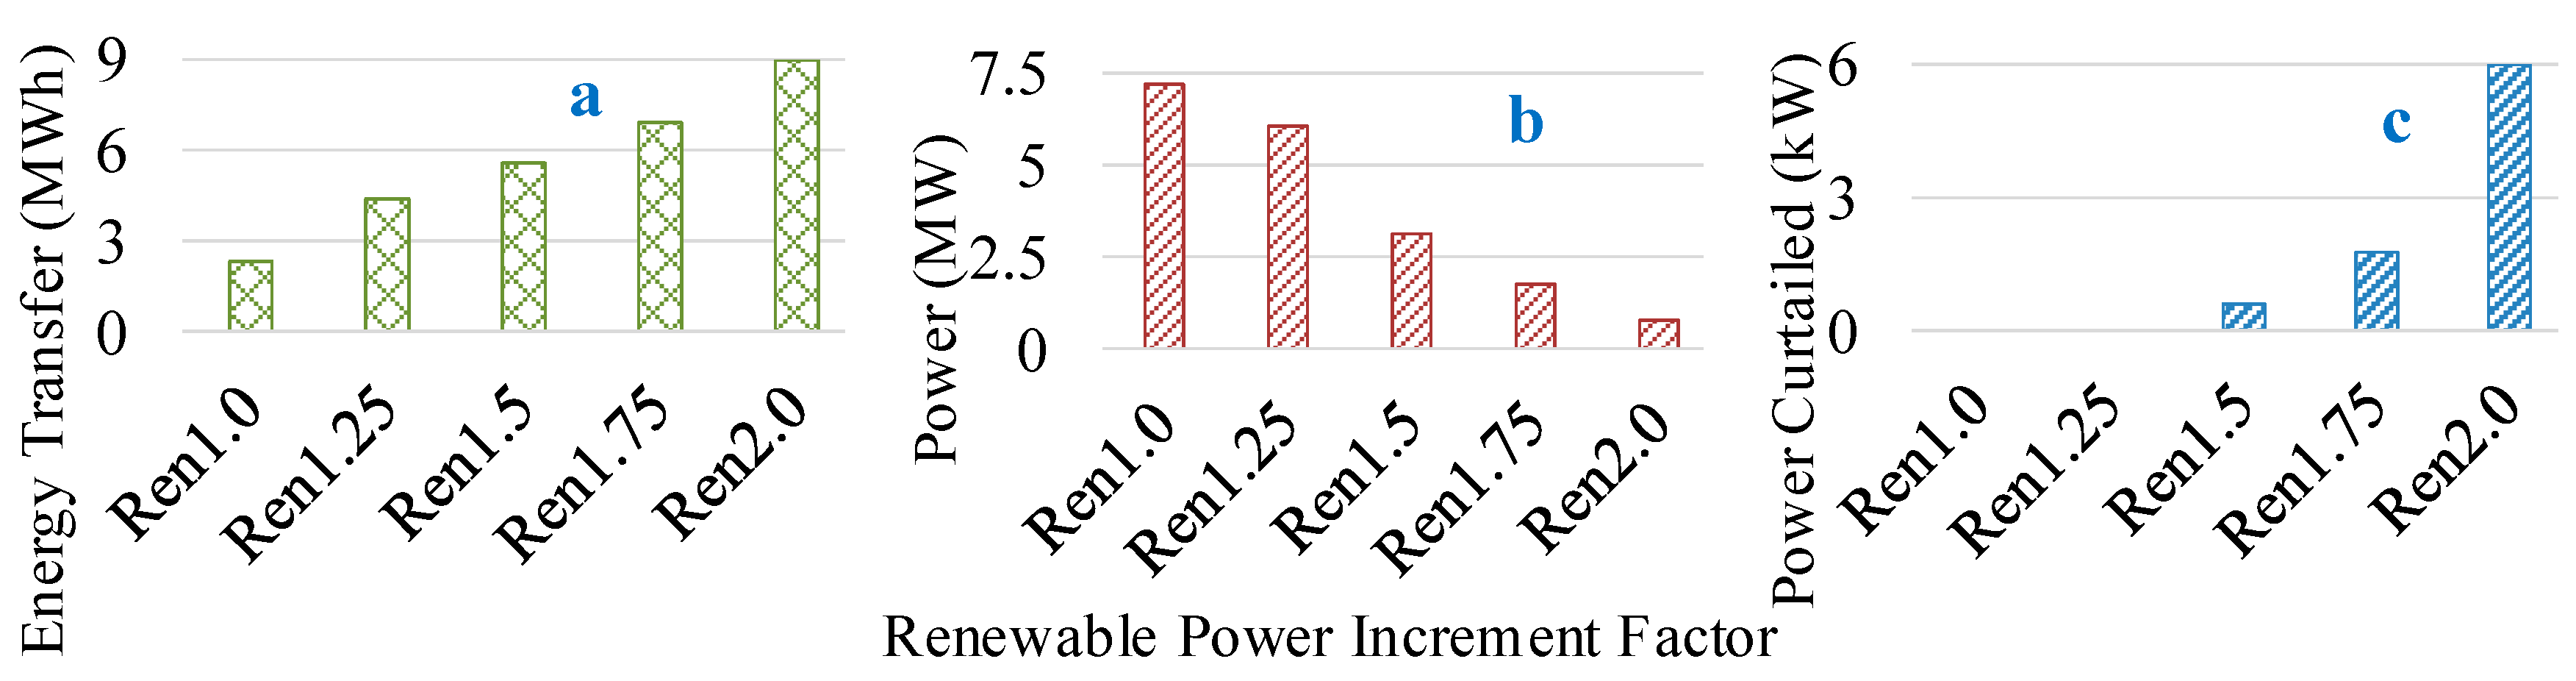
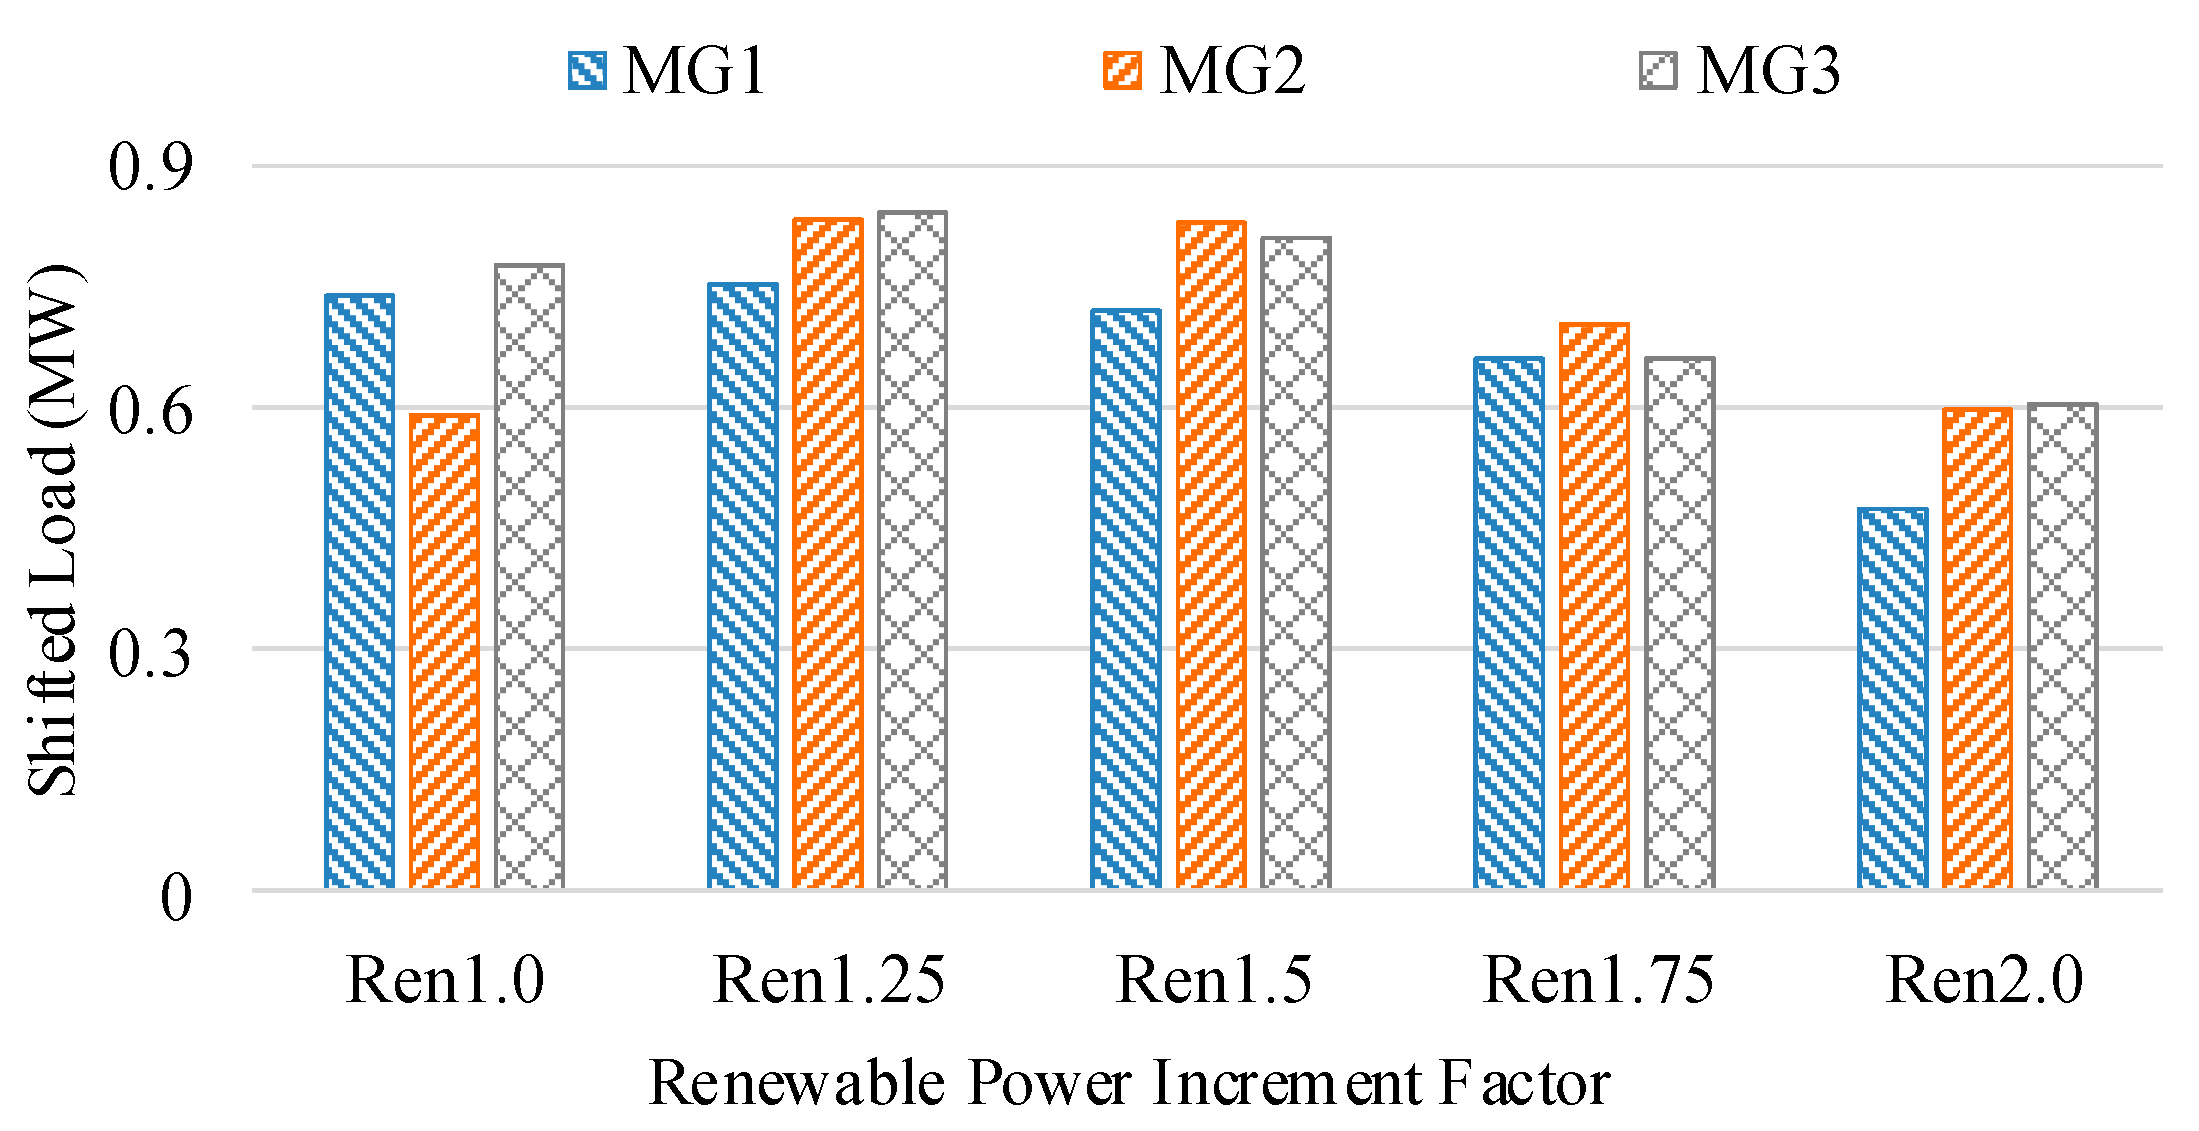
4.3.2. Renewable Penetration Level

In this section, the performance of the proposed operation scheme with different penetration levels of renewables is analyzed. The original renewable power is increased by a step of 0.25 and four additional cases are simulated. It can be observed from Figure 20a,b that the operation cost and the load shedding amount of non-critical loads decreases with an increase in the renewable penetration level. This is due to the ability to feed more loads, which results in lesser penalty costs and lesser utilization of CDGs, as shown in Figure 21b. It can be observed from Figure 21a that the power transfer among microgrids increases with increase in renewables due to the presence of different amount of renewables in different microgrids. Figure 21c shows that renewable curtailment remains zero if the renewable amount is increased by 0.25. However, further increase results in curtailment of renewables in an exponential fashion. It implies that more shiftable loads are required to absorb the excess of the renewable amount. Finally, Figure 22 shows that load shifting increases initially with an increase in the renewable power amount and then decreases. It implies that all shiftable loads are fully utilized till the maximum shifted case, further increase in renewables results in the feeding of loads during that interval, i.e., no need of shifting.
It can be concluded from the operation results that, load shifting decrease if the amount of renewables is increased while keeping the shiftable amount fixed. In addition, the point where load shedding is reduced to zero can be obtained, which was increase by two times for this case.

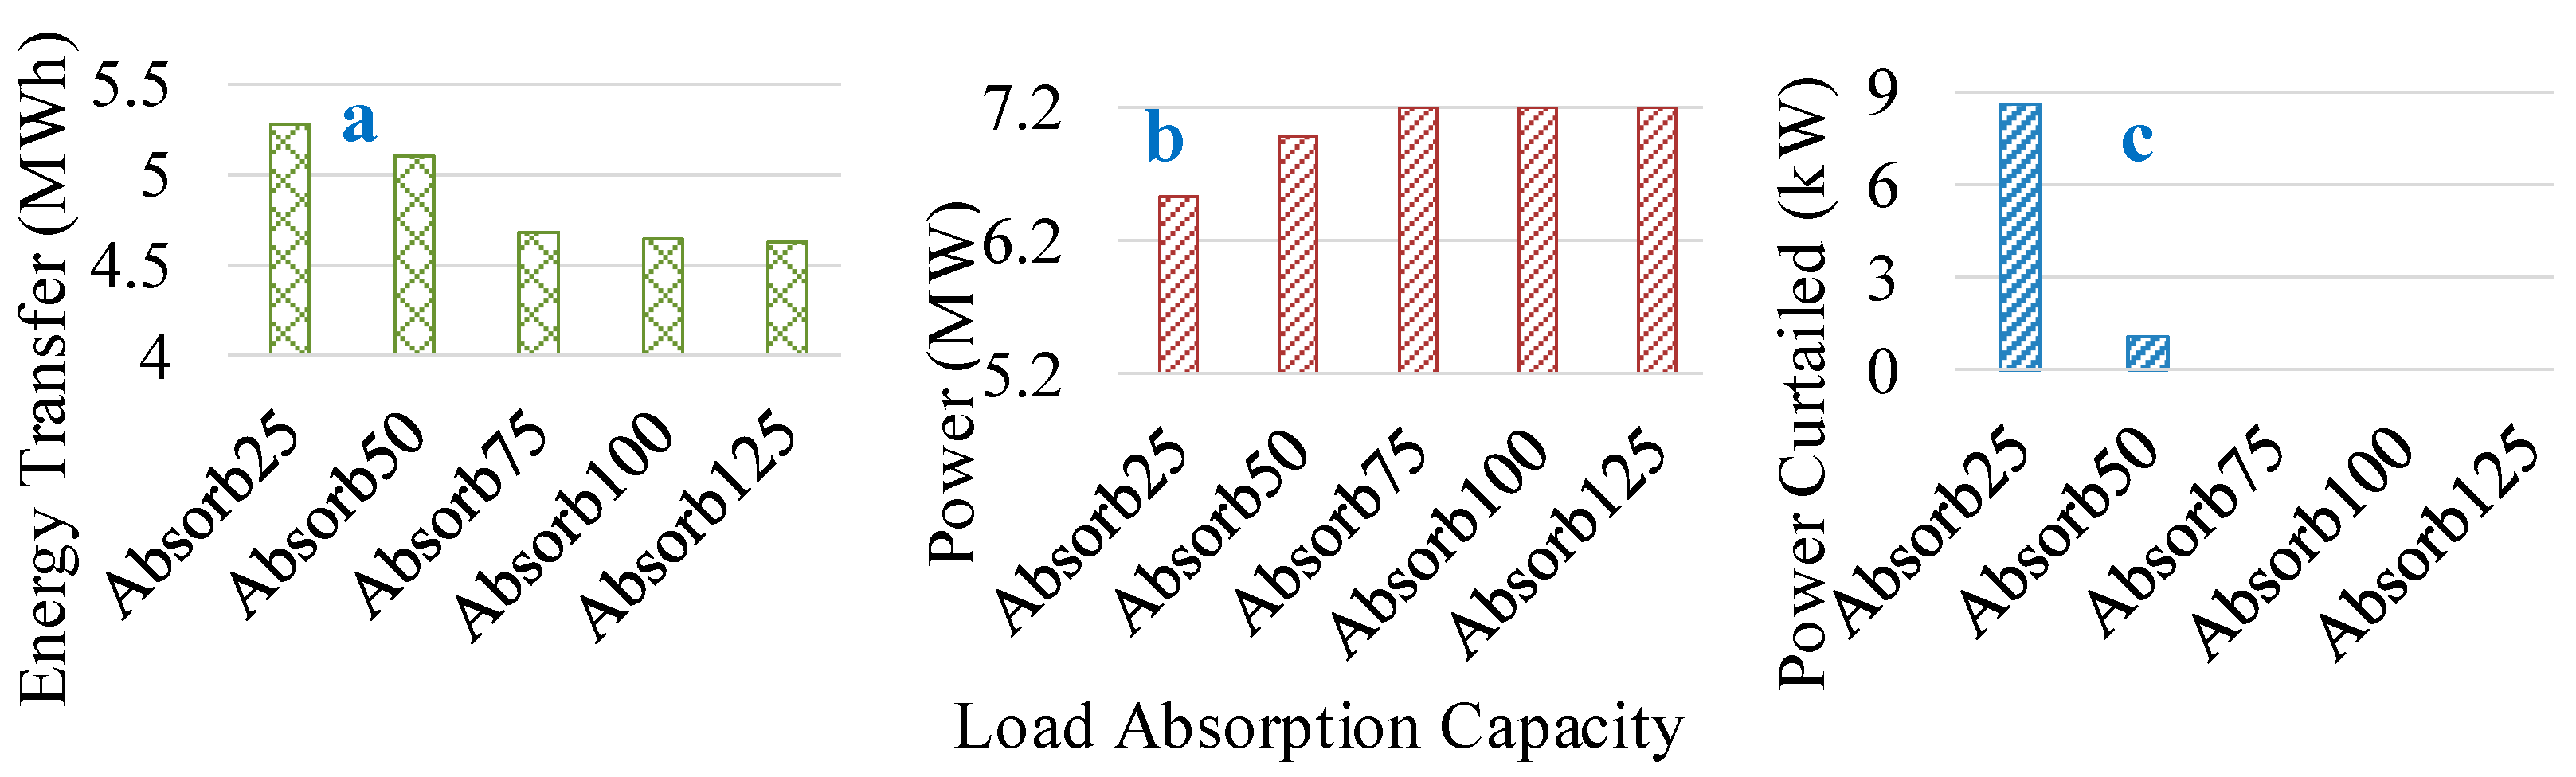
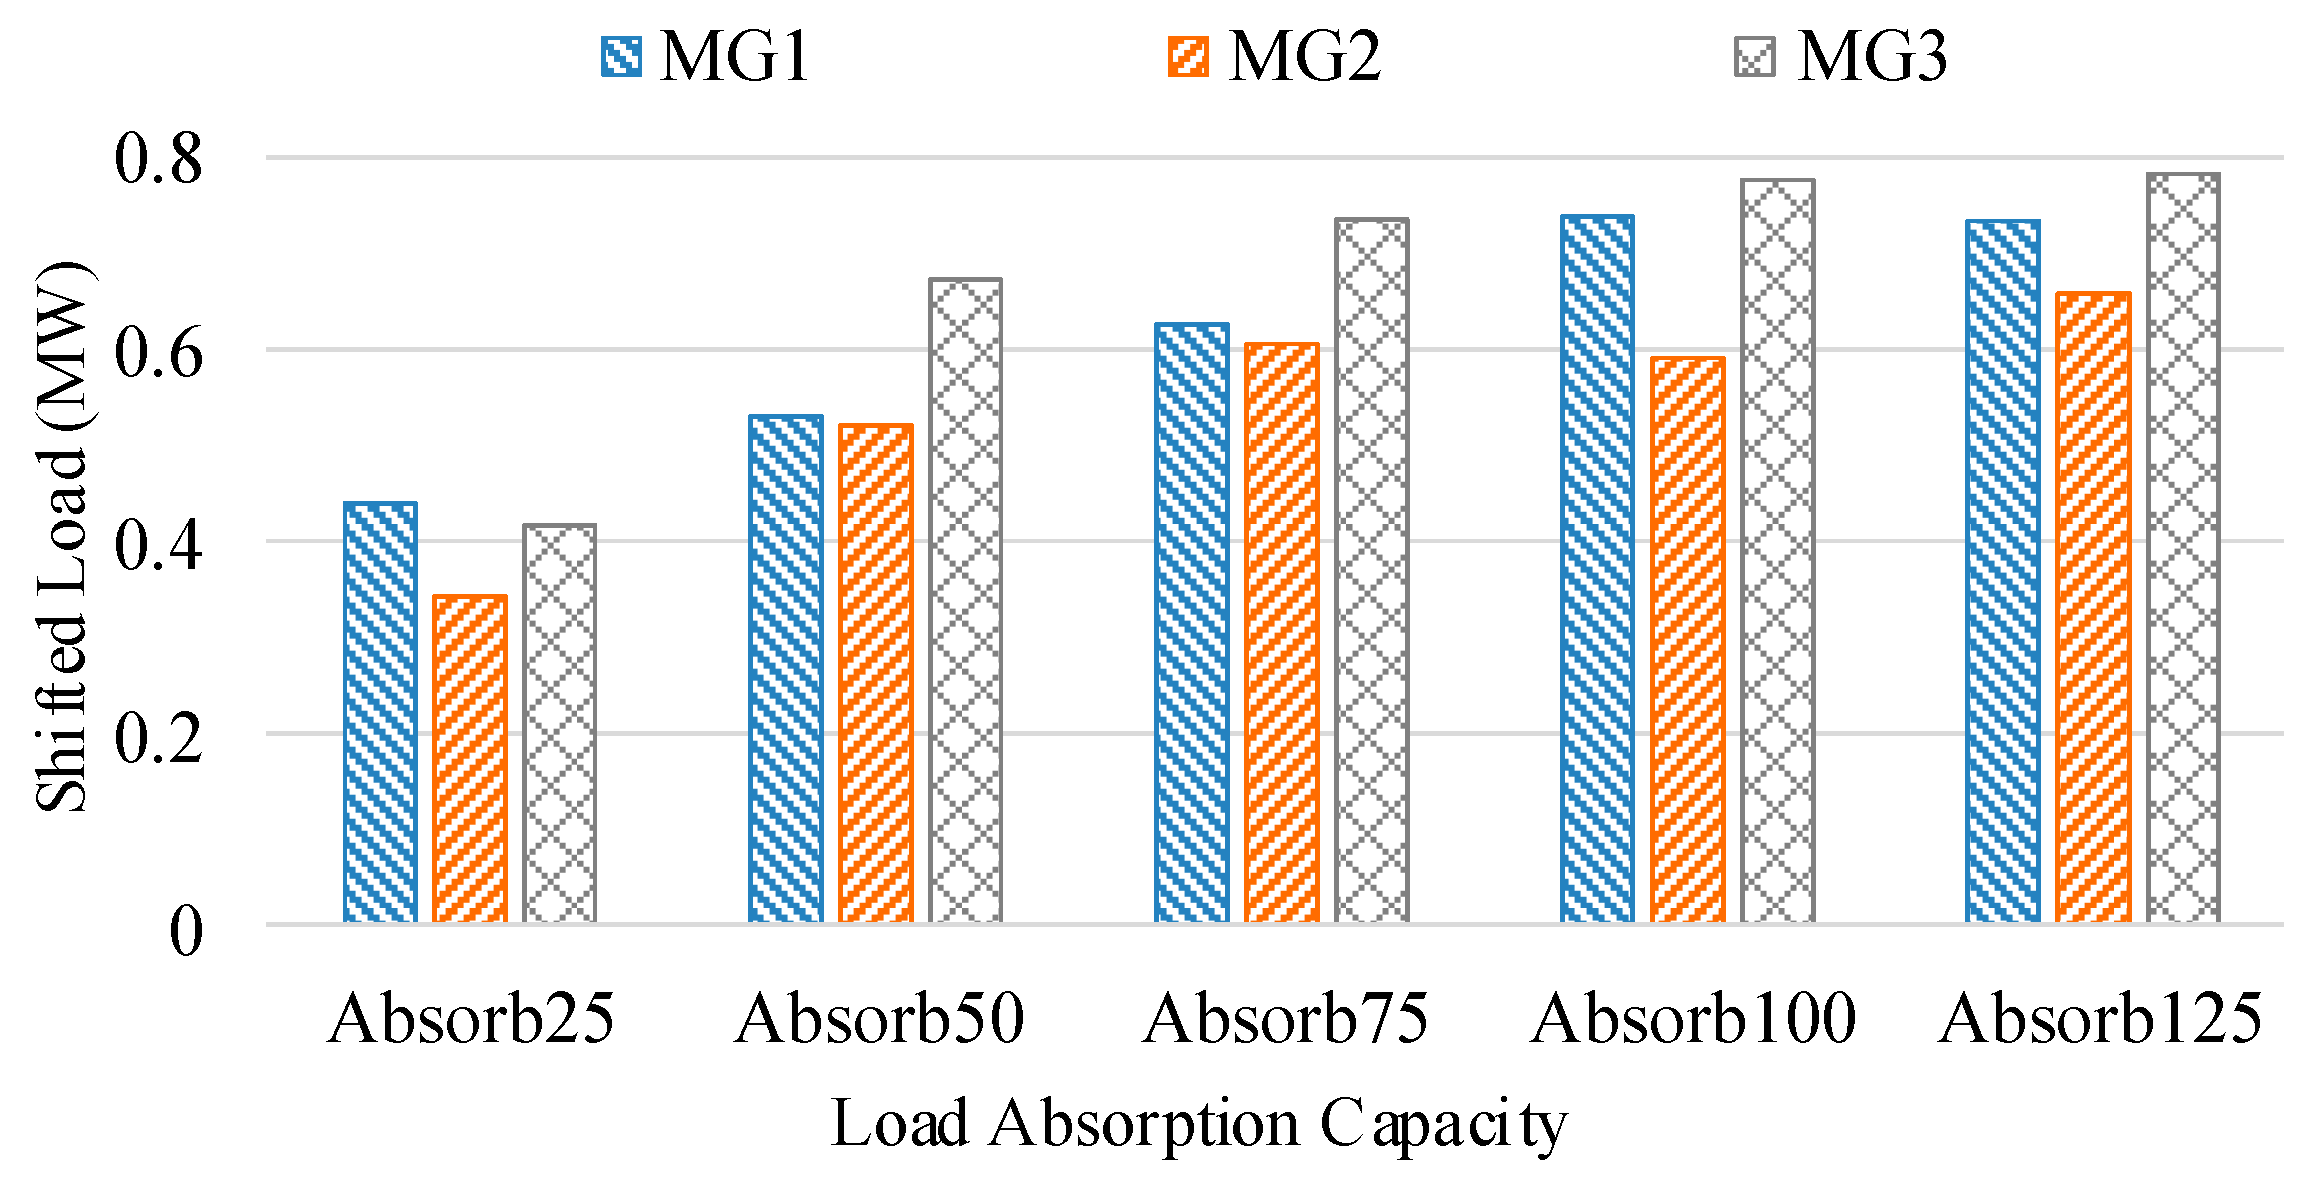
4.3.3. Load Absorption Level

In this section, the impact of load absorption level per interval on the performance of the proposed operation scheme is analyzed. It can be observed from Figure 23a,b that with an increase in the load absorption level, both operation cost and load shedding amount decreases initially. However, from load absorption level 75 kWh onwards, the performance remains same. The same trend can be observed for power transfer among the microgrids and the generation amount of CDGs, Figure 24a,b. This is due to full utilization of shiftable loads until 75 kWh case. However, shifted load amount increases with increase in the absorption level. It implies that more loads are shifted to intervals with larger absorption capacity but it is not contributing in reducing the load shedding amount. The renewable power curtailment in Figure 24c shows that power curtailment reduces with increase in absorption level of intervals and reduces to zero if increased to 75 kWh and onwards. It implies that the absorption level of 75 kWh is the saturation point for the tested microgrid system. Finally, Figure 25 shows that shifted load increases with an increase in the absorption level in all the microgrids, except MG2 for 100 kWh absorption case. It can be concluded by analyzing the results of this section that, load absorption level has a saturation point and further increase in load absorption level does not contribute in reducing load shedding amount. Similarly, a further increase in absorption level is not reducing the operation cost due to same load shedding amount and utilization of the same power from CDGs. In order to better utilize the allowed absorption level, increase in penetration level of renewables and/or increase in load shifting amount is required.

5. Conclusions

A survivability-oriented demand response program is proposed for a network of hybrid microgrids in this study. The uncertainties in renewables and loads in the microgrids are realized via a robust optimization method and the worst-case scenario is considered. The performance of the proposed method is compared with conventional independent operation case and interconnected operation case. The proposed method has shown a reduction in operation cost by 19% in comparison with the independent operation case and 10% in comparison with the interconnected case. Similarly, reduction of load shedding amount in comparison with independent and interconnected cases turns out to be 32% and 22%, respectively. In addition, the curtailment of renewables has been reduced to 0% by the proposed method, in the nominal case. It can be concluded from the simulation results that the proposed method is capable of reducing load shedding amount, curtailment of renewables, and operation cost of the microgrid networks during emergencies. However, the performance of the proposed method is subjected to various input and control parameters. Therefore, the impact of these parameters on the operation of the proposed method is also analyzed in this study. The results show that the increase in renewable penetration level has a significant impact on the performance of the proposed method. However, shiftable load ratio and load absorption level have a minute impact. Both of these parameters have a saturation level and further increase has no impact on the operation cost and load shedding amount without changing the penetration level of renewables. Similarly, the increase in renewable penetration level without an increase in shiftable load ratio results in increased curtailment of renewables. Therefore, a trade-off needs to be decided for each microgrid network.

Author Contributions

The paper was a collaborative effort between the authors. The authors contributed collectively to the theoretical analysis, modeling, simulation, and manuscript preparation.

Funding

This work was funded by Incheon National University Research Grant in 2018.

Acknowledgments

This work was supported by Incheon National University Research Grant in 2018.

Conflicts of Interest

The authors declare no conflict of interest.

Nomenclature

Identifiers and Binary Variables
t Index of time, running from 1 to T.
m , n Index of microgrids, running from 1 to M and 1 to N, respectively.
g Index of dispatchable generators, running from 1 to G.
X Microgrid side identifier, A for AC side and D for DC side microgrid.
s m , g X ( t ) Commitment status identifier of dispatchable generator g of X side MG m at t.
s u m , g X ( t ) ,   s d m , g X ( t ) Start-up and shut-down identifiers of dispatchable generator g of X side MG m at t.
c m ( t ) , d m ( t ) Identifier for charging and discharging of BESS in MG m at t.
v m X   ( t , t ) Identifier for load shifting allowance in X side MG m from t’ to t.
Variables and Constants
P U C m , g X D G ( p m , g X D G ( t ) ) Generation cost of dispatchable unit g of X side MG m at t.
p m , g X D G ( t ) Amount of power generated by dispatchable unit g of X side MG m at t.
S U C m , g X D G ( t ) Start-up cost of dispatchable unit g of X side MG m at t.
S D C m , g X D G ( t ) Shut-down cost of dispatchable unit g of X side MG m at t.
C C P , C N P Penalty for shedding critical and non-critical loads in X side MG m at t.
p m X C S ( t ) , p m X N S ( t ) Amount of critical and non-critical load shed in X side MG m at t.
C R P ,   p m X R S ( t ) Penalty and amount of renewable power curtailed in X side MG m at t.
p m X C L ( t ) , p m X N L ( t ) Amount of critical and non-critical load in X side MG m at t.
p m X _ A d j L ( t ) Amount of adjusted load in X side MG m at t.
p m X S H F ( t , t ) Amount of load shifted from t’ to t in X side microgrid m.
p m X B C ( t ) , p m X B D ( t ) Amount of electrical energy charged/discharged to/from BESS of X side MG m at t.
p m S E ( t ) , p m R E ( t ) Amount of power sent by/received from MG m at t.
p m X R G ( t ) Forecasted power of RDG unit of X side MG m at t.
P m           C A P , P ( m , n ) C A P Capacity of line connecting mth MG with utility grid and nth MG, respectively.
p ( m , n ) R E (t)Amount of power received by mth MG from nth MG at t.
p ( m , n ) S E (t)Amount of power sent by mth MG to nth MG at t.
p m T A C ( t ) , p m T D C ( t ) Amount of power sent from AC to DC and DC to AC microgrid in MG m at t.
P I L C           C A P ,   η m I L C Capacity and efficiency of ILC connecting AC and DC microgrid in MG m at t.
P m X B E S S , p m X S O C ( t ) Capacity and SOC of BEES in X side MG m at t.
η m X C , η m X D   Charging and discharging loss of BESS in X side MG m.
P m X I N I T Initial amount of energy in BESS in X side MG m.
T O X m a x ( t ) ,   F R X m a x ( t ) Maximum load allowed to shift to and allowed to shift from t in X side MG m.
p m X N e t L ( t ) ,   p m X _ S L ( t ) Amount of net critical load and shiftable load in X side MG m at t.
p ^ m X L O A D ( t ) , p m X L O A D ( t ) Bounded load and associated uncertainty bound in X side MG m at t.
p ^ m X R G ( t ) ,   p m X R G ( t ) Bounded RDG output power and associated uncertainty bound in X side MG m at t.
p _ m X L O A D ( t ) , p ¯ m X L O A D ( t ) Upper and lower bounds of load in X side MG m at t.
p _ m X R G ( t ) , p ¯ m X R G ( t ) Upper and lower bounds of RDG output power in X side MG m at t.
z _ m X L O A D ( t ) ,   z ¯ m X L O A D ( t ) Scaled deviations for load of X side MG m at t.
z _ m X R G ( t ) ,   z ¯ m X R G ( t ) Scaled deviations for WT power output of X side MG m at t.
Г m X ( t ) , ζ m X ( t ) Budget of uncertainty and uncertainty adjustment factor of X side MG m at t.
λ m X l ± ( t ) , λ m X r ± ( t ) Dual variables for load and RDG unit of X side MG m at t.

References

  1. Khodaei, A. Resiliency-oriented microgrid optimal scheduling. IEEE Trans. Smart Grid 2014, 5, 1584–1591. [Google Scholar] [CrossRef]
  2. Hussain, A.; Bui, V.H.; Kim, H.M. A proactive and survivability-constrained operation strategy for enhancing resilience of microgrids using energy storage system. IEEE Access 2018, 6, 75495–75507. [Google Scholar] [CrossRef]
  3. Wang, Z.; Wang, J. Self-healing resilient distribution systems based on sectionalization into microgrids. IEEE Trans. Power Syst. 2015, 30, 3139–3149. [Google Scholar] [CrossRef]
  4. Hussain, A.; Bui, V.H.; Kim, H.M.; Im, Y.H.; Lee, J.Y. Optimal energy management of combined cooling, heat and power in different demand type buildings considering seasonal demand variations. Energies 2017, 10, 789. [Google Scholar] [CrossRef]
  5. Nguyen, D.T.; Le, L.B. Optimal energy management for cooperative microgrids with renewable energy resources. In Proceedings of the IEEE International Conference on Smart Grid Communications (SmartGridComm), Vancouver, BC, Canada, 21–24 October 2013. [Google Scholar] [CrossRef]
  6. Palensky, P.; Dietrich, D. Demand side management: Demand response, intelligent energy systems, and smart loads. IEEE Trans. Ind. Inform. 2011, 7, 381–388. [Google Scholar] [CrossRef]
  7. US DoE. Benefits of Demand Response in Electricity Markets and Recommendations for Achieving Them, Report to the US Congress. 2006. Available online: http://eetd.idi.gov (accessed on 19 December 2018).
  8. Silva, S.; Soares, I.; Pinho, C. Electricity demand response to price changes: The Portuguese case taking into account income differences. Energy Econ. 2017, 65, 335–342. [Google Scholar] [CrossRef]
  9. Samuel, O.; Javaid, S.; Javaid, N.; Ahmed, S.; Afzal, M.; Ishmanov, F. An efficient power scheduling in smart homes using Jaya based optimization with time-of-use and critical peak pricing schemes. Energies 2018, 11, 3155. [Google Scholar] [CrossRef]
  10. Carpinelli, G.; Mottola, F.; Proto, D. Optimal scheduling of a microgrid with demand response resources. IET Gen. Trans. Dist. 2014, 8, 1891–1899. [Google Scholar] [CrossRef]
  11. Imani, M.H.; Niknejad, P.; Barzegaran, M.R. The impact of customers’ participation level and various incentive values on implementing emergency demand response program in microgrid operation. Int. J. Electr. Power Energy Syst. 2018, 96, 114–125. [Google Scholar] [CrossRef]
  12. Hajibandeh, N.; Ehsan, M.; Soleymani, S.; Shafie-khah, M.; Catalão, J. The mutual impact of demand response programs and renewable energies: a survey. Energies 2017, 10, 1353. [Google Scholar] [CrossRef]
  13. Rezaei, N.; Kalantar, M. Stochastic frequency-security constrained energy and reserve management of an inverter interfaced islanded microgrid considering demand response programs. Int. J. Electr. Power Energy Syst. 2015, 69, 273–286. [Google Scholar] [CrossRef]
  14. Bayat, M.; Sheshyekani, K.; Hamzeh, M.; Rezazadeh, A. Coordination of distributed energy resources and demand response for voltage and frequency support of MV microgrids. IEEE Trans. Power Syst. 2016, 31, 1506–1516. [Google Scholar] [CrossRef]
  15. Gouveia, C.; Moreira, J.; Moreira, C.L.; Lopes, J.P. Coordinating storage and demand response for microgrid emergency operation. IEEE Trans. Smart Grid 2013, 4, 1898–1908. [Google Scholar] [CrossRef]
  16. Eshraghi, A.; Motalleb, M.; Reihani, E.; Ghorbani, R. Frequency regulation in Islanded microgrid using demand response. In Proceedings of the 2017 North American Power Symposium (NAPS), Morgantown, WV, USA, 17–19 September 2017. [Google Scholar]
  17. Wang, Y.; Pordanjani, I.R.; Xu, W. An event-driven demand response scheme for power system security enhancement. IEEE Trans. Smart Grid 2011, 2, 23–29. [Google Scholar] [CrossRef]
  18. Yang, X.; He, X.; Lin, J.; Yu, W.; Yang, Q. A novel microgrid based resilient demand response scheme in smart grid. In Proceedings of the 2016 17th IEEE/ACIS International Conference on Software Engineering, Artificial Intelligence, Networking and Parallel/Distributed Computing (SNPD), Shanghai, China, 30 May–1 June 2016. [Google Scholar]
  19. Nikmehr, N.; Najafi-Ravadanegh, S.; Khodaei, A. A Probabilistic optimal scheduling of networked microgrids considering time-based demand response programs under uncertainty. Appl. Energy 2017, 198, 267–279. [Google Scholar] [CrossRef]
  20. Nikmehr, N.; Wang, L.; Najafi-Ravadanegh, S.; Moradi-Moghadam, S. Demand response enabled optimal energy management of networked microgrids for resilience enhancement. In Operation of Distributed Energy Resources in Smart Distribution Networks; Academic Press: Amsterdam, The Netherlands, 2018. [Google Scholar]
  21. Hosseinzadeh, M.; Salmasi, F.R. Power management of an isolated hybrid AC/DC micro-grid with fuzzy control of battery banks. IET Renew. Power Gen. 2015, 9, 484–493. [Google Scholar] [CrossRef]
  22. Hussain, A.; Bui, V.H.; Kim, H.M. Robust optimal operation of AC/DC hybrid microgrids under market price uncertainties. IEEE Access 2018, 6, 2654–2667. [Google Scholar] [CrossRef]
  23. Eajal, A.A.; Shaaban, M.F.; Ponnambalam, K.; El-Saadany, E.F. Stochastic centralized dispatch scheme for AC/DC hybrid smart distribution systems. IEEE Trans. Sustain. Energy 2016, 7, 1046–1059. [Google Scholar] [CrossRef]
  24. Hussain, A.; Bui, V.H.; Kim, H.M. Impact analysis of demand response intensity and energy storage size on operation of networked microgrids. Energies 2017, 10, 882. [Google Scholar] [CrossRef]
  25. Wang, Y.; Mao, S.; Nelms, R.M. On hierarchical power scheduling for the macrogrid and cooperative microgrids. IEEE Trans. Ind. Inform. 2015, 11, 1574–1584. [Google Scholar] [CrossRef]
  26. Rezvan, A.T.; Gharneh, N.S.; Gharehpetian, G.B. Robust optimization of distributed generation investment in buildings. Energy 2012, 48, 455–463. [Google Scholar] [CrossRef]
  27. Hussain, A.; Bui, V.H.; Kim, H.M. Robust optimization-based scheduling of multi-microgrids considering uncertainties. Energies 2016, 9, 278. [Google Scholar] [CrossRef]
  28. Akbari, K.; Nasiri, M.M.; Jolai, F.; Ghaderi, S.F. Optimal investment and unit sizing of distributed energy systems under uncertainty: A robust optimization approach. Energy Build. 2014, 85, 275–286. [Google Scholar] [CrossRef]
  29. Hussain, A.; Bui, V.H.; Kim, H.M. A resilient and privacy-preserving energy management strategy for networked microgrids. IEEE Trans. Smart Grid 2018, 9, 2127–2139. [Google Scholar] [CrossRef]
  30. NetBeans IDE for Windows. Available online: https://netbeans.org (accessed on 19 December 2018).
  31. IBM ILOG CPLEX V12.6 User’s Manual for CPLEX 2015, CPLEX Division; ILOG: Incline Village, NV, USA, 2015; Available online: https://www.ibm.com/support/knowledgecenter/SSSA5P_12.6.2/ilog.odms.studio. help/pdf/usrcplex.pdf (accessed on 19 December 2018).
Figure 1. Configuration of AC/DC hybrid microgrid network.
Energies 12 00452 g001
Figure 2. Survivability-oriented demand response program.
Energies 12 00452 g002
Figure 3. Worst-case load and renewable profiles of microgrids: (a) Microgrid 1; (b) Microgrid 2.
Energies 12 00452 g003
Figure 4. Worst-case load and renewable profiles of microgrid 3: (a) Load profile; (b) Renewable power profile.
Energies 12 00452 g004
Figure 5. Summary of test cases considered in this study.
Energies 12 00452 g005
Figure 6. CDG generated power in independent operation case: (a) AC side; (b) DC side.
Energies 12 00452 g006
Figure 7. Load shedding in independent operation case: (a) Critical load; (b) Non-critical load.
Energies 12 00452 g007
Figure 8. Operation results in independent operation case: (a) Energy transfer; (b) state-of-charge (SOC) of batteries.
Energies 12 00452 g008
Figure 9. CDG generated power in interconnected operation case: (a) AC side; (b) DC side.
Energies 12 00452 g009
Figure 10. Operation results in interconnected operation case: (a) Energy transfer; (b) Non-critical load shed.
Energies 12 00452 g010
Figure 11. Operation results in interconnected operation case: (a) SOC; (b) Energy exchange among microgrids (MGs).
Energies 12 00452 g011
Figure 12. Operation results in demand response (DR) integrated operation case: (a) CDG power; (b) Energy transfer.
Energies 12 00452 g012
Figure 13. Operation results in DR integrated operation case: (a) Non-critical load shed; (b) Energy exchanged.
Energies 12 00452 g013
Figure 14. Load shifting in DR integrated operation case: (a) MG 1; (b) MG 2.
Energies 12 00452 g014
Figure 15. Operation results in DR integrated operation case: (a) Load shifting in MG3; (b) SOC.
Energies 12 00452 g015
Figure 16. Performance comparison of the test cases: (a) Critical load shed; (b) Non-critical load shed; (c) Renewable power curtailed; (d) Reduction in operation cost.
Energies 12 00452 g016
Figure 17. Operation results with different shiftable load ratios: (a) Operation cost; (b) Non-critical load shed.
Energies 12 00452 g017
Figure 18. Operation results with different shiftable load ratios: (a) Energy transfer; (b) CDG Power; (c) Renewable power curtailed.
Energies 12 00452 g018
Figure 19. Shifted load in microgrids with different shiftable load ratios.
Energies 12 00452 g019
Figure 20. Operation results with different renewable power levels: (a) Operation cost; (b) Non-critical load shed.
Energies 12 00452 g020
Figure 21. Operation results with different renewable power levels: (a) Energy transfer; (b) CDG Power; (c) Renewable power curtailed.
Energies 12 00452 g021
Figure 22. Shifted load in microgrids with different renewable power levels.
Energies 12 00452 g022
Figure 23. Operation results with different load absorption levels: (a) Operation cost; (b) Non-critical load shed.
Energies 12 00452 g023
Figure 24. Operation results with different load absorption levels: (a) Energy transfer; (b) CDG Power; (c) Renewable power curtailed.
Energies 12 00452 g024
Figure 25. Shifted load in microgrids with different load absorption levels.
Energies 12 00452 g025
Table 1. Parameters of controllable distributed generators (CDGs) in the test network.
ParameterUnitMicrogrid 1Microgrid 2Microgrid 3
AC CDGDC CDGAC CDGDC CDGAC CDGDC CDG
MaximumkW555055505040
MinimumkW000000
Generation CostKRW/kWh100106116103104108
Table 2. Parameters of battery energy storage system (BESS) units in the test network.
ParameterUnitMicrogrid 1Microgrid 2Microgrid 3
AC SideDC SideAC SideDC SideAC SideDC Side
BESSCapacitykWh-5050-5050
Efficiency%-9897-9798
ConverterEfficiency%-9898-9898

