Thermodynamic Performance and Optimization Analysis of a Modified Organic Flash Cycle for the Recovery of Low-Grade Heat

Abstract
1. Introduction
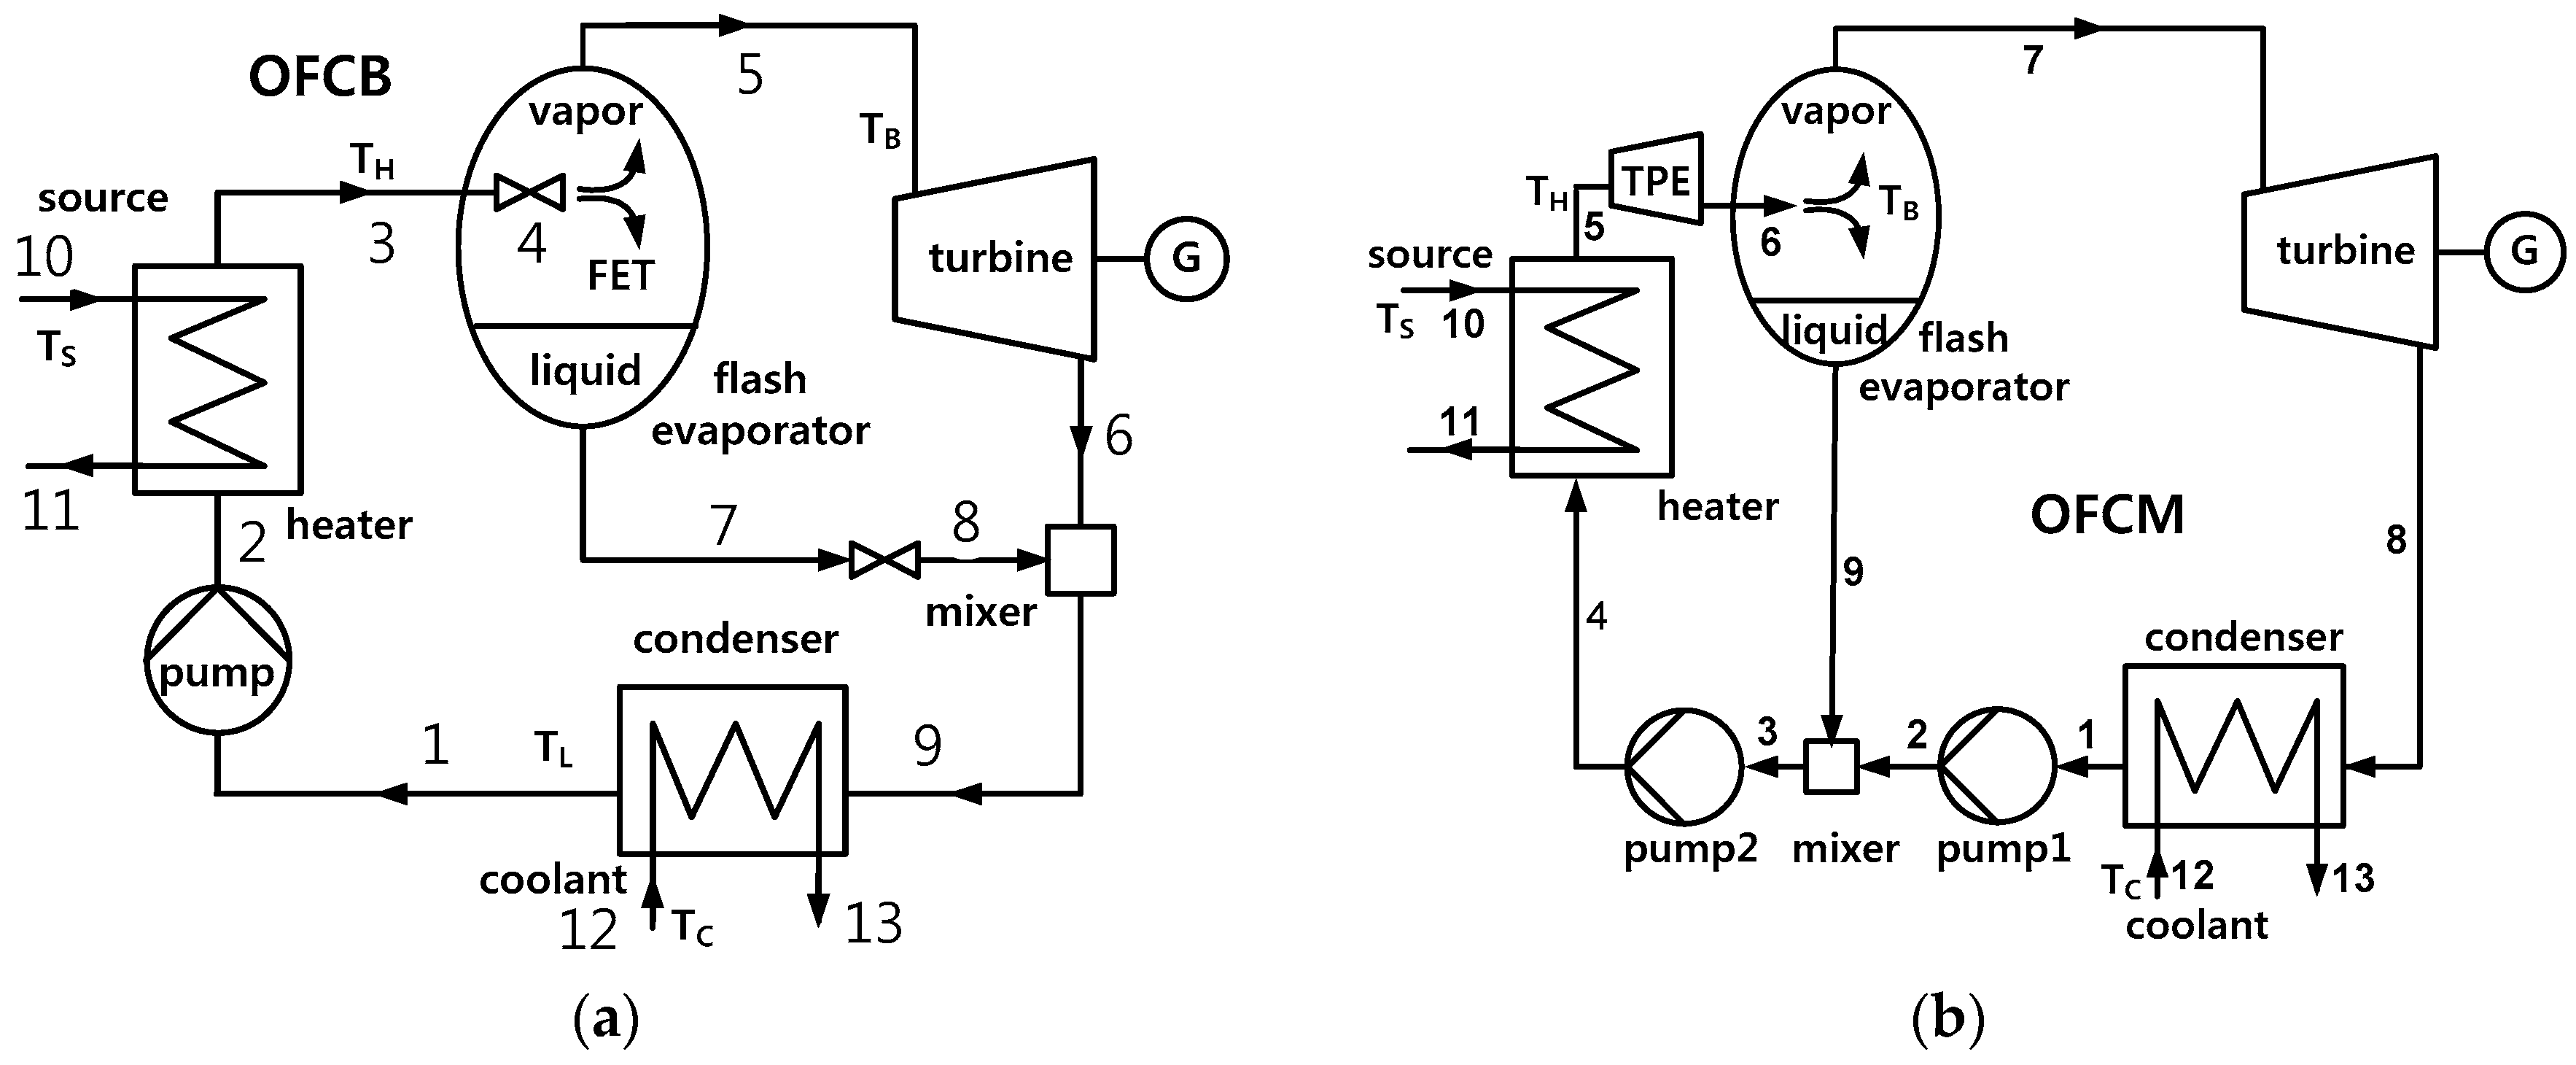
2. System Analysis
- 1)
- Pressure losses are neglected in heat exchangers and pipelines.
- 2)
- Heat losses are ignored in components.
- 3)
- Each of the pumps, turbine, and expander has a constant isentropic efficiency.
- 4)
- The working fluids leaving the heater, bottom of flash evaporator, and condenser are saturated liquids at temperatures TH, TF, and TL, respectively.
- 5)
- The working fluid that exits the mixer and enters pump 2 is liquid.
- 6)
- The pinch temperature difference is given as ΔTpp.
3. Results and Discussion
3.1. Effects of Flash Temperature
3.2. Effects of Source under Optimal Conditions of the Flash Temperature
4. Conclusions
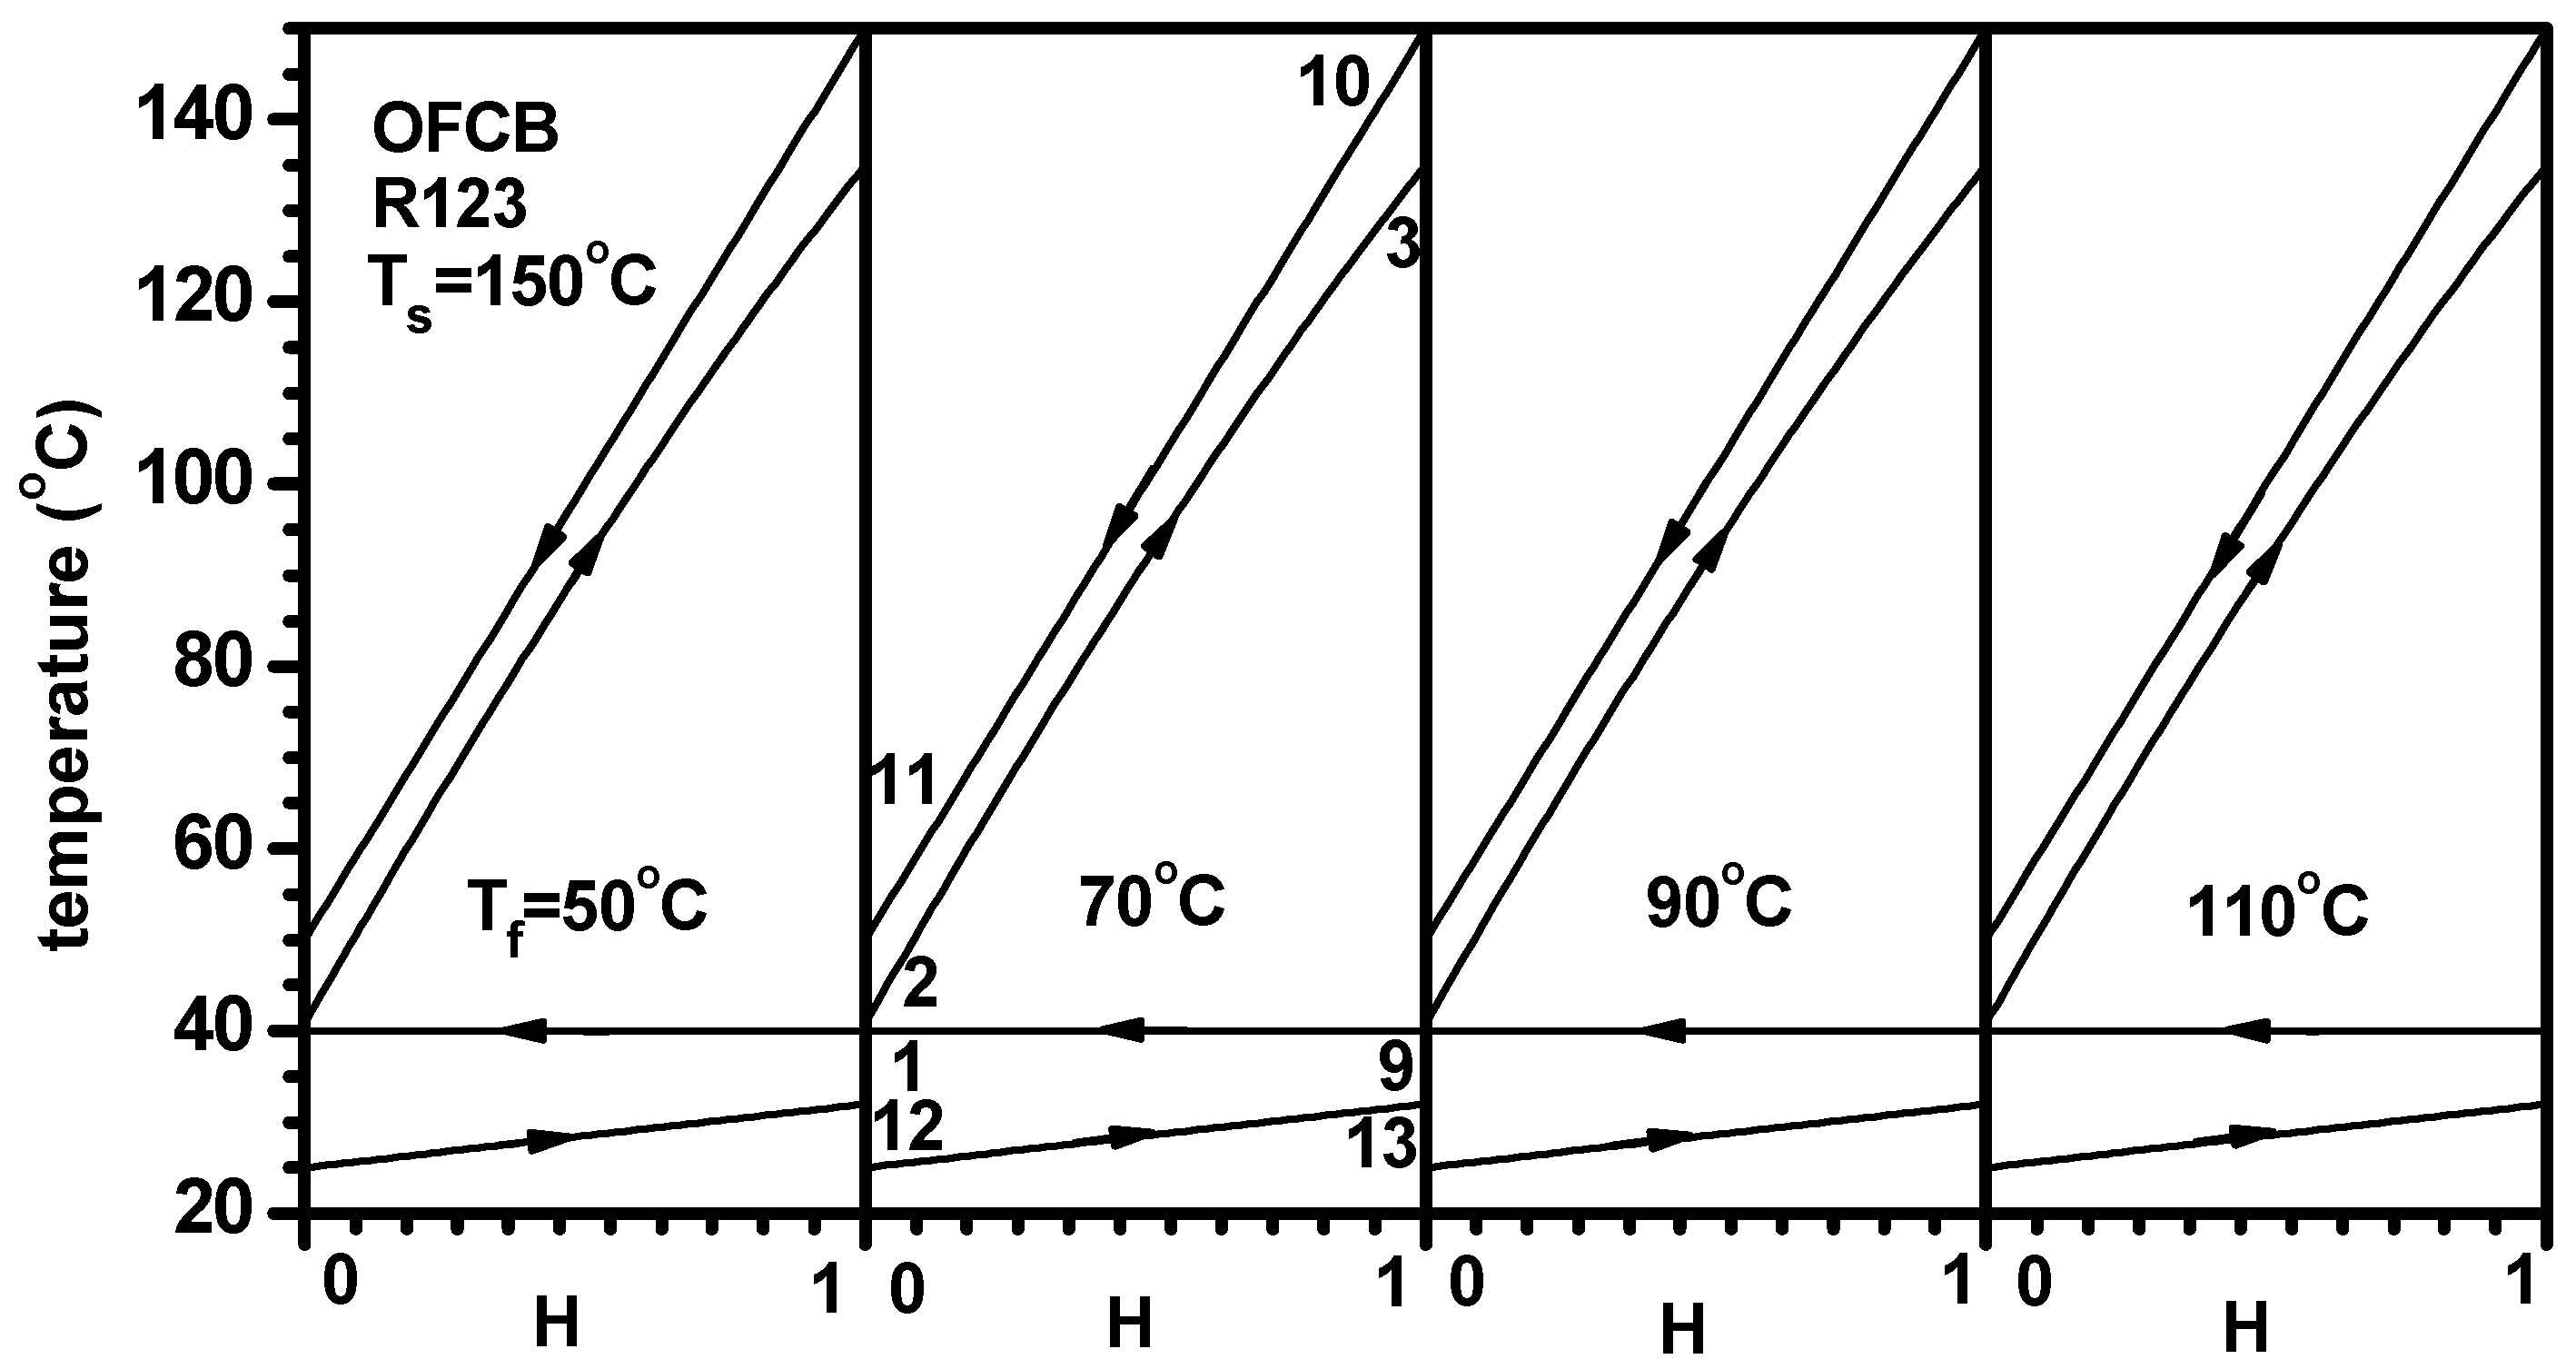
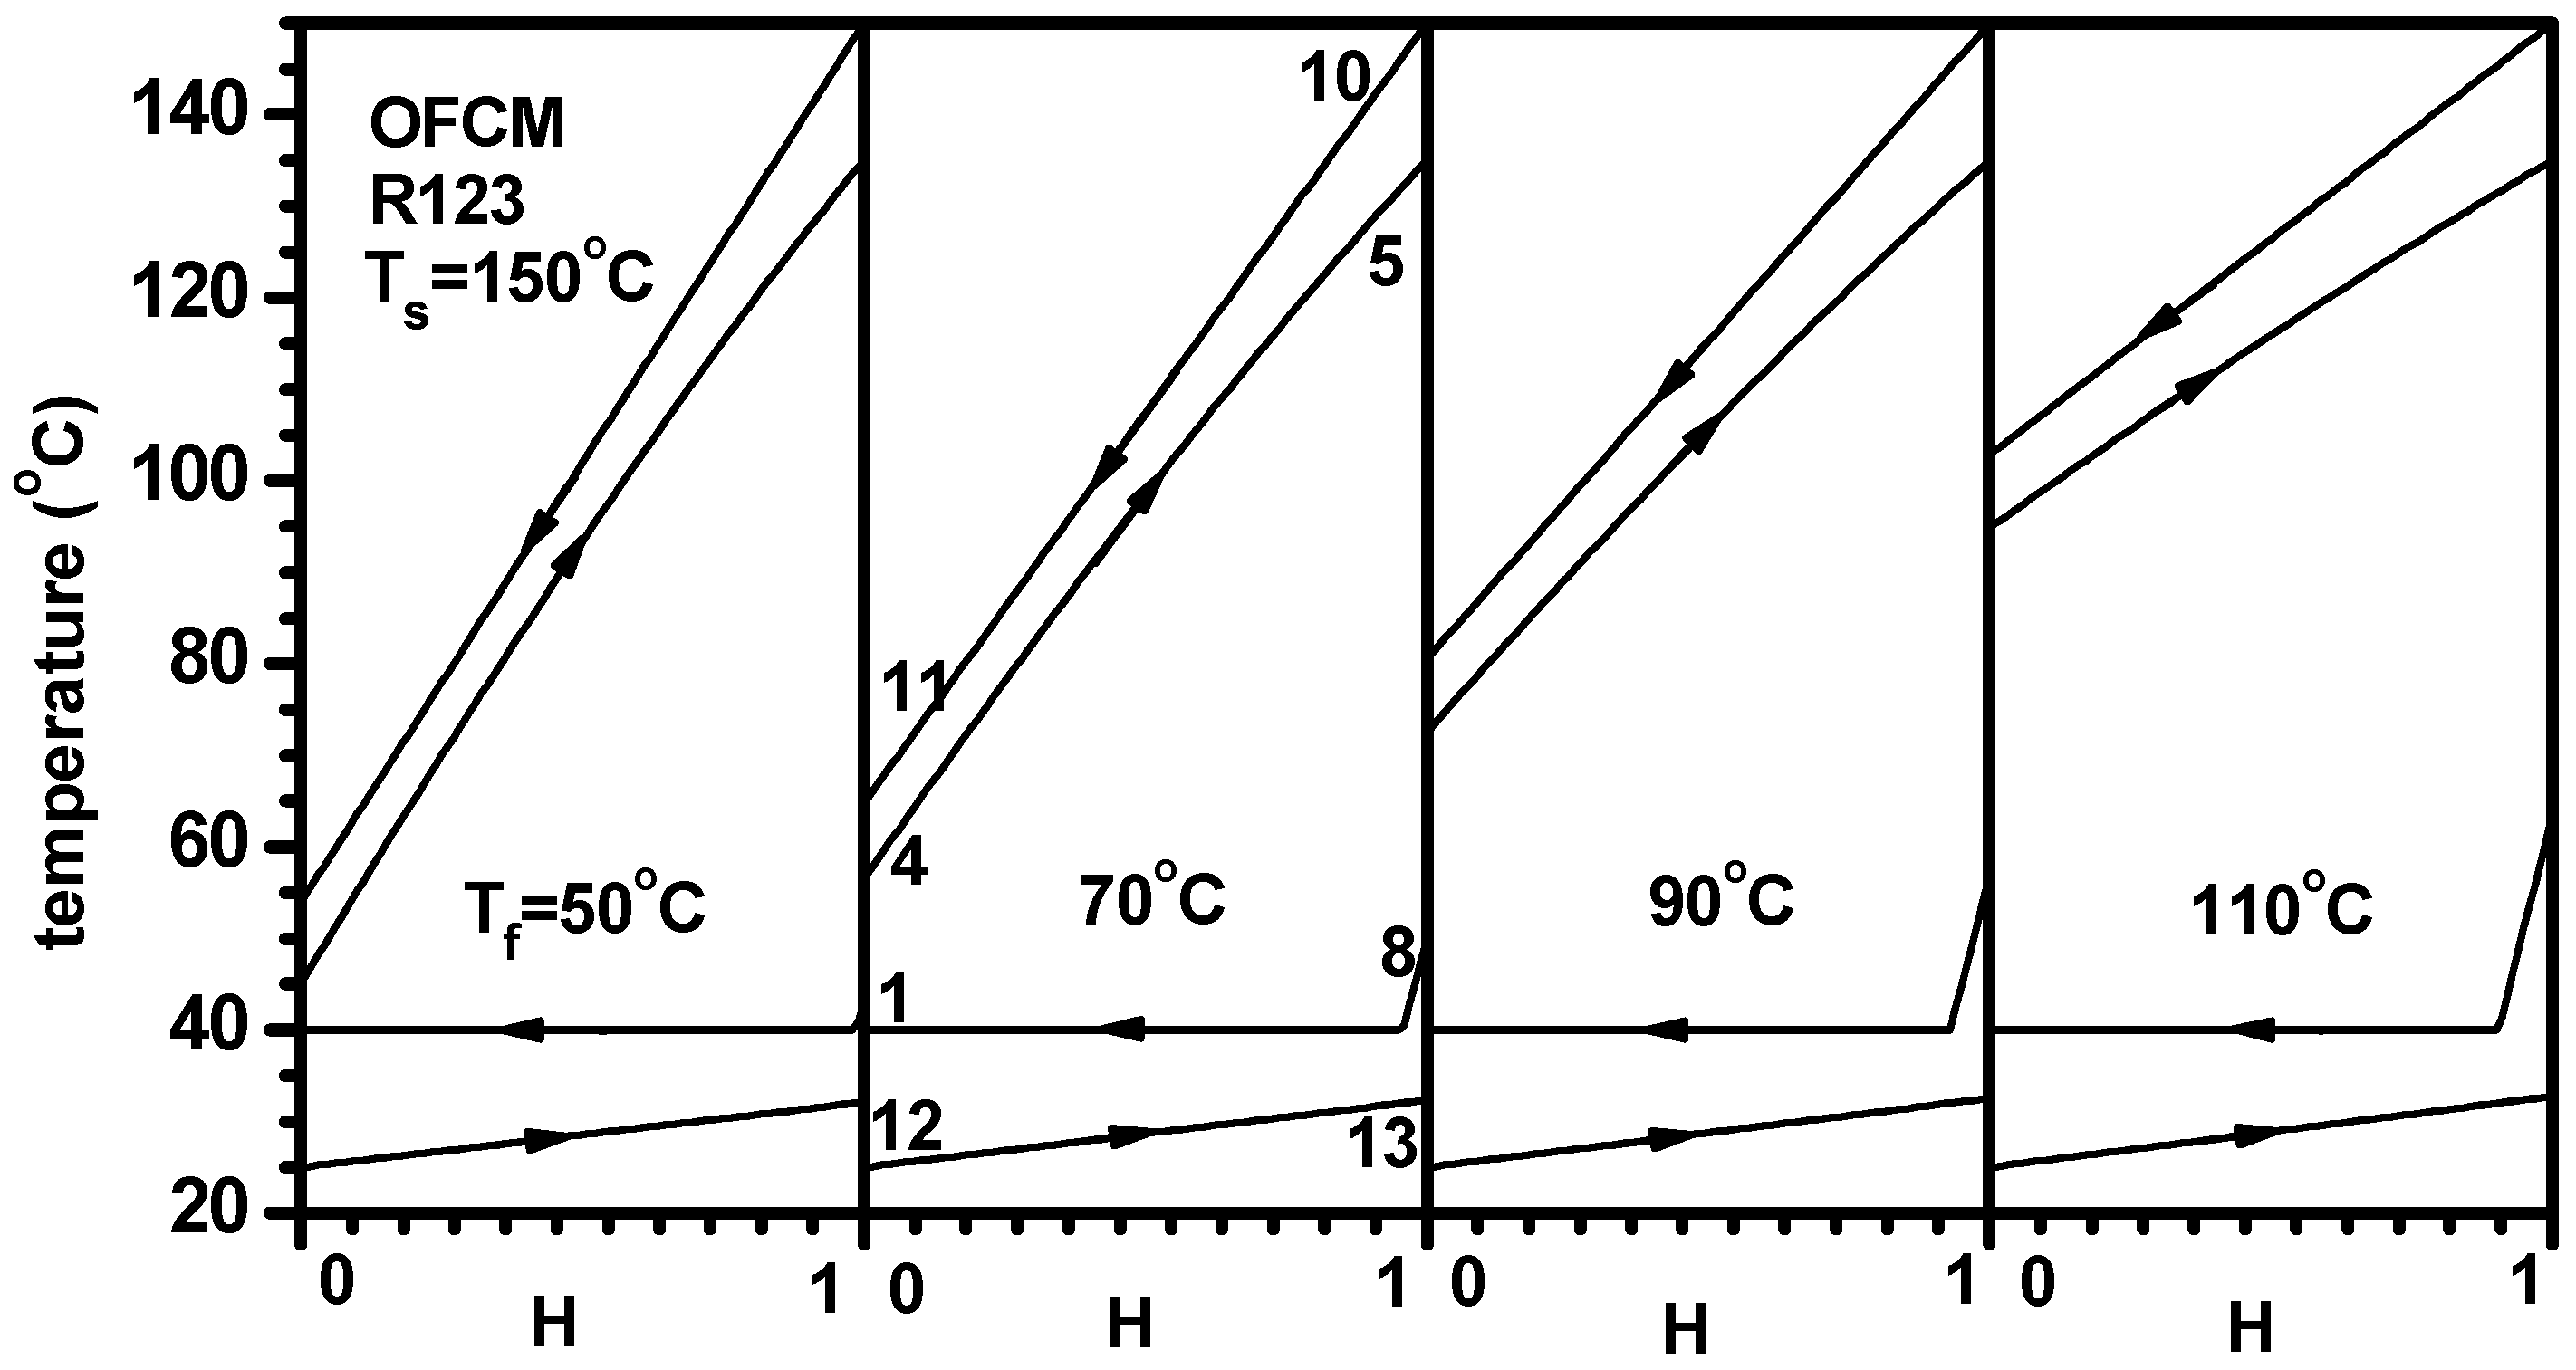
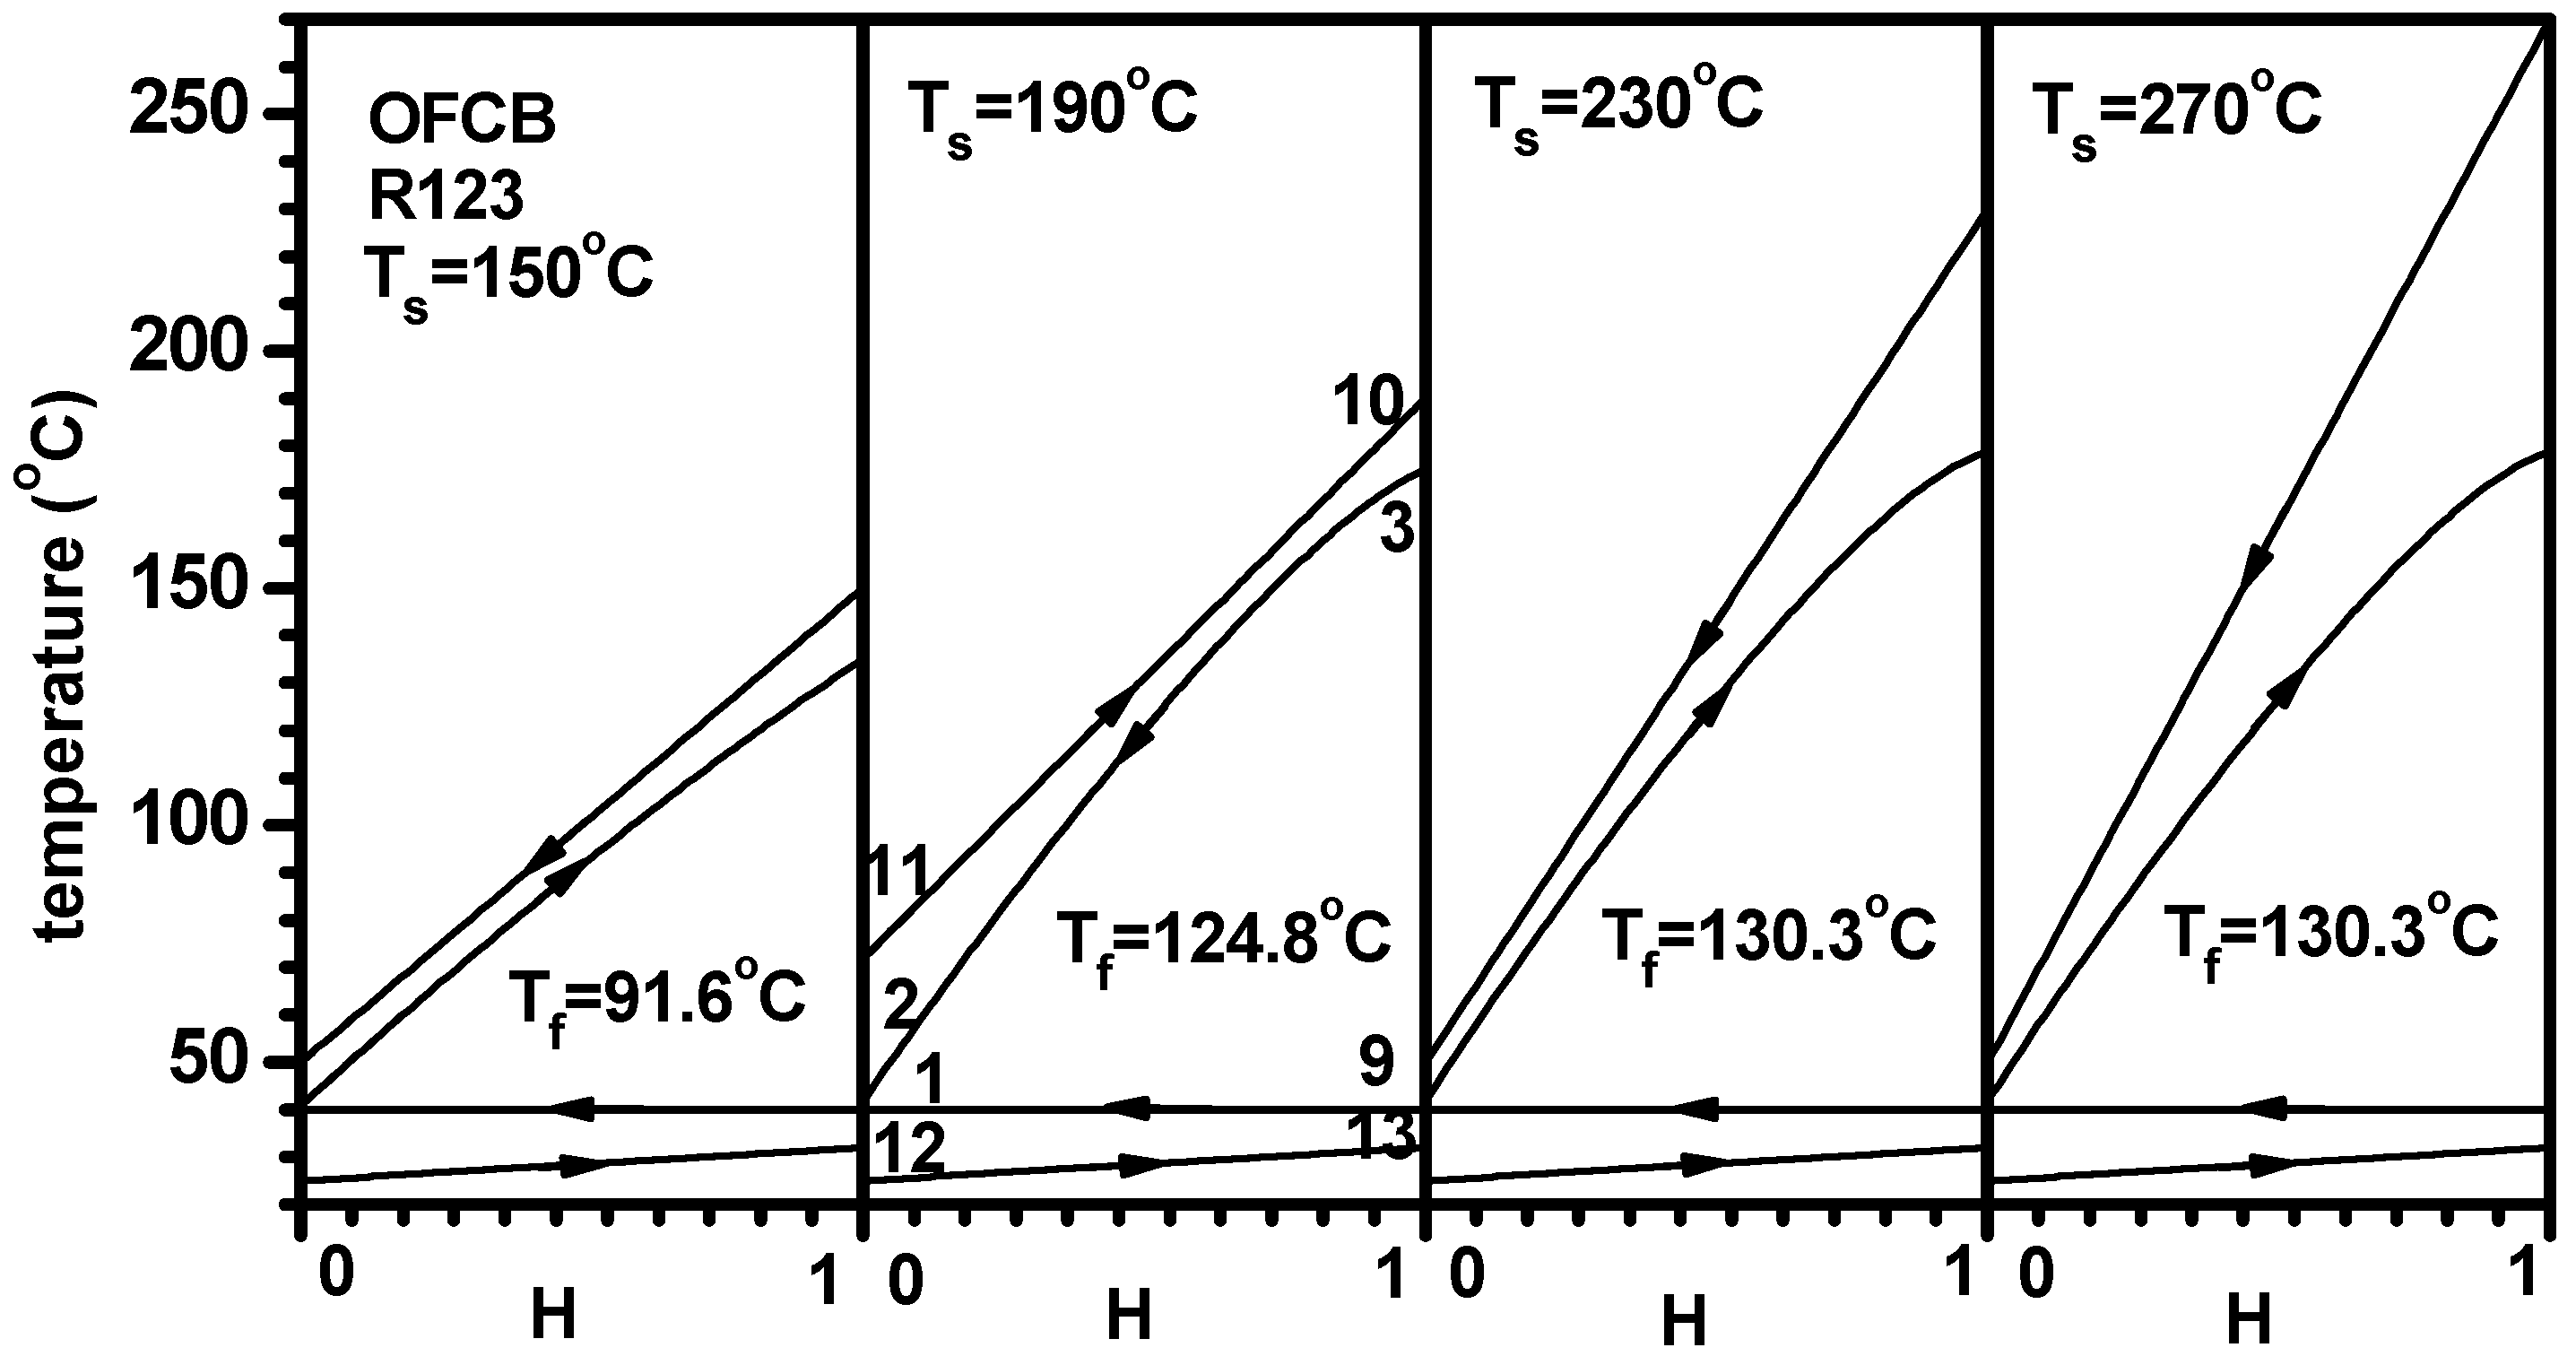
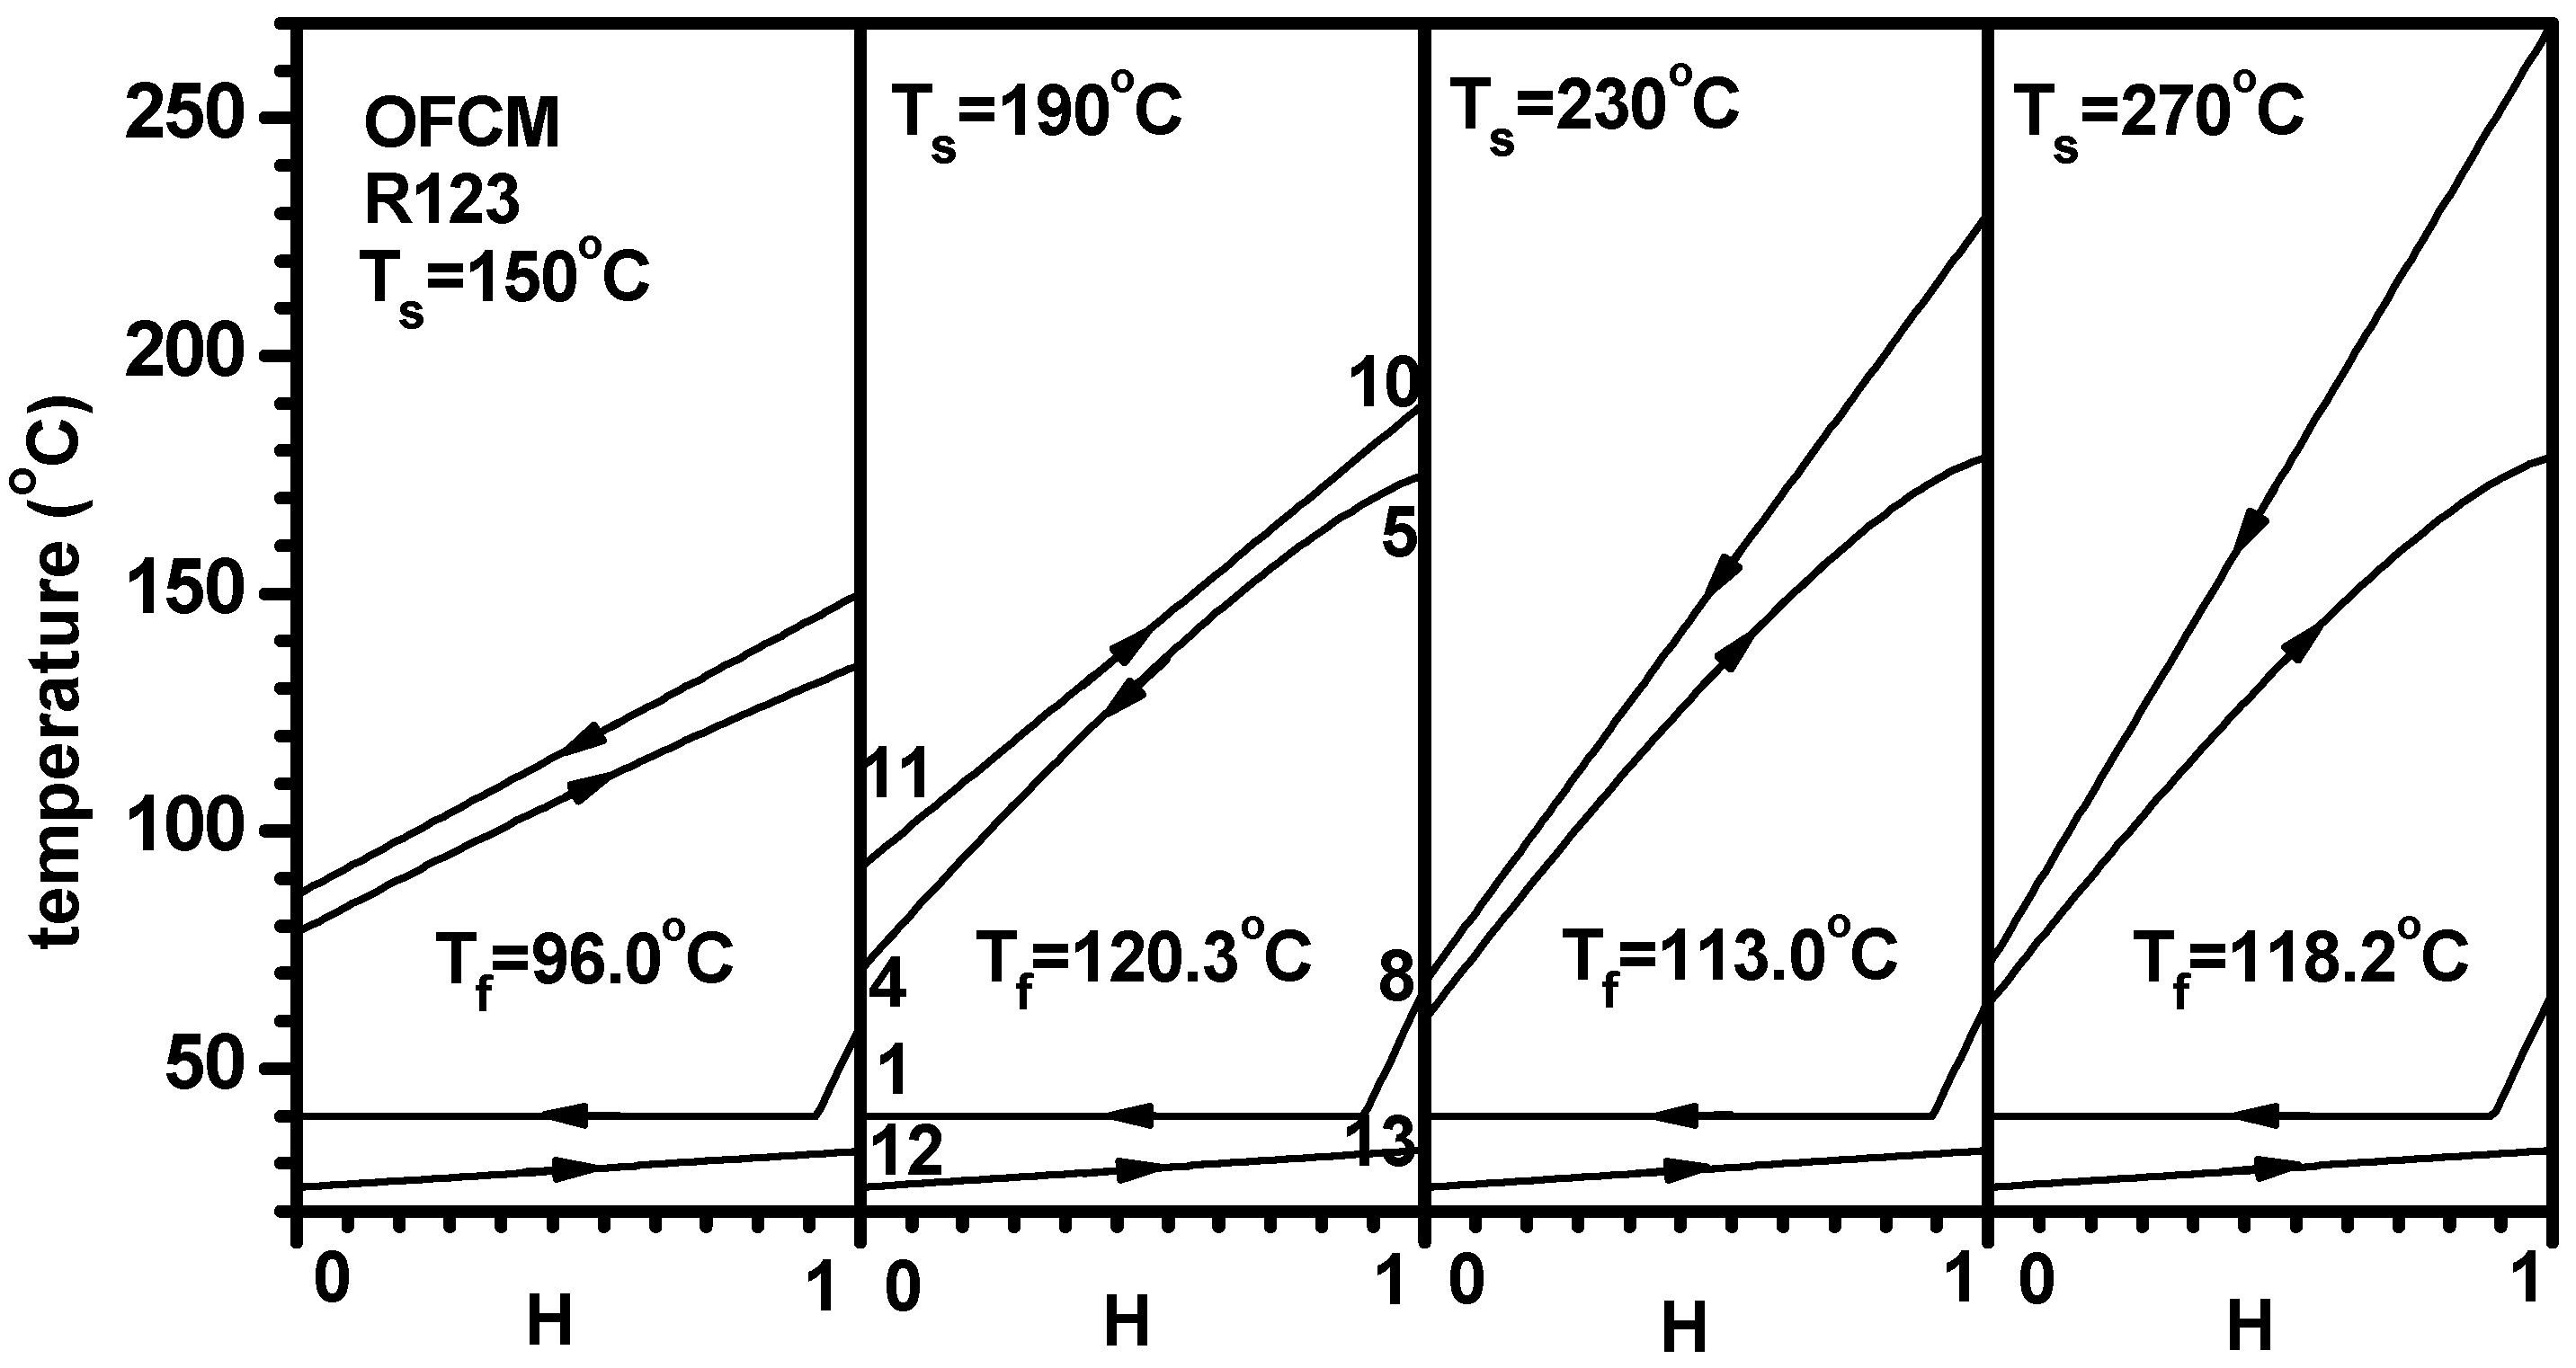
- The temperature distribution profiles of streams in the heater and condenser of the OFCB and OFCM were comparatively studied for different flash and source temperatures. In the OFCM, the nonlinear temperature profile had a great influence on the pinch-point position and thermodynamic performance of the system due to the elevated temperature of the working fluid entering the heater, especially when the source temperature was near the critical temperature of the working fluid.
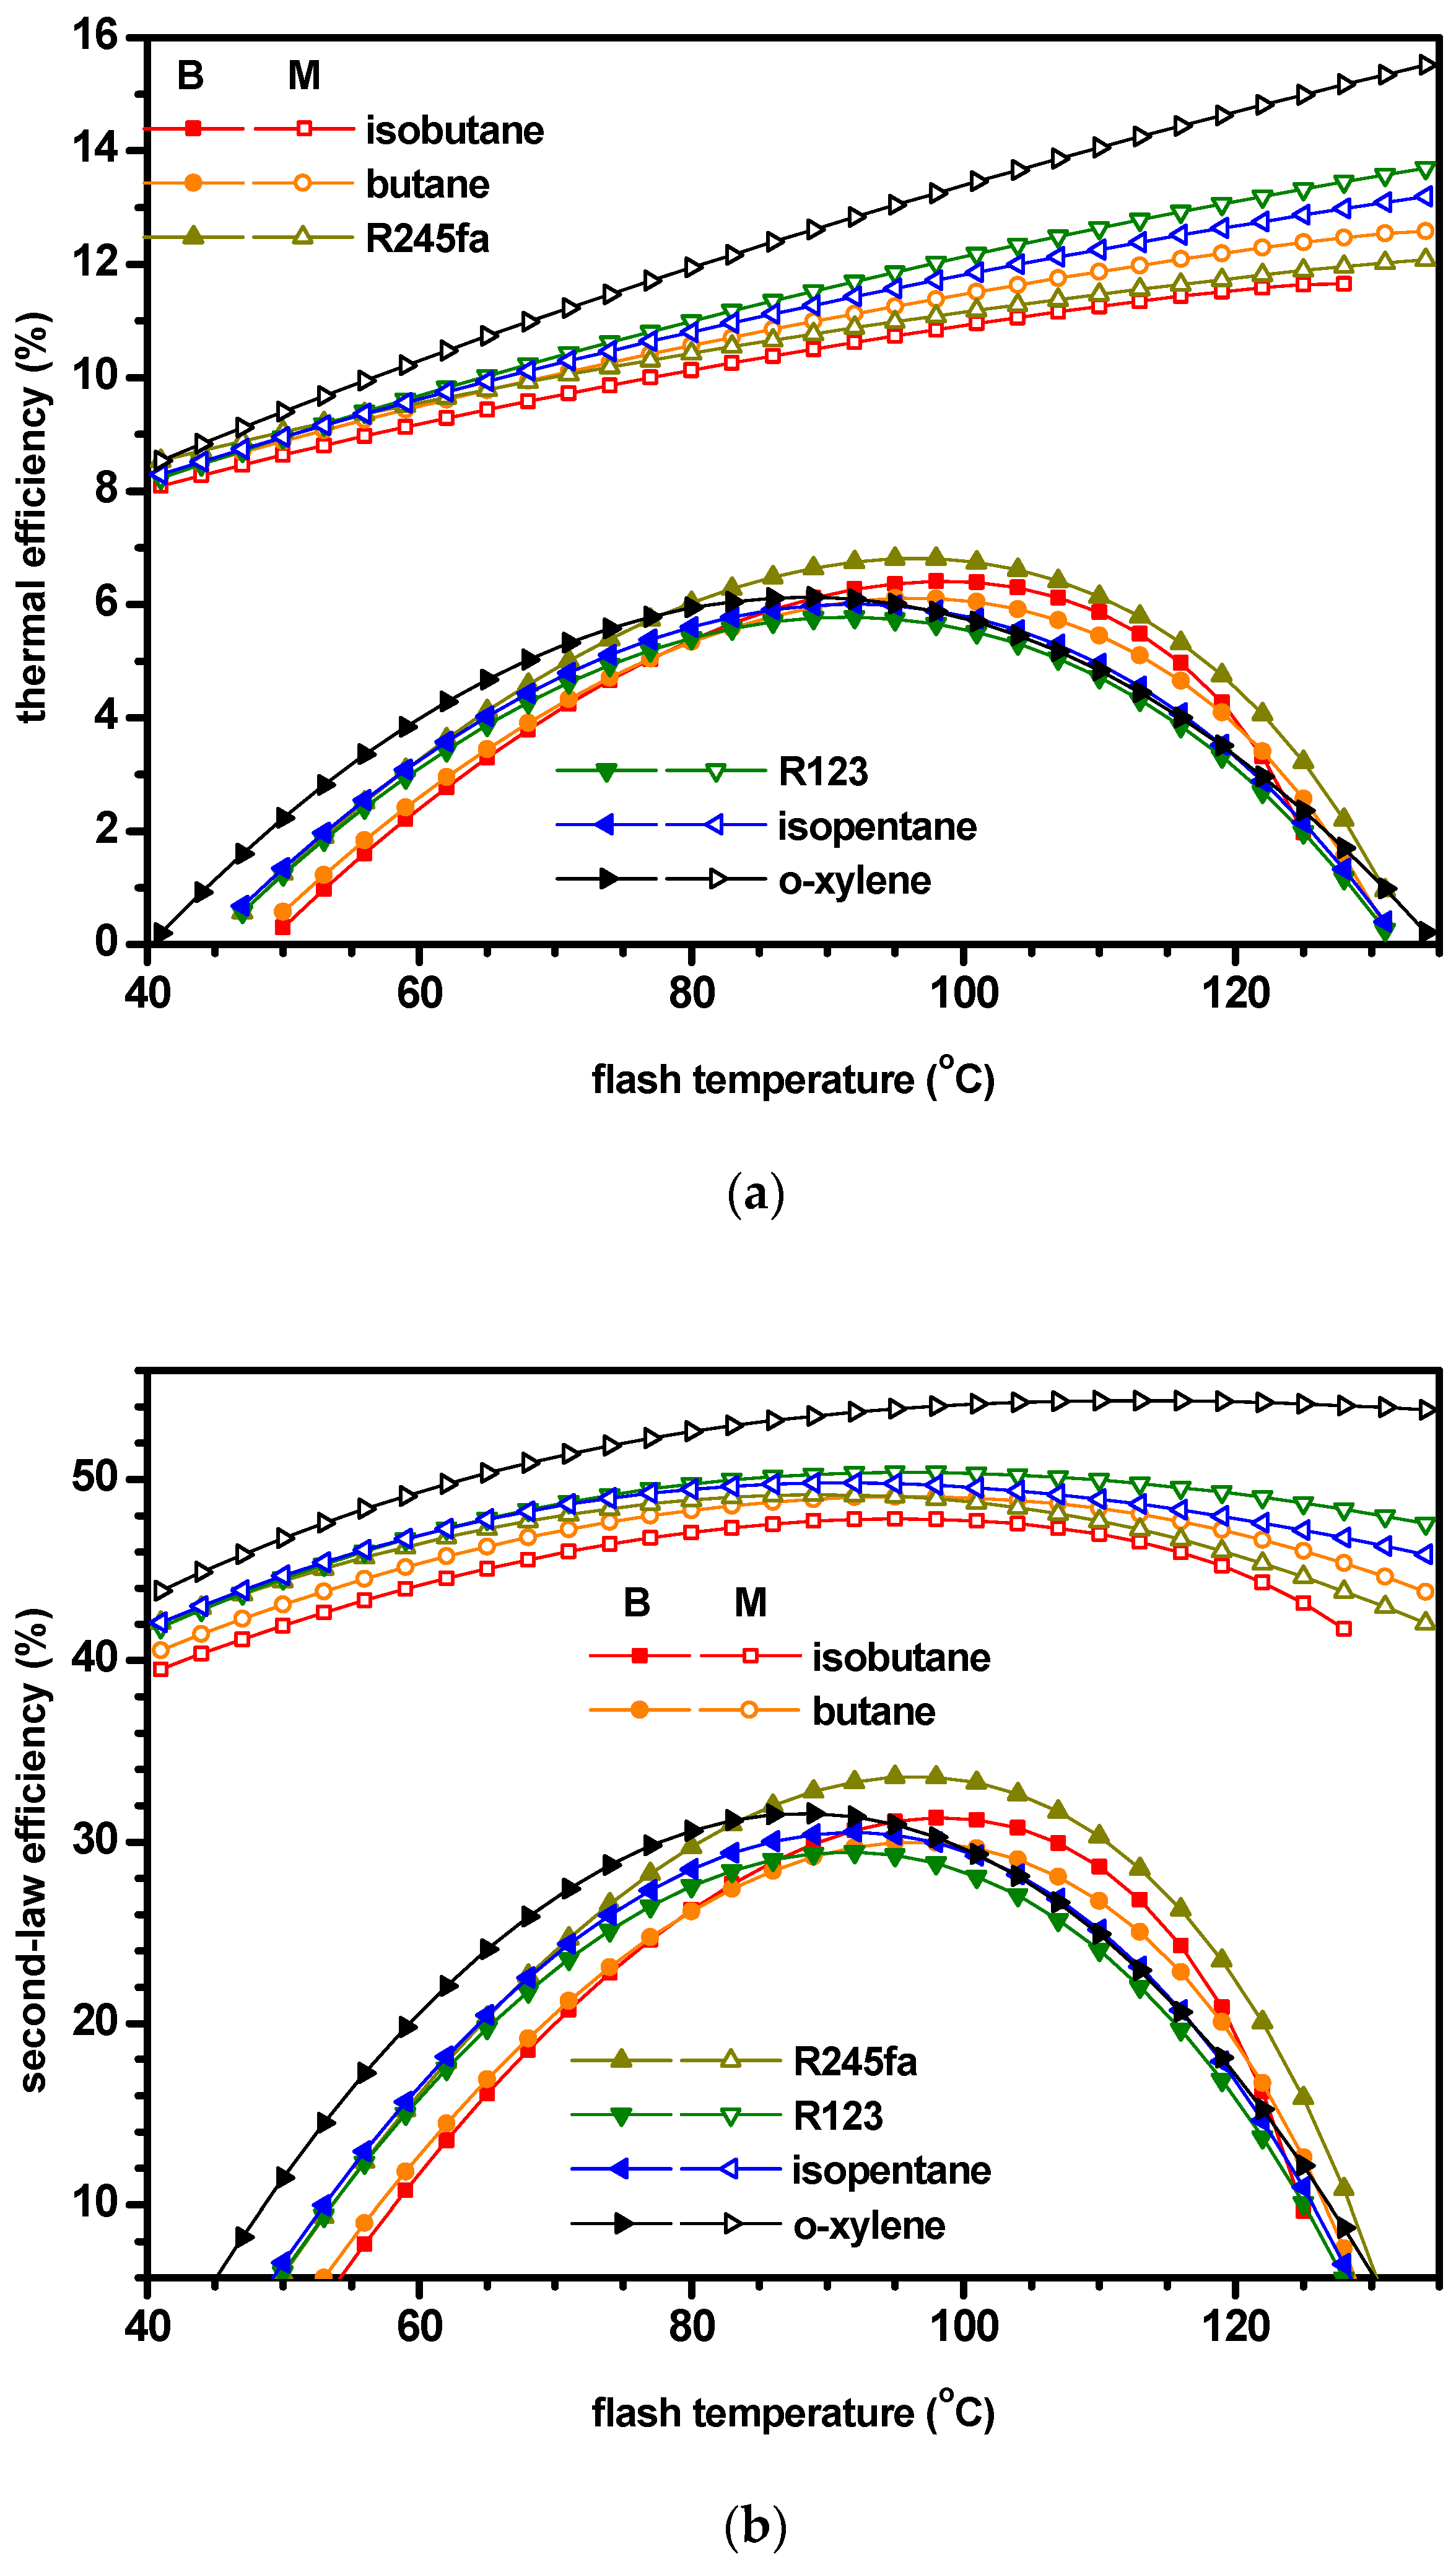
- The thermal efficiency had a maximum value with respect to the flash temperature in the OFCB, but simply increased with flash temperature in the OFCM. The net power and the second-law efficiency had a maximum value with respect to the flash temperature in both the OFCB and OFCM. For a specified flash temperature, all the net power, thermal, and second-law efficiencies of the OFCM were higher than those of the OFCB.
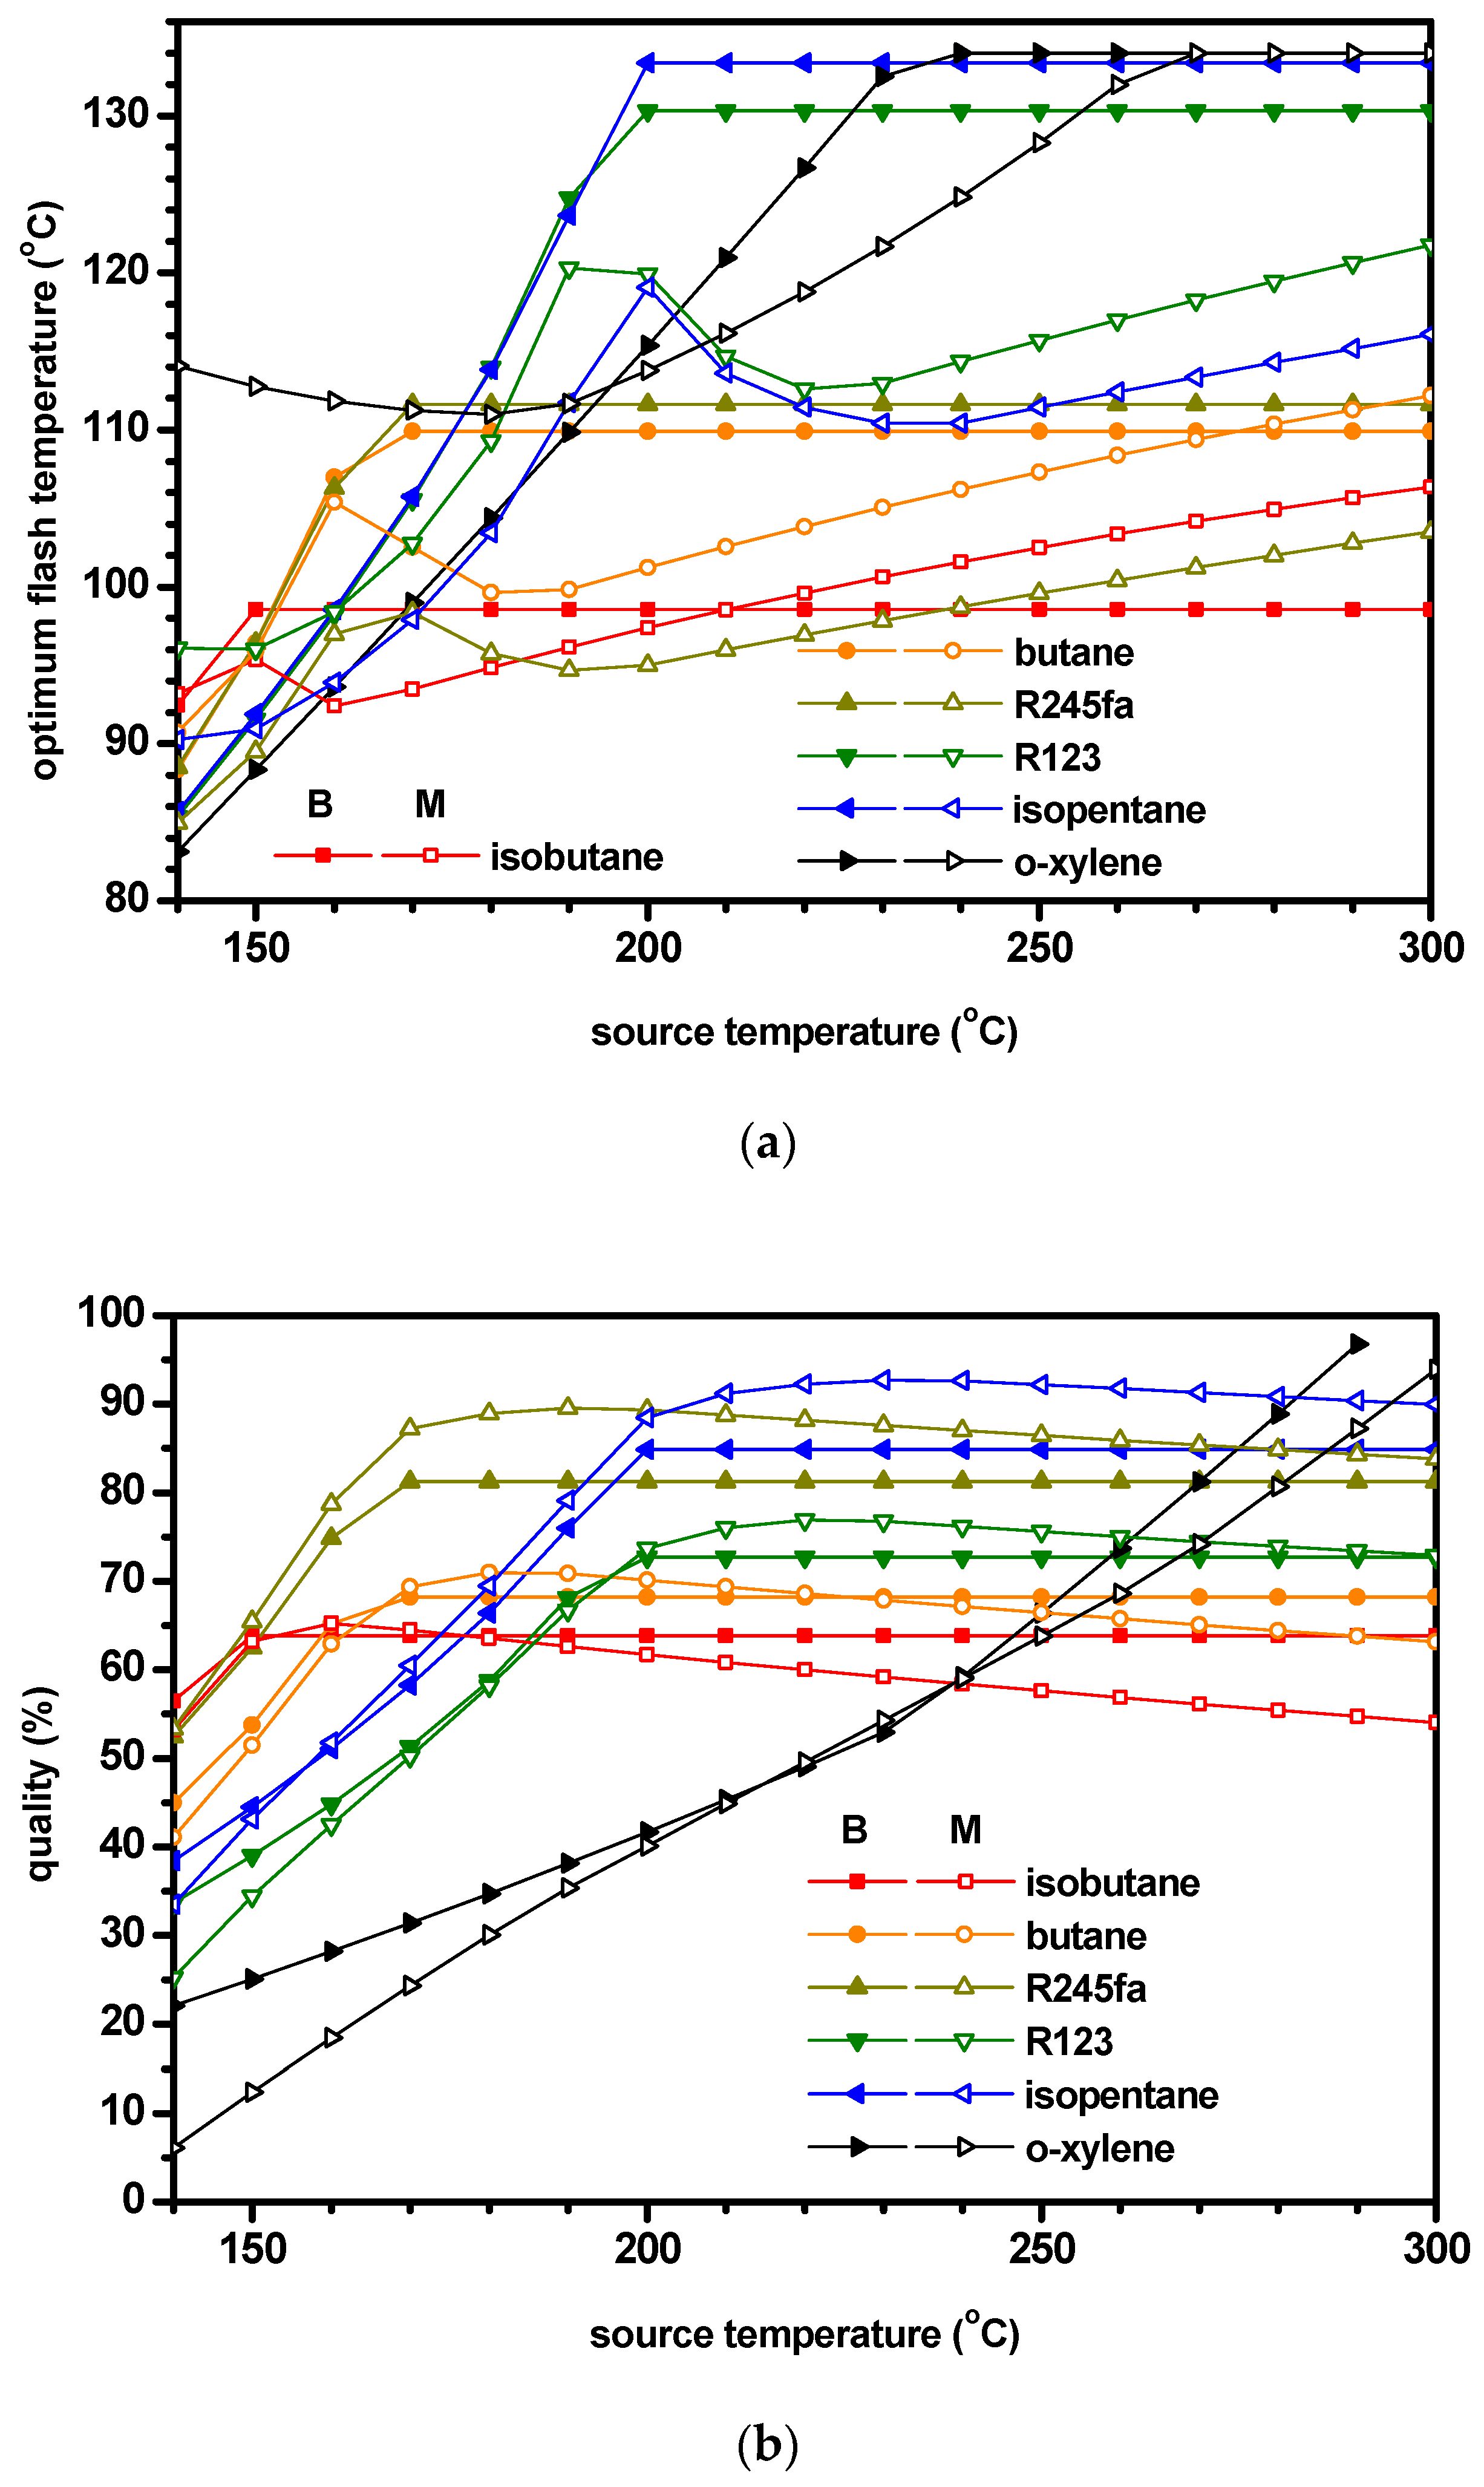
- Thermodynamic performances were investigated for source temperatures from 140 °C to 300 °C under the optimal conditions of the flash temperature for the maximum second-law efficiency. The optimum flash temperature first increased with an increase in the source temperature and then remained constant in the OFCB, while showing complex behavior near the critical point of the working fluid in the OFCM.
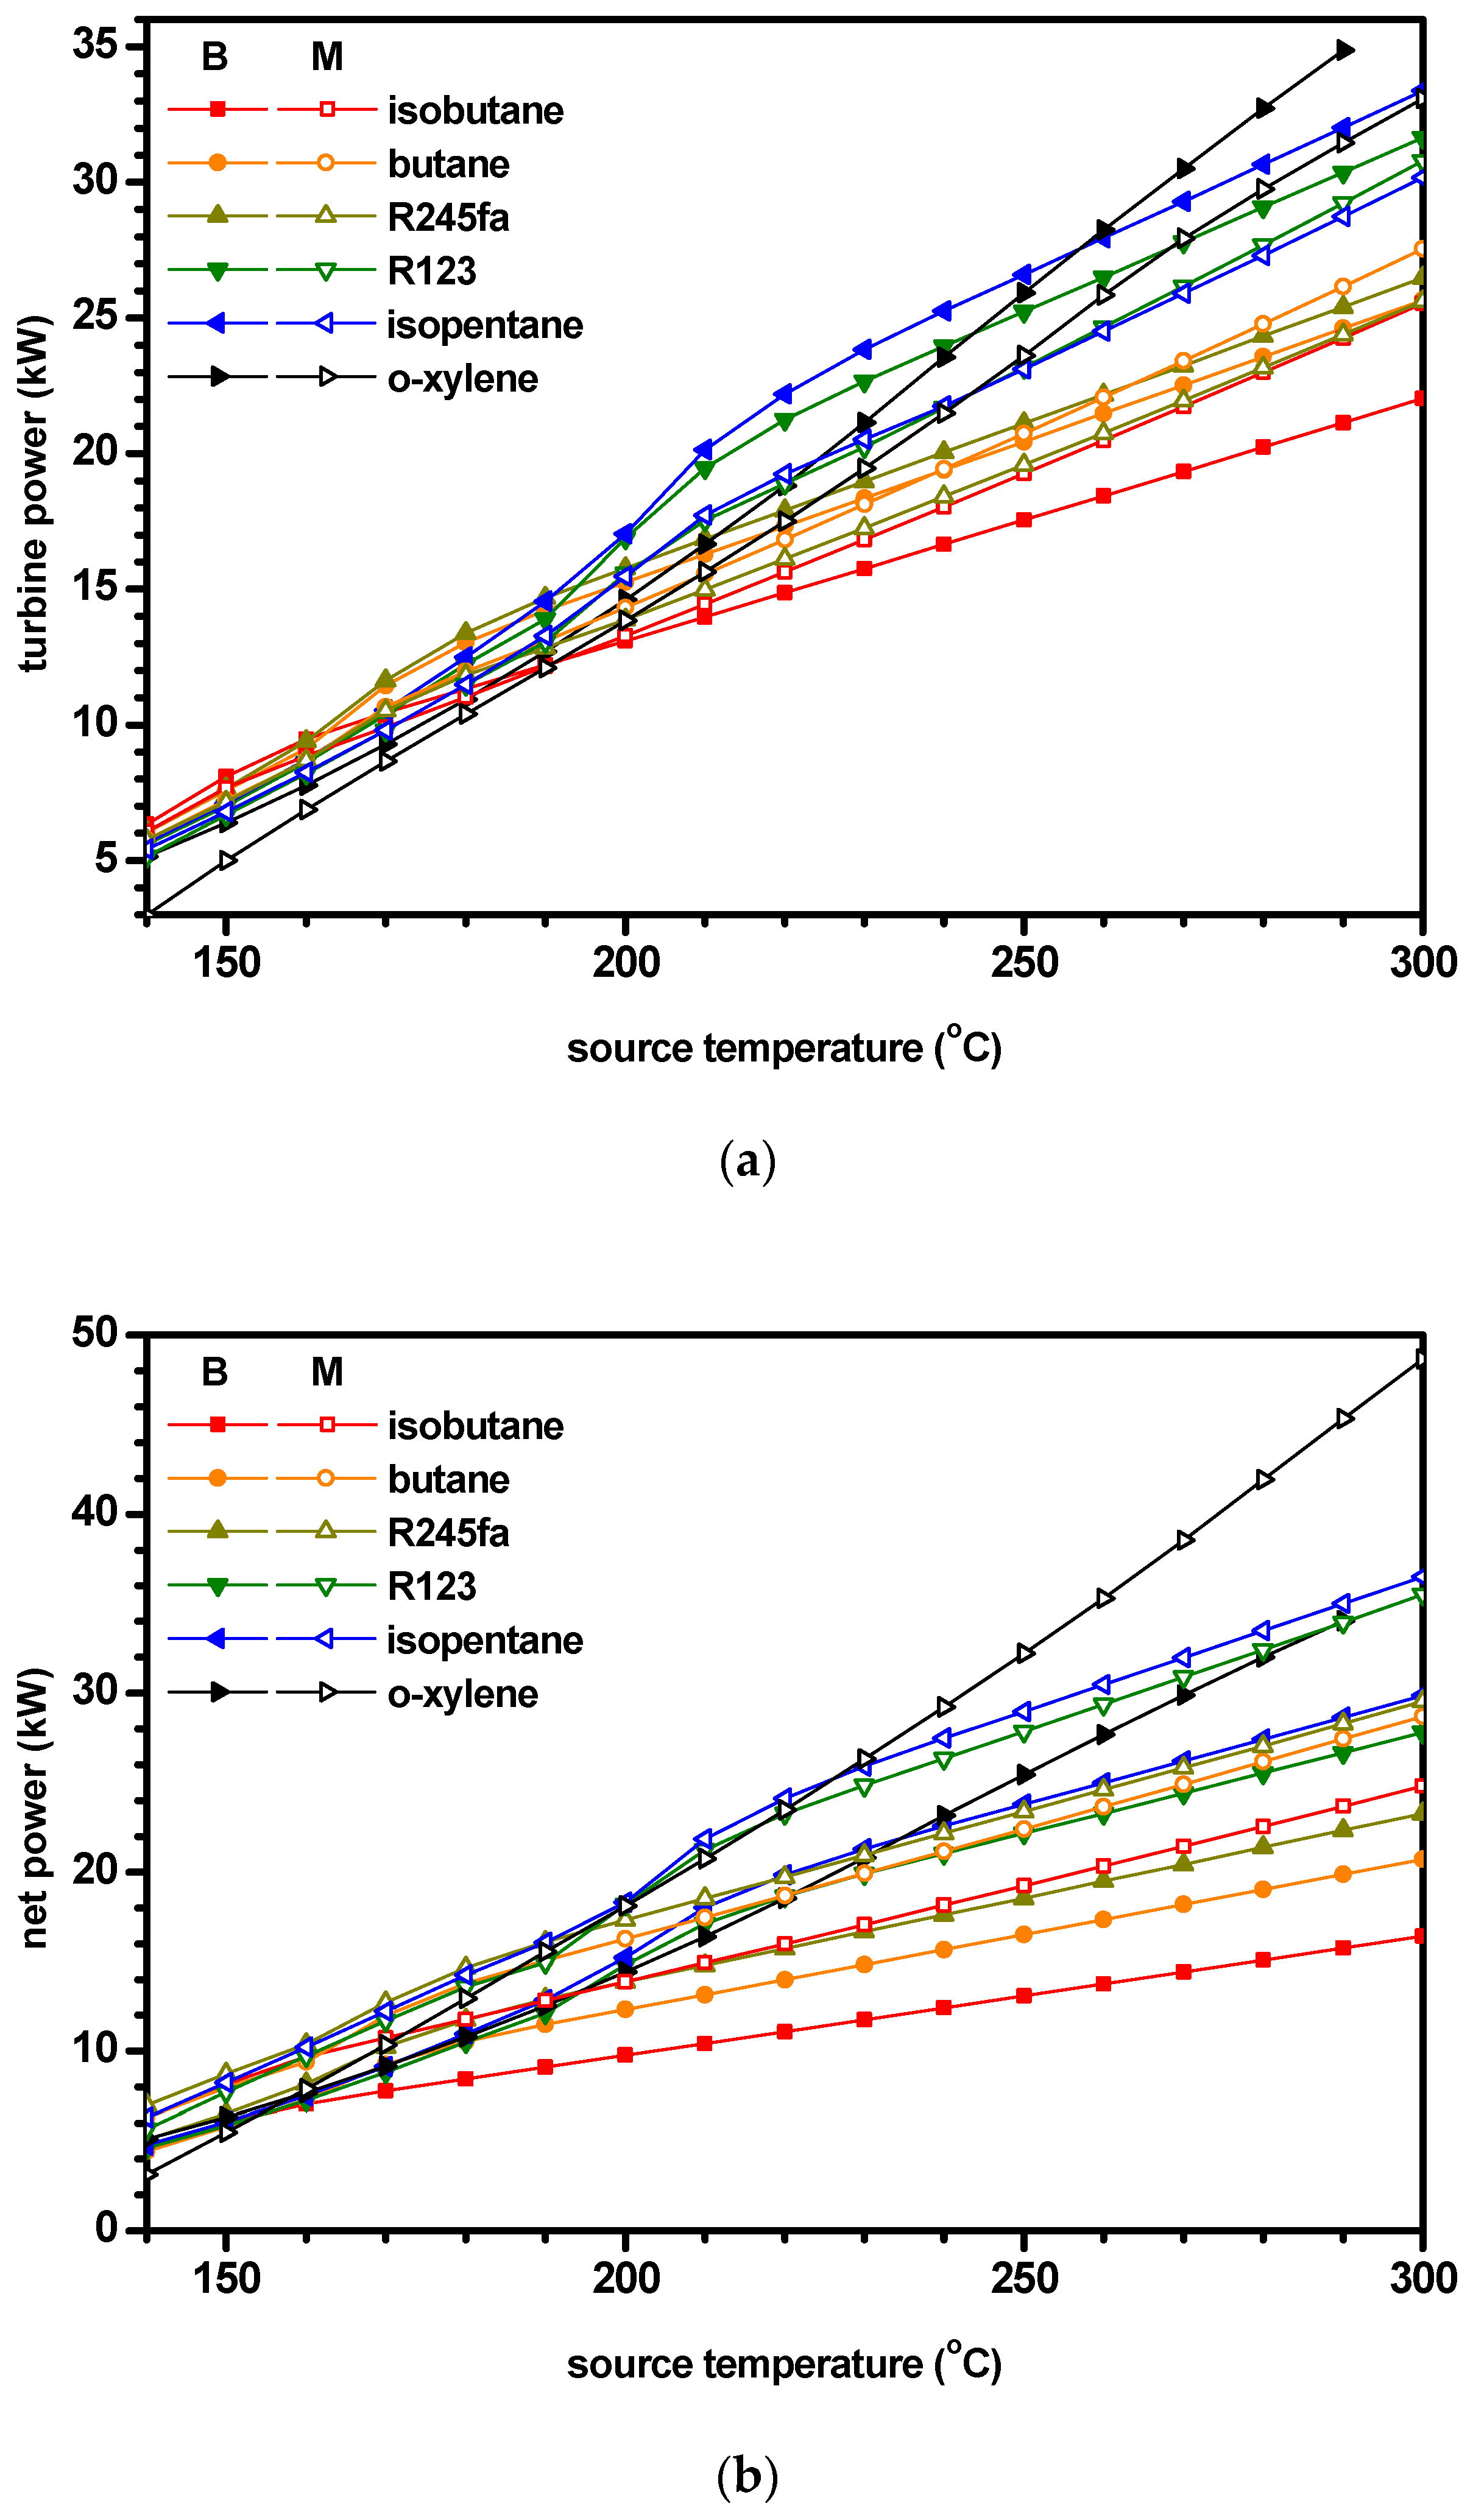
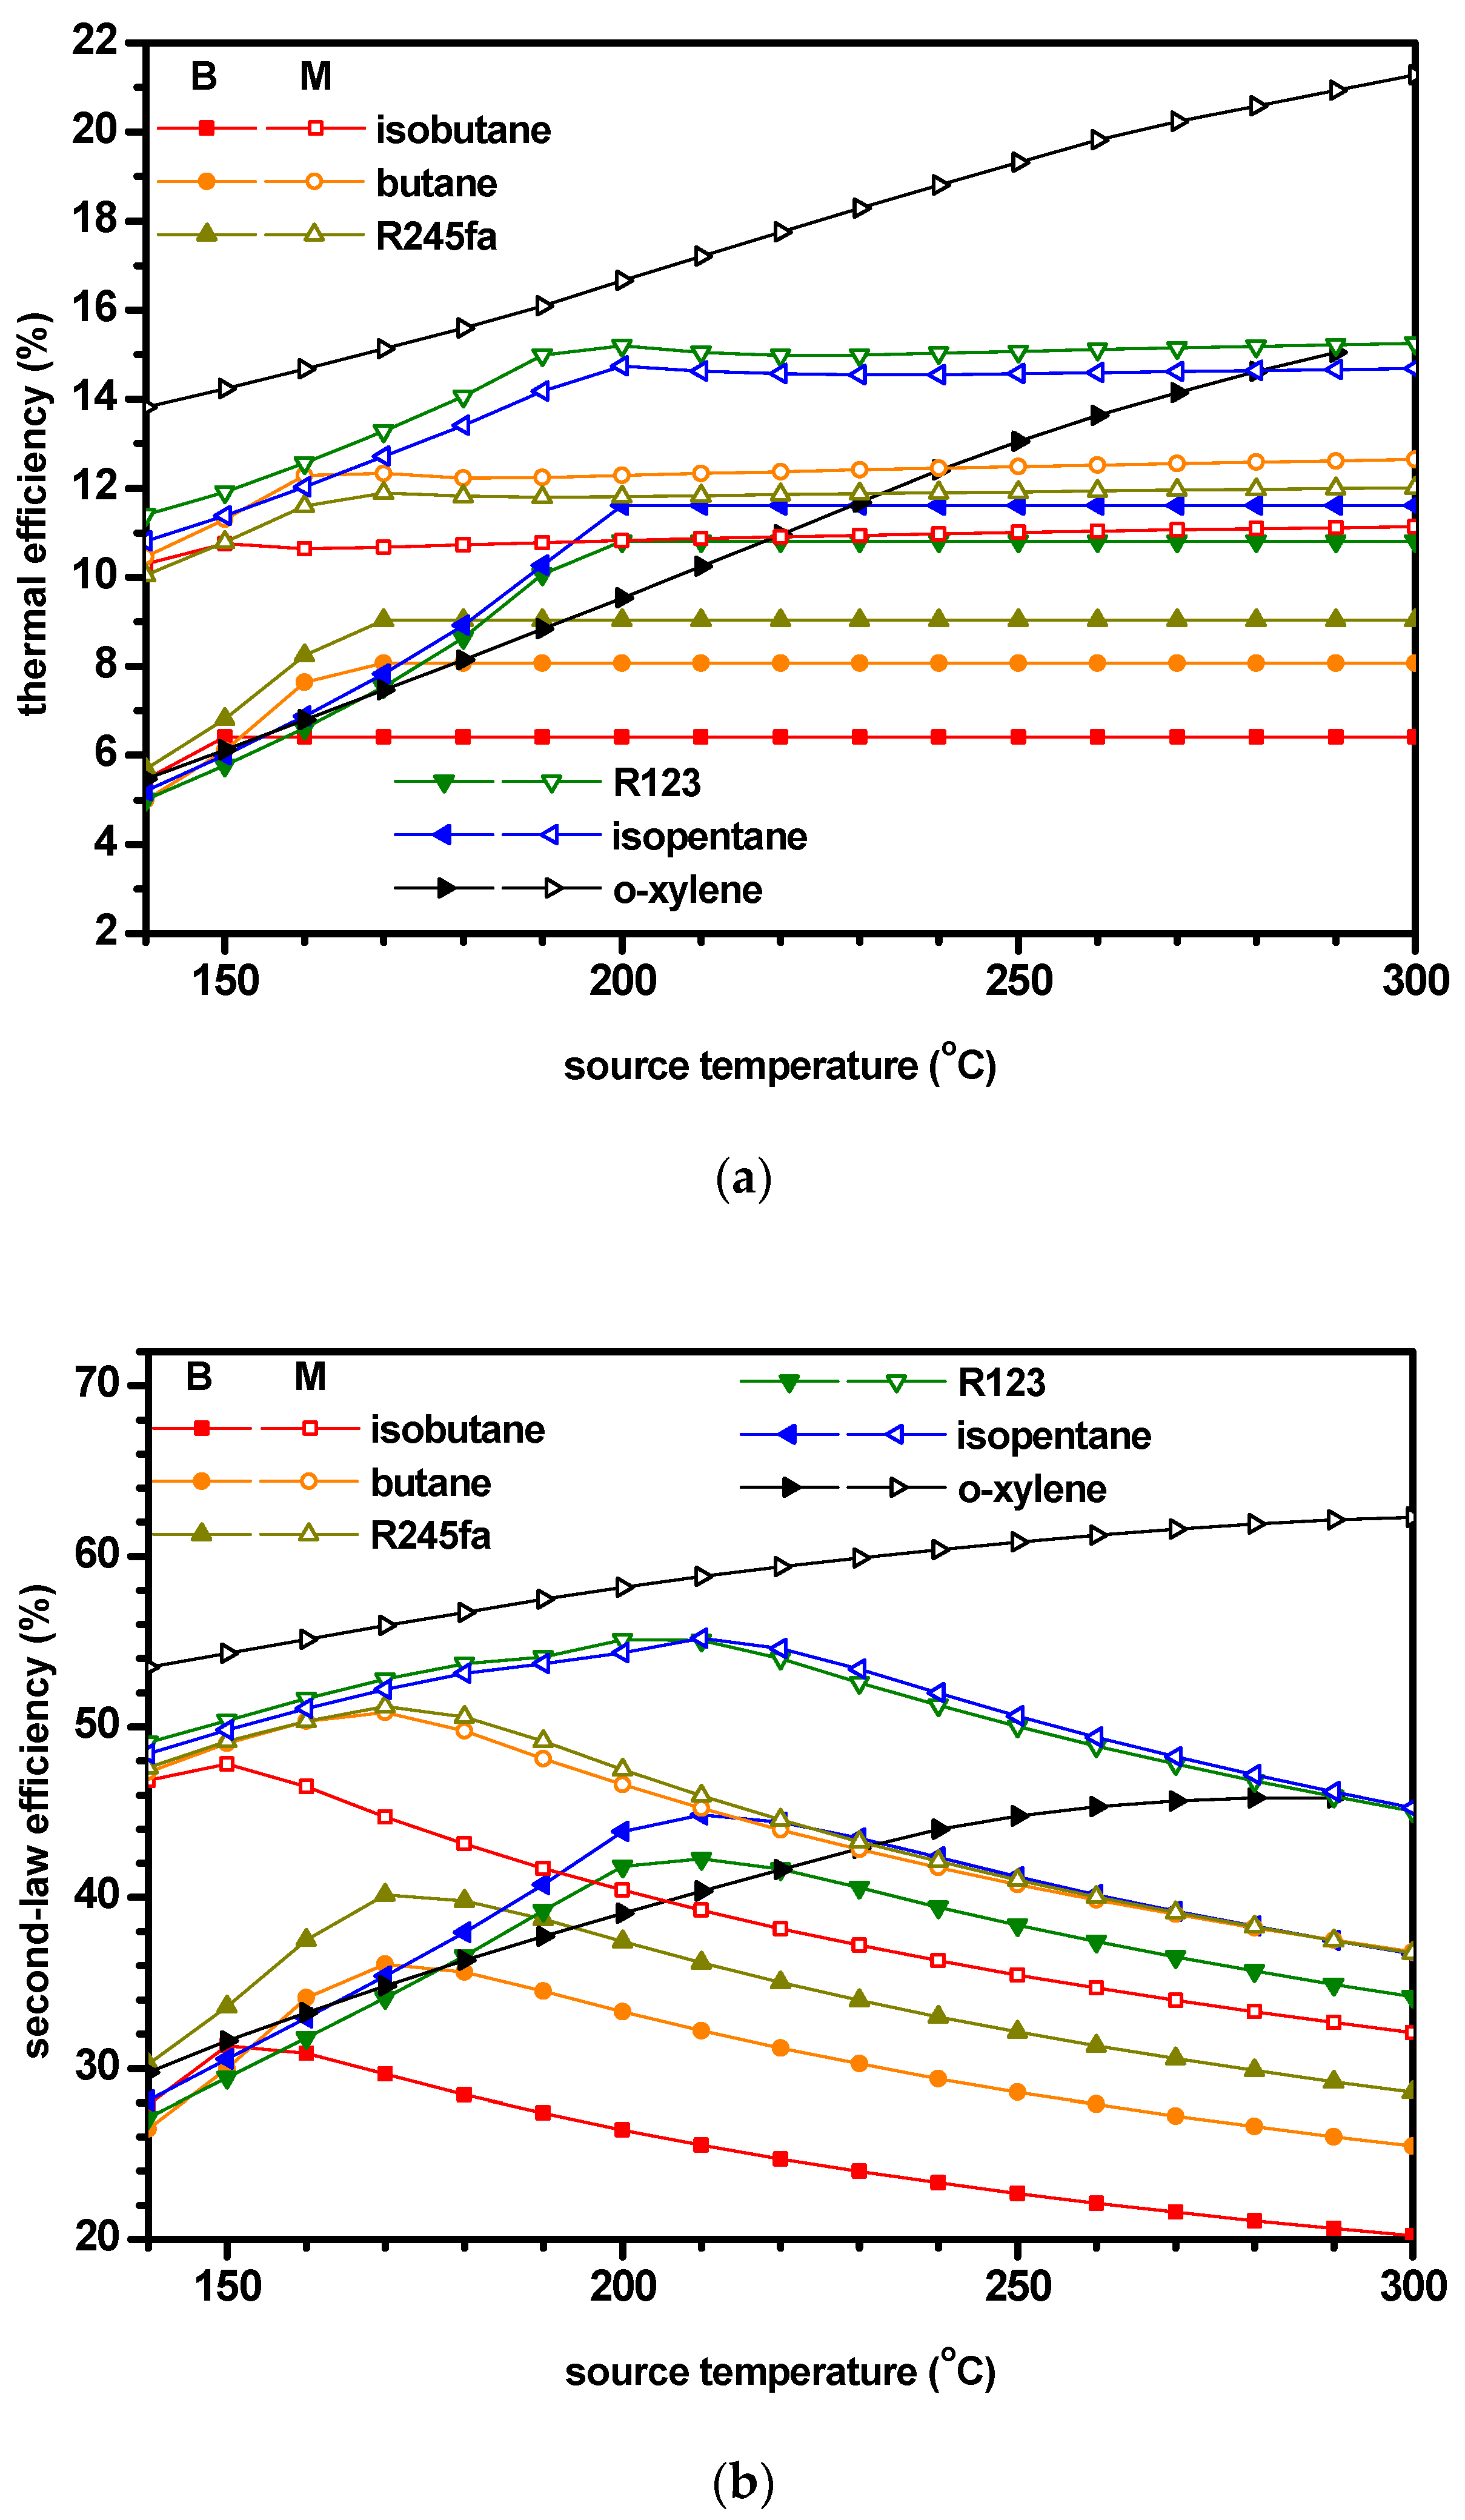
- The net power production of the system increased with source temperature in both the OFCB and OFCM, and the net power in the OFCM was greater than that in the OFCB, due to power generation by TPE. The thermal and second-law efficiencies of the OFCM were superior to the OFCB, mainly due to regeneration.
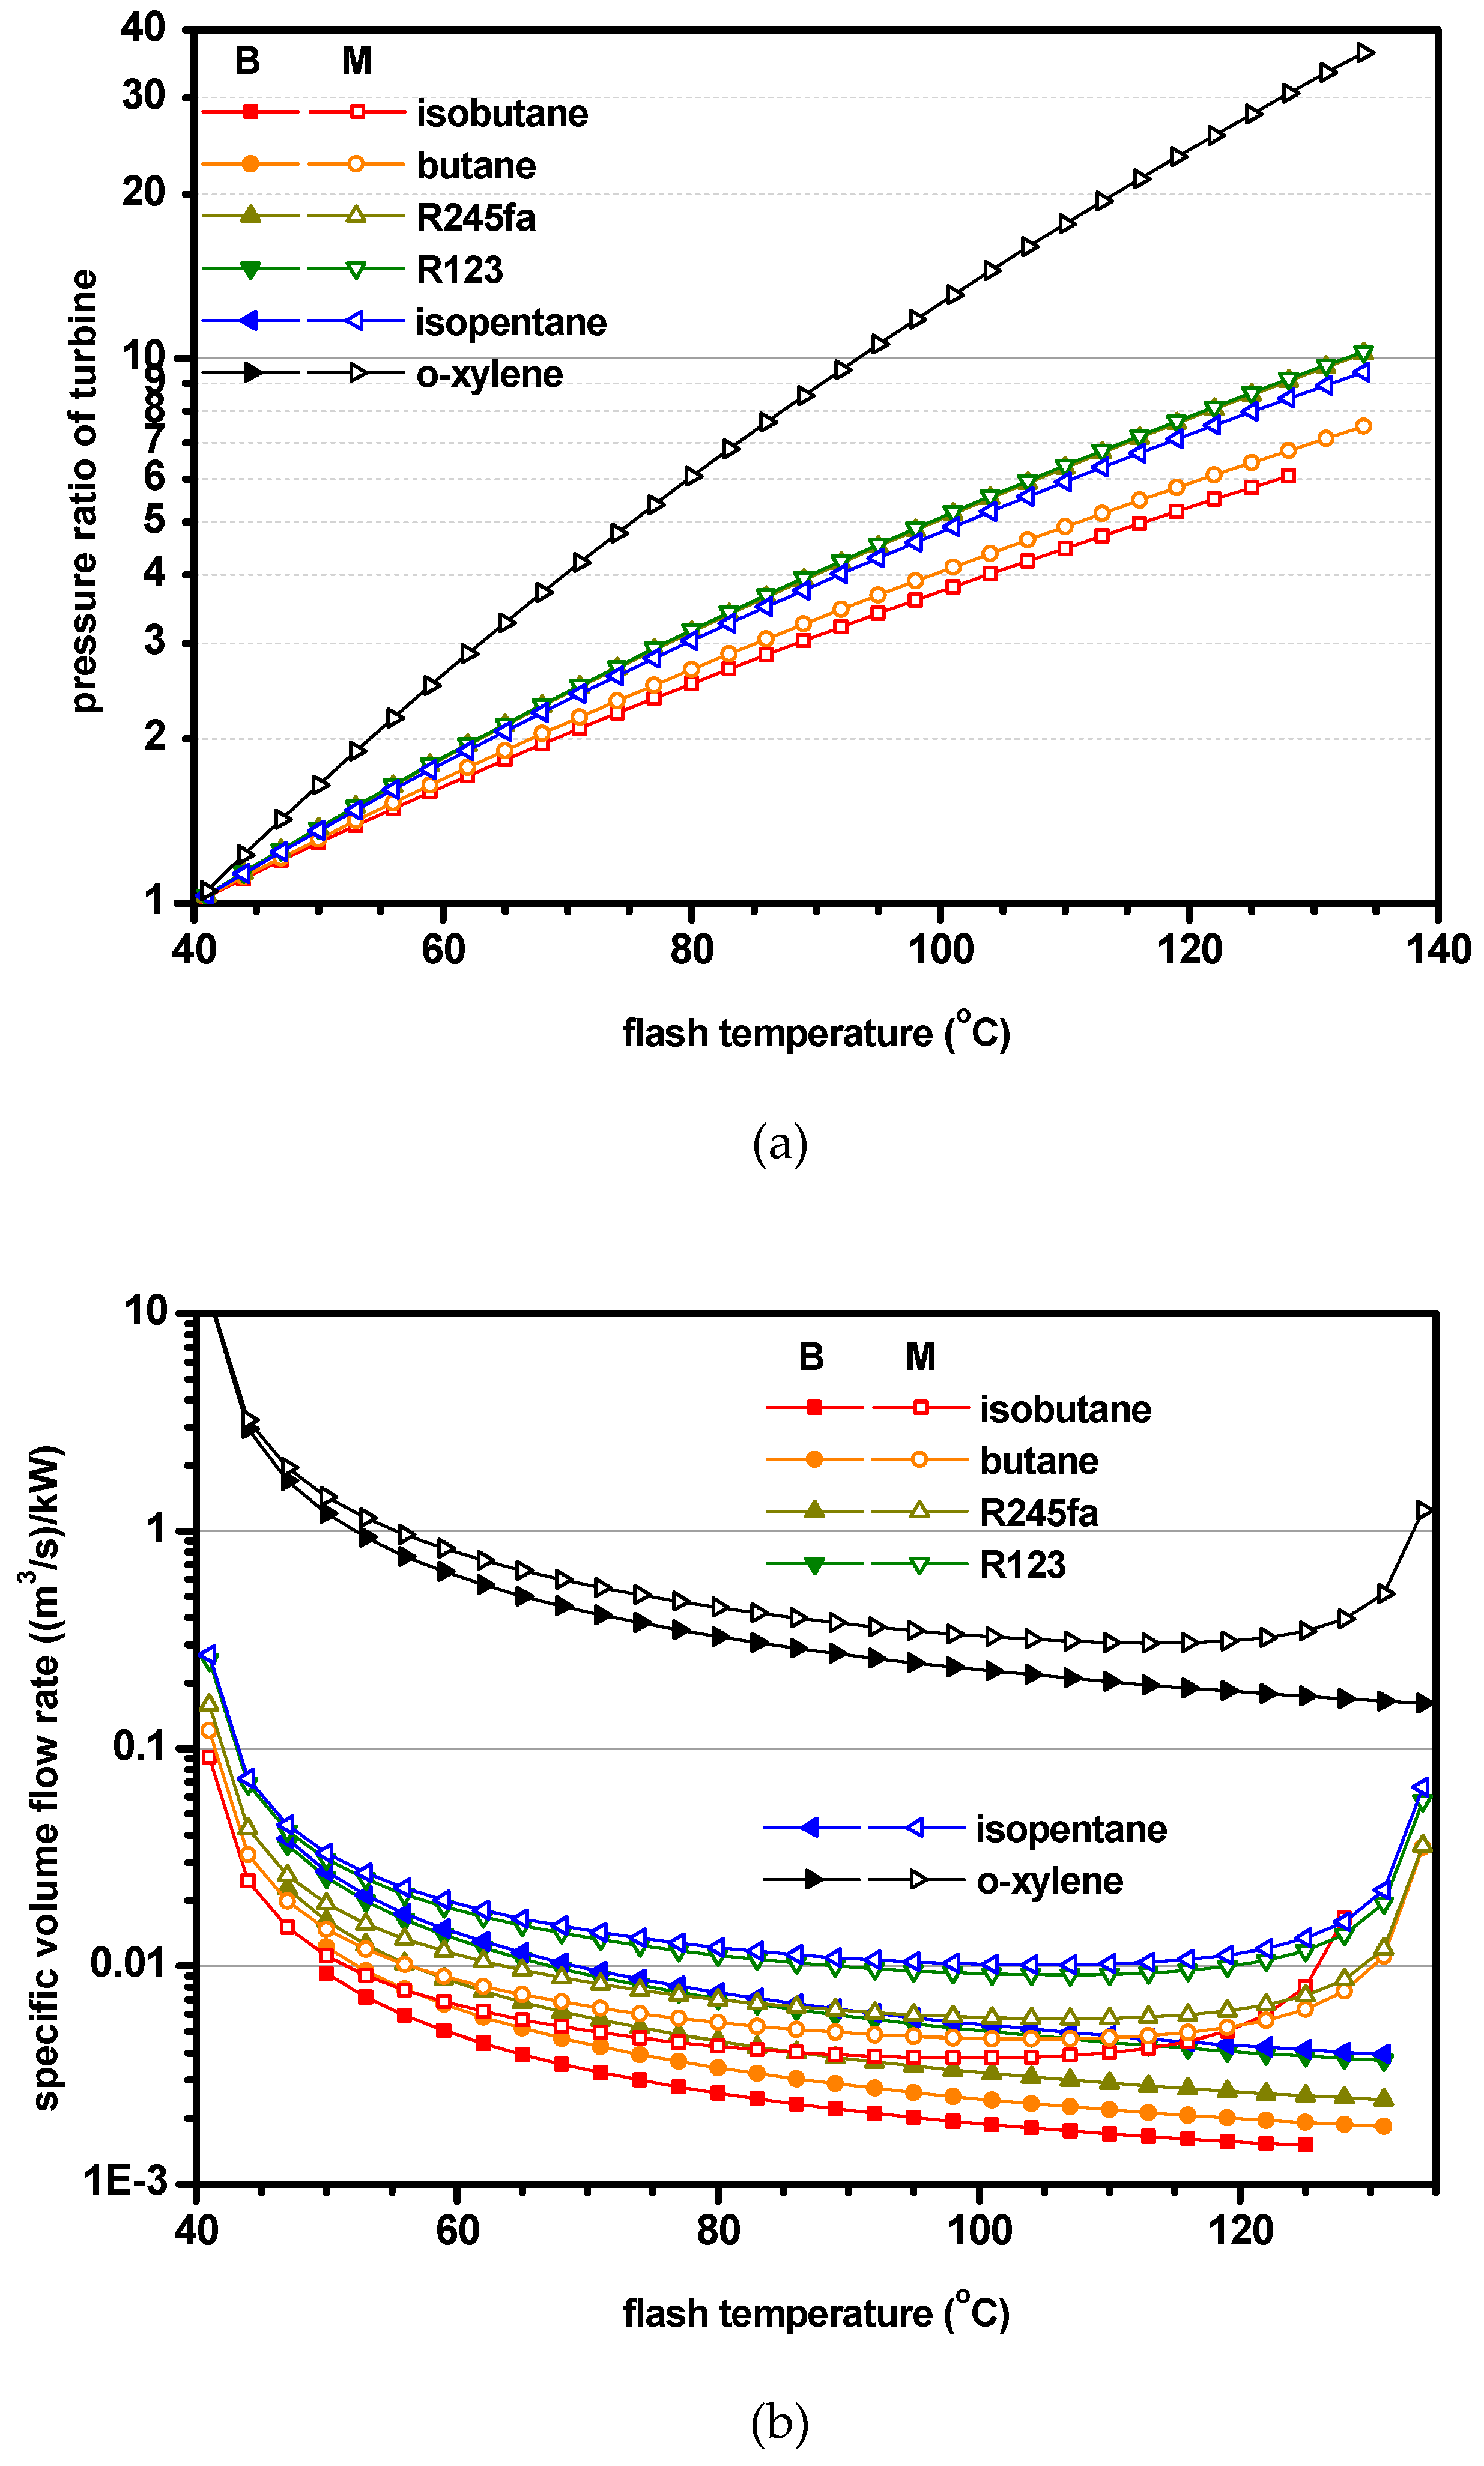
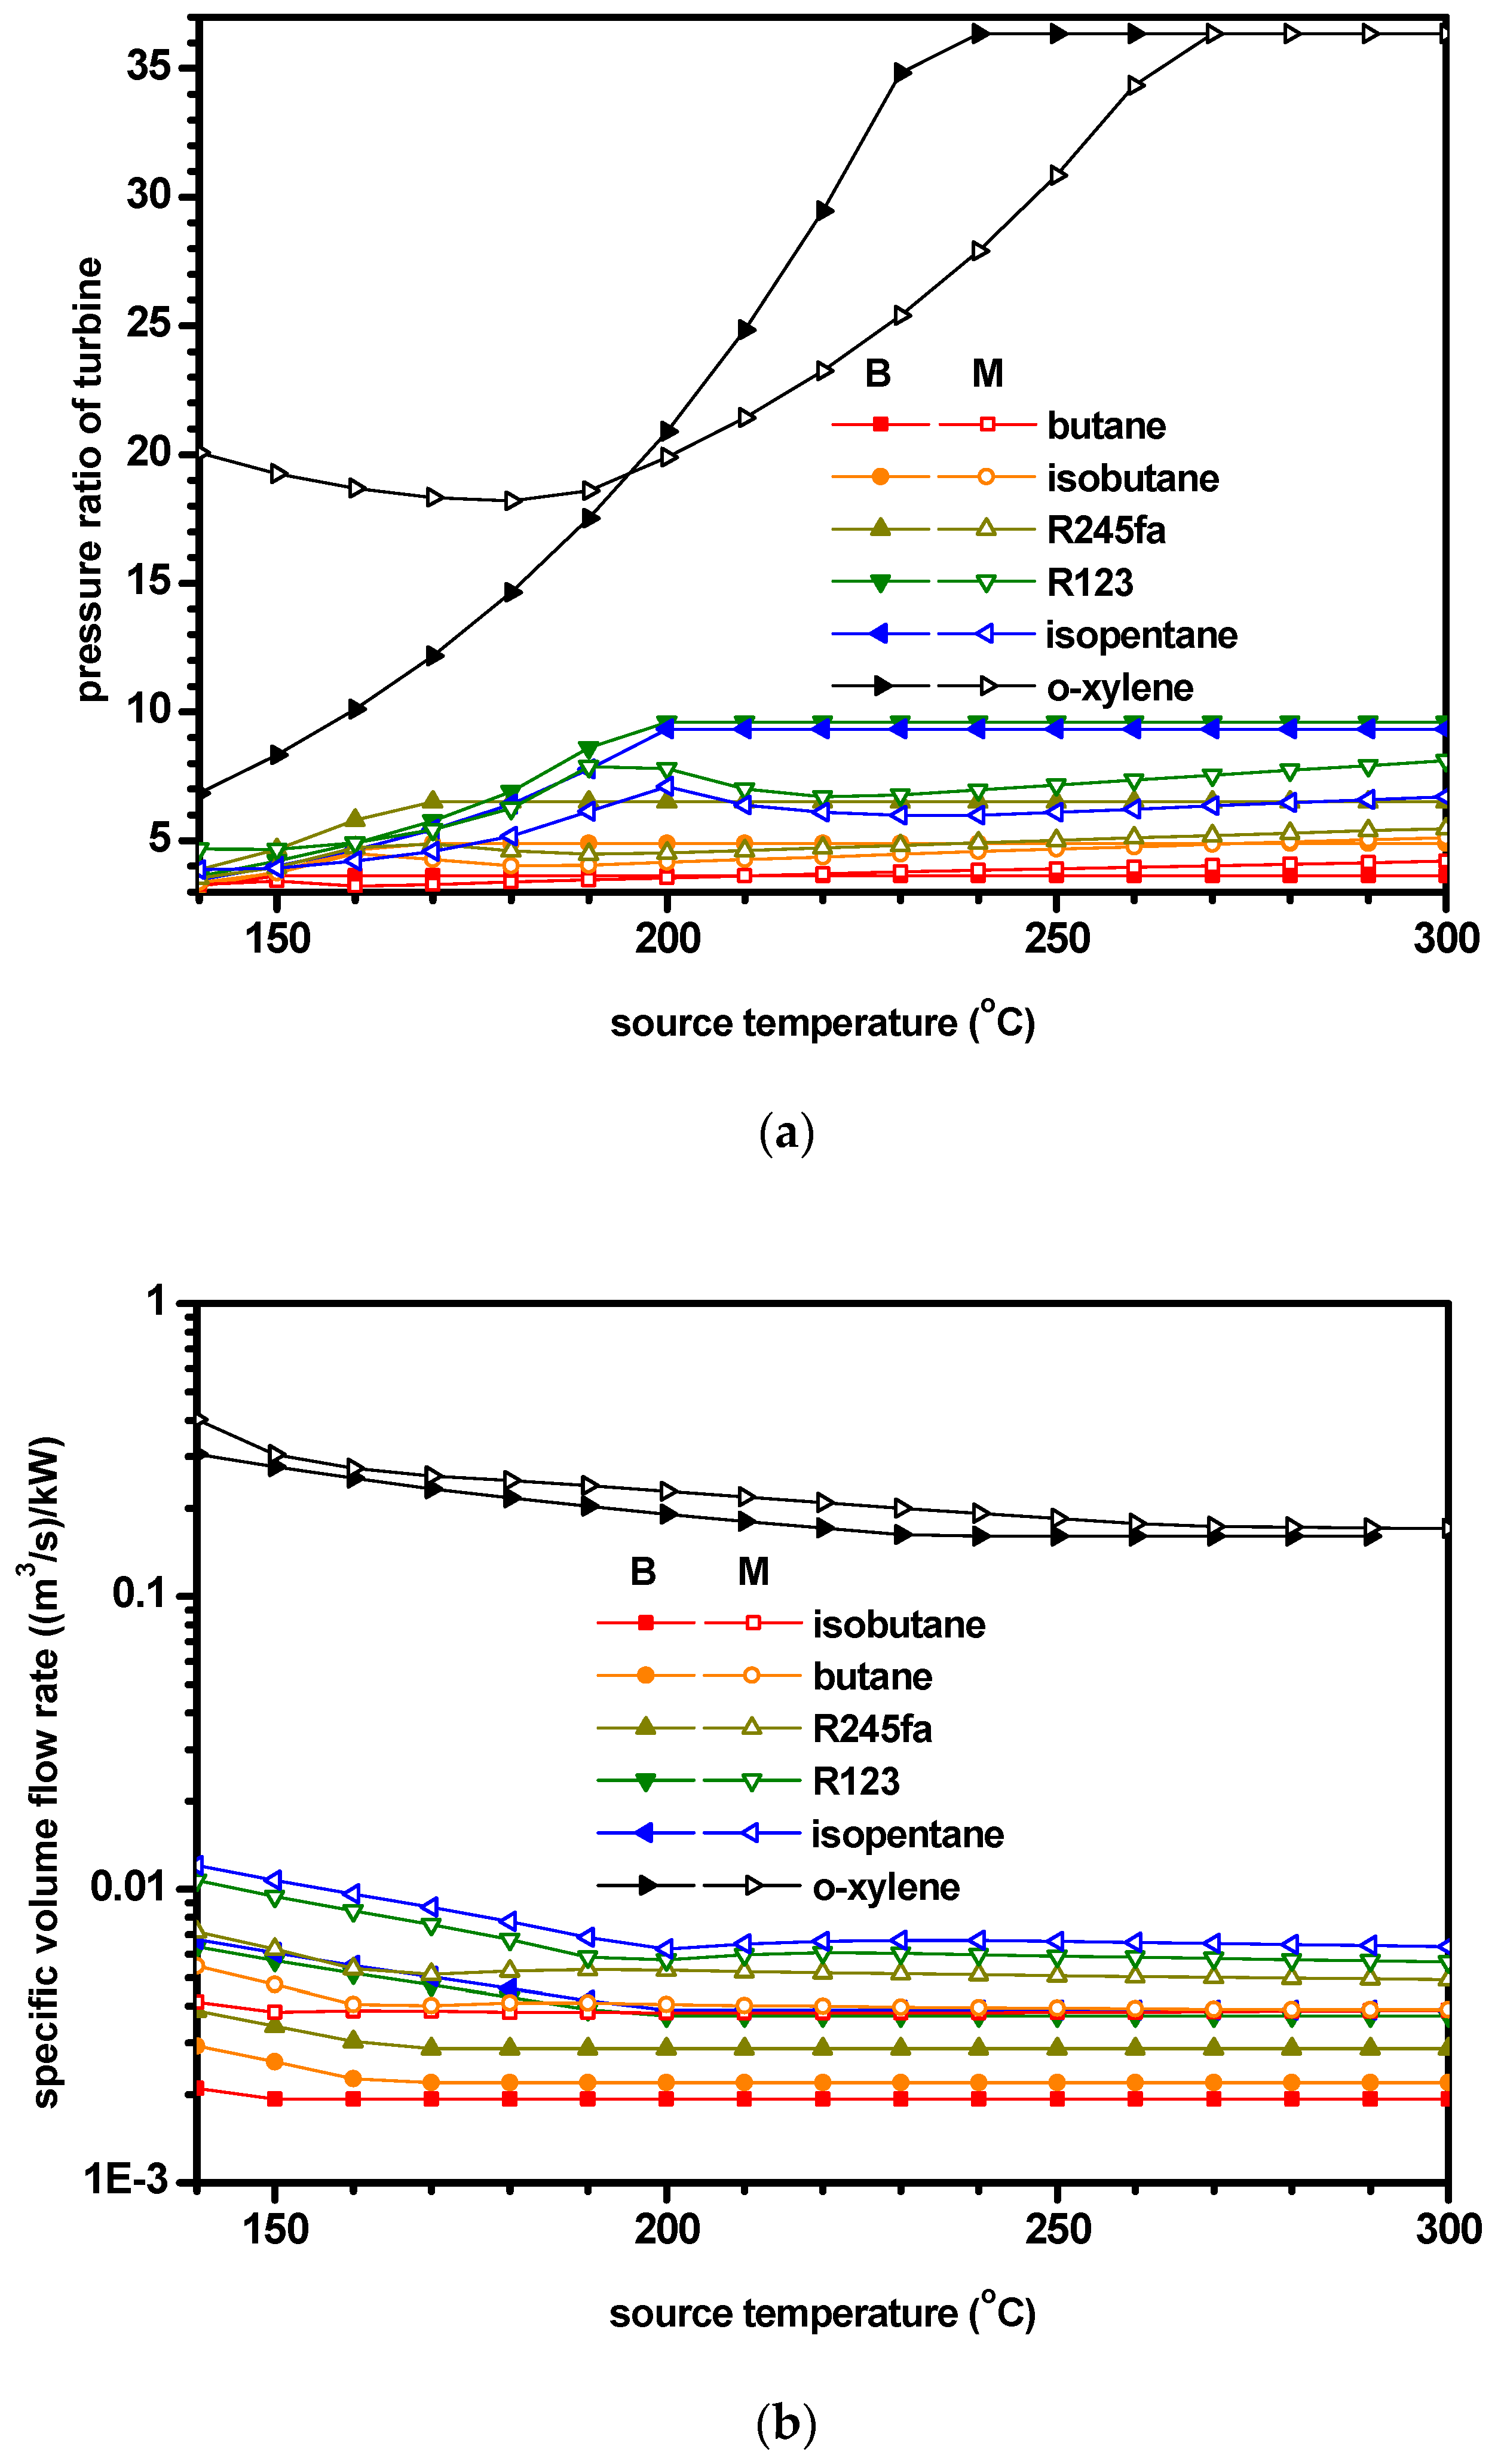
- The pressure ratio and specific volume flow rate were investigated for different source temperatures and working fluids, and it was shown that o-xylene led to a significantly higher pressure ratio and specific volume flow rate.
- The working fluid that carried the highest second-law efficiency under optimum conditions varied according to the source temperature in the OFCB, while it was always o-xylene followed by R123 and isopentane in the OFCM. However, according to the very high pressure ratio and specific volume flow rate of a system using o-xylene, and the environmental effect of R123, isopentane is recommended as the most suitable working fluid for an OFCM.
Acknowledgments
Conflicts of Interest
Nomenclature
| cp | isobaric specific heat (kJ/kg∙K) |
| E | exergy flow (kW) |
| h | specific enthalpy (kJ/kg) |
| m | mass flow rate (kg/s) |
| OFCB | basic organic flash cycle |
| OFCM | modified organic flash cycle |
| P | pressure (bar) |
| Q | heat transfer rate (kW) |
| s | specific entropy (kJ/kg∙K) |
| T | temperature (°C) |
| TPE | fytwo-phase expander |
| TH | heating temperature at heat exchanger exit in OFCB/OFCM (°C) |
| W | power, (kW) |
| ∆Tpp | pinch temperature difference (°C) |
| η | isentropic efficiency |
| ηII | cycle second-law efficiency |
| ηth | thermal efficiency |
Subscripts
| 0 | dead state |
| C | compressor/coolant |
| cr | critical |
| F | flash |
| H | high |
| L | low/condensation |
| p | pump |
| S | source |
| t | turbine |
| w | working fluid |
References
- Aghahosseini, A.; Dincer, I. Comparative performance analysis of low-temperature Organic Rankine Cycle (ORC) using pure and zeotropic working fluids. Appl. Therm. Eng. 2013, 54, 35–42. [Google Scholar] [CrossRef]
- Tchanche, B.F.; Pétrissans, M.; Papadakis, G. Heat resources and organic Rankine cycle machines. Renew. Sustain. Energy Rev. 2014, 39, 1185–1199. [Google Scholar] [CrossRef]
- Tchanche, B.F.; Papadakis, G.; Lambrinos, G.; Frangoudakis, A. Fluid selection for a low-temperature solar organic Rankine cycle. Appl. Therm. Eng. 2009, 29, 2468–2476. [Google Scholar] [CrossRef]
- Li, G. Organic Rankine cycle performance evaluation and thermoeconomic assessment with various applications part I: Energy and exergy performance evaluation. Renew. Sustain. Energy Rev. 2016, 53, 477–499. [Google Scholar] [CrossRef]
- Mansoury, M.; Jafarmadar, S.; Khalilarya, S. Energetic and exergetic assessment of a two-stage Organic Rankine Cycle with reactivity controlled compression ignition engine as a low temperature heat source. Energy Convers. Mgmt. 2018, 166, 215–232. [Google Scholar] [CrossRef]
- Kim, K.H.; Perez-Blanco, H. Performance Analysis of a Combined Organic Rankine Cycle and Vapor Compression Cycle for Power and Refrigeration Cogeneration. Appl. Therm. Eng. 2015, 91, 964–974. [Google Scholar] [CrossRef]
- Kim, K.H.; Kim, K.C. Thermodynamic performance analysis of a combined power cycle using low grade heat source and LNG cold energy. Appl. Therm. Eng. 2014, 70, 50–60. [Google Scholar] [CrossRef]
- Yao, E.; Wang, H.; Wang, L.; Xi, G.; Maréchal, F. Multi-objective optimization and exergoeconomic analysis of a combined cooling, heating and power based compressed air energy storage system. Energy Convers. Manag. 2017, 138, 199–209. [Google Scholar] [CrossRef]
- Li, J.; Alvi, J.Z.; Pei, G.; Ji, J.; Li, P.; Huide, F. Effect of working fluids on the performance of a novel direct vapor generation solar organic Rankine cycle system. Appl. Therm. Eng. 2016, 98, 786–797. [Google Scholar] [CrossRef]
- Bao, J.; Zhao, L. A review of working fluid and expander selections for organic Rankine cycle. Renew. Sustain. Energy Rev. 2013, 24, 325–342. [Google Scholar] [CrossRef]
- Lecompte, S.; Huisseune, H.; van den Broek, M.; Vanslambrouck, B.; De Paepe, M. Review of organic Rankine cycle (ORC) architectures for waste heat recovery. Renew. Sustain. Energy Rev. 2015, 47, 448–461. [Google Scholar] [CrossRef]
- Pethurajan, V.; Sivan, S.; Joy, G.C. Issues, comparisons, turbine selections and applications—An overview in organic Rankine cycle. Energy Convers. Mgmt. 2018, 166, 474–488. [Google Scholar] [CrossRef]
- Mahmoudi, A.; Fazli, M.; Morad, M.R. A recent review of waste heat recovery by Organic Rankine Cycle. Appl. Therm. Eng. 2018, 143, 660–675. [Google Scholar] [CrossRef]
- Shi, L.; Shu, G.; Tian, H.; Deng, S. A review of modified Organic Rankine Cycles (ORCs) for internal combustion engine waste heat recovery (ICE-WHR). Renew. Sustain. Energy Rev. 2018, 92, 95–110. [Google Scholar] [CrossRef]
- Garciaa, S.I.; Garcia, R.F.; Carril, J.C.; Garcia, D.I. A review of thermodynamic cycles used in low temperature recovery systems over the last two years. Renew. Sustain. Energy Rev. 2018, 81, 760–767. [Google Scholar] [CrossRef]
- Kim, K.H.; Han, C.H.; Kim, K. Effects of ammonia concentration on the thermodynamic performances of ammonia-water based power cycles. Thermochimca Acta 2012, 530, 7–16. [Google Scholar] [CrossRef]
- Kim, K.H.; Ko, H.J.; Kim, K. Assessment of pinch point characteristics in heat exchangers and condensers of ammonia-water based power cycles. Appl. Energy 2014, 113, 970–981. [Google Scholar] [CrossRef]
- Lai, N.A.; Fischer, J. Efficiencies of power flash cycles. Energy 2012, 44, 1017–1027. [Google Scholar] [CrossRef]
- Ho, T.; Mao, S.S.; Greif, R. Comparison of the Organic Flash Cycle (OFC) to other advanced vapor cycles for intermediate and high temperature waste heat reclamation and solar thermal energy. Energy 2012, 42, 213–223. [Google Scholar] [CrossRef]
- Ho, T.; Mao, S.S.; Greif, R. Increased power production through enhancements to the Organic Flash Cycle (OFC). Energy 2012, 45, 686–695. [Google Scholar] [CrossRef]
- Bombarda, P.; Gaia, M.; Invernizzi, C.; Pietra, C. Comparison of Enhanced Organic Rankine Cycles for Geothermal Power Units. In Proceedings of the World Geothermal Congress, Melbourne, Australia, 19–25 April 2015. [Google Scholar]
- Lee, H.Y.; Park, S.H.; Kim, K.H. Comparative analysis of thermodynamic performance and optimization of Organic Flash Cycle (OFC) and Organic Rankine Cycle (ORC). Appl. Therm. Eng. 2016, 100, 680–690. [Google Scholar] [CrossRef]
- Mondal, S.; De, S. Power by waste heat recovery from low temperature industrial flue gas by Organic Flash Cycle (OFC) and transcritical-CO2 power cycle: A comparative study through combined thermodynamic and economic analysis. Energy 2017, 121, 832–840. [Google Scholar] [CrossRef]
- Mondal, S.; De, S. Ejector based organic flash combined power and refrigeration cycle (EBOFCP&RC)—A scheme for low grade waste heat recovery. Energy 2017, 134, 638–648. [Google Scholar]
- Mondal, S.; Alam, S.; De, S. Performance assessment of a low grade waste heat driven Organic Flash Cycle (OFC) with ejector. Energy 2018, 163, 849–862. [Google Scholar] [CrossRef]
- Li, Z.; Lu, Y.; Huang, Y.; Qian, G.; Chen, F.; Yu, X.; Roskilly, V. Comparison study of Trilateral Rankine Cycle, Organic Flash Cycle and basic Organic Rankine Cycle for low grade heat recovery. Energy Procedia 2017, 142, 1441–1447. [Google Scholar] [CrossRef]
- Nemati, A.; Nami, H.; Yari, M. Assessment of different configurations of solar energy driven organic flash cycles (OFCs) via exergy and exergoeconomic methodologies. Renew. Energy 2018, 115, 1231–1248. [Google Scholar] [CrossRef]
- Baccioli, A.; Antonelli, M. Organic Flash Cycles: Off-design behavior and control strategies of two different cycle architectures for Waste Heat Recovery applications. Energy Convers. Mgmt. 2018, 157, 176–185. [Google Scholar] [CrossRef]
- Baccioli, A.; Antonelli, M.; Desideri, U. Technical and economic analysis of organic flash regenerative cycles (OFRCs) for low temperature waste heat recovery. Appl. Energy 2017, 199, 69–87. [Google Scholar] [CrossRef]
- Mosaffa, A.H.; Zareei, A. Proposal and thermoeconomic analysis of geothermal flash binary power plants utilizing different types of organic flash cycle. Geothermics 2018, 72, 47–63. [Google Scholar] [CrossRef]
- Kim, K.H.; Han, C.H.; Ko, H.J. Comparative Thermodynamic Analysis of Kalina and Kalina Flash Cycles for Utilizing Low-Grade Heat Source. Energies 2018, 11, 3311. [Google Scholar] [CrossRef]
- Yang, T.; Chen, G.J.; Guo, T.M. Extension of the Wong—Sandler mixing rule to the three-parameter Patel-Teja equation of state: Application up to the near-critical region. Chem. Eng. J. 1997, 67, 27–36. [Google Scholar] [CrossRef]
- Gao, J.; Li, L.D.; Zhu, Z.Y.; Ru, S.G. Vapor-liquid equilibria calculation for asymmetric systems using Patel-Teja equation of state with a new mixing rule. Fluid Phase Equilibria 2004, 224, 213–219. [Google Scholar] [CrossRef]
- Yaws, C.L. Chemical Properties Handbook; McGraw-Hill: New York, NY, USA, 1999. [Google Scholar]
- Delgado-Torres, A.M.; García-Rodríguez, L. Preliminary assessment of solar organic Rankine cycles for driving a desalination system. Desalination 2007, 216, 252–275. [Google Scholar] [CrossRef]


| Reference | Ho et al. [20] | Nemati et al. [27] | Baccioli et al. [28] | Baccioli et al. [29] | Mosaffa et al. [30] | Present Work |
|---|---|---|---|---|---|---|
| year | 2012 | 2018 | 2018 | 2017 | 2018 | 2019 |
| flash | SDSSS | SDSSS | SS | DD | SDSD | SS |
| expander | SDDSD | SDDSD | SS | DD | SDSD | SS |
| TPE | NNNYY | NNNYY | NN | NN | NNNN | NY |
| regeneration | NNNNN | NNNNN | NY | NY | NNYY | NY |
| TS (°C) | 300 | 290–310 | 150–210 | 80–170 | 170 | 140–300 |
| mS (kg/s) | - | 17 | - | - | 10 | 1 |
| no. of fluids | 10 | 5 | 16 | 8 | 1 | 6 |
| opt. fluid | - | - | R601a | R601a | R123 | R601a |
| remarks | first proposal | exergo-economic | - | off-design | regeneration by IHE | - |
| Substance | M (kg/kmol) | Tcr (°C) | Pcr (MPa) | ω |
|---|---|---|---|---|
| isobutane | 58.123 | 134.99 | 3.648 | 0.177 |
| butane | 58.123 | 152.03 | 3.797 | 0.199 |
| R245fa | 134.048 | 154.05 | 3.640 | 0.3724 |
| R123 | 136.467 | 183.75 | 3.674 | 0.282 |
| isopentane | 72.150 | 187.28 | 3.381 | 0.228 |
| o-xylene | 106.167 | 357.22 | 3.734 | 0.313 |
| Symbol | Parameter | Data | Unit |
|---|---|---|---|
| TS | source temperature | 150 | °C |
| TH | heating temperature | 135 | °C |
| TF | flash temperature | 80 | °C |
| TL | condensation temperature | 40 | °C |
| TC | cooling water temperature | 25 | °C |
| T0 | reference dead state temperature | 25 | °C |
| ΔTpp | pinch temperature difference | 8 | °C |
| ηp | isentropic efficiency of pump | 80 | % |
| ηt | isentropic efficiency of turbine | 80 | % |
| ηTPE | isentropic efficiency of TPE | 65 | % |
© 2019 by the author. Licensee MDPI, Basel, Switzerland. This article is an open access article distributed under the terms and conditions of the Creative Commons Attribution (CC BY) license (http://creativecommons.org/licenses/by/4.0/).
Share and Cite
Kim, K.H. Thermodynamic Performance and Optimization Analysis of a Modified Organic Flash Cycle for the Recovery of Low-Grade Heat. Energies 2019, 12, 442. https://doi.org/10.3390/en12030442
Kim KH. Thermodynamic Performance and Optimization Analysis of a Modified Organic Flash Cycle for the Recovery of Low-Grade Heat. Energies. 2019; 12(3):442. https://doi.org/10.3390/en12030442
Chicago/Turabian StyleKim, Kyoung Hoon. 2019. "Thermodynamic Performance and Optimization Analysis of a Modified Organic Flash Cycle for the Recovery of Low-Grade Heat" Energies 12, no. 3: 442. https://doi.org/10.3390/en12030442
APA StyleKim, K. H. (2019). Thermodynamic Performance and Optimization Analysis of a Modified Organic Flash Cycle for the Recovery of Low-Grade Heat. Energies, 12(3), 442. https://doi.org/10.3390/en12030442