Abstract
China will impose both renewable portfolio standards (RPS) and emissions trading (ET) on the electricity industry, but the product competition in the retail market and the influence of the supply chain network structure has not been investigated. This paper studies policy effects by comparing equilibrium results under different supply chain network structures, and we use the concept of consumer environmental awareness to capture a product’s substitutability. Results indicate that: (1) Both increases in the permit price and the rise of the quota obligation reduces the aggregate profits of the supply chain, but the former rather than the latter increases the profits of the renewable power generating company; (2) the differential pricing improves the retailer’s flexibility in the charged price when confronting increases in the permit price and the quota obligation; (3) higher consumer environmental awareness makes the supply chain less profitable and increases the costs of ET suffered by the consumer; (4) the cooperation between the thermal power generating company and the retailer significantly increases the aggregated profits of the supply chain, although the cooperative profit is sensitive to environmental awareness. Moreover, the consumer suffers the highest costs that the retailer passes on them, and may prefer to feel that the emission cost and compliance cost are less affordable. In contrast, the cooperation between power generating companies removes the influence of environmental awareness, but the aggregated profits of the supply chain are smaller than in the decentralized decision scenario.
1. Introduction
In China, the feed-in tariff (FIT) policy boosted the development of renewable energy generation, but it failed to encourage the state grid company to consume the soaring levels of electricity from renewable energy sources (RES-E). Now, as the government is confronted with an unprecedented subsidy deficit and the pressure of achieving its energy goal in 2020 [1,2], China is eager to adjust its current subsidy policy. Compared to the FIT, the renewable portfolio standards (RPS) combined with tradable green certificates (TGCs) are generally regarded as a quantity-driven instrument designed according to neoclassical economic theory [3,4,5,6]. Thus, to realize their energy goal while minimizing social costs, on 3 March 2018, China announced that RPS combined with TGCs would soon be implemented, and quota obligations will be imposed on retailers [7]. Furthermore, the severe air pollution and the promise of achieving a carbon emissions cap in 2030 spurred China to establish the national emissions trading (ET) system. On 18 December 2017, the government announced a pilot program of national ET in the power industry [8]. Thus, RPS and ET, which is regarded as the policy mix [9,10,11], will coexist in the Chinese electricity market in the future.
It has long been suspected that the policy mix may give rise to complex policy effects, but the Chinese government does not focus much on it. First, there are complicated price correlations among the green certificate price, the permit price, and the power price [12,13,14,15,16]. As a result, it is arduous to analyze the change in the consumer’s price and the optimal quota of achieving the energy goal and the environmental goal [17,18]. The renewable power generating company may utilize these correlations to enhance its market power, which distorts the power price [19,20,21]. Recently, the negative impact of the RPS on the carbon permit price has been concerned [18,22,23,24,25]. The introduction of RPS will encourage the development of RES-E, which brings on the displacement of power generated by fossil fuels. This will exert downward pressure on the carbon permit price. Furthermore, the implementation of RPS may reduce the shadow costs of carbon emissions, which results in a lower reduction of carbon emissions [26]. In fact, RPS has long been suspected of its real performance [3,27,28,29,30,31], and some scholars thought that it is necessary to clarify the definition of RECs [32,33,34]. However, some scholars refute the existence of a negative impact in the real system [35,36]. Now, the researchers have begun to employ a policy mix to appeal for the further study of the dynamics and outcomes of RPS with an ET counterpart [10,11,23,37]. They hope that relevant research will help to realize appropriate coordination and instrument choice.
Generally, researchers agree on the necessity to study the impact of the policy mix concerning RPS and ET, but only a few publications investigate it against the context that the retailer is required to comply with a quota obligation [15,38]. Thus, current studies cannot provide sufficient policy suggestions for the policymaker. Furthermore, when the retailer must comply with the quota obligation, the retailer usually provides the consumer with the so-called green plan, which only contains the RES-E, to avoid suffering all the costs of green certificates. Therefore, there will be two products competing in the electricity market, and the policy mix may have different impacts on their prices. Moreover, the participant in the market might choose to cooperate with others to maximize its profits. Nevertheless, to the best of our knowledge, no previous study captures these issues. Thus, the influences of the product competition and the supply chain’s network structure on the policy effects of RPS and ET have not been investigated.
This paper aims to study the interplay among prices, quota obligation, permit price, and consumer’s environmental awareness by comparing policy effects of ET and RPS in different supply chain network structures, and the retailer is required to comply with the quota obligation. The consumer’s environmental awareness factors in the demand for power to capture the substitutability between different types of power sold by the retailer. The understanding gained will help to comprehend the impact of the supply chain’s network structure on the policy effects and the role that consumers’ environmental awareness plays in it.
2. Theoretical Model
We construct a two-stage supply chain in which there are two manufacturers—a thermal power generating company and a renewable power generating company—and a retailer. Since we are interested in the impacts of the supply chain’s network structure on policy effects, three different power supply chain network structures are investigated in this study. The first structure is the benchmark in which every company acts as an individual and endeavors to maximize its profits, i.e., a decentralized decision model. Then, we consider a scenario where the thermal power generating company launches a retailer, and they cooperate to select the retail price. Finally, in the third structure, the thermal power generating company invests in the renewable energy generation, in which the power generating companies cooperate to select the wholesale price and the green certificate price. Table 1 defines the notations of the model.

Table 1.
Decision variables, variables, and parameters.
In China, each unit of RES-E will be qualified and issued with a one-unit TGC [7]. We hypothesize that the retailer charges different prices for thermal power and RES-E. When the two types of power compete in the market, the substitutability of the two types of power depends on two factors. The first factor is product differentiation, which is a measure of the intensity of the product’s competition [39,40,41]. A smaller value of the intensity of the production competition implies less product substitutability, and the price difference between the two brands within a store has less impact on the demands [40]. Some literature also calls it “product differentiation” or “substitutability of products”. The second factor is the consumer’s environmental awareness [39,42]. The consumers’ environmental awareness is the consumers’ willingness to pay higher prices for more eco-friendly products [39]. Thus, the higher the consumer’s environmental awareness is, the more consumers are willing to pay higher prices for eco-friendly products. However, since the behavior of carbon reduction is not the focus of this study, we hypothesize that the emissions abatement of the power generating company does not influence the demand for power. Instead, we assume that the consumer’s environmental awareness influences the substitutability of two types of power for the consumer. Specifically, if the consumer has minimal environmental awareness, they will only be concerned about the retail price of power and the gap between the retail prices of the two types of power. In contrast, if the consumer has the strongest environmental awareness, the two types of power will be regarded as heterogeneous, which means that the two types of power are not substitutable. Thus, the demand functions of the two types of power are defined as follows:
Moreover, as there is no difference in the physical characteristics between the two types of electricity for the consumer, the intensity of the production competition is . Thus, the demand functions are rewritten as follows:
The demand function indicates that the two types of power are entirely substitutable when the consumer’s environmental awareness is , whereas the two types of power are heterogeneous when the consumer’s environmental awareness is .
The model hypothesizes that power generating companies first select the wholesale price and the green certificate price. Then, the retailer purchases electricity from the wholesale market and selects the retail price of the two types of power. Thus, the model is a typical Stackelberg model, which can be resolved using backward induction.
China initially launched the electricity reform in 2002, and the State Power Company was divided into five power generation companies and two grid companies. In March 2015, the General Office of the CPC Central Committee published Several Opinions on Further Deepening the Reform of Power System, which launched the new-round of electricity market reform. As the state grid company and the southern grid company almost monopolize the retail market, the new-round of electricity market reform focused on a liberalizing retail market and created an unprecedented opportunity for the company who wants to invest in the retail market, especially for the generating company. Thus, some generating companies established their own retail company to broaden the scope of business. On the other side, since China is determined to deal with serve air pollution and reduce carbon emission, both RPS and ET were introduced in the electricity industry. As a result, the generating company whose power units are mainly comprised of thermal power generating units will suffer heavier environment costs. Thus, to relieve the cost pressure, they have invested tremendous resources to build large-scale renewable power generating plant.
Thus, this study discusses three cases: Decentralized decision scenario and two centralized decision scenarios. Case 1 is the benchmark, in which power generating companies and the retailer will independently decide the optimal price to obtain maximum price. In case 2, the power generating companies cooperate to decide the optimal wholesale price. Finally, in case 3, the thermal power generating company cooperates with the retailer to make optimal decisions. The three cases are shown in Figure 1, Figure 2 and Figure 3, respectively. Many publications concerning supply chain analysis are investigated from a social welfare perspective. However, in China’s recent electricity market reform, the officer hopes that the “invisible hand” will play a pivotal role in the power industry, meaning that the market participants rather than the government will determine the power price. Following the same spirit, the green certificates’ price and emissions allowance price will also be set by the market. Since every market participant is concerned about its own profits rather than social welfare, this study investigates from the perspective of the supplier. Furthermore, at least one parameter, for example, the carbon tax, in the study that discusses it from the social welfare perspective can be set by officials. If we attempt to investigate social welfare, the parameter set by officials should be quota obligation. Nevertheless, this study only establishes a simplified model that consists of two generating companies and a retailer. Therefore, the theme concerning optimal quota obligation that creates the largest social welfare is far beyond the scale of the model. In conclusion, this study limits the discussion on the interplay among prices and parameters and how it influences profits.
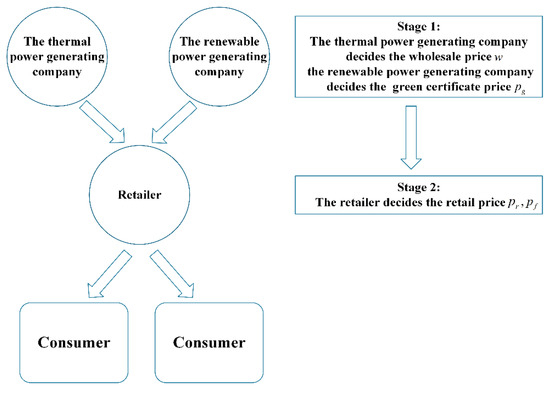
Figure 1.
The supply chain network structure of the decentralized decision in case 1.
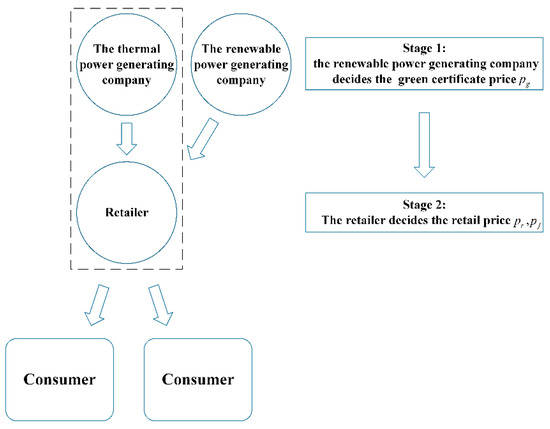
Figure 2.
The supply chain network structure of the centralized decision in case 2.
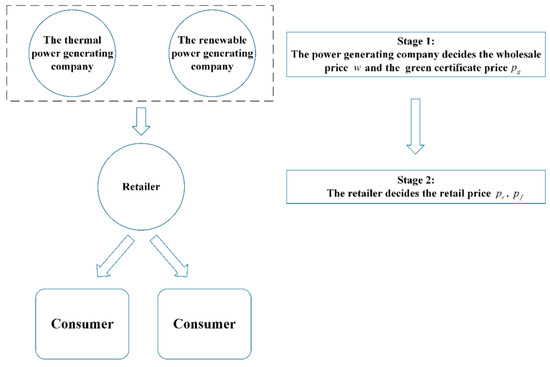
Figure 3.
The supply chain network structure of the centralized decision in case 3.
2.1. Case 1: Decentralized Decision
The retailer must provide the specified amounts of TGCs to prove that they comply with the quota obligation [7]. Moreover, if the retailer cannot obtain sufficient TGCs through purchasing RES-E, they can buy TGCs from other owners of TGCs to meet the requirement. Thus, we hypothesize that the retailer can obtain TGCs by purchasing RES-E, which is bundled with TGCs, or buy TGCs from the TGC market in which the TGCs are sold separately from RES-E. The retailer’s profits are described as follows:
where the TGC price, , in the TGC market is exogenous. In the model, we hypothesize that the thermal power generating company dominates the market, whereas the renewable power generating company competes as a fringe firm [21]. Thus, the renewable power generating company takes the wholesale price as given and selects the green certificate price to maximize its profits. The thermal power generating companies’ profits are described as follows:
The renewable power generating companies’ profits are described as follows:
2.2. Case 2: Centralized Decision
In case 2, we consider a scenario in which the thermal power generating company launches a retailer, and the thermal power generating company cooperates with the retailer to select the retail price. This scenario can be modeled by the supply chain with the centralized decision. The cooperative profits are given by the following:
The renewable power generating companies’ profits are described as follows:
2.3. Case 3: Centralized Decision
The power generating companies cooperate to select the wholesale price and the green certificate price to maximize its profits.
Thus, the power generating company’s profit is described as follows:
The retailer’s profits are given by the following:
3. The Equilibrium Results
In this section, we show the equilibrium result for each scenario and investigate the impact of the policy mix on the price. Since the partial derivative of the equilibrium results with respect to is complex, we cannot obtain an unambiguous conclusion concerning the direct impacts of consumers’ environmental awareness in this section. Thus, it is investigated in the numerical examples. For the same reason, the profits that result in each supply chain network structure are also studied in numerical examples.
3.1. Equilibrium Results for Case 1
Theorem 1.
There exists a unique Nash equilibrium to the model in Case 1.
The optimal decision for the thermal power generating company is as follows:
The optimal decision for the renewable power generating company is as follows:
The optimal decision for the retailer is as follows:
The proof is shown in Appendix A.
Proposition 2.
When the carbon permits price increases, both the wholesale price and the retail price will increase, and the green certificate price will decrease. When the quota obligation rises, both the green certificate price and retail price will increase, and the wholesale price will decrease.
See Appendix B for proof. When the carbon permit price increases, the thermal power generating company suffers higher costs of emissions. On the other hand, the retailer faces higher costs of green certificates as the quota obligation increases. Proposition 2 indicates that both costs will be partially suffered by the consumer. By further analyzing the consumer’s environmental awareness, we obtain the following proposition.
Proposition 3.
When the consumer’s environmental awareness increases, the rate of change in the wholesale price with respect to the permit price, the rate of change in the green certificate price with respect to the permit price, and the rate of change in the thermal power retail price with respect to the permit price will all increase. Moreover, the rate of change in the RES-E retail price with respect to the permit price will decrease, the rate of change in the wholesale price with respect to the quota obligation will increase, and the rate of change in the retail price with respect to the quota obligation and the rate of change in the green certificate price with respect to the quota obligation will all decrease.
See Appendix B for proof. When the consumer’s environmental awareness increases, the consumer prefers to differentiate between the two types of power. This would allow the thermal power generating company to pass the larger costs of the emission permits onto the retailer as the permit price increases, whereas the renewable power generating company charges a much lower green certificate price. Thus, when the permit price increases, the rise of the thermal power retail price will be higher, but the rise of the RES-E retail price will be smaller. On the other hand, when the quota obligation goes up, the increasing range of the green certificate price will be smaller, whereas the decreasing range of wholesale price will be larger. As a result, the retailer will pass the smaller cost of green certificates onto consumers.
3.2. Equilibrium Results for Case 2
Theorem 4.
There exists a unique Nash equilibrium to the model in case 2.
The optimal decision for the renewable power generating company is as follows:
The optimal decision for the retailer is as follows:
See Appendix A for proof.
Proposition 5.
When the carbon permit price increases, the retail price will increase, and the green certificate price will decrease if. When the quota obligation rises, the retail price will increase, and the green certificate price will increase if.
See Appendix B for proof. Proposition 5 shows that the impact of the rise of the permit price and the quota obligation on the retail price is the same as in case 1. However, the wholesale price is an exogenous variable in case 2. Thus, when the permit price and the quota obligation increase, whether the retail price will decrease or increase depends on the rate of change in the wholesale price.
Proposition 6.
When the consumer’s environmental awareness increases, the rate of change in the RES-E retail price with respect to the quota obligation will decrease, and the rate of change in the RES-E retail price with respect to the permit price will decrease. The rate of change in the thermal power retail price will not be affected by the consumer’s environmental awareness.
See Appendix B for proof. Proposition 6 means that the impact of the consumer’s environmental awareness on the RES-E retail price will be the same as in case 1. However, if the thermal power generating company cooperates with the retailer, the rise of the thermal power retail price will not be affected by the consumer’s environmental awareness.
3.3. Equilibrium Results for Case 3
Theorem 7.
There exists a unique Nash equilibrium to the model in case 3.
The optimal decision for the power generating company is as follows:
The optimal decision for the retailer is as follows:
See the Appendix A for proof.
Proposition 8.
When the carbon permit price increases, both the wholesale price and the RES-E retail price will increase, and the green certificate price will decrease. When the quota obligation rises, both the thermal power retail price and the RES-E retail price will increase, and the wholesale price will decrease. The consumer’s environmental awareness will not impact the price.
See Appendix B for proof. The proof is given in Appendix B. Similar to Proposition 2, the increase in the permit price will result in a higher wholesale price and a lower green certificate price, and the environmental costs will be reflected in the higher thermal power retail price. Nevertheless, the RES-E retail price will stay the same as the rise of the permit price. On the other side, the increase in the quota obligation will only result in a lower wholesale price and a higher retail price, whereas the green certificate will not be affected. Furthermore, if power generating companies cooperate, the consumer’s environmental awareness will not play any role in the price of the supply chain. Finally, we have the following proposition by comparing the rate of change in the price:
Proposition 9.
When the carbon permit price increases, the rate of changeand. When the quota obligation rises, the rate of changeand.
The number in the superscript denotes different cases. When the thermal power generating company cooperates with the retailer, the retailer passes the highest costs on to the consumer in all cases with respect to the rise of the permit price and the quota obligation. When power generating companies cooperate, the costs that the retailer passes onto the consumer through the thermal power are higher than the decentralized scenario, whereas the costs that the retailer passes on the consumer through RES-E are smaller than the decentralized scenario.
4. Numerical Analysis
In this section, we present numerical examples to investigate the direct impacts of the consumer’s environmental awareness on the prices and the profits. In addition, all the aforementioned propositions will be proven in the following examples. The parameters are designed as follows. The production costs of the thermal power, , and the production costs of RES-E, , are 0.35 and 0.55 , respectively. These hypotheses are consistent with the feed-in tariff for the thermal power and RES-E in China [43,44]. For the parameters of the demand function, we hypothesize that the potential demand, , and price elasticity, , are 50 and 50 , respectively.
The government established a platform for a pilot program of voluntary green certificate trading, which attempts to draw public attention on the RPS (http://www.greenenergy.org.cn/shop/index.html). However, only a minor part of the green certificates was sold, and the consumer only chooses the cheapest green certificate that the price falls behind 50 to 100 . Thus, the green certificate price in the green certificate market, , is assumed to be 0.08 . In 2020, the quota obligation that different provinces should comply with changes from 10% to 25% [7]. Moreover, the maximum permit price is approximately 0.07 (approximately $11) in China [45]. Therefore, we perform the analysis of the numerical results by varying the RPS level from 10% to 25% and the permit price from 0 to 0.15 .
The coal consumption of generating thermal power in China is approximately 270 to 330 , and the average coal consumption of generating thermal power in China is 309 [46]. The carbon emissions can be calculated by the following equation: . The coefficient of 0.67 is the carbon emissions coefficient recommended by the National Development and Reform Commission. This coefficient means that burning 1 g of coal produces 0.67 g of carbon. Moreover, theoretically, 44 g of CO2 consists of 32 g of oxygen and 12 g of carbon. Therefore, the carbon emission is assumed as 0.8 .
4.1. Numerical Results of the Price
Figure 4, Figure 5 and Figure 6 plot the trend of the price in case 1. First, Figure 4 shows the trend of the price under different levels of the quota obligation, , and the permit price, . We hypothesize that the consumer’s environmental awareness is . In Figure 4, when the permit price rises from 0 to 0.15 , the wholesale price and thermal power retail price increases about 0.051 CNY and 0.036 CNY, respectively, while the RES-E retail price only rises about 0.004 CNY. Thus, the difference between the thermal power retail price and the RES-E retail price shrinks as the permit price rises. If the permit price is higher than 0.11 , the thermal power retail price is higher than the RES-E retail price. Besides, the green certificate decreases about 0.044 CNY.
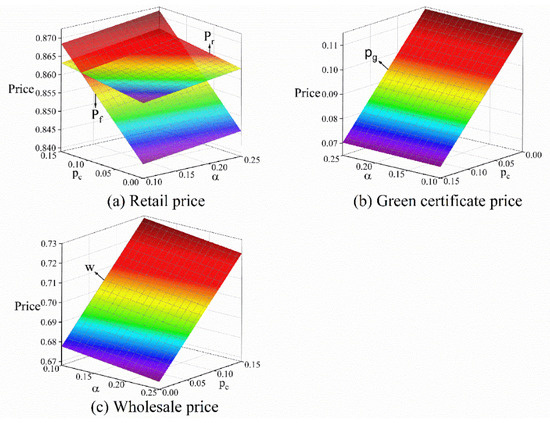
Figure 4.
The trend of price under different levels of and .
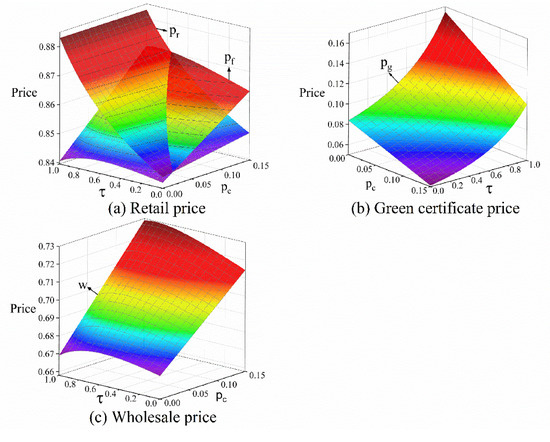
Figure 5.
The trend of the price under different levels of and .
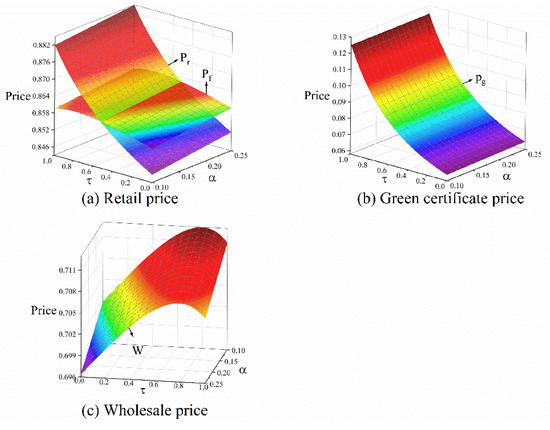
Figure 6.
The trend of price under different levels of and .
On the other hand, if the environmental awareness is , when the quota obligation increases from 10% to 25%, the retail price and the green certificate price increase about 0.003 CNY and 0.001 CNY, respectively, whereas the wholesale price decreases about 0.006 CNY. However, if the environmental awareness is , the quota obligation does not impact the green certificate price, which is displayed in Figure 6.
Then, the trend of the price under different levels of the consumer’s environmental awareness and the permit price is shown in Figure 5, and we assume that the quota obligation is . When the permit price is low, both the RES-E retail price and the wholesale price increase and then decrease with the rise of environmental awareness. This phenomenon can also be observed under different levels of , which is displayed in Figure 6.
In Figure 6, the permit price is assumed to be . When the permit price is high enough, both the RES-E retail price and the wholesale price increase as the consumer’s environmental awareness increases. Moreover, when the environmental awareness increases from 0 to 1, the RES-E retail price and the thermal power retail price rise about 0.036 CNY and 0.004 CNY, respectively. The green certificate price rises about 0.062 CNY. Therefore, we observe that the RES-E retail price is always higher than the thermal power retail price when the consumer’s environmental awareness is higher than 0.8. Furthermore, comparing the trend of the retail price in Figure 5 and Figure 6, we find that the point where the thermal power retail price exceeds the RES-E retail price will rise as the increase in the consumer’s environmental awareness.
Figure 7, Figure 8 and Figure 9 depict the trend of the price in case 2. In Figure 7, the trend of the price under different levels of the permit price and the quota obligation in case 2 are displayed. We substituted the wholesale price, , in the green certificate price Equation (23) using the wholesale price in case 1 and case 3, which is denoted by and in the figures, respectively. The trend of the retail price and the green certificate price in Figure 6 is consistent with case 1. However, the RES-E retail price is always higher than the thermal power retail price in case 2. In Figure 7, when the permit price rises from 0 to 0.15 , the thermal power retail price and the RES-E retail price increase about 0.06 CNY and 0.004 CNY, respectively, while the green certificate price, , and green certificate price, , decreases about 0.034 CNY and 0.043 CNY. When the quota obligation increases from 10% to 25%, the thermal power retail price and RES-E retail price increase about 0.006 CNY and 0.004 CNY, respectively, while the green certificate price increases about 0.002 CNY.
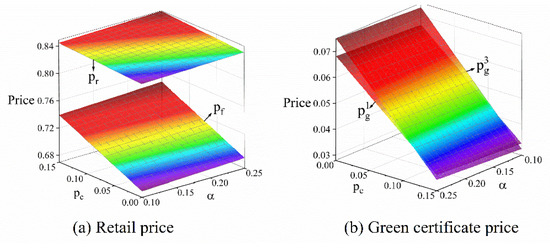
Figure 7.
The trend of the price under different levels of and .
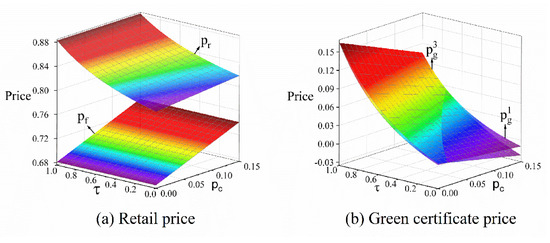
Figure 8.
The trend of the price under different levels of and .
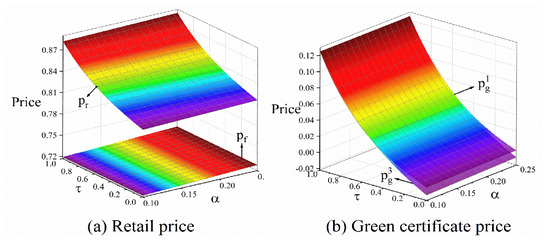
Figure 9.
The trend of price under different levels of and .
In Figure 8, when the consumer’s environmental awareness is , the RES-E retail price is not affected by the permit price. The aforementioned phenomena are also observed in Figure 9. In Figure 9, when the environmental awareness increases from 0 to 1, the RES-E retail price by about 0.080 CNY to 0.065 CNY, while the thermal power retail price is not affected. The green certificate price, , and green certificate price, , rises about 0.161 CNY to 0.115 CNY.
Since the price in case 3 is not affected by the consumer’s environmental awareness, we only display the trend of the price under different levels of the quota obligation and the permit price in Figure 10. It shows that the trend of the retail price and the trend of the green certificate price are consistent with case 2, and the trend of the wholesale price is the same as in case 1. In Figure 10, when the permit price rises from 0 to 0.15 , the wholesale price and thermal power retail price increases about 0.06 CNY and 0.030 CNY, respectively, while the RES-E retail price is not affected. The green certificate price decreases about 0.06 CNY. When the quota obligation rises from 10% to 25%, the retail price increases about 0.003 CNY, whereas the wholesale price decreases about 0.06 CNY. The green certificate price is not affected.
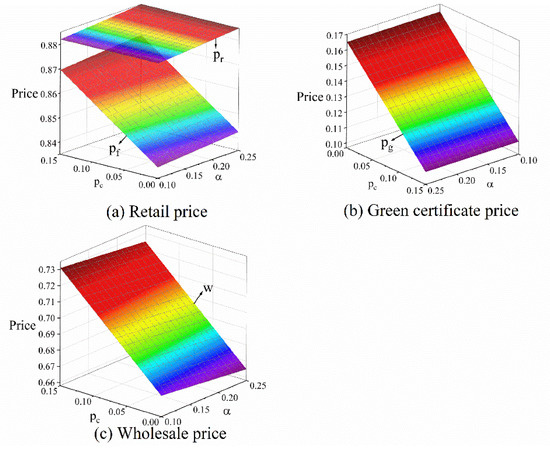
Figure 10.
The trend of the price under different levels of and .
By comparing the price in the three cases, we find that the cooperation between the thermal power generating company and the retailer significantly reduces the thermal power retail price and the green certificate price. However, if the thermal power generating company cooperates with the renewable power generating company, the green certificate price and the RES-E retail price are higher than the scenario with the decentralized decision.
4.2. Numerical Results of the Profit
Now, we further investigated the trend of profits. First, Figure 11 compare the renewable power generating company’s profits (abbreviated as the renewable company’s profit in Figure 11) in case 1 with the profits in case 2. When the permit price rises from 0 CNY to 0.15 CNY, the renewable power generating company’s profits in case 1 and the renewable power generating company’s profits in case 3 increase 0.10 CNY and 0.18 CNY, respectively. However, when the quota obligation rises from 10% to 25%, the renewable power generating company’s profits decreases about 0.07 CNY and 0.04 CNY, respectively. When the consumer’s environmental awareness increases, the renewable power generating company’s profits increase in case 2, whereas the renewable power generating company’s profits initially decrease and then increase in case 1. Furthermore, the range of change for the renewable power generating company’s profit shrinks with the increase in the consumer’s environmental awareness. If the consumer’s environmental awareness is , there is no difference between the renewable power generating company’s profits in cases 1 and 2.
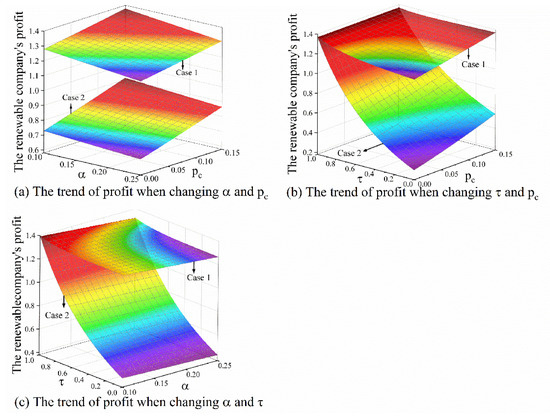
Figure 11.
The renewable power generating company’s profits under different levels of , , and .
The retailer’s profits in case 1 and case 3 are compared in Figure 12. We observe that the retailer’s profits decrease when the permit price, the quota obligation, and the consumer’s environmental awareness increase. If the consumer’s environmental awareness is , the retailer’s profits in case 1 are larger than the profits in case 3 under different levels of and . Nevertheless, the retailer’s profits in case 1 are very sensitive to environmental awareness. In Figure 12c, when the consumer’s environmental awareness rises from 0 to 1, the retailer’s profits in case 1 decrease about 0.52 CNY to 0.55 CNY. If the consumer’s environmental awareness is , the retailer’s profits in case 1 are identical with the profits in case 3.
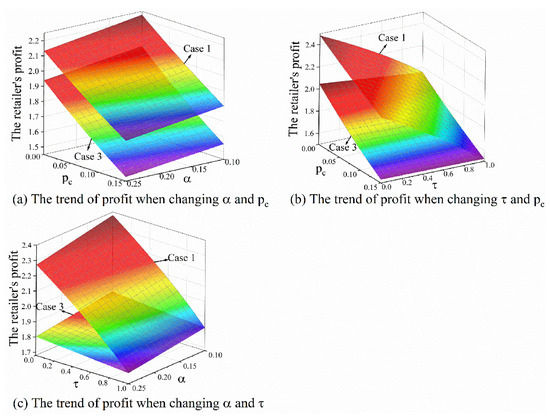
Figure 12.
The retailer’s profits under different levels of , , and .
The comparison between the cooperative profits in case 2 and the cooperative profits in case 3 are shown in Figure 13. The cooperative profits drop when the permit price and quota obligation increase, although the influence of the quota obligation is minor. We find that the profits in case 2 are always larger than the profits in case 3 under different levels of , , and . Furthermore, in Figure 13c, when the consumer’s environmental awareness rises from 0 to 1, the cooperative profits in case 2 decrease about 1.44 CNY to 1.55 CNY, but the cooperative profits in case 3 are not affected by the consumer’s environmental awareness.
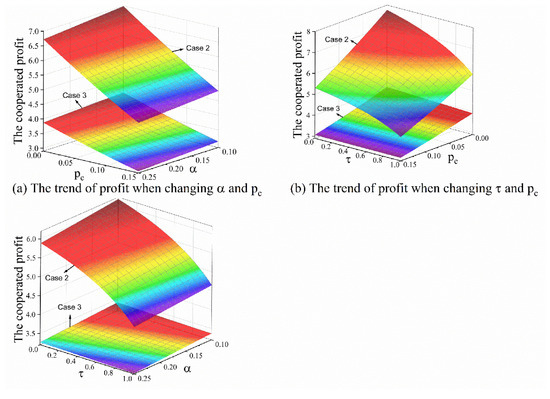
Figure 13.
The thermal power generating company’s profits under different levels of , , and .
Finally, the aggregate profits of the supply chain in different cases are compared in Figure 14. We find that the aggregate profits of different structures decrease as the quota obligation and the permit price increase. The aggregate profits of the supply chain in case 3 are the same under different levels of a consumer’s environmental awareness, whereas the aggregate profits in the other two cases drop when the consumer’s environmental awareness increases. Moreover, the aggregate profits in case 2 are significantly larger than the other two cases under different levels of , , and , while the aggregate profits in case 3 are slightly smaller than the profits in case 1 under different levels of , , and .
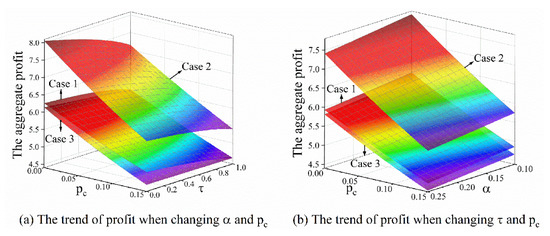
Figure 14.
The aggregate profits of the supply chain under different levels of , , and .
5. Discussion
5.1. The Trend of the Price
Table 2 summarizes the impact of different parameters on the price (see Proposition 2, Proposition 5, Proposition 8, Figure 5, and Figure 8). the symbol + means that the row parameter will rise as the increase in the column parameter. All tables shown in this chapter only discuss the scenario when the consumer’s environmental awareness is . In each table, the number denotes different cases.
Table 2.
The impact of different parameters on the price.
First, we interpreted the policy effects in case 1. If the permit price increases, Table 2 shows that the thermal power generating company passes the increasing costs of emissions on to the retailer, which will dampen the consumer’s demand for power. Therefore, the renewable power generating company charges a lower green certificate price to attenuate the negative impact on its profits, which is consistent with the observation in other researchers’ work [12,15]. Comparing the numerical results of the three cases, it shows that the cost of emissions suffered by consumers in case 2 is the largest among the three cases, i.e., the rise of the permit price will cause the largest increase in the thermal power retail price in case 2. Thus, if the thermal power generating company participates in the retail market and progresses sufficient market power, consumers will feel it is more difficult to afford the carbon cost.
If the quota obligation increases, the retailer passes the increasing costs of green certificates onto the consumer. Similarly, the thermal power generating company charges a lower wholesale price to prevent a decrease in the demand for thermal power. The lower wholesale price also reduces the RES-E retail price, which creates room for the renewable power generating company to charge a higher green certificate price. The inverse ratio relation between the wholesale price and the green certificate price is also reported in [14]. However, numerical results indicate that the impact of the quota obligation on the price is somewhat trivial.
Once consumers have a higher environmental awareness, two types of power will be less substitutable for them. As a result, the gap between the thermal power retail price and the RES-E retail price has less impact on the demand for the power. Thus, the renewable power generating company will charge a higher green certificate price, which brings on an expensive RES-E. Moreover, consumers with higher environmental awareness would recognize that RES-E contains the larger environment value (Figure 5), which agrees with common sense.
The aforementioned analysis can also be employed to explain the phenomenon in case 2. However, when the thermal power generating company establish its own retail company, the thermal power generating company will make the thermal power price be free from the influence of the consumer’s environmental awareness. Numerical results further show that this increasing range is largest in case 2, though the RES-E retail price in case 3 is the highest. As a result, the consumer suffers the highest costs when the permit price and the quota obligation increase in this scenario.
Finally, if the thermal power generating company cooperates with the renewable power generating company, the power generating company optimizes its decision and only charges a lower wholesale price. As a result, the green certificate price is not influenced by the quota obligation, and the RES-E retail price is unchanged as the permit price increases.
Table 3 summarizes the impact of the consumer’s environmental awareness on the rate of change in the price (see Proposition 3, Proposition 6, and Proposition 9). In Table 3, the symbol upward indicates that the effects of the increase in the consumer’s environmental awareness. For example, the first row and the first column indicate that the increase in the environmental awareness will bring on the increase in the rate of change, , in case 1, while the rate of change, , will be same in case 3.
Table 3.
The impact of environmental awareness on the change rate in the price.
Then, we explain the phenomena shown in Table 3. The partial derivative of the demand for power with respect to the permit price is calculated as follows:
The equilibrium results show that and when the consumer’s environmental awareness is . Thus, when the consumer’s environmental awareness increases, the rate of change, , increases, whereas the rate of change, , decreases. Since the equilibrium results show that the and , the increase in the consumer’s environmental awareness reduces the decreasing range of the demand for thermal power and enlarges the decreasing range of the demand for RES-E. Therefore, if the consumer has higher environmental awareness, the thermal power generating company passes larger costs of emissions onto the consumer, whereas the renewable power generating company charges a much lower green certificate price.
The partial derivative of the demand for power with respect to the quota obligation is calculated as follows:
Similarly, the decreasing range of the demand for thermal power increases with the increase of the consumer’s environmental awareness. Therefore, the thermal power generating company further lowers the wholesale price. However, the increase in the consumer’s environmental awareness directly results in a higher retail price. The lower wholesale price cannot offset its negative impact on the demand for RES-E. Thus, the renewable power generating company charges a lower green certificate price.
In conclusion, Table 3 indicates that the increase in the consumer’s environmental awareness gives rise to higher costs suffered by the consumer when the permit price increases. In contrast, a higher consumer’s environmental awareness reduces the costs that the retailer passes onto the consumer when the quota obligation rises.
5.2. The Trend of the Profit
Table 4 summarizes the impact of different parameters on the profit (see Figure 11, Figure 12, Figure 13, and Figure 14), where the number denotes different cases. The table only addresses the scenario when the consumer’s environmental awareness is .
Table 4.
The impacts of different parameters on the profits.
First, we explain the scenario of the decentralized decision. The aforementioned explanation shows that the increase in the permit price gives rise to the decrease in the demand for electricity. As a result, the thermal power generating company’s profits, the cooperative profits, and the aggregate profits of the supply chain drop when the permit price increases. However, the decrease in the demand for RES-E is smaller than the decrease in the demand for thermal power since the rate of change is . As the renewable power generating company also benefits from a higher wholesale price, the renewable power generating company’s profits increase when the permit price increases.
On the other hand, the rise of the quota obligation results in the decrease in the wholesale price and the increase in the green certificate price, but a higher green certificate price cannot offset the negative impact of a higher retail price on the demand for RES-E. Thus, the renewable power generating company’s profits drop when the quota obligation rises. Moreover, the thermal power retail price might be higher than the RES-E retail price in case 1 (see Figure 4, Figure 5 and Figure 6). This means that whether the increase in the consumer’s environmental awareness increases the demand for the thermal power or RES depends on the permit price and the consumer’s environmental awareness. Therefore, the impact of the consumer’s environmental awareness on power generating companies’ profits is indefinite.
When the thermal power generating company cooperates with the retailer, the RES-E retail price is always higher than the thermal power retail price (see Figure 7, Figure 8, Figure 9 and Figure 10). Thus, the rise of the consumer’s environmental awareness increases the demand for the renewable power generating company, which benefits the renewable power generating company. Moreover, this cooperation causes a noticeable drop in the thermal power retail price. Both the member’s profits and the aggregated profits of the supply chain significantly increase, but the profits become more sensitive to the change of environmental awareness. On the other hand, when the power generating companies cooperate, the member’s profits and the aggregated profits are no longer affected by the consumer’s environmental awareness. However, the power generating companies receive higher profits at the expense of the aggregate profits of the supply chain.
6. Conclusions and Policy Implications
This study investigated the policy effects of the policy mix concerning RPS and ET when the retailer is required to comply with a quota obligation. To avoid bearing the whole cost of green certificates, the retailer usually charges different prices for the two types of power. The substitutability of the two types of power for the consumer is captured by the concept of the consumer’s environmental awareness. The two-stage game paradigm was used to resolve the problem, and the policy effects in different supply chain network structures were compared by numerical examples.
In the decentralized decision-making scenario, the ET not only makes the environment costs reflect in the higher wholesale price, but also forces the renewable power generating company to charge a lower green certificate price. In contrast, the rise of the quota obligation causes a lower wholesale price and a higher green certificate price. In general, both the increase in the permit price and the rise of the quota obligation brings on a less affordable electricity fee and a less profitable supply chain. The policymaker hopes that the implementation of RPS will boost the development of RES-E. Nevertheless, our study shows that the increase in the quota obligation causes a drop in the renewable power generating company’s profits.
On the other hand, although the increase in the permit price also gives rise to a higher retail price, the renewable power generating company benefits from the higher wholesale price and the shrinking gap between the RES-E retail price and the thermal power retail price. As a result, the renewable power generating company’s profits increase as the permit price rises. Thus, a level field for the price competition between thermal power and RES-E might be more beneficial than the fixed quota of RES-E consumption for the renewable power generating company.
Furthermore, if the permit price increases, the retailer passes the majority of the increase on to the consumer of thermal power. In contrast, if the quota obligation rises, the retailer passes the majority of the increasing costs on to the consumer of RES-E. Thus, differential pricing attenuates the negative impact of the markup on the consumer’s demand. Therefore, the differential pricing also improves the retailer’s flexibility when passing the increasing costs onto the consumer.
However, the increase in the consumer’s environmental awareness gives rise to undesirable consequences. First, a higher environmental awareness makes the retailer charge a higher price, which reduces the aggregate profits of the supply chain. Thus, the lack of substitutability of the two types of power causes a less profitable supply chain. Second, a higher consumer environmental awareness makes the consumer bear larger costs of carbon emissions that the thermal power generating company passes onto them. This is not consistent with the policy maker’s intentions because the thermal power generating company rather than the consumer should pay for the environment costs. Moreover, the retailer may hope that the consumer’s higher environmental awareness will attenuate the costs of the green certificates suffered by them. In contrast, the increase in the consumer’s environmental awareness reduces the retailer’s profits and the cost of green certificates that the retailer passes on the consumer.
Finally, compared with the aforementioned results in the decentralized decision scenario, the supply chain network structure significantly influences the policy effects. One may argue that cooperation enhances the market power, but this study showed that results are complicated. Indeed, if the thermal power generating company cooperates with the retailer, the consumer suffers the highest costs that the retailer passes on them, and may prefer to feel that the emission cost and compliance cost are less affordable. However, this cooperation significantly reduces the thermal power retail price, which benefits all members of the supply chain. In the other case, cooperation between power generating companies results in an increase in the retail price, but it reduces the costs that the retailer passes on to the consumer who buys RES-E. Furthermore, the cooperation between the thermal power generating company and the retailer makes the cooperative profits and the renewable power generating company’s profits very sensitive to the consumer’s environmental awareness, whereas the cooperation between the power generating companies removes the impact of the consumer’s environmental awareness. In the latter scenario, the green certificate price remains unchanged when the quota obligation increases, and the RES-E retail price is not affected by the increase in the permit price.
Care should be taken when transferring findings based on the relatively simplified model to the realistic evaluation of policy effects. There are several factors influencing policy effects that may not be substantially captured in this paper. On the one hand, the competition between retailers and the competition between power generating companies do not factor in this study. On the other hand, electricity is a unique product that cannot be stored, and its transmission is limited by diverse security and stability requirements. Therefore, the analysis of the policy effects considering the competition between multiple supply chains and physical limitations will be our future work.
Author Contributions
W.Z., X.B., G.Y., and H.B. devise the research. G.Y. and W.Z. calculated the results. W.Z. and X.B. were responsible for the overall editing of the paper. X.W. was responsible for the data visualization and analyzed the results. H.B. provides the data of numerical results and gave valuable information concerning the Chinese renewable portfolio standards.
Funding
This work was supported by The Ministry of Education of Humanities and Social Science project, grant number 18YJAZH138.
Acknowledgments
The Authors are grateful to Bobo Chen for the insightful discussion. We also thank Huimin Yang for her comments on the illustration and to all anonymous reviewers for their contributions to improve this paper.
Conflicts of Interest
The authors declare no conflict of interest.
Appendix A
Proof of Theorem 1.
The retailer’s profit maximization problem is described as:
The Hessian matrix of retailer’s profit function is calculated as:
The Hessian matrix is negative definite. Thus, there is a unique solution to the problem:
The thermal power generating company’ profit maximization problem is described as:
The renewable power generating company’ profit is described maximization problem as:
Substitute the retail price with and in functions (A.5) and (A.6), and the second derivative of cooperative profit function is calculated as:
Thus, there is a unique solution to the problem:
Plug the solution back to the and :
Q.E.D.
Proof of Theorem 2.
The cooperative profit maximization problem is described as:
The Hessian matrix of retailer’s profit function is calculated as:
The Hessian matrix is negative definite. Thus, there is a unique solution to the problem:
The renewable power generating company’ profit is described maximization problem as:
Substitute the retail price with and in functions (A.17), and the second derivative of power generating companies’ profit function is calculated as:
Thus, there is a unique solution to the problem:
Plug the solution back to the and :
Q.E.D.
Proof of Theorem 3.
The retailer’s profit maximization problem is described as:
The Hessian matrix of retailer’s profit function is calculated as:
The Hessian matrix is negative definite. Thus, there is a unique solution to the problem:
The cooperative profit maximization problem is described as:
Substitute the retail price with and in functions (A.26), and the second derivative of cooperative profit function is calculated as:
The Hessian matrix is negative definite. Thus, there is a unique solution to the problem:
Plug the solution back to the and :
Q.E.D.
Appendix B
Proof of Proposition 2.
The equilibrium result of case 1 is shown in the Equation (A.9), the Equation (A.10), the Equation (A.11), and the Equation (A.12). Take the partial derivative with permit price :
For the consumer’s environmental awareness , we obtain , , , and .
Take the partial derivative with quota obligation :
For the consumer’s environmental awareness , we obtain , , , and .
Q.E.D.
Proof of Proposition 3.
Differentiates equilibrium results in case 1 with respect to and :
For the consumer’s environmental awareness , we obtain , , , and .
Differentiates equilibrium results in case 1 with respect to and :
When the consumer’s environmental awareness , we obtain , , , and .
Q.E.D.
Proof of Proposition 4.
Take the partial derivative with permit price :
For the consumer’s environmental awareness , we obtain and . If , we have .
Take the partial derivative with quota obligation :
For the consumer’s environmental awareness , we obtain and . If , we have .
Q.E.D.
Proof of Proposition 5.
Differentiates equilibrium results in case 2 with respect to and :
For the consumer’s environmental awareness , we obtain .
Differentiates equilibrium results in case 2 with respect to and :
For the consumer’s environmental awareness , we obtain .
Q.E.D.
Proof of Proposition 6.
Take the partial derivative with permit price :
For the consumer’s environmental awareness , we obtain , , and . Take the partial derivative with quota obligation :
For the consumer’s environmental awareness , we obtain , , and .
Take the partial derivative with permit price and quota obligation :
Differentiates equilibrium results in case 2 with respect to and :
Q.E.D.
References
- National Energy Administration. Opinions Concerning the Institution of a System of Guiding Development and Utilization of Renewable Energy. 2016. Available online: http://zfxxgk.nea.gov.cn/auto87/201603/t20160303_2205.htm (accessed on 8 January 2019).
- Peng, L. The Contemplation of Renewable Portfolio Standards and Green Certificate Trading. China Energy News. 2017. Available online: http://paper.people.com.cn/zgnyb/html/2017-04/03/content_1764051.htm (accessed on 8 January 2019).
- Haas, R.; Resch, G.; Panzer, C.; Busch, S.; Ragwitz, M.; Held, A. Efficiency and effectiveness of promotion systems for electricity generation from renewable energy sources–lessons from EU countries. Energy 2011, 36, 2186–2193. [Google Scholar] [CrossRef]
- Verbruggen, A.; Lauber, V. Assessing the performance of renewable electricity support instruments. Energy Policy 2012, 45, 635–644. [Google Scholar] [CrossRef]
- Darmani, A.; Rickne, A.; Hidalgo, A.; Arvidsson, N. When outcomes are the reflection of the analysis criteria: A review of the tradable green certificate assessments. Renew. Sustain. Energy Rev. 2016, 62, 372–381. [Google Scholar] [CrossRef]
- Choi, G.; Huh, S.-Y.; Heo, E.; Lee, C.-Y. Prices versus quantities: Comparing economic efficiency of feed-in tariff and renewable portfolio standard in promoting renewable electricity generation. Energy Policy 2018, 113, 239–248. [Google Scholar] [CrossRef]
- National Energy Administration. Notice of Implementing Renewable Portfolio Standards (Consultation Paper), 2018. Available online: http://www.nea.gov.cn/2018-11/15/c_137607356.htm (accessed on 8 January 2019).
- National Development and Reform Commission. The Scheme for Institution National Carbon Emission Trading. 2017. Available online: http://www.ndrc.gov.cn/zcfb/gfxwj/201712/t20171220_871127.html (accessed on 8 January 2019).
- Sorrell, S.; Sijm, J. Carbon trading in the policy mix. Oxf. Rev. Econ. Policy 2003, 19, 420–437. [Google Scholar] [CrossRef]
- Rogge, K.S.; Reichardt, K. Policy mixes for sustainability transitions: An extended concept and framework for analysis. Res. Policy 2016, 45, 1620–1635. [Google Scholar] [CrossRef]
- Rogge, K.S.; Kern, F.; Howlett, M. Conceptual and empirical advances in analysing policy mixes for energy transitions. Energy Res. Soc. Sci. 2017, 33, 1–10. [Google Scholar] [CrossRef]
- Amundsen, E.S.; Mortensen, J.B. The danish green certificate system: Some simple analytical results. Energy Econ. 2001, 23, 489–509. [Google Scholar] [CrossRef]
- Morthorst, P.E. Interactions of a tradable green certificate market with a tradable permits market. Energy Policy 2001, 29, 345–353. [Google Scholar] [CrossRef]
- Jensen, S.G.; Skytte, K. Interactions between the power and green certificate markets. Energy Policy 2002, 30, 425–435. [Google Scholar] [CrossRef]
- Böhringer, C.; Behrens, M. Interactions of emission caps and renewable electricity support schemes. J. Regul. Econ. 2015, 48, 74–96. [Google Scholar] [CrossRef]
- Siddiqui, A.S.; Tanaka, M.; Chen, Y. Are targets for renewable portfolio standards too low? The impact of market structure on energy policy. Eur. J. Oper. Res. 2016, 250, 328–341. [Google Scholar] [CrossRef]
- Jensen, S.G.; Skytte, K. Simultaneous attainment of energy goals by means of green certificates and emission permits. Energy Policy 2003, 31, 63–71. [Google Scholar] [CrossRef]
- Linares, P.; Santos, F.J.; Ventosa, M.; Lapiedra, L. Incorporating oligopoly, CO2 emissions trading and green certificates into a power generation expansion model. Auotamatica 2008, 44, 1608–1620. [Google Scholar] [CrossRef]
- Amundsen, E.; Bergman, L. Green certificates and market power on the Nordic power market. Energy J. 2012, 33, 101–117. [Google Scholar] [CrossRef]
- Tanaka, M.; Chen, Y. Market power in renewable portfolio standards. Energy Econ. 2013, 39, 187–196. [Google Scholar] [CrossRef]
- Dong, Y.; Shimada, K. Evolution from the renewable portfolio standards to feed-in tariff for the deployment of renewable energy in Japan. Renew. Energy 2017, 107, 590–596. [Google Scholar] [CrossRef]
- Böhringer, C.; Keller, A.; Bortolamedi, M.; Rahmeier Seyffarth, A. Good things do not always come in threes: On the excess cost of overlapping regulation in EU climate policy. Energy Policy 2016, 94, 502–508. [Google Scholar] [CrossRef]
- del Río, P.; Cerdá, E. The missing link: The influence of instruments and design features on the interactions between climate and renewable electricity policies. Energy Res. Soc. Sci. 2017, 33, 49–58. [Google Scholar] [CrossRef]
- Tsao, C.C.; Campbell, J.E.; Chen, Y. When renewable portfolio standards meet cap-and-trade regulations in the electricity sector: Market interactions, profits implications, and policy redundancy. Energy Policy 2011, 39, 3966–3974. [Google Scholar] [CrossRef]
- Böhringer, C.; Rosendahl, K.E. Green promotes the dirtiest: On the interaction between black and green quotas in energy markets. J. Regul. Econ. 2010, 37, 316–325. [Google Scholar] [CrossRef]
- Wu, J.; Fan, Y.; Xia, Y. How can China achieve its nationally determined contribution targets combining emissions trading scheme and renewable energy policies? Energies 2017, 10, 1166. [Google Scholar] [CrossRef]
- Park, J.Y.; Ahn, N.S.; Yoon, Y.B.; Koh, K.H.; Bunn, D.W. Investment incentives in the Korean electricity market. Energy Policy 2007, 35, 5819–5828. [Google Scholar] [CrossRef]
- Lipp, J. Lessons for effective renewable electricity policy from Denmark, Germany and the United Kingdom. Energy Policy 2007, 35, 5481–5495. [Google Scholar] [CrossRef]
- Jacobsson, S.; Bergek, A.; Finon, D.; Lauber, V.; Mitchell, C.; Toke, D.; Verbruggen, A. Eu renewable energy support policy: Faith or facts? Energy Policy 2009, 37, 2143–2146. [Google Scholar] [CrossRef]
- Bergek, A.; Jacobsson, S. Are tradable green certificates a cost-efficient policy driving technical change or a rent-generating machine? Lessons from Sweden 2003–2008. Energy Policy 2010, 38, 1255–1271. [Google Scholar] [CrossRef]
- Nicolini, M.; Tavoni, M. Are renewable energy subsidies effective? Evidence from Europe. Renew. Sustain. Energy Rev. 2017, 74, 412–423. [Google Scholar] [CrossRef]
- Gillenwater, M. Redefining recs—Part 2: Untangling certificates and emission markets. Energy Policy 2008, 36, 2120–2129. [Google Scholar] [CrossRef]
- Gillenwater, M. Redefining recs—Part 1: Untangling attributes and offsets. Energy Policy 2008, 36, 2109–2119. [Google Scholar] [CrossRef]
- Gillenwater, M.; Breidenich, C. Internalizing carbon costs in electricity markets: Using certificates in a load-based emissions trading scheme. Energy Policy 2009, 37, 290–299. [Google Scholar] [CrossRef]
- Schusser, S.; Jaraitė, J. Explaining the interplay of three markets: Green certificates, carbon emissions and electricity. Energy Econ. 2018, 71, 1–13. [Google Scholar] [CrossRef]
- Blindheim, B. A missing link? The case of Norway and Sweden: Does increased renewable energy production impact domestic greenhouse gas emissions? Energy Policy 2015, 77, 207–215. [Google Scholar] [CrossRef]
- del Río, P. Why does the combination of the European union emissions trading scheme and a renewable energy target makes economic sense? Renew. Sustain. Energy Rev. 2017, 74, 824–834. [Google Scholar] [CrossRef]
- Helgesen, P.I.; Tomasgard, A. An equilibrium market power model for power markets and tradable green certificates, including Kirchhoff’s laws and nash-Cournot competition. Energy Econ. 2018, 70, 270–288. [Google Scholar] [CrossRef]
- Liu, Z.; Anderson, T.D.; Cruz, J.M. Consumer environmental awareness and competition in two-stage supply chains. Eur. J. Oper. Res. 2012, 218, 602–613. [Google Scholar] [CrossRef]
- Choi, S.C. Price competition in a duopoly common retailer channel. J. Retail. 1996, 72, 117–134. [Google Scholar] [CrossRef]
- Li, L.; Zhang, H. Confidentiality and information sharing in supply chain coordination. Manag. Sci. 2008, 54, 1467–1481. [Google Scholar] [CrossRef]
- Wang, X.Y.; Xue, M.G.; Xing, L. Analysis of carbon emission reduction in a dual-channel supply chain with cap-and-trade regulation and low-carbon preference. Sustainability 2018, 10, 18. [Google Scholar]
- National Development and Reform Commission. Notice of Lowering the Feed-In Tariff for Thermal Power and Commerce and Industry Electricity Price. 2015. Available online: http://www.ndrc.gov.cn/zwfwzx/zfdj/jggg/201512/t20151230_769630.html. (accessed on 8 January 2019).
- National Development and Reform Commission. Notice of Adjusting Feed-In Tariff for Photovoltaic Power and Onshore Wind Power. 2016. Available online: http://www.ndrc.gov.cn/zcfb/zcfbtz/201612/t20161228_833049.html (accessed on 8 January 2019).
- China‘s Emissions Trading Market. Available online: http://www.tanpaifang.com/tanhangqing/ (accessed on 13 January 2019).
- National Energy Administration, National Statistics of Power Industry. 2017. Available online: http://www.nea.gov.cn/2018-01/22/c_136914154.htm (accessed on 13 January 2019).


© 2019 by the authors. Licensee MDPI, Basel, Switzerland. This article is an open access article distributed under the terms and conditions of the Creative Commons Attribution (CC BY) license (http://creativecommons.org/licenses/by/4.0/).