1. Introduction
With the installation of the 30 MW Hywind pilot project in 2017 and the ongoing works on the 50 MW Kincardine farm, floating offshore wind turbines (FOWTs) are now a commercial reality. However, many floating wind platform concepts are still progressing through the technology readiness levels (TRLs) via a combination of experimental and physical testing, and over 30 such concepts were identified in [
1]. The progression of these technologies through the TRLs has resulted in a wealth of fundamental research in the areas of both physical and numerical hydrodynamics to support advancement to commercialisation.
In terms of physical testing of FOWTs, research has focused on increasing accuracy or realism through the introduction of wind turbine emulation systems, such as pulleys, ducted fans, Software-in-Loop, rotating weighted beams, and fully Reynolds scaled turbines, designed to operate at the Froude scaled timescales of a wave basin test campaign. A review of the available options and recent development are presented in [
2,
3]. It is generally accepted that these wind turbine emulation systems increase the realism of wave basin testing by allowing the impact of atmospheric turbulence, turbine control algorithms, and the contribution of platform motion to the wind speed experienced across the rotor to be considered. However, there has been little consideration of the impact of increasingly realistic wave basin representations of FOWTs on testing uncertainty.
This paper examines the impact on testing uncertainty in a laboratory environment observed by introducing wind thrust and gyroscopic rotor loading on a 1:36 Froude scaled multirotor floating platform. This work will inform the analysis in the H2020 project, MaRINET2 Offshore Wind Round Robin Tests, in which the FP7 INNWIND semi-submersible platform will be tested at a scale of 1:60 across four separate European test facilities using a range of wind emulation systems during 2019 and 2020.
2. Uncertainty Assessment
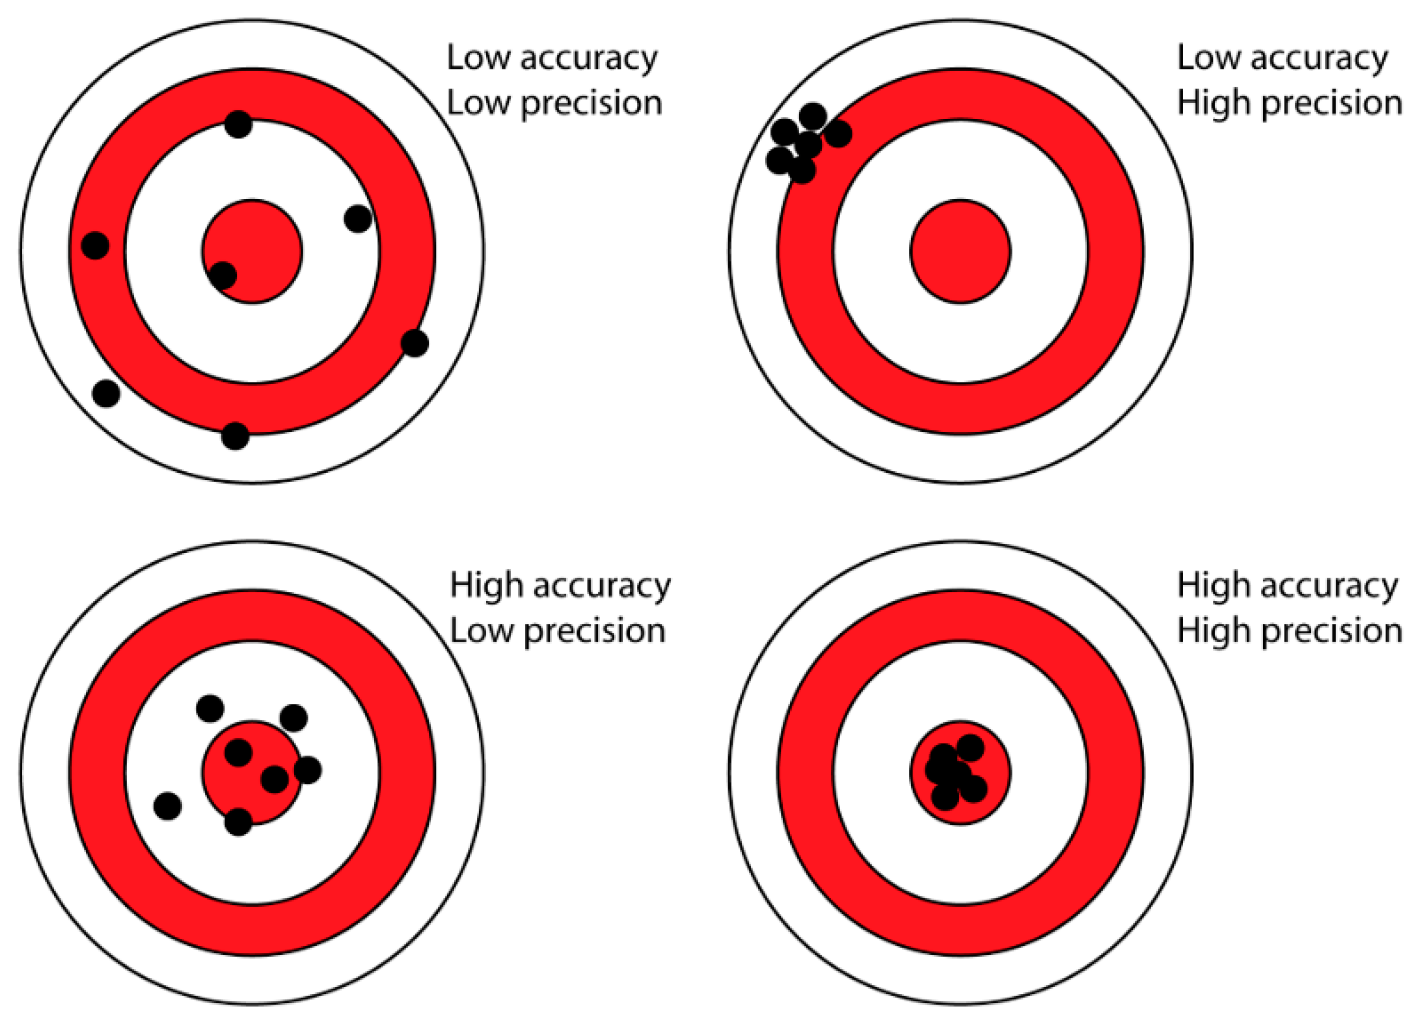
The title of this paper refers to a potential trade-off between accuracy and precision when undertaking experimental testing of FOWTs. Different terminology is used in various sources; in this paper, accuracy is taken to be a measure of how close the results achieved at the model scale are to the ‘real’ value, i.e., what would be observed for a fully operating FOWT at full scale. Precision is taken to be a measure of the scatter observed in the results at the model scale, i.e., the repeatability of the tests. Together, accuracy and precision are taken as measures of experimental uncertainty. These definitions are summarised graphically in
Figure 1, where the centre of the target is the “real” value and the black dots are experimental assessments of this value.
There is a long history of model testing in the shipbuilding sector stretching back to the work of Leonardo da Vinci in the 1500s, however, the systematic assessment of experimental uncertainty has only emerged in the past 15 years [
4]. Guidelines are provided for the assessment of uncertainty in tank testing by both ASME [
5] and the ITTC [
6] with specific guidance provided by the ITTC for the testing of offshore wind turbines [
7]. However, these are guidelines only and do not provide a systemic approach for the assessment of experimental uncertainty, an unenviable task given the broad spectrum of testing undertaken in wave basins facilities. As the physical testing of FOWTs is relatively new, a standardised approach has yet to emerge and thus a quantification of experimental uncertainty is often absent from the relevant literature. For example, in [
8,
9,
10,
11], experimental uncertainty was not addressed, whilst in [
12,
13,
14,
15,
16,
17], comparisons between numerical and physical data were presented, which can be considered a measure of experimental accuracy, but with no assessment of experimental precision.
There are exceptions to this trend of omitting an assessment of experimental uncertainty in FOWT test campaigns. Most notably, in a recent paper [
18], the subject of which is a test campaign on the OC5-DeepCwind semisubmersible platform at a scale of 1:50. The authors followed the uncertainty assessment guidelines provided by ASME [
5], identified all potential sources of experimental uncertainty, and quantified some examples, such as wave elevation, model centre of gravity determination, platform motions, and mooring line loads. The ultimate aim of the work presented in [
18] was to quantify all sources of both experimental precision and accuracy for a particular test campaign and to propagate using statistical techniques to determine an overall threshold for experimental uncertainty. The motivation for this rigorous assessment were the requirements of the OC5 community to allow a meaningful inter-comparison of their increasingly advanced FOWT numerical simulations with a robust physical validation dataset.
This paper does not attempt to quantify all sources of experimental uncertainty, but focuses specifically on the precision of measured model responses (pitch, surge, heave) and mooring line loads. A methodology and metric are presented, which allow the precision across the full time series to be assessed rather than focusing on the variation observed in statistical measures, such as max, mean, standard deviation, or variation in the top 10 peaks. Whilst this methodology was devised specifically to examine the impact of rotor thrust and gyroscopic loading on the experimental precision of the considered test campaign, it also provides an insight into the dynamic nature of experimental precision and allows for robust comparison with numerical models across the full time series. This may be particularly useful for identifying the points in a time series at which numerical and physical results diverge or for understanding system fatigue, where an appreciation of potential dynamic loadings and their relative variations are key.
3. Validation Data
The validation data for this paper was sourced from an experimental test campaign considering the SCDnezzy2 platform in the Lir National Ocean Test Facility (NOTF). Details are provided below.
3.1. SCDNezzy2
A multirotor FOWT is being developed by aerodyn engineering gmbh, Büdelsdorf, Germany. The technology consists of a turret mooring system, a semisubmersible platform, and 2 No. 7.5 MW wind turbines. The platform is referred to as SCDnezzy
2 and the 1:36 Froude scaled non-elastic model considered during the test campaign is presented in
Figure 2. The turret mooring system is connected to the keel of the bow vertical leg. At the model scale, SCDnezzy
2 has a total length of 2.6 m, hub height of 2.4 m, freeboard of 0.5 m, draft of 0.4 m, and total mass of approximately 135 kg. The full details of the SCDnezzy2 design are commercially sensitive.
Wind thrust during the experimental campaign was simulated using 2 No. 89 mm ducted fans (Midi Fan pro ducted fan unit / HET 650-68-1500). During testing, both fans were set at a thrust of 10 N, equivalent to the full scale thrust, which would be expected at approximately 6.5 m/s during operation [
19]. The ducted fans were connected to a 3-axis load cell (Applied Measurements Limited Three Axis Force Sensor OBUXYZ120, 500N rating, non-linearity 0.2%, hysteresis 0.02%), which was used to calibrate and balance the fan thrusts prior to the commencement of testing. In order to set the fans’ thrust, the floor of the Deep Ocean Basin was first raised to lift the model out of the water. The control settings for both fans were then adjusted to provide a downwind thrust of 10 N on each tower as measured using the 3-axis load cell. Once the thrust settings were balanced and consistent, the floor was dropped to the required level for testing. This process was conducted once prior to starting the testing outlined in this paper, thus ensuring that the same thrust and fan configuration was used for all tests. Fan thrust was also monitored during testing, however, these data are less reliable due to the motions of the floating platform.
Gyroscopic rotor loading was simulated by 2 No. weighted rotating beams. Each rotating beam consisted of a 25 mm × 10 mm × 1350 mm aluminum beam, with a mass of 732 g. Lead was added to both ends of each beam to bring the total mass per beam to 2 kg. These beams were rotated at a constant 76.2 RPM by use of stepper motors (NEME 23–60 mm High Torque Stepper Motors). During the testing examined in this paper, the beams were contra-rotating and in sync (i.e., both were vertical/horizontal at the same time). The rotating beams were kept in sync by providing a single control signal (produced by an Arduino Mega 2560) to both stepper motor drivers (DMD556 Digital Stepper Drive). The control signal frequency was gradually ramped up/down over a period of one minute to provide a soft start/stop for the rotating beams. Both beams were placed in the horizontal position prior to beginning each test to ensure consistency of the experimental approach. The synchronicity and rotation speed of the beams were confirmed by filming both beams for a period of 1 min during testing.
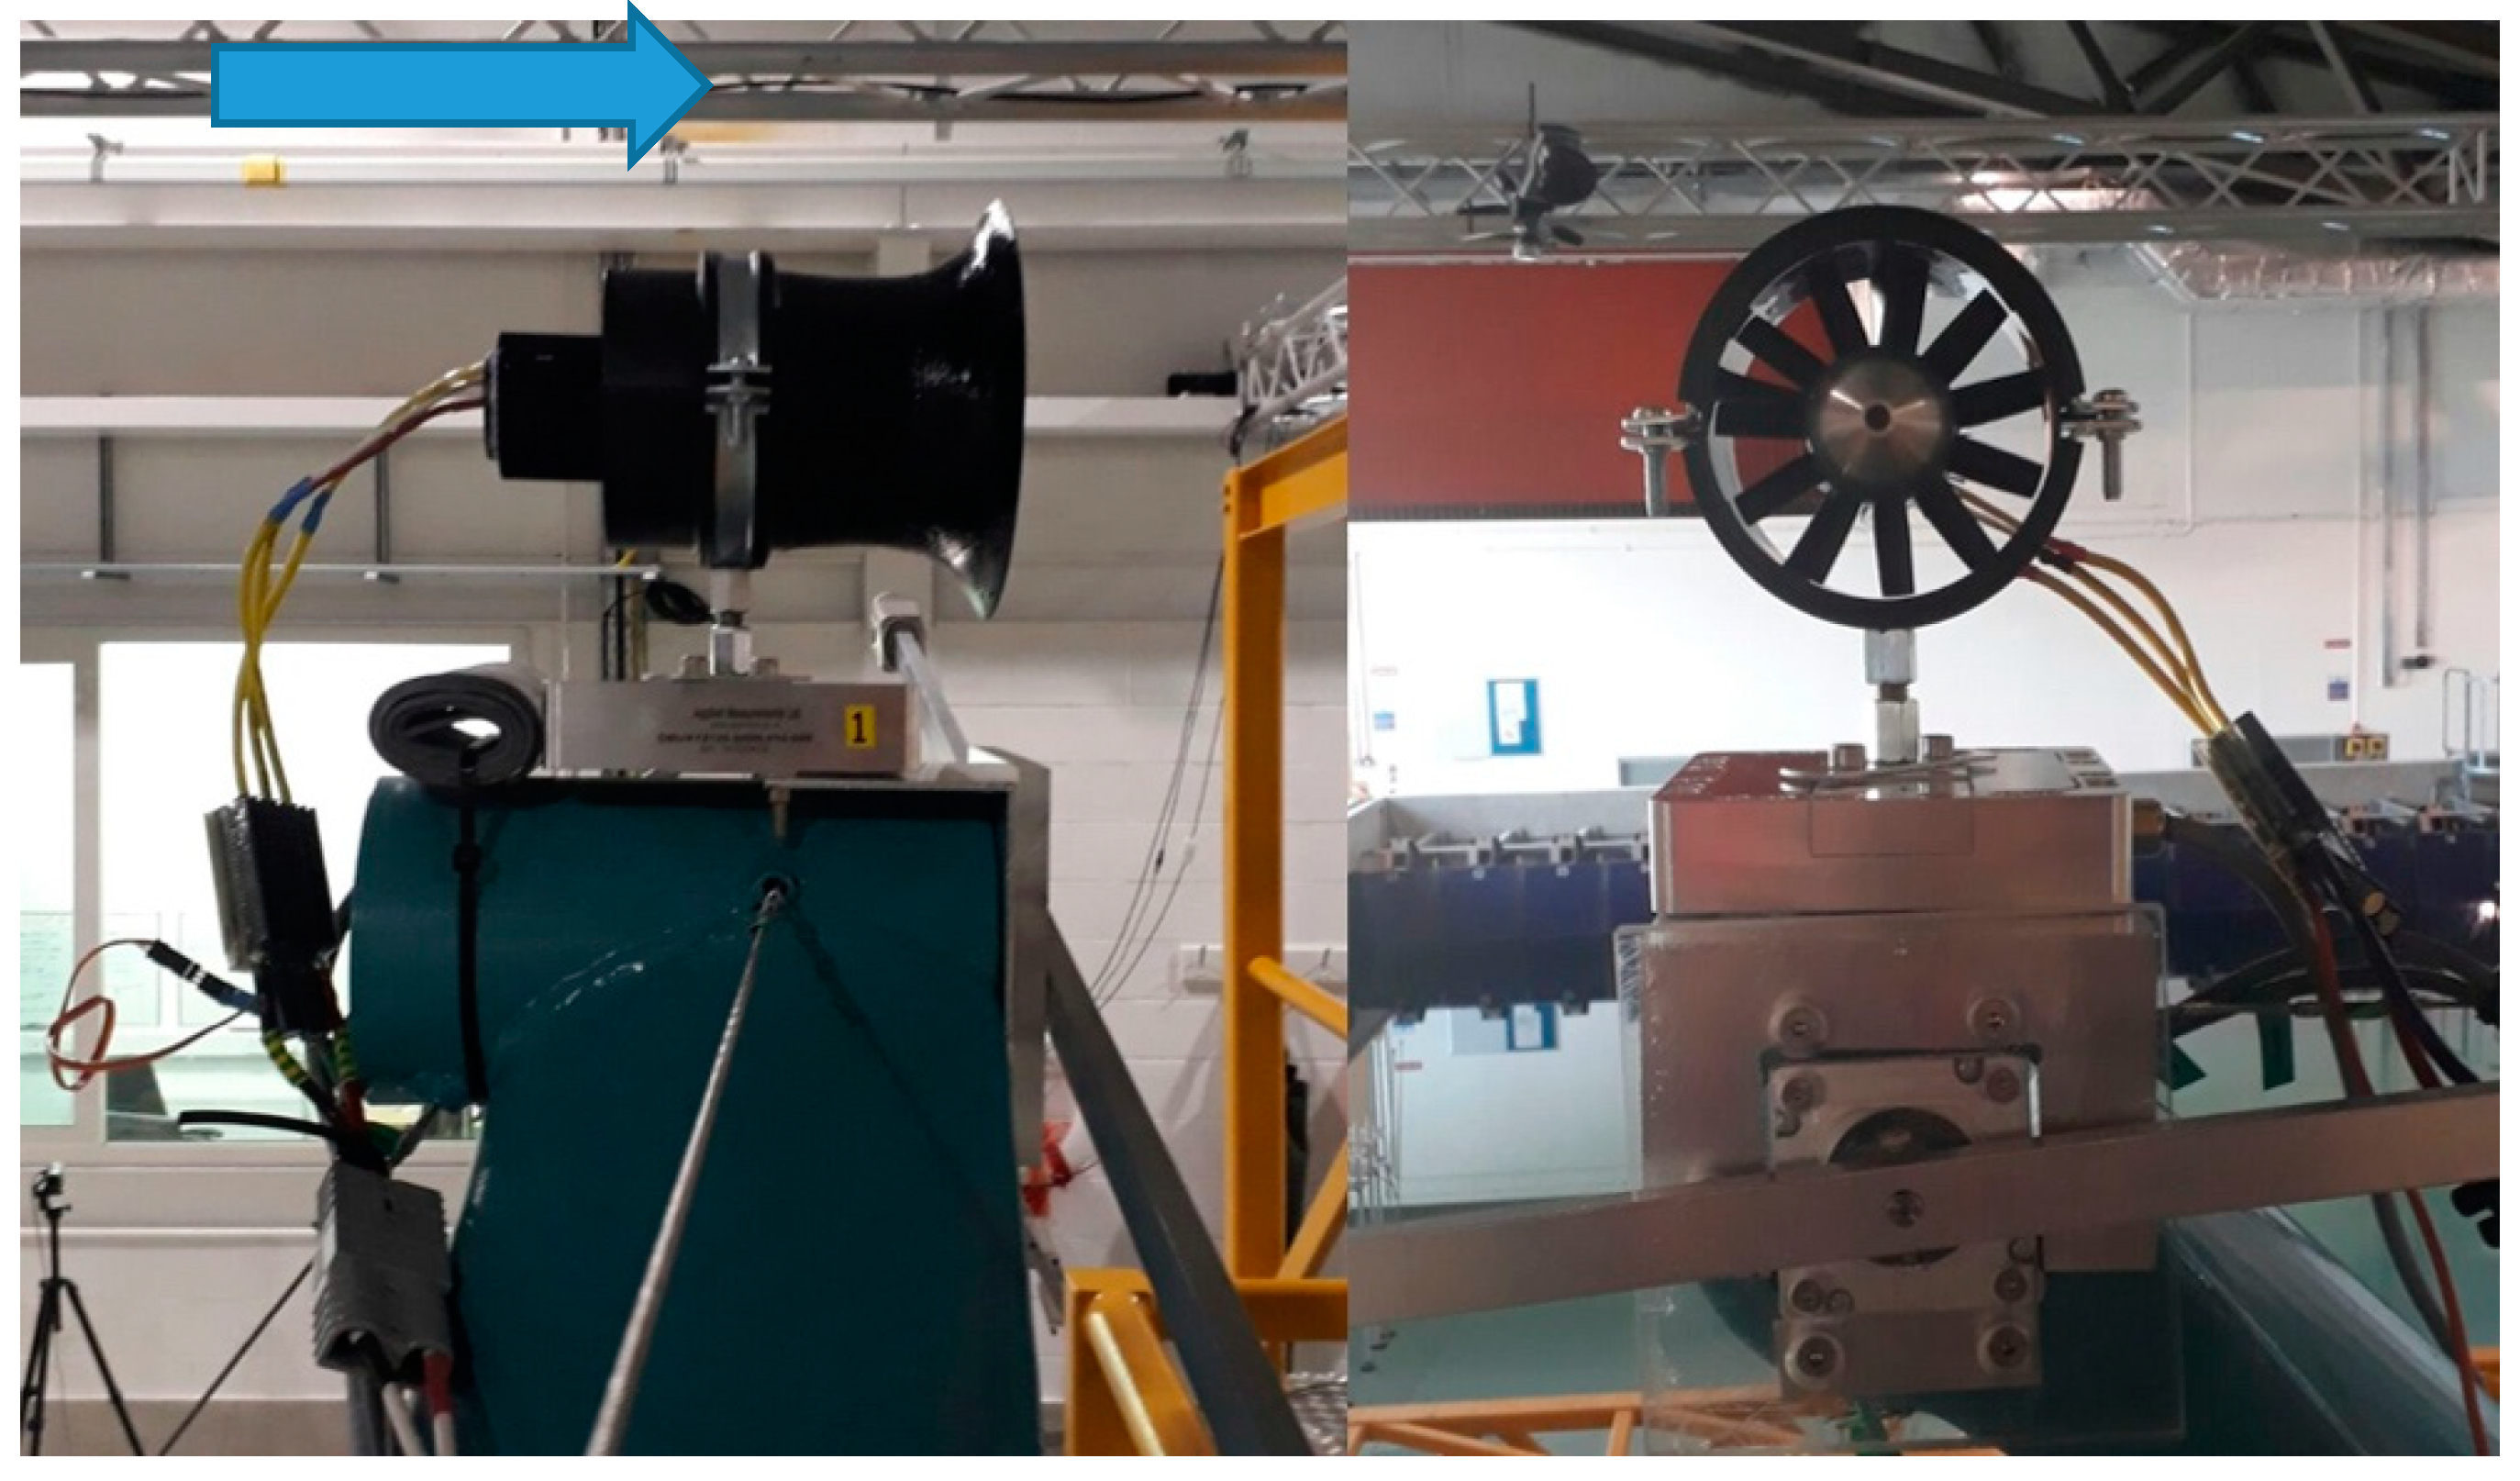
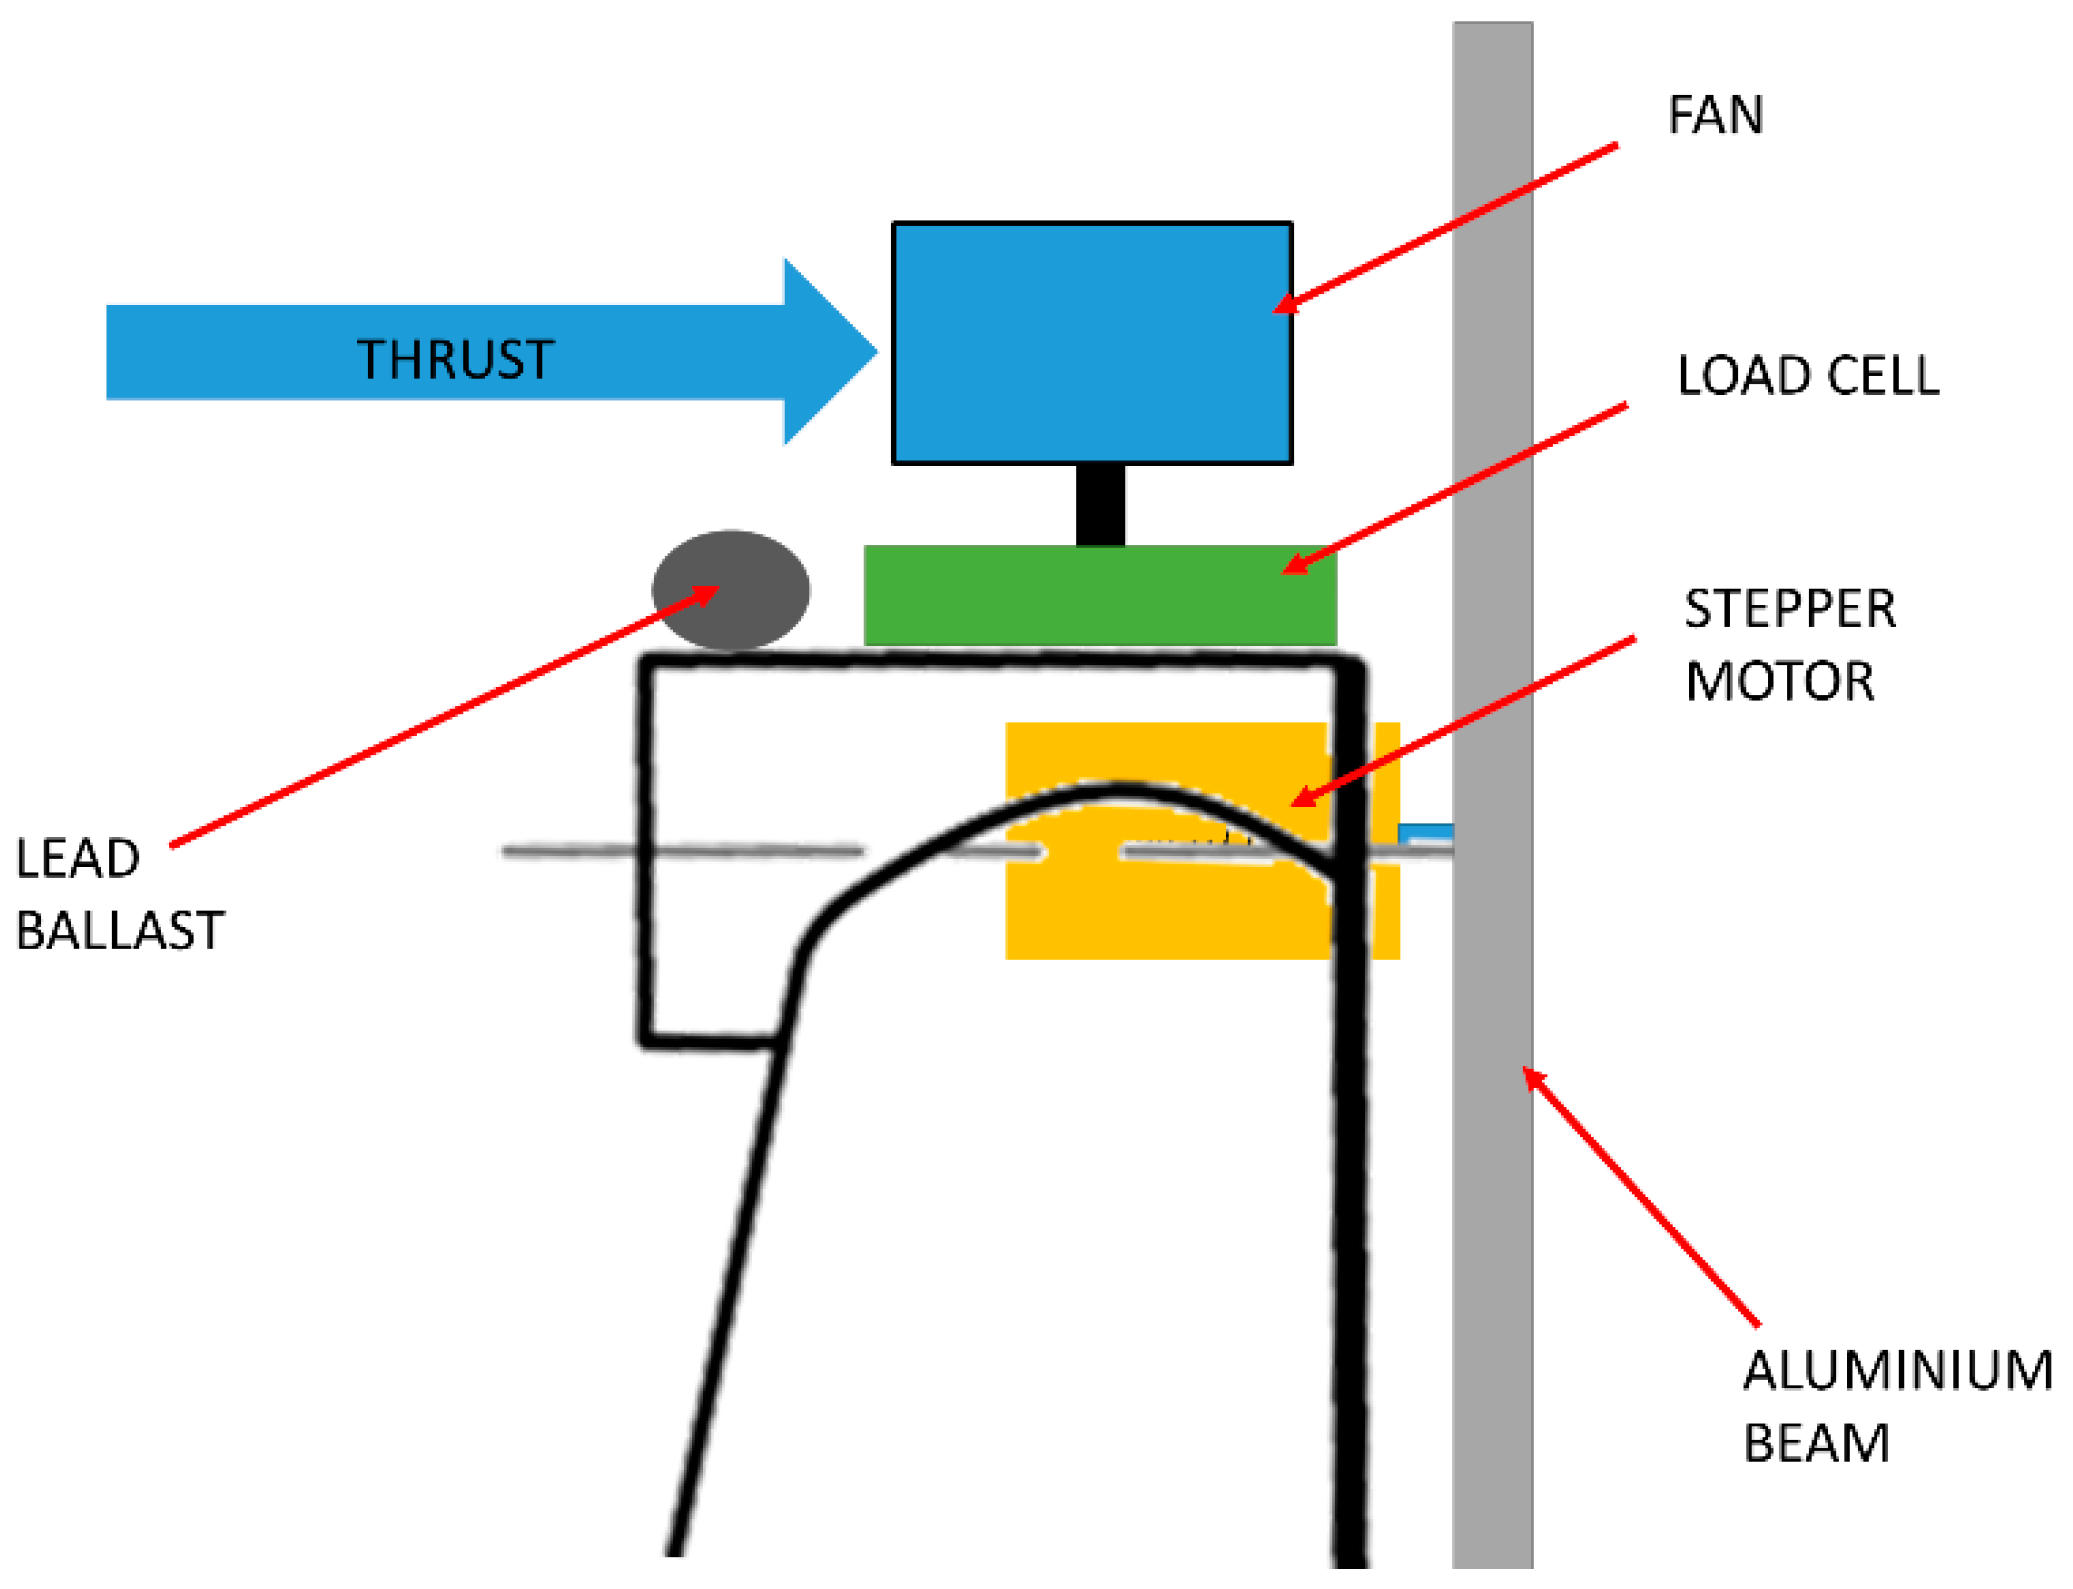
The experimental configuration at each nacelle is shown in
Figure 3, and the direction of the wind thrust is indicated by the blue arrow. Further views and schematics are provided in
Figure 4,
Figure 5 and
Figure 6. As can be seen, the rotating weighted beams intermittently obstructed the air intakes of the ducted fans during operation.
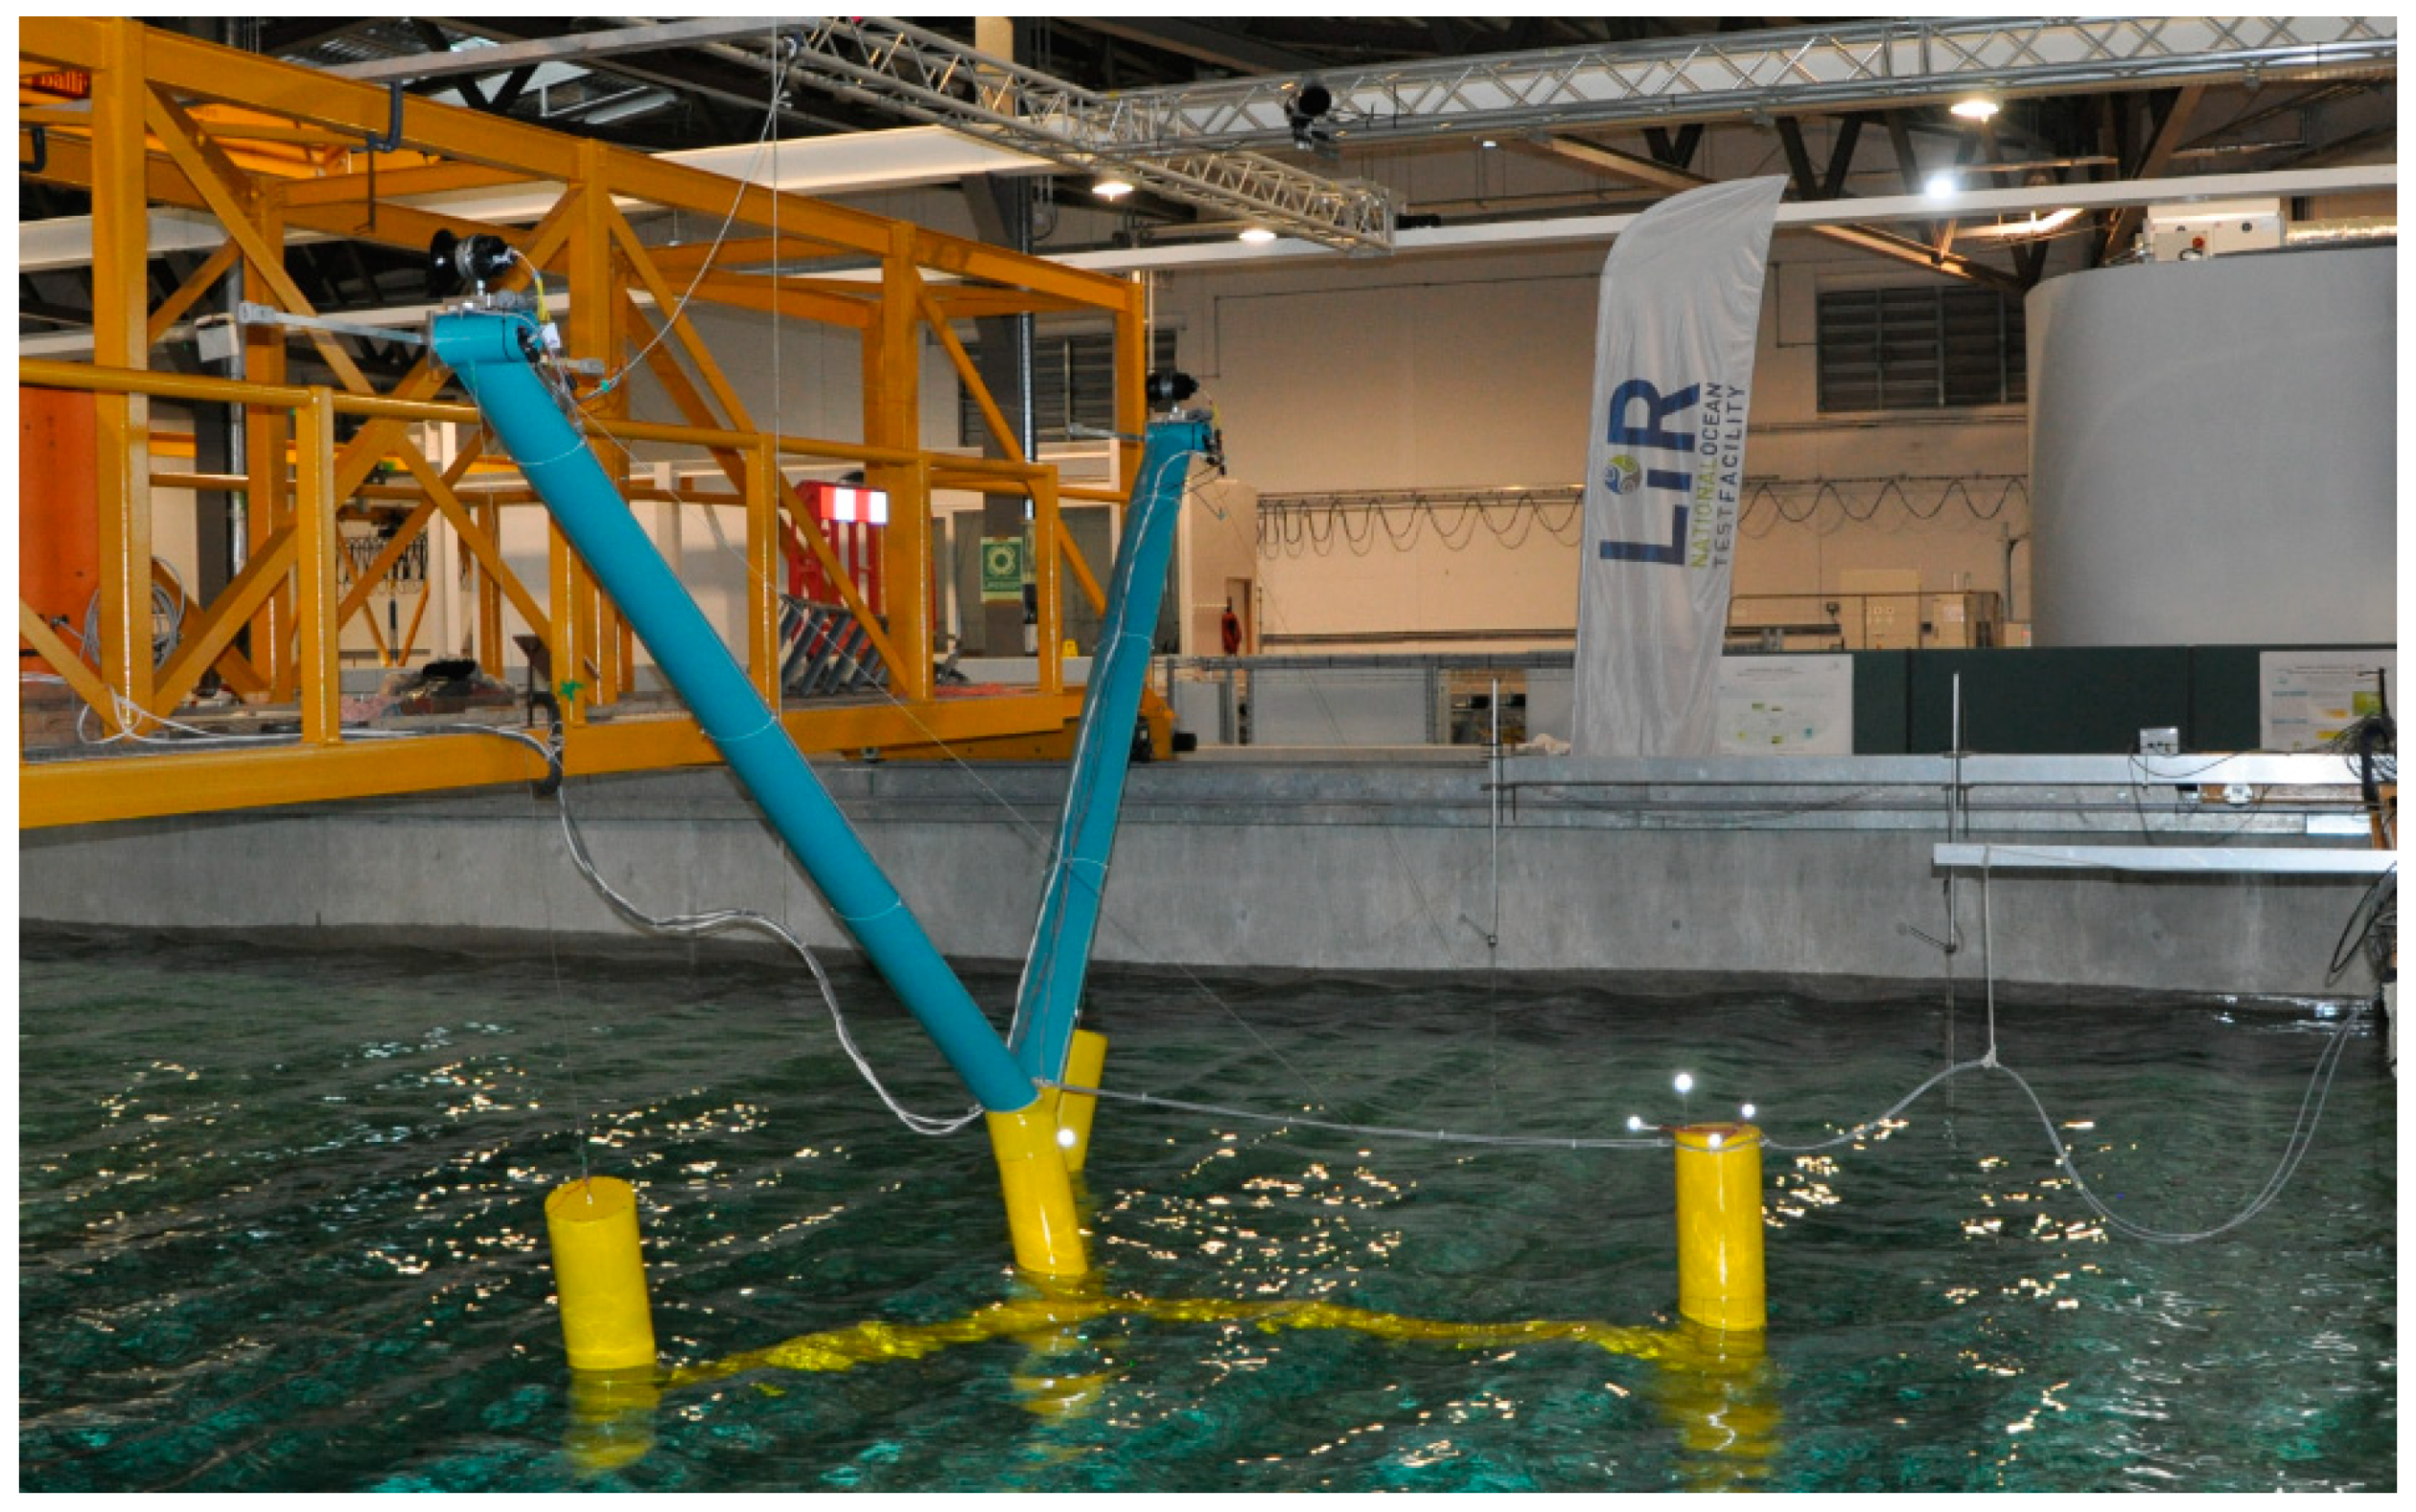
3.2. Wave Basin
The SCDnezzy
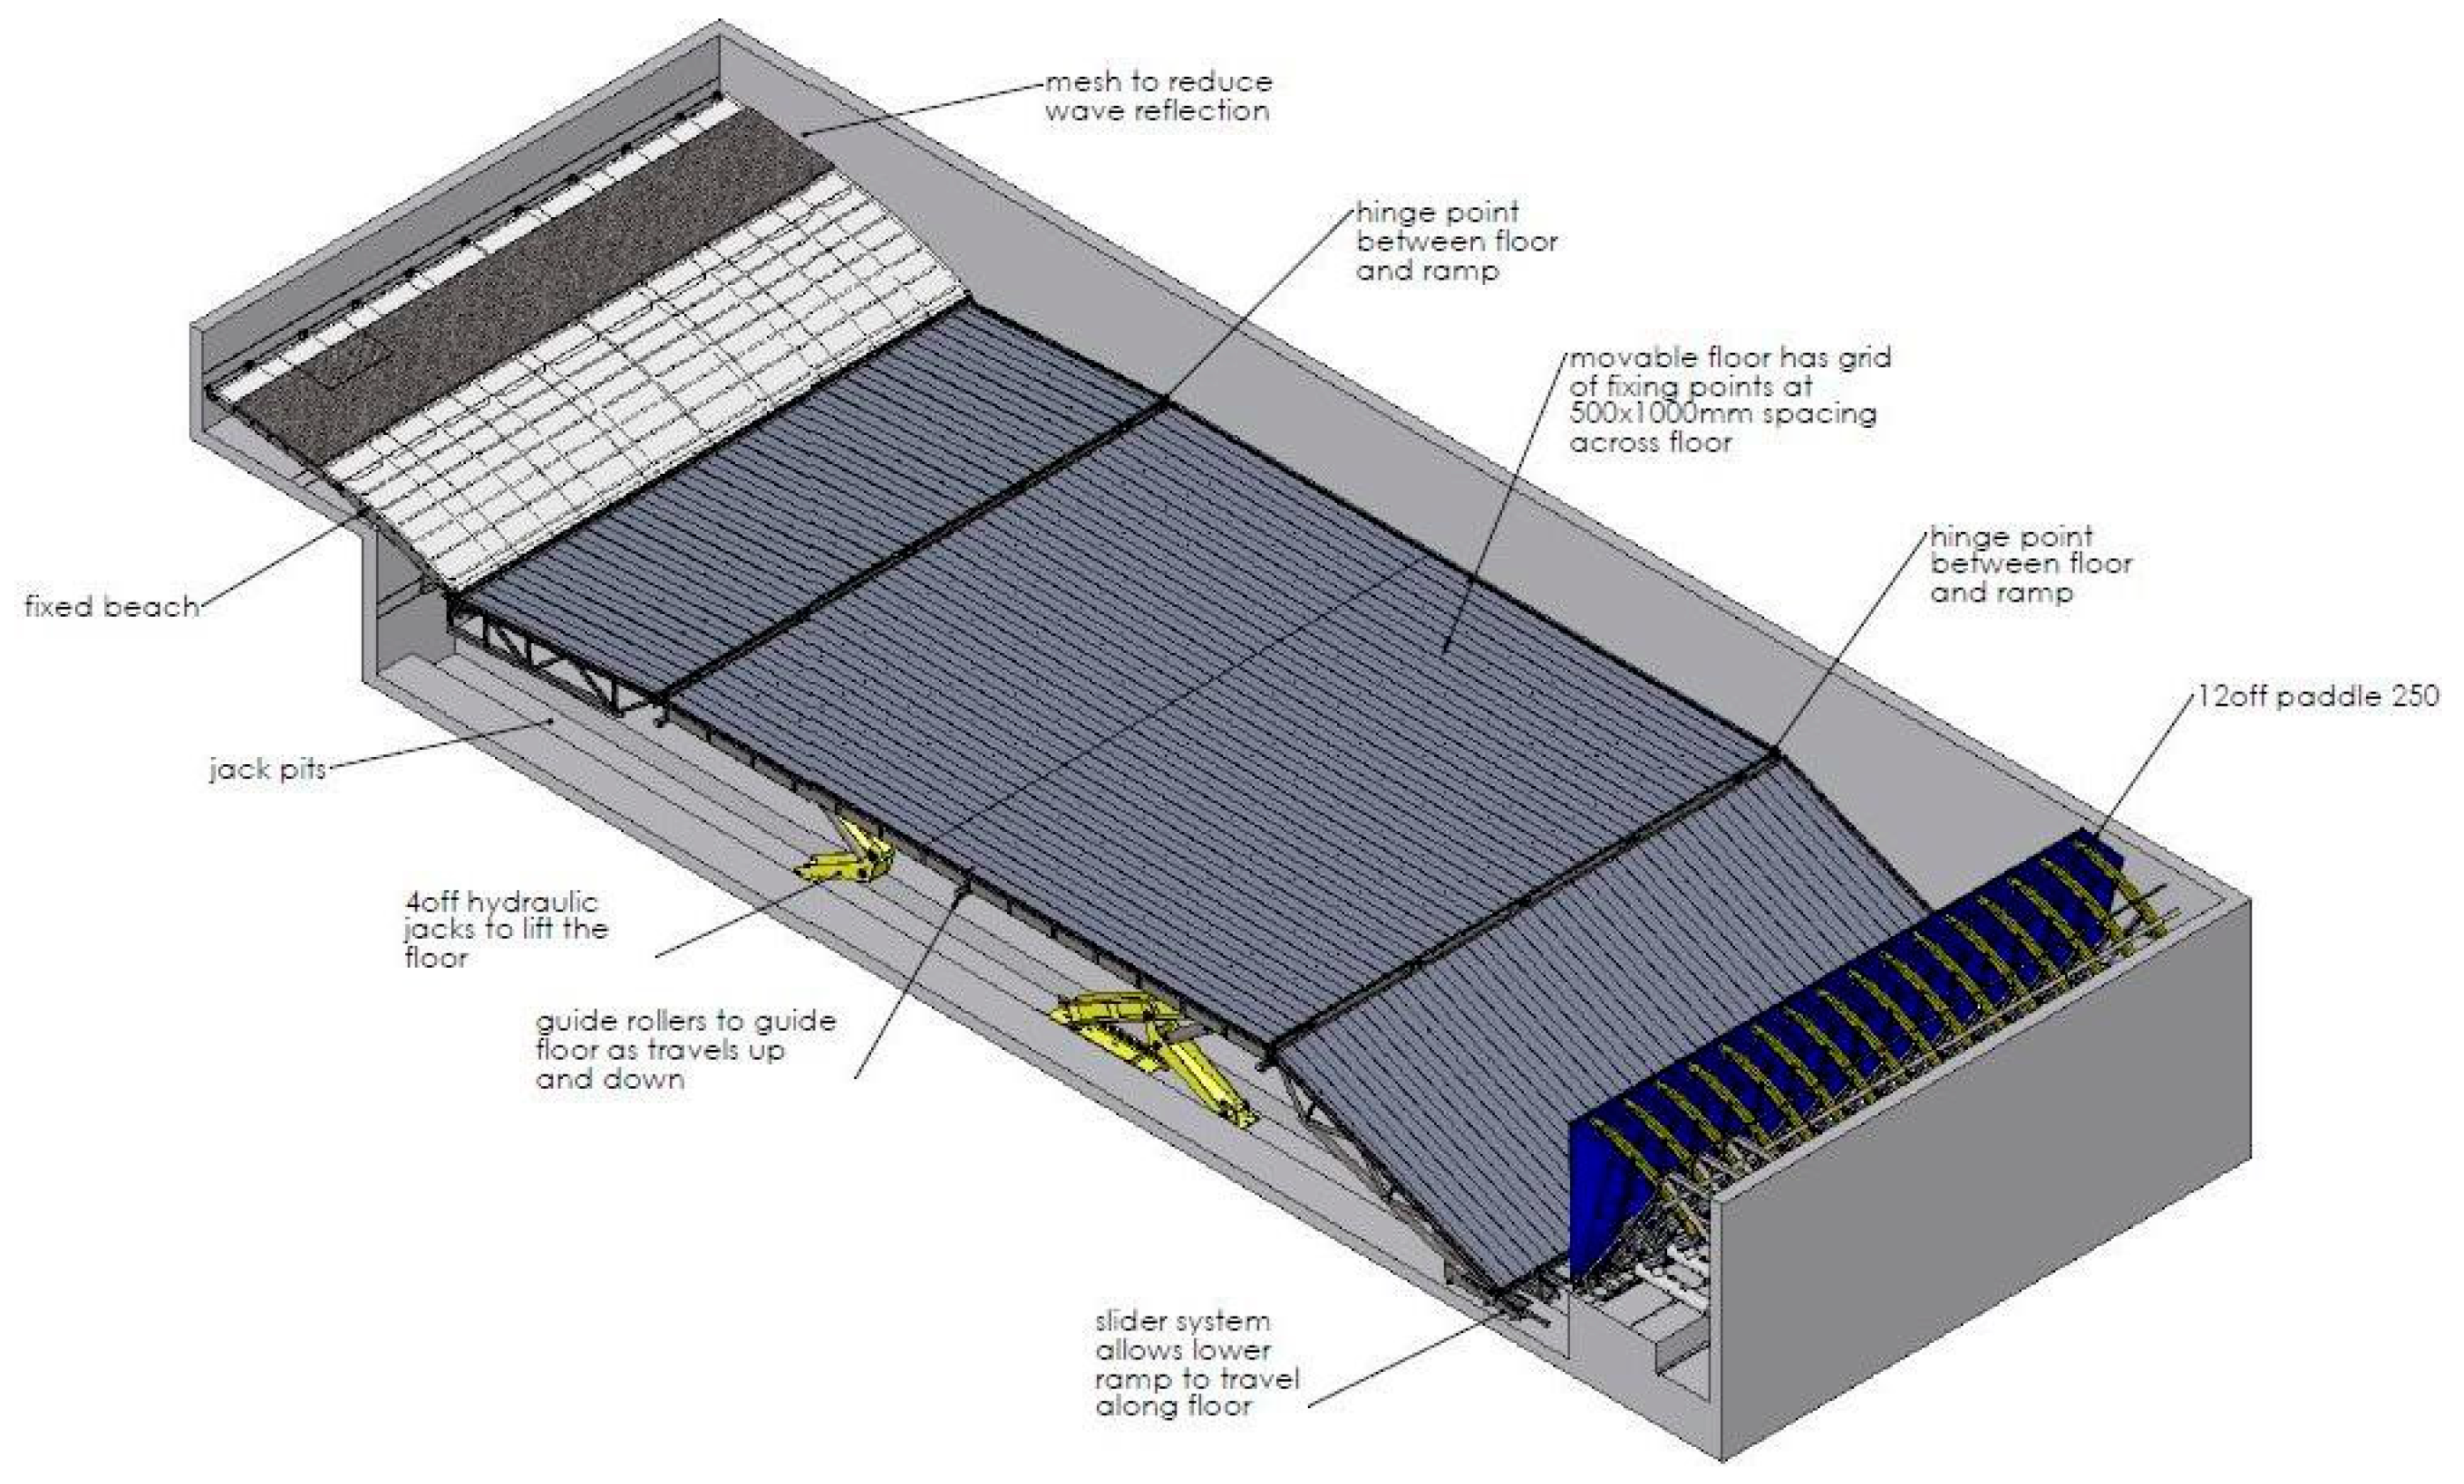
2 model was tested in the Deep Ocean Basin of the Lir NOTF. The basin, shown in
Figure 7, has dimensions of 35 m long × 12 m wide × 4 m deep and is equipped with 16 hinged force feedback paddles capable of a peak wave generation condition of Hs = 0.6 m, T
p = 2.7 s, and H
max = 1.1 m. A movable floor plate allows the water depth to be adjusted to a maximum of 3 m. During testing of the SCDnezzy
2 model, the tank water depth was set to 1.111 m in order to simulate a water depth of 40 m at full scale.
To track the motion of models in the Deep Ocean Basin, a system provided by Qualisys, Göteborg, Sweden was used. The installation consists of four Opus 3-series cameras data from which were captured at a rate of 96 Hz during the SCDnezzy
2 test campaign and processed using the Qualisys Track Manager (QTM) software (Qualisys, Göteborg, Sweden). A total of 5 markers were placed on the SCDnezzy
2 model during testing; the location of these markers can be seen in
Figure 2.
During testing, mooring line forces were replicated by use of taut 3 mm stainless steel wires with springs in parallel to provide the load-displacement performance of the full scale catenary system. These mooring lines were anchored to the basin floor at a horizontal spread of 4 m. The mooring springs had a stiffness of 0.09 N/mm up to a load of 10 N and 0.4 N/mm for higher loads. The pretension at equilibrium was 3.2 N. Line loads were monitored at the interface with the turret mooring through the use of single axis load cells. A total of 5 No. mooring lines and load cells were connected to the model. In this paper, only the data relating to the front mooring line was analysed. The load cell used on this mooring line was a 445N Futex submersible S-Beam (Model LSB210 connected to a 10 V D.C. power source, non-linearity 1%, hysteresis 1.5%), data from which were collected at a rate of 100 Hz.
3.3. Test Matrix
Three test groups were conducted, with each being repeated 5 times to provide an assessment of experimental precision as per [
18]. These three test groups are described in
Table 1. A Bretschneider spectrum was used for all tests.
As can be seen in
Table 1, Group C tests are the most representative of a full scale operating FOWT as both the rotor thrust and gyroscopic loading are included. Thus, Group C tests represent the highest level of accuracy or realism considered in this paper. The focus of the presented analysis will be the impact of increasing the levels of accuracy on the experimental precision.
For each test, the wind thrust and rotating beams were started (if used), the model was allowed to settle before wave generation commenced. A 1-min wave ramp up period was provided, data were recorded for 10 min, and the tank was allowed to settle for 5 min prior to starting the next test.
4. Precision Assessment Method
The first step used in the assessment of experimental precision was to assess the background “noise” in all data signals. The tank was allowed to settle overnight and data from all sensors were recorded for a period of 5 min. The error ranges observed (maximum value–minimum value) over this period are given in
Table 2.
Next, all data from repeat tests in each group, see
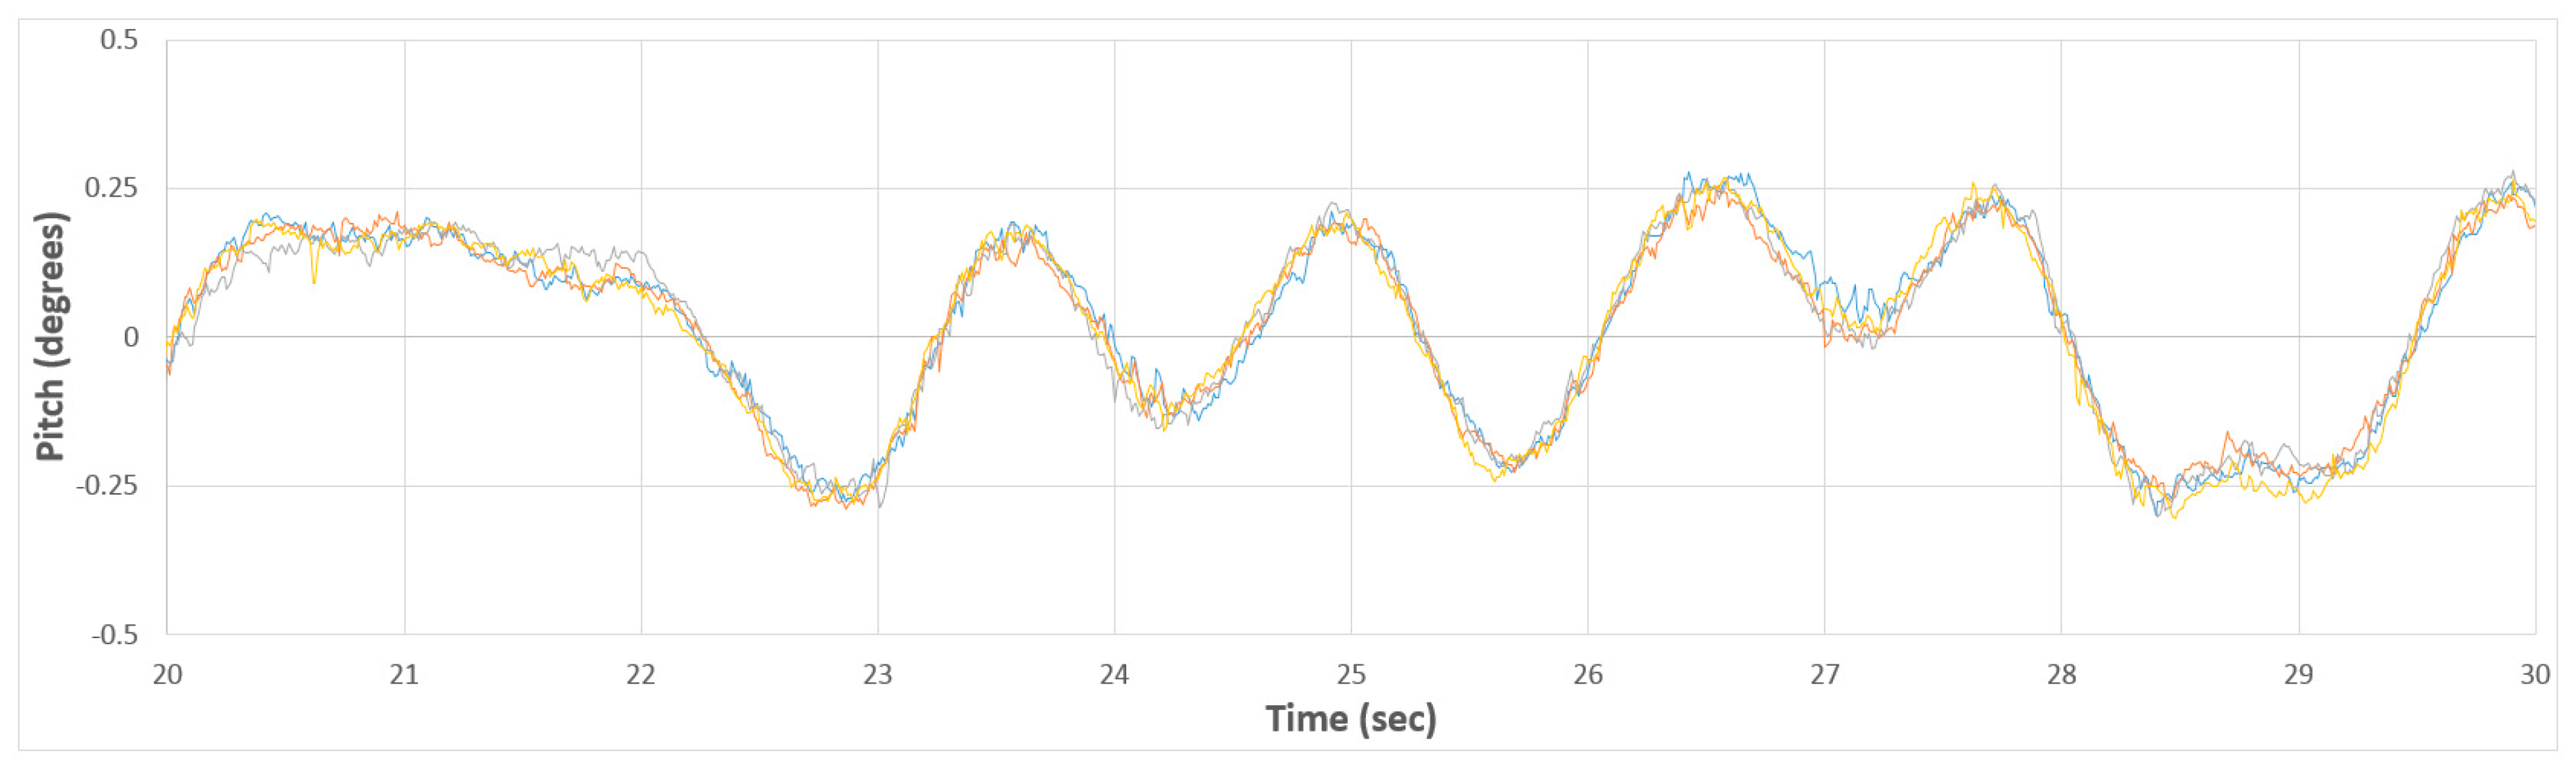
Table 1, were extracted for the 10 min active test period. The time series for the pitch, surge, heave, and front line load tests in each group were adjusted for the time shift by examining the Pearson’s correlation coefficient (PCC). Typically, a time adjustment of 0.05 sec was required and a PCC of 0.99 was achieved across all comparable time series in each group.
Figure 8 shows a sample of a set of adjusted time series data. This time shift is due to a slight variable lag between starting the wave maker and the data acquisition systems.
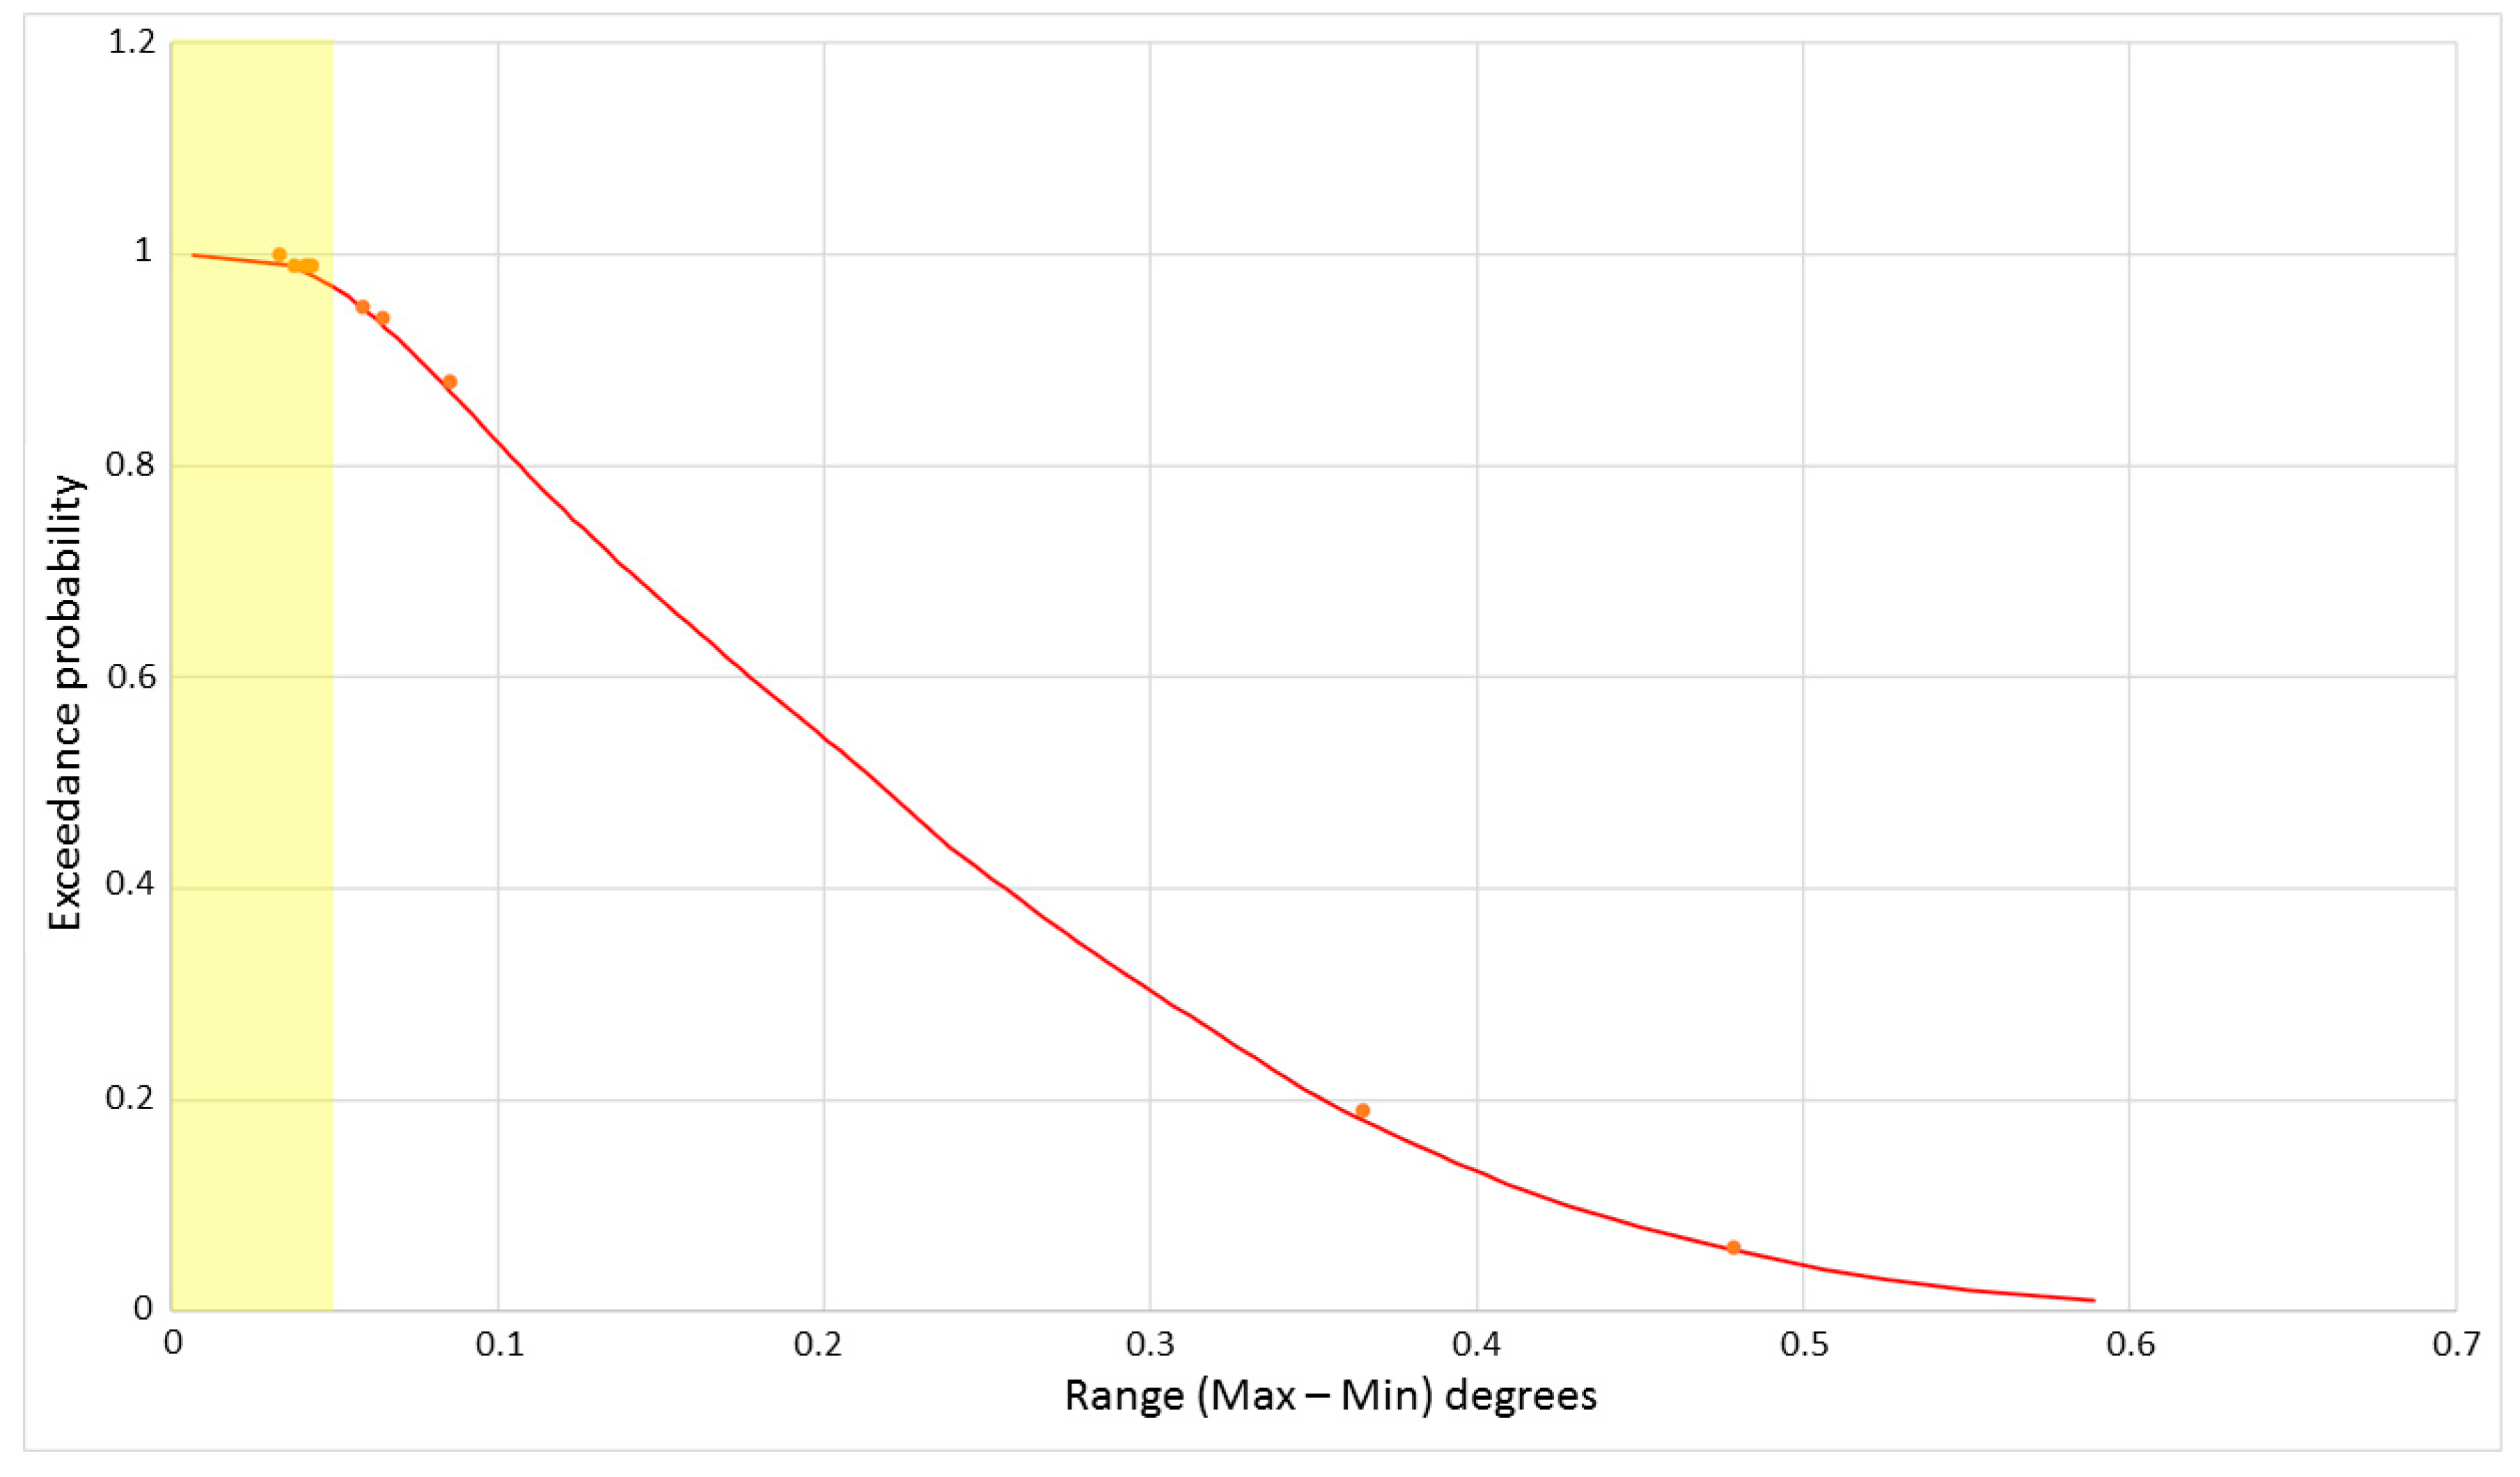
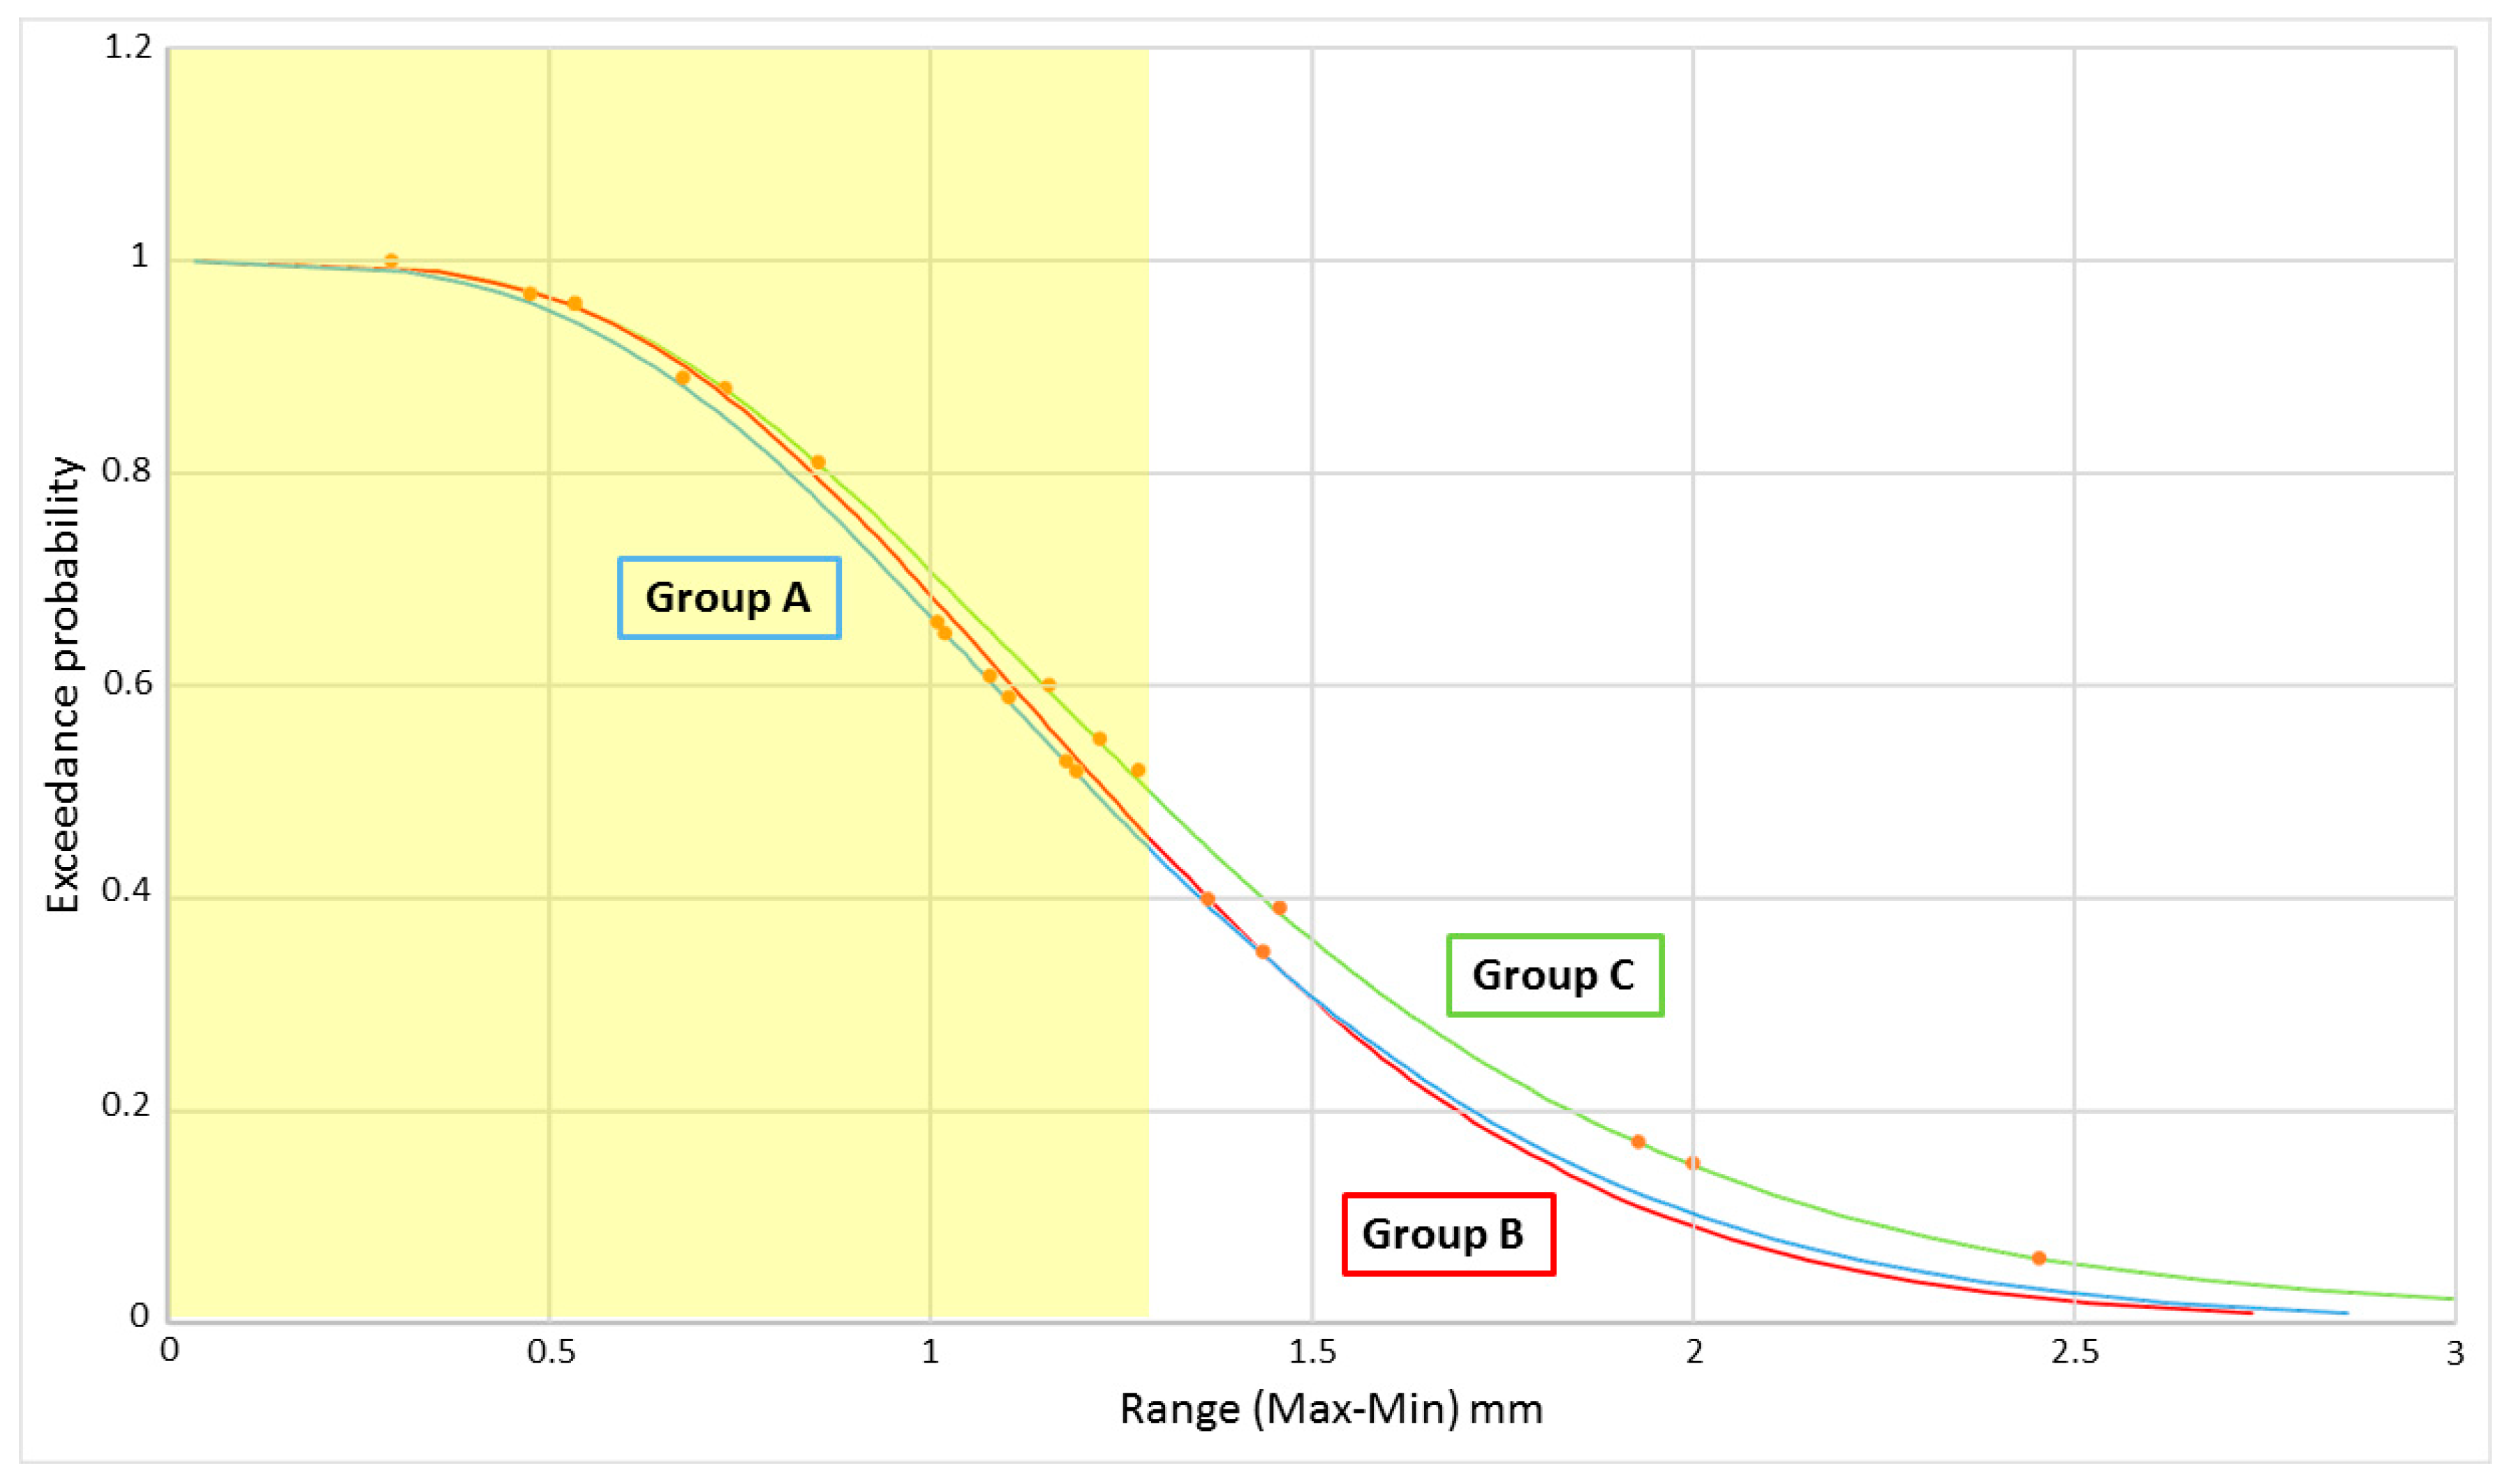
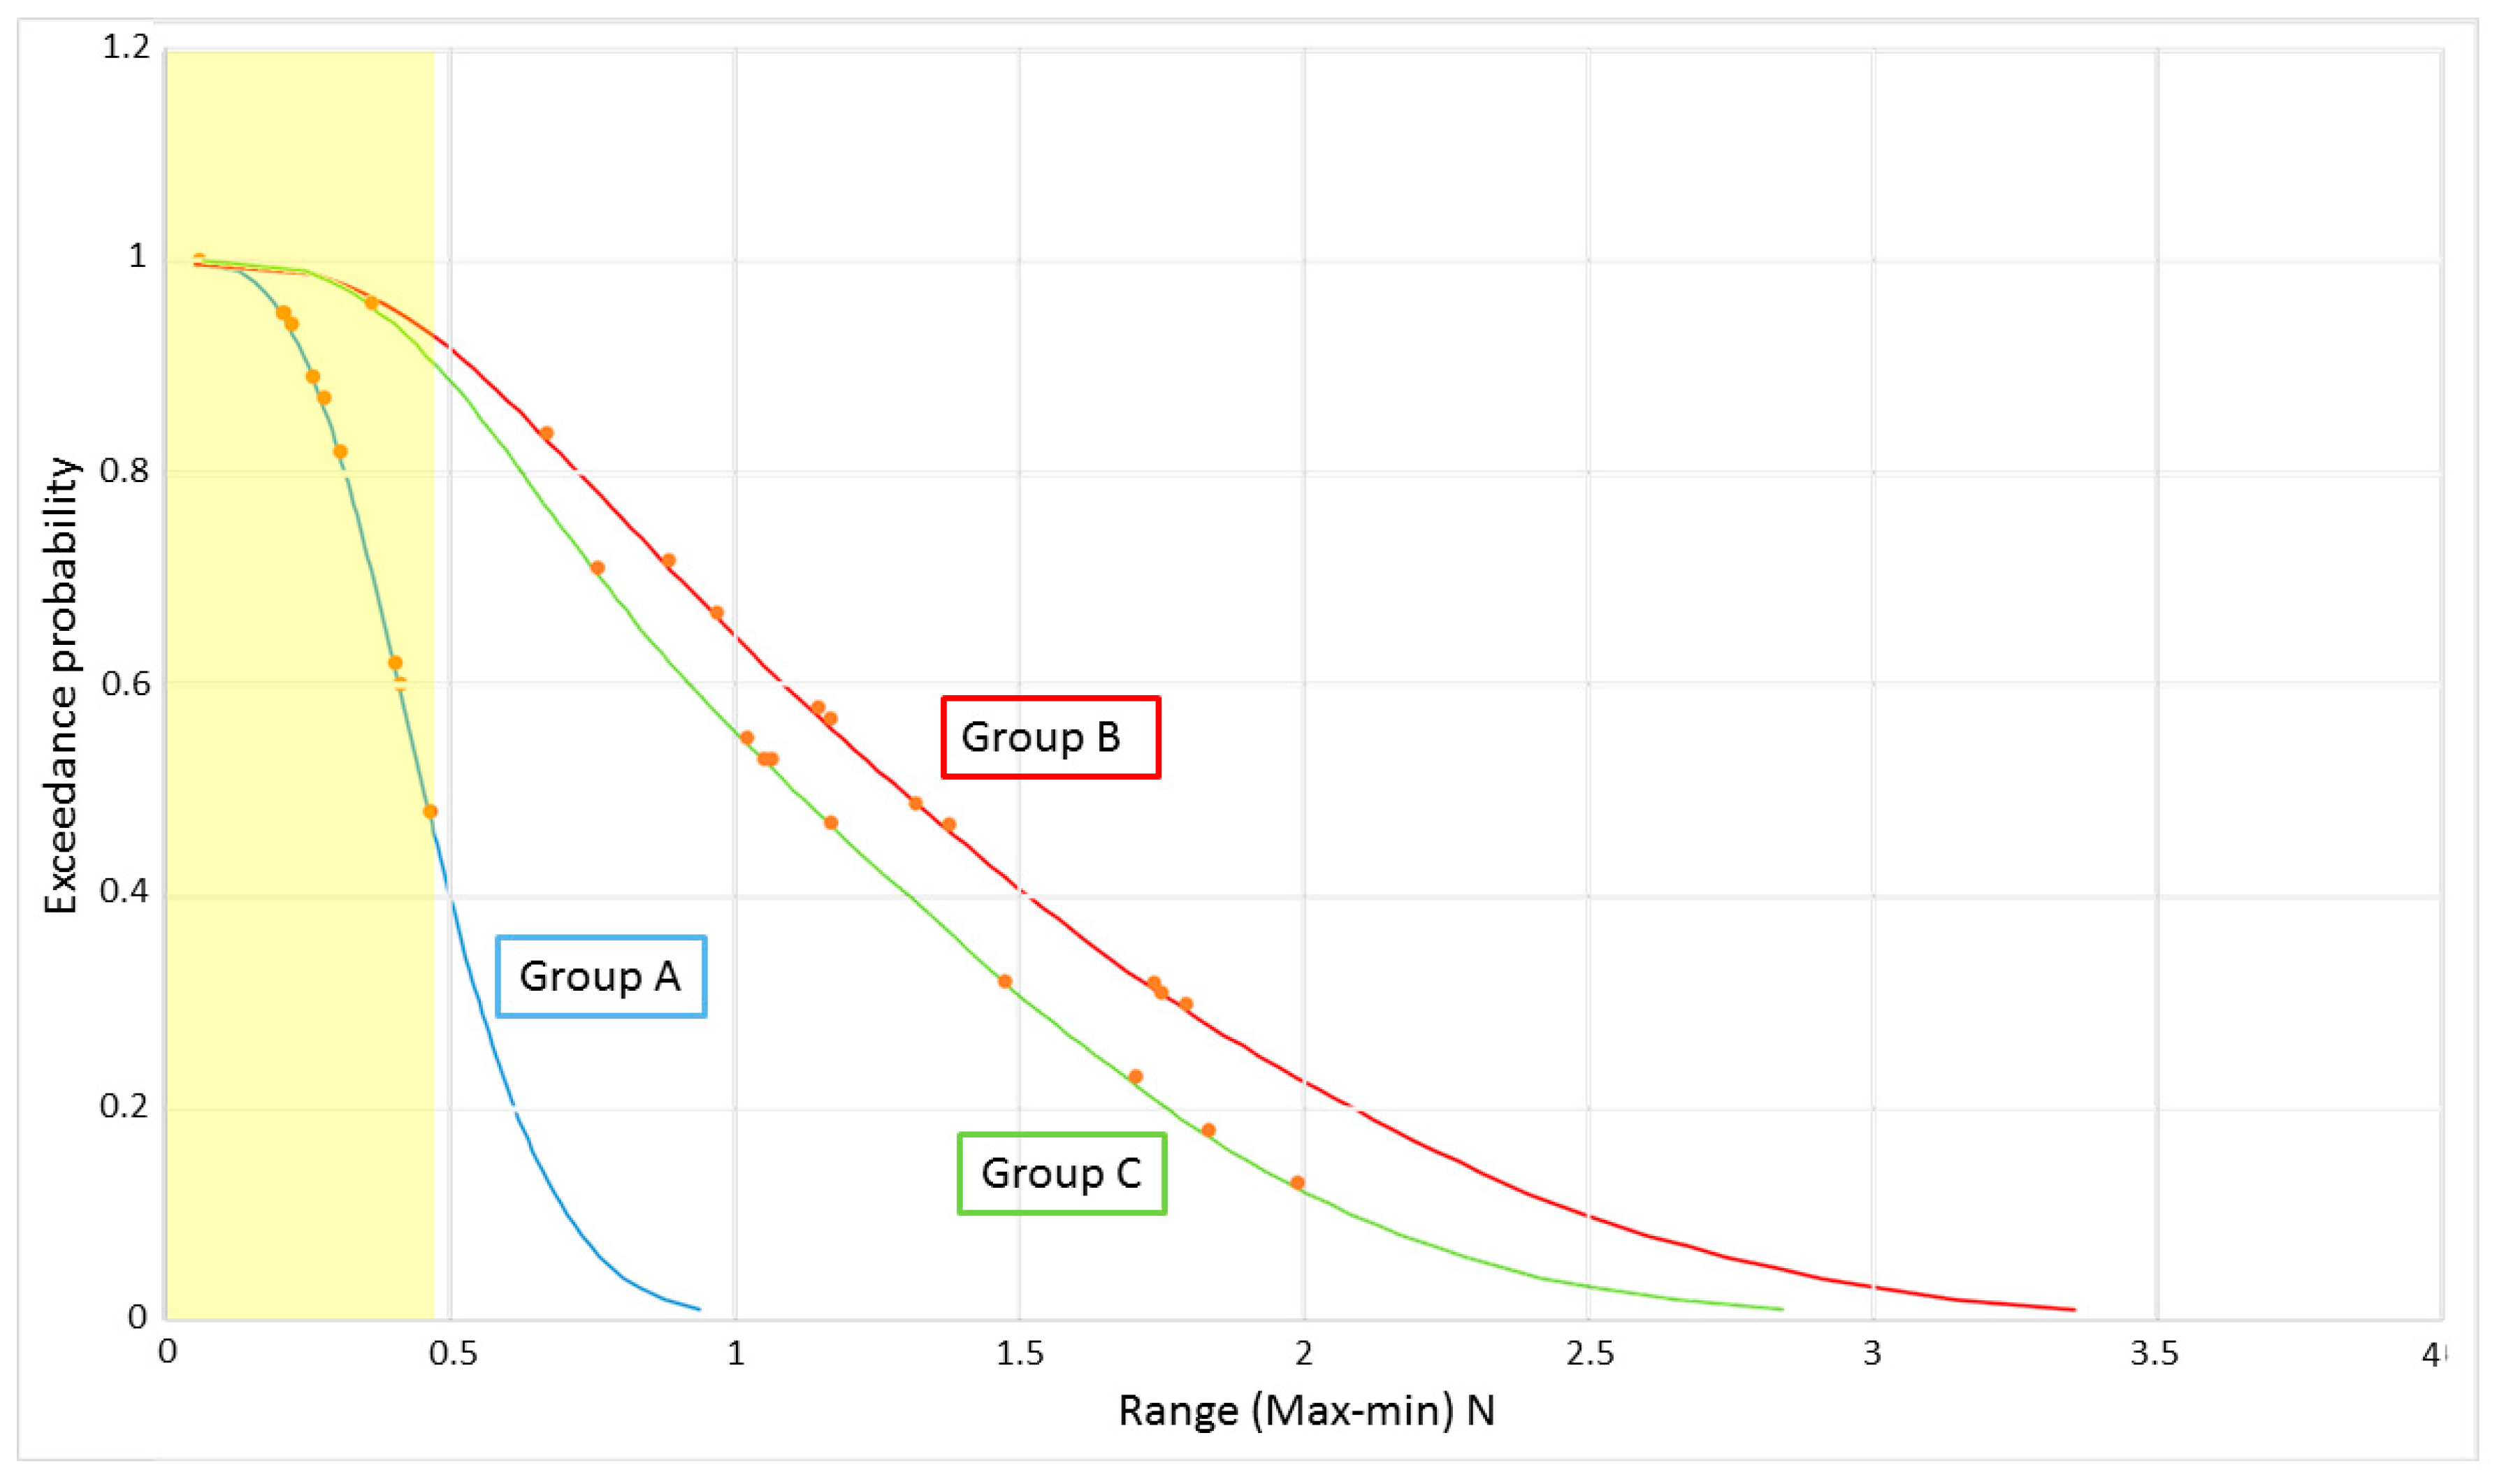
The error range (maximum value–minimum value) was then calculated at every time step for each group of time series. As mentioned previously, all motion data were recorded at 96 Hz and line load data at 100 Hz, thus a total of 57,600 error range values were calculated for motions and 60,000 for line load over the 10 min active test period for each Group of 5 repetitions. For visualisation, these error range data are presented as exceedance probability plots; a sample is shown in
Figure 9.
The shaded region in
Figure 9 indicates the error range which can be attributed to sensor noise, the values in
Table 2. The orange data points indicate the error range observed across the 5 repetitions for the 10 top peaks, the precision metric used in [
18]. As can be seen in
Figure 8 and
Figure 9, the magnitude of the error range is not well correlated to the magnitude of the value being measured with 8 of the top 10 peak error range values being exceeded for at least 85% of the 10-min time concurrent time series for Group B in pitch. Thus, examining the error in the top 10 peaks or maximum peak does not give an appreciation of the error observed across the full time series. To capture this detail, the precision metric used in this paper will be
; that is, the error range which is exceeded 5% of the time for concurrent time series with 5 repetitions. For the data presented in
Figure 9, the
= 0.49 degrees.
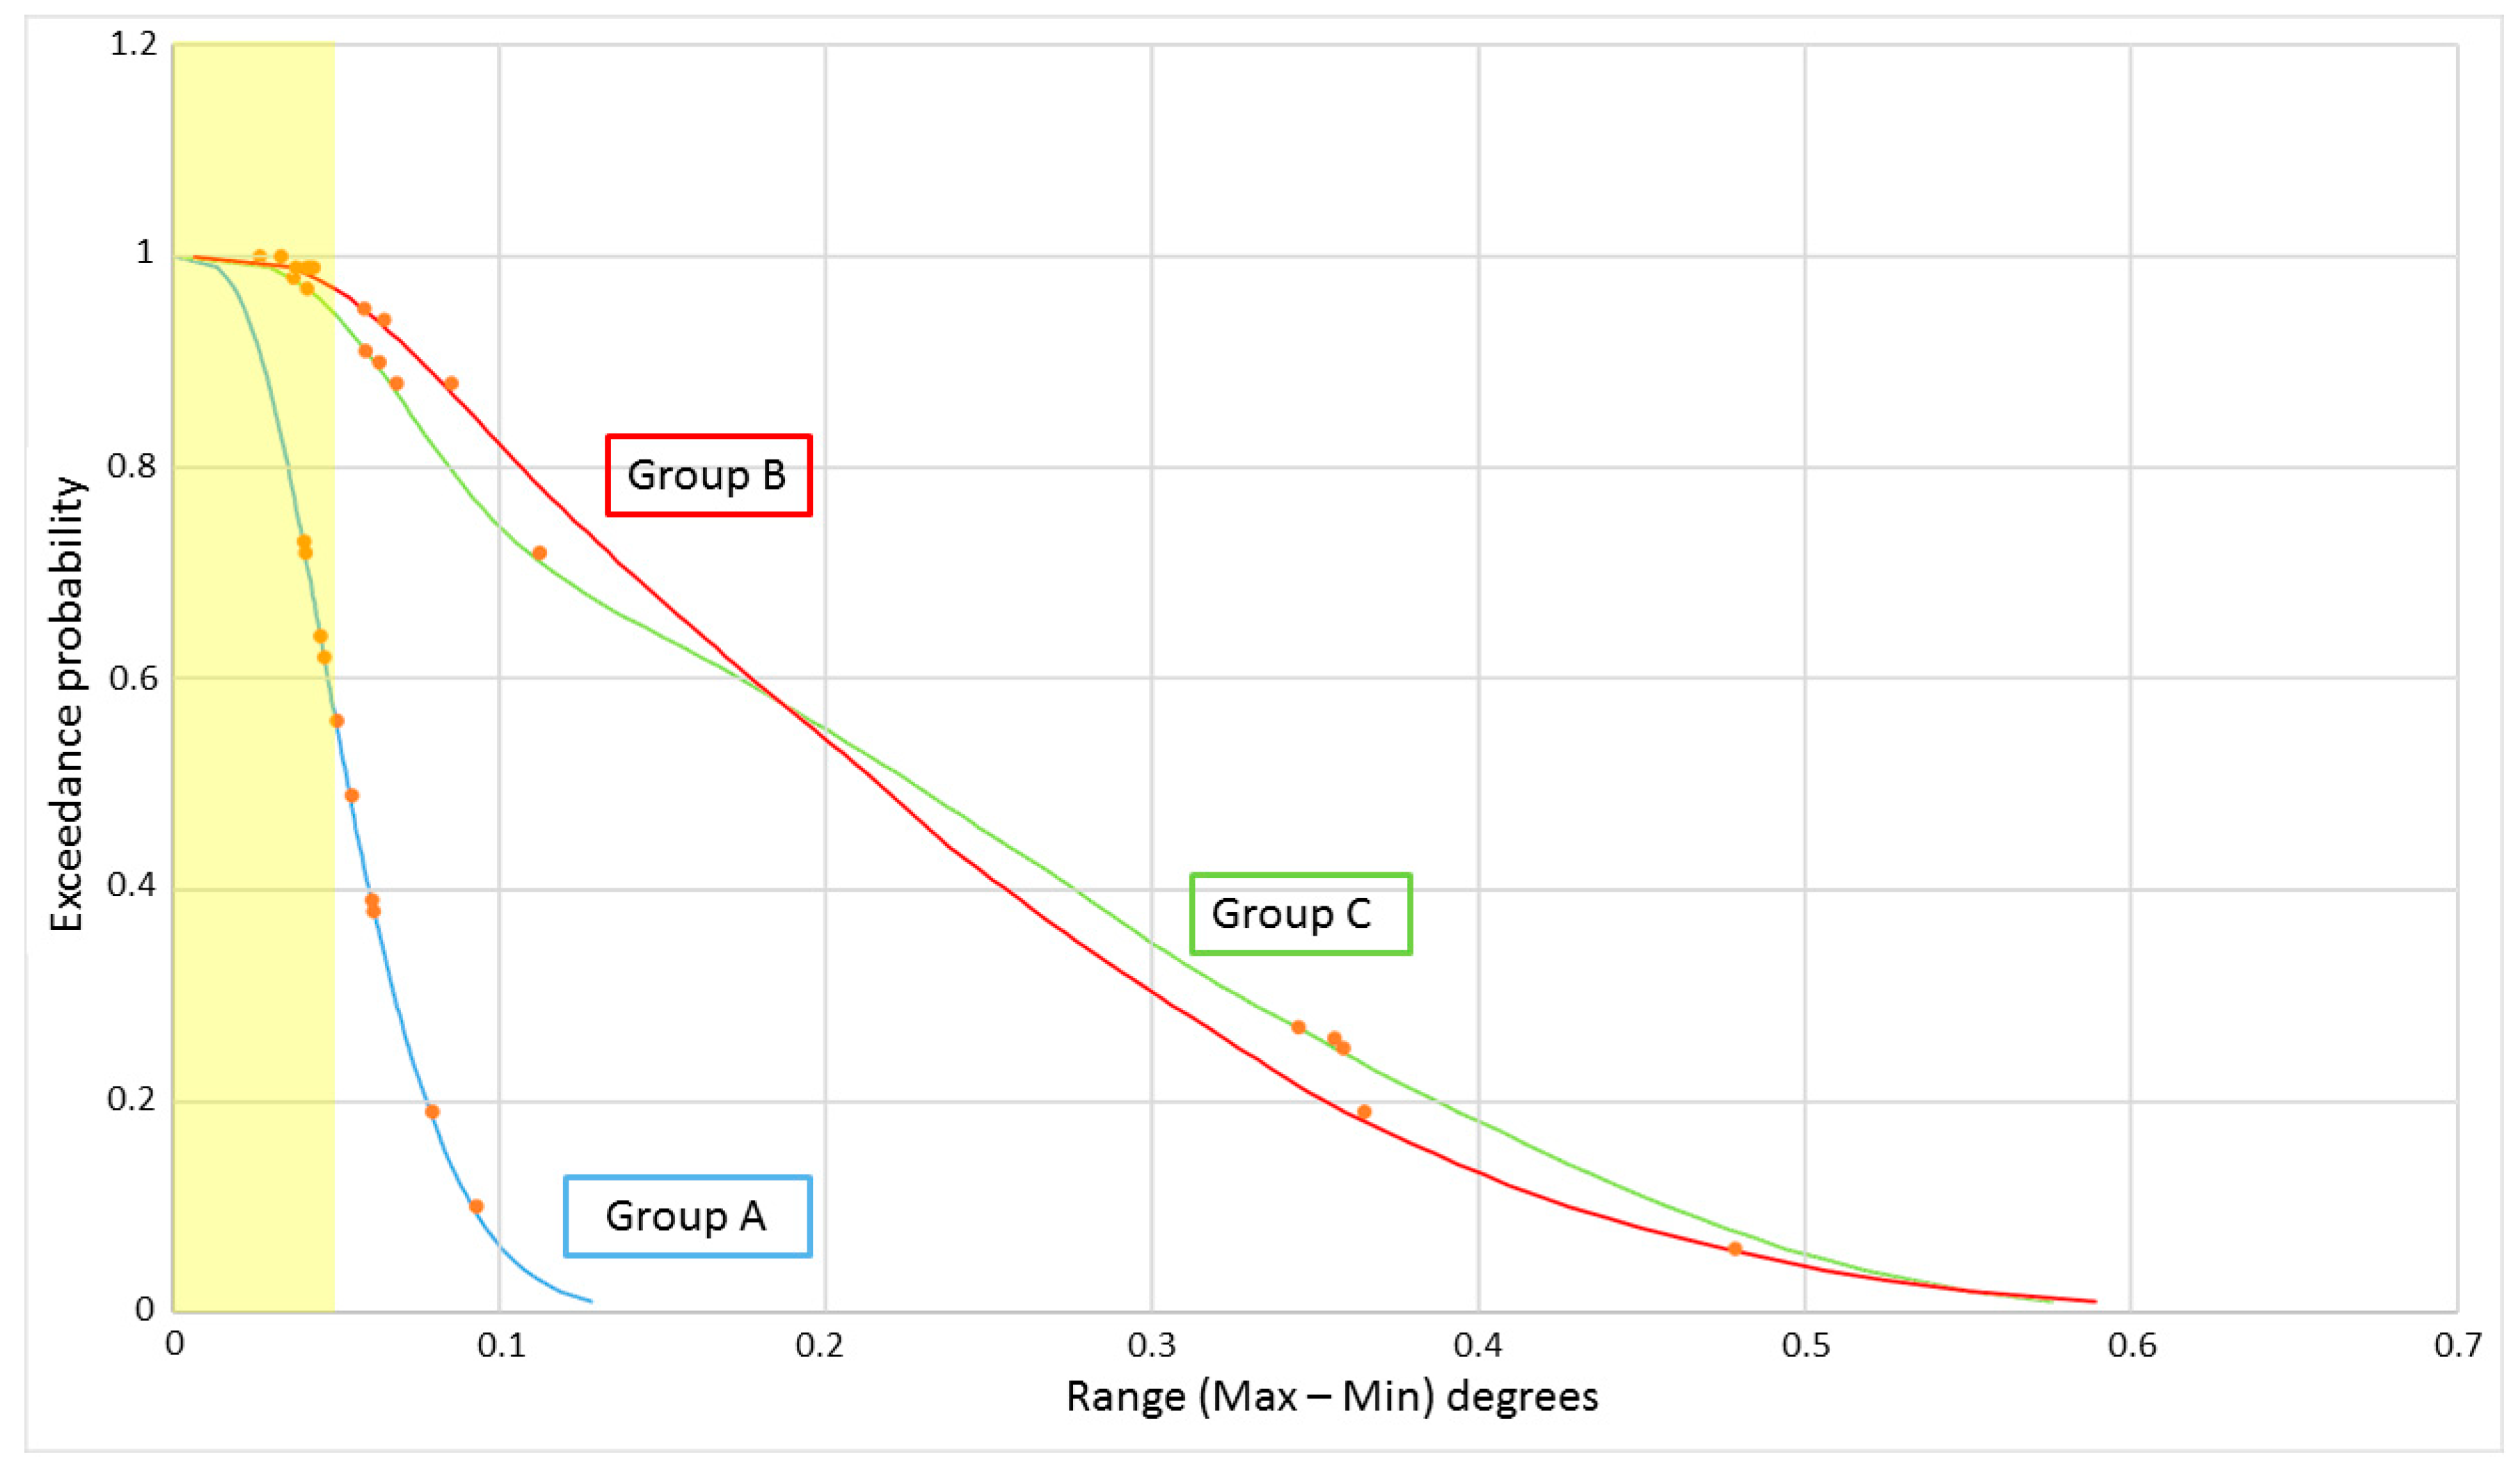
6. Conclusions
This paper primarily set out to assess if there is a trade-off between precision and accuracy when conducting experimental analysis of FOWTs. In terms of the addition of wind thrust loading (Group A compared with Group B), the presented results for pitch and surge certainty indicate that this is the case, with a significant reduction in experimental precision observed with the introduction of thrust through the use of ducted fans. This trend is also observed in the front line load results, however, these are disputable as line load precision is known to decrease with increasing load unlike the error associated with the Qualisys measurements, which are absolute values. Thus, the reduced precision of the front line load measurements of Group B and C when compared to Group A may be attributed to the increased load being measured due to the combined 20 N of applied thrust at hub height.
These findings in relation to the reduction in experimental precision when introducing wind loading can be attributed to the modulating nature of the incident thrust generated by the ducted fans. The magnitude of precision reduction observed in this study comes with the obvious caveat that this is for a multirotor system, where the impact is doubled. Also, the sacrifice of experimental precision must be weighed up against the increased accuracy, which allows the impact of the rotor thrust to be examined, a key point in the design of FOWTs. However, it is important to highlight this potential trade off and to take steps to mitigate it in future physical test campaigns.
In terms of the addition of rotor gyroscopic loading, all results, with the exception of pitch and heave, indicate an increase in experimental precision as can be seen from the comparison of the Group B and C results. It is known [
20] that the impact of a rotating body is twofold, a tendency to rotate the axis of the rotating body in a given direction (yaw in the case of a horizontal axis wind turbine) and a tendency to resist external forces, resulting in increased system stability. There have been a number of studies investigating the combined impact on single rotor FOWT dynamics [
21,
22] using experimental and numerical techniques to focus on the induced yaw force. In [
23], it was shown experimentally that the rotor gyroscopic load impacts the magnitude of the resonant platform response and also showed a slight reduction in the high frequency response in heave and pitch for the 1:100 scale tension leg platform that was studied. This suggests an increase in system stability due to gyroscopic forcing similar to what was observed in the current study.
This result is somewhat surprising given that each rotating weighted beams interrupts the air flow through the ducted fans at a rate of 2.5 Hz, thus adding to the modulating thrust issue discussed above. Whilst the combined impact of wind thrust and rotor gyroscopic loading will vary for each platform, in the current study, it appears that the inherent system stability introduced by the two contra-rotating weighted beams is more important, in terms of experimental precision, than the additional thrust modulation.
These findings drawn from the comparison of Group B and Group C results come with the caveat that the observed difference in experimental precision is small and may be within the precision range of the precision assessment methodology itself. An investigation into this matter would require a large number of additional repeat tests, which may be conducted as a piece of future work.
The
experimental metric was a useful tool to assess experimental precision in this paper and captured a higher level of detail across the full response time series when compared to the top 10 peak method. Thus, the
metric may be a suitable measure of experimental uncertainty for use in the Monto Carlo style assessment suggested by ASME [
5] and being pursued by the OC5 community [
18]. It is clear, however, that it is impractical to repeat all experiments at least five times and so future work on the
metric will focus on generalising results and possibly the use of a single experiment of regular waves to quantify experimental precision.
As mentioned in the introduction, the impact of a much broader range of wind turbine emulation systems on model test uncertainty will be investigated during a future study under the MaRINET2 project in which a single 1:60 scale semi-submersible platform will be tested at four separate EU facilities.


