Development of a Consecutive Occupancy Estimation Framework for Improving the Energy Demand Prediction Performance of Building Energy Modeling Tools
Abstract
1. Introduction
1.1. Background of Study
1.2. Necessity and Purpose of Study
- An overwhelming majority of studies showed a sufficiently high accuracy rate of approximately 95% in terms of occupancy status (Level 1), meaning that those occupancy estimation methods using indirect sensors showed an insignificant difference in prediction performance compared to those using direct occupancy sensors;
- most of the studies collected data for a short period of less than one month and focused on the estimation accuracy of occupancy status and the number of occupants. However, there were not enough studies that utilized long-term measurement data to evaluate whether it could be possible to maintain accuracy in the event of seasonal changes. For instance, the correlation of indirect sensor data, such as energy consumption and window opening and closing data, with the accuracy of occupancy estimation can be changed in consideration of seasonal variations; and
- lastly, there were not enough studies that analyzed how the accuracy of occupancy estimation could change the energy consumption in the context of time series variations of occupancy and its related variables. It is believed that such studies can provide a significant impact on more accurate building energy estimation and more precise building system control.
2. Data Collection and Preprocessing
2.1. Description on Target Space and Collected Data
2.2. Quality Control and Pre-Processing of Measurement Data
3. Development and Performance Analysis of Consecutive Occupancy Estimation Framework
3.1. Selection of Occupancy Estimation Algorithms and Parameter Tuning
3.2. Performance Evaluation of Seasonal Short-Term Occupancy Estimation
3.2.1. Selection of Key Input Variables
3.2.2. Training and Verification of Classification Models
3.3. Framework Development for Consecutive Occupancy Estimation with Time-Series Data
3.3.1. Selection of Verification Period and Window Moving Interval
3.3.2. Performance Comparison between Seasonal Short-Term and Consecutive Long-Term Occupancy Estimations
4. Performance Evaluation of Building Energy Consumption with the Occupancy Estimation Data
4.1. Establishment of Simulation Environment
4.1.1. BCVTB, R-script, and EnergyPlus Models with Occupancy Data
4.1.2. Actual Meteorological Data for epw Input
4.1.3. EnergyPlus Energy Model for the Target Space
4.2. Comparison of Energy Consumption Estimation Results
5. Results, Summary and Discussion
6. Conclusions and Future Work
Author Contributions
Acknowledgments
Conflicts of Interest
References
- Delzendeh, E.; Wu, S.; Lee, A.; Zhou, Y. The impact of occupants’ behaviours on building energy analysis: A research review. Renew. Sustain. Energy Rev. 2017, 80, 1061–1071. [Google Scholar] [CrossRef]
- Paone, A.; Bacher, J.-P. The Impact of Building Occupant Behavior on Energy Efficiency and Methods to Influence It: A Review of the State of the Art. Energies 2018, 11, 953. [Google Scholar] [CrossRef]
- Melfi, R.; Rosenblum, B.; Nordman, B.; Christensen, K. Measuring building occupancy using existing network infrastructure. In Proceedings of the 2011 International Green Computing Conference and Work-shops (IGCC), Orlando, FL, USA, 25–28 July 2011. [Google Scholar]
- Garg, V.; Bansal, N.K. Smart occupancy sensors to reduce energy consumption. Energy Build. 2000, 32, 81–87. [Google Scholar] [CrossRef]
- Nagy, Z.; Yong, F.Y.; Frei, M.; Schlueter, A. Occupant centered lighting control for comfort and energy efficient building operation. Energy Build. 2015, 94, 100–108. [Google Scholar] [CrossRef]
- Gunay, H.B.; Fuller, A.; O’Brien, W.; Beausoleil-Morrison, I. Detecting occupants’ presence in office spaces: A case study. In Proceedings of the eSim 2016, Hamilton, OH, USA, 3–4 May 2016. [Google Scholar] [CrossRef]
- Benezeth, Y.; Laurent, H.; Emile, B.; Rosenberger, C. Towards a sensor for detecting human presence and characterizing activity. Energy Build. 2011, 43, 305–314. [Google Scholar] [CrossRef]
- Zou, J.; Zhao, Q.; Yang, W.; Wang, F. Occupancy detection in the office by analyzing surveillance videos and its application to building energy conservation. Energy Build. 2017, 152, 385–398. [Google Scholar] [CrossRef]
- Amin, I.J.; Taylor, A.J.; Junejo, F.; Al-Habaibeh, A.; Parkin, R.M. Automated people-counting by using low-resolution infrared and visual cameras. Measurement 2008, 41, 589–599. [Google Scholar] [CrossRef]
- Shen, W.; Newsham, G.; Gunay, B. Leveraging existing occupancy-related data for optimal control of commercial office buildings: A review. Adv. Eng. Inform. 2017, 33, 230–242. [Google Scholar] [CrossRef]
- Chen, Z.; Masood, M.K.; Soh, Y.C. A fusion framework for occupancy estimation in office buildings based on environmental sensor data. Energy Build. 2016, 133, 790–798. [Google Scholar] [CrossRef]
- Candanedo, L.M.; Feldheim, V. Accurate occupancy detection of an office room from light, temperature, humidity and CO2 measurements using statistical learning models. Energy Build. 2016, 112, 28–39. [Google Scholar] [CrossRef]
- Yang, Z.; Li, N.; Becerik-Gerber, B.; Orosz, M. A multi-sensor based occupancy estimation model for supporting demand driven HVAC operations. In Proceedings of the 2012 Symposium on Simulation for Architecture and Urban Design. Society for Computer Simulation International, Orlando, FL, USA, 26–30 March 2012. [Google Scholar]
- Dong, B.; Andrews, B.; Lam, K.P.; Höynck, M.; Zhang, R.; Chiou, Y.S.; Benitez, D. An information technology enabled sustainability test-bed (ITEST) for occupancy detection through an environmental sensing network. Energy Build. 2010, 42, 1038–1046. [Google Scholar] [CrossRef]
- Khan, A.; Nicholson, J.; Mellor, S.; Jackson, D.; Ladha, K.; Ladha, C.; Oliver, P.; Plötz, T. Occupancy monitoring using environmental & context sensors and a hierarchical analysis framework. In Proceedings of the BuildSys@ SenSys, Memphis, TN, USA, 5–6 November 2014; pp. 90–99. [Google Scholar] [CrossRef]
- Lam, K.P.; Höynck, M.; Dong, B.; Andrews, B.; Chiou, Y.S.; Zhang, R.; Benitez, D.; Choi, J. Occupancy detection through an extensive environmental sensor network in an open-plan office building. In Proceedings of the 11th International IBPSA Conference, Glasgow, Scotland, 27–30 July 2009; pp. 1452–1459. [Google Scholar]
- Han, Z.; Gao, R.X.; Fan, Z. Occupancy and indoor environment quality sensing for smart buildings. In Proceedings of the 2012 IEEE International Instrumentation and Measurement Technology Conference (I2MTC), Graz, Austria, 13–16 May 2012; pp. 882–887. [Google Scholar]
- Yang, Z.; Li, N.; Becerik-Gerber, B.; Orosz, M. A systematic approach to occupancy modeling in ambient sensor-rich buildings. Simulation 2014, 90, 960–977. [Google Scholar] [CrossRef]
- Dodier, R.H.; Henze, G.P.; Tiller, D.K.; Guo, X. Building occupancy detection through sensor belief networks. Energy Build. 2006, 38, 1033–1043. [Google Scholar] [CrossRef]
- Zhao, Y.; Zeiler, W.; Boxem, G.; Labeodan, T. Virtual occupancy sensors for real-time occupancy information in buildings. Building Environ. 2015, 93, 9–20. [Google Scholar] [CrossRef]
- Wang, W.; Chen, J.; Hong, T.; Zhu, N. Occupancy prediction through Markov based feedback recurrent neural network (M-FRNN) algorithm with WiFi probe technology. Building Environ. 2018, 138, 160–170. [Google Scholar] [CrossRef]
- Wang, W.; Chen, J.; Hong, T. Occupancy prediction through machine learning and data fusion of environmental sensing and Wi-Fi sensing in buildings. Autom. Construct. 2018, 94, 233–243. [Google Scholar] [CrossRef]
- Zou, H.; Zhou, Y.; Yang, J.; Spanos, C. Towards occupant activity driven smart buildings via WiFi-enabled IoT devices and deep learning. Energy Build. 2018, 177, 12–22. [Google Scholar] [CrossRef]
- Zou, H.; Zhou, Y.; Yang, J.; Spanos, C. Device-free occupancy detection and crowd counting in smart buildings with WiFi-enabled IoT. Energy Build. 2018, 174, 309–322. [Google Scholar] [CrossRef]
- Arora, A.; Amayri, M.; Badarla, V.; Ploix, S.; Bandyopadhyay, S. Occupancy estimation using non-intrusive sensors in energy efficient buildings. In Proceedings of the 14th Conference of IBPSA, Hyderabad, India, 7–9 December 2015; pp. 1441–1448. [Google Scholar]
- Hailemariam, E.; Goldstein, R.; Attar, R.; Khan, A. Real-time occupancy detection using decision trees with multiple sensor types. In Proceedings of the 2011 Symposium on Simulation for Architecture and Urban Design, Boston, MA, USA, 3–7 April 2011; pp. 141–148. [Google Scholar]
- Milenkovic, M.; Amft, O. Recognizing energy-related activities using sensors commonly installed in office buildings. Procedia Comput. Sci. 2013, 19, 669–677. [Google Scholar] [CrossRef]
- ISO 8601 Data Elements and Interchange Formats—Information Interchange—Representation of Dates and Times. 2004. Available online: https://www.iso.org/obp/ui/#iso:std:iso:8601:ed-3:v1:en (accessed on 7 November 2017).
- McKinley, S.; Levine, M. Cubic Spline Interpolation; College of the Redwoods: Eureka, CA, USA, 1998; Volume 45, pp. 1049–1060. [Google Scholar]
- Ihaka, R.; Gentleman, R. R: A language for data analysis and graphics. J. Comput Graphical Stat. 1996, 5, 299–314. [Google Scholar]
- The R Core Team. R: A Language and Environment for Statistical Computing. Available online: https://cran.r-project.org/doc/manuals/r-release/fullrefman.pdf (accessed on 5 October 2017).
- Zhang, R.; Lam, K.P.; Chiou, Y.S.; Dong, B. Information-theoretic environment features selection for occupancy detection in open office spaces. Build. Simul. 2012, 5, 179–188. [Google Scholar] [CrossRef]
- Breiman, L.; Friedman, J.; Stone, C.J.; Olshen, R.A. Classification and Regression Trees; CRC Press: Boca Raton, FL, USA, 1984. [Google Scholar]
- Michell, T.M. Machine Learning; McGraw-Hill: New York, NY, USA, 1997; pp. 81–127. [Google Scholar]
- Staelin, C. Parameter Selection for Support Vector Machines. Hewlett-Packard Company. Available online: http://www.hpl.hp.com/techreports/2002/HPL-2002-354R1.pdf (accessed on 15 October 2017).
- Hsu, C.W.; Chang, C.C.; Lin, C.J. A Practical Guide to Support Vector Classification. Available online: http://www.csie.ntu.edu.tw/~cjlin/papers/guide/guide.pdf (accessed on 29 October 2017).
- Ekwevugbe, T.; Brown, N.; Pakka, V. Real-Time Building Occupancy Sensing for Supporting Demand Driven HVAC Operations. In Proceedings of the 13th International Conference for Enhanced Building Operations, Montreal, QC, Canada, 8–10 October 2013. [Google Scholar]
- Jiang, C.; Masood, M.K.; Soh, Y.C.; Li, H. Indoor occupancy estimation from carbon dioxide concentration. Energy Build. 2016, 131, 132–141. [Google Scholar] [CrossRef]
- Zuraimi, M.S.; Pantazaras, A.; Chaturvedi, K.A.; Yang, J.J.; Tham, K.W.; Lee, S.E. Predicting occupancy counts using physical and statistical CO2-based modeling methodologies. Build. Environ. 2017, 123, 517–528. [Google Scholar] [CrossRef]
- Li, Z.; Dong, B. A new modeling approach for short-term prediction of occupancy in residential buildings. Build. Environ. 2017, 121, 277–290. [Google Scholar] [CrossRef]
- Amayri, M.; Arora, A.; Ploix, S.; Bandhyopadyay, S.; Ngo, Q.D.; Badarla, V.R. Estimating occupancy in heterogeneous sensor environment. Energy Build. 2016, 129, 46–58. [Google Scholar] [CrossRef]
- Ryu, S.H.; Moon, H.J. Development of an occupancy prediction model using indoor environmental data based on machine learning techniques. Build. Environ. 2016, 107, 1–9. [Google Scholar] [CrossRef]
- Masood, M.K.; Soh, Y.C.; Jiang, C. Occupancy estimation from environmental parameters using wrapper and hybrid feature selection. Appl. Soft Comput. 2017, 60, 482–494. [Google Scholar] [CrossRef]
- Han, J.; Pei, J.; Kamber, M. Data Mining: Concepts and Techniques; Elsevier: Amsterdam, The Netherlands, 2011; pp. 336–341. [Google Scholar]
- Therneau, T.; Atkinson, B.; Ripley, B. CRAN-Package Rpart. Available online: https://cran.r-project.org/web/packages/rpart/rpart.pdf (accessed on 8 October 2017).
- Therneau, T.M.; Atkinson, E.J. An Introduction to Recursive Partitioning Using the RPART Routines. Available online: https://cran.r-project.org/web/packages/rpart/vignettes/longintro.pdf (accessed on 8 October 2017).
- Meyer, D.; Dimitriadou, E.; Hornik, K.; Weingessel, A.; Leisch, F.; Chang, C.; Lin, C. CRAN-Package e1071. Available online: https://cran.r-project.org/web/packages/e1071/e1071.pdf (accessed on 8 October 2017).
- Karatzoglou, A.; Meyer, D.; Hornik, K. Support Vector Machines. Available online: https://www.jstatsoft.org/article/view/v015i09/v15i09.pdf (accessed on 21 October 2017).
- Fritsch, S.; Guenther, F.; Suling, M.; Mueller, S.M. Training of Neural Networks. Available online: https://cran.r-project.org/web/packages/neuralnet/index.html (accessed on 25 Sepember 2017).
- Günther, F.; Fritsch, S. Neuralnet: Training of Neural Networks. Available online: https://journal.r-project.org/archive/2010/RJ-2010-006/RJ-2010-006.pdf (accessed on 8 October 2017).
- Goyal, S.; Ingley, H.A.; Barooah, P. Occupancy-based zone-climate control for energy-efficient buildings: Complexity vs. performance. Appl. Energy 2013, 106, 209–221. [Google Scholar] [CrossRef]
- Zhang, J.; Lutes, R.G.; Liu, G.; Brambley, M.R. Energy Savings for Occupancy Based Control (OBC) of Variable Air-Volume (VAV) Systems. 2013. Available online: https://www.pnnl.gov/main/publications/external/ technical_reports/PNNL-22072.pdf (accessed on 14 January 2019).
- DOE-2.1A Reference Manual. VIII. Weather Data. DOE. 1980. Available online: http://doe2.com/ download/DOE-21E/DOE-2ReferenceManualVersion2.1A.pdf (accessed on 29 October 2017).
- U.S. Department of Energy Commercial Reference Building Models of the National Building Stock. Available online: https://www.nrel.gov/docs/fy11osti/46861.pdf (accessed on 28 October 2017).



| Ref No. | Resolution | Accuracy | Classification Algorithm | Ground Truth | Data Gathering | Data Collecting Period | ||||||
|---|---|---|---|---|---|---|---|---|---|---|---|---|
| Virtual Sensor | Direct Occupancy Sensor | Time Information | ||||||||||
| Occupancy | Spatial | Temporal | Environment | Energy Usage | Contextual Information | |||||||
| [11] | Level 1, 2 | Room | Min. | 93.5%, 74.2% | ELM, ANN, SVM, KNN, LDA, CART | Camera | Temperature, RH, CO2, Air-Pressure | 30 days | ||||
| [13] | Level 1, 2 | Room | Min. | 98.2%, 97.8% | SNM, KNN, ANN, NB, TAN, DT | Camera Touchscreen | Temperature, RH, CO2, Light, Sound | Door | Motion, Infrared | 20 days | ||
| [15] | Level 1, 2 | Room | Min. | 95.5%, 78.0% | SVM, KNN | Camera, Observation | Temperature, RH, Light, Sound | PIR | Meeting schedule | 10 days | ||
| [12] | Level 1 | Room | Min. | 99.3% | LDA, CART, RF, GBM | Camera | Temperature. RH, Humidity ratio, CO2, Light | Time stamp, Date stamp | ||||
| [14] | Level 2 | Room | Min. | 65–90% | SVM, ANN, HMM | Camera | Temperature, RH, CO2, Light, Outdoor-Temperature, Sound, DewPoint, PM2.5, CO, TVOC | Motion | 44 days | |||
| [24] | Level 1 | Room | Min. | 98.4% | Decision tree | Camera | CO2, Light, Sound | Current (pc) | Motion | 7 days | ||
| [18] | Level 2 | Room | Min. | 87.6% | Radial Basis Function (RBF) neural network | Camera Touchscreen | Temperature, RH, CO2, Light, Sound | Motion, PIR | 20 days | |||
| [19] | Level 1 | Room | Sec. | Belief network | Manual, Camera | Outbound phone call | Motion | 2 days | ||||
| [20] | Level 1 | Room | Sec. | 97.0% | Bayesian network | Manual | Wi-Fi, Keyboard-mouse, Bluetooth, Door | Motion, Chair sensors | 2 weeks | |||
| [16] | Level 2 | Floor | Min. | 80.0% | SVM, ANN, HMM | Video camera | Temperature, RH, CO2, Light, Outdoor-Temperature, Sound, DewPoint, PM2.5, CO, TVOC | Motion | 44 days | |||
| [17] | Level 2 | Room | Min. | 80.8% | SVM, HMM, Autoregressive Hidden Markov Model | Manual recording | Temperature, RH, CO2 | PIR | 3 weeks | |||
| [21] [22] | Level 2 | Open office | Min. | 80.0% | M-FRNN, ANN, kNN, SVM | Camera | Temperature, RH, CO2, CO, Pressure, Airflow | Time | 9 days | |||
| [23] [24] | Level 2 Level 4 | Rooms | Min. | 92.8% 97.6% | kNN, CARM, RF, SVM, CNN | Controlled condition | 2 days | |||||
| [25] | Level 2 | Room | Min. | 65.0% | Decision tree | Recorded videos | Temperature, RH, CO2, Light | Power (laptop) | Door, Window | Motion | Time stamp, Date Stamp | 16 days |
| [27] | Level 1, 2 | Room | Min. | 87.0%, 78.0% | Layered Hidden Markov Model | Manual recording, Ultrasound range finder | Power (plug) | PIR | 5 days, 7 days | |||
| Category | Description |
|---|---|
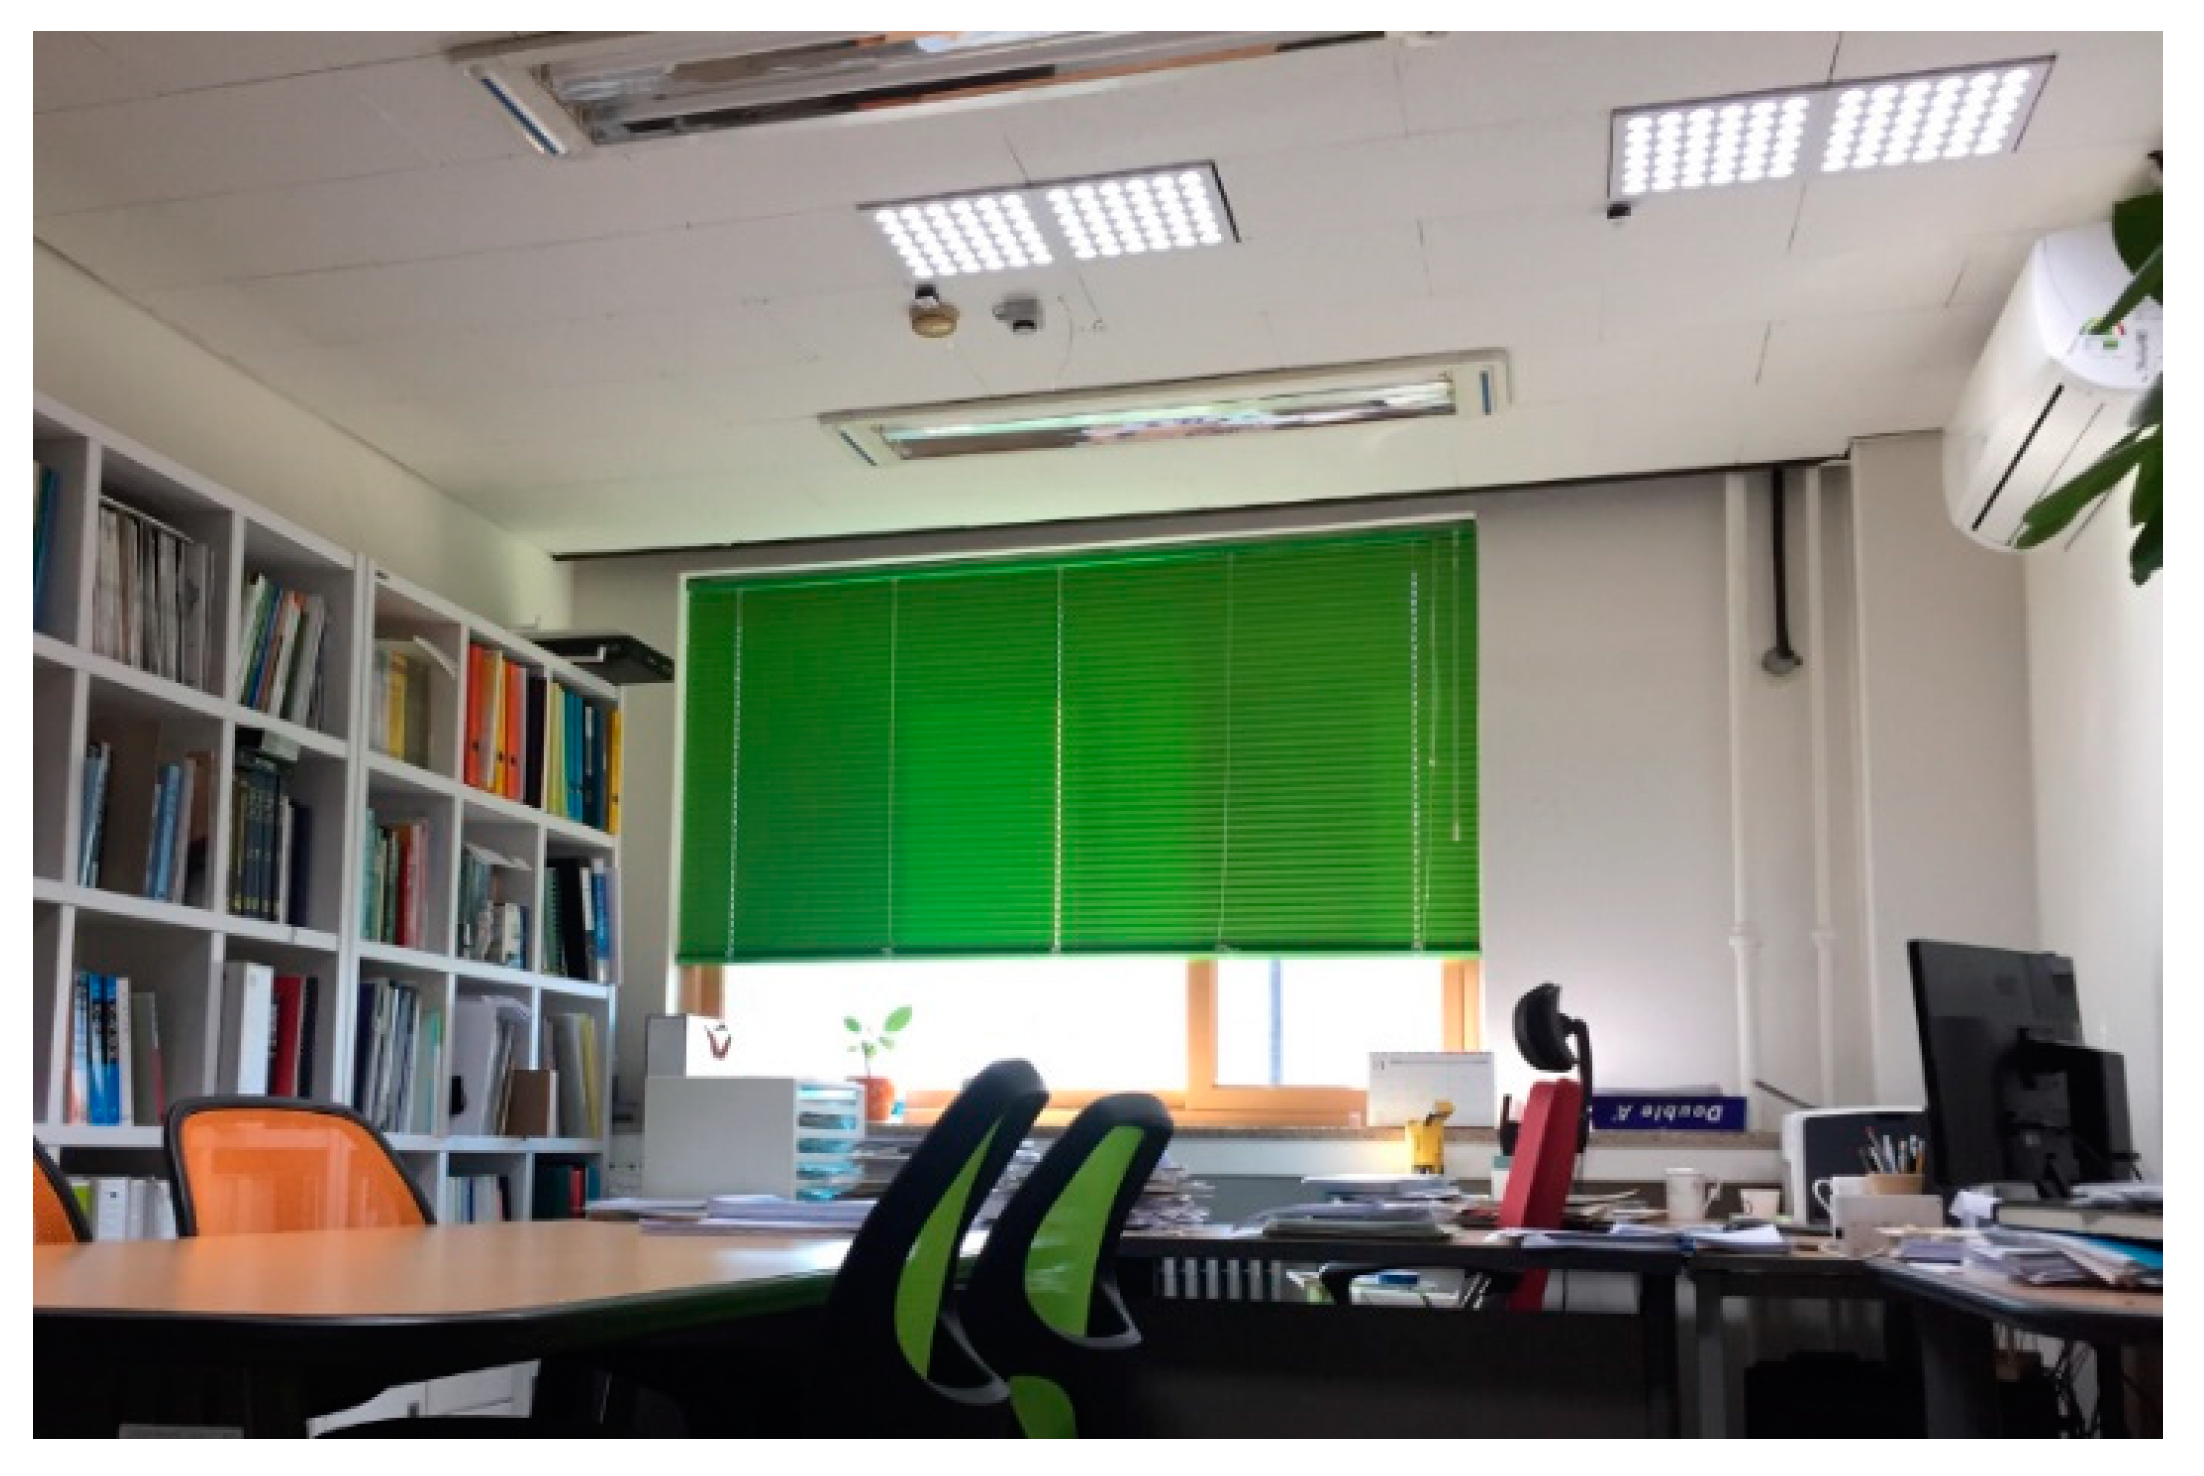
| Location | Cheongju-si, Republic of Korea |
| Room area | 22.51 m2 |
| Room purpose | Private office |
| Occupant number | 1 person |
| Lighting equipment | LED (auto dimming control) |
| Heating and cooling equipment | EHP, Auxiliary heater, Steam radiator |
| Office equipment | Desktop PC |
| Control | All equipment except the steam radiator is individually controlled by an occupant. |
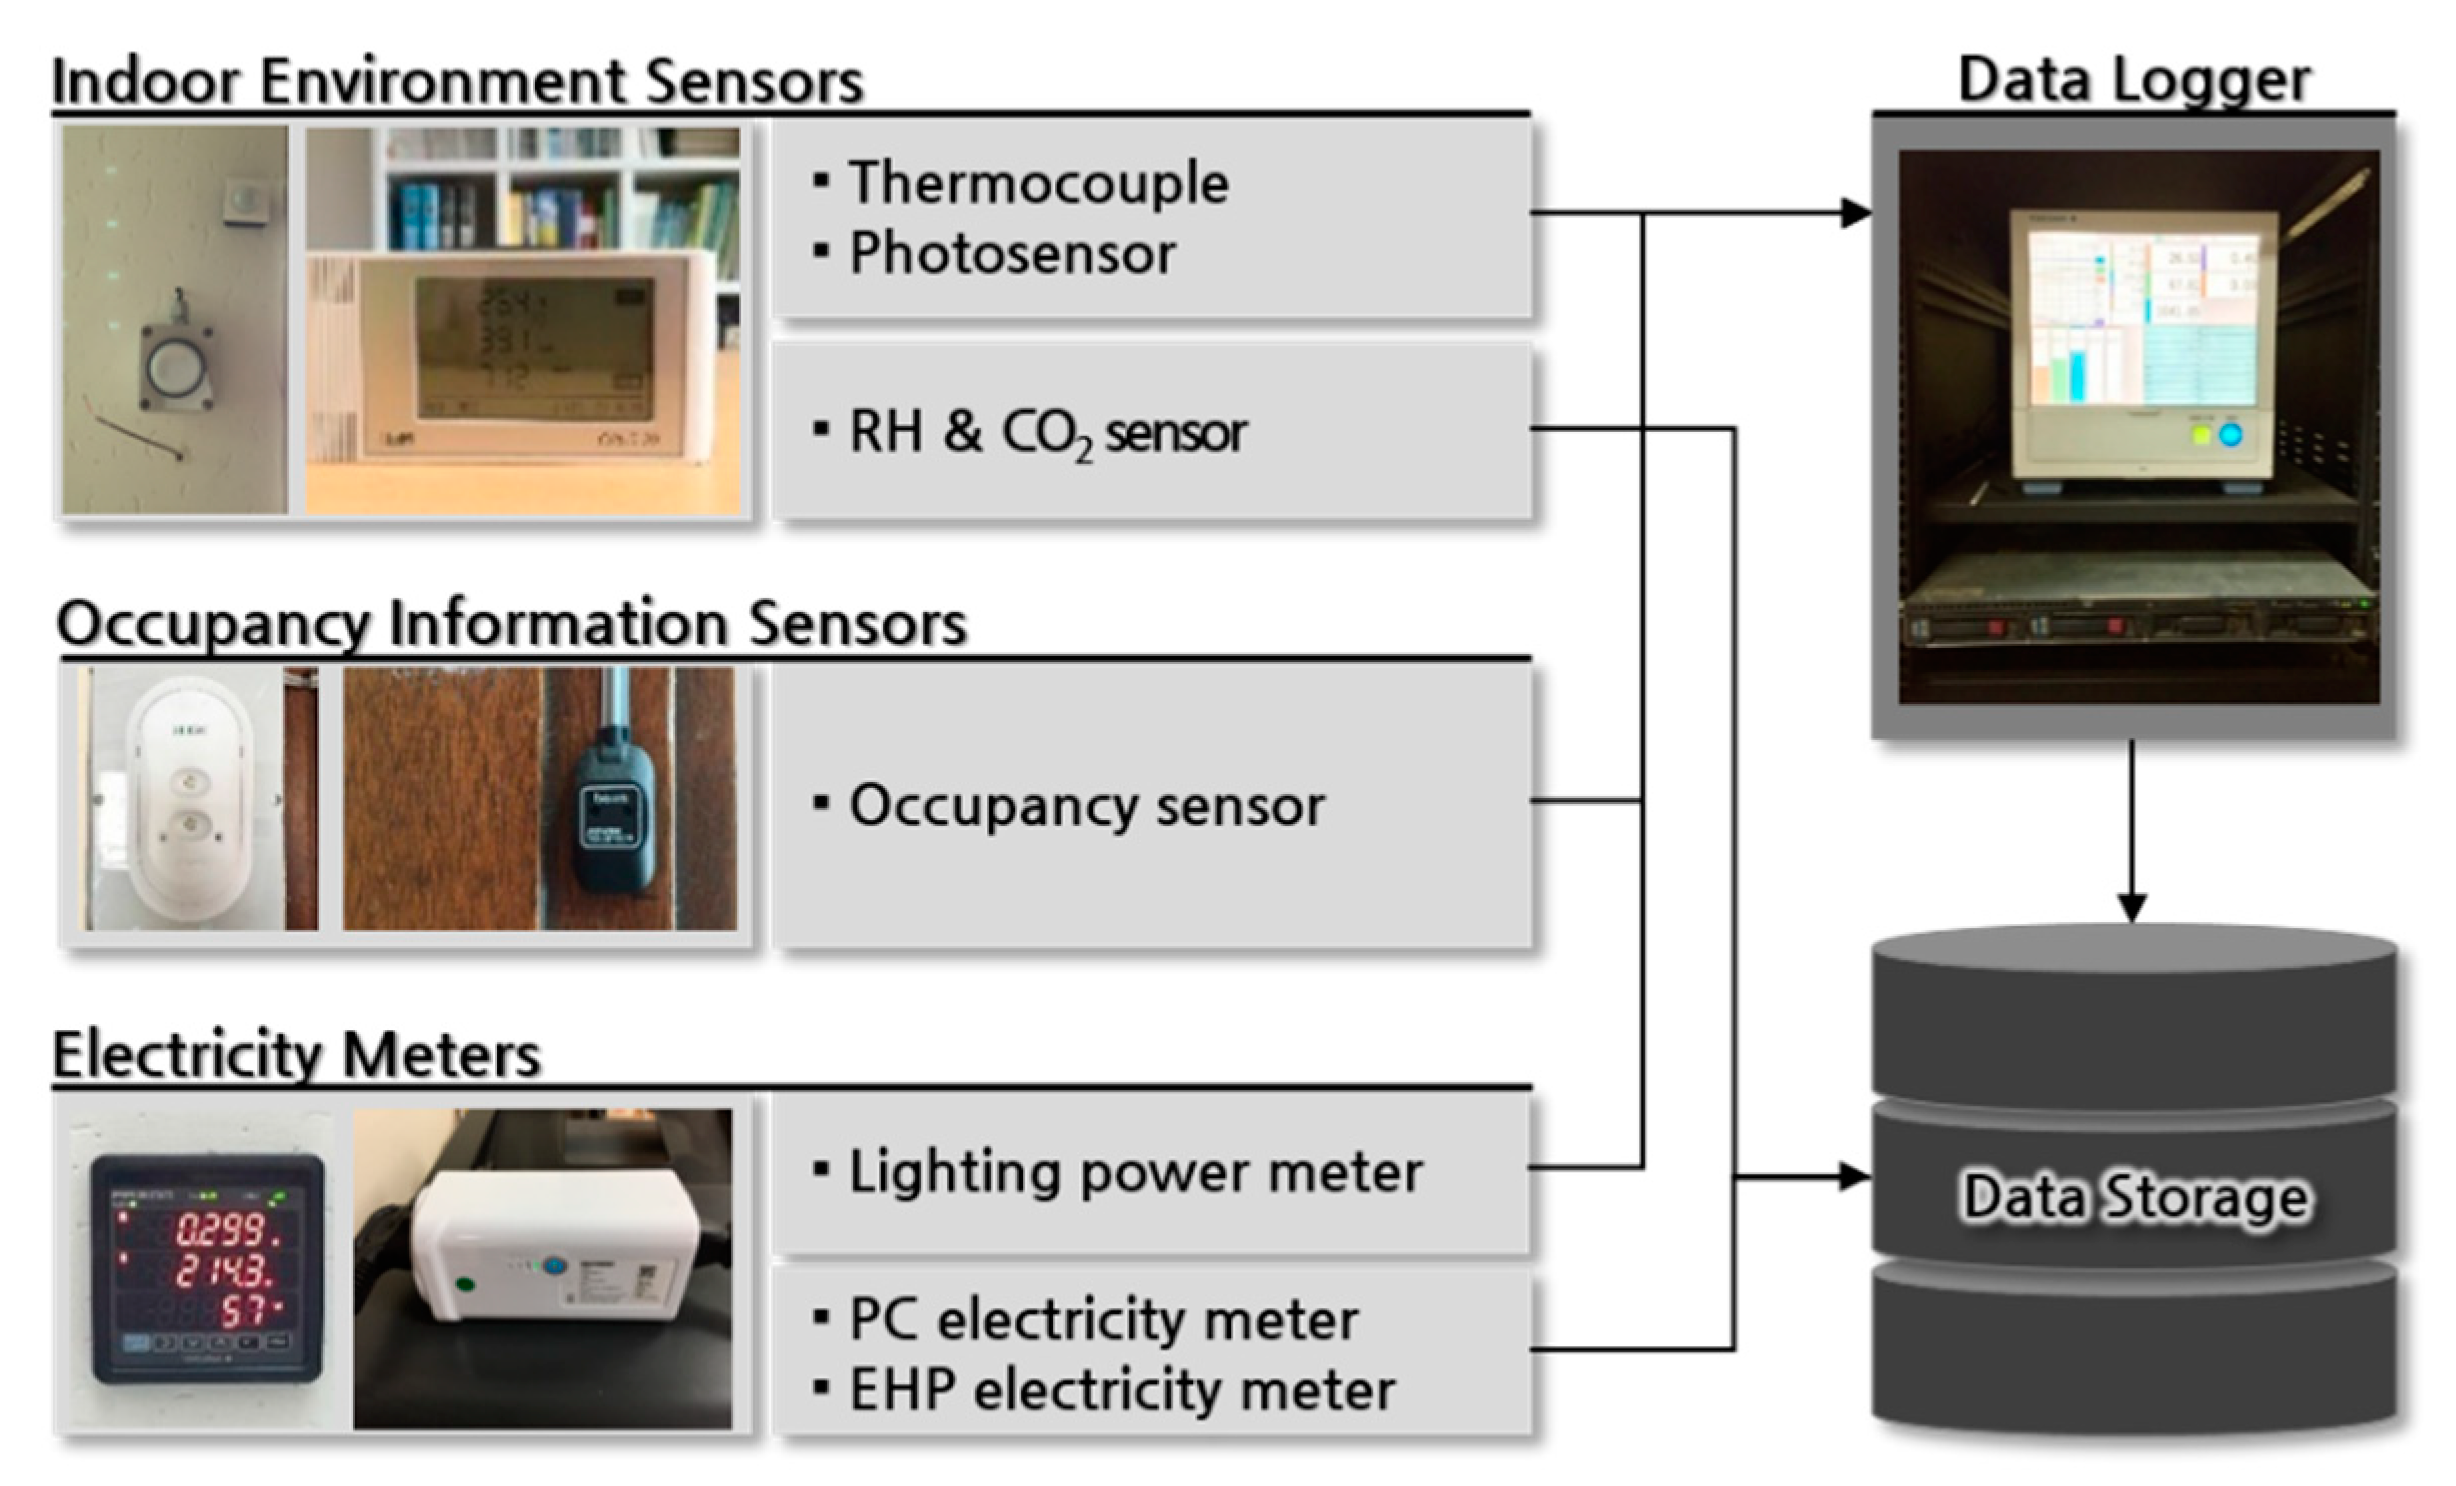
| Logger | Measuring Element | Sensor (Manufacture) | Resolution | Data Interval |
|---|---|---|---|---|
| Logger 1 | Temperature | TX-FF-0.32-1P (FUKUDEN) | 0.5 °C (at −25~100 °C) | 1 min |
| Illuminance | HD2021T AA-SP (Deltaohm) | ±0.005 klux (at 0.02~2 klux) | ||
| Lighting power | PR300 (Yokogawa) | ±0.5 W | ||
| Occupancy status | PN1500 (Botem) | 98.61% | ||
| Logger 2 | Relative humidity | OPUS20 TCO (Lufft) | ±2% RH | 15 min |
| concentration | ±50 ppm | |||
| Logger 3 | EHP energy consumption | Enertalk Plug (Encored Technologies) | ±0.9% | 1 s |
| PC energy consumption |
| Measurement Elements | Total Number of Data Points | Number of Missing Data Points | Missing Rate | ||||
|---|---|---|---|---|---|---|---|
| Total | Short-Term | Long-Term | Total | Short-Term | Long-Term | ||
| Temperature | 26,304 | 593 | 522 | 71 | 2.25% | 0.27% | 1.99% |
| Relative humidity | 26,304 | 32 | 22 | 10 | 0.12% | 0.04% | 0.08% |
| concentration | 26,304 | 32 | 22 | 10 | 0.12% | 0.04% | 0.08% |
| Illuminance | 26,304 | 587 | 520 | 67 | 2.23% | 0.25% | 1.98% |
| Lighting power | 26,304 | 587 | 520 | 67 | 2.23% | 0.25% | 1.98% |
| PC usage | 26,304 | 172 | 126 | 46 | 0.48% | 0.16% | 0.32% |
| EHP usage | 26,304 | 157 | 118 | 39 | 0.42% | 0.13% | 0.29% |
| Occupancy | 26,304 | 587 | 520 | 67 | 2.23% | 0.25% | 1.98% |
| Notation | Calculation | Description |
|---|---|---|
| FD1_ | raw(i) − raw(i − 1) | First order difference |
| SD_ | FD(i) − FD(i − 1) | Second order difference |
| FD2_ | raw(i) − raw(i − 2) | Variation of first order difference |
| MA1h_ | /4 | 1-h moving average |
| CSD | Cumulative seconds of a day | |
| Hour | Hour of the measured time |
| Seasonal Period | SVM | ANN | ||
|---|---|---|---|---|
| Hidden Layer | Hidden Neuron | |||
| Winter | 1 | 1 | 1 | 10 |
| Transition period | 10 | 10 | 1 | 10 |
| Spring | 10 | 10 | 2 | 30 |
| Summer | 0.1 | 0.1 | 1 | 10 |
| Rank | Winter | Transition_Period | Spring | Summer | ||||
|---|---|---|---|---|---|---|---|---|
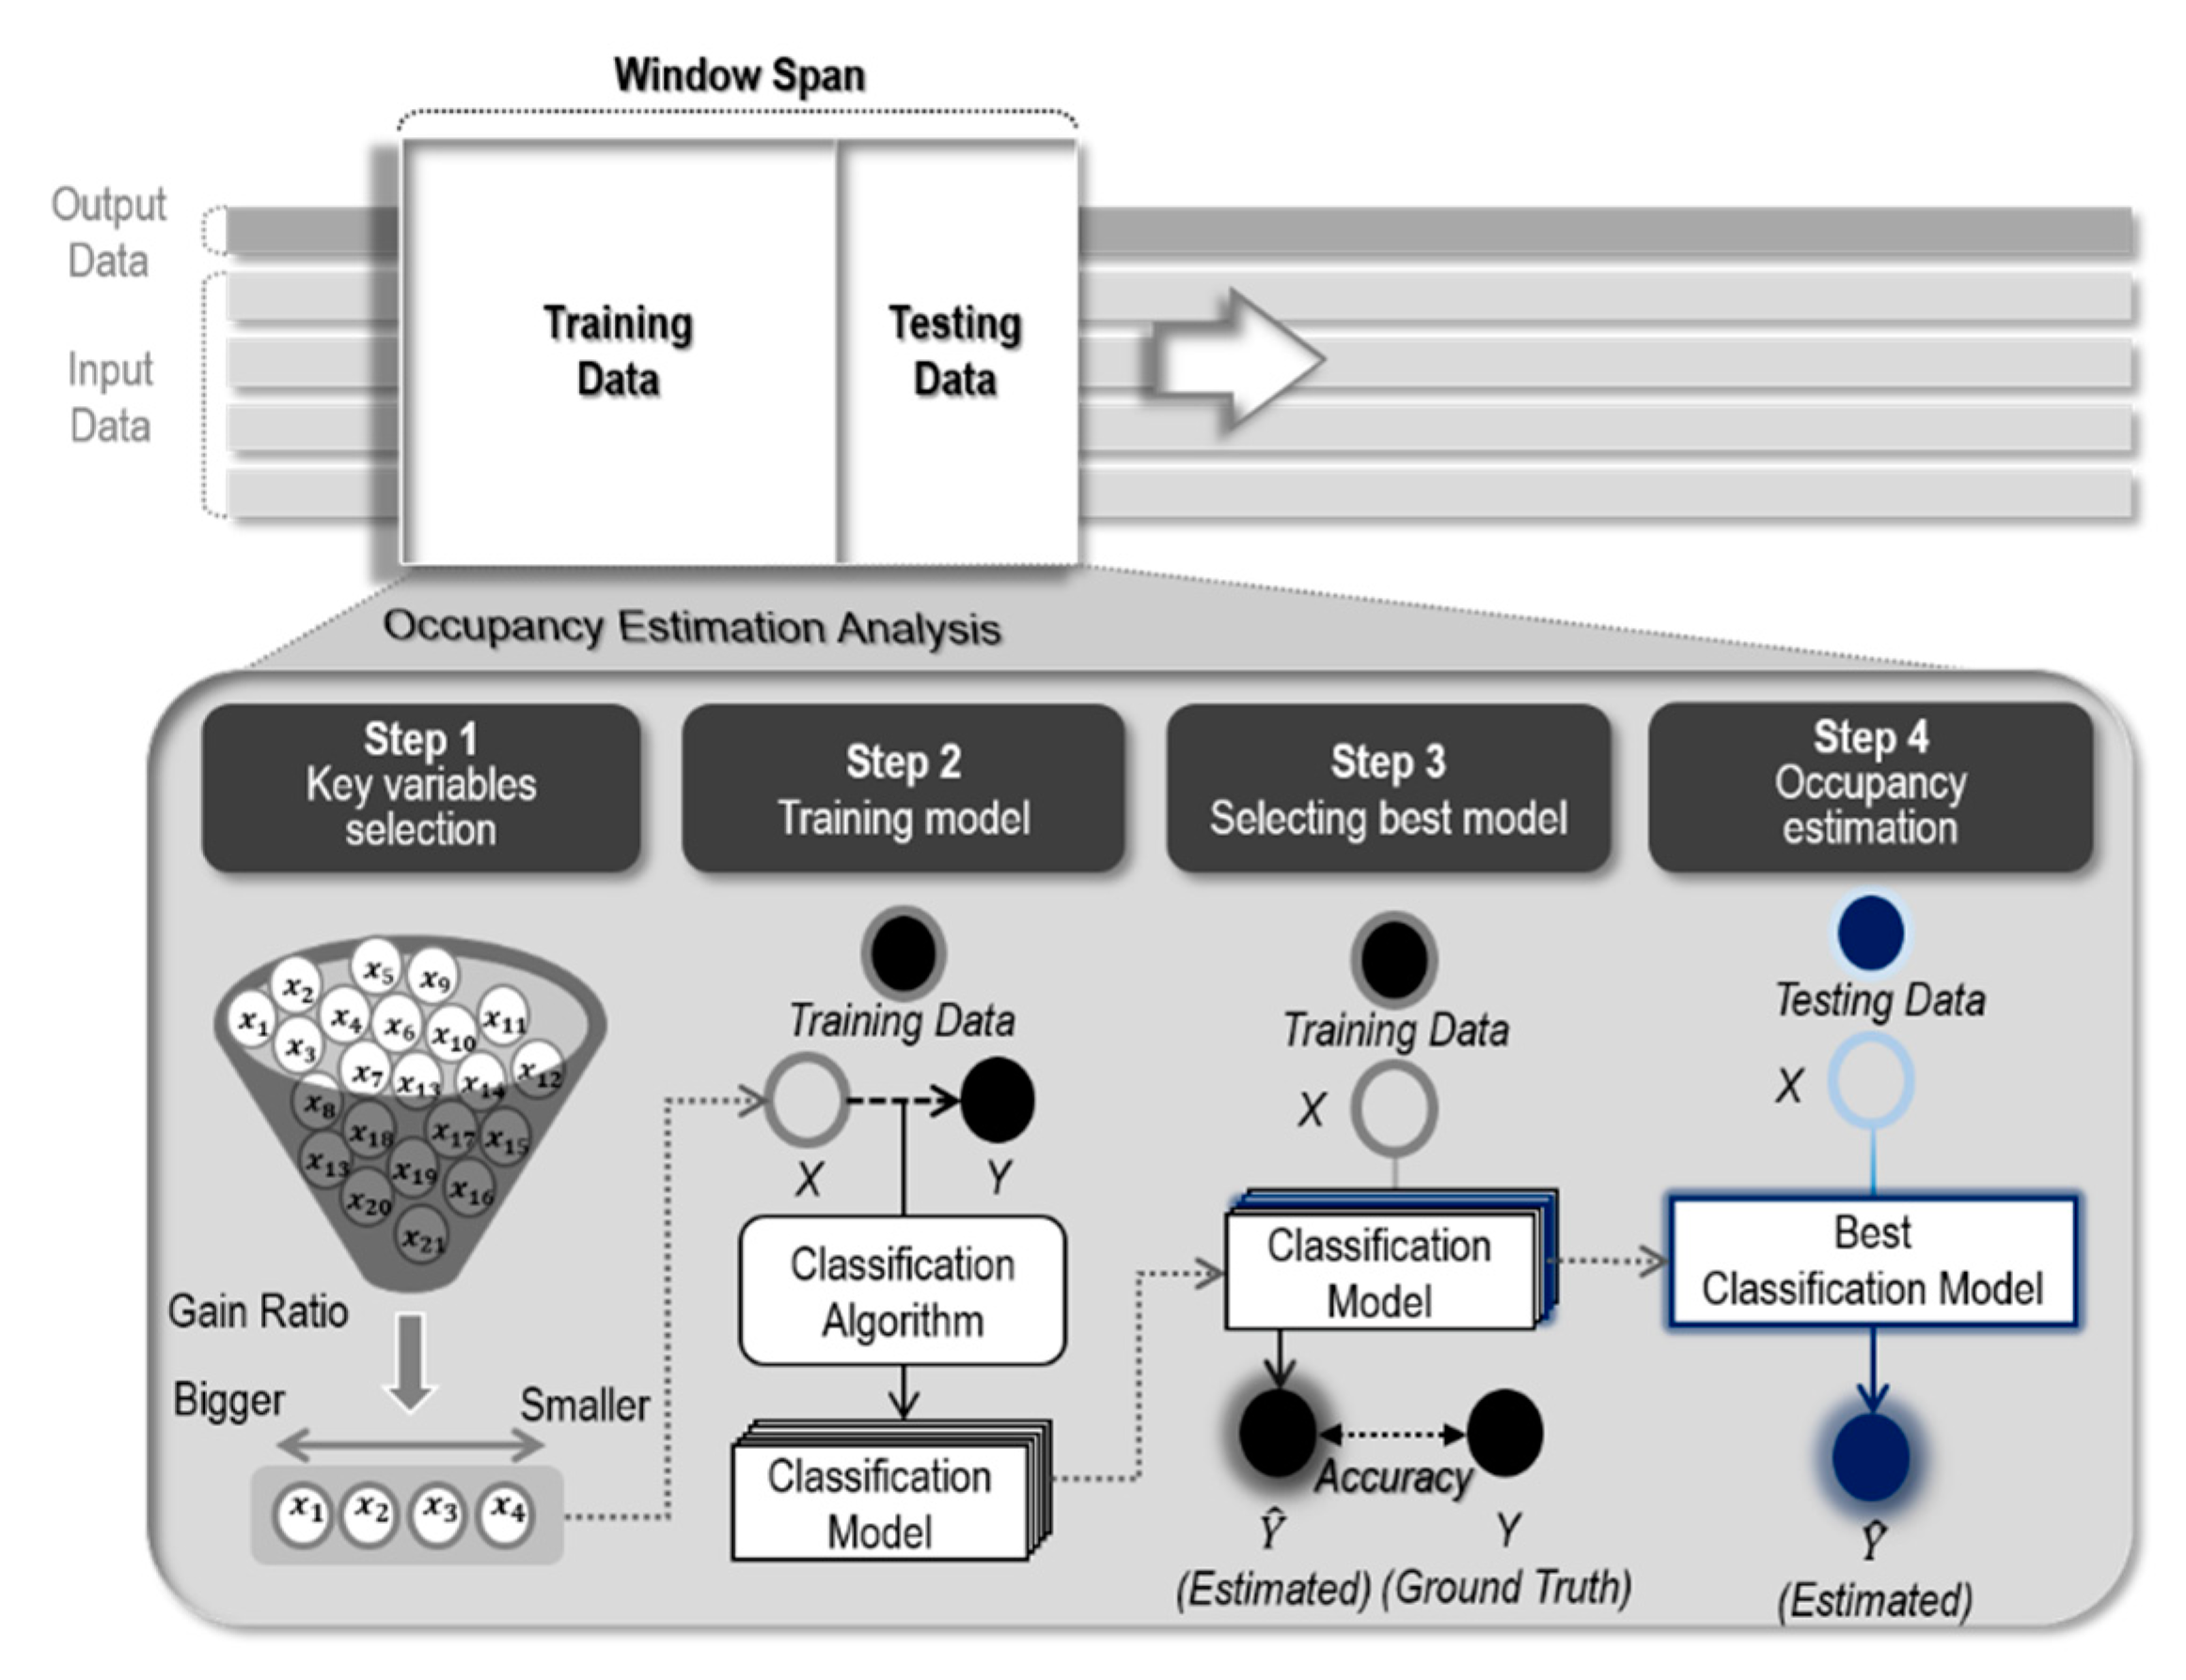
| 1 | Light_Power (W) | 0.6103 | PC_Usage (Wh) | 0.4330 | PC_Usage (Wh) | 0.3380 | Light_Power (W) | 0.7868 |
| 2 | PC_Usage (Wh) | 0.3140 | EHP_Usage (Wh) | 0.3988 | EHP_Usage (Wh) | 0.3372 | EHP_Usage (Wh) | 0.7283 |
| 3 | ILLUM (lux) | 0.2354 | Light_Power (W) | 0.2305 | ILLUM (lux) | 0.2726 | ILLUM (lux) | 0.2718 |
| 4 | TEMP (°C) | 0.1355 | ILLUM (lux) | 0.2267 | Light_Power (W) | 0.2631 | CO2 (ppm) | 0.2635 |
| 5 | MA1h_TEMP | 0.1243 | CO2 (ppm) | 0.1791 | MA1h_RH | 0.2487 | PC_Usage (Wh) | 0.2436 |
| 6 | FD1_CO2 | 0.1195 | MA1h_CO2 | 0.1455 | FD2_CO2 | 0.1460 | FD2_ CO2 | 0.2022 |
| 7 | CO2 (ppm) | 0.1095 | TEMP (°C) | 0.1335 | RH (%) | 0.1364 | MA1h_CO2 | 0.1965 |
| 8 | EHP_Usage (Wh) | 0.1002 | MA1h_TEMP | 0.1281 | FD1_CO2 | 0.1188 | FD1_CO2 | 0.1832 |
| 9 | FD2_CO2 | 0.0958 | FD1_CO2 | 0.1186 | CO2 (ppm) | 0.1182 | TEMP (°C) | 0.1257 |
| 10 | MA1h_CO2 | 0.0941 | CSD | 0.1121 | MA1h_CO2 | 0.0941 | MA1h_TEMP | 0.1174 |
| 11 | SD1_CO2 | 0.0791 | FD2_CO2 | 0.0965 | CSD | 0.0911 | SD1_TEMP | 0.0959 |
| 12 | HOUR | 0.0701 | SD1_CO2 | 0.0810 | HOUR | 0.0888 | SD1_CO2 | 0.0827 |
| 13 | CSD | 0.0682 | HOUR | 0.0716 | SD1_CO2 | 0.0852 | FD2_TEMP | 0.0752 |
| 14 | FD1_TEMP | 0.0642 | SD1_TEMP | 0.0715 | FD2_TEMP | 0.0772 | SD1_RH | 0.0743 |
| 15 | SD1_TEMP | 0.0635 | FD2_TEMP | 0.0688 | SD1_TEMP | 0.0754 | FD1_TEMP | 0.0694 |
| 16 | FD2_TEMP | 0.0619 | FD1_TEMP | 0.0661 | FD1_TEMP | 0.0717 | FD1_RH | 0.0632 |
| 17 | SD1_RH | 0.0470 | FD2_RH | 0.0385 | TEMP (°C) | 0.0651 | FD2_RH | 0.0626 |
| 18 | FD1_RH | 0.0412 | FD1_RH | 0.0318 | MA1h_TEMP | 0.0628 | HOUR | 0.0502 |
| 19 | FD2_RH | 0.0340 | RH (%) | 0.0187 | FD2_RH | 0.0370 | RH (%) | 0.0499 |
| 20 | MA1h_RH | 0.0150 | MA1h_RH | 0.0175 | SD1_RH | 0.0301 | CSD | 0.0485 |
| 21 | RH (%) | 0.0138 | SD1_RH | 0.0130 | FD1_RH | 0.0251 | MA1h_RH | 0.0409 |
| Algorithm | Winter | Transition Period | Spring | Summer | |
|---|---|---|---|---|---|
| CART | Model | Light_Power + PC_Usage + TEMP | EHP_Usage + PC_Usage + ILLUM | EHP_Usage + PC_Usage | Light_Power |
| Accuracy | 94.58% | 97.19% | 91.33% | 97.18% | |
| SVM | Model | Light_Power + PC_Usage + TEMP | EHP_Usage + PC_Usage | PC_Usage + ILLUM | Light_Power |
| Accuracy | 93.26% | 96.25% | 93.55% | 97.08% | |
| ANN | Model | ILLUM + PC_Usage + TEMP | PC_Usage + ILLUM | EHP_Usage + PC_Usage | Light_Power + PC_Usage |
| Accuracy | 93.03% | 96.46% | 90.52% | 97.08% | |
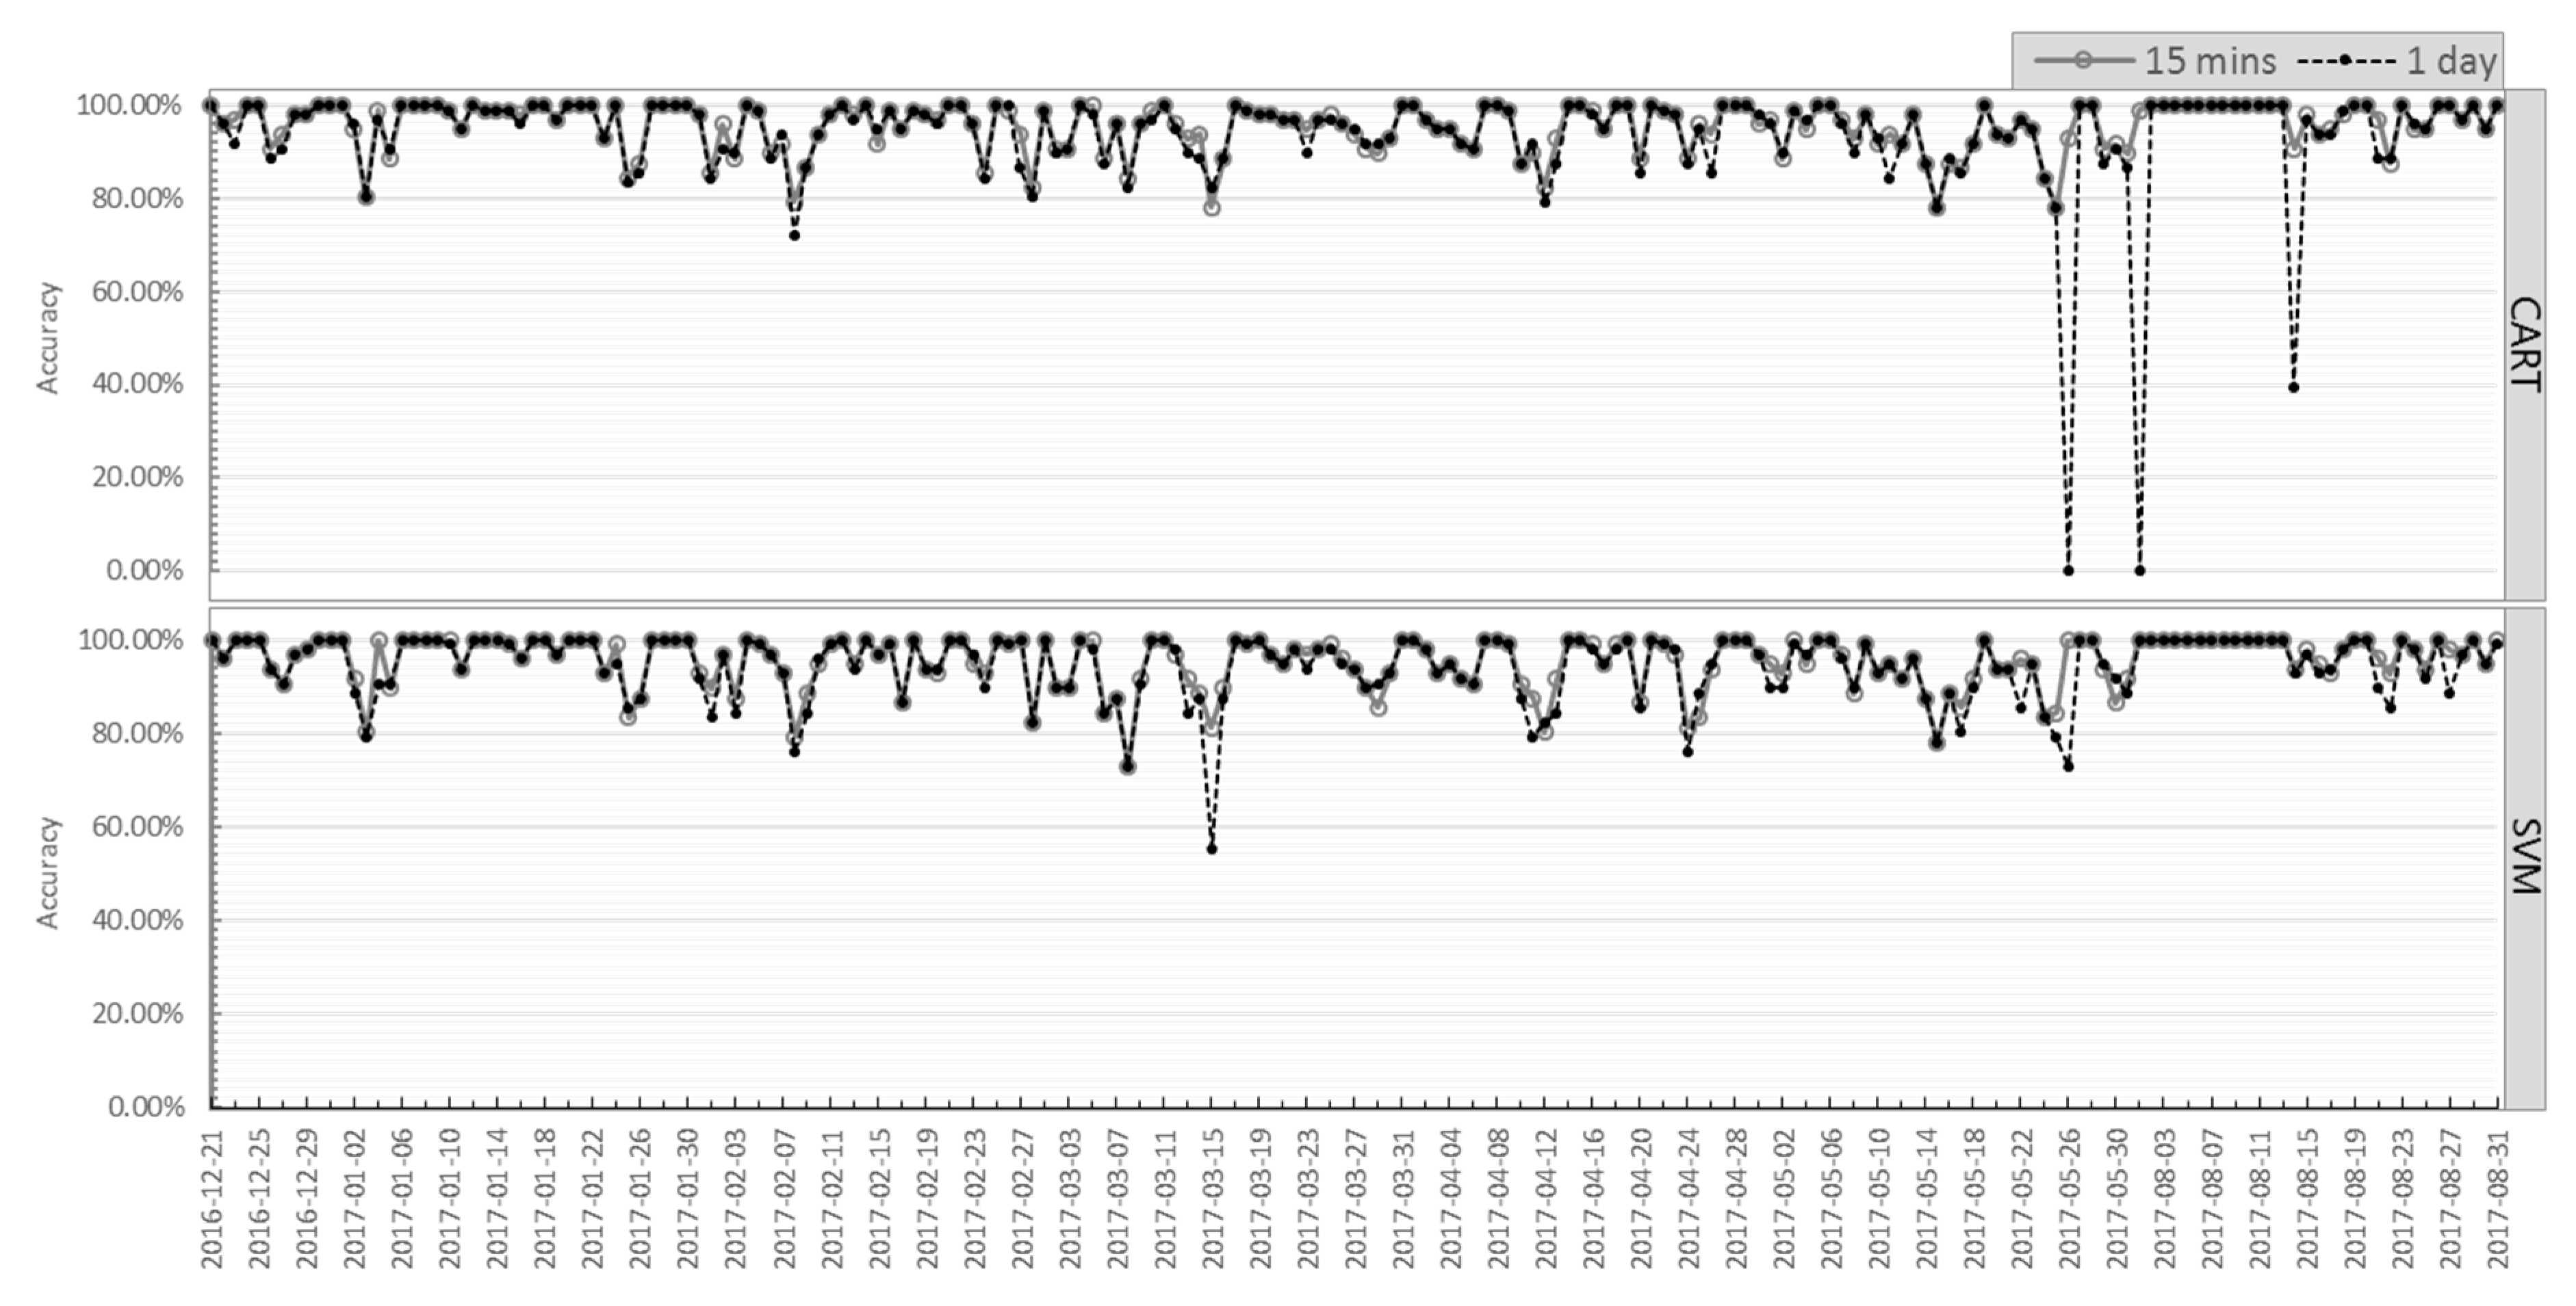
| Algorithm | Moving | Overall Accuracy | Standard Deviation |
|---|---|---|---|
| CART | 15 min | 95.59% | 5.24% |
| 1 day | 93.84% | 11.85% | |
| SVM | 15 min | 95.44% | 5.60% |
| 1 day | 94.55% | 6.90% |
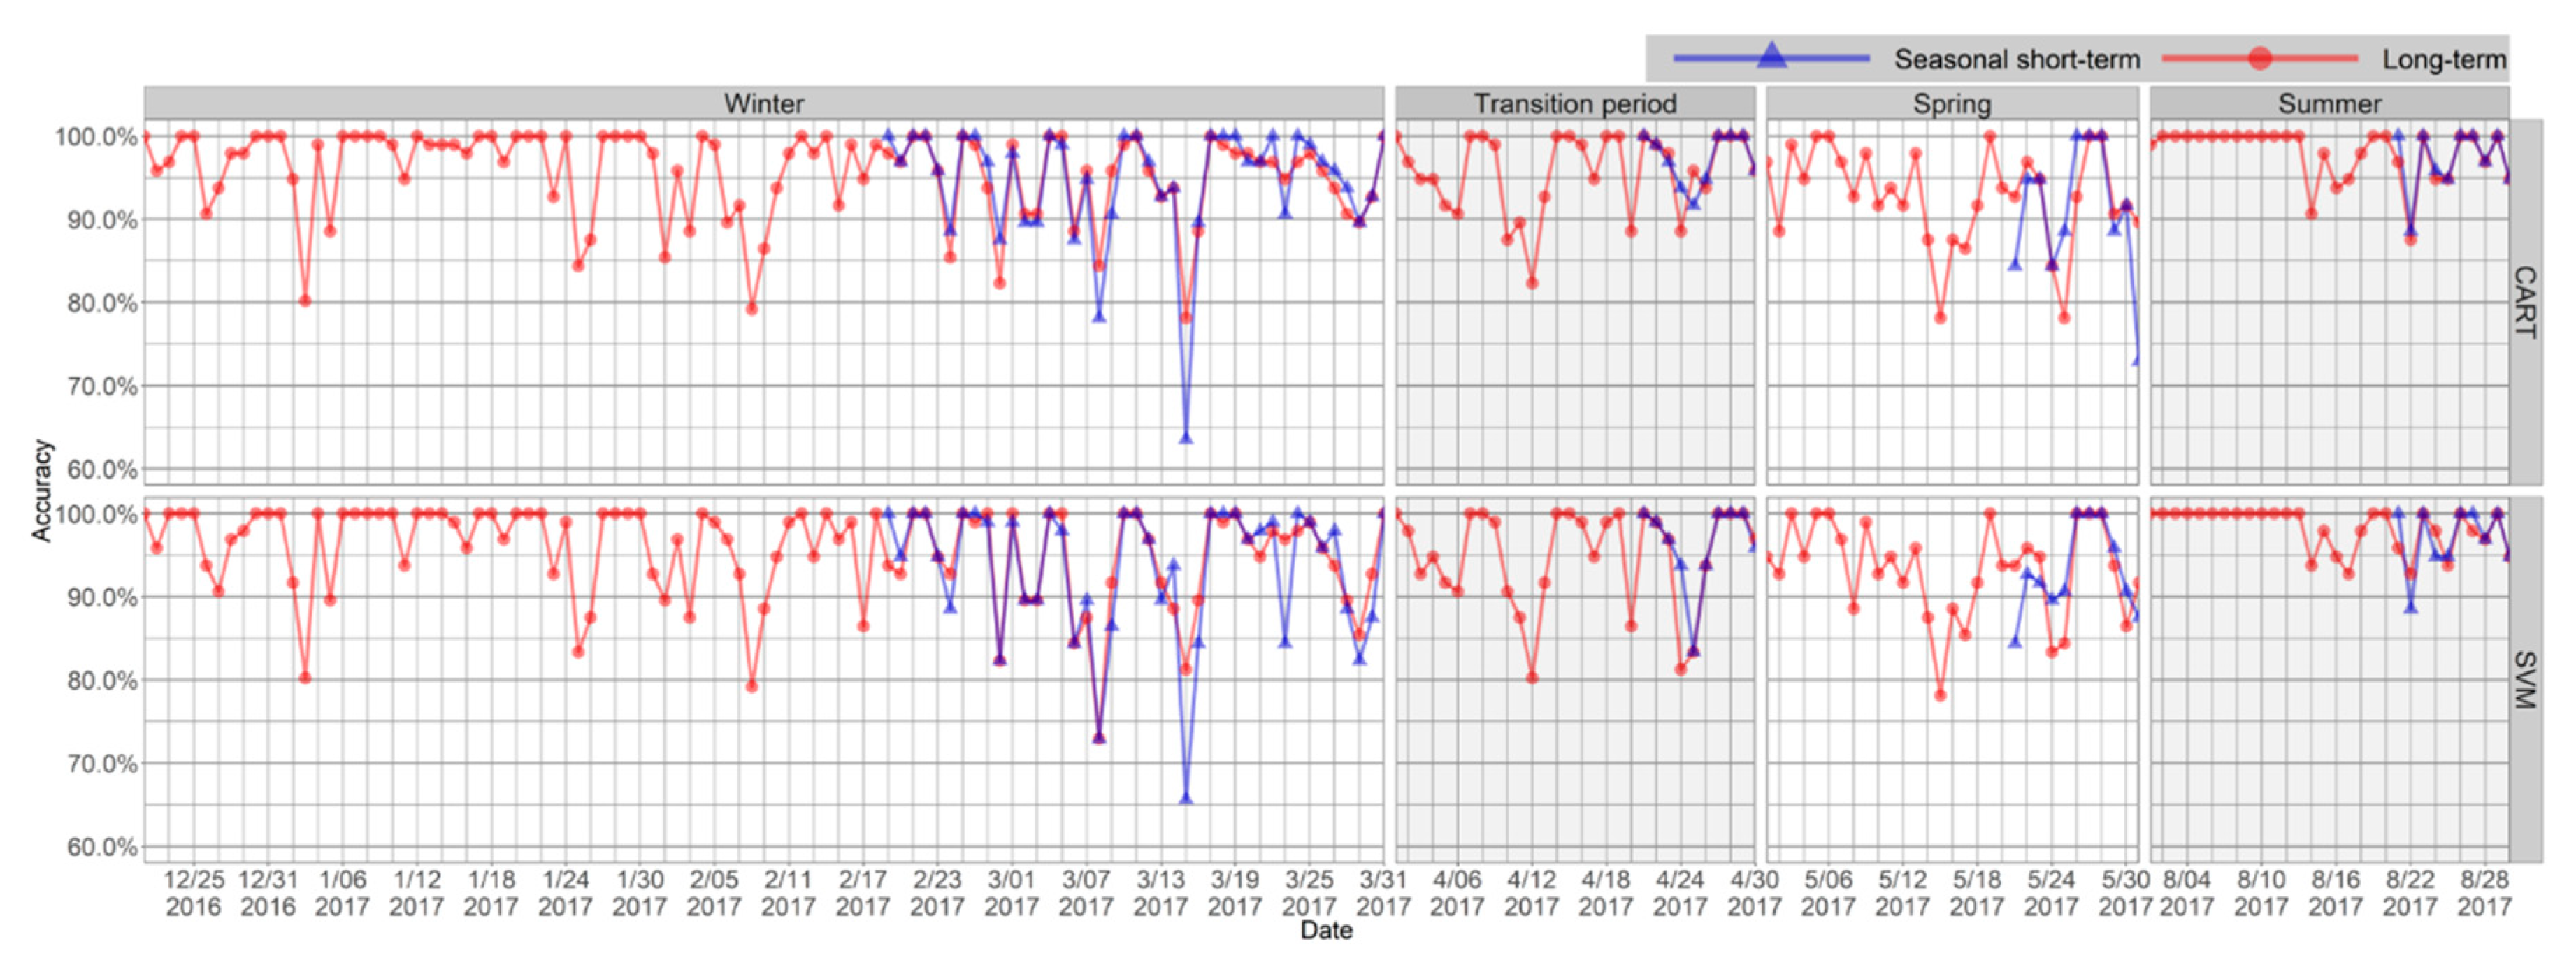
| Method | Algorithm | Winter | Transition Period | Spring | Summer | All Period |
|---|---|---|---|---|---|---|
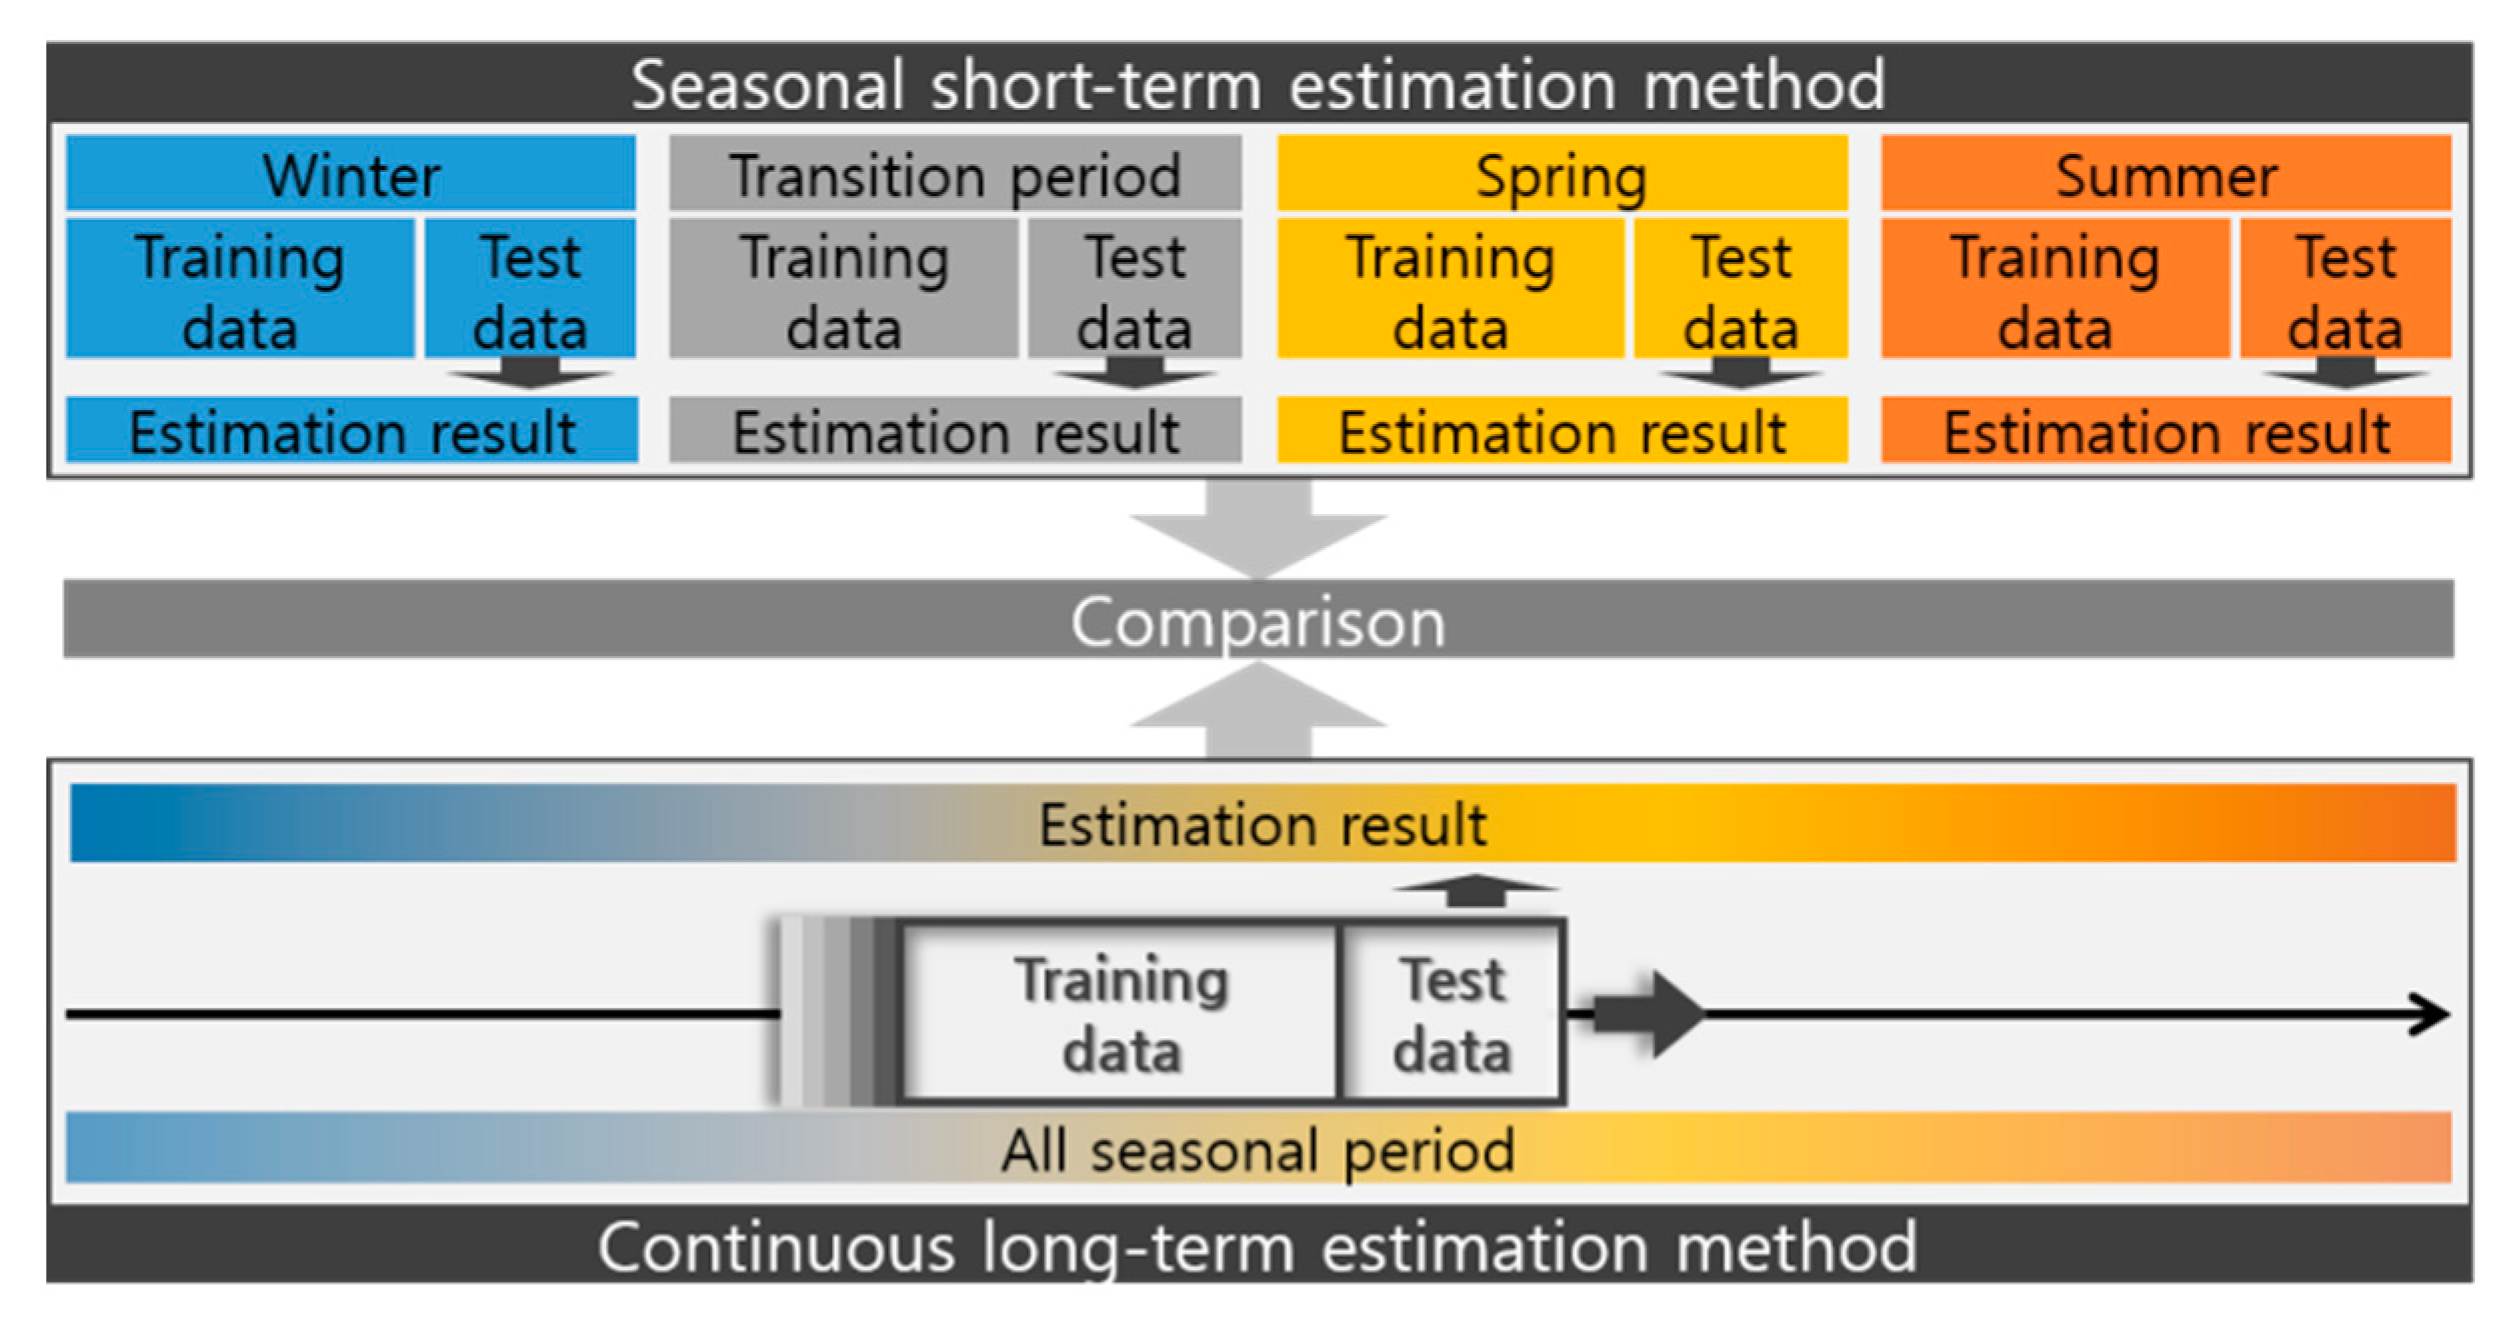
| Seasonal short-term estimation | CART | 94.58% | 97.19% | 91.33% | 97.18% | 94.85% |
| SVM | 93.26% | 96.25% | 93.55% | 97.08% | 94.28% | |
| Continuous long-term estimation | CART | 95.62% | 95.76% | 92.84% | 98.05% | 95.59% |
| SVM | 95.41% | 94.90% | 93.25% | 98.29% | 95.44% |
| Variables | Input Value | |
|---|---|---|
| Space Info. | 4.0 × 6.0 × 2.7 (m) | |
| Window Info. | 2.0 × 1.5 (m), facing south-west | |
| U-Value | Wall | 0.509 W/m2·K |
| Window | 3.159 W/m2·K | |
| Interior Shade Status | 100% closed blinds with 30% area retracted | |
| Cooling Equipment | EHP | 3500 W (efficiency: 5.4 W/W) |
| Heating Equipment | EHP | 4300 W (efficiency: 2.9 W/W) |
| Steam Radiator (Central) | ||
| Resistive Heater (Auxiliary) | ||
| Lighting | LED | 40 W × 3 EA, Dimming |
| Plug Load | PC | 111 W |
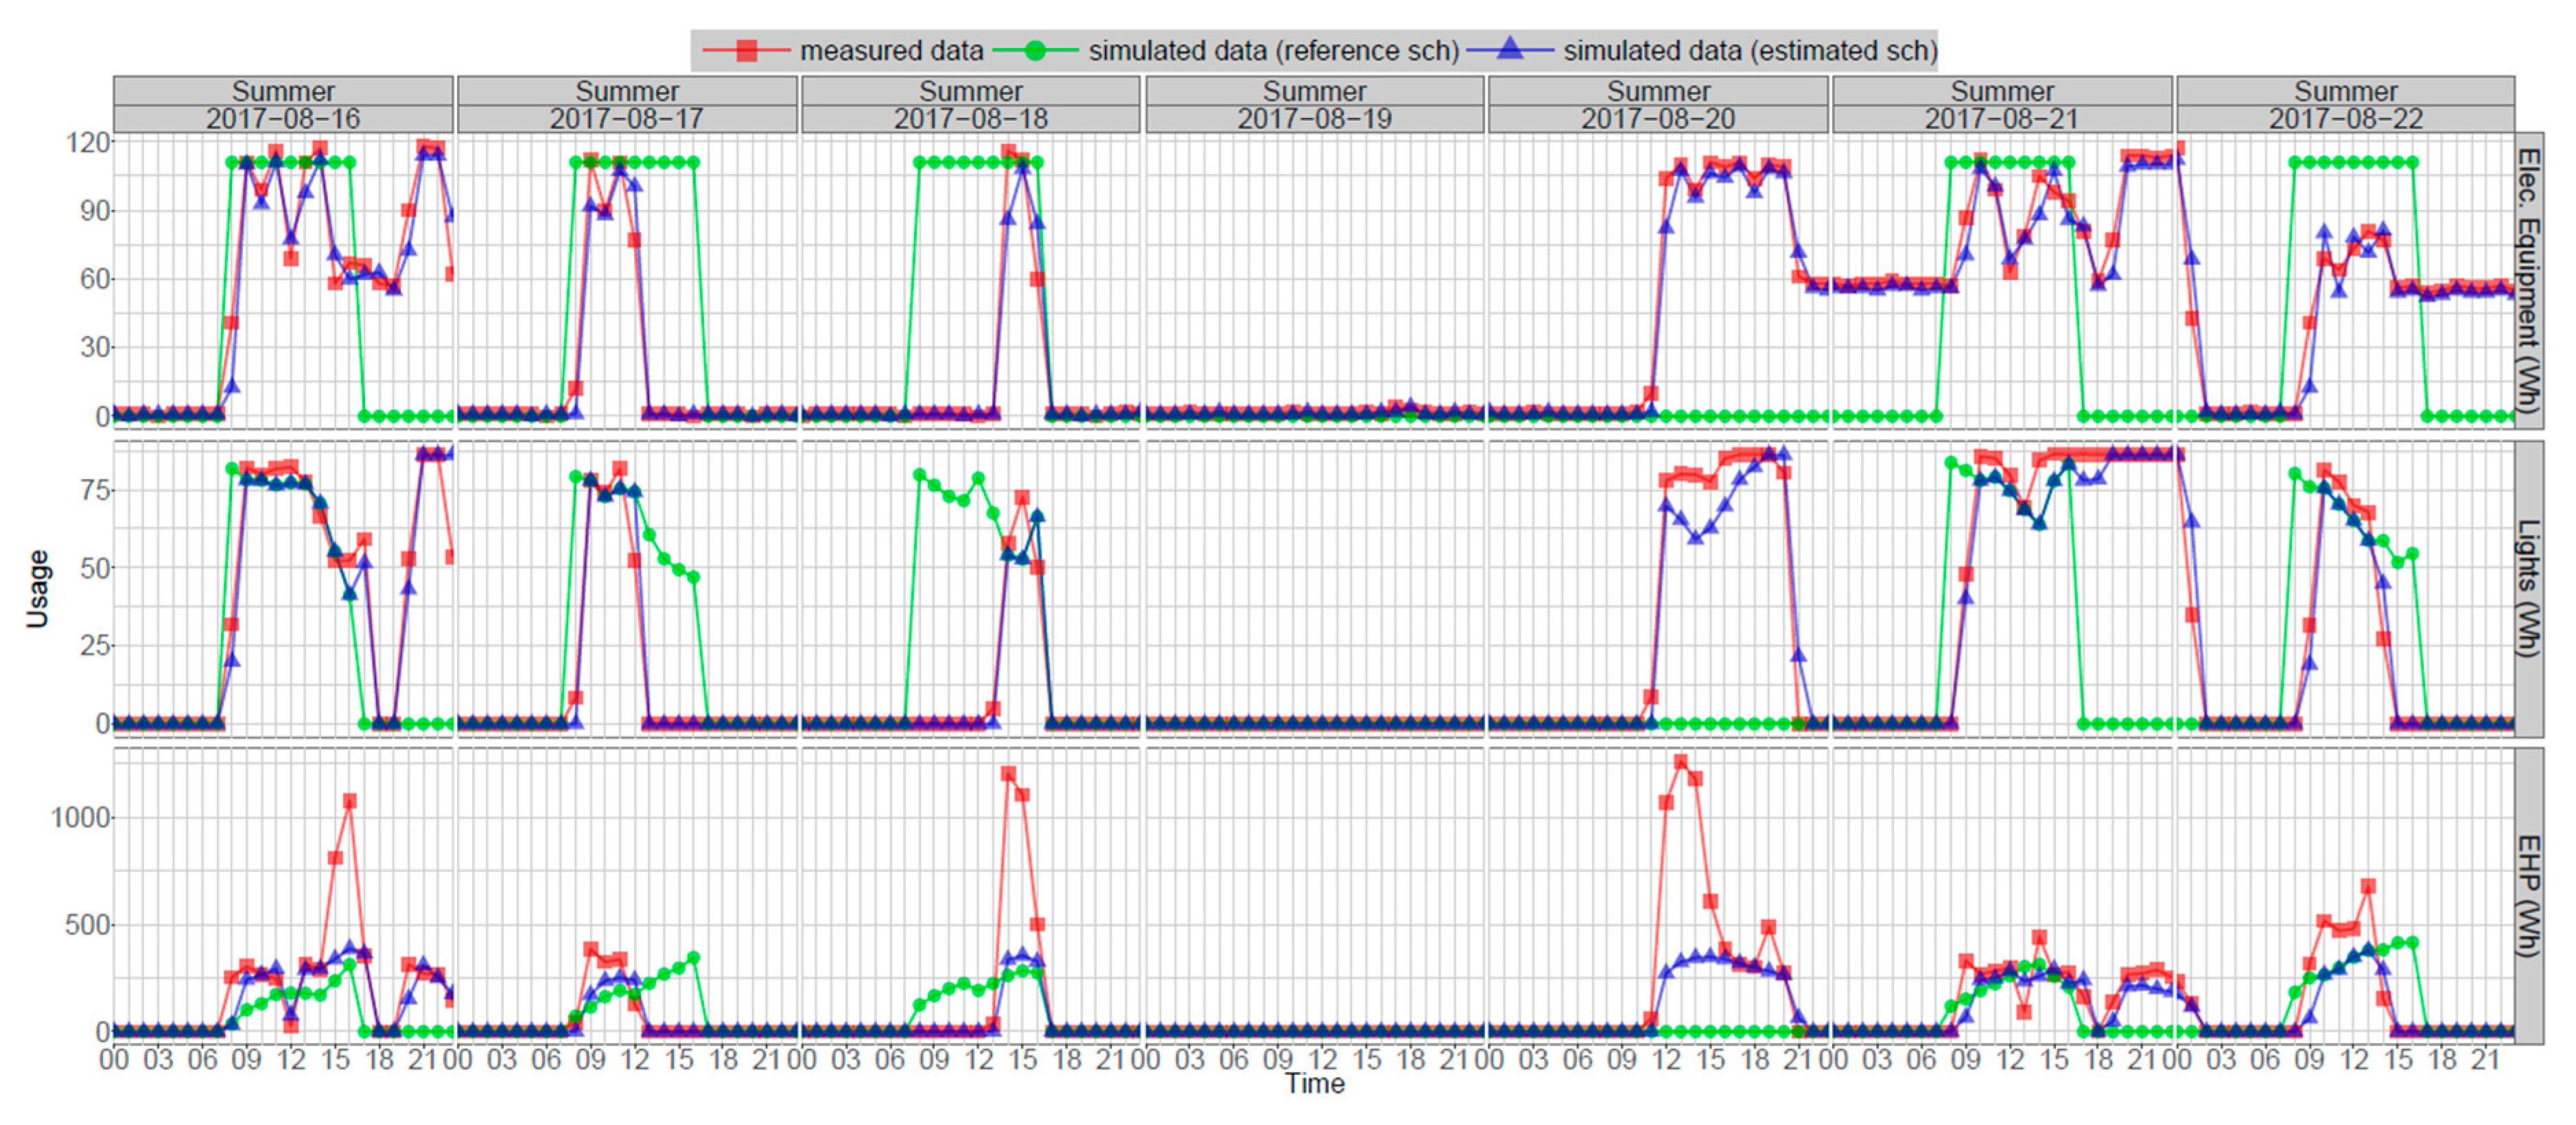
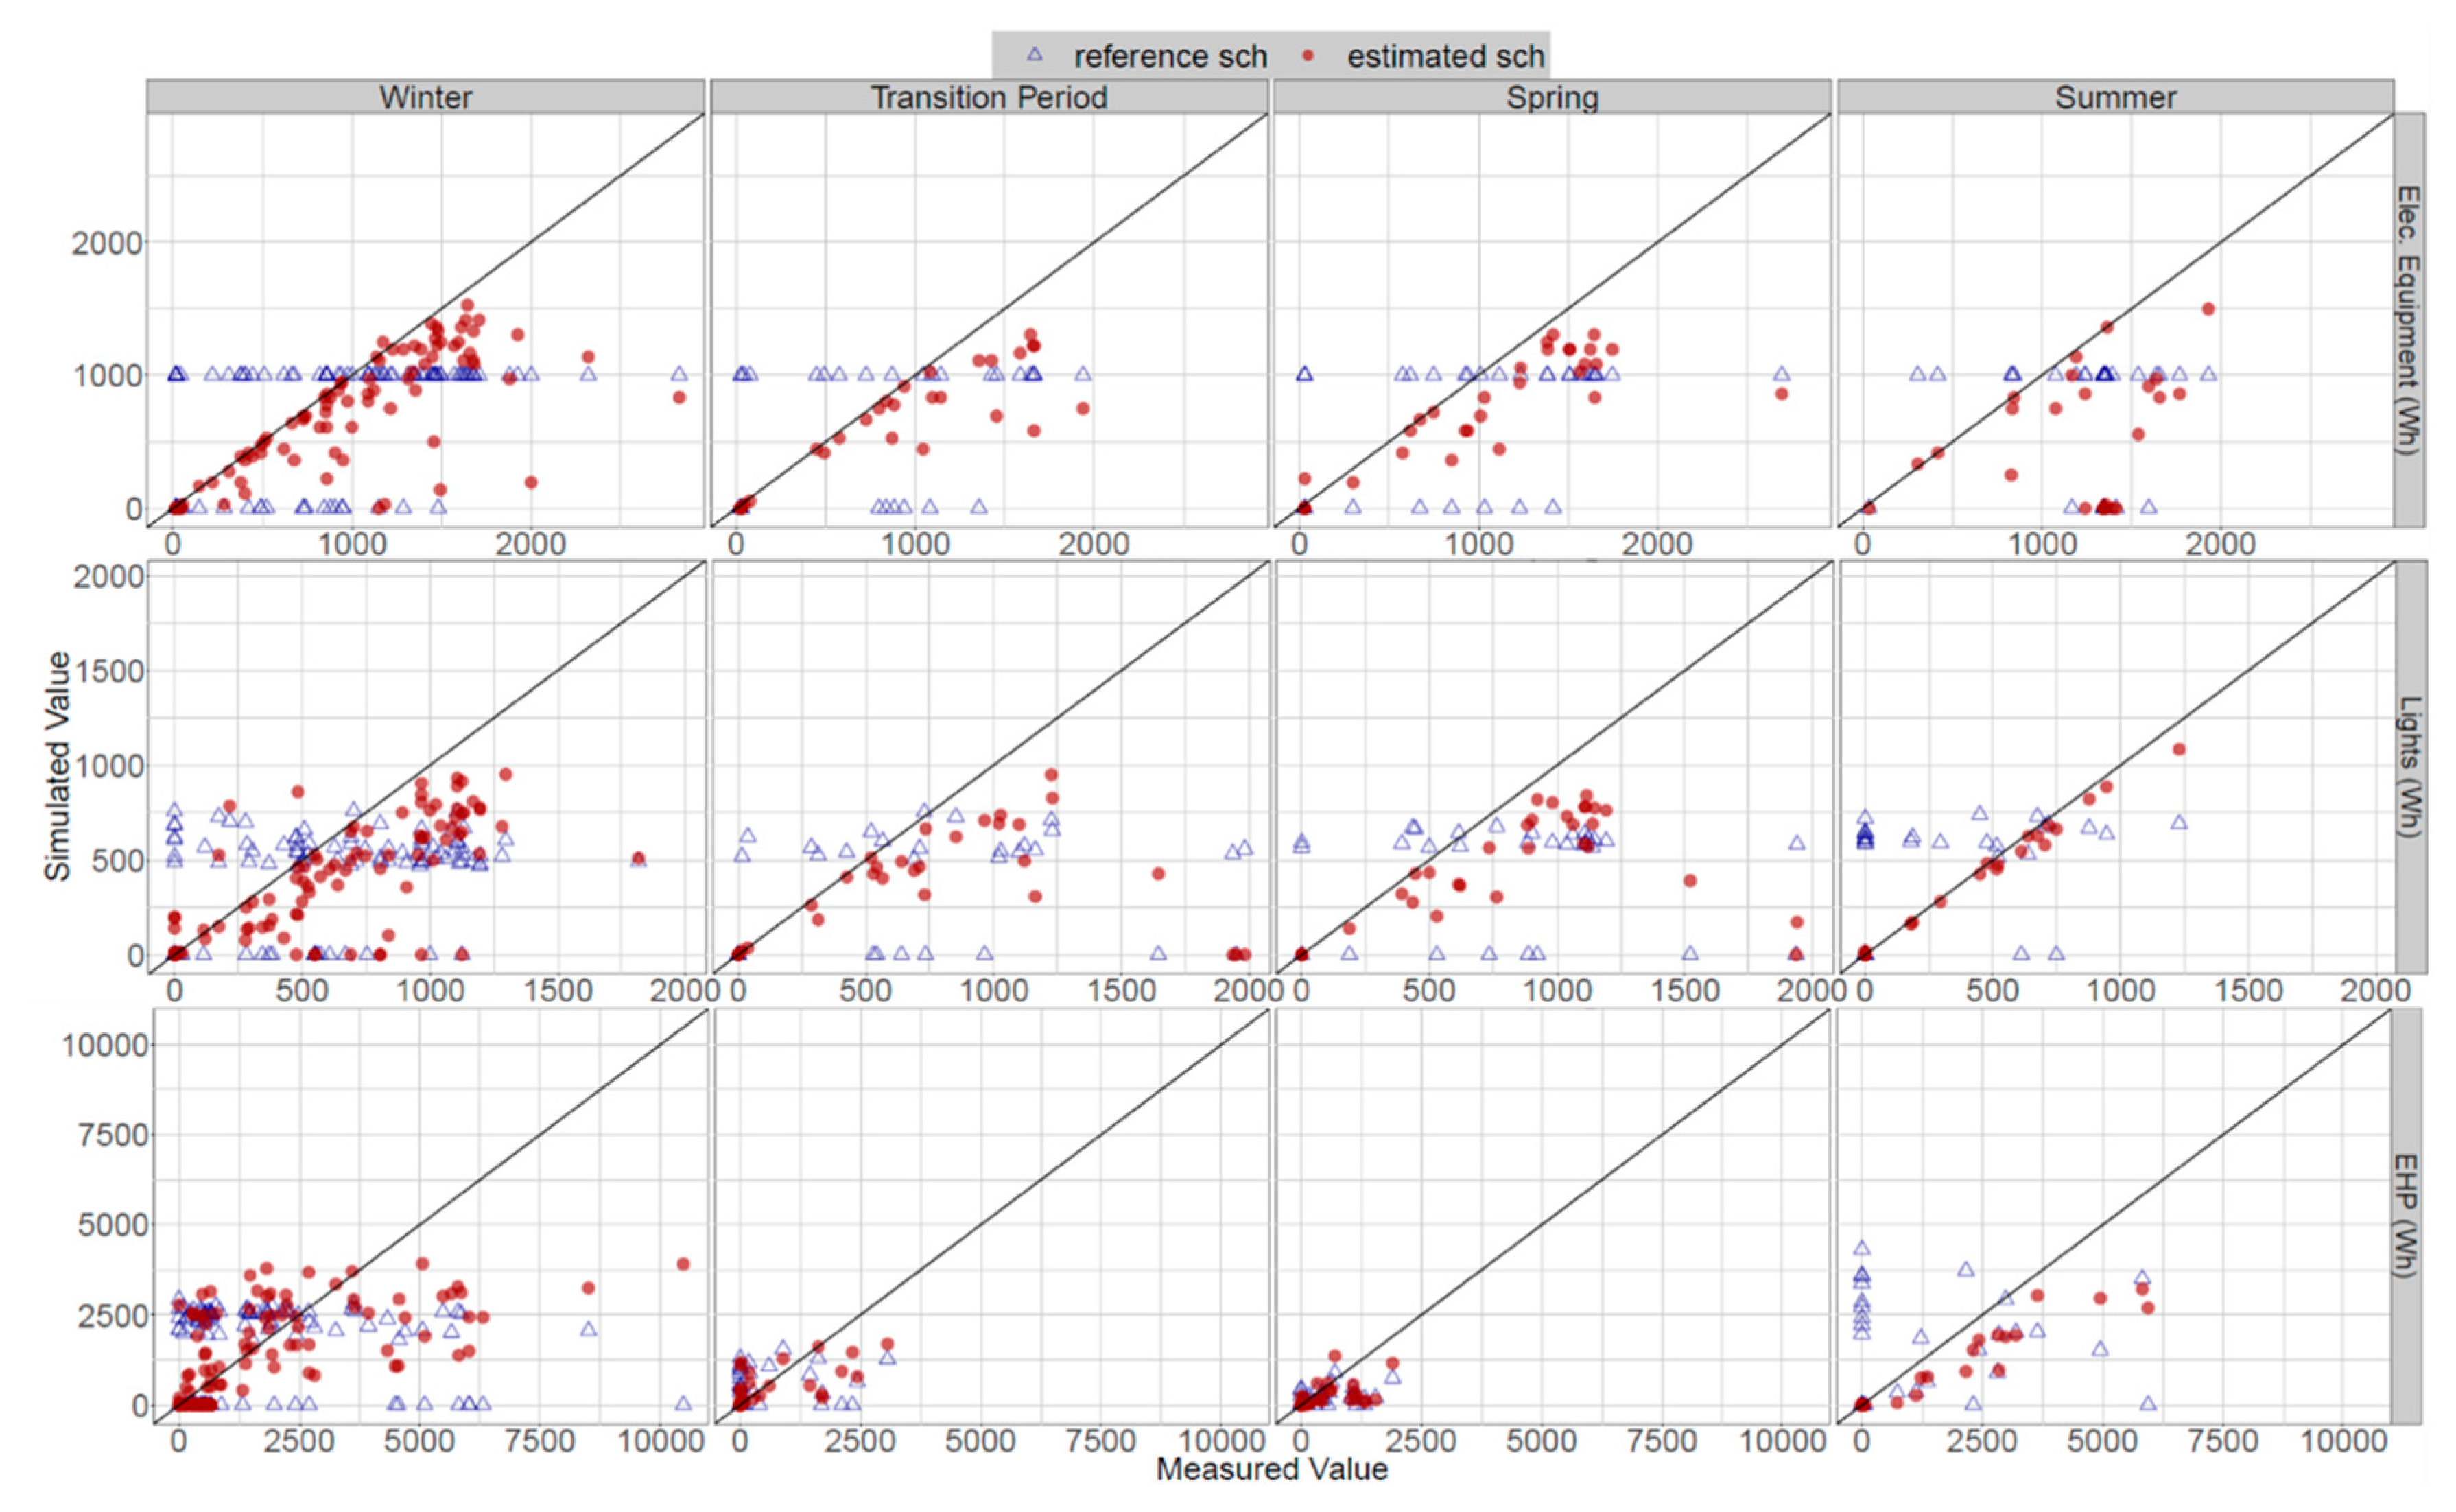
| System | Schedule | Winter | Transition Period | Spring | Summer | All Period | |||||
|---|---|---|---|---|---|---|---|---|---|---|---|
| RMSE | MBE | RMSE | MBE | RMSE | MBE | RMSE | MBE | RMSE | MBE | ||
| Elec. Equipment (kWh) | reference sch | 0.64 | −0.16 | 0.68 | −0.19 | 0.71 | −0.32 | 0.76 | −0.49 | 0.68 | −0.24 |
| estimated sch | 0.45 | −0.25 | 0.39 | −0.25 | 0.48 | −0.31 | 0.98 | −0.80 | 0.56 | −0.35 | |
| Lights (kWh) | reference sch | 0.45 | −0.19 | 0.73 | −0.41 | 0.68 | −0.40 | 0.42 | 0.15 | 0.54 | −0.20 |
| estimated sch | 0.36 | −0.22 | 0.71 | −0.41 | 0.58 | −0.37 | 0.05 | −0.03 | 0.45 | −0.24 | |
| EHP (kWh) | reference sch | 2.48 | −0.20 | 1.02 | −0.06 | 0.61 | −0.31 | 2.25 | 0.22 | 2.06 | −0.13 |
| estimated sch | 1.73 | −0.38 | 0.72 | −0.14 | 0.56 | −0.29 | 1.03 | −0.61 | 1.37 | −0.36 | |
© 2019 by the authors. Licensee MDPI, Basel, Switzerland. This article is an open access article distributed under the terms and conditions of the Creative Commons Attribution (CC BY) license (http://creativecommons.org/licenses/by/4.0/).
Share and Cite
Kim, S.; Song, Y.; Sung, Y.; Seo, D. Development of a Consecutive Occupancy Estimation Framework for Improving the Energy Demand Prediction Performance of Building Energy Modeling Tools. Energies 2019, 12, 433. https://doi.org/10.3390/en12030433
Kim S, Song Y, Sung Y, Seo D. Development of a Consecutive Occupancy Estimation Framework for Improving the Energy Demand Prediction Performance of Building Energy Modeling Tools. Energies. 2019; 12(3):433. https://doi.org/10.3390/en12030433
Chicago/Turabian StyleKim, Seokho, Yujin Song, Yoondong Sung, and Donghyun Seo. 2019. "Development of a Consecutive Occupancy Estimation Framework for Improving the Energy Demand Prediction Performance of Building Energy Modeling Tools" Energies 12, no. 3: 433. https://doi.org/10.3390/en12030433
APA StyleKim, S., Song, Y., Sung, Y., & Seo, D. (2019). Development of a Consecutive Occupancy Estimation Framework for Improving the Energy Demand Prediction Performance of Building Energy Modeling Tools. Energies, 12(3), 433. https://doi.org/10.3390/en12030433


