Article

Life Cycle Assessment of Large-scale Compressed Bio-natural Gas Production in China: A Case Study on Manure Co-digestion with Corn Stover

1
College of Agronomy and Biotechnology, China Agricultural University, Beijing 100193, China
2
Department of Agricultural and Biological Engineering, Purdue University, West Lafayette, IN 47907, USA
3
National Energy R&D Center for Biomass, China Agricultural University, Beijing 100193, China
*
Author to whom correspondence should be addressed.
Energies 2019, 12(3), 429; https://doi.org/10.3390/en12030429
Submission received: 17 November 2018 / Revised: 24 January 2019 / Accepted: 24 January 2019 / Published: 29 January 2019

Abstract

:
Compressed bio-natural gas (CBG) production from large-scale systems has been recognized as promising because of the abundance of manure and crop residue feedstocks and its environmental friendliness. This study is a life cycle assessment using the local database of an operating large-scale CBG system of manure co-digestion with corn stover in China and eBalance software. The results showed that the system’s Primary Energy Input to Output (PEIO) ratio was 20%. Its anaerobic digestion process was the main contributor to energy consumption, accounting for 76%. Among the six environmental impacts investigated in this study, the global warming potential (GWP) was the major environmental impact, and the digestate effluent management process was the main contributor to the GWP, accounting for 60%. The mitigation potential of the system, compared with reference case for GWP, was 3.19 kg CO2-eq for 1 m3 CBG production. In the future, the GWP mitigation could be 479 × 106 metric tons CO2-eq with 150 × 109 m3 yr−1 CBG production from the entire China. This study provides a reference on large-scale CBG production system for establishing a localized life cycle assessment inventory database in China.

1. Introduction

China has been one of the largest and the most successful countries in biogas production. According to the 13th Five-Year National Development Plan for Rural Biogas in China, biogas production reached 15.8 billion m3 in 2015, with 41.93 million household biogas digesters and 110,975 biogas systems [1]. However, many household biogas digesters have been abandoned and many others are operating at low efficiency because of the reduced supplies of manure feedstock for the digesters [1]. The reason for this is that traditional household animal production methods have been largely replaced by large-scale commercial animal production farms during the past three decades. A few years ago, the Chinese government changed its policy to support medium- and large-scale biogas systems, which have been defined as those that have biogas production capacities of >150 and >500 m3 d−1, respectively [2].
Biogas can be upgraded to bio-natural gas by removing most of the carbon dioxide (CO2) from the biogas and increasing its methane (CH4) concentration to 90% or greater. Production of bio-natural gas from large-scale biogas systems is economically feasible [3,4]. Bio-natural gas can be further processed into compressed bio-natural gas (CBG) for easy storage and transportation.
Manure co-digestion with crop residues has been recognized as an efficient biogas production technology. A lot of research on co-digestion has been done in some countries, especially in Europe. De Vries, et al. [5] in The Netherlands demonstrated that the biogas from manure co-digested with grass could reduce climate change by 89 kg CO2-eq t−1 of substrate, higher than the mono-digestion value of 16 kg CO2-eq t−1. Pehme, et al. [6] in Estonia found that co-digestion with natural grass could reduce global warming potential by 41% compared with manure mono-digestion. In Denmark, both Croxatto Vega et al. [7] and Hamelin, et al. [8] found that manure co-digested with straw could reduce global warming potential by 51 kg CO2-eq t−1 of slurry and 15 kg CO2-eq t−1 of fresh manure respectively, compared with mono-digestion. In Hungary, Fuchsz and Kohlheb [9] found that manure co-digested with crop residues was a better option in terms of energy efficiency, compared with the mono-digestion. These studies highlighted the substantial energy and environment benefits of anaerobic digestion of manure co-digested with crop residues in contrast to the mono-manure management practice.
Life cycle assessment (LCA) is an internationally accepted method to evaluate the energy and environment consequences of a product or system [10,11]. It can provide insights into a product or system in all stages of its life cycle. A few peer-reviewed publications have studied the LCA of household biogas digesters in China [12,13]. However, LCA of large-scale biogas system, especially the system with co-digestion of manure and crop residue, has not yet been found in the literature. Although national and regional policies have been made to support the development of large-scale biogas systems in China, effective measures are still pending. Therefore, it is important to make further policies to promote large-scale biogas production. Energy and environmental performance of a system is basic issues that should be investigated first using quantitative assessment models based on LCA.
Local data for LCAs are essential to evaluate technology developments in a country or region. In China, the LCA approach has been widely accepted and the local LCA software eBalance has been developed. eBalance is fully-featured LCA software that uses both Chinese and global quality databases. It has become the preferred choice for LCA of products manufactured in China and has been used by many researchers in recent years [14,15,16,17,18]. Hence, in the present study, eBalance was selected in a LCA of manure co-digested with corn stover for a large-scale CBG system.
The objectives of this work were to assess the energy efficiency and the environmental characterization categories of global warming potential (GWP), acidification potential (AP), eutrophication potential (EP), respiratory inorganics (RI), water use (WU) and abiotic depletion potential (ADP) for the different processes in the large-scale co-digestion system.

2. Methodology

2.1. Goal and Scope

The goal of this study is to provide research-based results for government policy making and LCA inventory database expansion in China, as well as for the development and optimization of large-scale CBG systems in China and other countries. The scope of this LCA is limited to the energy efficiency and environment consequences of dairy cattle and beef cattle manure with corn stover as co-digestion feedstock for producing bio-natural gas, which has a heating value of 37 MJ Nm−3 [19], in large-scale CBG systems, and the impact of the individual sub-processes on the synthetic environment.
The categories of emissions and resources in this paper were mainly based on a case study of a company in North China. The company was in a pasturing area and used a typical biogas production technology with manure and corn stover as co-substrate, which is representative of such biogas systems in China. Figure 1 shows a detailed system-boundary diagram to illustrate the proposed scope of CBG production. The system was divided into four processes, i.e., feedstock pre-treatment process, anaerobic digestion process, biogas upgrading for CBG process, and digester effluent treatment process. The functional unit was defined as 1 m3 CBG production.
Cattle raising and corn production were excluded from the system boundary because manure and corn stover were treated as wastes. In addition, the construction of facilities, the manufacture of machines and the setup of other basic infrastructure elements were excluded from the system [20,21].

2.2. Software and Database

The LCA software eBalance v4.7 and the Chinese Life cycle Database v0.8 were used to analyze the environmental impacts of biogas production. The database represents the general technologies in the Chinese market. It consists of more than 600 life cycle inventory datasets for key materials and chemicals, energy, transportation, and waste treatment.

2.3. Life Cycle Energy Analysis

The life cycle energy performance was based on the energy input and output. The energy input to the system included diesel consumption for feedstock transportation, electricity consumption for facility operation and heat consumption for mesophilic anaerobic digestion. The energy output included the low heating value of CBG and the energy saved by operating the bioenergy system, e.g., the energy savings from substituting chemical fertilizer production by digestate solid. The equivalent energy consumption for chemical fertilizer production was from the local database in eBalance. The energy efficiency was evaluated as Primary Energy Input to Output (PEIO) [22]. The PEIO is the percentage of total energy consumed per unit of energy output. Lower percentage represents higher energy efficiency of the system.

2.4. Life Cycle Environmental Inventory Analysis

Life cycle inventory analysis involved quantifying the input and output of mass (including emitted greenhouse gases) and energy for each process in the entire life cycle. The analysis was based on the functional unit and normalized input and output data [10]. However, direct CO2 emissions from the manure were not estimated because the CO2 photosynthesized by plants as feed was returned to the atmosphere as respired CO2; so the net CO2 emission was assumed to be zero. Direct CO2 emissions from the corn stover were also assumed to be zero [23].

2.4.1. Feedstock Pre-Treatment Process

Manure, including dung and urine, was collected from the farms of more than 25,000 dairy cattle and beef cattle of the company. It was transported in trucks to the anaerobic digesters over an average distance of 8 km according to the layout of the farms. The truck payload was 12 metric tons (t) with an average fuel economy of 27 L per 100 km. Considering a collection rate of 85%, the available quantity of manure, which had a total solid of 9.7%, from the farms was 1133 tons per day. The manure was transported to a reception tank for temporary storage before mixing with 15 t of shredded corn stover at a mixture rate of 1.32% in a mixing tank. The corn stover was transported in trucks over an average distance of 30 km to the anaerobic digesters.

2.4.2. Anaerobic Digestion Process

The mixture of manure and corn stover was pumped into six 6280-m3 completely mixed anaerobic digesters that were equipped with energy-efficient mixers. The mesophilic digesters operated at 35 °C and had a hydraulic retention time of 31 days. To maintain the digestion temperature, heat was provided from a biomass boiler that used cotton residues as fuel. Cotton residues are abundant locally and have a heating value of 16 MJ kg−1, which is greater than most of the other agricultural residues. To meet the heat demand of 158,523 MJ day−1 for the mixing tank and digesters, 13 t d−1 of cotton residues were transported over an average of 30 km to the site of anaerobic digestion process and then shredded and compressed for the boiler. Direct burning of cotton residues in the boiler emitted 1.61 and 16.06 kg d−1 of sulfur dioxide (SO2) and nitrogen oxides (NOx), respectively. In addition, loss of methane (CH4) from the digester was estimated 1% of the overall CH4 produced based on the latest anaerobic digestion technologies [5,8]. Biogas produced from the anaerobic digesters was 36,626 m3 d−1 and contained 60% of CH4.

2.4.3. Biogas Upgrading for CBG Process

In this process, the biogas first went through a wet scrubber to reduce hydrogen sulfide (H2S) concentrations to <200 ppm before being transported to a biogas storage. More H2S in the biogas from the storage was removed in an activated-carbon based equipment so the biogas could meet the requirement of water scrubbing technology to remove carbon dioxide (CO2) and enrich CH4 to 95% as bio-natural gas. Finally, the bio-natural gas was compressed to CBG. In this process, 23,133 m3 d−1 CBG was produced and the H2S was 0.1 kg d−1.

2.4.4. Digester Effluent Treatment Process

Digester effluent was treated in a solid-liquid separator to produce 129 t d−1 of solid and 973 t d−1 of liquid fertilizers. After separation, the solids were stored in a shed and the liquid was stored in lagoons before seasonal application to croplands. The solids and liquid contained 30% and 4% total solids, respectively. The CH4 emissions from solid and liquid storage were calculated with the following equation based on a method from IPCC [24]:
EFCH4 = VS × BO × MCF × 0.67
where EFCH4 is the CH4 emissions from digestate storage (i.e., solids and liquid) (kg); VS is the volatile solids of manure, an average of 80% of total solid (kg); BO is the maximum CH4 producing capacity of manure, and is assumed 0.13 m3 CH4 kg−1 VS based on Asian values in the IPCC [24]; MCF is the methane conversion factor and is 4% for solid storage and 43% for liquid storage [24]; 0.67 is a conversion factor for m3 CH4 to kilogram CH4 at standard temperature and pressure (20 °C and 101,325 Pa) (dimensionless). In addition, emissions of nitrous oxide (N2O) from the solid and liquid storage were about 25% of the CH4 emission in terms of CO2-eq [25].

2.5. Life Cycle Environmental Impacts Assessment

The life cycle environmental impact was assessed in two procedures: characterization and normalization. Characterization is a process that translates the consequence of inventory substances into environmental impacts. Characterization categories were calculated based on inventory substances multiplied by characterization factors, which reflected their relative contribution to the environmental impacts [26]. Characterization categories studied in this research included global warming potential (GWP), acidification potential (AP), eutrophication potential (EP), respiratory inorganics (RI), water use (WU) and abiotic depletion potential (ADP) (Table 1). To determine which categories produced the major environmental impact, a normalization analysis was done based on the value of characterization categories divided by the total emissions from the main environmental contributors or the total consumption of natural resources in 2010 in China. The normalization factors are shown in Table 1. After normalization, the values of characterization categories became dimensionless and allowed comparison of characterization categories.

2.6. Analysis of Emission Credits

Emission credits constitute a benefit of using cattle manure and corn stover to produce biogas. The credits resulted from replacing compressed conventional natural gas production by CBG and replacing chemical fertilizer by digester effluent, which was high-quality organic fertilizer [31]. The replaced nitrogen (N), phosphorus (P) and potassium (K) in digestate were assumed 100% of efficiency and were calculated based on Xu et al. [32].
The digestate could replace N at 3.41 t d−1, P at 1.54 t d−1 and K at 1.64 t d−1. Furthermore, the CBG production reduced environmental emissions from replacing compressed conventional natural gas production. The system boundary for compressed conventional natural gas production was from cradle mining, pipeline transportation and natural gas production process to the compressed natural gas production process. It was assumed that the produced CBG could replace the same amount (23,133 m3) of compressed conventional natural gas because bio-natural gas and natural gas have the same heating value. The reference case was the traditional management of manure and corn stover, including manure storage in lagoons without any treatment and corn stover burning in the field. The environmental emissions from reference case are shown in Table 2.

2.7. Sensitivity Analysis

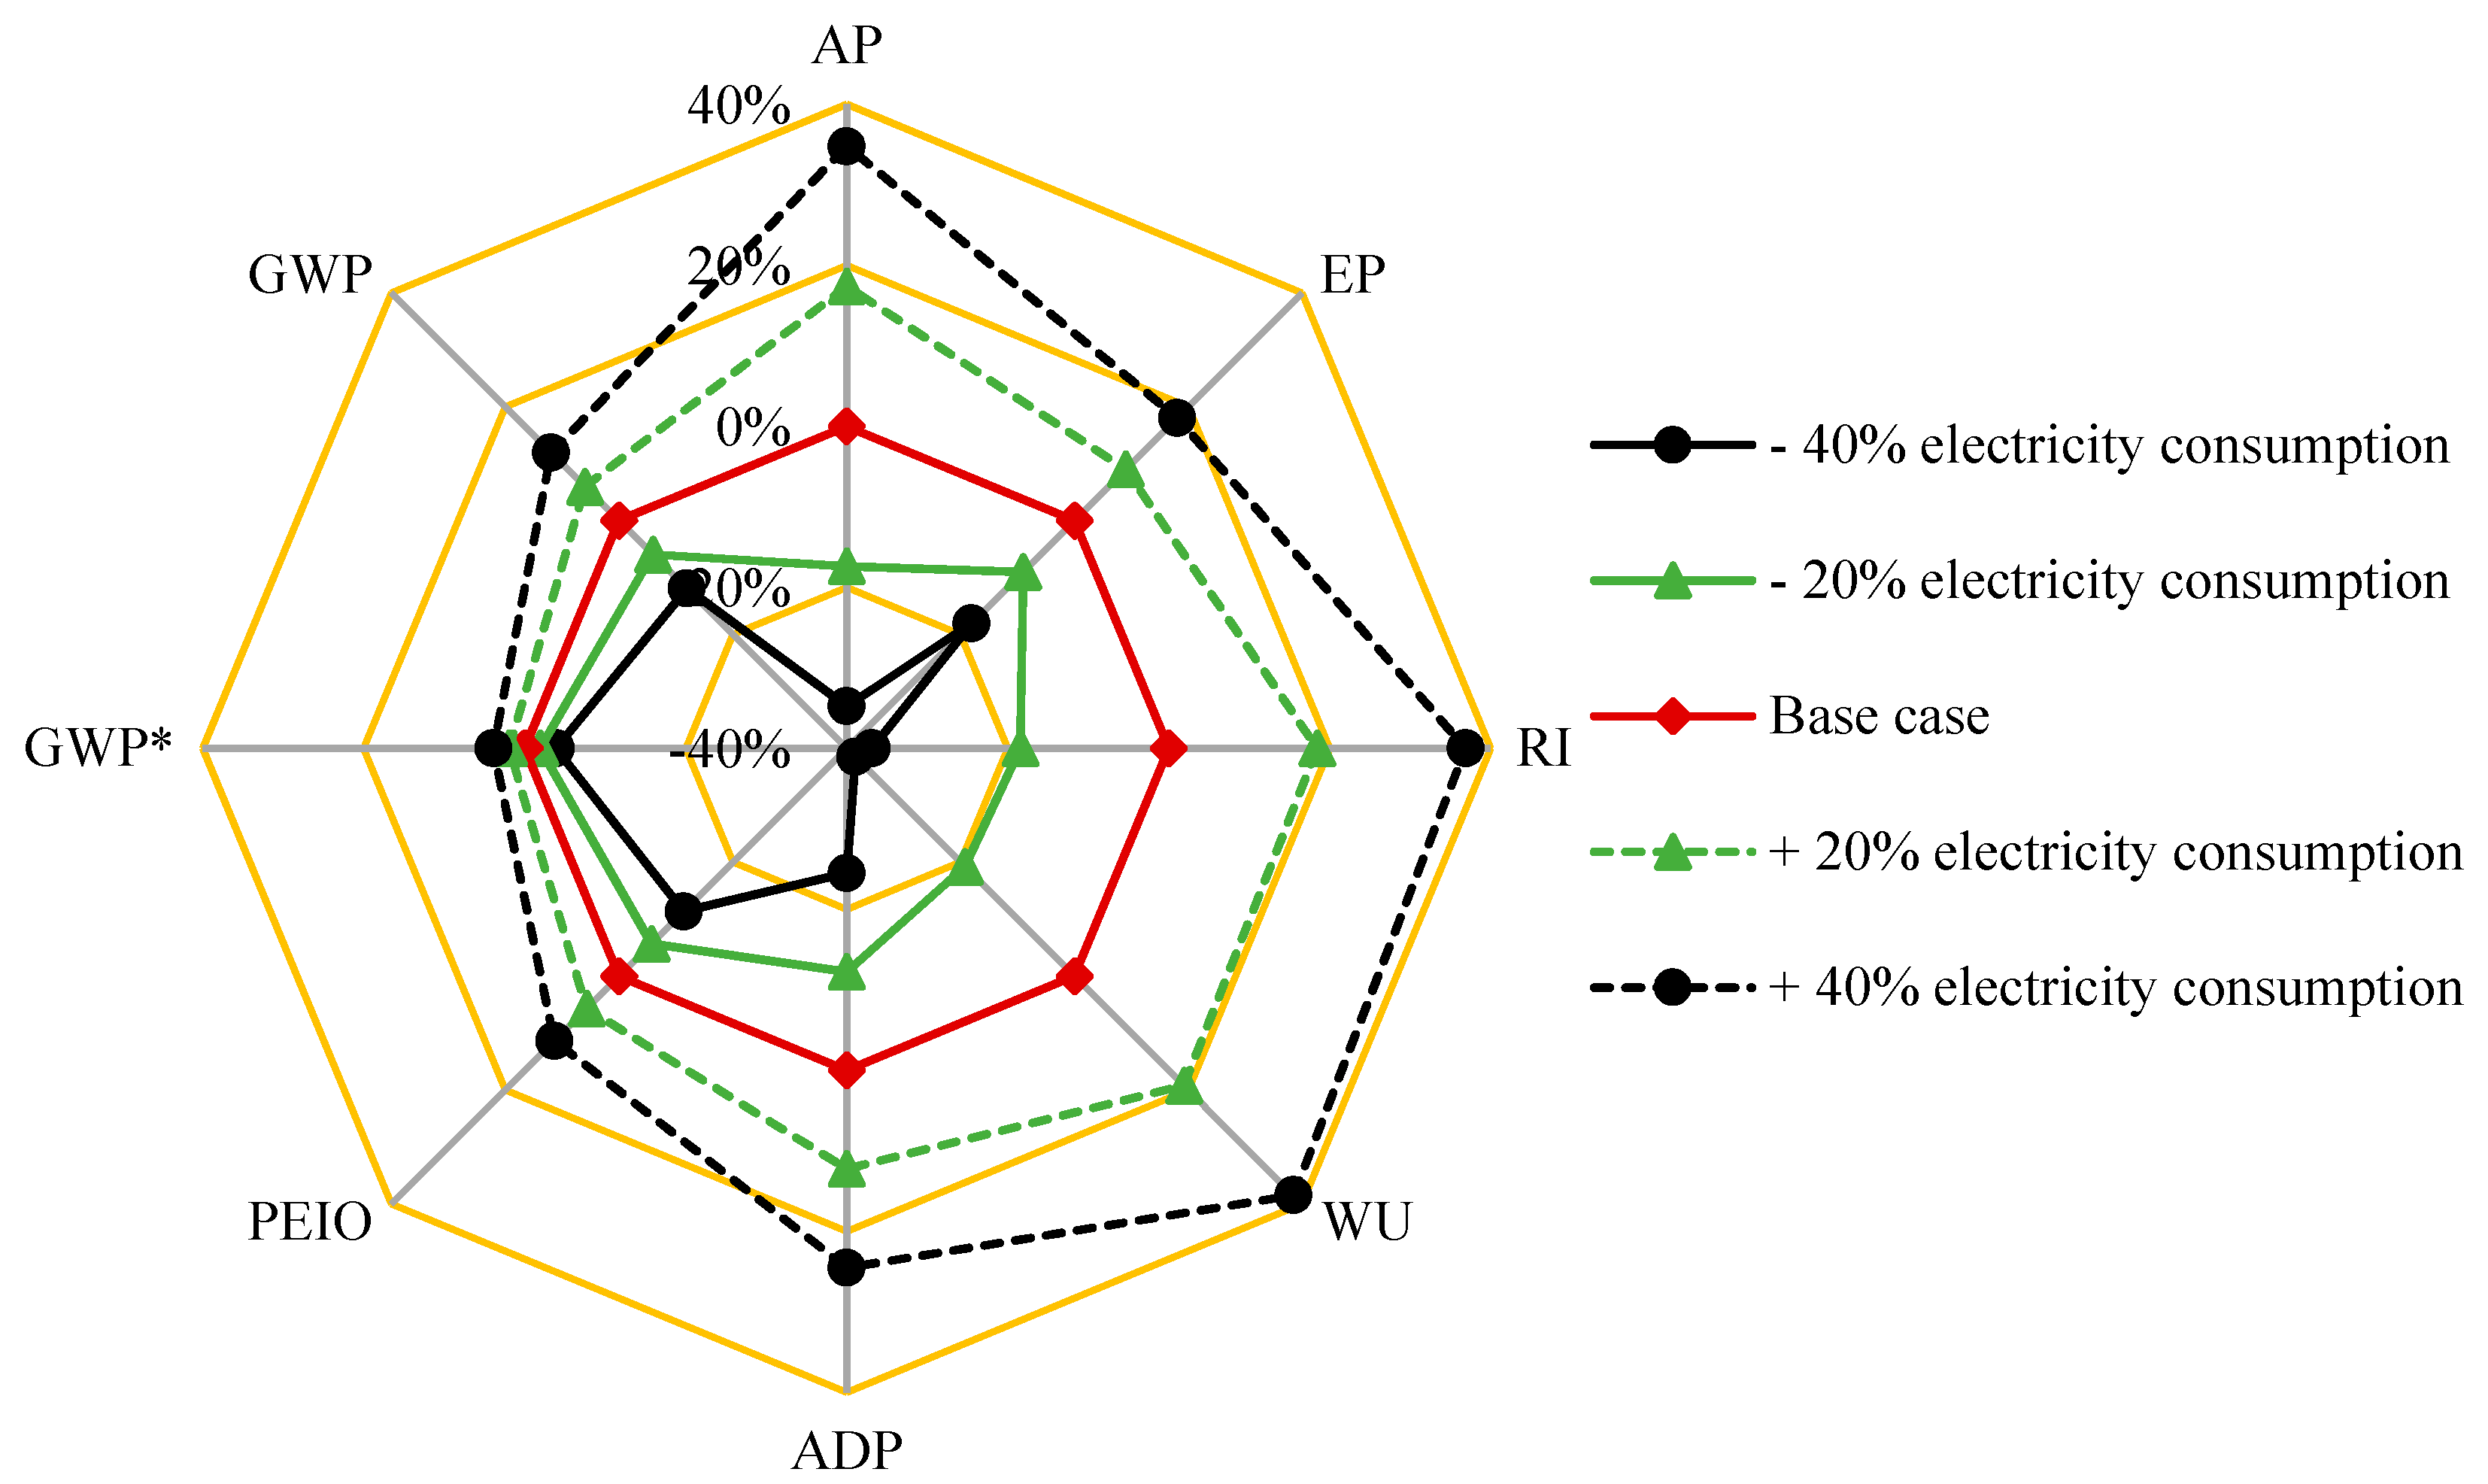
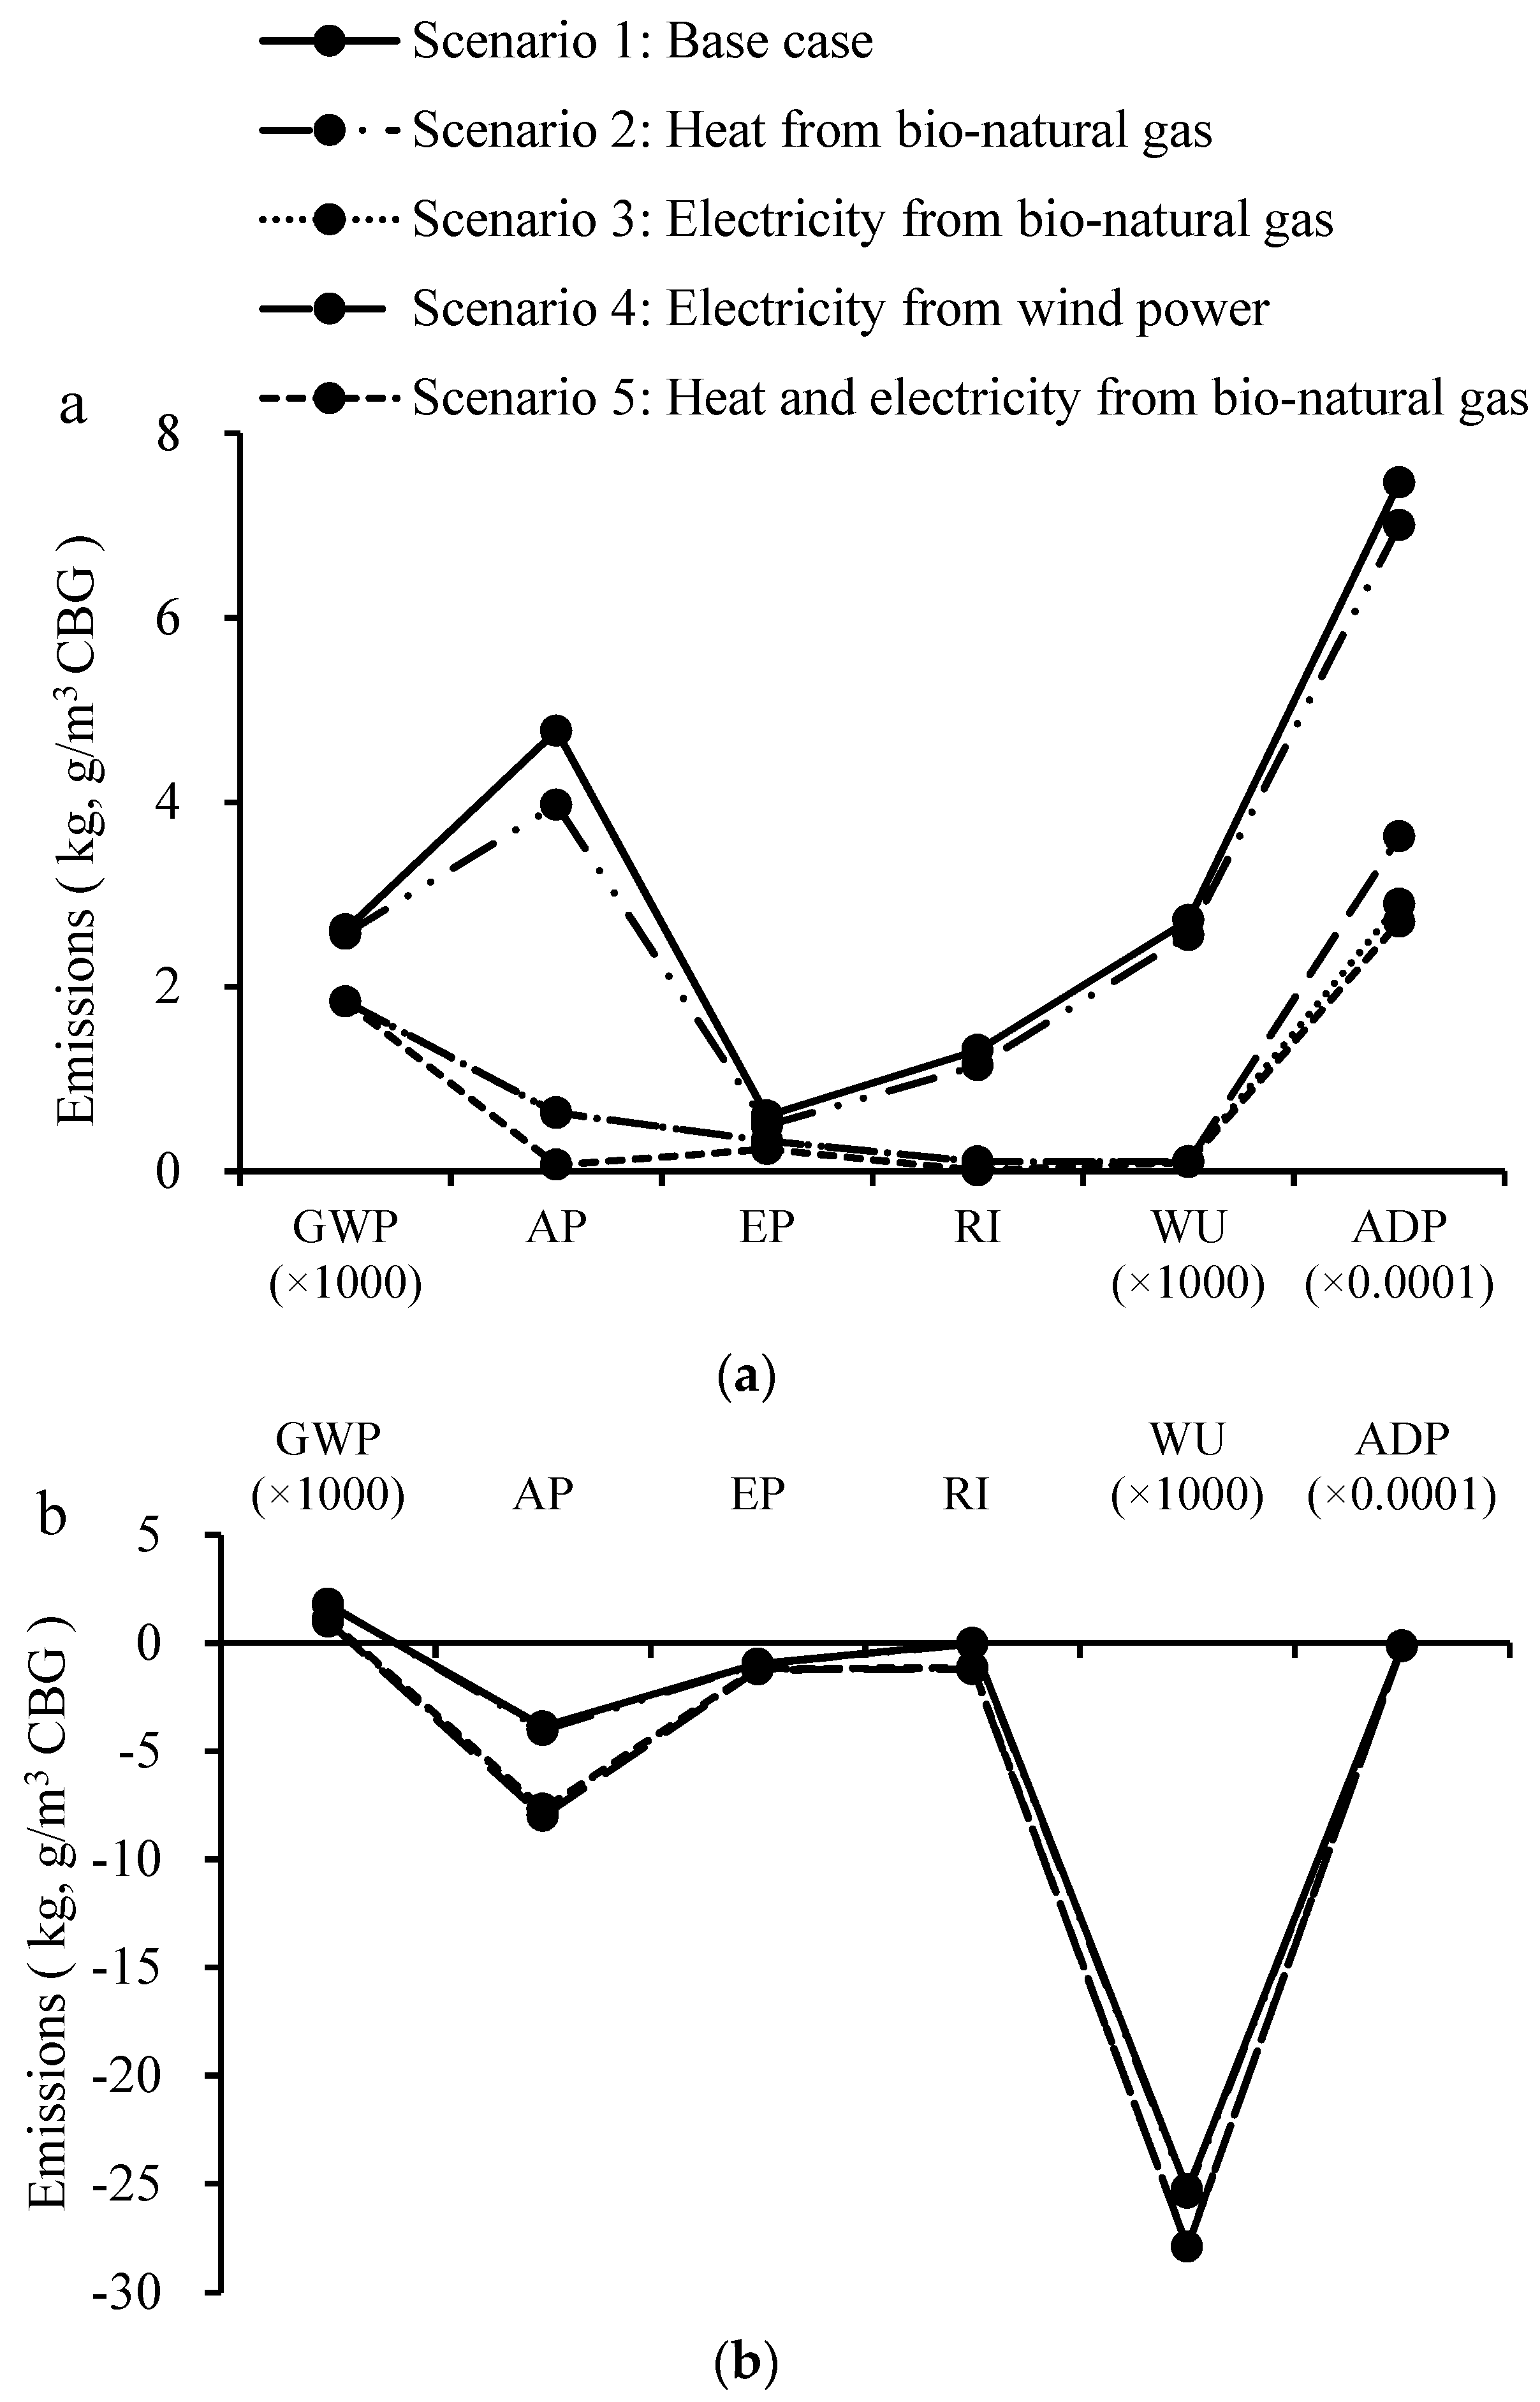
The main energy consumption during CBG production was electricity generated from coal-fired power plants, which emitted a large amount of gaseous pollutants. Direct CH4 emissions from digester leakages was also a relevant source of GWP [25]. Hence, electricity consumption and CH4 emission during anaerobic digestion were used in the sensitivity analysis as key input parameters, which were designed to change by −40%, −20%, 20%, and 40%, to calculate the energy and environmental impact as a function of the rate of change and sensitivity. Sensitivity analysis was also conducted with five assumed scenarios: Scenario 1 was based on the results in this study, which served as the base case; Scenario 2 was assumed that all heat was produced by using the CBG instead of from the cotton residues; Scenario 3 was assumed that all electricity was generated by using the CBG instead of from coal-based power plants; Scenario 4 was assumed that all electricity was from wind powers; and Scenario 5 was assumed that all heat and electricity were provided from the CBG.

3. Results

3.1. Assessment of Energy Efficiency

The energy input and output of the large-scale CBG production is shown in Table 3. Of the total energy input, the energy input to the anaerobic digestion process (75.97%) was the largest, followed by the biogas upgrading for CBG process (17.26%).
Most energy consumption in the anaerobic digestion process was attributed to heating that was 64.59% of the system’s total energy input to keep the digesters operating at mesophilic conditions (35 °C) in all seasons. The electricity consumption of the system was 19,389 kWh d−1, about 28% of the total energy input. Electricity consumption in biogas upgrading process accounted for 15% of total energy input to the system. Diesel consumption was about 7% of total energy input, mainly for feedstock transportation.
Of the total energy output of the system, the CBG production accounted for 69% and the energy saving accounted for 31%. The total energy input of the system was 245,413 MJ d−1 or 11 MJ for 1 m3 CBG production. However, the equivalent energy produced from the system was 1,243,467 MJ d−1. Consequently, the system’s PEIO was 20%. Given the energy input to the different processes of the system, reducing energy consumption in the anaerobic digestion process deserves more attention.

3.2. Assessment of Environmental Impact

The decomposed total life cycle environmental impacts in CBG production based on the functional unit are presented in Table 4. In this study, the GWP was 2.62 kg CO2 for 1 m3 CBG production. It originated mainly from the digester effluent treatment process, which attained 60% of the GWP (1.58 kg CO2 for 1 m3 CBG) because digester slurry storage was among the major sources of CH4 emissions. Anaerobic digestion process held the second position and reached 21% of the GWP (0.55 kg CO2 for 1 m3 CBG).
The EP primarily covers N and P that may result in adverse fluctuation of species composition and biomass production. In this system, it was 0.60 g PO43− for 1 m3 CBG, mainly because NOx emissions from cotton residues burning in the boiler (18%) and N2O emissions from the solid and liquid storage (38%).
The biogas upgrading for CBG process had the highest environmental impact in the AP, RI, WU and ADP, about 53% (2.53 g SO2-eq), 56% (0.74 g PM2.5-eq), 58% (1.59 kg) and 37% (2.78 × 10⁻⁴ g Sb-eq) of the corresponding total emissions from the system, respectively. Emissions from the biogas upgrading for CBG process came from a large electricity consumption. In China, electricity is generated mostly in coal-fired power plants, which emit significant quantities of GHG and gaseous pollutants, such as SO2, PM2.5, and PM10.
Based on the total environmental potential, the categories GWP, AP, EP, RI, WU and ADP for 1 m3 CBG production after normalization were 2.49 × 10⁻¹³, 1.31 × 10⁻¹³, 1.60 × 10⁻¹³, 0.70 × 10⁻¹³, 4.49 × 10⁻¹⁵, and 0.99 × 10⁻¹³. This indicated that the GWP was the major environment impact, followed by the EP and AP, whereas the WU had the smallest environment impact.

3.3. Emission Credits and Mitigation Potential

The environmental impacts from the reference case and the large-scale CBG production system using manure co-digestion with corn stover are presented in Figure 2. As the net emissions based on emission credits were also analyzed, the negative values in Figure 2 represent environmental benefits, whereas the positive values represent adverse environmental impacts.
The results show that emission credits for all categories, except for the GWP, were greater than the total emission, which translated into a beneficial environmental performance. The net GWP was about 1.76 kg CO2-eq for 1 m3 CBG production, or about 48 g CO2-eq for 1 MJ CBG production.
Using digester slurry as organic fertilizer, instead of using chemical fertilizer, affected the AP, EP, RI and WU, for about 60%, 58%, 58% and 100%, respectively, of the total emission credits. This indicated that many of the major air pollutions went into the environment during chemical N, P and K fertilizer production. This system provided significant environmental benefits in GWP (54%) and ADP (68%) by replacing compressed conventional bio-natural gas production.
When considering emission credits, this study indicated that manure co-digestion with corn stover for biogas production had superior environmental performances for all the environmental impacts comparing with the reference case, mainly because of the potential of energy and fertilizer savings. Without considering emission credits, the GWP, EP and RI were also lower than the reference case. However, the AP for biogas production was a little higher than the reference case.
As for the environmental mitigation potential, compared with the reference case, the emission credits should be considered because the CBG and digestate decreased or replaced the compressed conventional natural gas and chemical fertilizers utilization, respectively. Hence, the mitigation potential of large-scale CBG system for GWP, AP, EP, RI, WU, and ADP were 3.19 kg CO2-eq, 5.86 g SO2-eq, 19.98 g PO43−-eq, 7.84 g PM2.5-eq, 25.27 kg and 1.62 × 10⁻⁴ g Sb-eq for 1 m3 CBG production, respectively.

3.4. Sensitivity Analysis

The electricity consumption exhibited higher sensitivities on the WU, RI, AP and ADP compared with the GWP and EP (Figure 3). The WU changed by 38% when electricity consumption decreased or increased by 40%. However, changes in electricity consumption had the lowest impact on the GWP. Compared with other categories, the GWP changed only by 12% when the electricity consumption changed by 40%. The effect of CH4 emission from anaerobic digestion on the GWP was similar to that of electricity consumption: the GWP changed only by 4% when the CH4 emission changed by 40%. As for the PEIO, it could change 11% when the electricity consumption changed by 40%.
Figure 4a,b show the environmental performance of biogas production under different scenarios without and with emission credits considered, respectively. Without emission credits, Scenario 5 (all the electricity and heat from the produced CBG) outperformed the other scenarios on environmental performance (Figure 4a), while its PEIO was highest (24%). With emission credits, it would decrease the compressed conventional natural gas displacement and emission credits if part of CBG was used for electricity and heat. It was found that the environmental performance of Scenario 4 (all the electricity from wind power) was best (Figure 4b).
From the perspectives of all the energy and environmental impacts, Scenario 1 did not have the best environmental performance, but it had the best PEIO (20%). The environmental performance was best if the consumed heat and electricity were from wind power (Scenario 4) or biogas (Scenario 5).

4. Discussion

4.1. Energy Efficiency of Large-Scale CBG System

According to the results of this study, the large-scale CBG system exhibited a good PEIO of 20%. This is in agreement with the finding by Berglund and Börjesson [36], who exhibited the PEIO between 20–40% in large-scale biogas systems with different raw materials. However, Pöschl, et al. [22] reported a worse PEIO (input/output ratio 44.6%) than this study, probably due to its higher proportion of corn and grass silage, which required more energy input in feedstock pre-treatment. Additionally, Pöschl, et al. [22] calculated energy input from feedstock production but did not consider energy savings from chemical fertilizer production. Hence, large-scale CBG systems to produce transportation fuel has been an attractive pathway with good PEIO in China, even better than in Europe [22,36].
The energy input to the anaerobic digestion process was the highest compared with the other three processes in this study. This was similar with the research conducted by Pöschl, et al. [22] and Berglund and Börjesson [36]. These two studies indicated that anaerobic digestion was the most energy-demanding process, corresponding to 40-80% of the total energy input into the system. The PEIO could be improved not only through reducing energy consumption, but also through using co-digestion substrates of high biogas yields (e.g., food waste, corn silage) [37], and encompassing the complete recycling of digestate (e.g., recovering heat from the liquid and recovering biogas from digestate storage) [22].

4.2. Environmental Performance of Large-Scale CBG System

By breaking down the total life cycle environmental impact in CBG production, it was shown that environmental impacts varied among different processes. The GWP originated mainly from the digester effluent treatment process. This result was consistent with that of Aguirre-Villegas and Larson [38], who reported that CH4 from manure storage counted for 70% of total emissions. The authors claimed that further digestate process (i.e., incorporated nutrient recovery systems in digestate treatment) could mitigate CH4 emissions through minimizing volatile solid accumulation in liquid storage. Hamelin et al. [39] indicated that separating solid from slurry for biogas production could also be an efficient method to improve the environment benefit in large-scale CBG systems.
In this study, the net emissions of GWP, which were calculated from the total emissions of GWP minus the emission credits, were 1.76 kg CO2-eq for 1 m3 CBG production, or about 48 g CO2-eq for 1 MJ CBG production. They were higher than the -39 g CO2-eq for 1 MJ obtained by Han et al. [40]. The reason was that Han et al. [40] did not include CH4 and N2O emissions during digestate storage, which were almost 60% of the total emissions based on this study.
According to this study and without emission credits, the GWP, EP and RI from biogas production were lower than the reference case because untreated manure and burning crop straw in open fields could emit large quantities of CH4 and PM2.5 to the air, and phosphorus and nitrogen to the water system [39,41]. However, the AP from biogas production was higher than from the reference case because of higher NH3 emissions from digestate storage compared with the direct manure storage in lagoons [5,42]. Emission credit studies also exhibited that fertilizer production was a high air pollution industry. This was in agreement with Hodge [43], who also found that chemical fertilizer production could result in the most serious air pollution, especially with sulfur oxides.
The sensitivity analysis revealed that electricity consumption exhibited the lowest impact on the GWP in anaerobic digestion for biogas in this study. This result was similar to the finding obtained by Liebetrau et al. [25]. However, electricity consumption exhibited the highest impact on the WU. Scenario analysis indicated that it was difficult to assess the energy efficiencies and environmental effects among different scenarios. In this way, the system could be a prudent choice to balance the energy and environmental performance.

4.3. Development of Large-Scale CBG Systems in China

This case study exhibited a good PEIO and environmental performance of the large-scale CBG system with manure and corn stover co-digestion in China. China is experiencing an increasing fossil fuel consumption. For example, the natural gas consumption increased at a rate of 10.04% between 2012 and 2017 [44] and its rate of dependence on importation was 39% in 2017 [45]. However, China is rich in animal manure and crop residue that are available for biogas production. In China, there were an average annual bio-natural gas production potential of 150 × 109 m3 yr−1, thus a GWP mitigation potential of 479 × 106 t CO2-eq yr−1 could be achieved based on this study. Therefore, large-scale CBG production with co-digestion of manure and corn stover should be encouraged in North China, although further LCA of the manure and corn stover co-digestion are needed for different regions and feedstock.

5. Conclusions

The large-scale CBG production had a PEIO ratio of 20%. The system had environmental benefits compared with the reference case. Among the six environmental impacts, the GWP was the major one. The energy input, and GWP mitigation potential of the system, compared with the reference case, were 11 MJ and 3.19 kg CO2-eq for 1 m3 CBG production, respectively. Further improvements could be obtained through reducing energy consumption and using energy from bioenergy systems. This research established a localized life cycle assessment inventory database and provided theoretical basis for the development of a low-energy-consumption and environmentally friendly large-scale bio-natural gas systems in China.

Author Contributions

Y.Y. conceived the theme; W.Z. conducted the investigation process for data collection; Y.Y. analyzed the data and wrote the original draft; J.-Q.N., W.Z. and G.X. provided theoretical and technical guidance; W.Z., J.-Q.N. and G.X. reviewed and edited the entire paper.

Funding

This study is supported by the China Clean Development Mechanism Fund (No. 2014083) and a scholarship of the China Scholarship Council, China.

Conflicts of Interest

The authors declare no conflict of interest.

Nomenclature and Abbreviations

ADPAbiotic depletion potential
APAcidification potential
CBGCompressed Bio-natural Gas
CH4Methane
COCarbon monoxide
CO2Carbon dioxide
CODChemical oxygen demand
EPEutrophication potential
H2SHydrogen sulfide
IPCCIntergovernmental panel on climate change
KPotassium
LCALife cycle assessment
MCFMethane conversion factor
NNitrogen
NH3Ammonia
NOxNitrogen oxides
N2ONitrous oxide
PPhosphorus
PEIOPrimary Energy Input to Output
PM2.5Particulate matter 2.5
PM10Particulate matter 10
RIRespiratory inorganics
SbAntimony
SO2Sulfur dioxide
VOCVolatile organic compounds
VSVolatile solid
WUWater use

References

  1. National Development and Reform Commission, Ministry of Agriculture and Rural Affairs of the People’s Republic of China (NDRC). The 13th Five-Year National Plan for Rural Biogas Development. 2017. Available online: http://www.gov.cn/xinwen/2017-02/10/5167076/files/797001c427eb47b680c0cd77daad 4327. pdf (accessed on 25 January 2017).
  2. Ministry of Agriculture and Rural Affairs of the People’s Republic of China (MARAC). Classification of Scale for Biogas Engineering. 2011. Available online: http://www.jsagri.gov.cn/attachement/5980.doc (accessed on 2 September 2011).
  3. Xu, C.; Zongjun, C.; Wanbin, Z. The upcoming bio-natural gas in China: A strategic emerging industry. Nat. Gas Ind. 2013, 33, 141–148. [Google Scholar]
  4. Budzianowski, W.M.; Wylock, C.E.; Marciniak, P.A. Power requirements of biogas upgrading by water scrubbing and biomethane compression: Comparative analysis of various plant configurations. Energy Convers. Manag. 2017, 141, 2–19. [Google Scholar] [CrossRef]
  5. De Vries, J.W.; Vinken, T.M.; Hamelin, L.; De Boer, I.J. Comparing environmental consequences of anaerobic mono- and co-digestion of pig manure to produce bio-energy—A life cycle perspective. Bioresour. Technol. 2012, 125, 239–248. [Google Scholar] [CrossRef] [PubMed]
  6. Pehme, S.; Veromann, E.; Hamelin, L. Environmental performance of manure co-digestion with natural and cultivated grass: A consequential life cycle assessment. J. Clean. Prod. 2017, 162, 1135–1143. [Google Scholar] [CrossRef]
  7. Croxatto Vega, G.C.; ten Hoeve, M.; Birkved, M.; Sommer, S.G.; Bruun, S. Choosing co-substrates to supplement biogas production from animal slurry—A life cycle assessment of the environmental consequences. Bioresour. Technol. 2014, 171, 410–420. [Google Scholar] [CrossRef]
  8. Hamelin, L.; Naroznova, I.; Wenzel, H. Environmental consequences of different carbon alternatives for increased manure-based biogas. Appl. Energy 2014, 114, 774–782. [Google Scholar] [CrossRef]
  9. Fuchsz, M.; Kohlheb, N. Comparison of the environmental effects of manure- and crop-based agricultural biogas plants using life cycle analysis. J. Clean. Prod. 2015, 86, 60–66. [Google Scholar] [CrossRef]
  10. ISO. Environmental Management—Life Cycle Assessment—Principles and Framework. 2006. Available online: https://www.iso.org/standard/37456.html (accessed on 1 July 2006).
  11. ISO. Environmental Management—Life Cycle Assessment—Requirements and Guidelines. 2006. Available online: https://www.iso.org/standard/38498.html (accessed on 1 July 2017).
  12. Chen, S.; Chen, B.; Song, D. Life-cycle energy production and emissions mitigation by comprehensive biogas-digestate utilization. Bioresour. Technol. 2012, 114, 357–364. [Google Scholar] [CrossRef]
  13. Hou, J.; Zhang, W.F.; Wang, P.; Dou, Z.X.; Gao, L.W.; Styles, D. Greenhouse Gas Mitigation of Rural Household Biogas Systems in China: A Life Cycle Assessment. Energies 2017, 10, 239. [Google Scholar] [CrossRef]
  14. Ren, C.; Wang, W.; Mao, Y.; Yuan, X.; Song, Z.; Sun, J.; Zhao, X. Comparative life cycle assessment of sulfoaluminate clinker production derived from industrial solid wastes and conventional raw materials. J. Clean. Prod. 2017, 167, 1314–1324. [Google Scholar] [CrossRef]
  15. Tian, X.; Wu, Y.; Hou, P.; Liang, S.; Qu, S.; Xu, M.; Zuo, T. Environmental impact and economic assessment of secondary lead production: Comparison of main spent lead-acid battery recycling processes in China. J. Clean. Prod. 2017, 144, 142–148. [Google Scholar] [CrossRef]
  16. Yu, Z.; Ma, W.; Xie, K.; Lv, G.; Chen, Z.; Wu, J.; Yu, J. Life cycle assessment of grid-connected power generation from metallurgical route multi-crystalline silicon photovoltaic system in China. Appl. Energy 2017, 185, 68–81. [Google Scholar] [CrossRef]
  17. Wang, J.; Wang, R.; Zhu, Y.; Li, J. Life cycle assessment and environmental cost accounting of coal-fired power generation in China. Energy Policy 2018, 115, 374–384. [Google Scholar] [CrossRef]
  18. Yang, X.; Hu, M.; Wu, J.; Zhao, B. Building-information-modeling enabled life cycle assessment, a case study on carbon footprint accounting for a residential building in China. J. Clean. Prod. 2018, 183, 729–743. [Google Scholar] [CrossRef]
  19. Wang, M.; Elgowainy, A.; Han, J.; Benavides, P.T.; Burnham, A.; Cai, H.; Canter, C.; Chen, R.; Dai, Q.; Kelly, J.; et al. Summary of Expansions, Updates, and Results in GREET 2017 Suite of Models. 2017. Available online: https://www.osti.gov/biblio/1414291 (accessed on 1 November 2017).[Green Version]
  20. Jin, Y.Y.; Chen, T.; Chen, X.; Yu, Z.X. Life-cycle assessment of energy consumption and environmental impact of an integrated food waste-based biogas plant. Appl. Energy 2015, 151, 227–236. [Google Scholar] [CrossRef]
  21. Wang, Q.-L.; Li, W.; Gao, X.; Li, S.-J. Life cycle assessment on biogas production from straw and its sensitivity analysis. Bioresour. Technol. 2016, 201, 208–214. [Google Scholar] [CrossRef] [PubMed]
  22. Pöschl, M.; Ward, S.; Owende, P. Evaluation of energy efficiency of various biogas production and utilization pathways. Appl. Energy 2010, 87, 3305–3321. [Google Scholar] [CrossRef]
  23. Thelen, K. Corn Fields Help Clean Up and Protect the Environment. 2007. Available online: https://www.canr.msu.edu/news/corn_fields_help_clean_up_and_protect_the_environment (accessed on 7 June 2007).
  24. IPCC. Chapter 10: Emissions from Livestock and Manure Management. In IPCC Guidelines for National Greenhouse Gas Inventories, Prepared by the National Greenhouse Gas Inventories Programme; Cambridge University Press: Cambridge, UK, 2006; pp. 10.1–10.87. [Google Scholar]
  25. Liebetrau, J.; Reinelt, T.; Agostini, A.; Linke, B. Methane Emissions from Biogas Plants; IEA Bioenergy: Golden, CO, USA, 2017; ISBN 978-1-910154-35-9. [Google Scholar]
  26. Golsteijn, L. Characterisation: New Developments for Toxicity. 2014. Available online: https://www.pre-sustainability.com/news/characterisation-new-developments-for-toxicity (accessed on 7 July2014).
  27. Forster, P.; Ramaswamy, V.; Artaxo, P.; Berntsen, T.; Betts, R.; Fahey, D.W.; Haywood, J.; Lean, J.; Lowe, D.C.; Myhre, G.; et al. Climate Change 2007: The Physical Science Basis—Contribution of Working Group I to the Fourth Assessment Report of the Intergovernmental Panel on Climate Change; Cambridge University Press: Cambridge, UK; New York, NY, USA, 2007; pp. 129–234. [Google Scholar]
  28. Guinée, J.B.; Gorrée, M.; Heijungs, R.; Huppes, G.; Kleijn, R.; Koning, A.D.; Oers, L.V.; Wegener Sleeswijk, A.; Suh, S.; Udo de Haes, H.A.; et al. Handbook on Life Cycle Assessment. Operational Guide to the ISO standards. I: LCA in Perspective; Guinée, J., Ed.; Kluwer Academic: Dordrecht, The Netherlands, 2002; p. 692. [Google Scholar]
  29. Jolliet, O.; Margni, M.; Charles, R.; Humbert, S.; Payet, J.; Rebitzer, G.; Rosenbaum, R. IMPACT 2002+: A new life cycle impact assessment methodology. Int. J. Life Cycle Assess. 2003, 8, 324. [Google Scholar] [CrossRef]
  30. IKE Environmental Technology Co., Ltd. eBalance 4.7. 2018. Available online: www.ike-global.com (accessed on 15 May 2014).
  31. Yi, R.; Zhang, W.; Zhou, J.; Li, W.; Wu, S.; Dong, R. Environmental impact analysis on the production and utilization of digestate based on LCA method. Renew. Energy Resour. 2015, 33, 301–307. [Google Scholar]
  32. Xu, Y.; Tian, X.; Li, D.; Tian, W.; Xu, X. The nutrient content compare of different raw biogas fermentation residues. Bull. Agric. Sci. Technol. 2012, 5, 100–102. [Google Scholar]
  33. You, Y.; Dong, H.; Zhu, Z.; Tao, X.; Chen, Y. Experiments on influencing factors of methane emissions from beef cattle manure stack. Trans. CSAE 2008, 24, 168–172. [Google Scholar]
  34. Wang, O.; Ye, F.; Li, K. Problems and solutions of cows manure treatment in Chongqing. China Dairy Cattle 2006, 10, 38–40. [Google Scholar]
  35. Li, X.; Wang, S.; Duan, L.; Hao, J.; Li, C.; Chen, Y.; Yang, L. Particulate and trace gas emissions from open burning of wheat straw and corn stover in China. Environ. Sci. Technol 2007, 41, 6052–6058. [Google Scholar] [CrossRef] [PubMed]
  36. Berglund, M.; Börjesson, P. Assessment of energy performance in the life-cycle of biogas production. Biomass Bioenergy 2006, 30, 254–266. [Google Scholar] [CrossRef]
  37. Becker, C.; Döhler, H.; Eckel, H.; Fröba, N.; Georgieva, T.; Grube, J. Empirical Values for Biogas; Springer Nature: Darmstadt, Germany, 2007. [Google Scholar]
  38. Aguirre-Villegas, H.A.; Larson, R.A. Evaluating greenhouse gas emissions from dairy manure management practices using survey data and lifecycle tools. J. Clean. Prod. 2017, 143, 169–179. [Google Scholar] [CrossRef]
  39. Hamelin, L.; Wesnaes, M.; Wenzel, H.; Petersen, B.M. Environmental consequences of future biogas technologies based on separated slurry. Environ. Sci. Technol. 2011, 45, 5869–5877. [Google Scholar] [CrossRef]
  40. Han, J.; Mintz, M.; Wang, M. Waste-to-Wheel Analysis of Anaerobic-Digestion-Based Renewable Natural Gas Pathways with the GREET Model. 2011. Available online: file:///C:/Users/1234/Downloads/ ANL _ESD _11-6.pdf (accessed on 30 September 2011).
  41. Wang, X.; Wang, L. Environmental Protection Departments about the Fog Haze in Harbin: Straw Is a Important Factor. 2013. Available online: http://www.chinanews.com/gn/2013/10-21/5403825.shtml (accessed on 21 October 2013).
  42. Cherubini, E.; Zanghelini, G.M.; Alvarenga, R.A.F.; Franco, D.; Soares, S.R. Life cycle assessment of swine production in Brazil: A comparison of four manure management systems. J. Clean. Prod. 2015, 87, 68–77. [Google Scholar] [CrossRef]
  43. Bunus FT. Phosphoric acid by wet process: Radioactive components in phosphoric acid and their removal. In Hodge CH, Popovici NP (eds) Pollution Control in Fertilizer Production; Marcel Dekker, Inc.: New York, NY, USA, 1994. [Google Scholar]
  44. ZCG. The Natural Gas Industry Report of In-Depth Market Research and Future Development Trent from 2018–2024 in China; Zhiyan Grail Research Group: Beijing, China, 2018. [Google Scholar]
  45. SC. The Rate of China’s Natural Gas Dependence on Importation in 2017. 2018. Available online: http://www.china-nengyuan.com/news/120546.html (accessed on 2 February 2018).
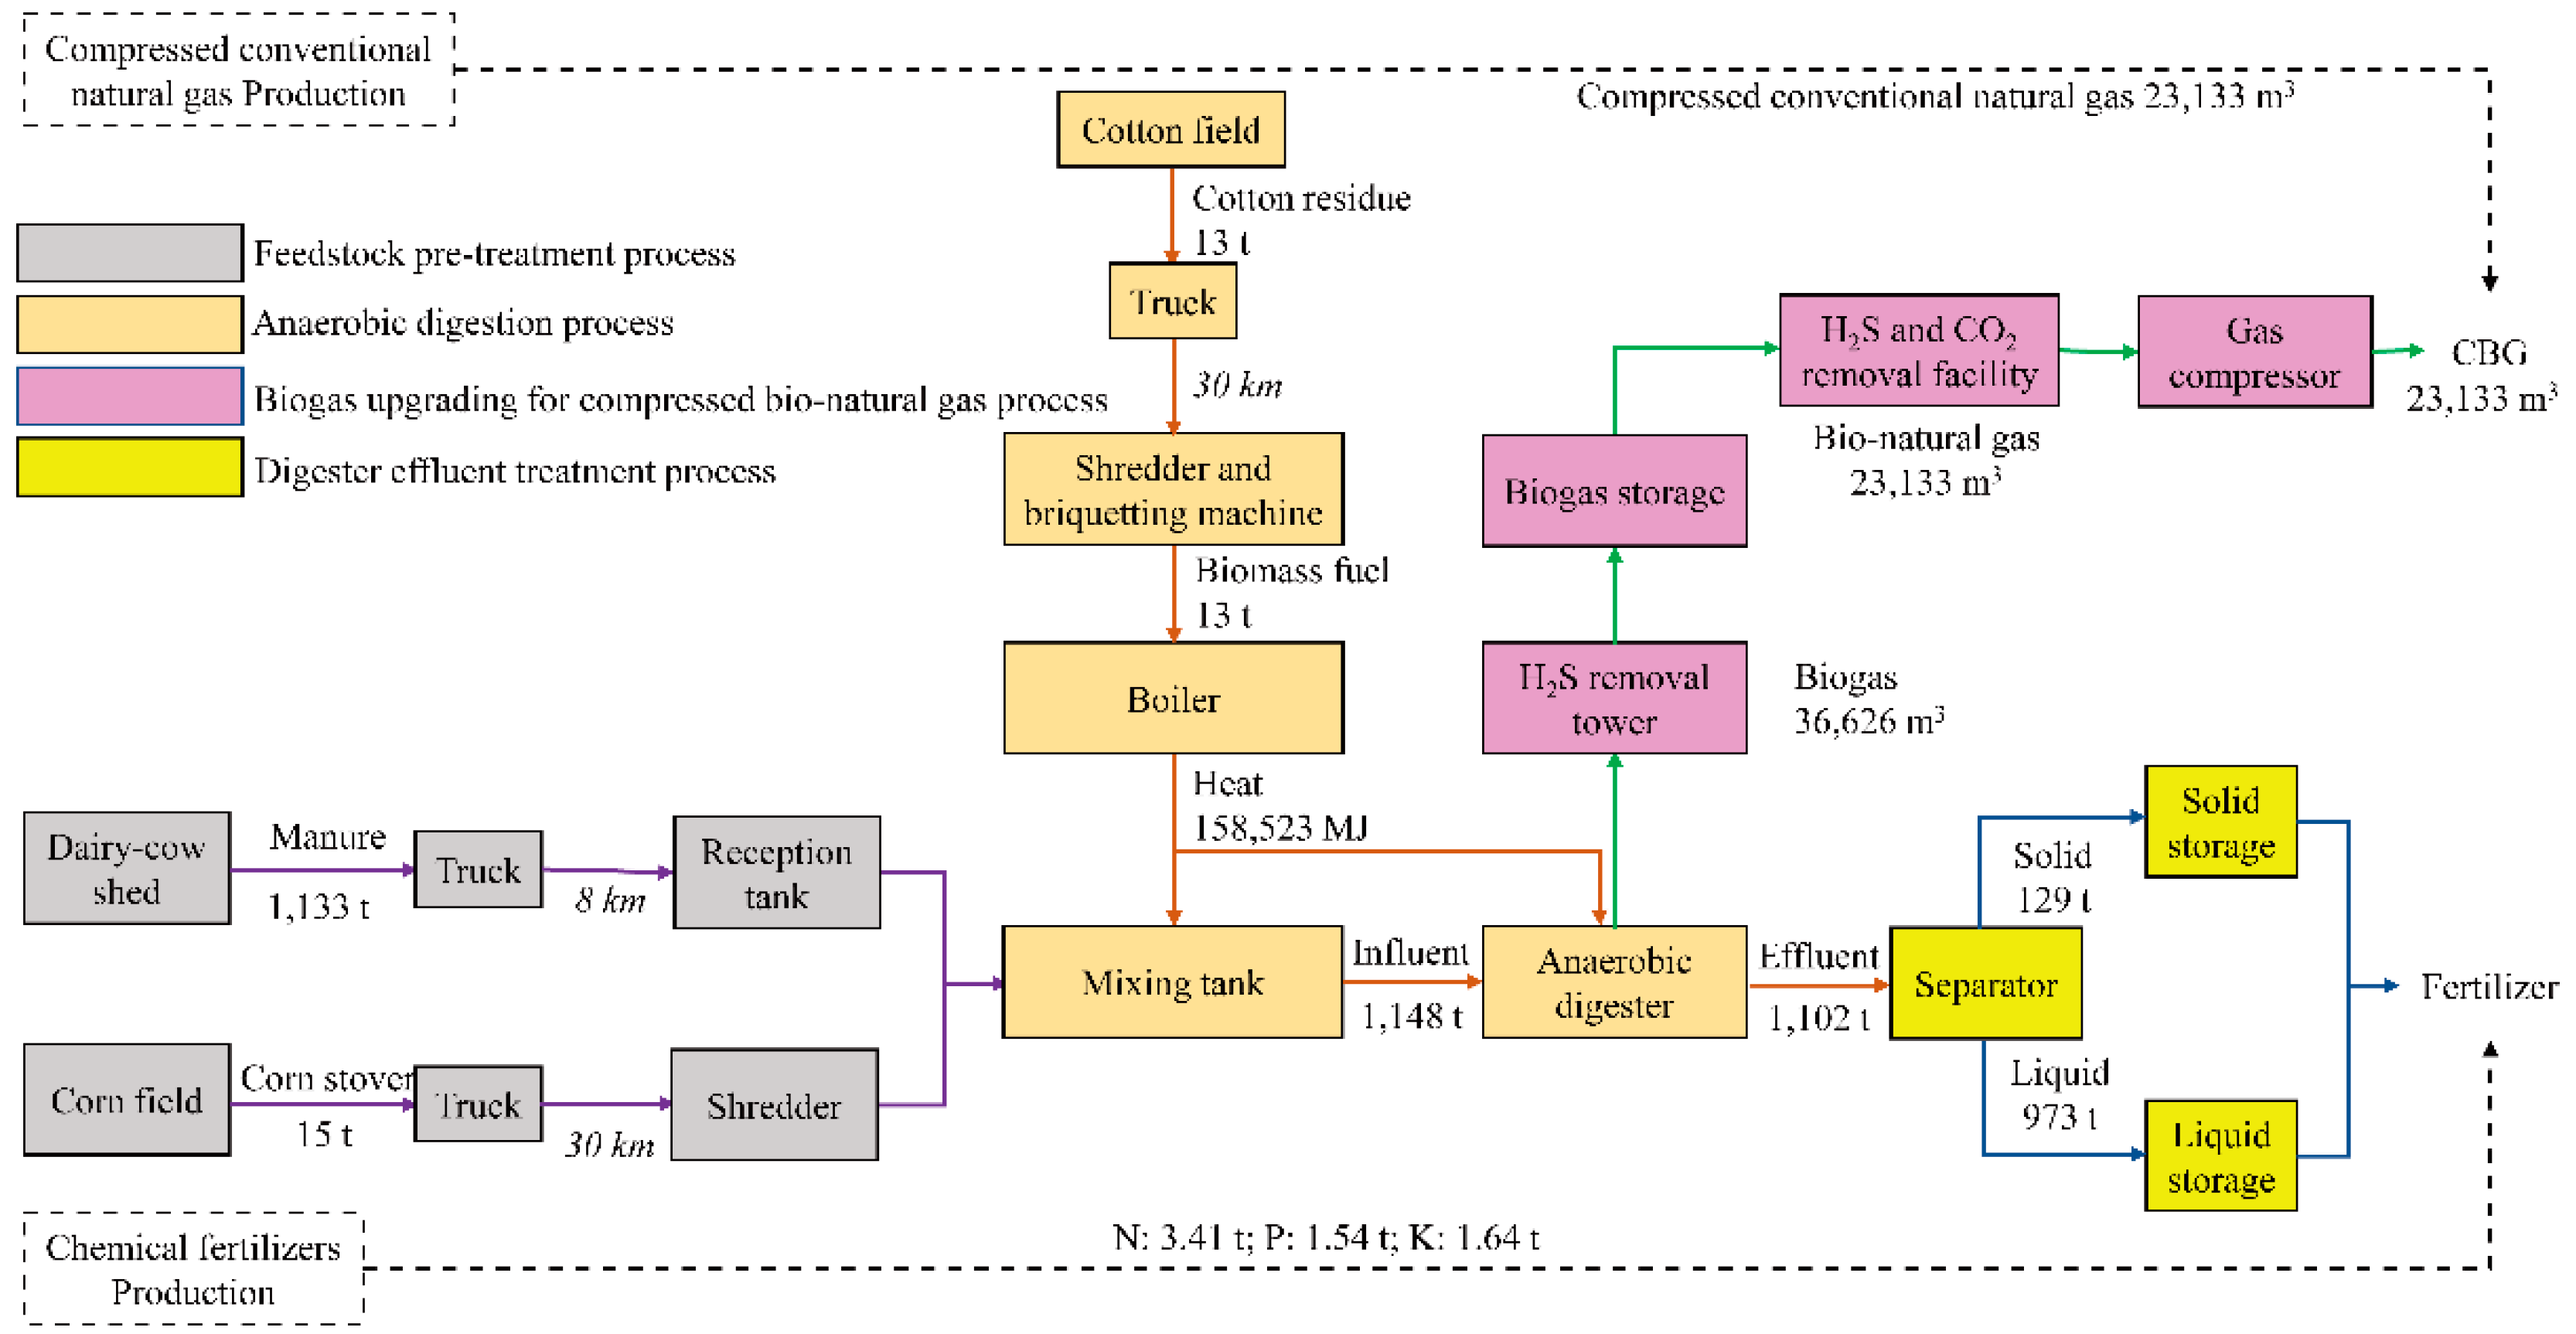
Figure 1. Key processes and data flows per day within the system boundary of the cattle manure co-digested with corn stover for the large-scale compressed bio-natural gas (CBG) production. Dotted lines indicate the replaced energy and fertilizer.
Energies 12 00429 g001
Figure 2. Environmental impacts of the system with emission credits for 1 m3 CBG production. GWP: global warming potential, kg CO2-eq; AP: acidification potential, g SO2-eq; EP: eutrophication potential, g PO43−-eq; RI: respiratory inorganics, g PM2.5-eq; WU: water use, kg; ADP: abiotic depletion potential, 10−4 g Sb-eq. (A, Reference case; B, manure co-digestion with corn stover for large-scale compressed bio-natural gas production.).
Energies 12 00429 g002
Figure 3. Results of sensitivity analysis for the effect of electricity consumption on global warming potential (GWP), acidification potential (AP), eutrophication potential (EP), respiratory inorganics (RI), water use (WU), abiotic depletion potential (ADP), primary energy input to output ratio (PEIO) and CH4 emission from anaerobic digestion on GWP (GWP*).
Energies 12 00429 g003
Figure 4. Sensitivity analysis of global warming potential (GWP, kg CO2-eq), acidification potential (AP, g SO2-eq), eutrophication potential (EP, g PO43−-eq), respiratory inorganics (RI, g PM2.5-eq), water use (WU, kg), and abiotic depletion potential (ADP, g Sb-eq) for different scenarios (A: without considering emission credits; B: with considering emission credits).
Energies 12 00429 g004
Table 1. The reference methods of characterization categories and the values of normalization factors in this study.
Characterization CategoriesReference MethodNormalization Factor d
Global warming potential (GWP)IPCC 2007 a1.05 × 1013
Acidification potential (AP)CML2002 b0.36 × 1011
Eutrophication potential (EP)CML2002 b0.38 × 1010
Respiratory inorganics (RI)IMPACT2002+ c1.88 × 1010
Water use (WU)-6.06 × 10¹⁴
Abiotic depletion potential (ADP)CML2002 b0.75 × 107
Note: a, referred from [27]; b, referred from [28]; c, referred from [29]; d, referred from [30].
Table 2. The inventory of environmental emissions from manure storage in lagoons without any treatment and corn stover burning in field.
InventoryEmissions from Manure Storage in Lagoons without any TreatmentEmissions from Corn Stover Burning in Field
Value (g kg−1)ReferenceValue (g kg−1)Reference
Methane (CH4)4.45[33]4.40[35]
Ammonia (NH3)0.02[34]--
Chemical oxygen demand (COD)1.91[31]--
Total phosphorus (TP)0.07[31]--
Total nitrogen (TN)0.25[31]--
Nitrous oxide (N2O)--0.14[35]
Carbon monoxide (CO)--4.60[31]
Nitrogen oxide (NOX)--0.13[31]
Volatile organic compounds (VOC)--0.79[31]
Sulfur dioxide (SO2)--0.02[31]
Particulate matter 2.5 (PM2.5)--11.7[35]
Particulate matter 10 (PM10)--0.29[31]
Table 3. Energy efficiency of the manure co-digestion with corn stover for compressed bio-natural gas (CBG) production system operation.
ItemValuePercent of Total Energy (%)
Total energy input245,413 MJ d−1100
Feedstock pre-treatment process16,043 MJ d−16.54
 Feedstock transportation (diesel)376 kg d−16.49
 Feedstock pretreatment33 kwh d−10.05
Anaerobic digestion process186,430 MJ d−175.97
 Homogenate1,240 kwh d−11.82
 Cotton residue transportation (diesel)28 kg d−10.47
 Cotton residue treatment for heat1,166 kwh d−11.71
 Anaerobic digestion5,022 kwh d−17.37
 Heat consumption158,523 MJ d−164.59
Biogas for CBG production process42,359 MJ d−117.26
 H2S removal1,248 kwh d−11.83
 Final H2S removal, CO2 removal and gas compression10,518 kwh d−115.43
Digester effluent treatment process582 MJ d−10.24
 Solid and liquid separation162 kwh d−10.24
Total energy output1,243,467 MJ d−1100
 CBG855,921 MJ d−169.00
 Energy savings from chemical fertilizer production387,546 MJ d−131.00
Primary Energy Input to Output (PEIO) ratio 20 %-
Table 4. Life cycle global warming potential (GWP), acidification potential (AP), eutrophication potential (EP), respiratory inorganics (RI), water use (WU) and abiotic depletion potential (ADP) performances of different processes for 1 m3 CBG production.
ProcessGWPAPEPRIWUADP
kg (CO2-eq)%g (SO2-eq)%g (PO43−-eq)%g (PM2.5-eq)%kg%10−4 g (Sb-eq)%
Feedstock pre-treatment process13.430.510.071.450.011.630.010.90103.763.812.7136.32
 Manure transport and pre-treatment11.220.430.061.210.011.440.010.6992.033.382.5133.57
 Corn stover transport and pre-treatment2.220.080.010.240.000.190.000.2111.720.430.212.75
Anaerobic digestion process553.8021.132.1444.920.1932.300.5642.391007.0937.001.9425.99
 Homogenate50.021.910.275.560.022.880.085.90167.476.150.293.92
 Cotton residue for heat46.951.790.8016.850.1117.750.1712.61161.375.930.466.21
 Anaerobic digestion456.8417.431.0822.510.0711.670.3123.88678.2524.921.1815.87
Biogas upgrading for CBG process474.6918.112.5352.910.1627.350.7455.951589.0758.382.7837.18
 H2S removal50.361.920.275.590.022.900.085.94168.596.190.293.94
 Final H2S removal, CO2 removal and gas compression424.3316.192.2647.320.1524.440.6650.011420.4852.192.4833.23
Digester effluent treatment process1578.7060.240.030.720.2338.730.010.7721.830.800.040.51
 Solid and liquid separation6.520.250.030.720.000.380.010.7721.830.800.040.51
 Solid and liquid storage1572.2159.990.000.000.2338.350.000.000.000.000.000.00
Total2,620.621004.781000.601001.311002,721.741007.47100