Abstract
The characterization of a spectrum splitter of both hot and cold mirror, type TechSpec AOI 50.0, using a 50-Watt halogen bulb light has been done. Both the bulb spectrum, prior to and after spectrum splitting, are described in this study to see the degradation of radiation that occurs because partial energy is absorbed by the splitter. This characterization plays an important role in determining the best position of a photovoltaic (PV) and thermoelectric generator (TEG) in a PV-TEG system. The light spectrum was recorded using mini USB spectrometer hardware and Spectragryph version 1.2.8 software as optical spectroscopic software that displays light records coming with wavelength (nm) on the x-axis and light spectrum intensity in arbitrary units (a.u.) on the y-axis. The measurement results show that the light intensity in the visible light region (300–750) nm is more dominant than the intensity in infrared light (>750 nm), so that the PV placement is preferred over TEG. Furthermore, with a cold mirror, PV is more suitable if placed in a position to receive reflected light, while using a hot mirror is more suitable in the position transmitted light. For TEG, it is placed in a position opposite to PV. As a result, the maximum intensity of the PV light spectrum with cold mirrors is 46.52 a.u at a wavelength of 479.6 nm, while with hot mirrors it is 42.07 a.u with a 457.6 nm wavelength. It can be concluded that the value of the light intensity with a cold mirror is better than that with a hot mirror on the visible light (Vis) spectrum, and the current and voltage are equivalent to the results of the radiation energy area. It was proven that the maximum total output of a hybrid PV-TEG system with Cold Mirror is greater than that with Hot Mirror (100.53 > 68.77) × 10−3 µW. Based on the result of this study, it is recommended that further research can be conducted to increase radiation energy and output power in TEG.
1. Introduction
Solar cells are technological products that can convert solar energy into electrical energy. However, not all energy that arrives can be converted into electrical energy, some of it converted into thermal energy. Solar energy that can be used for solar cells is the energy of photons in the spectrum with a range of wavelengths of 400–760 nm or in the category of visible light [1]. Spectra that are smaller than 400 nm and greater than 760 nm, or those outside the band gap of solar cells, will only change to thermal energy and in the long term will reduce the efficiency of solar cells [2,3]. The division of the sunlight spectrum based on wavelength has been carefully observed by Hamdy and Osborn [4], who categorize visible light in the range 400–800 nm with an electron volt value between 1.5 and 3.1 eV and infrared light in the range greater than 800 nm.
Furthermore, infrared light with a wavelength >760 nm that can be changed into thermal energy is more suitable for the needs of a thermoelectric generator (TEG) [1,5,6], which is a device for converting thermal energy into electrical energy. The mode of operation of this TEG module is that the heat on one side of the module will cause a temperature difference on both sides of the module so as to generate electricity voltage, which is known as the Seebeck effect.
Tritt [7] and Tritt et al. [8] explained the phenomena, properties, and material of thermoelectric generators, while the basic idea of combining and arranging in cascades solar cells and thermoelectric generators was introduced by Kraemer et al. [5], Van Sark [9], and Kraemer et al. [10]. Another interesting study on hybrid photovoltaic (PV)-TEG simulation was carried out by Li et al. [11], who analyzed the effect of the temperature differences on cold sides, the cross-sectional areas, as well as the distances between PV and TEG. On the other side, the parameter of the research was the concentration ratio of the radiation source, which was also analyzed as a parameter for the effectiveness in the overall hybrid PV-TEG.
Furthermore, several papers discuss PV-TEG hybrids with the splitting of the wavelength spectrum. Ju et al. [6] developed a numerical model on the incorporation of PV-TEG with a beam spectrum divider as a splitter of the PV and TEG spectrum regions at the standard AM1.5D radiation. The visible light spectrum was used for PV with a wavelength range of around 400–900 nm, while for TEG it was above 900 to 1700 nm. Elsarrag et al. [12] designed a simulation and test of PV-TEG incorporation in a laboratory using a cold mirror as an ultraviolet–visible light splitter for PV with infrared for TEG. In the simulation, Elsarrag et al. [12] varied the radiation with 0.2, 0.5, 0.8, and 1.1 Suns. Meanwhile, the spectrum splitter with the hot mirror was introduced by Mizoshiri et al. [13], which combined a thermoelectric module. with a dimension of 18 × 18 mm, from a homemade Bi2Te2.7 Se0.3 thin film material, with a mini solar cell module. A cylindrical lens was placed in the direction of the hot mirror’s reflection towards TEG to focus on the Near-infrared (Nir) light spectrum. Karp et al. [14] in the simulation also used spectrum splitters, but for applications in multi-junction solar cells without thermoelectric. There were three types of solar cells used in one junction, namely GaInP, GainAs, and Ge.
Several of the studies mentioned above were generally focused on the numerical studies, which only divided the light based on their wavelength into visible light (400–760 nm) and infrared (>760 nm). Although Elsarrag et al. [12] and others [13,14] had already conducted the experimental study, they still did not expose and analyze the form of the light spectrum. Additionally, Mizoshiri et al. [13] were only focusing on power output of PV-TEG hybrid using hot mirror, and Karp et al. [14] described PV only. Therefore, this study will focus on the characterization of two types of light splitters that display the results of measuring the light spectrum prior to and after passing through the spectrum splitters. The results of measuring the spectrum of light after passing through the splitter are the basis for the positioning of both PV and TEG modules.
In this PV-TEG hybrid, spectrum splitters were chosen from the type of Hot Mirror and Cold Mirror with 50 × 50 mm dimensions produced by Edmund Optic [15] with artificial light radiation sources from 50 Watt halogen bulbs. This bulb power was chosen as the initial step of investigation and adjusted to the parameters and limitations of the supporting components in terms of the temperature of the radiation that could be absorbed by the Fresnel lens (Fl), the mirror, and the temperature of the PV surface. The light spectrum measurements were obtained using a combination of mini USB spectrometer hardware and Spectragryph 1.2.8 application software, which displays wavelengths and light intensities in graphical form.
2. Materials and Methods
In this study, the halogen bulb was placed at the top position forming a 0°, in which the incident halogen light was directly overhead on the zenith angle in degrees of zenith = 0° on a Fresnel lens (FL). This bulb illuminates the FL, which was right below the lamp and served to focus the beam towards the hot/cold mirror. Some of the light radiation that passed through FL and arrived at the mirror was transmitted while others were reflected.
The placement of the PV and TEG module was adjusted with the measurement results of the halogen light spectrum (reflected/transmitted by the mirror). PV is suitable for receiving high-intensity spectra at low wavelengths while TEG is suitable for receiving high-intensity spectra at high wavelengths. The hybrid is shown in Figure 1.
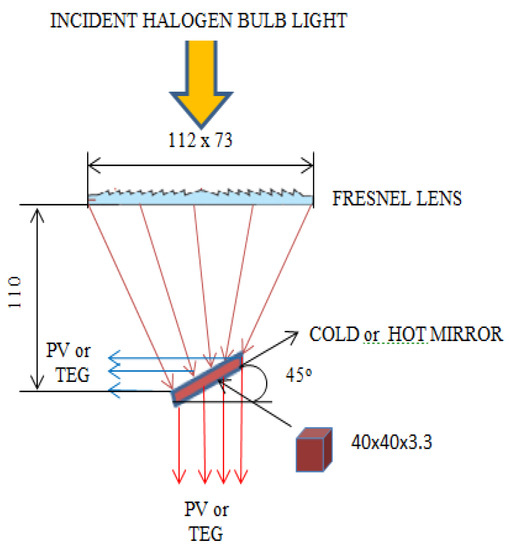
Figure 1.
The schematic of a potential photovoltaic-thermoelectric generator (PV-TEG) hybrid.
The working principle of combining PV-TEG above was explained by Skjolstrup et al. [16] who used a beam splitter on the sloping position as a light spectrum separator, which transmits to TEG and reflects PV. However, they did not explain the reason for the placement of the PV module in the direction of the beam splitter and the TEG direction of light transmission, whereas Skjolstrup et al. [16] referred to Ju et al. [6] who placed the PV module in the direction of transmission and TEG direction of light reflection with the spectral beam splitter. Therefore, in this study, two light spectrum splitters were used (hot and cold mirrors, type TechSpec AOI 50.0 mm2) alternately to see each of its characteristics of both transmitted and reflected light. Cold and Hot Mirror slope angles were 45o [15]. Slope angles (x) < 45° and (x) > 45° are not optimal to produce splitting of a light spectrum with a beam splitter [16]. The light spectrum, which is transmitted or reflected by the mirror, was measured using Spectragryph 1.2.8 application software [17].
Furthermore, two pieces of solar cells from polycrystalline silicone material were used with specification 0.14 W, 0.5 Vmax, 0.28 Imax, and dimensions 52 × 19 mm in series; therefore, the dimensions were 52 × 38 mm in total. The dimensions of the solar cell were adjusted to the dimensions of the hot mirror and cold mirror used, which was 50 × 50 mm2. For TEG, ceramic material (Bismuth Telluride, SP1848-27145 material) was used with dimensions 40 × 40 × 3.4 mm and operating temperatures of −40 to 150 °C. Meanwhile, to focus the halogen radiation light, a Fresnel lens from polymethylmethacrylate (PMMA) was used with dimensions of 112 × 73 mm and a focal length of 110 mm; the lens was 2 mm thick with 92% light transmission.
As for the experimental set-up as illustrated in Figure 2, it was conducted using a 6-GW Instek GDM-8135 digital multimeter model capable of measuring electric current and PV voltage-TEG up to a micrometer unit. Measurements of the halogen light spectrum reflected or transmitted by either hot mirror or cold mirror were carried out using a Mini USB spectrometer and with Spectragryph version 1.2.8 as optical spectroscopic software designed by Menges [17].
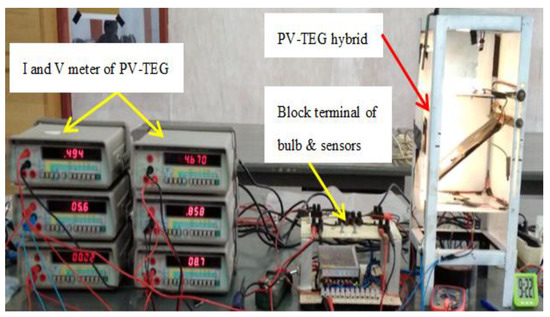
Figure 2.
Photograph of the complete experimental of PV-TEG hybrid setup.
Meanwhile, the specifications of the multimeter gauge as shown in Figure 2 above can be seen in Table 1 with a unit of current uncertainty (Ucurrent = 0.414 µA) at standard deviation (SD) 3.127. For power output, the SD = 6.182 with Upower = 0.819 × 10⁻³ µW. This calculation refers to Chandel [18].

Table 1.
Specifications of GW Instek GDM-8135 Digital Multimeter.
3. Results and Discussion
3.1. Light Spectrum of a Halogen Bulb Through Fresnel Lens
In Figure 3 the halogen light spectrums indicate that most of them are at wavelengths between 340 and 700 nm, while the above 700 nm decreased slowly. The light spectrum that passed through the Fresnel lens was lower in intensity than before, except that at the wavelength range of 340–486.67 nm, the intensity of both of them almost coincided at approximately 88 arbitrary unit (a.u.). However, above the visible light limit (>700 nm), the radiation spectrum difference prior to and after the FL was getting bigger. In general, the percentage of light transmitted was slightly lower than FL specifications in the range of 300–700 nm, which was approximately 79% < 92% (FL specification). This means that there was lost about 13% of the spectrum of light radiation not absorbed by FL and was transmitted to the mirror. Possibly, this occurred because not all of the light spectrums of the halogen bulb radiation were perpendicular to the FL, or it could be the quality of the lens material that needed to be replaced from PMMA to acrylic material. This is because polymethylmethacrylate (PMMA) has disadvantages in terms of thermal expansion, where the lens center may shift for a long-term use [19].
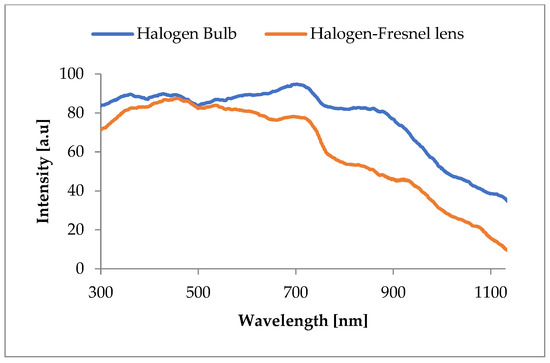
Figure 3.
The halogen bulb and before the mirror (after FL) spectrums (a.u. is arbitrary units).
3.2. The Light Spectrum that is Transmitted and Reflected
3.2.1. Hot Mirror
A light spectrum characteristic transmitted by the hot mirror (HM) is shown in Figure 4. It can be seen that the intensity of light was much greater at the wavelength limit of 300–749.62 nm than between 749.62 and 1200 nm. The intensity of light increased sharply from a wavelength of 300 nm to its peak at a wavelength of 457.6 nm with an intensity value of 42.07 a.u. After that, there were several stages of decreasing intensity until it reached the value of 13.36 a.u. at a wavelength of 749.62 nm. The wavelength of light between 300–751 nm can be included as the range of visible light (Vis), which is classified in the band gap of photon light [20,21]. Furthermore, at wavelengths above 751 nm, which are near-infrared (Nir), the light intensity was low and could be ignored. This indicates that the hot mirror worked well in the visible light range.
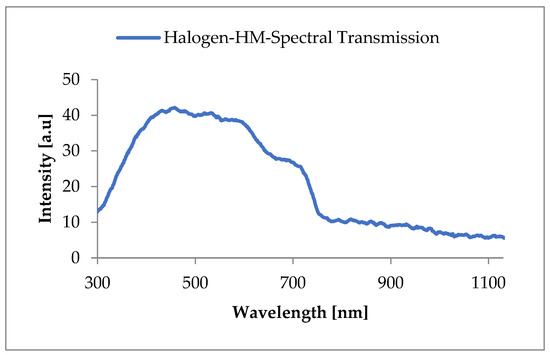
Figure 4.
The halogen spectrum transmitted by hot mirror (HM).
Meanwhile, the hot mirror reflected halogen light illustrated a different pattern, as shown in Figure 5, where the area of the intensity curve was relatively smaller. The larger area of the curve indicated greater radiation energy [22]. At visible light intervals (300–750) nm, a quite large intensity only occurred around the 400 nm wavelength, or precisely at 377 nm continuously declining to a wavelength of 749.61 nm. Furthermore, for wavelengths above 750 nm, the intensity that occurred was very small. At wavelengths above 750 nm, the intensity that occurred was also relatively low, as in transmitted light. In short, even though the reflected spectrum of light was much smaller than the transmitted one, the intensity was still relatively high in the range of 300–500 nm, which is still within the limits of visible light.
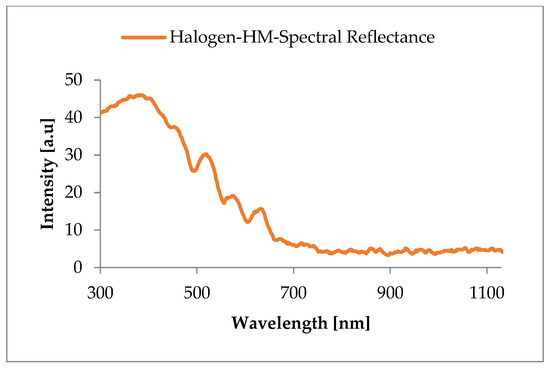
Figure 5.
The halogen light spectrum reflected by hot mirror.
3.2.2. Cold Mirror
The characteristics of the light transmission spectrum from the cold mirror (CM), as in Figure 6, showed a spectrum pattern that was much different from the hot mirror (Figure 3). Light energy in the visible light region appeared much smaller even though it had high enough peak intensity (44.79 a.u. at a wavelength of 304.5 nm). Furthermore, at wavelengths above 600 nm, it was relatively very small. This means that at the wavelength limit of 300 to 500 nm, the radiation spectrum could be utilized.
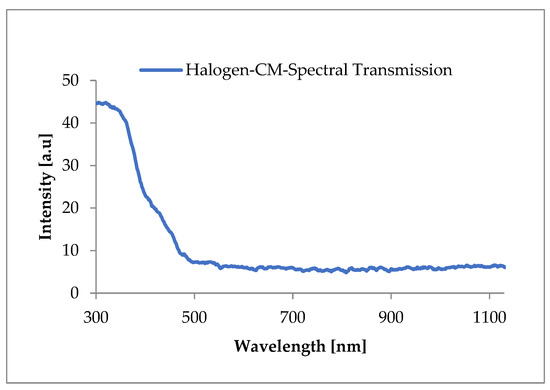
Figure 6.
The halogen light spectrum transmitted by cold mirror (CM).
Furthermore, from the characteristics of the reflected light spectrum of the cold mirror, it appears that relatively larger radiation energy occurred in the visible light region where the peak intensity was 46.52 a.u. at a wavelength of 479.6 nm. After that, the intensity decreased to the Vis boundary (at the value 749.62 nm, 13.94 a.u.). The intensity at the wavelength limit of 749.62–1200 nm also decreased dramatically; thus, it could be ignored as an energy source (Figure 7).
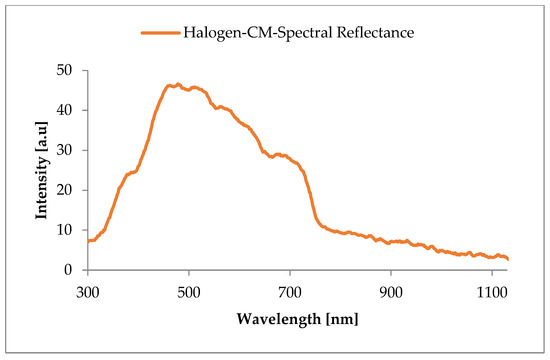
Figure 7.
The halogen light spectrum reflected by the cold mirror.
3.3. The Light Spectrum after Passing the Fresnel Lens and Hot Mirror
Figure 8 shows a light spectrum that was traversing the Fresnel lens and then transmitted to the PV and reflected to the TEG by the hot mirror. The reduction of intensity was more than 50%, either which was transmitted to the PV or that was reflected to the TEG. As for the example at 435 nm wavelength, the intensity after passing the Fresnel lens showed a number accounting for 86.703 a.u, while light intensity that was transmitted and reflected by HM, decreased, respectively, to 39.35 a.u (same amount on PV and TEG). This change occurred due to the absorption of radiation energy by the light spectrum splitter HM, which eventually affected the power generated by the PV and TEG modules. The other potential cause was the illumination of light radiation that was not 100% facing the HM surface.
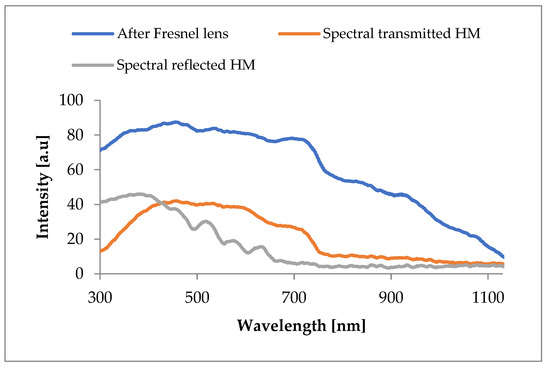
Figure 8.
The halogen light spectrum reflected and transmitted by hot mirror.
3.4. The Light Spectrum after Passing the Fresnel Lens and Cold Mirror
Similar to the trend that occurred on the HM, the light spectrum on the CM showed a declining intensity as well (as seen in Figure 9). This can be explained also by the example of the wavelength of 460 nm. After passing the Fresnel lens, the light spectrum intensity was 87.374 a.u. In addition, the intensity transmitted to the TEG and reflected to the PV was 12.293 and 46.145 a.u., respectively.
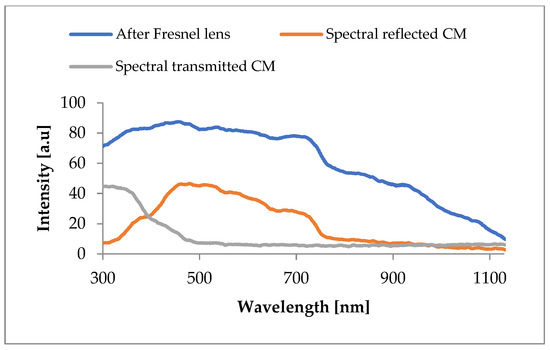
Figure 9.
The halogen light spectrum reflected and transmitted by cold mirror.
Comparing the radiation energy transmitted by CM to PV and reflected by HM to PV, both energies were relatively the same. These results were indicated by a comparatively same curve area. Otherwise, this did not occur on the TEG module, where the radiation energy reflected by the HM was far greater than that transmitted by the CM.
The degradation of the halogen light spectrum in every measurement position on Figure 3 to Figure 9 is briefly shown in Table 2 below.
Table 2.
Halogen light spectrums of different positions.
It can be seen from the trends in Table 2 that every halogen light spectrum position shows a declination of intensity. It might have occurred due to the specification of the Fresnel lens, which was only able to transmit light up to 92%, as was explained in Section 2. The ability of the hot mirror and cold mirror to transmit and reflect the light spectrum was also a parameter that affected radiation intensity degradation.
3.5. Position of PV and TEG Modules
The characteristics of the light spectrum that was reflected or transmitted by a light spectrum separator with the hot mirror and cold mirror of the TechSpec AOI 50.0 mm2 type can be used as a placement indication for PV or TEG module positions.
From the characteristics of the light spectrum for the hot mirror, as seen in Figure 4 and Figure 5, it appears that the greatest light energy occurred in the visible light region of transmitted light as indicated by the area of the larger intensity curve. Based on these results, the best position of the PV module was under the hot mirror, while the TEG was placed to receive reflected light from the hot mirror (see Figure 8).
While using the cold mirror shown in Figure 5 and Figure 6, it can be seen that the visible light energy (Vis) was reflected much more than it was transmitted, so that the proper placement of the PV module was in the direction of halogen light reflection, by placing TEG under the cold mirror (Figure 10).
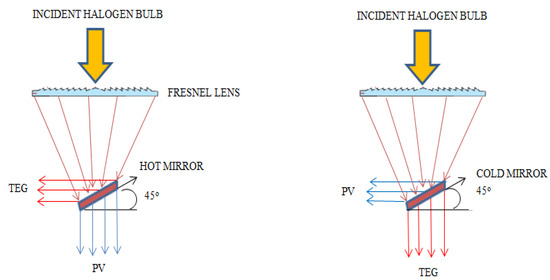
Figure 10.
The scheme of PV-TEG hybrid testing with hot and cold mirrors.
From Figure 8 it can also be explained that hypothetically the spectrum of light received by PV was in the visible light region, which is in accordance with the theory of photon energy. While leading to TEG, the resulting spectrum has not been optimally useful for TEG module. Although not yet optimal, this energy was still useful as in the simulation of Kraemer et al. [10] in hybrid PV-TEG using a spectrum splitter, which proves that the wavelength spectrum below 300 nm (ultraviolet) is still useful as energy for TEG even though it only contributes about 1.35% of the total incident radiation energy. Ideally, the light spectrum that is needed by TEG should be above 750 nm [7,8,9].
Furthermore, Figure 11 shows the trend of power and current in the voltage variable as described below.
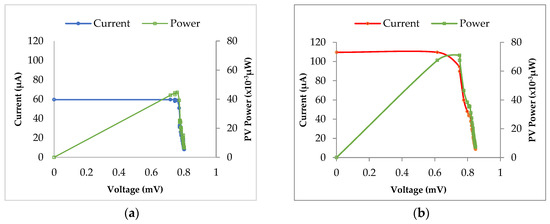
Figure 11.
Characteristics of power-voltage (P-V) and current-voltage (I-V) in PV; (a) transmitted HM, (b) reflected CM.
3.6. Typical P-V and I-V Characteristics of PV-TEG the Hybrid Scheme
3.6.1. PV
Figure 11 presents the characteristics of power-voltage (P-V) and current-voltage (I-V) of the PV, which was transmitted by the HM and reflected by the CM when the temperature differences were 0.3–1 °C between the upper and lower surfaces of PV. The maximum upper surface temperature of the PV using HM was 38.5 °C, while by the CM, the upper surface temperature PV was at 41.3 °C and 39.3 °C. This PV operating temperature was still below the maximum operating temperature range (50 °C) [23,24]. Meanwhile, the power generated by the PV from the reflected light by the CM was almost double compared to that transmitted by the HM at a similar voltage (0.75 mV). This is in line with the magnitude of the light radiation spectrum intensity curve in Figure 4 compared to Figure 7. The characteristics of increasing electrical power in the hybrid PV-TEG also illustrated the importance of designing temperature controls on PV to maintain a maximum power point for the whole time of the given operating conditions.
3.6.2. TEG
The I-V characteristics of TEG and PV are different (comparing Figure 11 and Figure 12) where as Figure 11 shows, the TEG electric current moderately decreased with increasing voltage, while as seen in Figure 9, the current was constant before sloping down. Likewise, the power increased to its maximum point, and after that decreased to almost 0 at the maximum voltage. In TEG the reflected light radiation of the CM showed a better increase in power than the transmitted power by the HM. The maximum power in TEG that was generated by the radiation spectrum using CM was 39.9 × 10⁻³ µW while using the HM was 24.4 × 10⁻³ µW. In other words, power by using the CM was 39% greater than that using the HM.
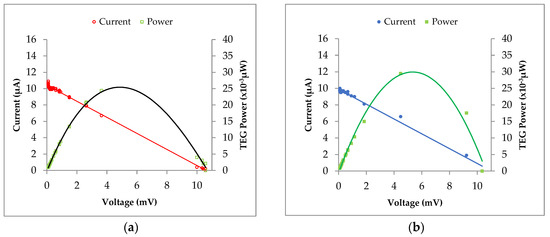
Figure 12.
Characteristics of P-V and I-V in TEG; (a) reflected HM, (b) transmitted CM.
The total power at the peak point of the PV-TEG hybrid by using the HM was equal to 68.77 × 10⁻³ µW, while by CM it reached 100.53 × 10⁻³ µW. This means that the power generated using the CM as spectrum splitter is approximately 40% better than the HM.
It is shown in Figure 12 that the power produced by TEG had different characteristics from the power produced by PV in Figure 11. The output power of TEG formed a raised curve with the maximum power point in the middle, while the current continued to decrease with increasing voltage. In contrast, in PV, the power rose as the voltage increased, while the current remained constant. Then, until a certain point, both current and power decreased. It could be interpreted that the spectrum of radiation in the visible light even in a relatively small intensity can produce better electrical power for PV, but not yet for TEG. For additional information, light spectrum generated was focusing on the PV polycrystalline material and TEG Bismuth Telluride SP1848-27145 material. Further research is also required for other PV and TEG, since the spectrum emitted by the halogen light to PV was only tested on polycrystalline silicon material, and has not been tested on other types of PV technologies, not on all TEG types.
Characteristics of changes on PV-TEG hybrid power output by using hot and cold mirror spectrum splitters are shown on Table 3.
Table 3.
Characteristics of PV-TEG in P = f(V) using spectrum splitters Hot and Cold Mirror.
4. Conclusions
In this study, a new method for determining the best position of PV and TEG modules is based on the characteristics of the light spectrum prior to and after the beam splitter using a halogen bulb as a sample. Splitting of the light spectrum was done using a hot mirror and cold mirror of the TechSpec AOI 50.0 mm2 type. In maximum power conditions, the results showed that the total power of the PV–TEG hybrid was 68.77 × 10⁻³ µW by using the HM, while it was 100.53 ×10⁻³ µW by using the CM, with PV and TEG area 0.001872 m2 and 0.0016 m2, respectively. It can be concluded that using the Cold Mirror is 40% approximetly better than the Hot Mirror as a spectrum splitter. As for PV and TEG, the output energy of PV was greater than TEG. It also showed that although the intensity of light radiation was low, it was able to produce photons needed by PV where the radiation spectrum was in the visible light spectrum area (400–760) nm; otherwise, the spectrum that had the potential to be thermal required by TEG was still low. In other words, for further research, it is highly recommended to conduct research on improving light spectrum that headed to TEG, enlarging the dimensions of the light splitter, and using acrylic Fresnel lens material, which is more resistant to high temperatures than PMMA.
Moreover, the current research was limited by only using polycrystalline silicon (PV) and bismuth telluride (TEG) materials; therefore, further research is also required to enrich the data by using other PV technologies and TEG materials.
Author Contributions
W.H.P., Z.D., and S. jointly designed the article reviews and analyzed the literature and data; M. drafted the experiment and wrote a draft of the article; W.H.P., and Z.D. contributed to the graphical analysis and writing results; S. carried out a critical review and proofreading.
Funding
This research received no external funding or self-funded by the authors.
Acknowledgments
The authors would like to thank the University of Hasanuddin and the University of Tadulako for hosting this research. We also would like to thank Irwan Mahmudi, the head of fundamental electric and measurement in the Electrical Engineering laboratory of the University of Tadulako, Palu, Indonesia, for setting up the experiments.
Conflicts of Interest
The authors declare no conflicts of interest. Funding sponsors have no role in the design of the study; in the collection, analyses; or interpretation of data; in writing manuscript, and in the decision to publish the results.
Nomenclature
| I | current (µA) |
| Imax | maximum current (µA) |
| P | power (µW) |
| Ppower | power uncertainty (µW) |
| V | voltage (mV) |
| Vmax | voltage maximum (mV) |
| Ucurrent | current uncertainty (µA) |
| x | slope of angle (o) |
Abbreviations
| a.u | arbitrary unit |
| CM | cold mirror |
| HM | hot mirror |
| Fl | Fresnel lens |
| Nir | near-infrared |
| nm | nanometer |
| PMMA | polymethylmethacrylate |
| rdg | reading of AC voltage in multimeter |
| PV | photovoltaic |
| SD | standard deviation |
| TEG | thermoelectric generator |
References
- Cengel, Y.A.; Ghajar, A.J. Heat and Mass Transfer: Fundamentals and Applications, 5th ed.; McGraw-Hill Education: New York, NY, USA, 2015; p. 718. ISBN 978-0-07-339818-1. [Google Scholar]
- Liao, T.; Lin, B.; Yang, Z. Performance characteristics of a low concentrated photovoltaic- thermoelectric hybrid power generation device. Int. J. Therm. Sci. 2014, 77, 158–164. [Google Scholar] [CrossRef]
- Lin, J.; Liao, T.; Lin, B. Performance analysis and load matching of a photovoltaic-thermoelectric hybrid system. Energy Convers. Manag. 2015, 105, 891–899. [Google Scholar] [CrossRef]
- Hamdy, M.A.; Osborn, D.E. The potential for increasing the efficiency of solar cells in hybrid photovoltaic/thermal concentrating systems by using beam splitting. Sol. Wind Technol. 1990, 7, 147–153. [Google Scholar] [CrossRef]
- Kraemer, D.; Hu, L.; Muto, A.; Chen, X.; Chen, G.; Chiesa, M. Photovoltaic-thermoelectric hybrid systems: A general optimization methodology. Appl. Phys. Lett. 2008, 92, 243503. [Google Scholar] [CrossRef]
- Ju, X.; Wang, Z.; Flamant, G.; Li, P.; Zhao, W. Numerical analysis and optimization of a spectrum splitting concentration photovoltaic-thermoelectric hybrid system. Sol. Energy 2012, 86, 1941–1954. [Google Scholar] [CrossRef]
- Tritt, T.M. Thermoelectric Materials: Principles, Structure, Properties, and Applications. Encycl. Mater. Sci. Technol. 2002. [Google Scholar] [CrossRef]
- Tritt, T.M.; Böttner, H.; Chen, L. Thermoelectrics: Direct Solar Thermal Energy Conversion. MRS Bull. 2008, 33, 366–368. Available online: https://www.cambridge.org/core/journals/mrs-bulletin (accessed on 20 October 2018). [CrossRef]
- Van Sark, W.G.J.H.M. Feasibility of photovoltaic—Thermoelectric hybrid modules. Appl. Energy 2011, 88, 2785–2790. [Google Scholar] [CrossRef]
- Kraemer, D.; Poudel, B.; Feng, H.P.; Caylor, J.C.; Yu, B.; Yan, X.; Ma, Y.; Wang, X.; Wang, D.; Muto, A.; et al. High-performance flat-panel solar thermoelectric generators with high thermal concentration. Nat. Mater. 2011, 10, 532–538. [Google Scholar] [CrossRef] [PubMed]
- Li, G.; Chen, X.; Jin, Y. Analysis of the Primary Constraint Conditions of an Efficient Photovoltaic-Thermeolectric Hybrid System. Energies 2017, 10, 20. [Google Scholar] [CrossRef]
- Elsarrag, E.; Pernau, H.; Heuer, J.; Roshan, N.; Alhorr, Y.; Bartholomé, K. Spectrum splitting for efficient utilization of solar radiation: A novel photovoltaic–thermoelectric power generation system. Renew. Wind Water Sol. 2015, 2, 16. [Google Scholar] [CrossRef]
- Mizoshiri, M.; Mikami, M.; Ozaki, K. Thermal–Photovoltaic Hybrid Solar Generator Using Thin-Film Thermoelectric Modules. Jpn. J. Appl. Phys. 2012, 51. [Google Scholar] [CrossRef]
- Karp, J.H.; Ford, J.E. Multiband solar concentrator using transmissive dichroic beamsplitting. Proc. SPIE 2008, 7043, 70430F. [Google Scholar]
- Edmund Optics Home Page. Available online: https://www.edmundoptics.com.sg (accessed on 11 September 2018).
- Skjølstrup, E.J.H.; Søndergaard, T. Design and optimization of spectral beamsplitter for hybrid thermoelectric-photovoltaic concentrated solar energy devices. Sol. Energy 2016, 139, 149–156. [Google Scholar] [CrossRef]
- Menges, F. Spectragryph—Optical Spectroscopy Software. Available online: https://www.effemm2.de/spectragryph/index.html (accessed on 25 May 2018).
- Chandel, R. Uncertainty Analysis of Photovoltaic Power Measurements using Solar Simulators. Energy Technol. 2013, 1, 763–769. [Google Scholar] [CrossRef]
- Annen, H.P.; Fu, L.; Leutz, R.; Gonz, L.; Mbakop, J.; Gmbh, C.O. Direct Comparison of Polymethylmetacrylate (PMMA) and Silicone-On-Glass (SOG) for Fresnel Lenses in Concentrating Photovoltaics (CPV). Proc. SPIE 2011, 8112. [Google Scholar] [CrossRef]
- Dharma, J.; Pisal, A. Simple Method of Measuring the Band Gap Energy Value of TiO2 in the Powder Form Using a UV/Vis/NIR Spectrometer; PerkinElmer, Inc.: Shelton, CT, USA, 2009; pp. 4–7. Available online: www.perkinelmer.com (accessed on 10 May 2018).
- Peters, M.; Goldschmidt, J.C.; Löper, P.; Groß, B.; Üpping, J.; Dimroth, F.; Wehrspohn, R.B.; Bläsi, B. Spectrally-Selective photonic structures for PV applications. Energies 2010, 3, 171–193. [Google Scholar] [CrossRef]
- Kreith, F.; Manglik, R.A.J.M.; Bohn, M.S. An Instructor’s Solutions Manual to Accompany Principle of Heat Transfer, 7th ed.; S1 Ed. Prepared by Tiwari, S.; Indian Institute of Technology Madras: Chennai, India, 2011; ISBN 978-1-4390-6187-9. [Google Scholar]
- Mahtani, P.; Yeghikyan, D.; Kherani, N.P.; Zukotynski, S. The Use of Amorphous Silicon in Fabricating a Photovoltaic-Thermal System. In Proceedings of the 2nd Canadian Solar Buildings Conference, Calgary, Canada, 10–14 June 2007. [Google Scholar]
- Yang, D.; Yin, H. Energy Conversion Efficiency of a Novel Hybrid Solar System for Photovoltaic, Thermoelectric, and Heat Utilization. IEEE Trans. Energy Convers. 2011, 26, 662–670. [Google Scholar] [CrossRef]
© 2019 by the authors. Licensee MDPI, Basel, Switzerland. This article is an open access article distributed under the terms and conditions of the Creative Commons Attribution (CC BY) license (http://creativecommons.org/licenses/by/4.0/).