Article

Formation of Conductive Oxide Scale on 33NK and 47ND Interconnector Alloys for Solid Oxide Fuel Cells

1
Institute of High Temperature Electrochemistry, UB RAS, 620137 Yekaterinburg, Russia
2
Institute of Chemical Engineering, Ural Federal University named after the first President of Russia B. N. Yeltsin, 620002 Yekaterinburg, Russia
3
Institute of New Materials and Technologies, Ural Federal University named after the first President of Russia B. N. Yeltsin, 620002 Yekaterinburg, Russia
4
School of Chemical Engineering, University of Birmingham, Birmingham B15 2TT, UK
*
Author to whom correspondence should be addressed.
Energies 2019, 12(24), 4795; https://doi.org/10.3390/en12244795
Submission received: 9 December 2019 / Revised: 9 December 2019 / Accepted: 14 December 2019 / Published: 16 December 2019

Abstract

:
Two grades of chromium-free alloys were studied in order to apply them as interconnectors for solid oxide fuel cells. The surface modification methods were proposed for each alloy with the purpose of forming of oxide scales considering the required physicochemical properties. Investigations of the structure and properties of the obtained oxide scales were performed and the efficiency of the chosen surface modification methods was approved. The samples with the surface modification exhibited higher conductivity values in comparison with the nonmodified samples. A compatibility study of samples with surface modification and glass sealant of chosen composition was accomplished. The modified samples demonstrated good adhesion during testing and electrical resistance less than 40 mOhm/cm2 at 850 °C in air, which allowed us to recommend these alloys with respective modified oxide scales as interconnectors for SOFC.

1. Introduction

Various types of fuel cells that differ in electrode and electrolyte materials and possess different operating temperatures are known. Among them are solid polymer, alkaline, phosphoric acid, molten carbonate, and solid oxide fuel cells (SOFC) [1].
Solid oxide fuel cells are considered the most promising type of fuel cells due to their ability for operating various types of fuel, as well as their modular design and relatively low cost of materials used for the manufacture.
Efforts of current research have proved that one of the main problems encountered during the operation of the SOFC is the poor stability of used interconnectors.
Ceramic interconnectors, such as lanthanum and yttrium chromite, as well as their various modifications, have such disadvantages, such as the coefficient of thermal expansion (CTE) not corresponding to other components of the SOFC, insufficiently high conductivity, and interaction with other SOFC materials [2,3].
Metallic interconnectors (Crofer HT, Crofer 22APU, AISI 441, SUS 441, 08H17T, 15H25T, etc.) are, as a rule, heat-resistant steels and alloys containing a great amount of chromium [4,5,6,7]. The high corrosion resistance of high-chromium steels is primarily associated with the formation of the Cr2O3 thin continuous oxide film on their surface [8,9]. However, an oxide film with low electrical conductivity continuously grows during the process of SOFC operation, which leads to an increase in resistivity [10,11,12]. Various defects and voids in steel can contribute the resistivity growth, as well as the impurities release that worsens the adhesion between the steel and the oxide scale. Hence, the actual contact area between them decreases. In steels containing silicon, an increase in resistivity is possible due to the formation of a non-conductive layer of silica SiO2 [13]. At high operating temperatures of SOFC, chromium, which is a part of steel, reacts with water or oxygen molecules, forming volatile oxides and hydroxides. These compounds actively interact with the SOFC functional materials, resulting in the formation of low-conductivity inactive compounds and, as an outcome, a decrease in the power of SOFC [13,14].
The use of chromium-free alloys as interconnectors seems to be the simplest and most effective way to eliminate the problems described above [15,16]. However, the lack of chromium in the alloy does not guarantee success in the application because there are a number of requirements that the material of the interconnector meets: High electronic conductivity of the coating, compliance of the CTE with other components of the cell, high corrosion resistance and stability in various atmospheres, high thermal conductivity, high heat resistance, gas tightness, high mechanical strength, low cost, and ease of manufacture [17].
Russian domestic 33NK and 47ND [18] alloys seem to be promising materials for the manufacture of the SOFC interconnectors due to their physicochemical properties, such as heat resistance, high electrical conductivity, and close CTE values to the CTE values of some solid oxide electrolytes and glass sealants.
The purpose of the present work was to study the oxide scales formed on the 33NK and 47ND alloys as a result of high-temperature processing, as well as to modify these oxide scales by applying nickel and manganese layers before annealing in the case of the 33NK alloy and cobalt and manganese in the case of the 47ND alloy in order to increase electrical conductivity, adhesion with glass sealants, and stability during long test conditions.

2. Experimental Procedure

The study of the oxide scales with and without surface modification of the 33NK and 47ND alloys samples was carried out by the following methods: X-ray phase analysis, scanning electron microscopy, and energy-dispersive X-ray spectroscopy (EDX) microanalysis. The samples were prepared in the form of flat plates with an external bottom diameter of 12 mm, a side thickness of 1 mm, and a total height of 1.9 mm (Figure 1a). The electrical resistance of modified and nonmodified samples was studied using the samples in the form of disks with a diameter of 12 mm and a thickness of 1.9 mm (Figure 1b). All samples were prepared on a DMG EcoTurn 450 machine (DMG MORI, Bielefeld, Germany) in order to reproduce a surface roughness not higher than 1.6 μm. Then, the samples were sequentially purified in acetone and isopropyl alcohol using ultrasonic for 20 min.
The samples’ surface modification was performed with the original method. Previously, we presented a method for forming a protective coating on the 08H17T stainless steel, which is analog of the well-known steel Crofer 22APU [19]. We were also granted a patent for a method of applying an electroconductive oxide protective coating of the interconnector to various chromium-containing steels [20]. However, this technique was not appropriate for the alloys described in this work. Therefore, another method was developed, which included the sequential deposition of nickel and manganese layers at the 33NK alloy and cobalt and manganese layers at the 47ND alloy from solutions by means of electrocrystallization. The following solutions were prepared for the deposition: (1) An aqueous-acid solution of NiCl2·6H2O (puriss.); (2) an aqueous-acid solution of Na3[Co(NO2)6]·0.5H2O (p.a.); (3) a solution of MnCl2·4H2O (p.a.) in dimethyl sulfoxide (puriss.). The use of an organic solvent for applying the manganese to the samples’ surface was related to the high value of reduction potential from aqueous solutions (−1.18 V). The choice of dimethyl sulfoxide (DMSO) as a solvent was based on the fact that it has a wide range of operating temperatures, sufficiently high dielectric constant (ε = 48.9), and resistance to decomposition during metal reduction.
The modification of the samples’ surface (Figure 2a,c) occurred as follows: A nickel layer was applied to the purified 33NK sample with electrodeposition at a current density of 0.05 A/cm2 for 300 s or a cobalt layer was applied to the 47ND sample at a current density of 0.01 A/cm2 for 300 s. Then, a manganese layer was applied to the 33NK sample at a current density of 0.07 A/cm2 for 60 s and to the 47ND sample for 120 s at 20–25 °C. Platinum plates were used as inert anodes. After each application step, the sample was washed in isopropyl alcohol.
All samples were subjected to the two-stage annealing. The first stage included annealing in a high-vacuum (10−4 mbar) installation with a furnace at 850 °C for 2 h in order to remove the remaining organics on the surface (Figure 2b,d). The second stage involved annealing at 1000 °C for 10 min in an air atmosphere in order to form the oxide scale on the surface. The heating rate in both cases was 100 °C/h. For nonmodified samples, the high-vacuum annealing was carried out in order to avoid the possible influence of different preparation techniques on the samples’ properties in comparison with the modified ones.
The linear thermal expansion study was performed by means of the high-temperature dilatometry in a quartz cell using a Tesatronic TT 80 length meter with a high-precision axial probe GT 21 HP (TESA, Renens, Switzerland). The sample was a bar with a size of 15 × 3 × 3 mm3. It was annealed under high-vacuum before the measurement, which was carried out in the air in the heating–cooling mode from 100 °C to 900 °C at a rate of 2 °C/min.
The X-ray phase analysis of the samples’ surface was carried out in the geometry of a grazing beam (the angle of the X-ray beam was 4°) using a Rigaku D/MAX-2200 V diffractometer (Rigaku, Tokyo, Japan) in CuKα radiation (λ = 1.5418 Å) with a step of Δ2Ѳ ≈ 0.02° with the angular scanning rate of 4°/min at room temperature in the air atmosphere.
The microstructure, uniformity of the distribution of the oxide scale, and elemental composition of the obtained oxide scales were analyzed using scanning electron microscope MIRA 3 LMU (TESCAN, Brno, Czech Republic) with an Inca Energy 350 X-ray microanalysis attachment (Oxford Instruments, Abingdon, UK).
In order to determine the thickness of the obtained oxide scales and the contact areas of the “interconnector—glass sealant”, the gluing of alloy samples with a glass sealant containing SiO2, CaO, ZrO2, Al2O3, Na2O (for more details, see glass sealant # 1 in Reference [21]), and their cross-sections were prepared. The samples, poured into a cylindrical form by the epoxy resin, were ground after hardening with abrasive disks of various grain sizes. Then, they were polished by felt disks with the diamond paste. The pouring process was performed under vacuum in order to achieve better adhesion and avoid the air bubbles formation in the structure of the cross-sections.
Grinding and polishing were conducted at the codirectional movement of the processed sample and disk using a MetPrep 4/PH-4 grinding and polishing machine (Allied, Rancho Dominguez, CA, USA).
The electrical resistance of samples was measured using a four-probe two-contact method with a RM3545 digital ohmmeter (Hioki E.E. Corporation, Nagano, Japan). Special measuring cell of corundum with a clamping mechanism and an outlet for air purging was made for this purpose. Platinum nets with wire were applied as current collectors.

3. Results and Discussion

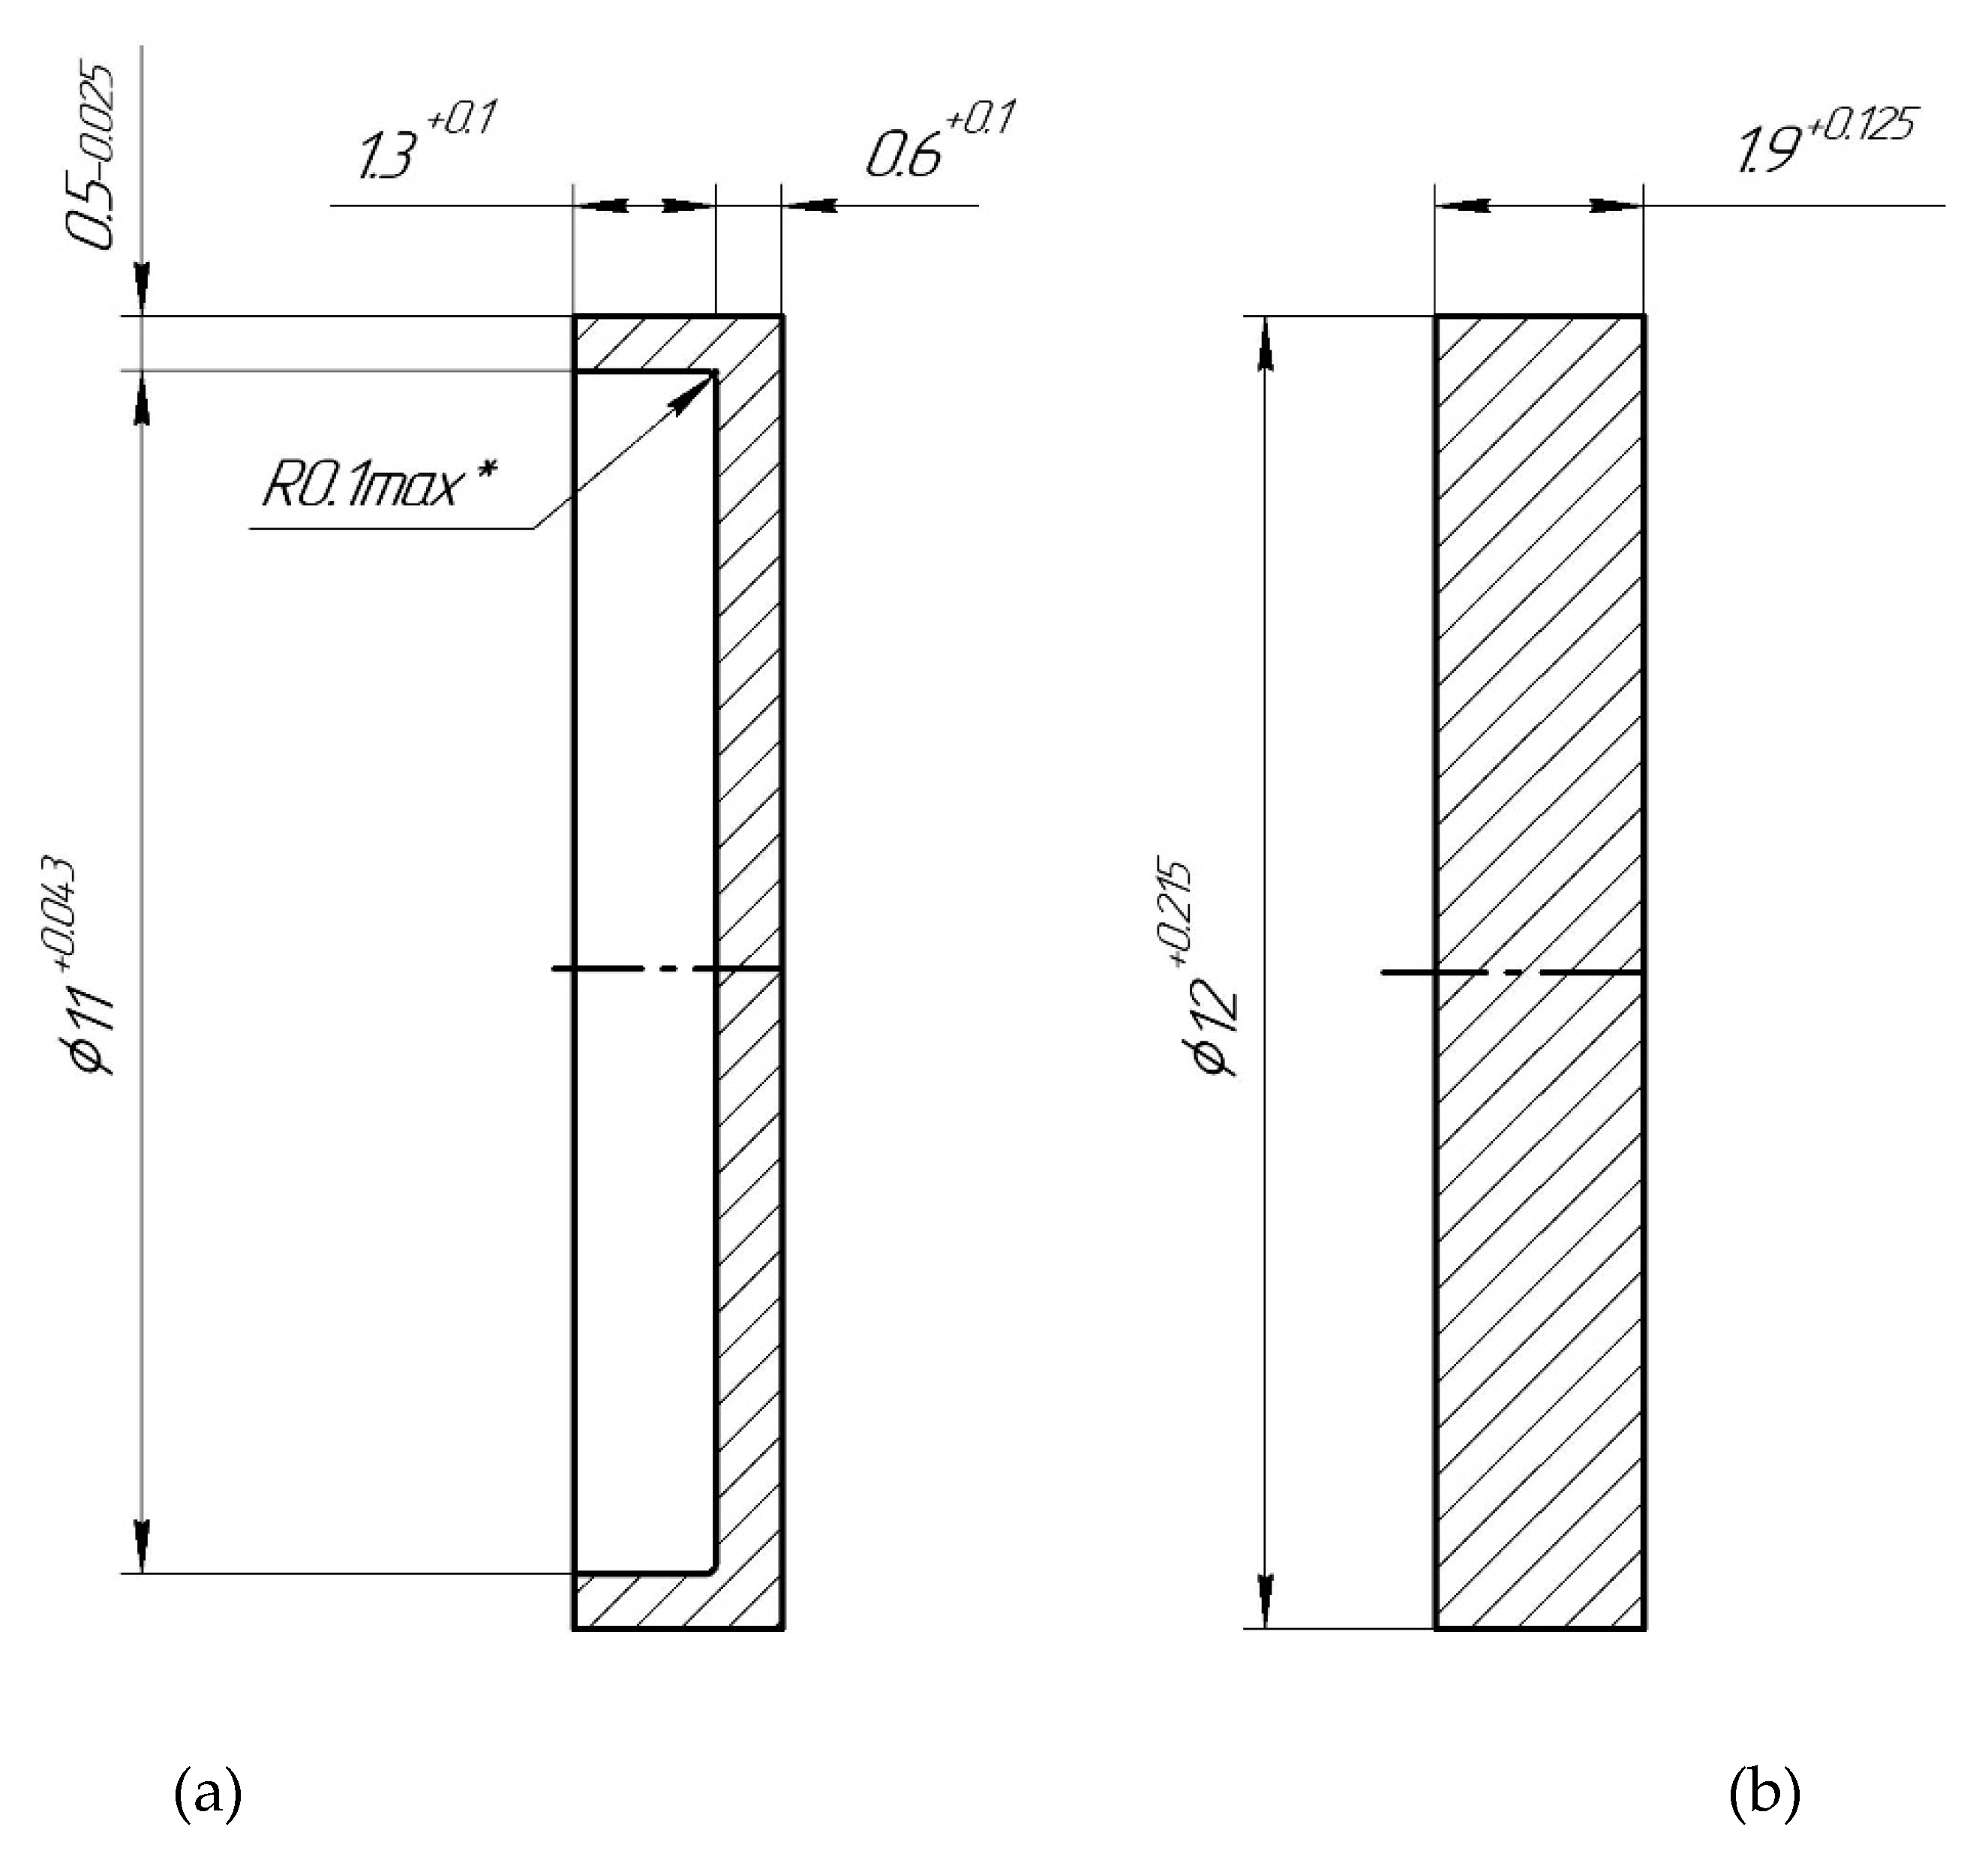
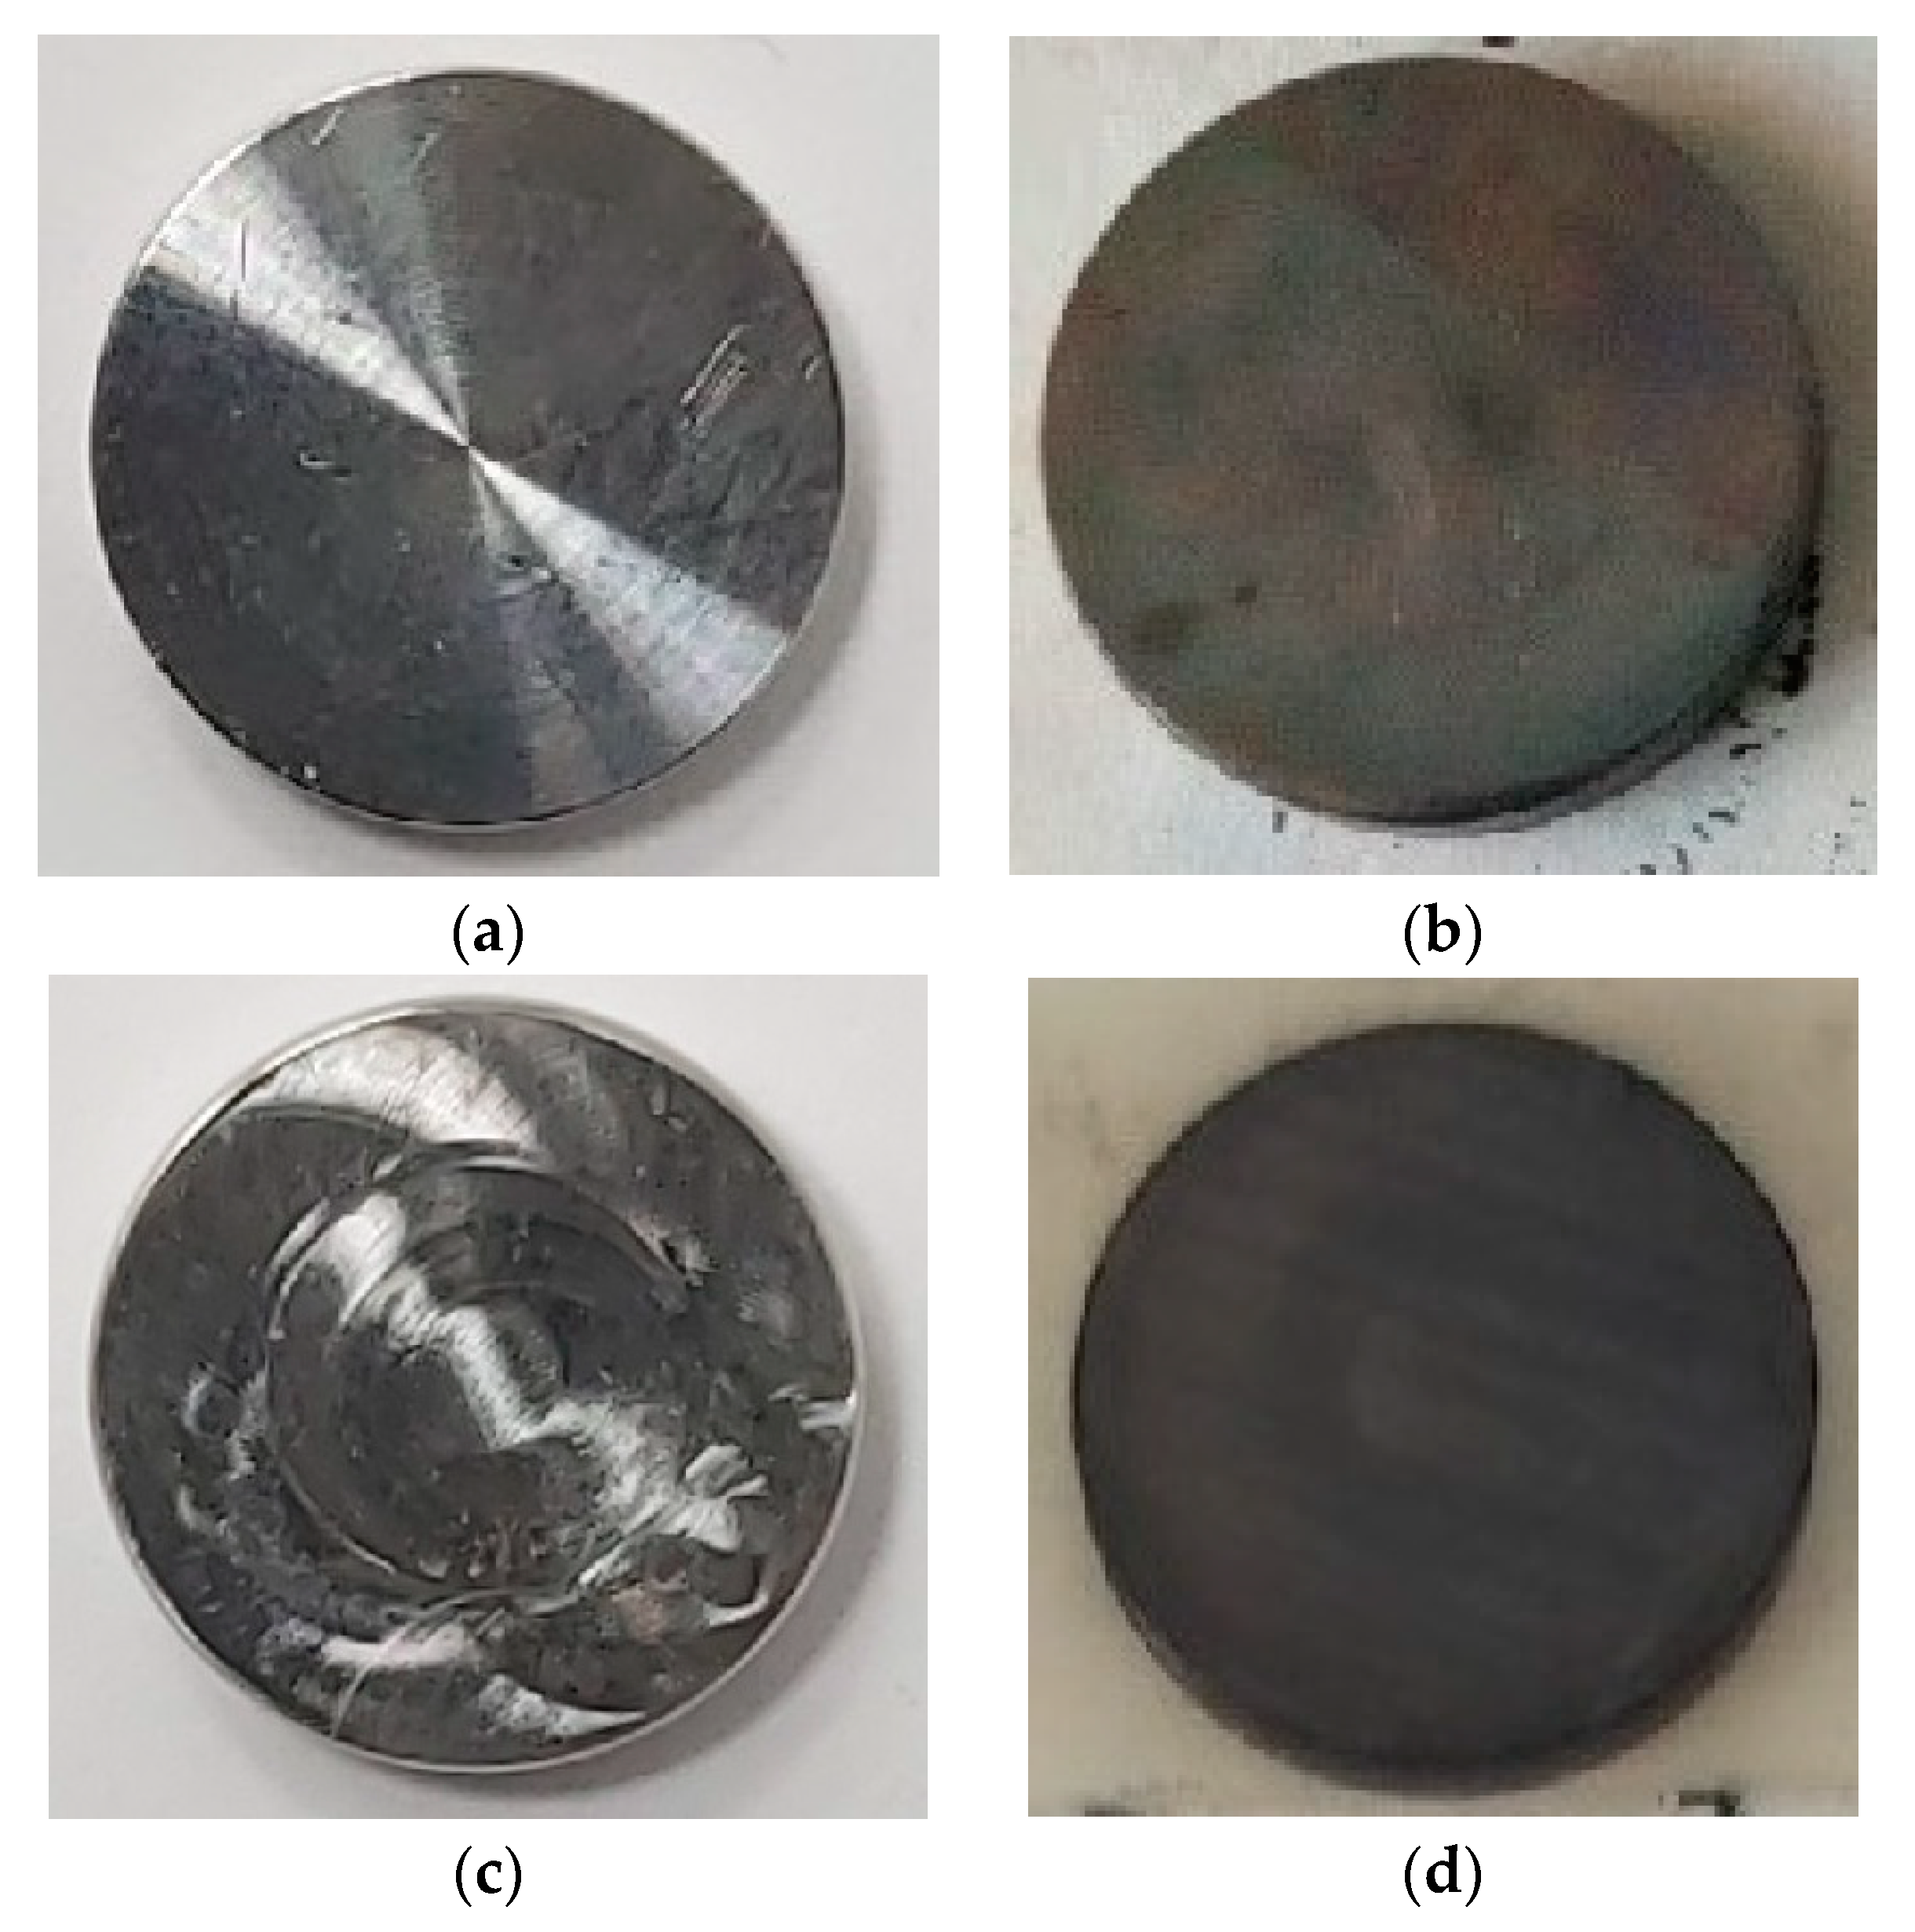
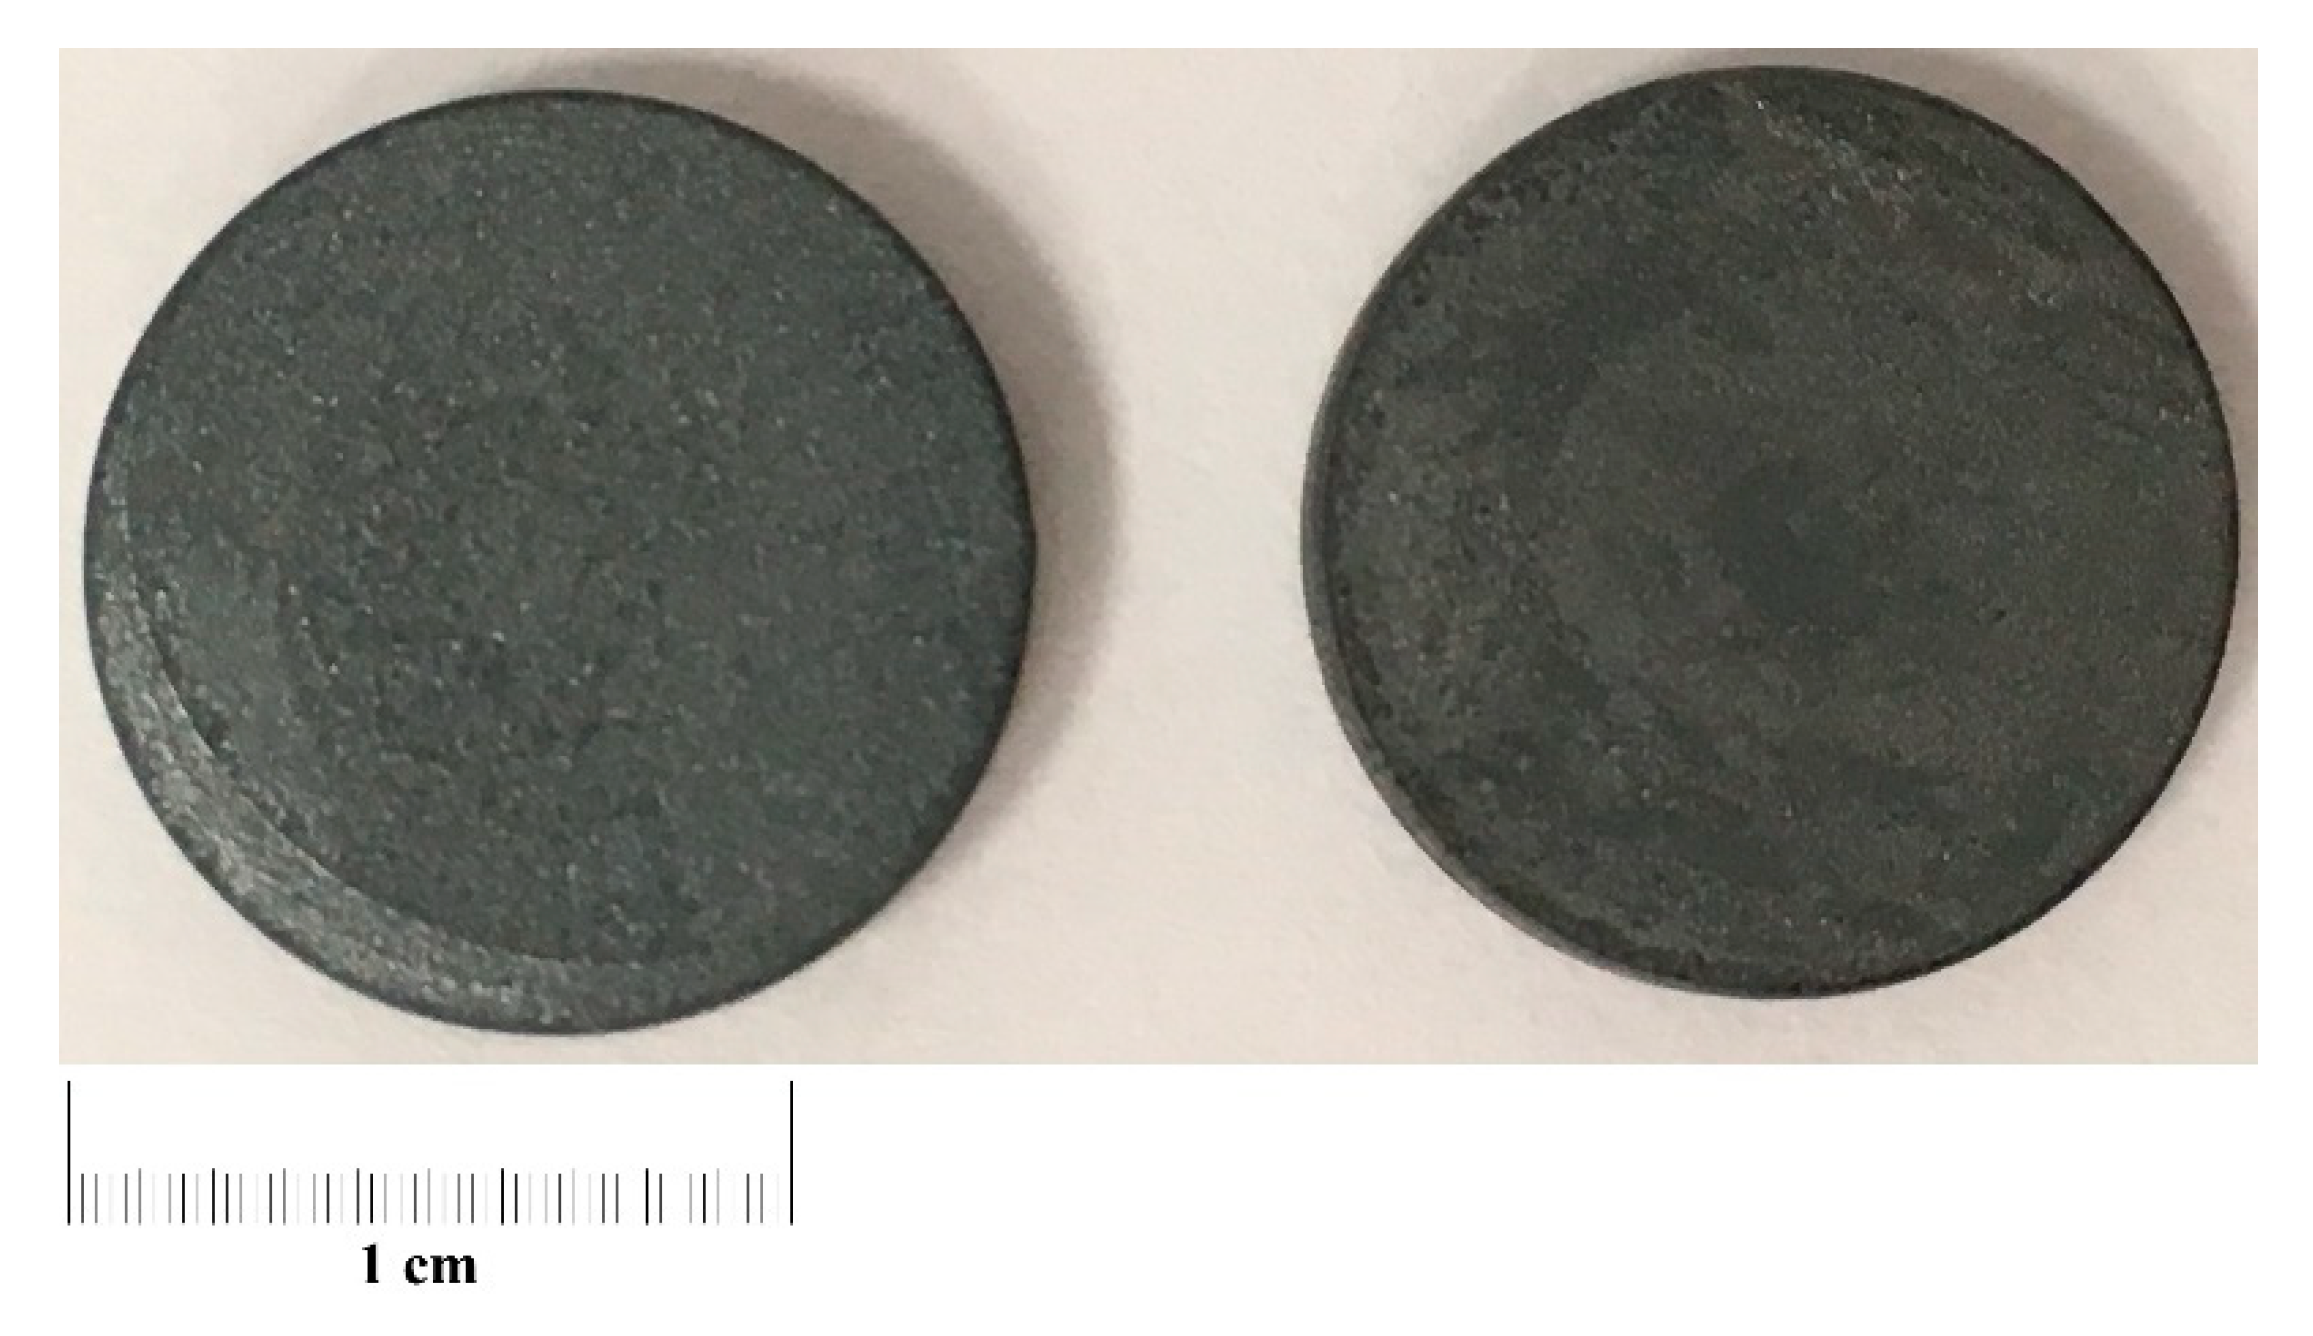
3.1. Features of the Studied Samples

The chemical composition of the studied alloys is presented in Table 1.
The temperature dependences of the relative change in the linear size of the samples of the 33NK and 47ND alloys and the 08H17T and Crofer 22APU steels, as well as the glass sealant and electrolyte Zr0.8Y0.2O3−δ for comparison, are given in Figure 3.
CTE of the 33NK and 47ND alloys and the 08H17T and Crofer 22APU steels measured in this study, as well as the glass sealant and electrolyte Zr0.8Y0.2O3−δ (YSZ), are listed in Table 2.
From the obtained data, it follows that the 47ND alloy had a very close CTE value to the CTE values of the glass sealant and the YSZ electrolyte, which makes it the most promising material for the manufacture of interconnectors among the steels and alloys considered in this work. The dilatometric curve for the 33NK alloy had a pronounced inflection point of about 500 °C, which may indicate the phase transition presence, whereas the CTE value changed sharply. Such a behavior of the 33NK alloy may negatively affect the mechanical strength of the assumed gluing with electrolyte through the glass sealant.

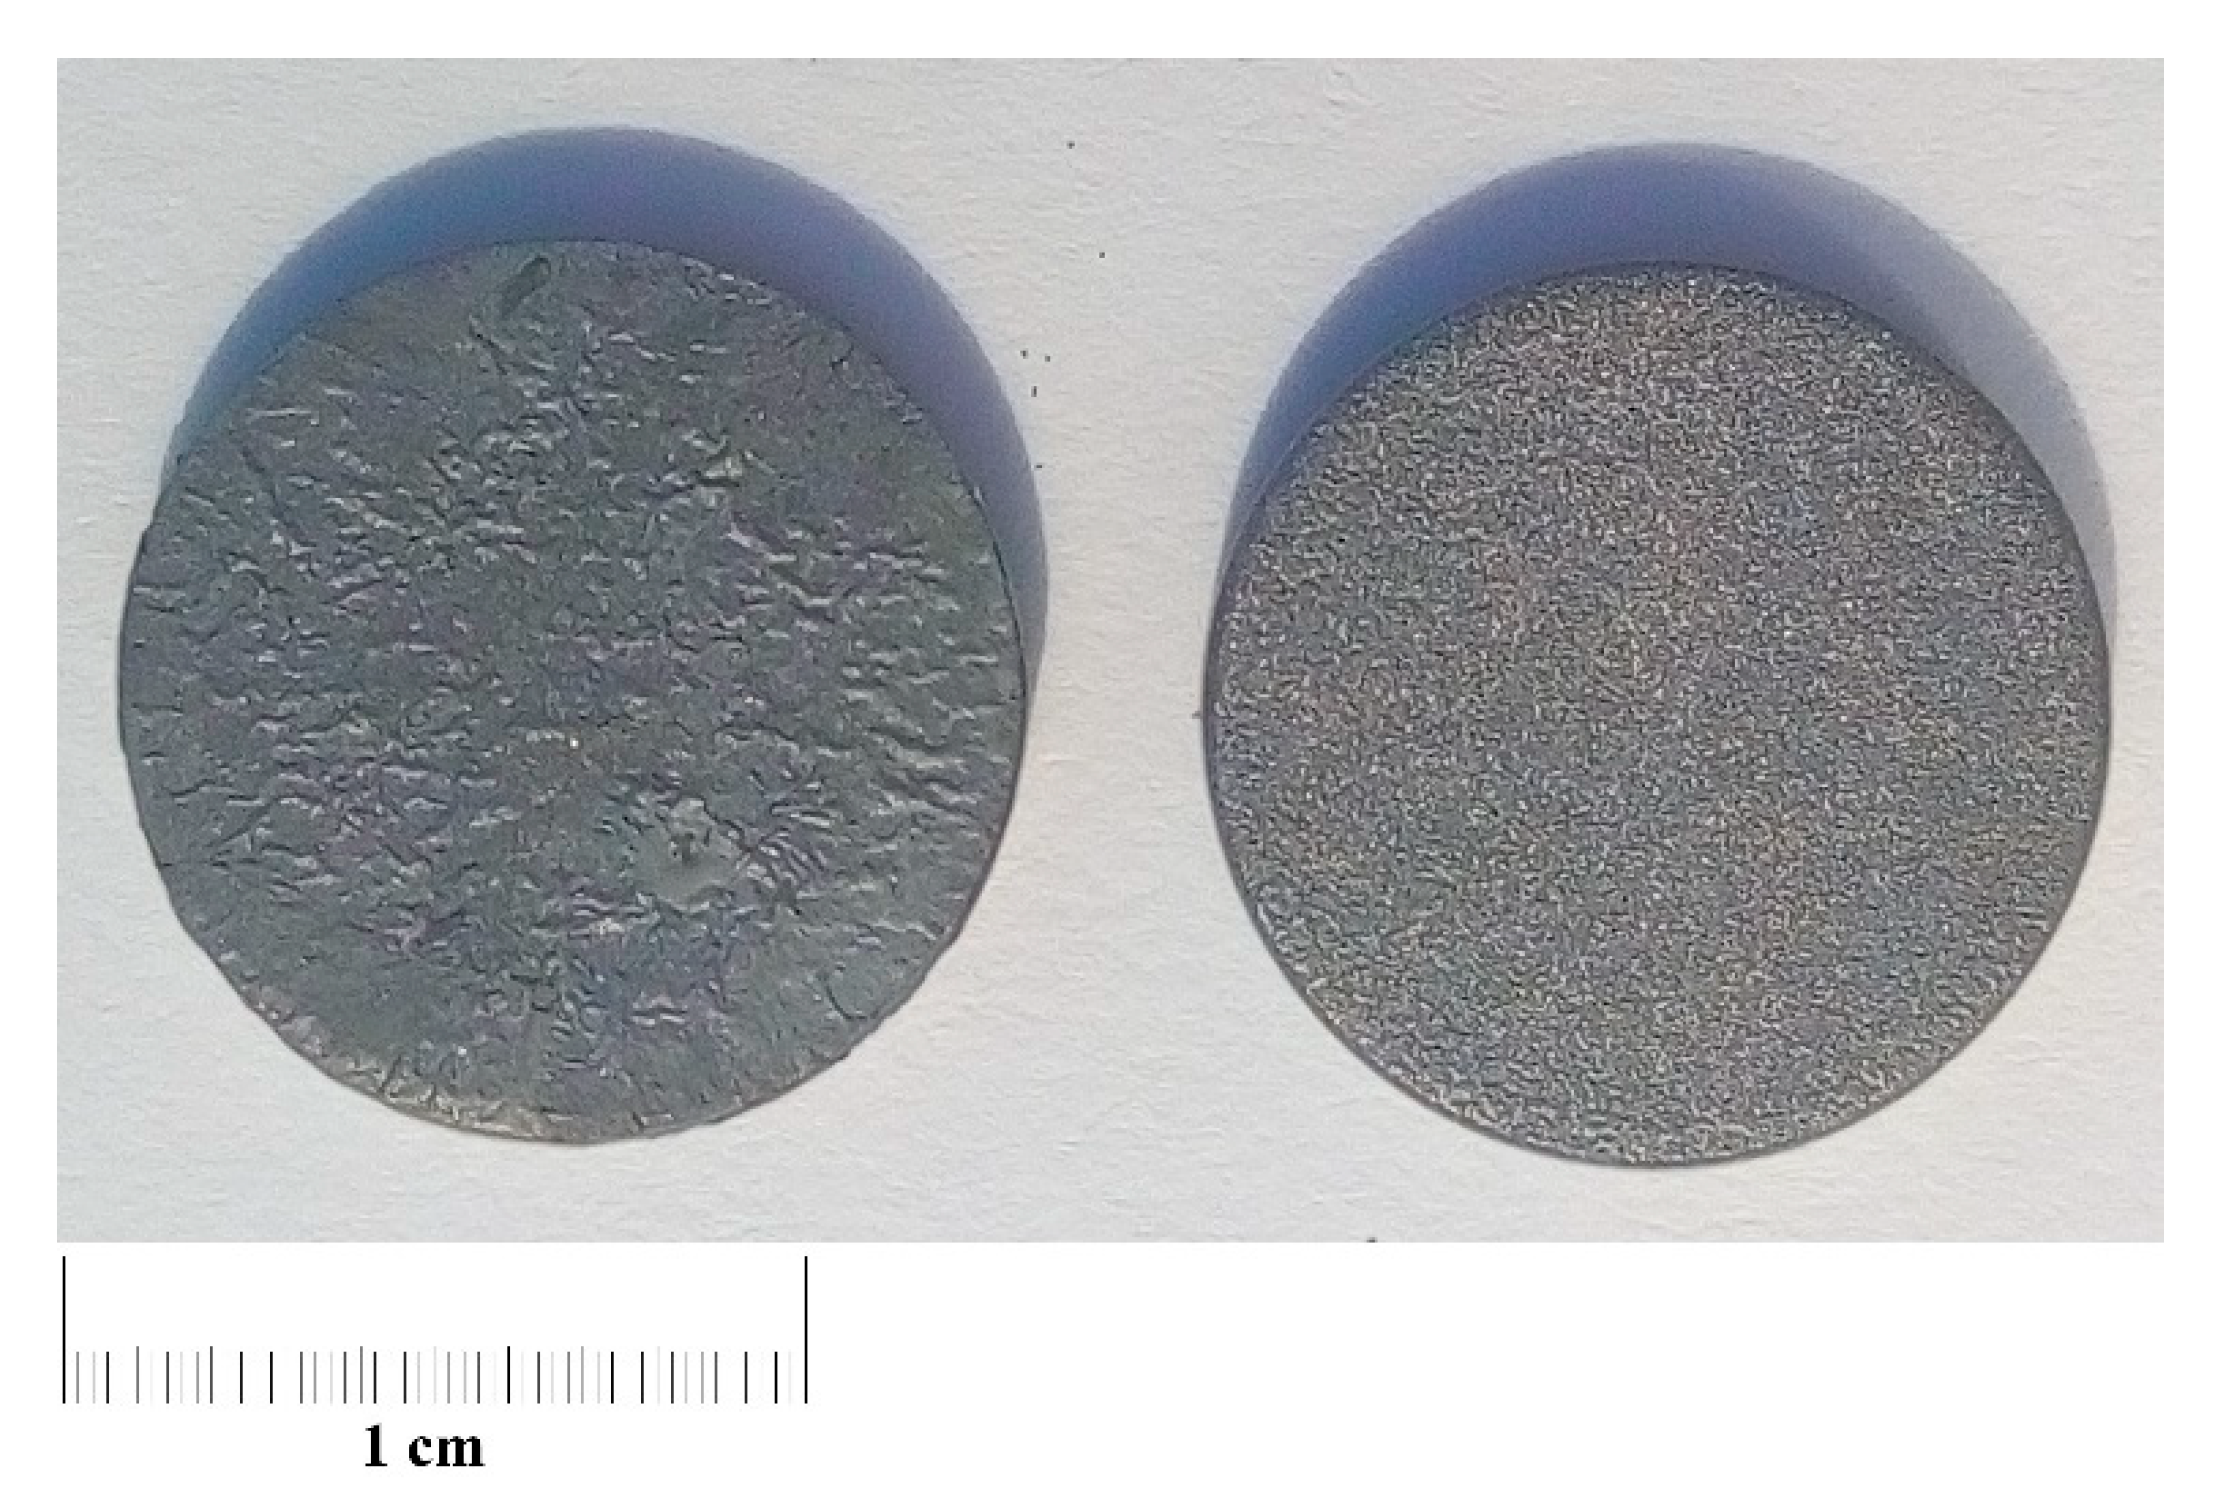
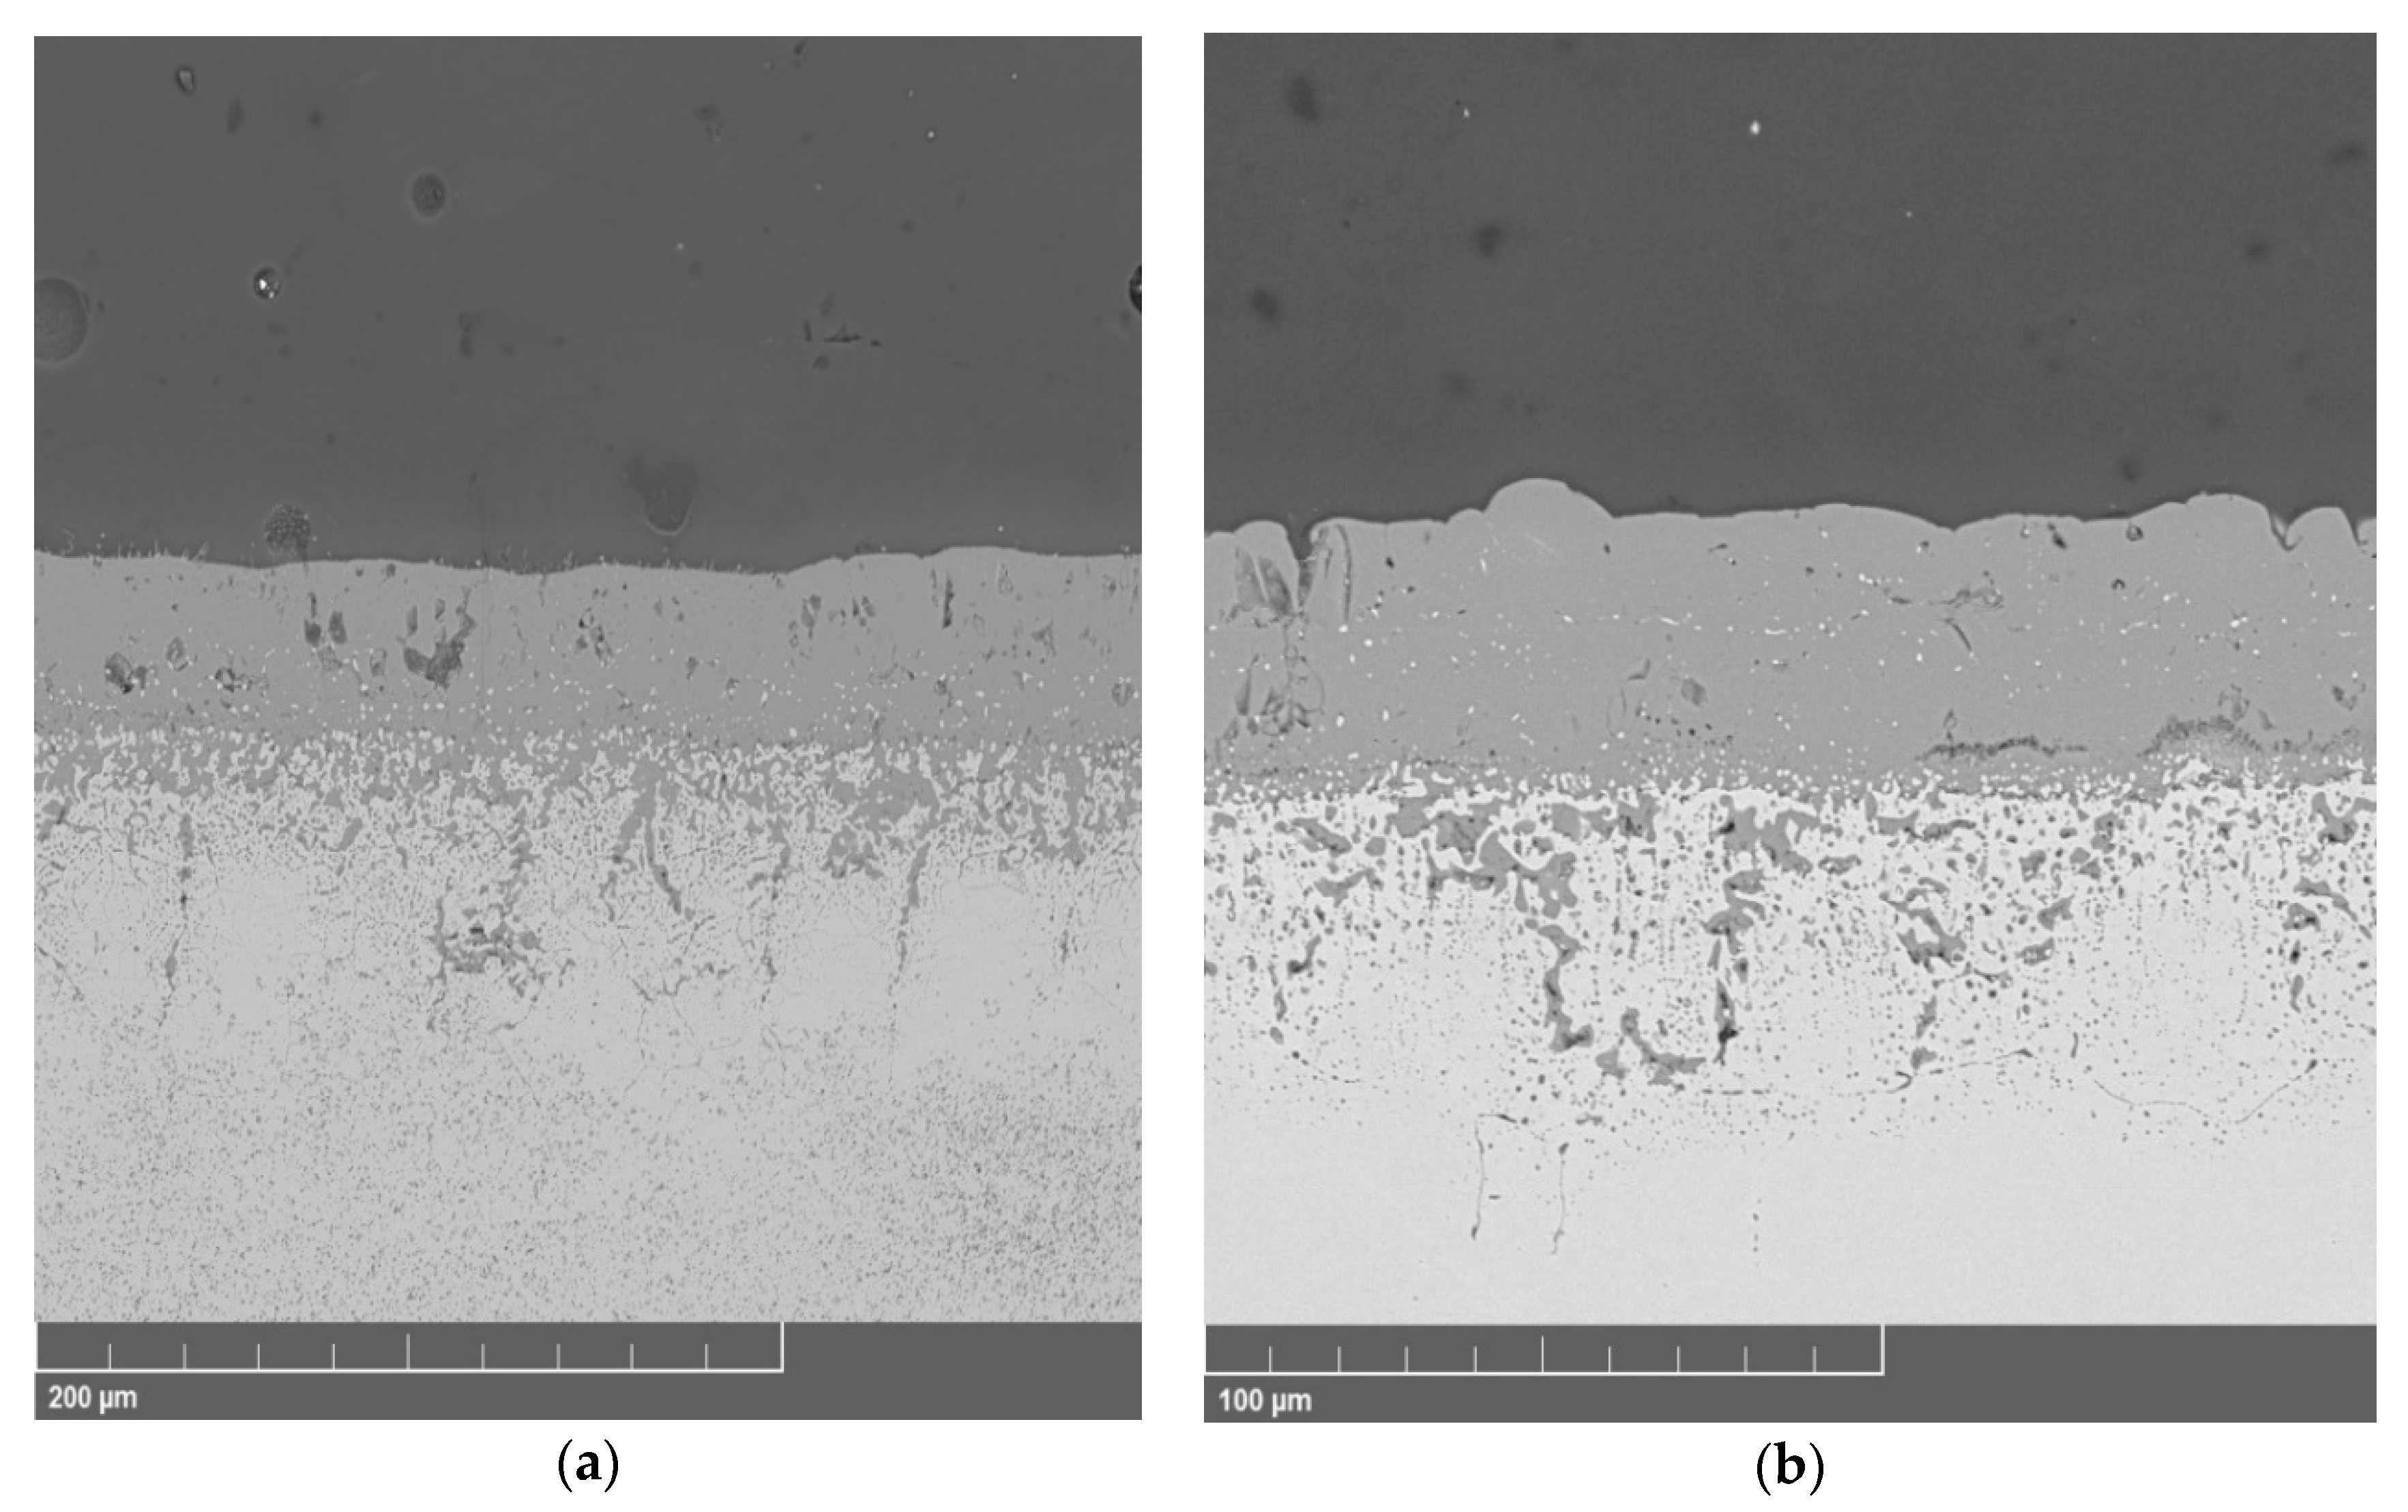
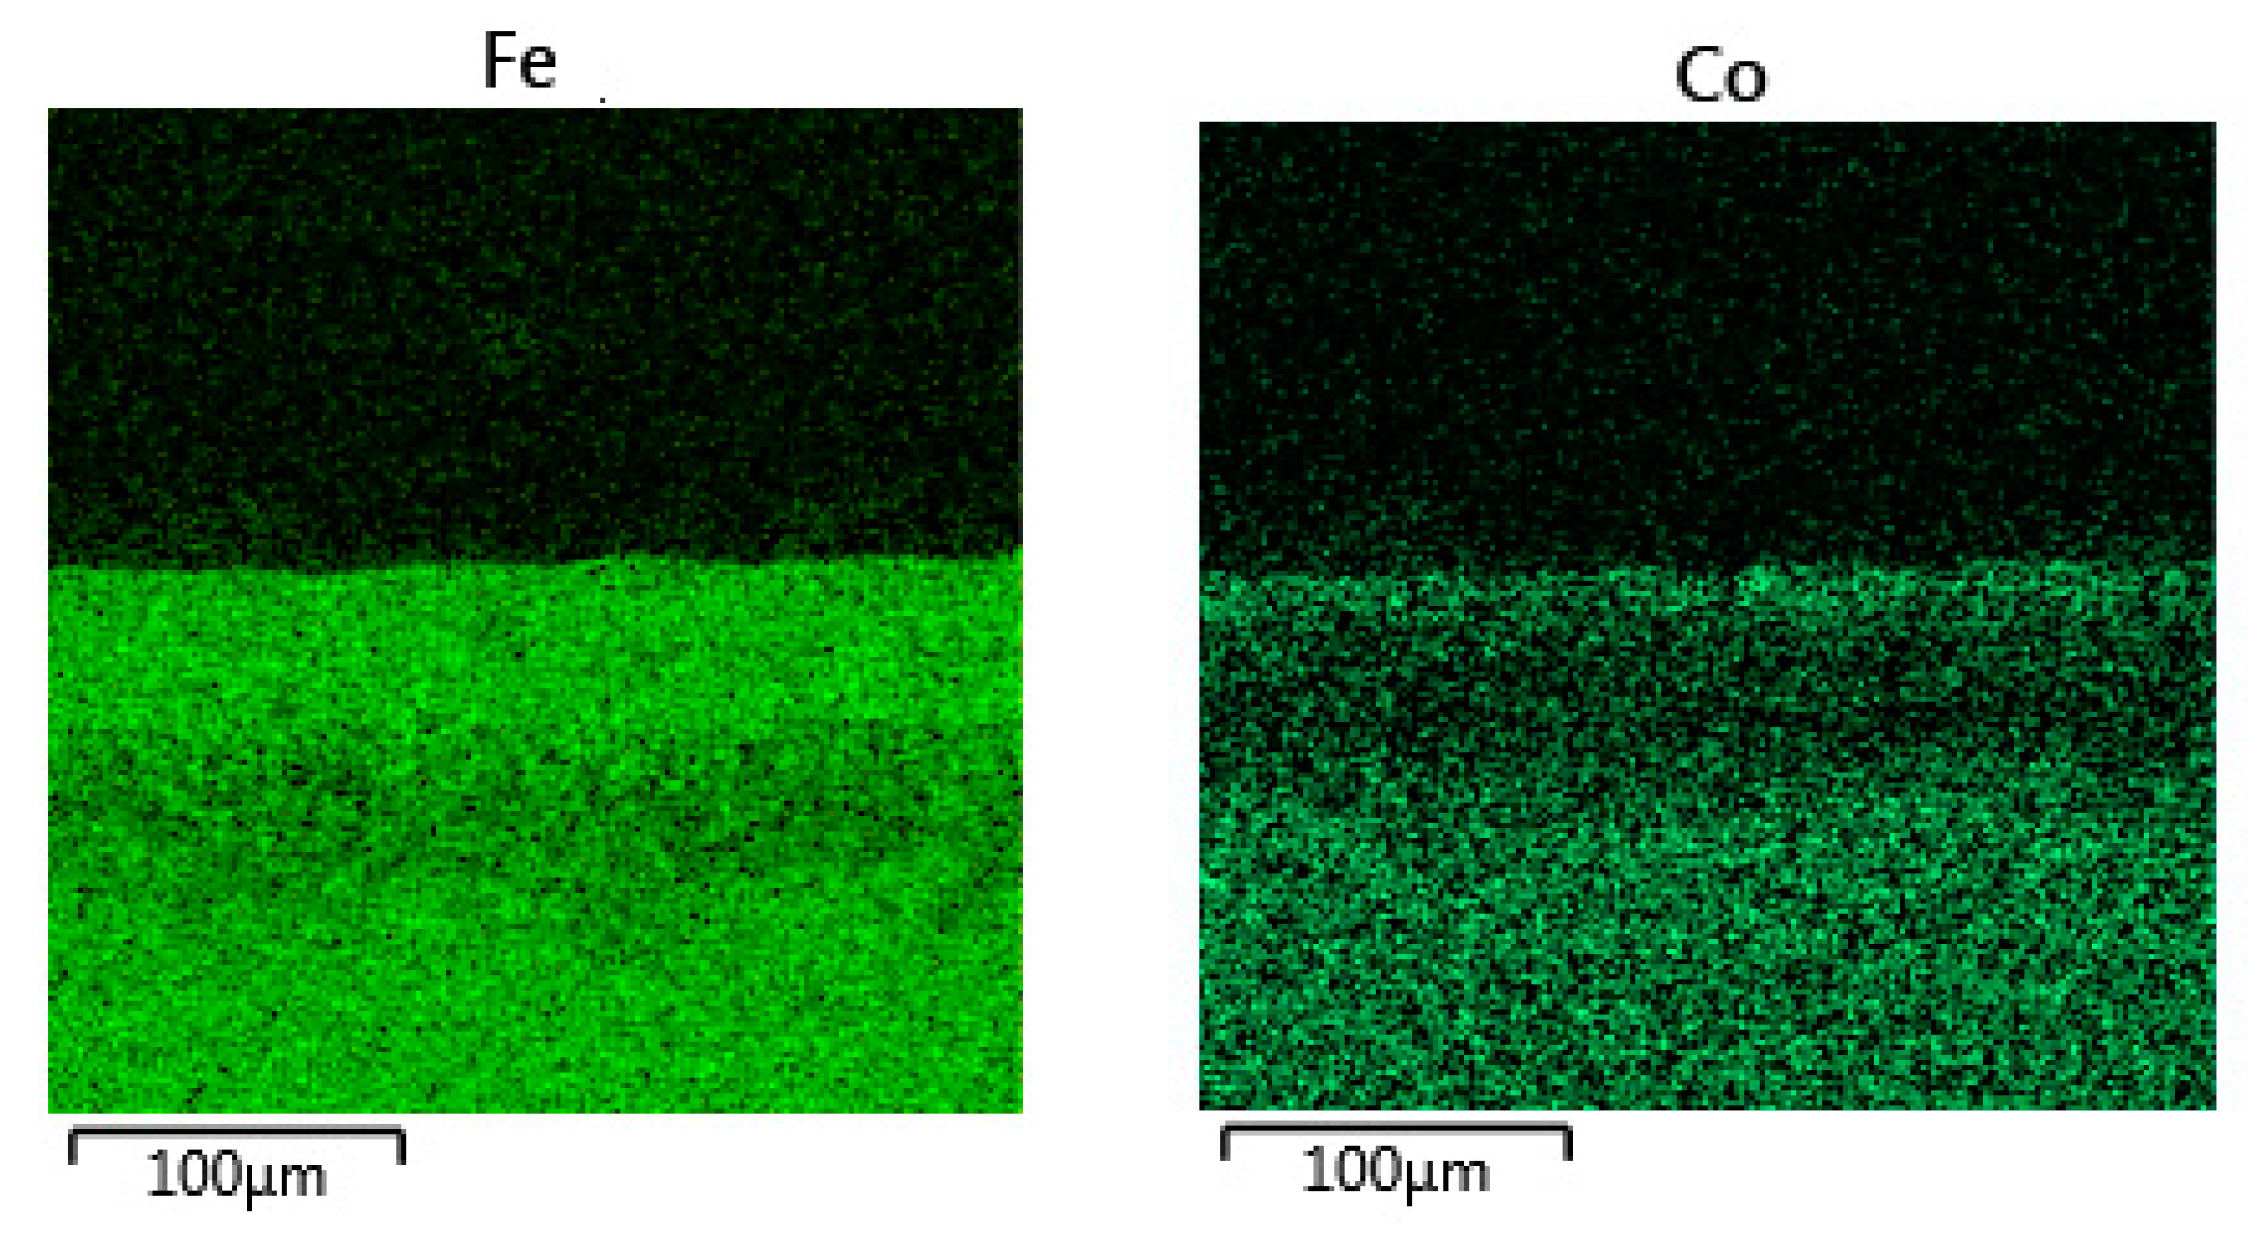
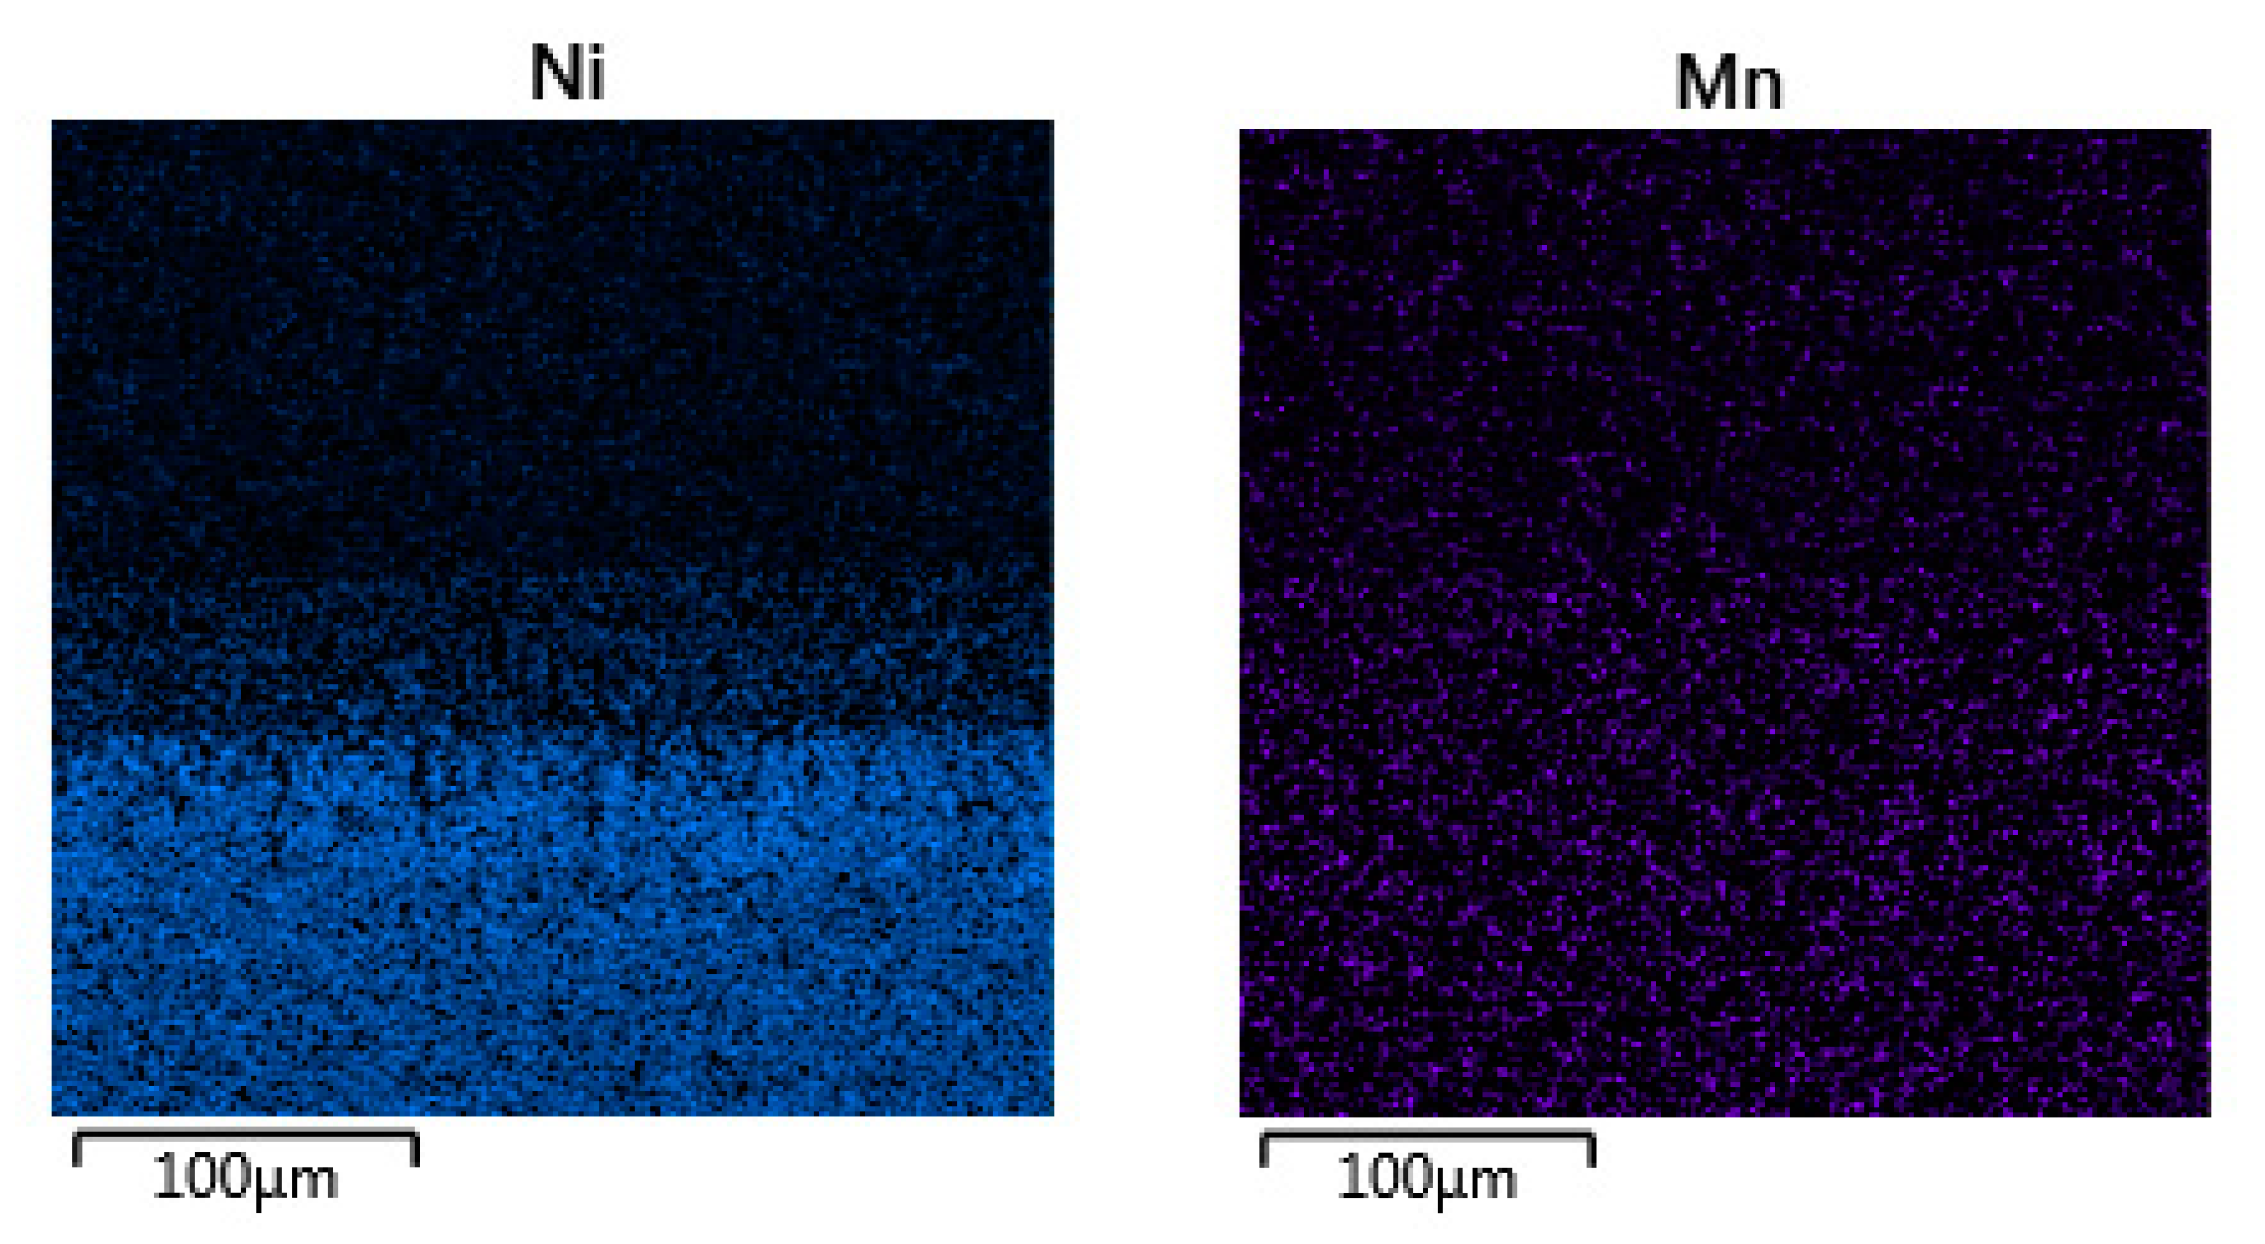
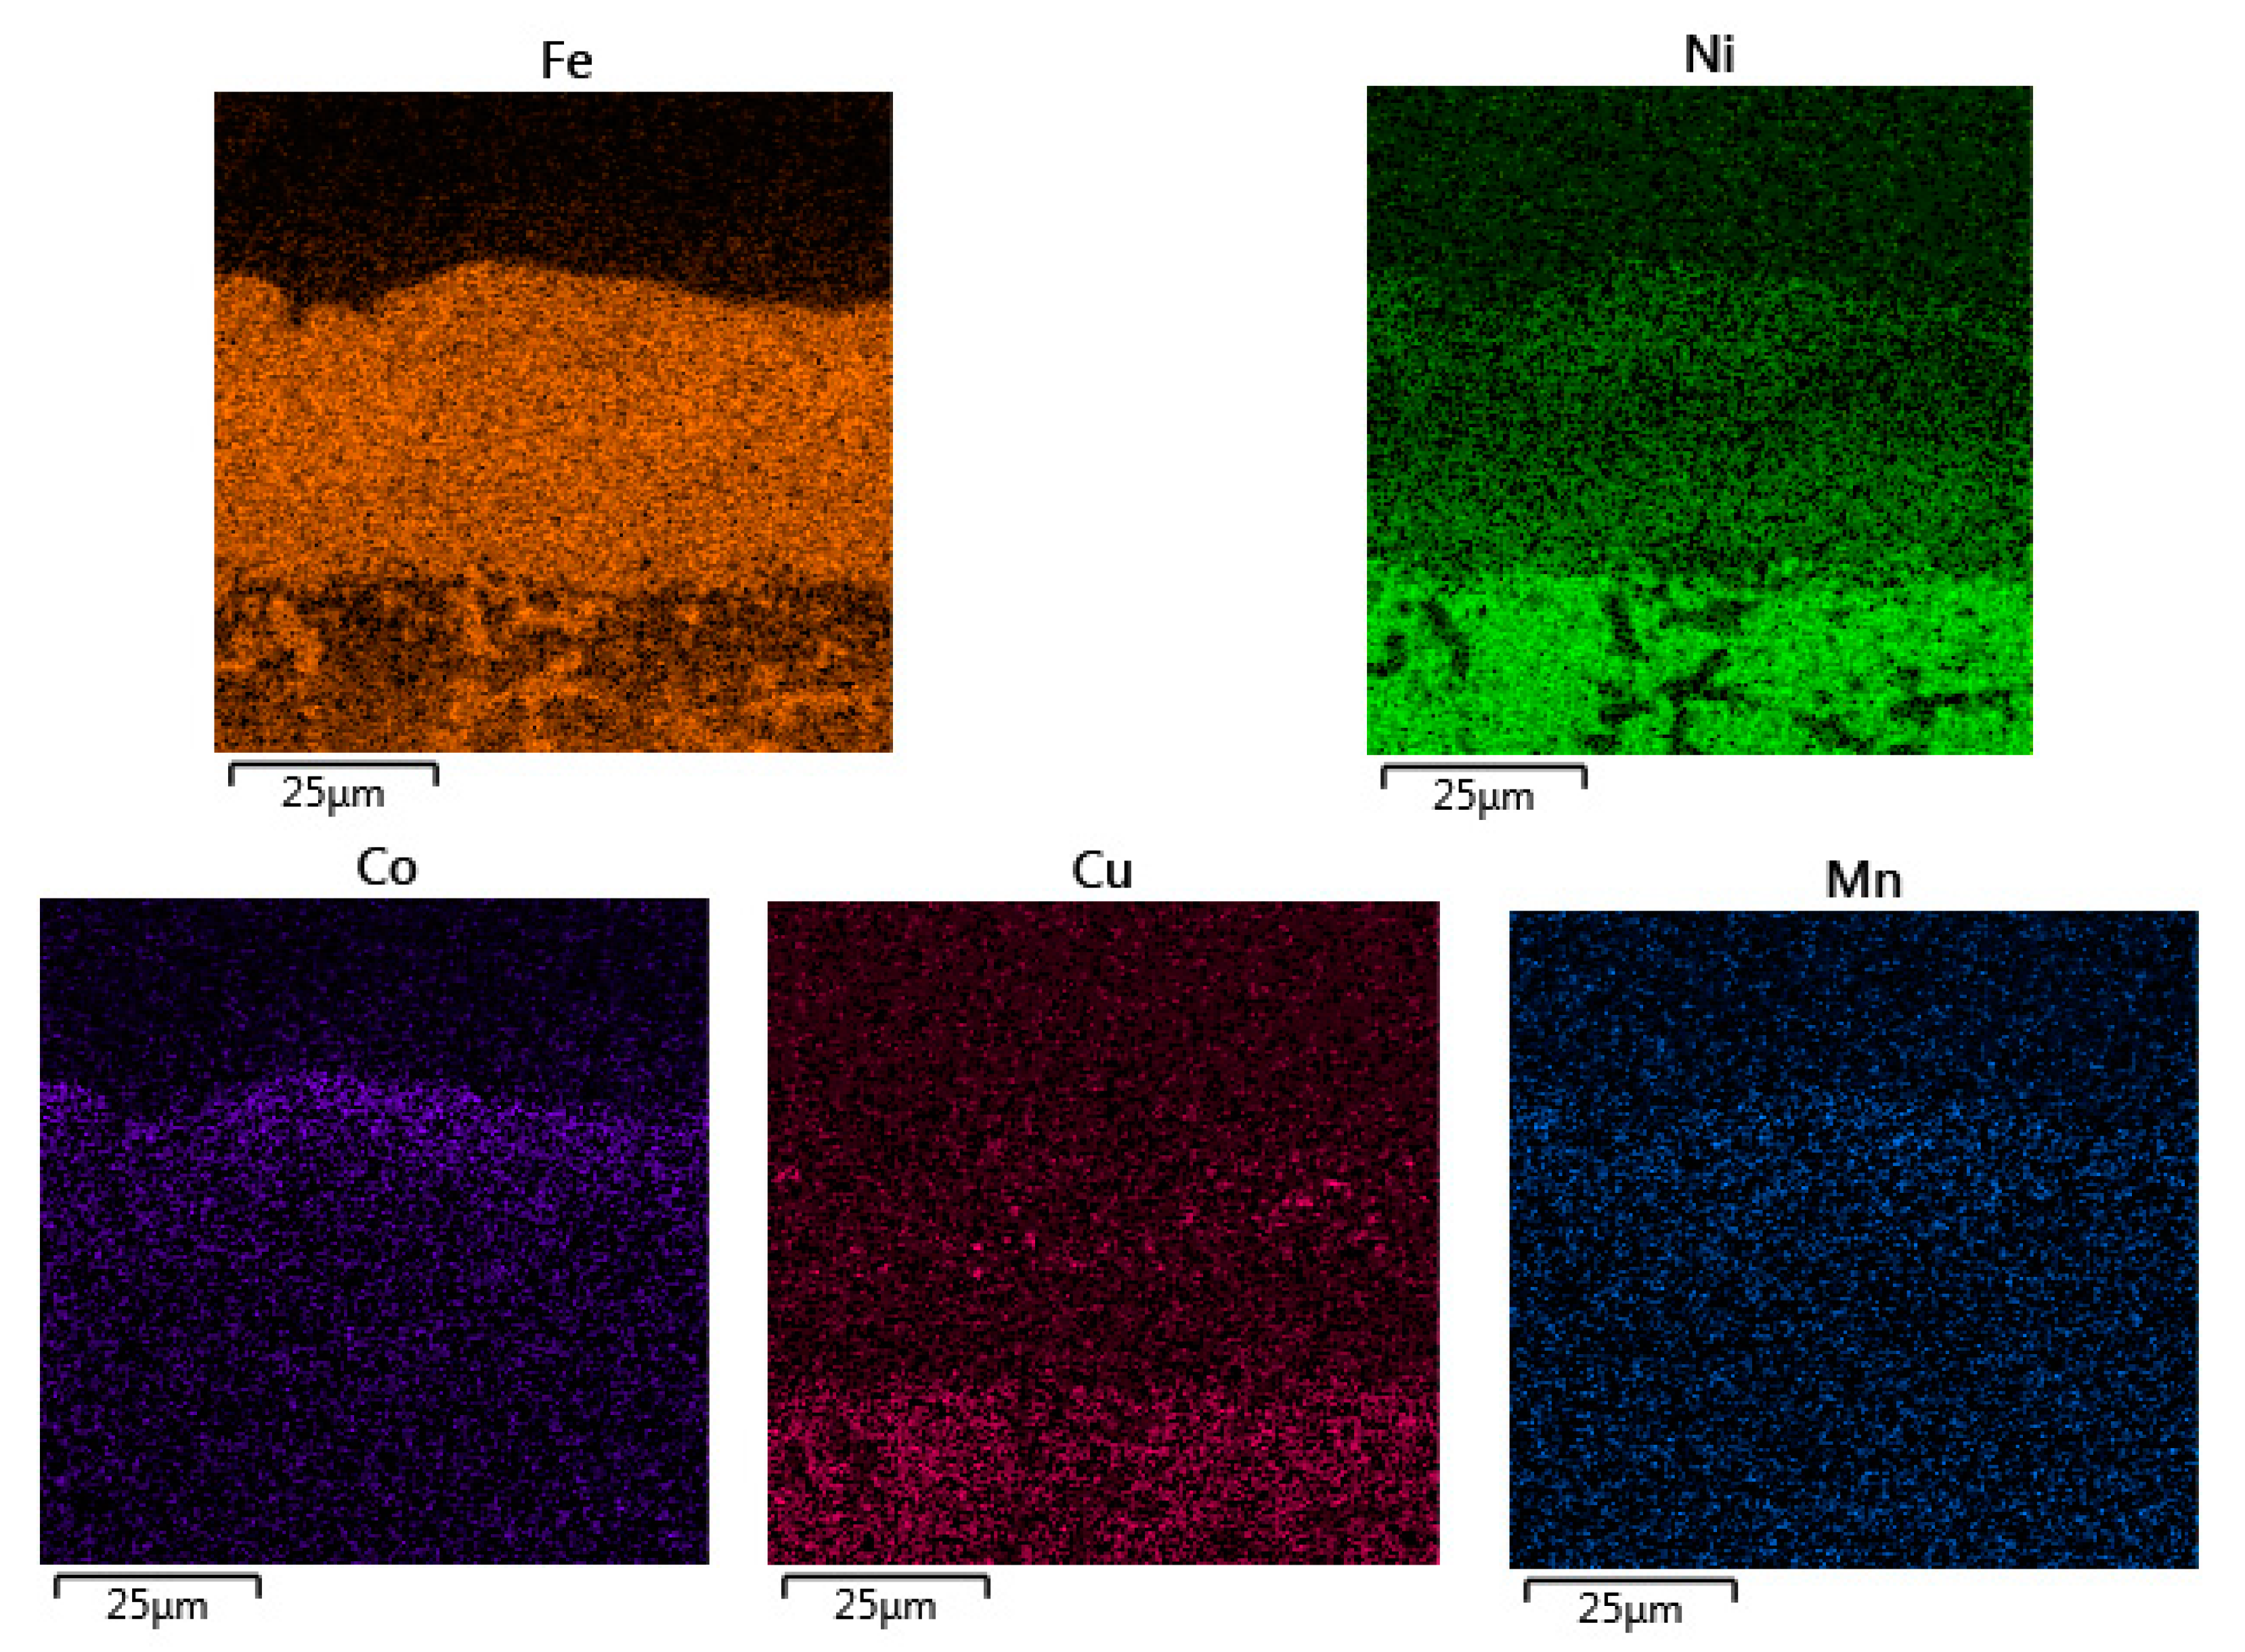
3.2. Microstructure of the Oxide Scales
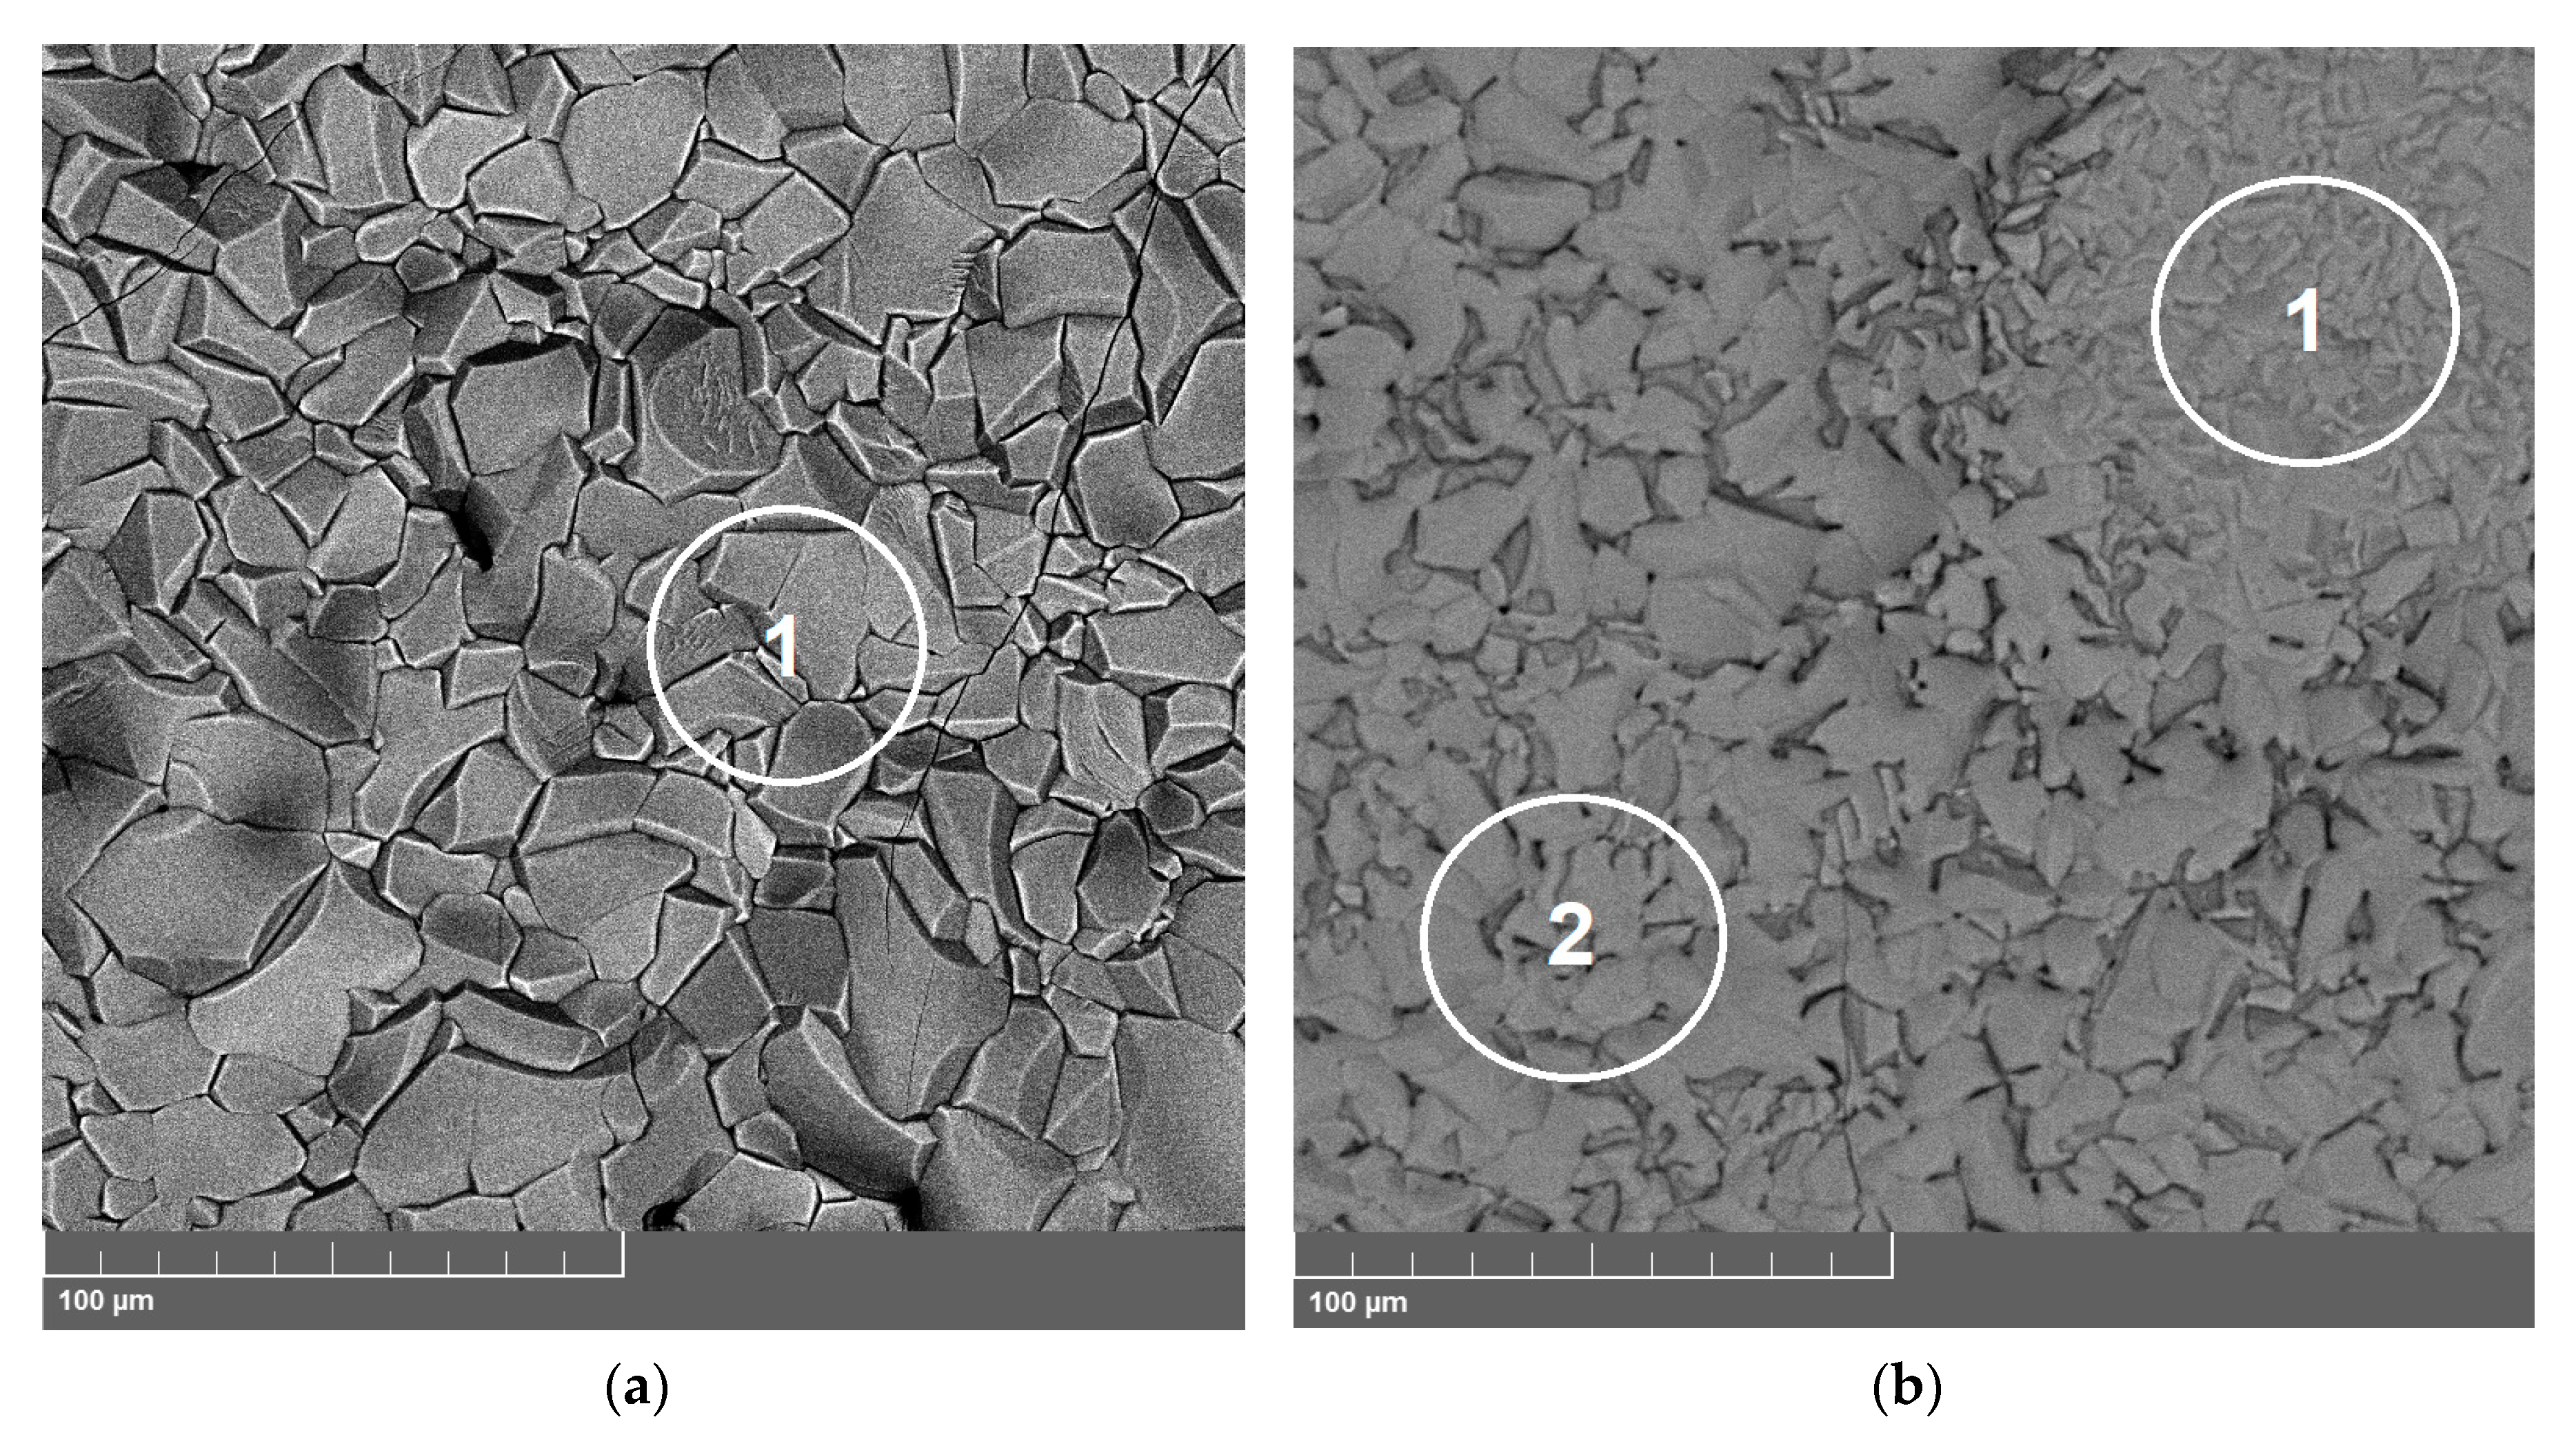
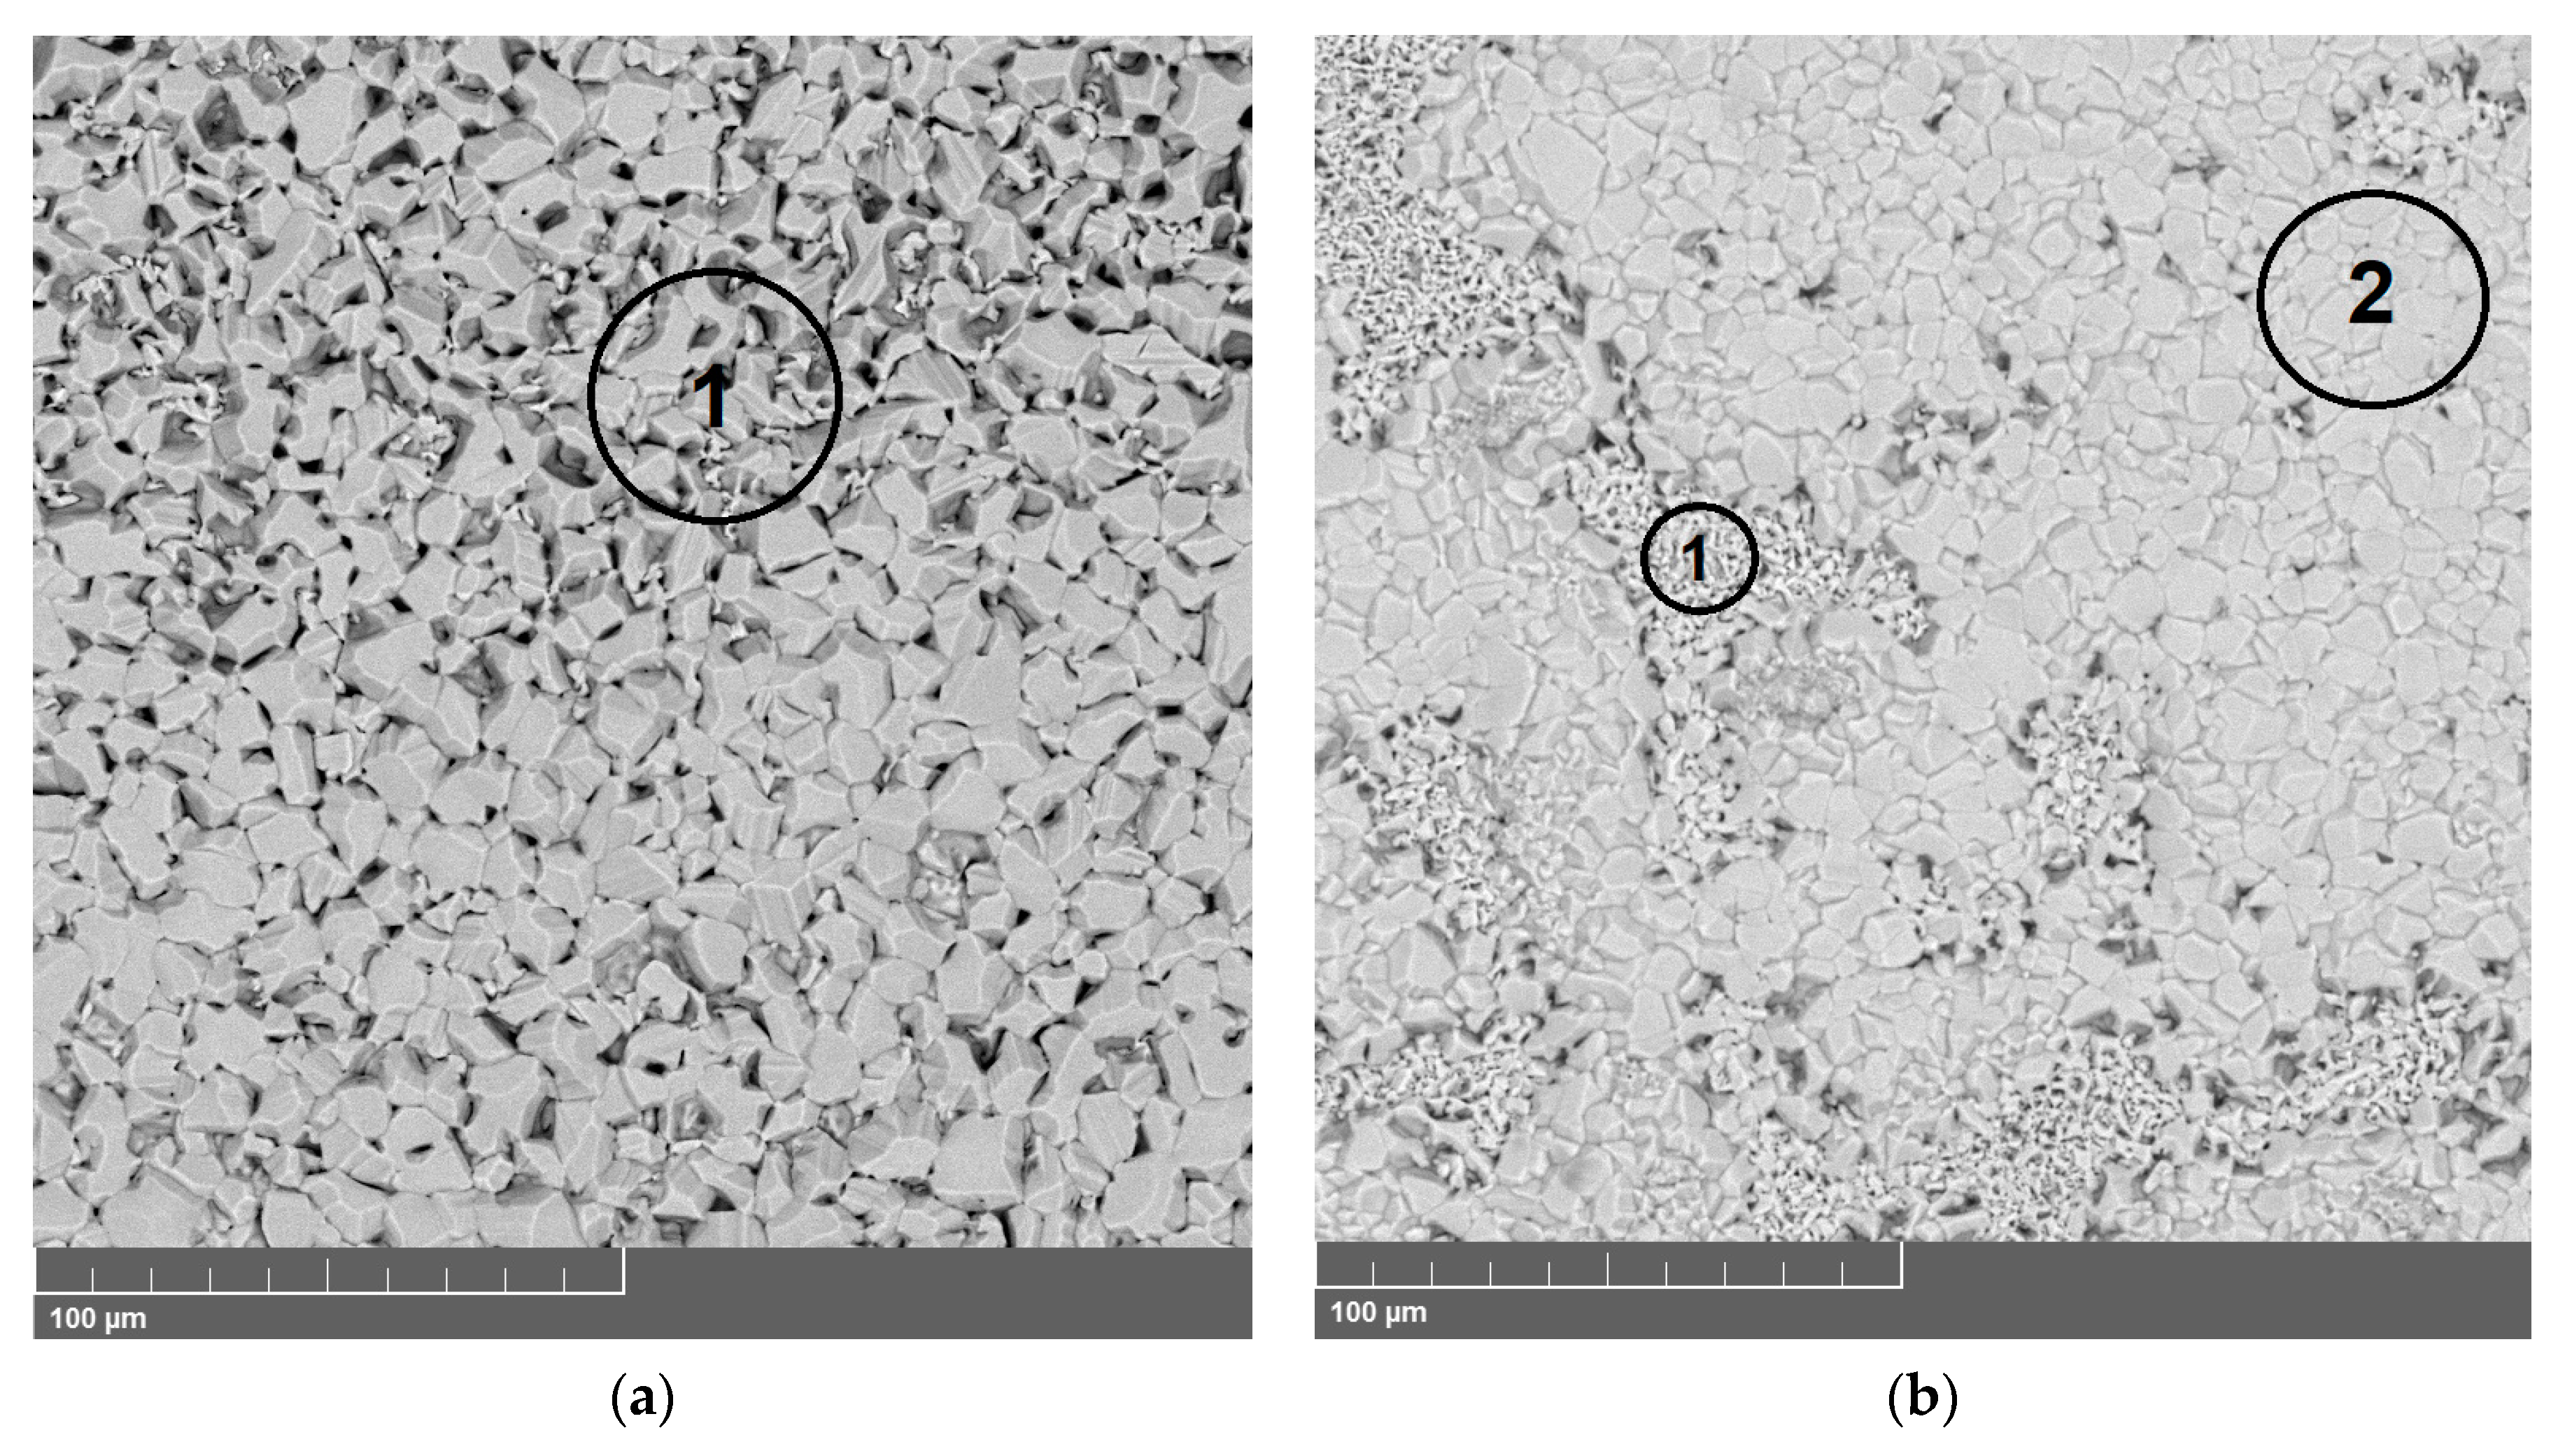
3.2.1. 33NK Alloy

The photos of the 33NK samples without and with surface modification are shown in Figure 4.
It is seen from Figure 4 that the view of the oxide scales differed significantly. The oxide scale without surface modification was extremely non-uniform in relief, which can cause additional mechanical stress when gluing samples with such a coating with glass sealants and/or during long-term tests. The oxide scale with modification was uniform in relief. Therefore, the gluing presented in this work was performed specifically with such samples. SEM images of the 33NK samples without modification (a) and with modification (b) are presented in Figure 5. It can be observed that the microstructure of the oxide scales was significantly different from each other.
The oxide scale without modification was characterized by coarser, more sharply marked features of the grains shape, as well as by the presence of pronounced cracks, while for the modified oxide scale, the grain boundaries had a smoother transition, and the oxide scale was more continuous and had significantly less number of cracks. However, the modified oxide scale had a non-uniform structure at the microlevel. Nevertheless, the chemical compositions of the modified oxide scale sections that visually differ in the structure at the microlevel were close to each other. The nominal composition of the alloy, as well as the chemical composition of the oxide scales from Figure 5, are presented in Table 3.
Considering the data in Table 3, it follows that the nonmodified and modified oxide scales did not have considerable differences in chemical composition. It can be concluded that these sections did not have a significant phase difference, the difference being in grain sizes, the formation process of which is rather difficult to control. The main difference in the oxide scales without modification and with surface modification was the structure at the macro- and microlevels.

3.2.2. 47ND Alloy

The photos of the 47ND samples without and with surface modification are given in Figure 6.
It is clear from Figure 6 that the view of the oxide scales was different. The oxide scale without surface modification was sufficiently uniform in color, which may indicate the homogeneous phase composition on the surface, while the oxide scale with modification was more dissimilar in color. However, both samples had a uniform relief of the oxide scales. The oxide scales of the 47ND alloy samples without modification (a) and with modification (b) are shown in Figure 7. It can be seen that the microstructures of the oxide scales were significantly different from each other.
In the oxide scale without modification, the grains had clearly defined boundaries, creating a rough relief. The modified scale was composed of two structurally different sections, one of which had the large grains as in the oxide scale without modification, but with less rough relief, and the second was composed of relatively small grains. Both oxide scales were continuous, without visible cracks. The chemical compositions of the modified oxide scale sectors, visually differing in the structure at the microlevel, were not the same. The nominal composition of the alloy, as well as the chemical composition of the oxide scale from Figure 7, are presented in Table 4.
According to the data in Table 4, it follows that sections with finer grains had a significantly lower content of modifying metals, and the iron content remained at the level of the oxide scale without modification. On the other hand, these sections also had a lower content of nickel, and especially copper, compared to the oxide scale without modification. Thus, one can conclude that the phase composition of the oxide scale without modification differed from the phase composition of two groups of sections of the modified oxide scale, which, in turn, were also different from each other. Precisely, this difference likely affected the structure of grains and, consequently, their appearance.

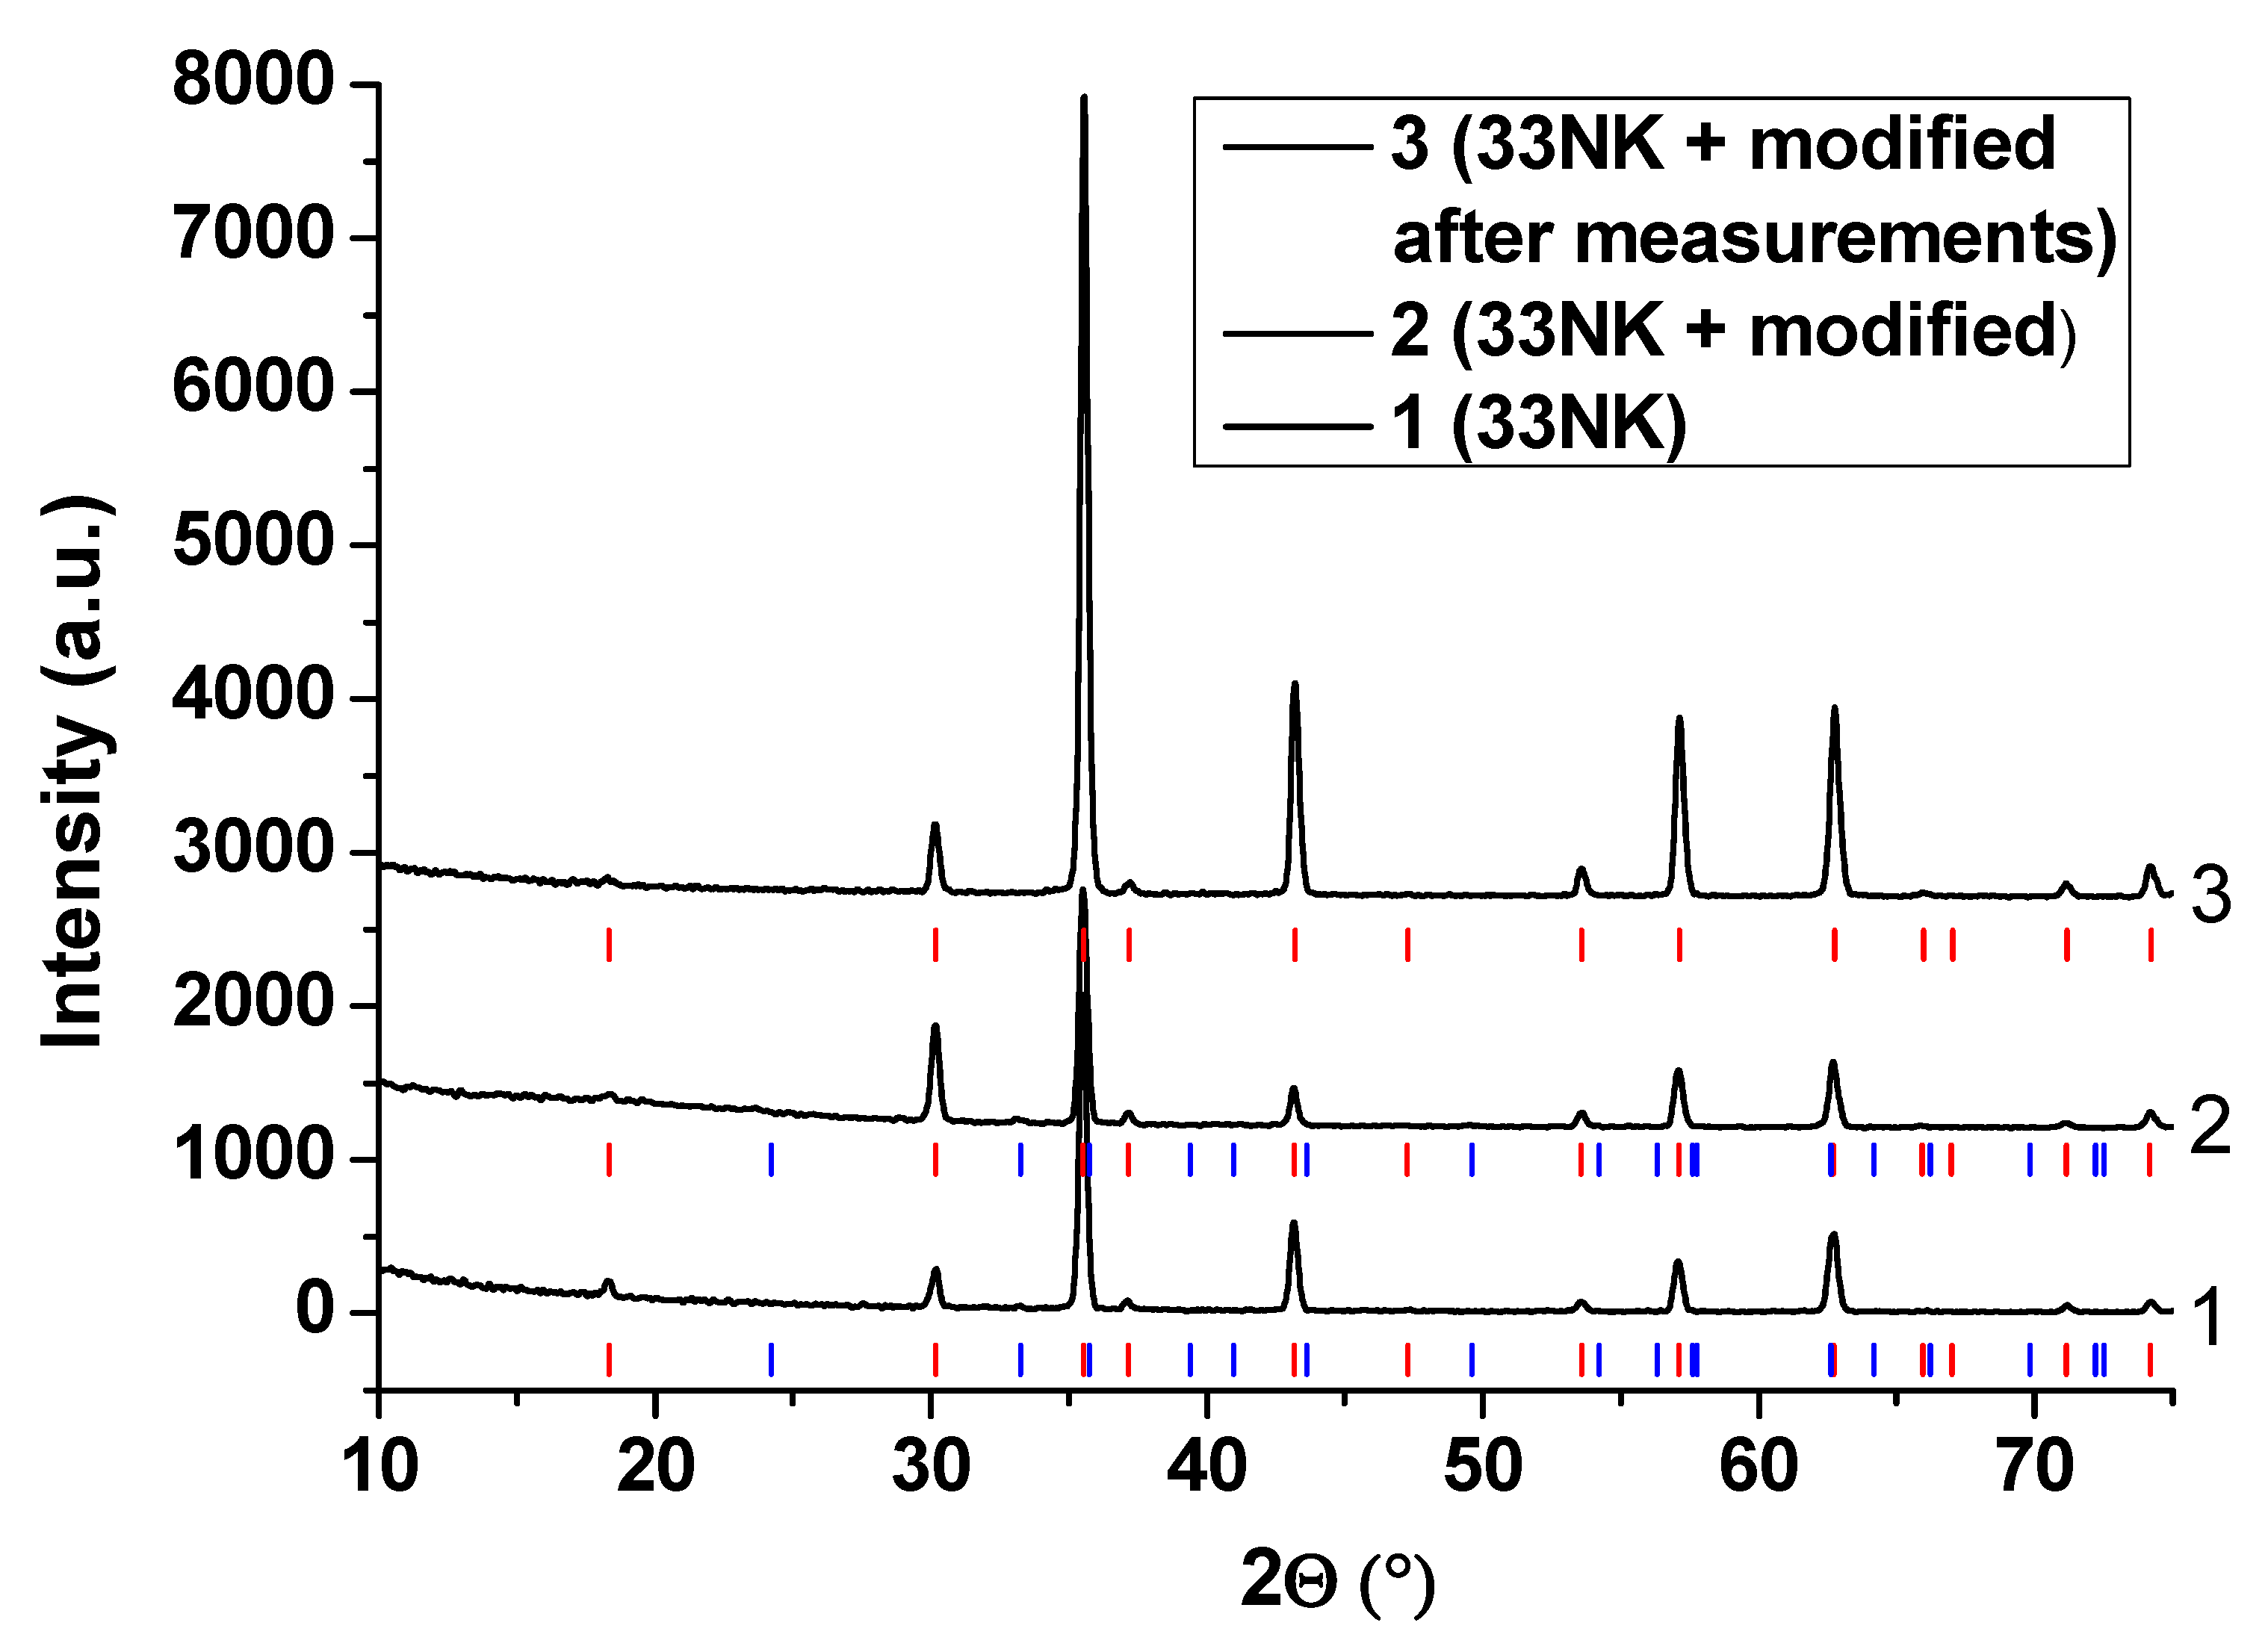
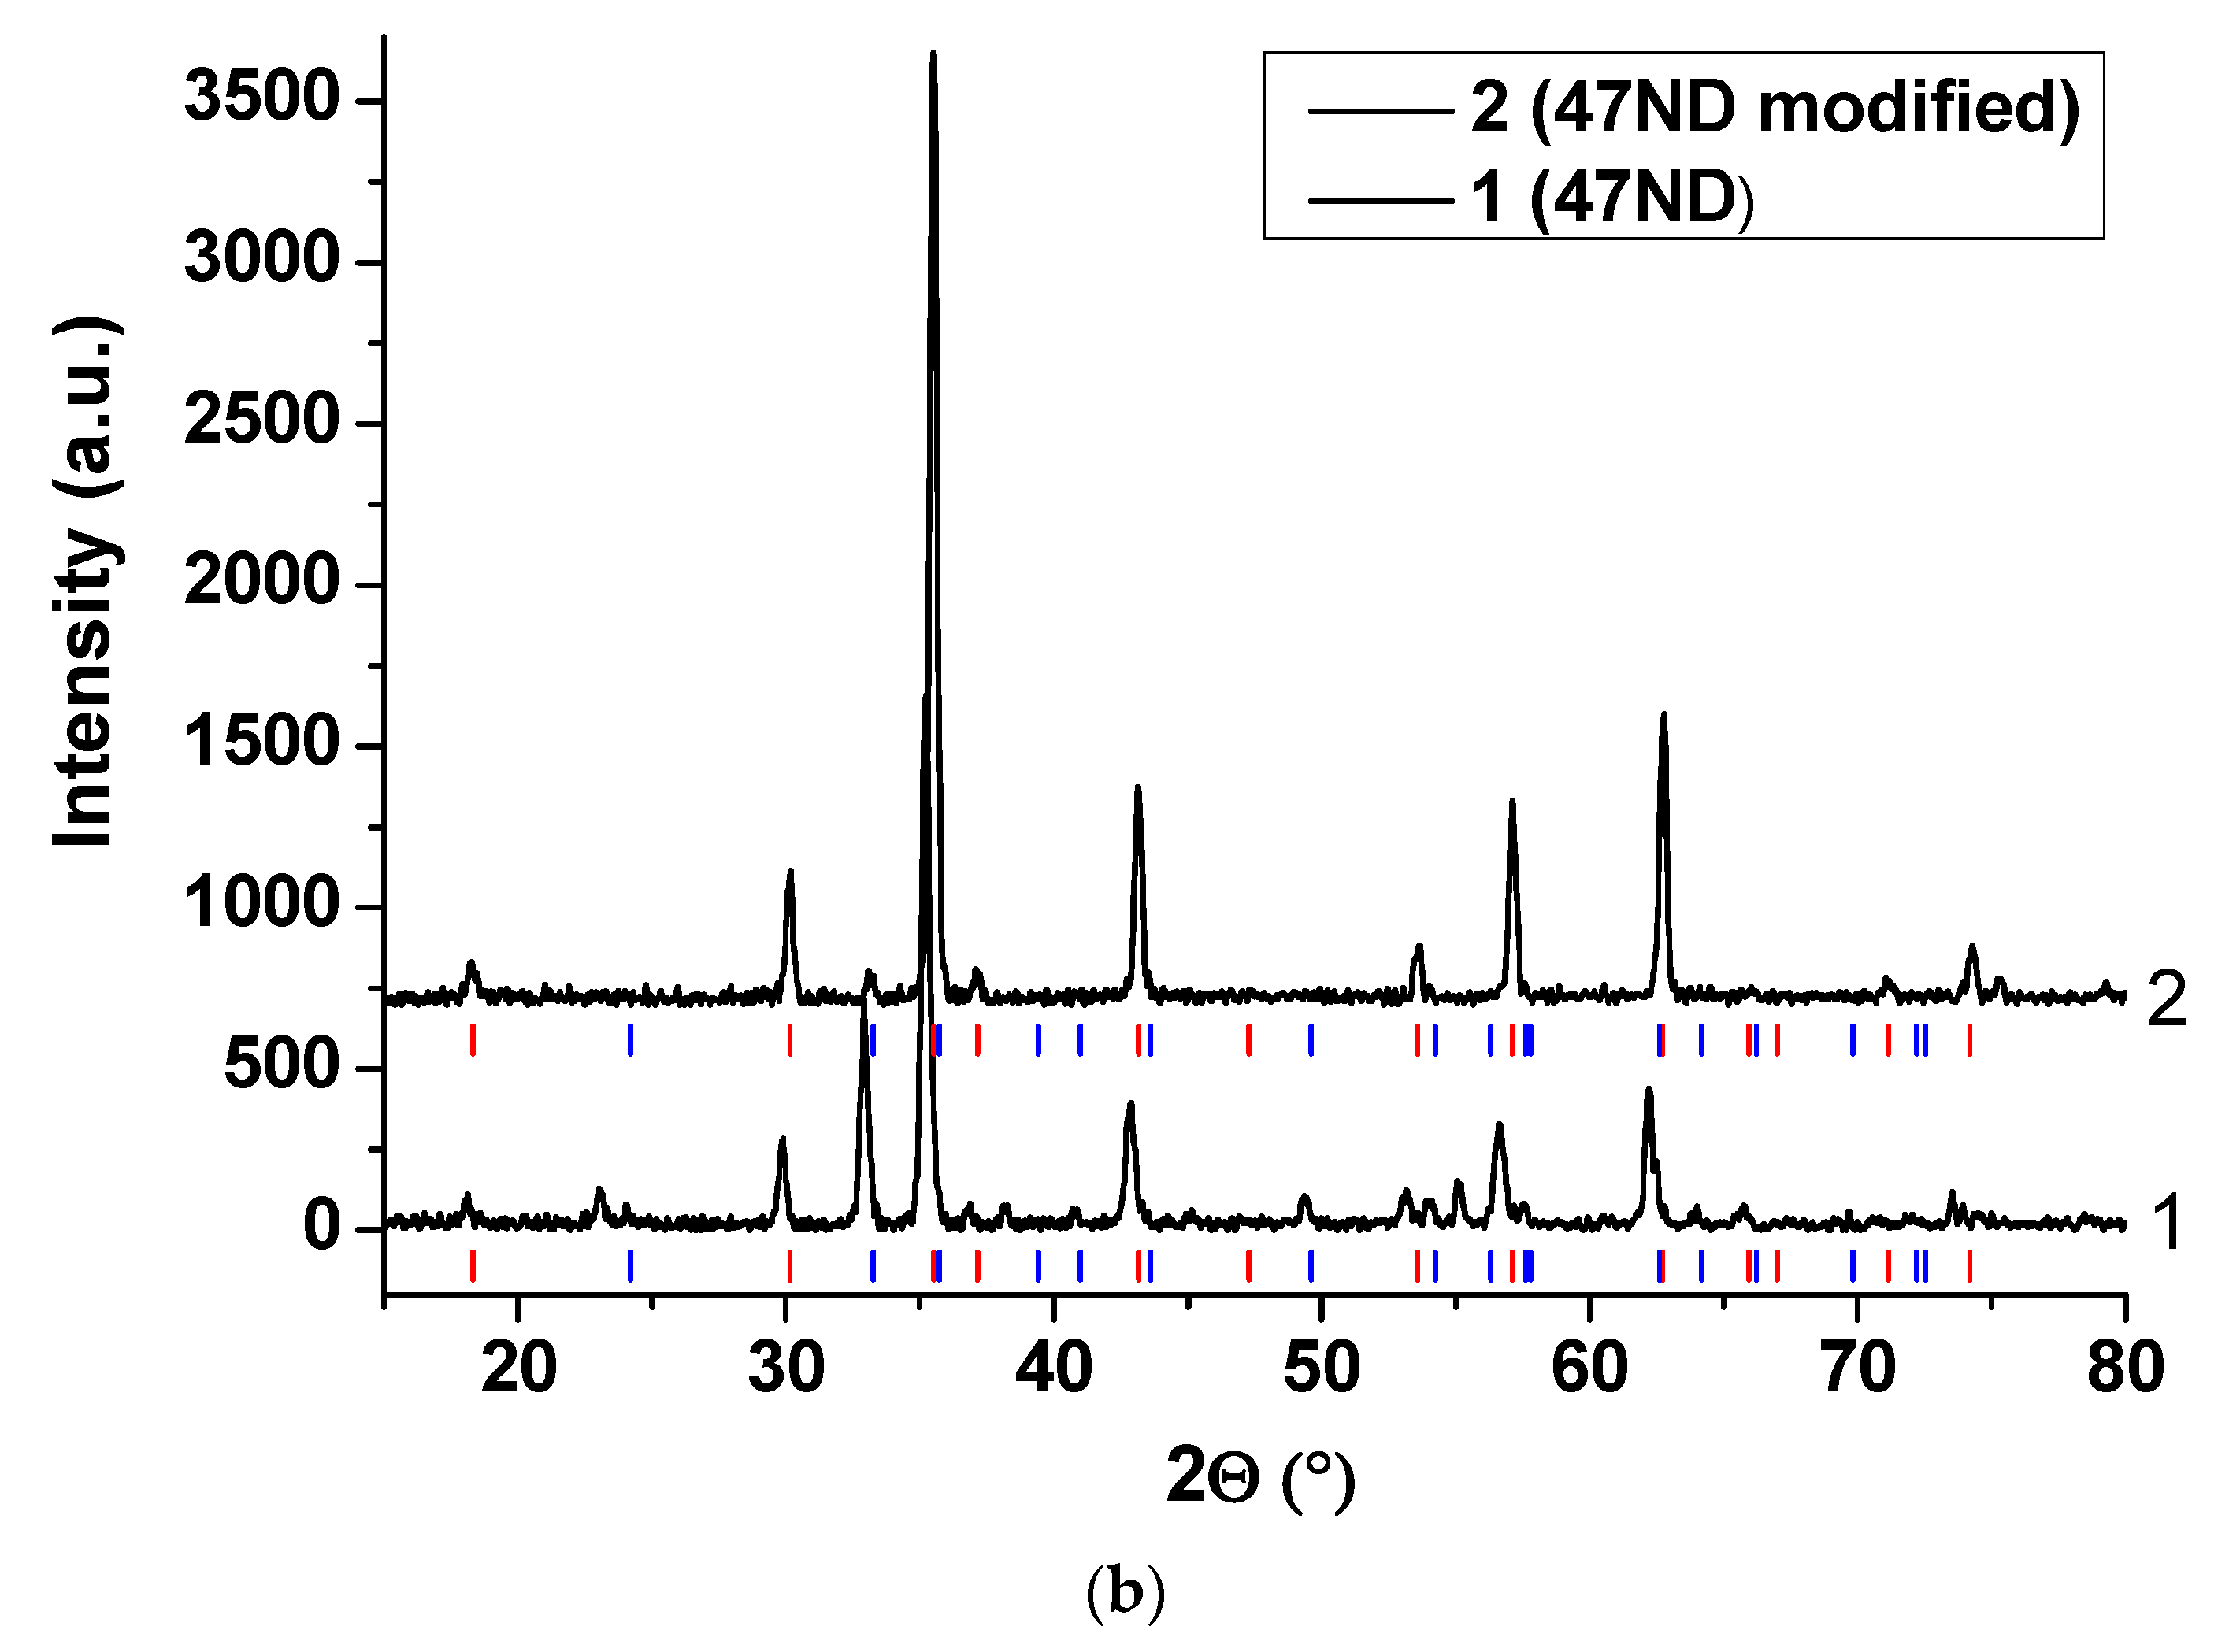
3.3. XRD Analysis of the Oxide Scales

3.3.1. 33NK Alloy

The grazing incidence XRD patterns of the oxide scales of the 33NK alloy without modification, with modification of the surface, and with modification after the electrical conductivity measurements are presented in Figure 8.
It is seen in Figure 8 that the XRD patterns for the samples without and with modification were the same in terms of the detected sets of interplanar spacings. However, there were differences in the shape of the XRD patterns: The peaks in the X-ray diffraction patterns corresponding to the presence of the spinel-like phases differed in absolute values and in relative ones values for the non-basic peaks in relation to the main ones. Thus, these two oxide scales were likely to differ in the qualitative and quantitative composition of the spinel-like phases in the set of the Fe, Co, Ni, and Mn, which was indirectly confirmed by the SEM images at the microlevel and the view of the oxide scales at the macrolevel. The various behavior of the samples with these oxide scales during the electrical conductivity measurement, described below, can be precisely associated with these structural differences. Moreover, a nonconductive Fe2O3 phase was presented in both oxide scales. However, after the electrical conductivity test, the Fe2O3 phase disappeared in both cases. We believe that the Fe2O3 phase reacted with the formation of the spinel-like phases, which favorably affected the electrical conductivity of the samples (see below).

3.3.2. 47ND Alloy

The grazing incidence XRD patterns of the 47ND alloy without and with surface modification before and after the conductivity measurements are presented in Figure 9.
It follows from Figure 9 that XRD patterns of oxide scales without modification and with modification were the same in terms of the detected sets of interplanar spacings before and after the conductivity measurements. However, there were differences in the shape of the XRD patterns: The peaks in the X-ray diffraction patterns corresponding to the presence of the spinel-like phases differed in absolute values and in relative values for the non-basic peaks in relation to the main ones. The difference is especially visible in the XRD patterns of the samples after the conductivity measurements. Thus, these two oxide scales were likely to differ in the qualitative and quantitative composition of the spinel-like phases within the set of the Fe, Co, Ni, Mn, and Cu, which was indirectly confirmed by the SEM images at the microlevel and the view of the oxide scales at the macrolevel. The various behaviors of the samples with these oxide scales during the electrical conductivity measurements, described below, can be precisely associated with these structural differences. Moreover, the nonconductive Fe2O3 phase was presented in both oxide scales. Nevertheless, after the electrical conductivity test, the amount of the Fe2O3 phase on the surface, according to the most intense peak after the main one, did not change significantly for the sample with modification. Meanwhile, its increase was noticeable for the sample without modification. We assume that the increase in the amount of the Fe2O3 phase for the sample without modification could cause the low values of electrical conductivity in comparison to the sample with modification.

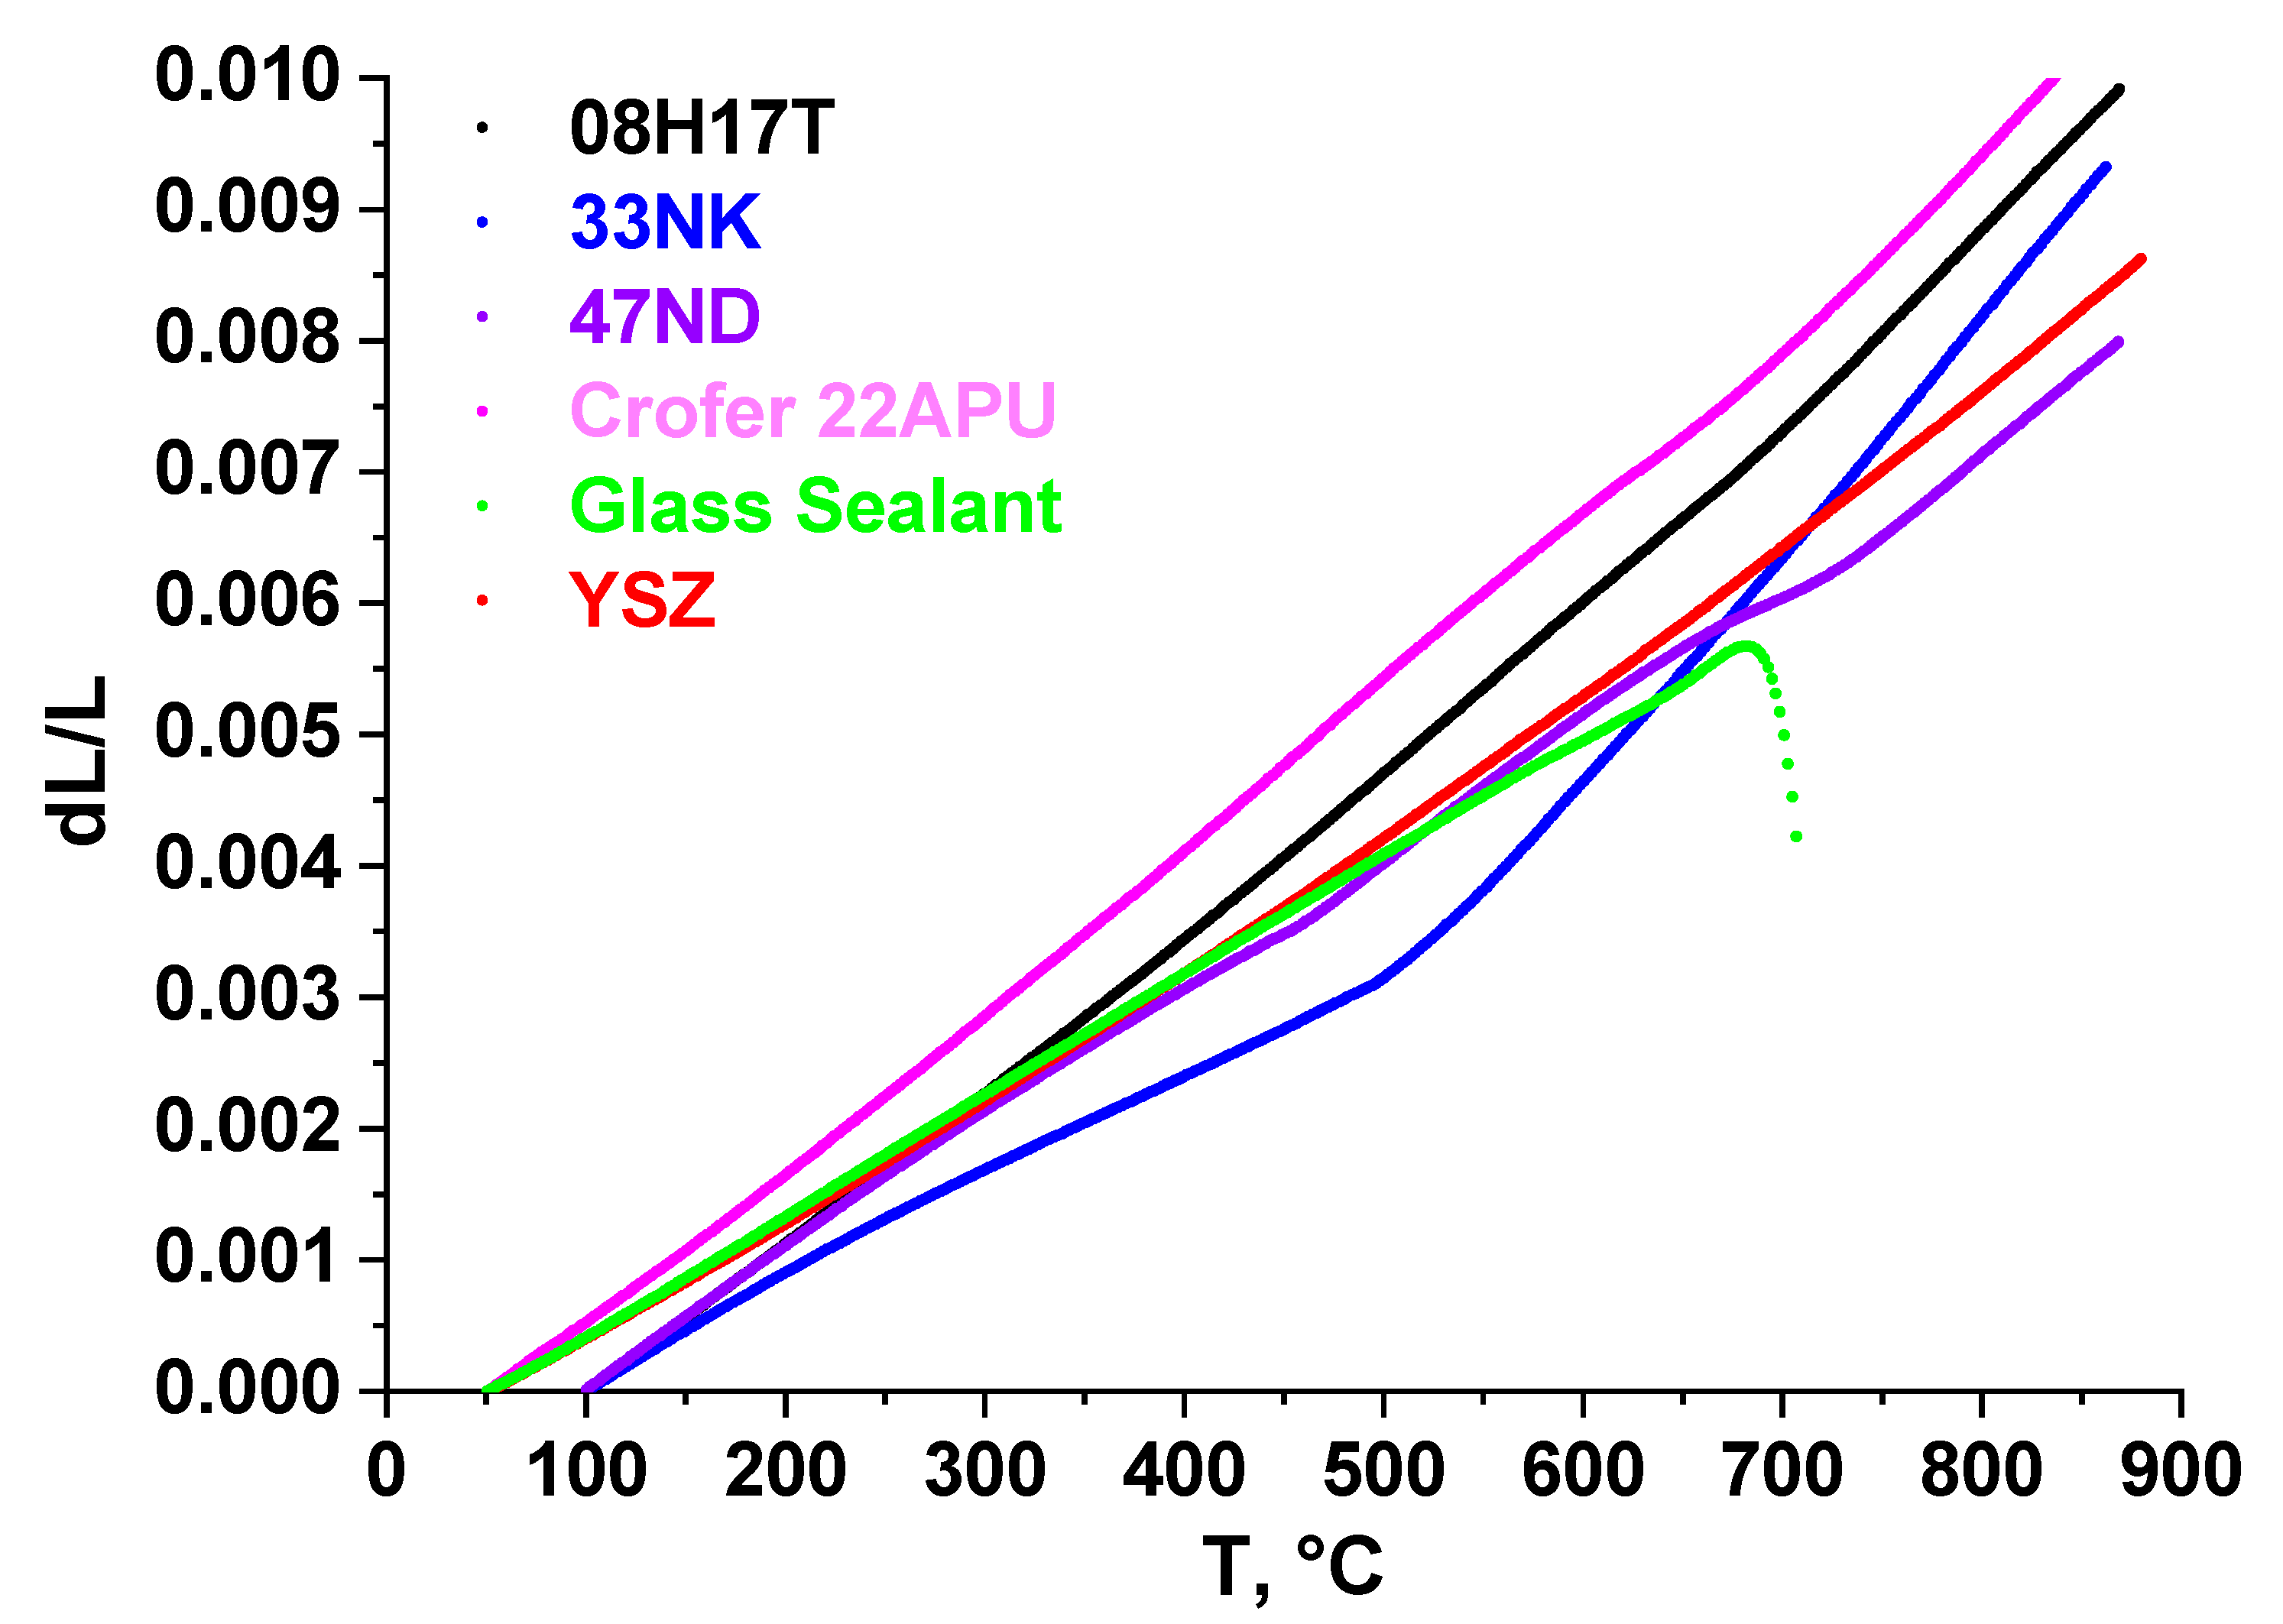
3.4. Compatibility of the Oxide Scales with the Glass Sealant

The compatibility of the modified oxide scales of the 33NK and 47ND alloys samples was studied in contact with the glass sealant.
From Figure 3, it follows that at temperatures as high as 500 °C, CTE of the 33NK alloy is acceptable for the manufacture of the corresponding gluing with the YSZ electrolyte through a glass sealant. However, a reversible phase transition on the 33NK steel is likely to be one of the reasons limiting the resource of using the 33NK steel grade during cycling.
One can also conclude from Figure 3 that the thermal behavior of the linear dimensions of the 47ND alloy is very close to the behavior of the glass sealant and especially to the behavior of the YSZ electrolyte in the entire temperature range studied. Thus, it can be expected that the gluing of these materials will be sufficiently strong and resistant to the heating-cooling cycles.
The SEM images of the contacts of the modified 33NK and 47ND alloys with glass sealant are given in Figure 10.
According to Figure 10a, the modified oxide scale of the 33NK alloy had good adhesion to the selected glass sealant. EDX mapping of the elements that make up the 33NK alloy and the solutions for the surface modification (Figure 11) show that the modified oxide scale was mainly composed of iron and cobalt, as well as a small amount of nickel and manganese. The same result was obtained when studying the surface composition (Table 3).
It is shown in Figure 10b that the modified oxide scale of the 47ND alloy had good adhesion to the chosen glass sealant. According to EDX mapping of the elements composed the 47ND alloy and the solutions for surface modification (Figure 12), the modified oxide scale was mainly composed of iron and, in the uppermost layer of the oxide scale, of cobalt, as well as a small amount of copper, nickel, and manganese. A similar result was obtained when studying the composition of one of two groups of surface regions (Table 4).

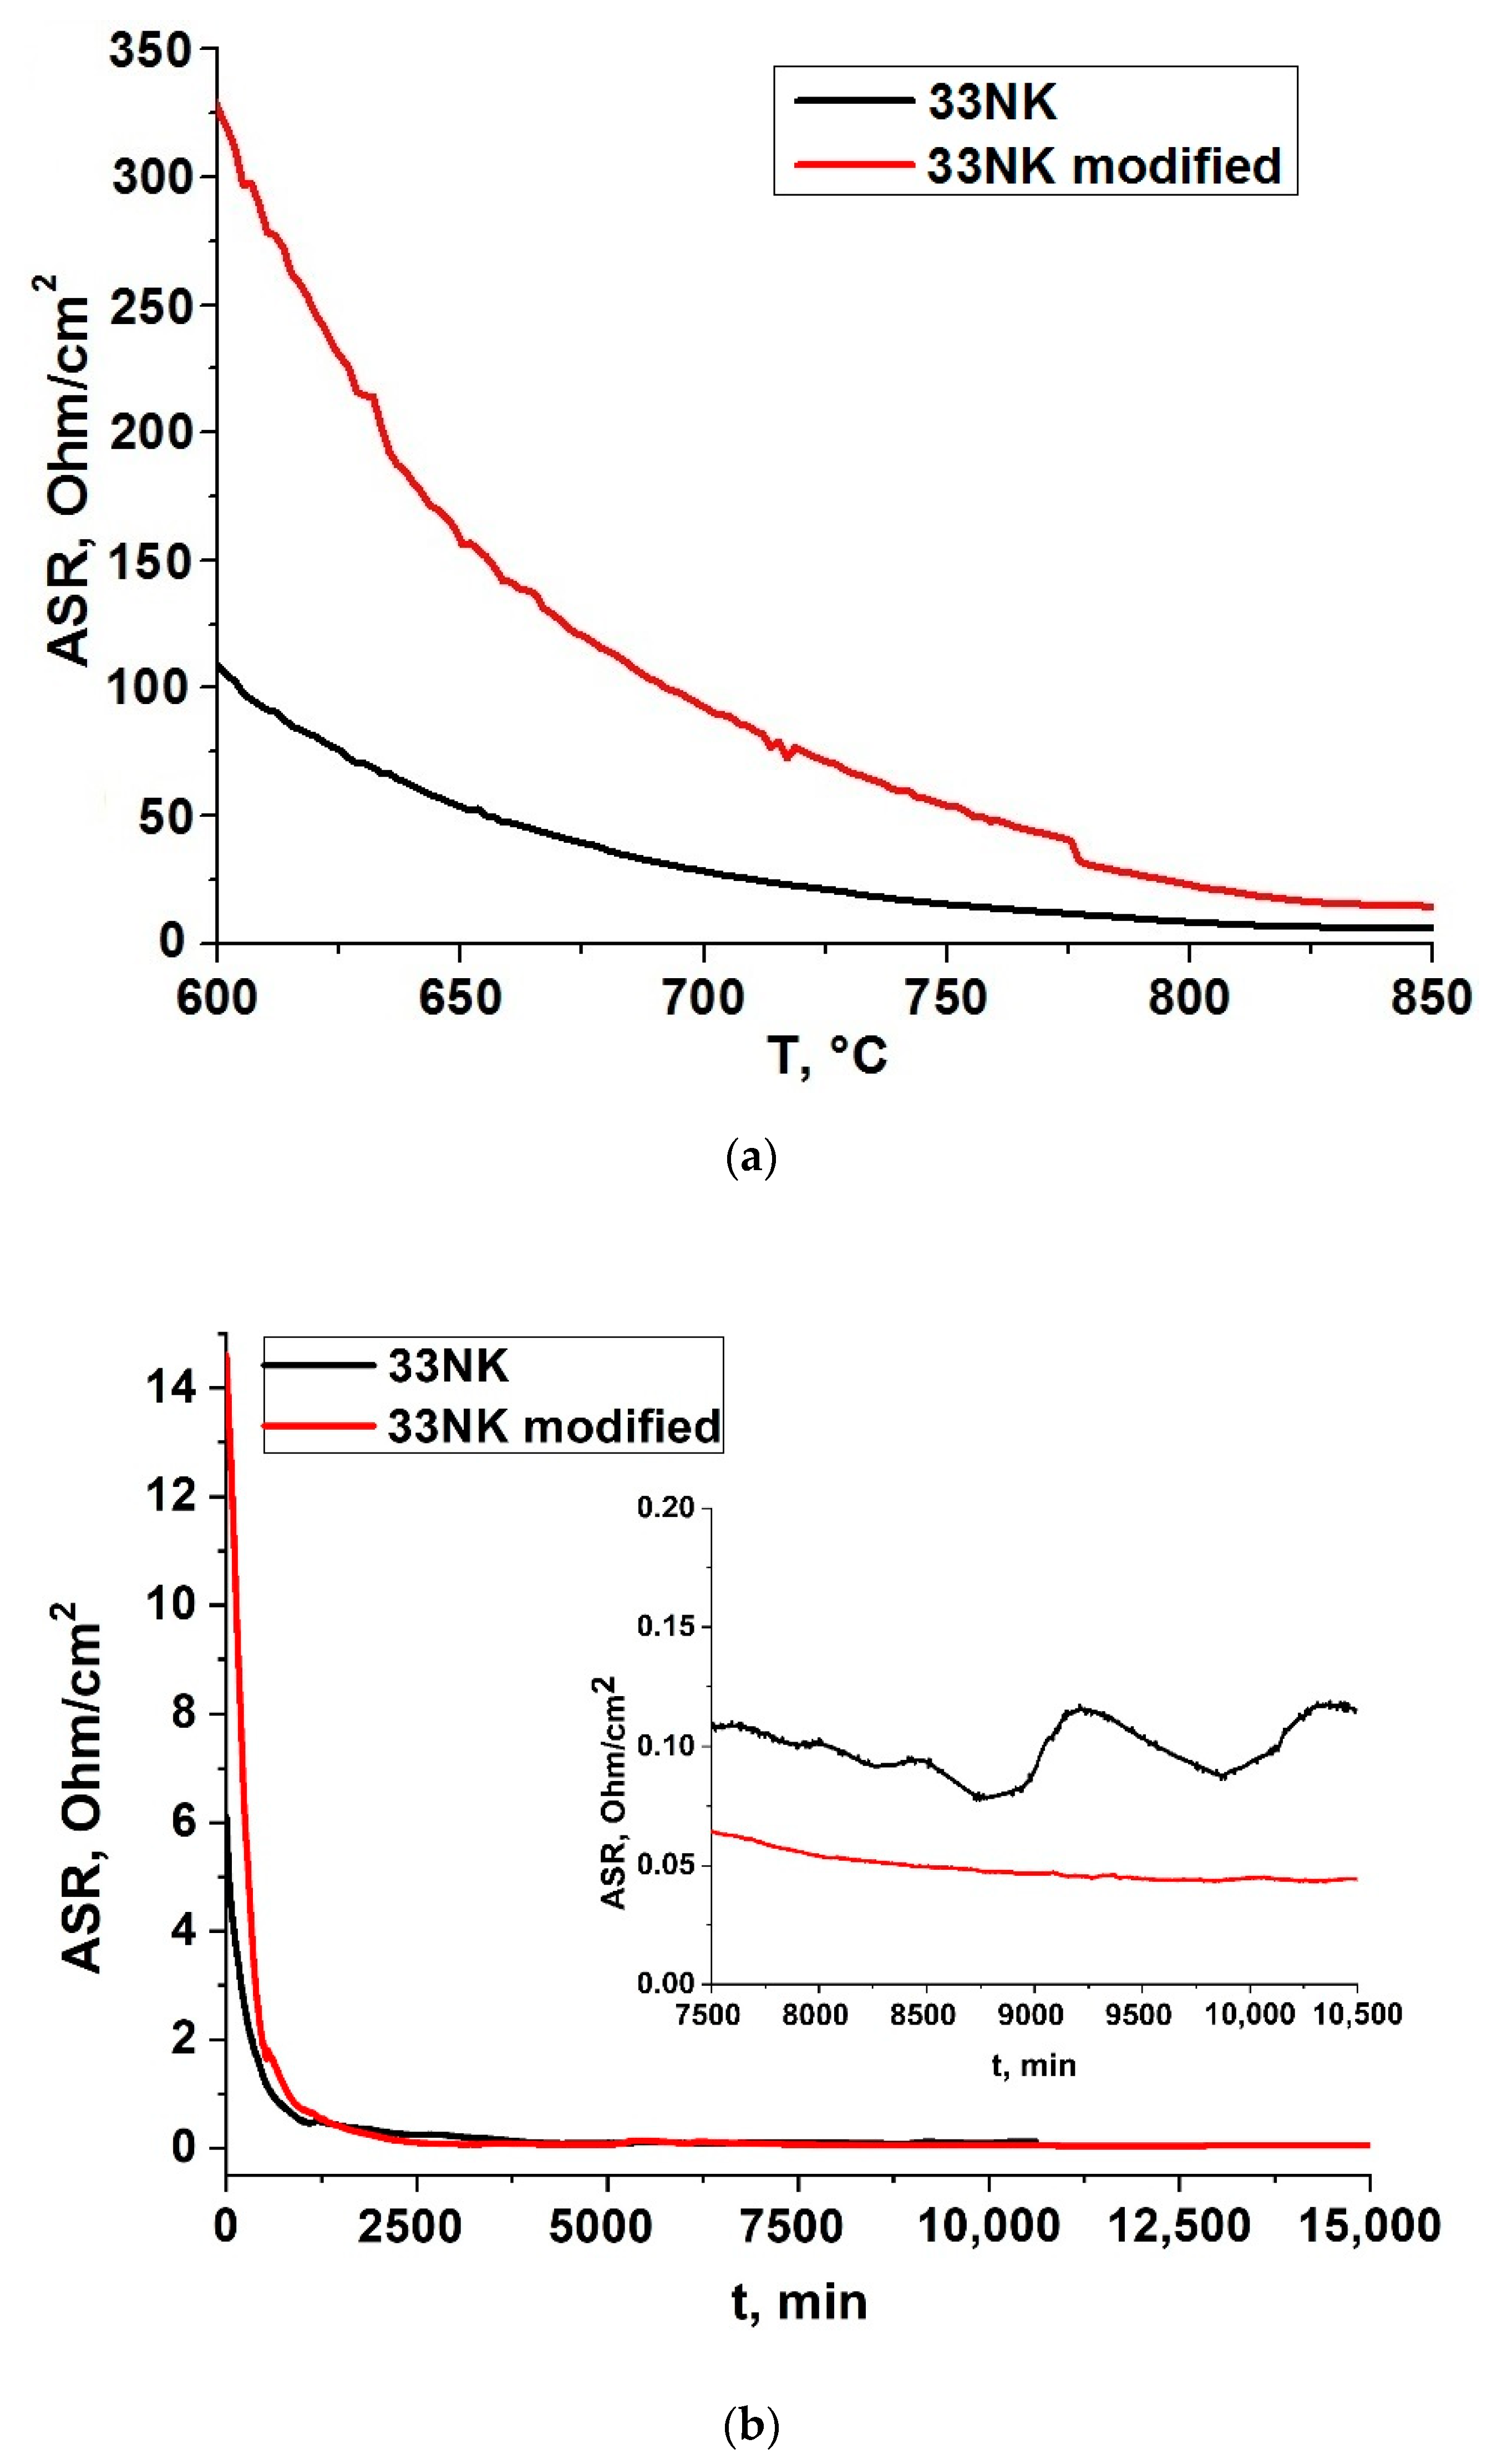
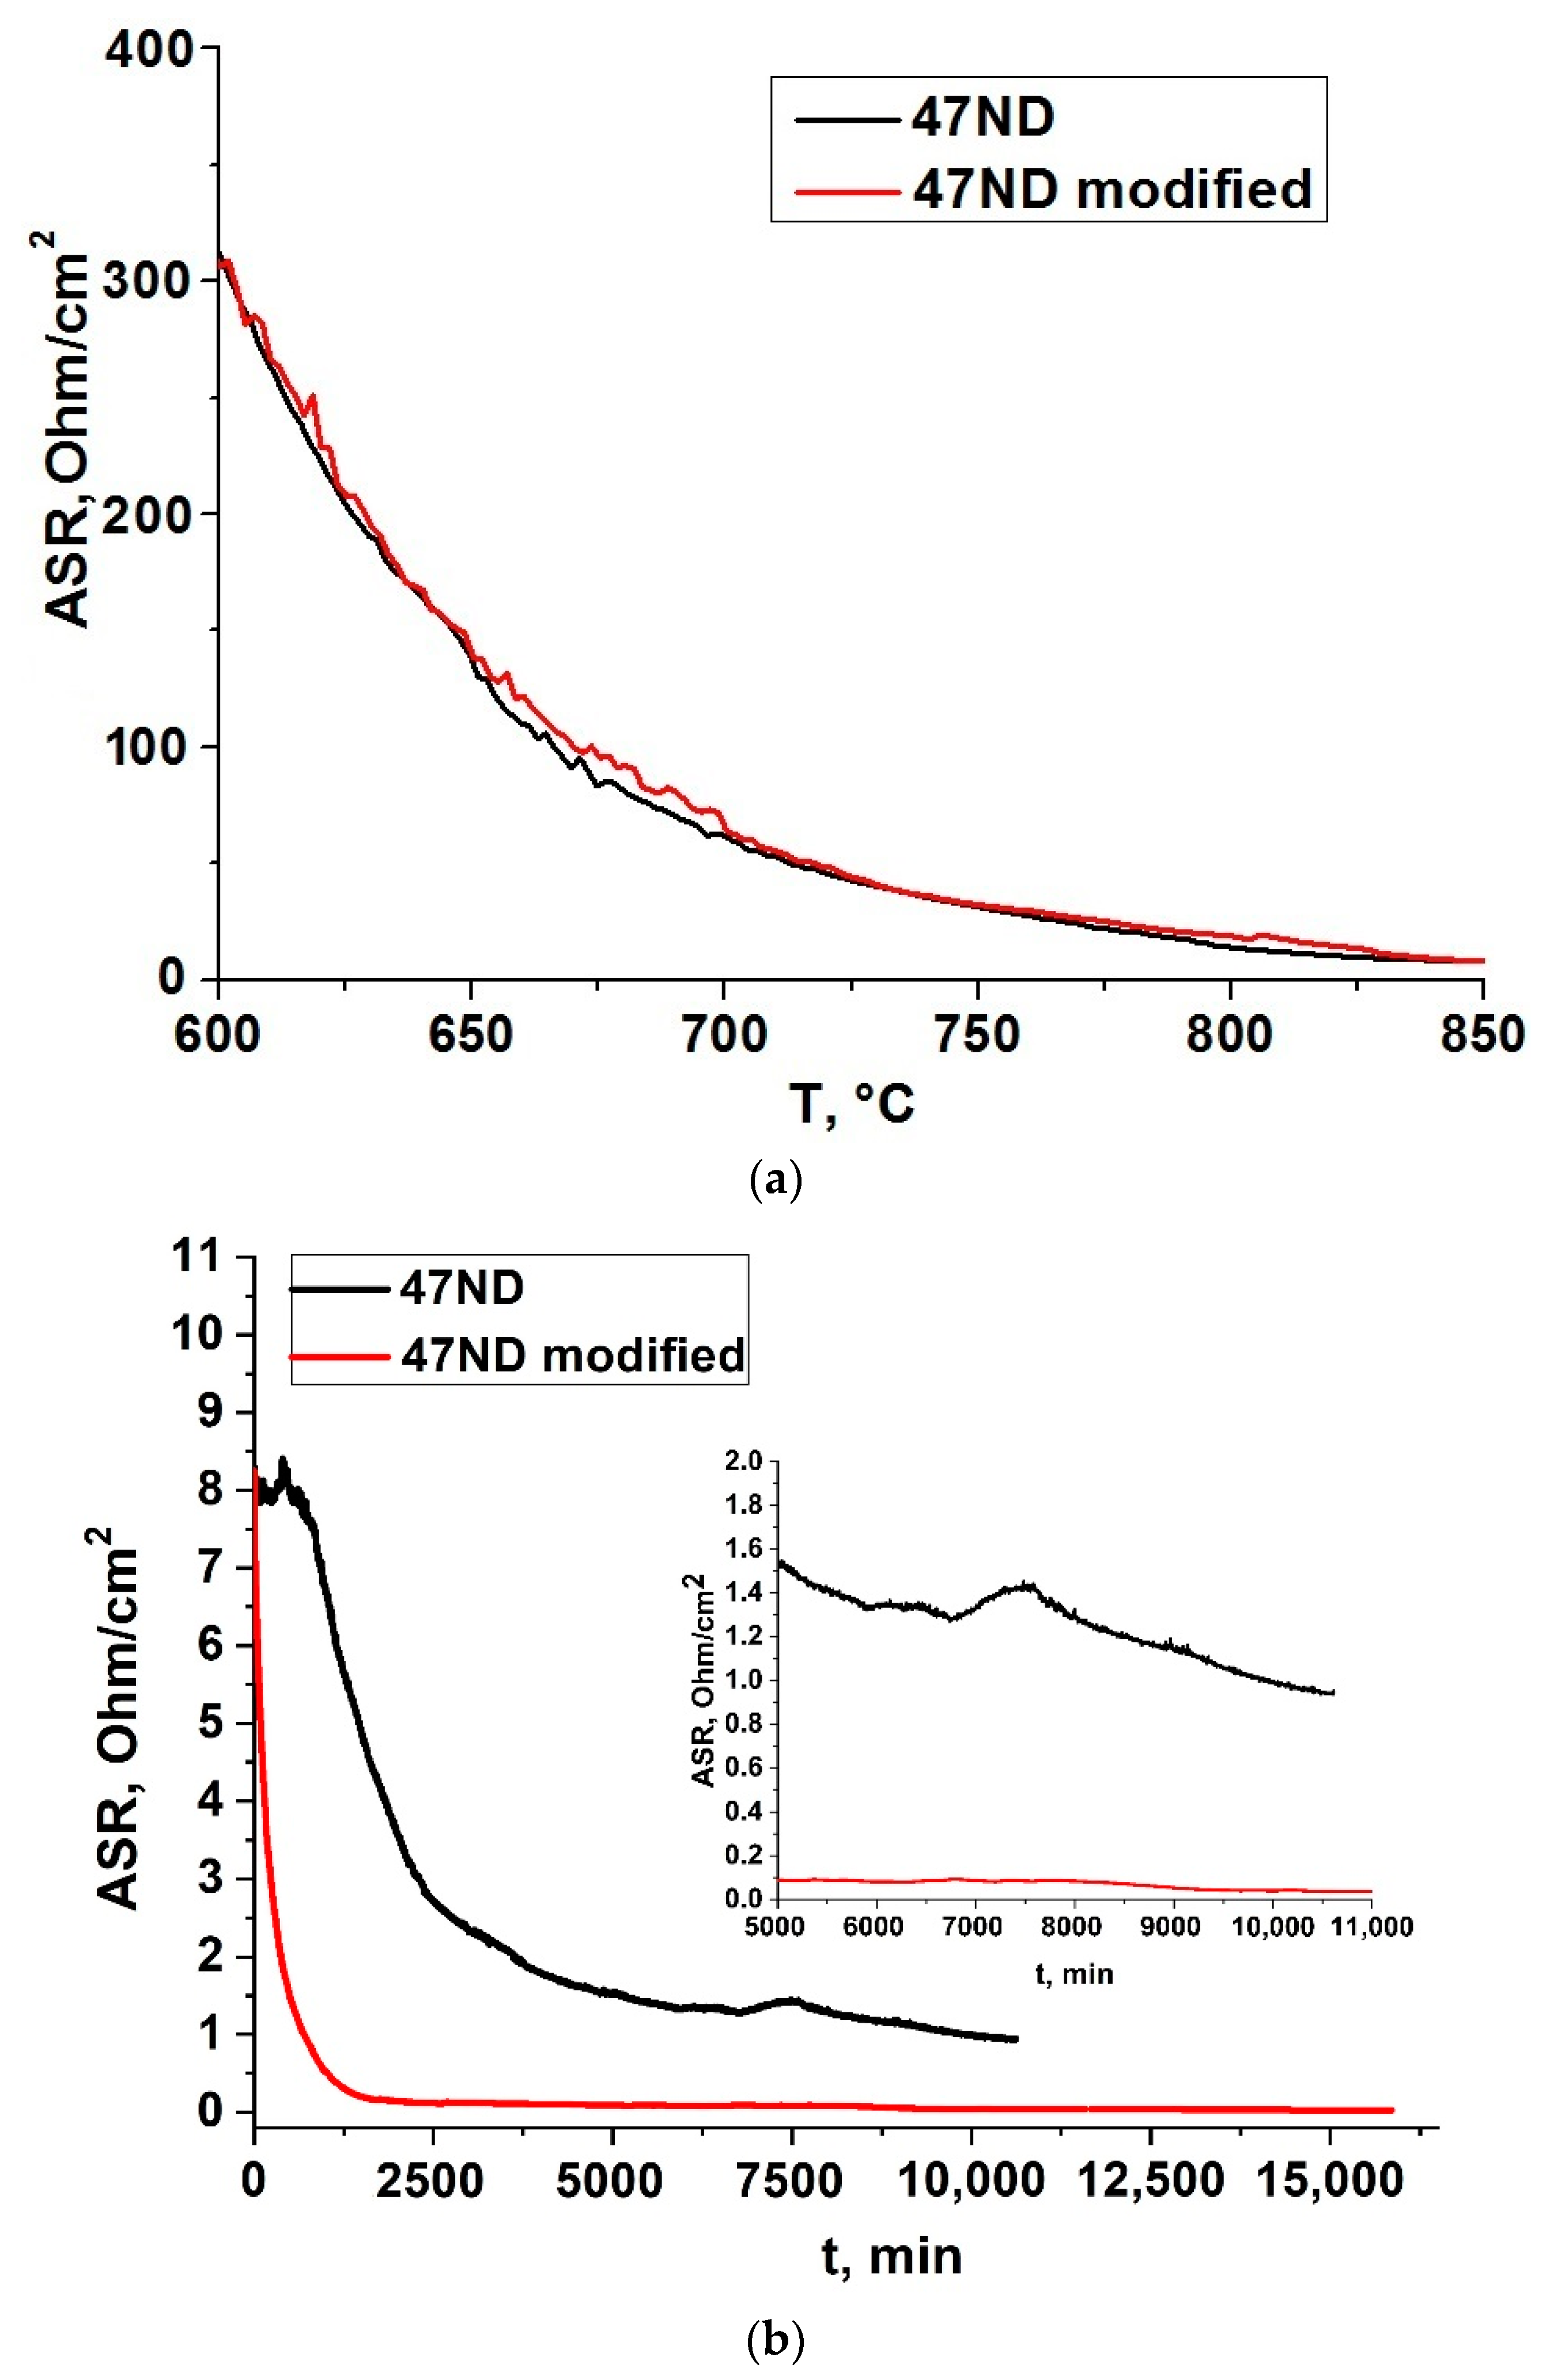
3.5. Electrical Conductivity

3.5.1. 33NK Alloy

The electrical conductivity data of the 33NK alloy samples without and with surface modification at 850 °C in air are shown in Figure 13.
It is seen from Figure 13a that during heating, the sample without modification had low resistance. However, the rate of the resistance decreases for the sample with modification was higher, and when the exposure temperature reached 850 °C (assumed SOFC operating temperature), the resistance values of both samples became close to each other. As it was mentioned above, we suppose that the reason for this was the difference in the qualitative and quantitative composition of the spinel-like phases in the set of the Fe, Co, Ni, and Mn for these oxide scales. After reaching the exposure temperature (Figure 13b), the resistance of both samples continued to decrease significantly. However, the rate of this process also began to decrease. A little more than after two days of exposure, the resistance of the modified sample became lower than the resistance of nonmodified one. After almost 177 h, the sample without modification had the resistance of 0.12 Ohm/cm2, and the sample with modification had the resistance of −0.04 Ohm/cm2. The total testing time for the modified sample was 351 h, and at the end of the test, the resistance was 0.02 Ohm/cm2.

3.5.2. 47ND Alloy

The electrical conductivity data for the 47ND alloy samples without and with surface modification at 850 °C in air are given in Figure 14. During the heating, the rates of the resistance decreasing and the resistance values of both samples were very close until the exposure temperature of 850 °C was reached.
After reaching the exposure temperature (Figure 14b), the drop in the resistance of the sample without modification slowed down in relation to the sample with modification. As a result, during the exposure, the values of their resistances became noticeably different. After 442 h, the sample without modification had a resistance of 0.94 Ohm/cm2, and the sample with modification had a resistance of −0.04 Ohm/cm2. The total testing time for the sample with modification was 661 h, and at the end of the test, the resistance reached 0.03 Ohm/cm2.
The difference in the behavior of samples of 33NK and 47ND alloys can be explained only by the difference in the chemical compositions of alloys, chemical compositions of solutions for modification, the compositions of the formed phases on the surface, and the fugitivity of the elements. Samples with surface modification of both alloys were characterized by lower resistance values during exposure, which may be due to the effect of surface modification on the relaxation processes of the chemical and phase compositions of the surface when the exposure temperature was reached.

4. Conclusions

In this work, it was revealed that the 33NK and 47ND alloys are promising materials as interconnectors for the SOFC. Nevertheless, the condition for their possible successful use in this capacity is the surface modification of the samples before the formation of oxide scale. The surface modification has a beneficial effect on the structure of the oxide scale at the macro- and microlevels: The samples with the modified oxide scale do not show delamination, cracks, and other defects, and also have an uniform surface. The electrical conductivity of modified samples was less than 40 mOhm/cm2 at 850 °C in air, which is the acceptable value for using these alloys as the interconnectors for SOFC. The found conditions made it possible to obtain gluing with good adhesion with preferred glass sealant for both alloys. The 47ND alloy had a constant CTE value within the range from room temperature to the temperature of SOFC operation, which had an obvious advantage over the 33NK alloy. The latter had a strong change in the CTE value in the region of 500 °C, which can lead to undesirable results during the heating and cooling cycles, which may be necessary arise during SOFC exploitation.

Author Contributions

Writing, editing and experiments verifying V.A.E.; experiments and editing A.A.S.; experiments S.A.B.; analyses A.V.K. and A.S.F.; experiments D.A.K.; experiments verifying N.S.S.; research goals, research, planning, conceptualization A.V.K., R.S.-W. and M.V.A.; sample manufacturing A.S.A.

Funding

This research was funded by the Russian Foundation of Basic Research grant number 17-58-10006.

Acknowledgments

The facilities of the shared access center “Composition of Compounds” of IHTE UB RAS were used in this work.

Conflicts of Interest

The authors declare no conflict of interest.

References

  1. Boaro, M.; Aricò, A.S. (Eds.) Advances in Medium and High Temperature Solid Oxide Fuel Cell Technology; CISM International Centre for Mechanical Sciences: Udine, Italy, 2017; Volume 574. [Google Scholar]
  2. Fergus, J.W. Lanthanum chromite-based materials for solid oxide fuel cell interconnects. Solid State Ion. 2004, 171, 1–15. [Google Scholar] [CrossRef]
  3. Zhu, W.; Yan, M. Perspectives on the metallic interconnects for solid oxide fuel cells. J. Zhejiang Univ. Sci. 2004, 5, 1471–1503. [Google Scholar] [CrossRef]
  4. Fergus, J.W. Metallic interconnects for solid oxide fuel cells. Mater. Sci. Eng. 2005, 397, 271–283. [Google Scholar] [CrossRef]
  5. Quadakkers, W.J.; Piron-Abellan, J.; Shemet, V.; Singheiser, L. Metallic interconnectors for solid oxide fuel cells: A review. Mater. High Temp. 2003, 20, 115–127. [Google Scholar]
  6. Geng, S.; Zhu, J. Promising alloys for intermediate-temperature solid oxide fuel cell interconnect application. J. Power Sources 2006, 160, 1009–1016. [Google Scholar] [CrossRef]
  7. Hua, B.; Pu, J.; Lu, F.; Zhang, J.; Chi, B.; Jian, L. Development of a Fe–Cr alloy for interconnect application in intermediate temperature solid oxide fuel cells. J. Power Sources 2010, 195, 2782–2788. [Google Scholar] [CrossRef]
  8. Toji, A.; Uehara, T. Stability of oxidation resistance of ferritic Fe-Cr alloy for SOFC interconnects. ECS Trans. 2007, 7, 2117–2124. [Google Scholar]
  9. Sachitanand, R.; Sattari, M.; Svensson, J.E.; Froitzheim, J. Evaluation of the oxidation and Cr evaporation properties of selected Fe-Cr alloys used as SOFC interconnects. Int. J. Hydrog. Energy 2013, 38, 15328–15334. [Google Scholar] [CrossRef] [Green Version]
  10. Jablonski, P.D.; Alman, D.E. Oxidation resistance of novel ferritic stainless steels alloyed with titanium for SOFC interconnect applications. J. Power Sources 2008, 180, 433–439. [Google Scholar] [CrossRef]
  11. Seo, H.S.; Yun, D.W.; Kim, K.Y. Effect of Ti addition on the electric and ionic property of the oxide scale formed on the ferritic stainless steel for SOFC interconnect. Int. J. Hydrog. Energy 2012, 37, 16151–16160. [Google Scholar] [CrossRef]
  12. Hosseini, N.; Karimzadeh, F.; Abbasi, M.H.; Choi, G.M. Correlation between microstructure and electrical properties of Cu1.3Mn1.7O4/La2O3 composite-coated ferritic stainless steel interconnects. J. Alloys Compd. 2016, 673, 249–257. [Google Scholar] [CrossRef]
  13. Shaigan, N.; Qu, W.; Ivey, D.G.; Chen, W. A review of recent progress in coatings, surface modifications and alloy developments for solid oxide fuel cell ferritic stainless steel interconnects. J. Power Sources 2010, 195, 1529–1542. [Google Scholar] [CrossRef]
  14. Garcia-Fresnillo, L.; Shemet, V.; Chyrkin, A.; de Haart, L.G.J. Long-term behaviour of solid oxide fuel cell interconnect materials in contact with Ni-mesh during exposure in simulated anode gas at 700 and 800 °C. J. Power Sources 2014, 271, 213–222. [Google Scholar] [CrossRef]
  15. England, D.M.; Virkar, A. Oxidation kinetics of some nickel-based superalloy foils and electronic resistance of the oxide scale formed in air. Part 1. J. Electrochem. Soc. 1999, 146, 3196–3202. [Google Scholar] [CrossRef]
  16. England, D.M.; Virkar, A. Oxidation kinetics of some nickel-based superalloy foils and electronic resistance of the oxide scale formed in air. Part 2. J. Electrochem. Soc. 2001, 148, 330–338. [Google Scholar] [CrossRef]
  17. Zhu, W.Z.; Deevi, S.C. Development of interconnect materials for solid oxide fuel cells. Mater. Sci. Eng. 2003, 348, 227–243. [Google Scholar] [CrossRef]
  18. GOST (State Standard) 10994-74. Precision Alloys. Brands. USSR, 1974. Available online: http://docs.cntd.ru/document/1200009057 (accessed on 16 December 2019).
  19. Ananyev, M.V.; Solodyankin, A.A.; Eremin, V.A.; Farlenkov, A.S.; Khodimchuk, A.V.; Fetisov, A.V.; Chernik, A.A.; Yaskelychik, V.V.; Ostanina, T.N.; Zaikov, Y.P. Protective Coatings La–Mn–Cu–O for Stainless-Steel Interconnector 08X17T for SOFC, Obtained by the Electrocrystallization Method from Non-Aqueous Solutions. Russ. J. Non-Ferr. Met. 2018, 59, 102–110. [Google Scholar] [CrossRef]
  20. Ananyev, M.V.; Eremin, V.A.; Solodyankin, A.A.; Yaskelchik, V.V. Electrochemical Method of Applying Conductive Oxide Protective Coating of Interconnector. Russian Federation Patent 2,016,139,988, 9 September 2016. [Google Scholar]
  21. Krainova, D.A.; Saetova, N.S.; Kuzmin, A.V.; Raskovalov, A.A.; Eremin, V.A.; Ananyev, M.V.; Steinberger-Wilckens, R. Non-Crystallising Glass Sealants for SOFC: Effect of Y2O3 Addition. Ceram. Int. 2020, in press. [Google Scholar] [CrossRef]
Figure 1. Dimensions of samples (in mm): (a) Flat plate; (b) disk.
Energies 12 04795 g001
Figure 2. The 33NK (a) and 47ND (c) alloys samples before the modification procedure, and the 33NK (b) and 47ND (d) alloys samples after the modification procedure and the annealing in a high-vacuum installation.
Energies 12 04795 g002
Figure 3. Dependences of the relative change in the linear size of the samples of the 33NK and 47ND alloys, the 08H17T and Crofer 22APU steels, glass sealant, and Zr0.8Y0.2O3−δ (YSZ) electrolyte on temperature.
Energies 12 04795 g003
Figure 4. Photo of the 33NK alloy samples without (left) and with (right) modification of the surface.
Energies 12 04795 g004
Figure 5. SEM images of the oxide scales of the 33NK alloy samples without modification (a) and with modification (b).
Energies 12 04795 g005
Figure 6. Photo of the 47ND alloy samples without (left) and with (right) modification of the surface.
Energies 12 04795 g006
Figure 7. SEM images of the oxide scales of the 47ND alloy samples without modification (a) and with modification (b).
Energies 12 04795 g007
Figure 8. Grazing incidence XRD patterns of the 33NK alloy without surface modification (1), with modification (2), and with modification after the electrical conductivity measurement test (3). Colored vertical lines indicate the position of the angles of the allowed Bragg reflections: Red ones confirm the presence of the isostructural spinel-like phases, such as Fe3O4, CoFe2O4, NiFe2O4, NiMn2O4, etc. Blue confirms the presence of Fe2O3.
Energies 12 04795 g008
Figure 9. The grazing incidence XRD patterns of the 47ND alloy before measuring the electrical conductivity (a) and after measuring the electrical conductivity (b) (1—without surface modification, 2—with surface modification). Colored vertical lines indicate the positions of the angles of the allowed Bragg reflections: Red ones confirm the presence of the isostructural spinel-like phases, such as Fe3O4, CoFe2O4, CuFe2O4, NiFe2O4, NiMn2O4, etc. Blue confirm the presence of Fe2O3.
Energies 12 04795 g009aEnergies 12 04795 g009b
Figure 10. SEM images of the gluing of the modified 33NK (a) and 47ND (b) alloys with the glass sealant.
Energies 12 04795 g010
Figure 11. Energy-dispersive X-ray spectroscopy (EDX) mapping of the elements that make up the 33NK alloy and solutions for the surface modification for Figure 10a.
Energies 12 04795 g011aEnergies 12 04795 g011b
Figure 12. EDX mapping of the elements that make up the 47ND alloy and the solutions for surface modification for Figure 10b.
Energies 12 04795 g012
Figure 13. Dependences of the electrical resistance of the 33NK alloy samples without and with surface modification on temperature (a) and time at T = 850 °C (b).
Energies 12 04795 g013
Figure 14. Dependences of the electrical resistance of the 47ND alloy samples without and with surface modification on temperature (a) and time at T = 850 °C (b).
Energies 12 04795 g014
Table 1. Chemical composition of the 33NK and 47ND alloys.
Alloy GradeContent, wt %Reference
CSiMnSPNiCoCuFe
33NK<0.05<0.30<0.40<0.015<0.01532.5–33.516.5–17.5-basic[18]
47ND<0.05<0.30<0.40<0.015<0.01546.0–48.0-4.5–5.5basic[18]
Table 2. Coefficient of thermal expansion (CTE) values of materials from Figure 3.
MaterialCTE, °C−1
steel 08H17T12.8 × 10−6 (20–870 °C)
steel Crofer 22APU12.8 × 10−6 (20–870 °C)
alloy 33NK7.7 × 10−6 (20–500 °C)
17.6 × 10⁻⁶ (500–870 °C)
alloy 47ND10.1 × 10−6 (20–870 °C)
glass-sealant [21]9.1 × 10⁻⁶ (20–870 °C)
YSZ electrolyte10.4 × 10−6 (20–870 °C)
Table 3. Chemical composition of the 33NK alloy and oxide scales, at %.
Element33NK Alloy (Basic Elements)Oxide Scale in Figure 5aOxide Scale in Figure 5b
Spectrum 1Spectrum 2
O~55.5~53.7~58.1
Mn~0.4~0.4~0.3~0.3
Fe~50.0~30.3~33.2~29.2
Co~16.5~12.6~10.8~9.4
Ni~32.5~1.2~2.0~3.0
Table 4. Chemical composition of the 47ND alloy and oxide scales, at %.
Element47ND Alloy (Basic Elements)Oxide Scale in Figure 7aOxide Scale in Figure 7b
Spectrum 1Spectrum 2
O~55.9~56.1~56.5
Mn~0.4~0.4~1.3~2.7
Fe~47.0~35.4~37.5~28.6
Co~1.3~5.4
Ni~47.0~3.2~2.6~3.1
Cu~5.0~5.1~1.2~3.7

