Article

A Three-Dimensional Microstructure-Scale Simulation of a Solid Oxide Fuel Cell Anode—The Analysis of Stack Performance Enhancement After a Long-Term Operation

1
Department of Fundamental Research in Energy Engineering, AGH University of Science and Technology, 30-059 Krakow, Poland
2
Academic Centre for Materials and Nanotechnology, AGH University of Science and Technology, 30-059 Krakow, Poland
*
Authors to whom correspondence should be addressed.
Energies 2019, 12(24), 4784; https://doi.org/10.3390/en12244784
Submission received: 19 November 2019 / Revised: 9 December 2019 / Accepted: 12 December 2019 / Published: 15 December 2019

Abstract

:
In this research, we investigate the connection between an observed enhancement in solid oxide fuel cell stack performance and the evolution of the microstructure of its electrodes. A three dimensional, numerical model is applied to predict the porous ceramic-metal electrode performance on the basis of microstructure morphology. The model features a non-continuous computational domain based on the digital reconstruction obtained using focused ion beam scanning electron microscopy (FIB-SEM) electron nanotomography. The Butler–Volmer equation is used to compute the charge transfer at reaction sites, which are modeled as distinct locally distributed features of the microstructure. Specific material properties are accounted for using interpolated experimental data from the open literature. Mass transport is modeled using the extended Stefan–Maxwell model, which accounts for both the binary, and the Knudsen diffusion phenomena. The simulations are in good agreement with the experimental data, correctly predicting a decrease in total losses for the observed microstructure evolution. The research supports the hypothesis that the performance enhancement was caused by a systematic change in microstructure morphology.

Graphical Abstract

1. Introduction

Fuel cells are energy conversion devices capable of converting the chemical energy of fuel directly into electrical energy. Solid oxide fuel cells (SOFCs) are the type of fuel cells, in which the electrolyte is composed of ceramic material, and the electrodes are made of porous ceramic-metal composite. Due to their high-efficiency, low environmental impact, and a wide variety of potential applications, SOFCs continue to attract considerable interest of the scientific community [1,2,3]. The porous, composite electrode of an SOFC is characterized by a complex microstructure, which affects the electrochemical phenomena. Furthermore, since these devices operate at high temperatures, the microstructure evolves during the prolonged periods of operation. The change of the SOFC performance due to the microstructure evolution phenomena has been observed and modeled by several research groups. Cayan et al. [4] have constructed and validated a model of SOFC degradation due to an accumulation of impurities from syngas. Sezer et al. [5] later used a similar technique to research the impact of phosphine induced nickel migration. Nevertheless, significant changes in phase distribution may also occur due to the impact of high temperature over a prolonged operating period [6,7]. Cold standby and shut down cycling also cause accelerated degradation of SOFC anodes [8]. Stoeckl et al. [9] investigated the degradation in a carbon-oxide powered SOFC device. Jiao et al. [10], and Shimura et al. [11] used a microstructure-scale mass and charge transport simulation to investigate the deterioration of a Nickel and Yttria stabilized Zirconia (Ni-YSZ) anode, and a Lanthanum Strontium Cobalt Ferrite (LSCF) cathode respectively. Miyoshi et al. [12] used a similar approach in the case of a Lanthanum Strontium Manganite (LSM) cathode under the influence of chromium poisoning. However, more research is required to fully understand the link between the evolution of an SOFC electrode and its performance. Brus et al. [13,14] measured the morphological parameters of an SOFC anode microstructure before and after a prolonged period of operation, during which the SOFC stack performance was registered. The experiment demonstrated an increase of cell terminal voltage after 3700 h of continuous operation, as well as radical changes of the triple phase boundary (TPB) length density, average grain size, phase tortuosity factor, and volume fraction [13,14]. Their studies indicated that, despite the significant decay of TPB length density, the reported stack performance increased [13,14]. The current state of the research suggests that this phenomenon cannot be explained using only microstructural studies and requires employing an advanced simulation of transport phenomena inside the electrode’s microstructure.
The transport phenomena may be simulated by means of mathematical and numerical modeling. Therefore, simulations are commonly used to predict the performance of SOFC electrodes. In an effort to model the mass and charge transport in the direction normal to the electrode surface, researchers generally make use of the continuous electrode theory. The continuous electrode theory assumes that the electrode can be approximated as a continuous medium, which allows for simultaneous flow of electrons, ions, and gaseous reagents. The anodic, or the cathodic half-reaction may take place anywhere within the continuous electrode—the influence of irregular morphological features of the microstructure is taken into consideration by introducing macroscopic parameters, which are, in general, distributed homogeneously within the modeled volume [15,16,17,18,19,20]. Fully three-dimensional models which employ a non-continuous computational domain to account for the irregular microstructure geometry are less common [21,22,23,24], since simulations performed using the continuous electrode theory require less computational resources. Furthermore, for a range of cases, the differential equations included in one-dimensional continuous-electrode models may be solved analytically, as proven by Costamagna [25] and Kulikovsky [26]. Nevertheless, such an approach may not be sufficient, if the process is influenced by heterogeneity.
The purpose of this research is to perform a microstructure-input-data-based simulation of the anode performance before and after the deterioration period while employing a model that does not rely on the assumption of homogeneity. Calculating the transfer of charge and gas diffusion, in a heterogeneous geometry offers an opportunity to highlight phenomena that may play an important role in SOFC deterioration, but are not included in a model with averaged, continuously distributed microstructure parameters. In contrast to previous studies, in which the SOFC electrode performance evolution was investigated by means of a microstructure-level simulation (i.e., by Jiao et al. [10], and by Shimura et al. [11]), this research covers a device, in which a performance enhancement, rather than deterioration, was observed [13,14]. The numerical simulations presented in this paper will help to determine whether the enhancement can be explained by the microstructure evolution.

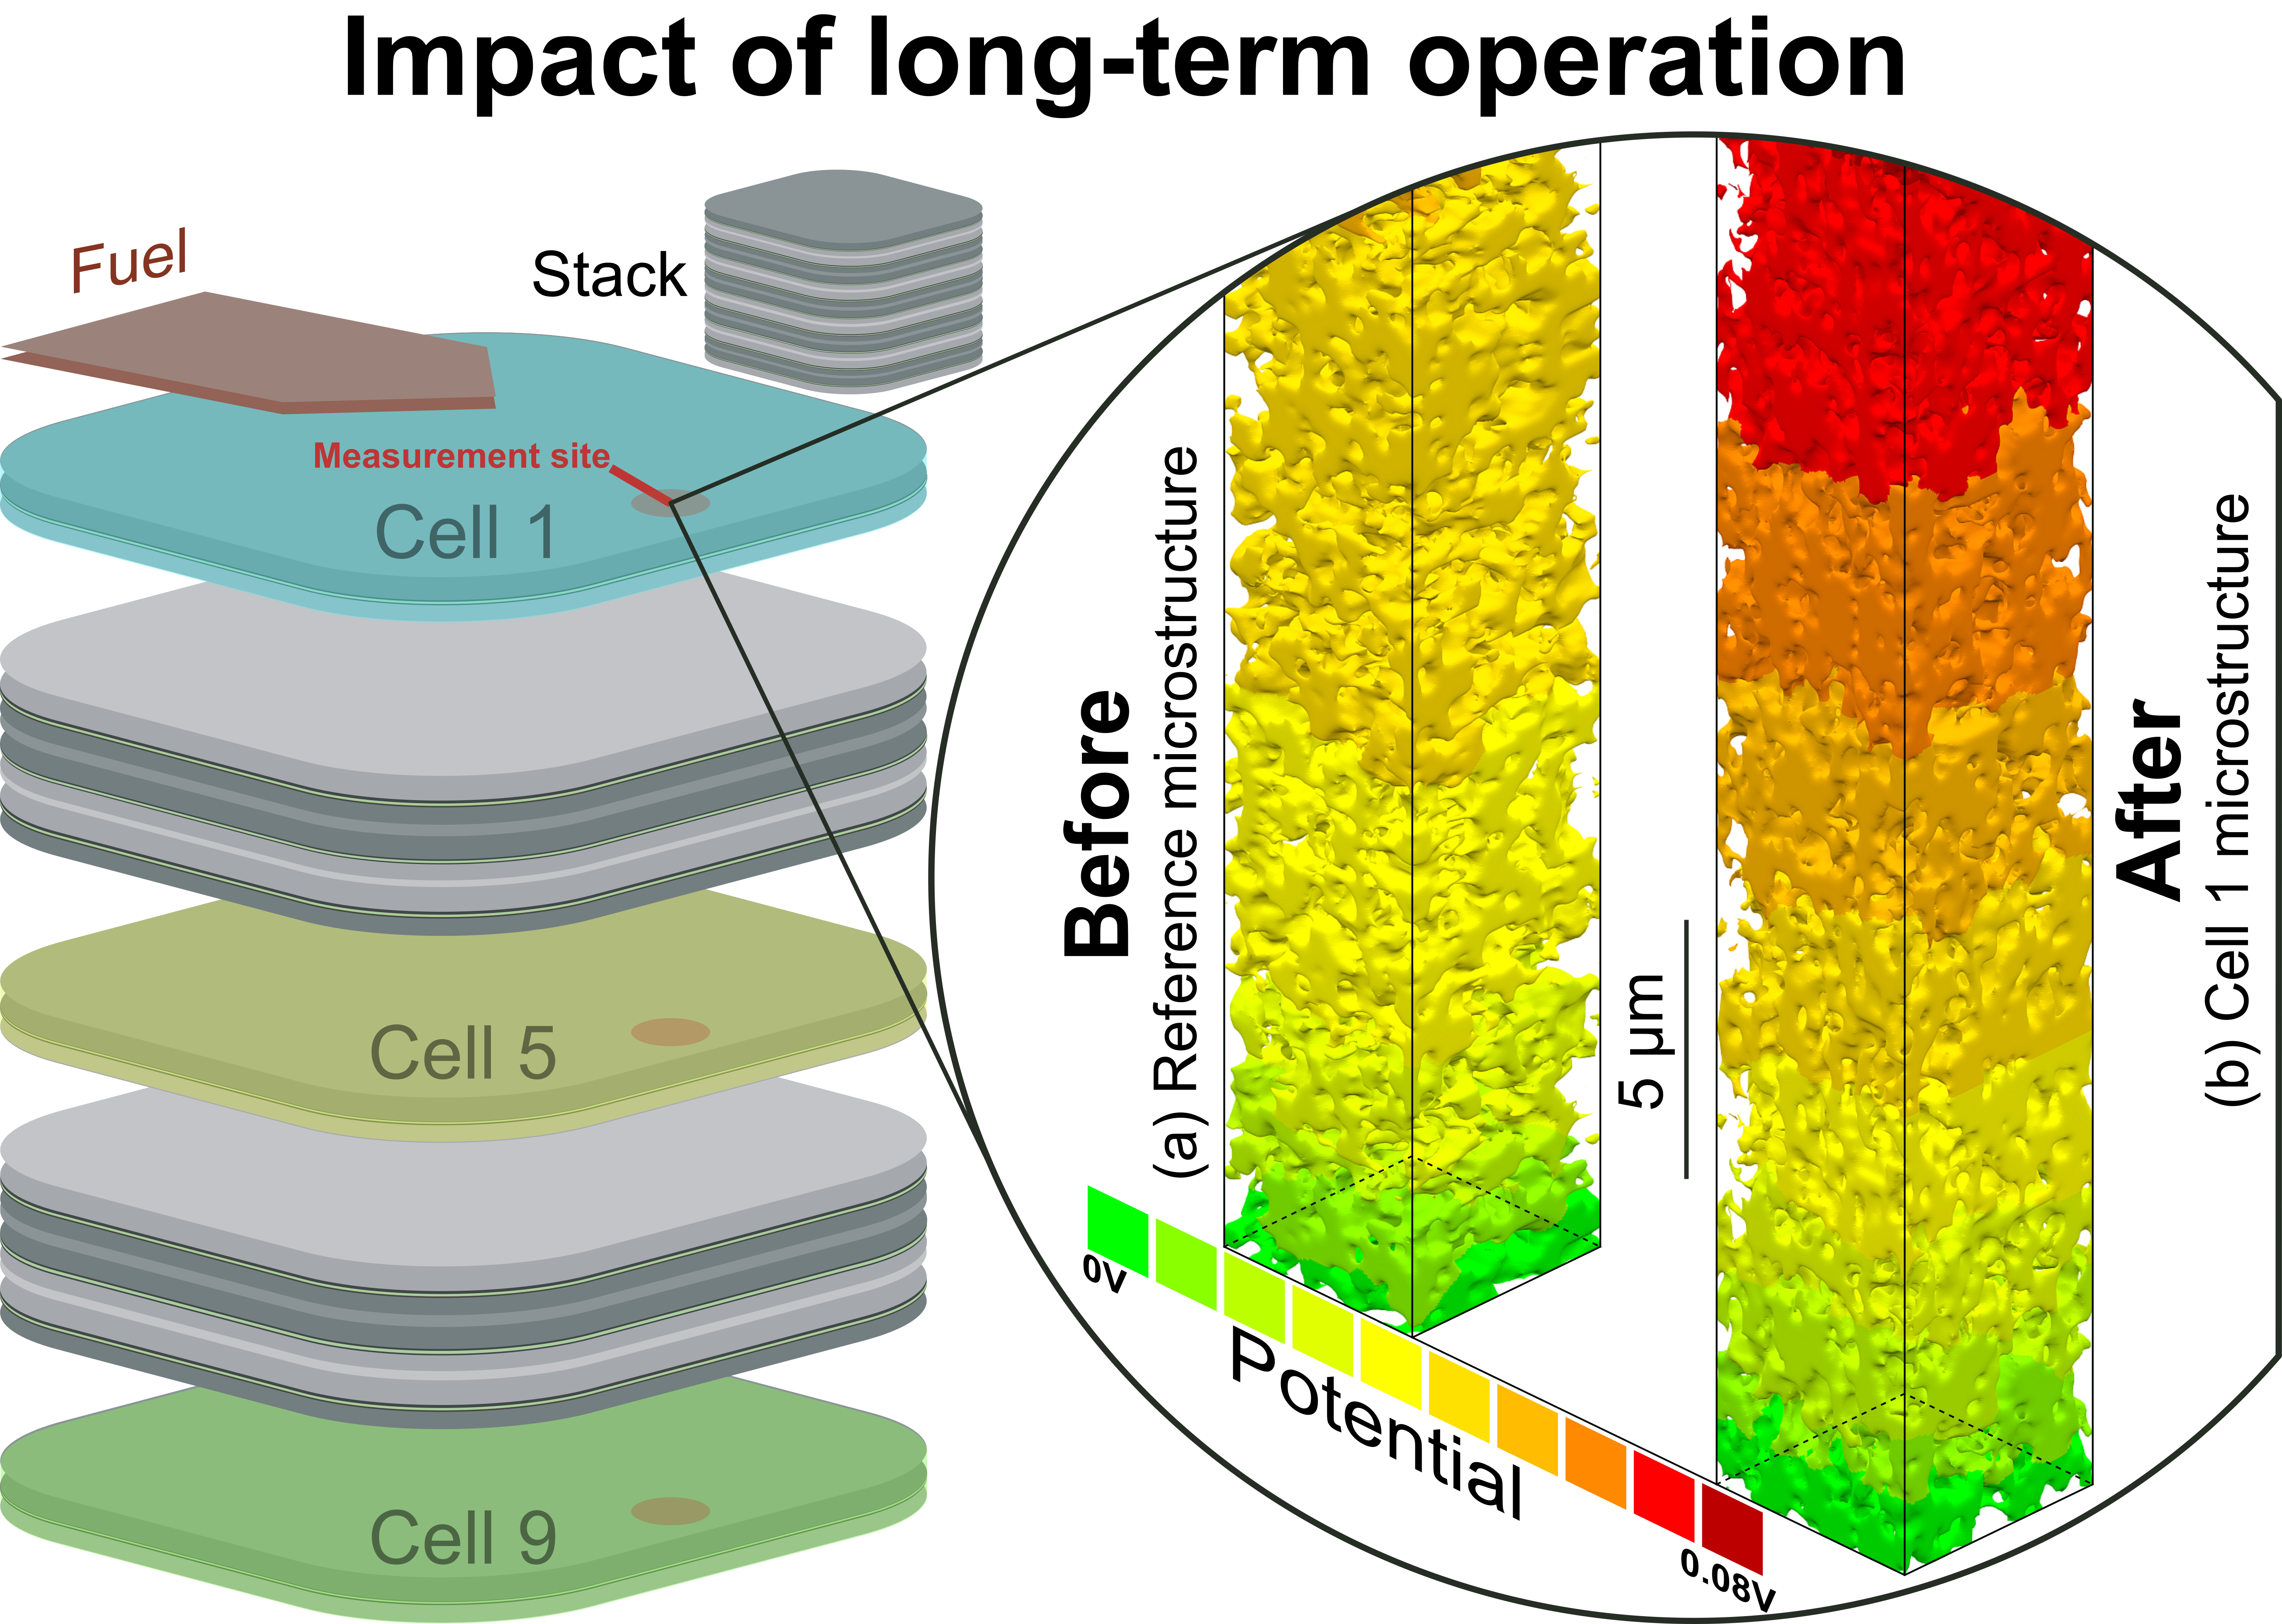
2. Long Term Operation Experiment

The study, which was conducted at the Department of Fundamental Research in Energy Engineering involved a stack of solid oxide fuel cells, operating within a modular stack test bench (MSTB). Both the SOFC stack and the MSTB were manufactured by SOLIDPower S.p.A. of Italy. The stack consisted of nine 6   c m × 8   c m anode-supported cells connected in series. Each cell had the following composition:
  • 240   μ m anode, made of Ni-YSZ ceramic-metal composite,
  • 10   μ m Yttria-stabilized Zirconia (YSZ) electrolyte, and
  • 50   μ m cathode made of Gadolinium Doped Ceria (GDC) Lanthanum Strontium Cobalt Ferrite (LSCF) composite.
The current flowing through the stack was manipulated, allowing for the acquisition of Current–Voltage (I–V) characteristic curves. The current values were set in a range of 0 A to 18 A. Given the total active cell area of 6   c m × 8   c m = 48   c m 2 = 0.0048   m 2 , this translates to current densities of 0– 3750 A / m 2 . The stack operated at temperatures in the range of 650– 800   C . All of the experimental results referred to in this section have been obtained from the aforementioned experiment. Another parameter regulated in the MSTB was the partial pressure of hydrogen, which was set to values in the range of 40– 70   k Pa . The cathode feed consisted of air at atmospheric pressure. The nine-cell stack was tested over 3800 h and disassembled after cooling down. The cells were subsequently divided into samples corresponding to the inlet side, the middle, and the outlet side in relation to the flow of the anodic gas mixture.

3. Microstructure Quantification

As part of the aging analysis, cell microstructure was investigated both for the stack before the aging experiment, and after the aging experiment. It is assumed that before the study, all cells within the stack had identical microstructural properties and were homogeneous. This is a realistic assumption, since the consistency of these parameters, to a reasonable degree, is guaranteed by the manufacturer. However, in order to observe anisotropy which may have arisen due to the aging phenomena, multiple measurements were taken for the cells recovered after the experiment. The microstructure measurements were taken in several places within the discussed SOFC stack. The stack consisted of nine cells. The cells are numbered from 1–9 counting from the top. This work uses measurements taken at the outlet side of cells: 1 (the top cell), 5 (the middle cell) and 9 (the bottom cell). The numbering scheme and measurement sites are visualized in Figure 1. Microstructures of both the electrodes were investigated using the FIB-SEM (focused ion beam scanning electron microscopy) tomography technique. In FIB-SEM tomography, a focused beam of ions is used to remove layers of the sample one by one, while the uncovered cross-sections are captured using a scanning electron microscope. After processing the resulting stacks of images, the three-dimensional digital reconstructions of the microstructure samples were obtained. Phase tortuosity was computed using the random walker simulation, and TPB density was obtained by means of the volume expansion method. The phase interface area in the case of the cathode was computed using the marching cube method. For details regarding microstructure quantification, see our previous articles [27,28].
The relevant cathodic microstructure parameters are presented in Table 1. Table 2, on the other hand, contains the microstructure parameters of the anodic samples recovered before, and after the long-term performance study. It is easy to see that the microstructures of the cells recovered after the aging experiment differ significantly from the reference cell microstructure. As expected, the deterioration of the triple phase boundary (TPB) was observed. However, this is not the only way in which the microstructure changed during the experiment—the tortuosity of the ion-conducting phase, as well as the gas diffusion phase, decreased during long term operation. This suggests that two opposing phenomena are involved—a decrease in reaction sites availability and an increase in reactant delivery speed. Thus, a simulation is needed to make further conclusions regarding the stack performance.

4. Mathematical Model

The transport in an SOFC electrode can be understood in light of four phenomena. These are the transport of mass and charge in the form of ions (ionic current), the transport of charge in an electronic conductor, the transport of gaseous reagents in the pores, and the exchange of charge at the reaction sites. To analyze the transport phenomena, a system of four three-dimensional Poisson differential equations and the Butler–Volmer equation is set up. Two equations for electric potential are included—one for the electron current in the metallic phase and one for the ion current in the oxide phase—as well as a diffusion equation for every species of the binary gas mixture within the electrode’s open porosity. The complete set of equations is presented below:
i an = x σ el , an ϕ el x + y σ el , an ϕ el y + z σ el , an ϕ el z i an = x σ ion , an ϕ ion x + y σ ion , an ϕ ion y + z σ ion , an ϕ ion z i an 2 F = x D H 2 R T p H 2 x + y D H 2 R T p H 2 y + z D H 2 R T p H 2 z i an 2 F = x D H 2 O R T p H 2 O x + y D H 2 O R T p H 2 O y + z D H 2 O R T p H 2 O z i an = i 0 , tpb , an l tpb · p H 2 p H 2 bulk exp α an , fwd F R T η p H 2 O p H 2 O bulk exp α an , bcw F R T η η = ϕ el ϕ ion R T 2 F ln p H 2 bulk p H 2 p H 2 O p H 2 O bulk .
It is assumed that in the above presented set of equations the anodic forward charge transfer coefficient α an , fwd = 1.4 and the anodic backward reaction coefficient α an , bcw = 0.6 , as was experimentally measured by Holtappels et al. [29]. The charge transfer coefficients are assumed to be constant within the discussed temperature range. This assumption is consistent with the experimental data reported by Holtappels et al. [29]. Constant temperatures are assumed within the computational domain, and the transport coefficients are approximated to be constant in relation to the model variables. The conductivity coefficients for the Nickel and Yttria-stabilized Zirconia phases in a Ni-YSZ cermet are computed using empirical relations (see Equations (2) and (3)) based on the experimental data by Anselmi-Tamburini et al. [30] and Bessette et al. [31]:
σ el , an = 3.27 · 10 6 1065.3 T ,
σ ion , an = 3.4 · 10 4 · exp 10350 T .
The equation for the anodic triple phase boundary exchange current density has been derived using the data by de Boer [21,32]:
i 0 , tpb , an = 31.4 · p H 2 0.06 · p H 2 O 0.43 · exp 152000 R T .
In the electrolyte, which is modeled as a solid layer of the ion conducting phase, equation system (1) simplifies to a single Laplace differential equation:
0 = x σ ion ϕ ion x + y σ ion ϕ ion y + z σ ion ϕ ion z .
For the cathode, the equation system analogous to equation system (1) takes the following form:
i cat = x σ el , an ϕ el x + y σ el , an ϕ el y + z σ el , an ϕ el z i cat = x σ ion , an ϕ ion x + y σ ion , an ϕ ion , an y + z σ ion ϕ ion z i an 4 F = x D O 2 R T p O 2 x + y D O 2 R T p O 2 y + z D O 2 R T p O 2 z i cat = ( i 0 , dpb A dpb + i 0 , tpb l tpb ) · exp α cat , frw F R T η exp α cat , bcw F R T η η = ϕ ion ϕ el R T 4 F ln p O 2 p O 2 bulk ,
where the specific electrochemical and material parameters were computed from the relationships reported by Matsuzaki et al. [33], Miyoshi et al. [34], and Kim et al. [35] Since the cathode side is not the main focus of this paper, we refer the reader to the aforementioned papers for further details.
As for the gas diffusion, the extended Stefan–Maxwell Model (eSMM) by Bao et al. [36] was used. Bao et al. [36] used the following formula to account for both the Fickian and the Knudsen diffusion phenomena:
D i = 1 2 1 D i j + 1 D i K 1 + 1 D i j + 1 D j K 1 ,
where D i j ( m 2   s 1 ) and D i K ( m 2   s 1 ) are, respectively, the binary diffusivity of the mixture i j and the Knudsen diffusivity of the species i. As can be seen, the diffusivities for any two species are identical, which satisfies the requirement of reciprocality. The Fickian binary diffusion coefficient can be obtained from the Fuller–Schettler–Giddings model:
D i j = 10 2 T 1.75 1 M i + 1 M j p v i 1 / 3 + v j 1 / 3 ,
and the Knudsen diffusion coefficient can be derived from the relationship (9):
D K , i = d pore 3 8 R T π M i ,
where p is the total pressure in Pascals, M n is the molar mass of species i, v i is its specific, cross sectional constant in the Fuller–Schettler–Giddings correlation [37], and d pore ( m ) is the pore diameter. The model equations were discretized using a Finite Volume Method (FVM) scheme over a non-continuous computational domain. The resulting sets of equations were then solved using the Successive Over-Relaxation (SOR) method with local linearization of the source term. An attempt at model falsification was carried out through the comparison between the numerical and the analytical solution. The comparison, shown in Figure 2, was performed for a number of cases, and a microstructure with parameters compiled in Table 3. For further details, please see our previous work [27]. The boundary conditions for a given electrode are explained in Table 4.
The water vapor partial pressure in the anodic gas mixture was derived from the measurement of open circuit voltage (OCV), and the set partial pressure of hydrogen, using the Nernst formula. This methodology was also used by Moździerz et al. [16] in their study of the same device.

5. Results

The three-dimensional reconstructions were input into a non-continuous, 3D numerical simulation. Both the Knudsen and the Fick diffusion were modeled. The computations were performed for electrode reconstructions based on the samples recovered from the stack before and after the aging experiment took place. For each case, a polarization curve was simulated, and the composition of losses was computed. Additionally, the simulations allowed to obtain distributions of exchange currents and potential fields within the electrodes.

5.1. Model Validation

This work assumes a falsificationist view on model validation. The modern falsificationist view, based on the philosophy of Karl Popper, states that a model may be proven false, but cannot be unequivocally proven true. However, the model gains trust, when the predicted results match empirical data. The goal of the analysis described in this section is to prove that the model is not false for several experimentally observed cases. In other words, the results obtained using the model are compared to equivalent experimental data. The 3D microstructure data was used to construct an equivalent computational domain used in the model. The cell operation parameters derived in the previous section: temperature, current densities, pressure, and composition of anodic and cathodic gas mixtures were input into the model formulated in the preceding chapters. Figure 3 shows a good agreement between the simulation and the experiment, given that an equivalent case is input into the model. Some of the discrepancy may stem from the lack of explicit data on the water vapor partial pressure, as the experimental setup did not allow for a direct measurement of this quantity. An error in microstructure reconstruction and quantification is also a factor. The model error may be related to the empirical estimates used to compute conductivities and equilibrium exchange currents, as well as charge transfer coefficients. This is also observed for the comparison of model performance and experimental data at different hydrogen partial pressure ratios. While a small error appears to be present, the simulation matches the qualitative behavior observed in the experiment. The modification of the hydrogen concentration at the inlet causes very little change in the overall stack performance, which is reflected in the simulation. Charge transfer coefficients are generally thought to remain constant in the discussed temperature range, but some variation is still possible [29]. Some error may stem from the assumption of constant temperature, partial pressure, and current distribution within the entire stack. Nevertheless, the model appears to predict the stack behavior quite well within the selected set of cases, proving that it is valid at least within the range. One may consider the model to be a sufficient tool for making further predictions regarding the device’s behavior. Thus, the validation is deemed sufficient for further applications.

5.2. Simulation of Pre- and Post-Study Anode Performance

Figure 4 depicts the comparison of the polarization curves predicted for the reference anode microstructure and electrodes recovered after the aging study. It is apparent that the latter generated significantly lower overpotential than the former. Qualitatively, this is consistent with the results of the Brus et al. [13] aging study. Furthermore, since the microstructure changes were different for each cell, so were the polarization curve characteristics. The central cell, Cell 5 showed the least enhancement, followed by Cell 1 (top) and Cell 9 (bottom). To better understand the relationship between the change in performance, and the microstructure evolution, it is necessary to decompose the total overpotential—that is, identify the contribution of activation losses, concentration losses, and losses due to the ohmic resistance.
In Figure 5, the results of the decomposition for the reference cell microstructure (microstructure before the aging study) are presented alongside the visualization of potential fields and charge transfer rate distribution. The activation losses are also relatively small, which could be attributed to the relatively high triple phase boundary (TPB) density of the anode. The irregularities are the result of local variations in the TPB density within the electrode—nevertheless, the microstructures appear relatively homogeneous. The active layer is relatively thin, likely due to the high TPB density.
Figure 6 displays equivalent datasets for the cells recovered after the experiment—Cells 1, 5, and 9 respectively. The decomposition revealed that concentration losses are the main contribution to the total overpotential in the reference electrode. This is expected, as the anode is very thick and has highly torturous pores. The ohmic losses are larger. This is likely due to an increase in active layer thickness caused by TPB depletion. A three-dimensional visualization of the ion-conducting phase potential distribution is shown in Figure 7.
A comparison between simulations for pre-aging and after-aging microstructures show the increase in activation losses. This is expected, since the qualitative analysis of the microstructure revealed considerable deterioration of the TPB density. It can clearly be seen that the active layer is thicker for the microstructures investigated after the aging experiment. All in all, for all the investigated cells, the main factor contributing to the enhancement was the decrease of the concentration overpotential. The concentration overpotential was very large due to the following factors: high thickness of the anode, exceptional tortuosity of the pore phase, and low pore volume fraction. During the long term operation, the tortuosity of pores decreased, leading to the enhancement.

6. Conclusions

In this work, a microstructure-scale model of mass and charge transport phenomena in cermet electrodes was experimentally validated and applied to an SOFC long-term operation phenomenon. First, we conducted a parametric study using the three-dimensional microstructure data from FIB-SEM tomography for the microstructure of the reference cell (a representative cell from before the aging experiment). This served the purpose of validating the model since the predicted performance was both qualitatively and quantitatively consistent with the experimental results for the stack. Then, microstructures based on the samples recovered after the experiment were input into the model. Despite the long-term performance, the simulations predicted a performance improvement for the microstructures. The improvement was consistent with the experimental results. Additionally, overpotential decomposition revealed that the change was caused primarily by the decrease in anodic concentration overpotential (caused by pore tortuosity), which compensated for the increase in activation overpotential (resulting from the decrease in the triple phase boundary density). Overall, the evolution of anodic microstructure is a sufficient explanation for the observed performance enhancement. Additionally, this research highlights the importance of mass transport in the design of microstructures for anode supported cells. The simulations suggest that if the anodic pore phase fraction is low, and its tortuosity is high, the device may perform at a reduced efficiency during the early stages of operation, negating some of the gains from the initially high TPB density and ionic conductivity.

Author Contributions

Conceptualization, G.B.; methodology, G.B.; software, T.A.P.; validation, M.M., G.B. and T.A.P.; formal analysis, T.A.P.; investigation, K.B., G.B. and M.M.; resources, K.B. and G.B.; data curation, T.A.P.; writing—original draft preparation, T.A.P.; writing—review and editing, G.B., M.M., K.B. and J.S.S.; visualization, T.A.P.; supervision, J.S.S.; project administration, G.B.; funding acquisition, G.B.

Funding

This work was supported by the National Science Centre of Poland (SONATA-10, Grant No. UMO-2015/19/D/ST8/00839). The authors are grateful for the support.

Acknowledgments

This research was supported in part by PL-Grid Infrastructure. Matplotlib Python library was used for data visualization [38].

Conflicts of Interest

The authors declare no conflict of interest.

Abbreviations

The following abbreviations and symbols are used in this manuscript:
DPBDouble Phase Boundary
FIBFocused Ion Beam
FVMFinite Volume Method
GDCGadolinium Doped Ceria
I–VCurrent–Voltage
LSCFLanthanum Strontium Cobalt Ferrite
LSMLanthanum Strontium Manganite
MSTBModular Stack Test Bench
Ni-YSZNickel and Yttria-stabilized Zirconia
OCVOpen Circuit Voltage
SEMScanning Electron Microscopy
SOFCSolid Oxide Fuel Cell
SORSuccessive Over-Relaxation
TPBTriple Phase Boundary
YSZYttria-stabilized Zirconia
Roman symbols
A dpb DPB density m 2 m 3
dPore diameterm
DDiffusion coefficient m 2 s 1
FFaraday constant A s mol 1
iCharge transfer rate A m 3
i 0 , tpb Equilibrium exchange current density at TPB A m 1
i 0 , dpb Equilibrium exchange current density at DPB A m 2
jMean charge transfer rate A m 2
l tpb TPB density m m 3
MMolar mass g mol 1
pTotal pressurePa
p i Partial pressure of iPa
RUniversal gas constant J mol 1 K 1
TTemperatureK
vFuller–Schettler–Giddings correlation specific coefficient-
x,yPlanar coordinatesm
zDepth (distance from the channel)m
Greek symbols
α Charge transfer coefficient-
η Local overpotentialV
ϕ Electrical potentialV
Φ Cell voltageV
σ Electrical conductivity Ω 1 m 1
τ Tortuosity-
ψ Phase volume fraction-
Subscripts
actActivation
anAnodic
bBoundary (bulk)
concConcentration
catCathodic
dpbDouble phase boundary
effEffective, homogeneous model value
H 2 Hydrogen
H 2 O Water vapor
iA substance
ionOxide ion conducting phase
N 2 Nitrogen
O 2 Oxygen
tpbTriple phase boundary
0Equilibrium

References

  1. Chang, H.; Lee, I.H. Environmental and Efficiency Analysis of Simulated Application of the Solid Oxide Fuel Cell Co-Generation System in a Dormitory Building. Energies 2019, 12, 3893. [Google Scholar] [CrossRef] [Green Version]
  2. Rangel-Hernandez, V.H.; Torres, C.; Zaleta-Aguilar, A.; Gomez-Martinez, M.A. The Exergy Costs of Electrical Power, Cooling, and Waste Heat from a Hybrid System Based on a Solid Oxide Fuel Cell and an Absorption Refrigeration System. Energies 2019, 12, 3476. [Google Scholar] [CrossRef] [Green Version]
  3. Arsalis, A.; Georghiou, G.E. A Decentralized, Hybrid Photovoltaic-Solid Oxide Fuel Cell System for Application to a Commercial Building. Energies 2018, 11, 3512. [Google Scholar] [CrossRef] [Green Version]
  4. Cayan, F.N.; Pakalapati, S.R.; Celik, I.; Xu, C.; Zondlo, J. A degradation model for solid oxide fuel cell anodes due to impurities in coal syngas: Part i theory and validation. Fuel Cells 2012, 12, 464–473. [Google Scholar] [CrossRef]
  5. Sezer, H.; Celik, I.B. Phosphine induced Nickel Migration in SOFC Anodes: A Computational Study. Electrochim. Acta 2015, 155, 421–430. [Google Scholar] [CrossRef] [Green Version]
  6. Zekri, A.; Herbrig, K.; Knipper, M.; Parisi, J.; Plaggenborg, T. Nickel Depletion and Agglomeration in SOFC Anodes During Long-Term Operation. Fuel Cells 2017, 17, 359–366. [Google Scholar] [CrossRef]
  7. Zekri, A.; Knipper, M.; Parisi, J.; Plaggenborg, T. Microstructure Degradation of Solid Oxide Fuel Cells Aged in Stack after Long Operation Time up to 20 000h Using 3D Reconstructions by FIB Tomography. ECS Trans. 2017, 77, 17–25. [Google Scholar] [CrossRef]
  8. Hanasaki, M.; Uryu, C.; Daio, T.; Kawabata, T.; Tachikawa, Y.; Lyth, S.M.; Shiratori, Y.; Taniguchi, S.; Sasaki, K. SOFC Durability against Standby and Shutdown Cycling. J. Electrochem. Soc. 2014, 161, F850–F860. [Google Scholar] [CrossRef]
  9. Stoeckl, B.; Subotić, V.; Preininger, M.; Schroettner, H.; Hochenauer, C. SOFC operation with carbon oxides: Experimental analysis of performance and degradation. Electrochim. Acta 2018, 275, 256–264. [Google Scholar] [CrossRef]
  10. Jiao, Z.; Shimura, T.; Shikazono, N. Numerical Assessment of SOFC Anode Polarization with Microstructure Evolution. ECS Trans. 2015, 68, 1281–1289. [Google Scholar] [CrossRef]
  11. Shimura, T.; He, A.; Shikazono, N. Evaluation of La0.57Sr0.38Co0.2Fe0.8O3-δ Electrode Performance Degradation Based on Three-Dimensional Microstructure Reconstruction and Electrochemical Simulation. J. Electrochem. Soc. 2019, 166, F821–F830. [Google Scholar] [CrossRef]
  12. Miyoshi, K.; Iwai, H.; Kishimoto, M.; Saito, M.; Yoshida, H. Chromium poisoning in (La,Sr)MnO3 cathode: Three-dimensional simulation of a solid oxide fuel cell. J. Power Sour. 2016, 326, 331–340. [Google Scholar] [CrossRef] [Green Version]
  13. Brus, G.; Iwai, H.; Sciazko, A.; Saito, M.; Yoshida, H.; Szmyd, J.S. Local evolution of anode microstructure morphology in a solid oxide fuel cell after long-term stack operation. J. Power Sour. 2015, 288, 199–205. [Google Scholar] [CrossRef]
  14. Brus, G.; Iwai, H.; Otani, Y.; Saito, M.; Yoshida, H.; Szmyd, J.S. Local Evolution of Triple Phase Boundary in Solid Oxide Fuel Cell Stack after Long-term Operation. Fuel Cells 2015, 15, 545–548. [Google Scholar] [CrossRef]
  15. Mozdzierz, M.; Chalusiak, M.; Kimijima, S.; Szmyd, J.S.; Brus, G. An afterburner-powered methane/steam reformer for a solid oxide fuel cells application. Heat Mass Transf. 2018, 54, 2331–2341. [Google Scholar] [CrossRef] [Green Version]
  16. Mozdzierz, M.; Berent, K.; Kimijima, S.; Szmyd, J.S.; Brus, G. A Multiscale Approach to the Numerical Simulation of the Solid Oxide Fuel Cell. Catalysts 2019, 9, 253. [Google Scholar] [CrossRef] [Green Version]
  17. Brus, G.; Iwai, H.; Mozdzierz, M.; Komatsu, Y.; Saito, M.; Yoshida, H.; Szmyd, J.S. Combining structural, electrochemical, and numerical studies to investigate the relation between microstructure and the stack performance. J. Appl. Electrochem. 2017, 47, 979–989. [Google Scholar] [CrossRef]
  18. Kishimoto, M.; Iwai, H.; Saito, M.; Yoshida, H. Quantitative evaluation of solid oxide fuel cell porous anode microstructure based on focused ion beam and scanning electron microscope technique and prediction of anode overpotentials. J. Power Sour. 2011, 196, 4555–4563. [Google Scholar] [CrossRef]
  19. Cayan, F.N.; Pakalapati, S.R.; Elizalde-blancas, F.; Celik, I. On modeling multi-component diffusion inside the porous anode of solid oxide fuel cells using Fick’s model. J. Power Sources 2009, 192, 467–474. [Google Scholar] [CrossRef]
  20. Li, J.; Bai, Z.; Croiset, E. A two-dimensional modeling of solid oxide fuel cell button cells with detailed electrochemistry mechanism. J. Power Sour. 2016, 333, 164–172. [Google Scholar] [CrossRef]
  21. Shikazono, N.; Kanno, D.; Matsuzaki, K.; Teshima, H.; Sumino, S.; Kasagi, N. Numerical Assessment of SOFC Anode Polarization Based on Three-Dimensional Model Microstructure Reconstructed from FIB-SEM Images. J. Electrochem. Soc. 2010, 157, B665–B672. [Google Scholar] [CrossRef] [Green Version]
  22. Kanno, D.; Shikazono, N.; Takagi, N.; Matsuzaki, K.; Kasagi, N. Evaluation of SOFC anode polarization simulation using three-dimensional microstructures reconstructed by FIB tomography. Electrochim. Acta 2011, 56, 4015–4021. [Google Scholar] [CrossRef]
  23. Rhazaoui, K.; Cai, Q.; Kishimoto, M.; Tariq, F.; Somalu, M.R.; Adjiman, C.S.; Brandon, N.P. Towards the 3D modelling of the effective conductivity of solid oxide fuel cell electrodes - Validation against experimental measurements and prediction of electrochemical performance. Electrochim. Acta 2015, 168, 139–147. [Google Scholar] [CrossRef] [Green Version]
  24. Suzue, Y.; Shikazono, N.; Kasagi, N. Micro modeling of solid oxide fuel cell anode based on stochastic reconstruction. J. Power Sour. 2008, 184, 52–59. [Google Scholar] [CrossRef]
  25. Costamagna, P.; Costa, P.; Antonucci, V. Micro-modelling of solid oxide fuel cell electrodes. Electrochim. Acta 1998, 43, 375–394. [Google Scholar] [CrossRef]
  26. Kulikovsky, A.A. A model for SOFC anode performance. Electrochim. Acta 2009, 54, 6686–6695. [Google Scholar] [CrossRef]
  27. Prokop, T.A.; Berent, K.; Iwai, H.; Szmyd, J.; Brus, G. A three-dimensional heterogeneity analysis of electrochemical energy conversion in SOFC anodes using electron nanotomography and mathematical modeling. Int. J. Hydrog. Energy 2018, 43, 10016–10030. [Google Scholar] [CrossRef]
  28. Prokop, T.; Berent, K.; Szmyd, J.S.; Brus, G. A three-dimensional numerical assessment of heterogeneity impact on a solid oxide fuel cell’s anode performance. Catalyst 2018, 8, 503. [Google Scholar] [CrossRef] [Green Version]
  29. Holtappels, P.; de Haart, L.G.J.; Stimming, U. Reaction of Hydrogen/Water Mixtures on Nickel-Zirconia Cermet Electrodes: I. DC Polarization Characteristics. J. Electrochem. Soc. 1999, 146, 1620–1625. [Google Scholar] [CrossRef]
  30. Anselmi-Tamburini, U.; Chiodelli, G.; Arimondi, M.; Maglia, F.; Spinolo, G.; Munir, Z. Electrical properties of Ni/YSZ cermets obtained through combustion synthesis. Solid State Ion. 1998, 110, 35–43. [Google Scholar] [CrossRef]
  31. Bessette, N.F., II; Wepfer, W.J.; Winnick, J. A Mathematical Model of a Solid Oxide Fuel Cel. J. Electrochem. Soc. 1995, 142, 3792–3800. [Google Scholar] [CrossRef]
  32. De Boer, B. Hydrogen Oxidation at Porous Nickel and Nickel/Yttria Stabilised Zirconia Cermet Electrodes. Ph.D. Thesis, Universiteit Twente, Enschede, The Netherlands, 1998. [Google Scholar]
  33. Matsuzaki, K.; Shikazono, N.; Kasagi, N. Three-dimensional numerical analysis of mixed ionic and electronic conducting cathode reconstructed by focused ion beam scanning electron microscope. J. Power Sour. 2011, 196, 3073–3082. [Google Scholar] [CrossRef]
  34. Miyoshi, K.; Miyamae, T.; Iwai, H.; Saito, M.; Kishimoto, M.; Yoshida, H. Exchange current model for (La0.8Sr0.2)0.95MnO3 (LSM) porous cathode for solid oxide fuel cells. J. Power Sour. 2016, 315, 63–69. [Google Scholar] [CrossRef] [Green Version]
  35. Kim, Y.T.; Jiao, Z.; Shikazono, N. Evaluation of La0.6Sr0.4Co0.2Fe0.8O3-δ-Gd0.1Ce0.9O1.95 composite cathode with three dimensional microstructure reconstruction. J. Power Sour. 2017, 342, 787–795. [Google Scholar] [CrossRef]
  36. Bao, C.; Jiang, Z.; Zhang, X. Modeling mass transfer in solid oxide fuel cell anode: I. Comparison between Fickian, Stefan-Maxwell and dusty-gas models. J. Power Sour. 2016, 310, 32–40. [Google Scholar] [CrossRef]
  37. Fuller, E.N.; Schettler, P.D.; Giddings, J.C. A new method for prediction of binary gas-phase diffusion coefficients. Ind. Eng. Chem. 1966, 58, 18–27. [Google Scholar] [CrossRef]
  38. Hunter, J.D. Matplotlib: A 2D graphics environment. Comput. Sci. Eng. 2007, 9, 90–95. [Google Scholar] [CrossRef]
Figure 1. A visualization of the measurement site placement within the stack.
Energies 12 04784 g001
Figure 2. Numerical model verification. Ionic potential and exchange current density fields. Boundary conditions: ϕ el , b = 0.05 V , p = 100,000 Pa, p H 2 O = 3000 Pa , p H 2 = p p H 2 O , thickness: 62.6 μ m , T = 1073 K , unless specified otherwise.
Energies 12 04784 g002
Figure 3. A comparison of experimental and simulated current–voltage (I–V) curves for different temperatures (a), and anode mixture compositions (b) (Operation parameters: p = 100,000 Pa , p H 2 = 60,000 Pa , p N 2 = p p H 2 , T = 1023 K , unless specified otherwise).
Energies 12 04784 g003aEnergies 12 04784 g003b
Figure 4. Anodic polarization curves simulated for microstructures recovered before and after the operation.
Energies 12 04784 g004
Figure 5. Anode performance before the experiment: Reference microstructure. Simulation parameters p = 100,000 Pa, p H 2 = 60,000 Pa , anode thickness: 240 μm, T = 1023 K.
Energies 12 04784 g005
Figure 6. Anode performance after the experiment: Cell 1 (a,b), Cell 5 (c,d), and Cell 9 (e,f). Simulation parameters: p = 100,000 Pa, p H 2 = 60,000 Pa , anode thickness: 240 μ m , T = 1023 K .
Energies 12 04784 g006aEnergies 12 04784 g006b
Figure 7. A 3D visualization of the active layer ion-conducting phase potential before (a), and after (bd) the experiment. Simulation parameters: p = 100,000 Pa, p H 2 = 60,000 Pa , anode thickness: 240 μ m , T = 1023 K .
Energies 12 04784 g007
Table 1. Reference parameters of the Gadolinium Doped Ceria (GDC) Lanthanum Strontium Cobalt Ferrite (LSCF) cathode used in the falsification attempt.
Phase
LSCFGDCPore
l tpb ( m   m 3 ) A dpb ( m 2   m 3 ) ψ f τ ψ f τ ψ f τ
2.11 × 10 12 1.63 × 10 6 0.343.950.2710.320.392.42
Table 2. The parameters of Nickel and Yttria-stabilized Zirconia (Ni-YSZ) anode before and after the long term performance study.
Sample Phase
NiYSZPore
l tpb ( m   m 3 ) ψ f τ ψ f τ ψ f τ
Brand new
Reference cell 4.44 × 10 12 0.3494.950.4623.0090.15926.159
After the study
Cell 1 2.92 × 10 12 0.2137.170.5202.1690.2135.324
Cell 5 4.21 × 10 12 0.3133.960.4352.5260.2458.788
Cell 9 3.25 × 10 12 0.15614.310.5132.0040.3063.892
Table 3. Microstructure parameters of the electrode used in the falsification attempt [27]. triple phase boundary (TPB).
Microstructure Parameters
Voxel edge lengthAverage TPB densityYSZ Volume FractionYSZ Phase Tortuosity
50.00 × 10 9 m 5.3 × 10 12 m m −30.442.52
Table 4. Scheme of Neumann boundary conditions.
Energies 12 04784 i001
z = 0 z = z b x { 0 , x b } y { 0 , y b }
p H 2 = p H 2 , b p H 2 z = 0 p H 2 x = 0 p H 2 y = 0
p H 2 O = p H 2 O , b p H 2 O z = 0 p H 2 O x = 0 p H 2 O y = 0
j el = j el , b ϕ el z = 0 ϕ el x = 0 ϕ el y = 0
ϕ ion z = 0 ϕ ion = ϕ ion , b ϕ ion x = 0 ϕ ion y = 0

