Article

Study on Rule of Overburden Failure and Rock Burst Hazard under Repeated Mining in Fully Mechanized Top-Coal Caving Face with Hard Roof

1
Energy School, Xi’an University of Science and Technology, Xi’an 710054, China
2
Key Laboratory of Western Mines and Hazard Prevention of China Ministry of Education, Xi’an University of Science and Technology, Xi’an 710054, China
3
Key Laboratory of Coal Resource Exploration and Comprehensive Utilization, Ministry of Land and Resources, Xi’an 710021, China
4
Shenhua Xinjiang Energy Ltd., China Energy, Wulumuqi 830027, China
*
Author to whom correspondence should be addressed.
Energies 2019, 12(24), 4780; https://doi.org/10.3390/en12244780
Submission received: 15 October 2019 / Revised: 7 November 2019 / Accepted: 13 December 2019 / Published: 15 December 2019
(This article belongs to the Special Issue Advanced Technologies for Energy Exploitation of Coals)

Abstract

:
The dynamic disasters caused by the failure of hard roof in the process of mining coal seriously affect the safe production in coal mines. Based on the W1123 mining coal working face of Kuangou coal mine, the physical similar material simulation experiment and acoustic emission (AE) monitoring method are used to study the failure law and AE characteristics of overburden in the process of coal mining. The stress evolution law is revealed through numerical simulation, the dangerous areas and rock burst hazard under the repeated mining with hard roof are studied combined with microseismic monitoring on site. The results show that the energy of W1123 working face released by the overburden damage under B4-1 solid coal is higher than that of the gob, and the peak value of the AE energy appears near the W1145 open-off cut. Through the statistics of the AE data, the large energy rate of AE event is defined, and the AE events with large energy rate appear in the scale of 82.4–231.2 cm within the model. This area is shown as a stress superposition area according to the numerical simulation. On the basis of comparing with the characteristics of energy distribution in the field, it is considered that the main control factors of rock burst in this area are hard roof of the working face and the stress concentration caused by the repeated mining. It provides a scientific guidance for the prevention and control measures of rock burst in this type of mining condition.

1. Introduction

Dynamic disaster induced by hard roof is one of the serious disasters in the coal mine. After the coal mining, this type of roof isn’t easy to collapse, resulting in the phenomenons of stress concentration and energy concentration, etc. Once the roof failure, it will lead to a dynamic disaster such as rock burst that endangers the lives of underground equipment and workers. This kind of dynamic disaster has the characteristics of strong suddenness, violent pressure and wide range of damage, which brings serious threat to mine safety production.
Rock burst disaster induced by hard roof is related to the mechanical characteristics of overburden and the complex geological evolution mechanism, it is difficult to prevent [1]. The influence of faults on the hard top plate is divided into two different induced modes of rock burst, which provided reference for the prediction of rock burst and the division of dangerous areas [2]. Based on the theory of key strata and rock control, combined with the law of mechanical load and energy conservation in the system, the mechanism of rock burst induced by key strata of thick and hard roof is revealed [3]. By analyzing the failure mode of the hard roof in physical model, the interaction of hard roof structure is easy to induce the occur of rock burst [4]. Nine different types of rock burst through the statistics of the geostress in the rock burst mining area are summarized [5], which provided a reference for understanding the mechanism of rock burst.
In terms of rock burst monitoring and early warning, scholars at home and abroad have put forward a variety of suggestions and made some achievements, but the practicability and accuracy of rock burst monitoring and early warning technology need to be improved [6]. By monitoring the accumulation and release of AE energy under the action of different horizontal loads in the process of simulation experiment, and comparing with the failure phenomenon of rock burst in engineering practice, the occurrence mechanism of rock burst in tunnel is studied [7]. Mechanical analysis and numerical simulation on the mechanism of rock burst induced by hard roof show that the rock burst of hard roof working face can be divided into two types: interlayer dislocation type and coal wall instability type [8]. Based on the study on the distribution of rock burst in China, the rock burst can be divided into three basic types: Coal compression type, roof fracture type and fault dislocation type. According to the occurrence mechanism of different types of rock burst, the corresponding control measures are proposed [9]. The microseismic monitoring and support pressure data show that the hard thick roof is the main force source of rock burst, and the prevention method of cutting off the hard roof in time to avoid the formation of stress concentration is proposed. The field practice effect is obvious [10]. The study from three aspects of geological structure, microseismic activity and stress field shows that the cutting action of reverse fault is easy to cause large area movement of thick and hard top plate, which provides dynamic load conditions for the occurrence of rock burst in working face [11]. The mechanism of rock burst is studied by mechanical analysis and numerical simulation, and the prevention and control measures of rock burst in different types of isolated island working face are put forward [12]. Based on the study of energy source and disaster mechanism of rock burst in hard direct roof working face by using microseismic and mine pressure monitoring, it is shown that the dynamic load caused by periodic breaking of hard direct roof increases the f rock burst hazard in working face [13]. The study of AE monitoring on the failure process of hard sandstone shows that the AE signal in the failure process of hard sandstone can be divided into three stages: relatively gentle growth stage, rapid growth stage and eruption stage. It is believed that the intensity of AE signal can be used as the early warning signal for the failure of hard sandstone [14]. The application of a new generation of portable digital geoacoustic instrument in the field under the dangerous condition of rock burst shows that the geoacoustic instrument can estimate the parameters of rock deformation process effectively and quickly [15]. The characteristics of AE signals in the process of hard roof failure show that in a short period of time before the failure of hard roof, the AE count shows an upward trend, and the AE energy increases sharply. These signals reach the peak value when the rock is broken and then decrease rapidly, ending at a weak level, which can provide certain ideas and references for predicting and monitoring the rock burst caused by the failure of Hard Roof [16]. The method of active seismic velocity inversion is used to predict the rock burst hazard of the long wall face of the island, which has made remarkable achievements in the disaster prevention and control of the rock burst mine [17]. Microseismic monitoring under high stress condition of hard roof shows that microseismic energy rises suddenly before rock burst, and when rock burst occurs, amplitude drops suddenly, indicating the occurrence of macro fracture [18]. The change of electromagnetic radiation parameters has a better monitoring effect on the occurrence of rock burst, and a method to prevent rock burst by using the change of electromagnetic radiation parameters is proposed [19]. Based on the multi parameter index early warning system of microseismic monitoring, the quantitative early warning reduction of rock burst risk can be carried out by comprehensive analysis [20]. RFPA system is applied to simulate the stress field around the thick coal seam mining process. The simulation results reproduce the dynamic development process of caving in the process of mining soft coal seam. It shows the influence of stress field, mining process and coal mechanical properties on the occurrence of rock burst, which has reference significance for the prediction and prevention of rock burst in the mining process [21]. FLAC3D (the fast lagrangian analysis of continua in 3-dimensions software) is used to simulate the stress state of rock burst roadway, and the results show that the stress concentration area caused by excavation is the place where rock burst occurs frequently [22]. Through numerical calculation and computed tomography, the change characteristics of regional geostress and fracture development are inverted, and the accuracy of the inversion method is verified based on the field monitoring data [23,24].
The above scholars have made fruitful achievements in laboratory research, numerical simulation and field measurement, however, the research on the prevention of rock burst in working face with hard roof is mostly focused on a single coal seam, and the research on the failure law and rock burst prevention under the repeated mining of multiple coal seams is relatively less. In this paper, based on the background of W1123 fully mechanized top–coal caving face in Kuangou coal mine, the physical material simulation experiment and AE monitoring method are used to study the failure law and AE characteristics of overburden in the process of coal mining, the law of stress evolution in the mining process of W1123 working face is revealed by numerical simulation. Combined with the field data, the dangerous areas and rock burst hazard under the repeated mining with hard roof are studied and verified.

2. Materials and Methods

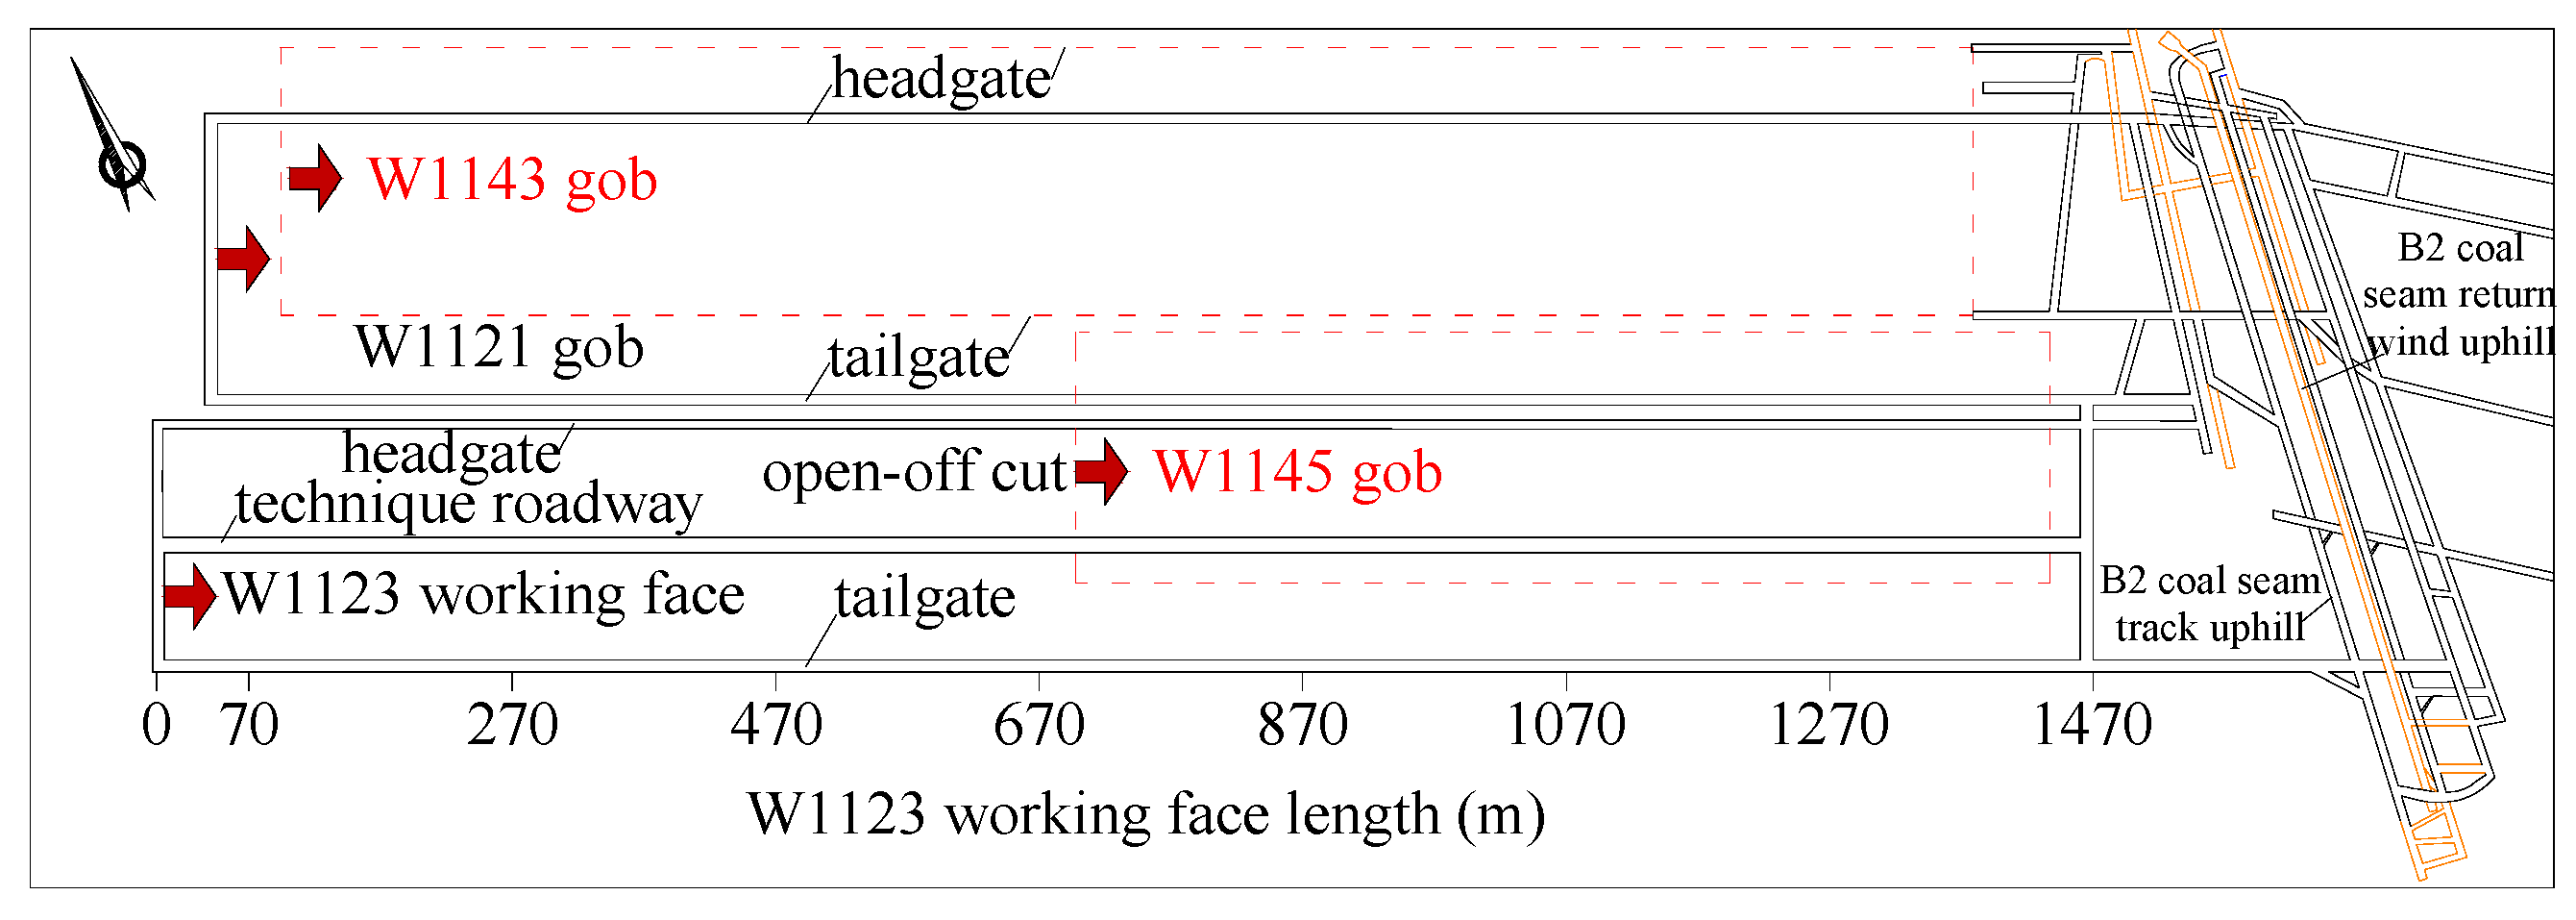
2.1. Engineering Background

Figure 1 shows the layout of spatial location relationship of four coal mining working faces in Kuangou coal mine. Kuangou Coal Mine is located in Queergou Town, Xinjiang province, China. The mining sequence of coal seam downward and section upward is adopted in the mine. The W1143 and W1145 working faces mine the B4-1 coal seam, this coal seam has been mined. W1121 and W1123 working face mine the B2 coal seam, the distance between the two layers of coal is about 42.9 m. The first mining face in B2 coal seam is W1121 working face, which has been mined, W1123 working face is mining. Due to the short working face W1145, there will be a part of solid coal and a part of gob above W1123 working face. This makes it difficult to control the hard roof of W1123 working face. The physical similar material simulation experiment is based on the full-mechanized top-coal caving mining of W1123 working face. B2 coal seam is the main mining seam in the mine. Its full thickness is 5.05–14.58 m, average thickness is 11.3 m, dip angle is 12–14 degrees. W1123 working face is located in the West Wing of B2 coal seam, strike length is 1469 m, dip length is 192 m, and buried depth is 370–416 m. It adopts upward full-mechanized top–coal caving mining. The average thickness of direct roof at W1123 working face is 7.6 m, it is mainly composed of fine sandstone and siltstone, its uniaxial compressive strength is 93.55 MPa, which belongs to hard and difficult-to-soften rock. The average thickness of basic roof is 8.5 m, the main component is coarse sandstone, and its uniaxial compressive strength is 115.25 MPa, which belongs to hard and difficult-to-soften rock. The floor is mudstone with an average thickness of 5.76 m, it is mainly siltstone, which belongs to soft rock.

2.2. AE Monitoring Principle and Experimental Model Construction

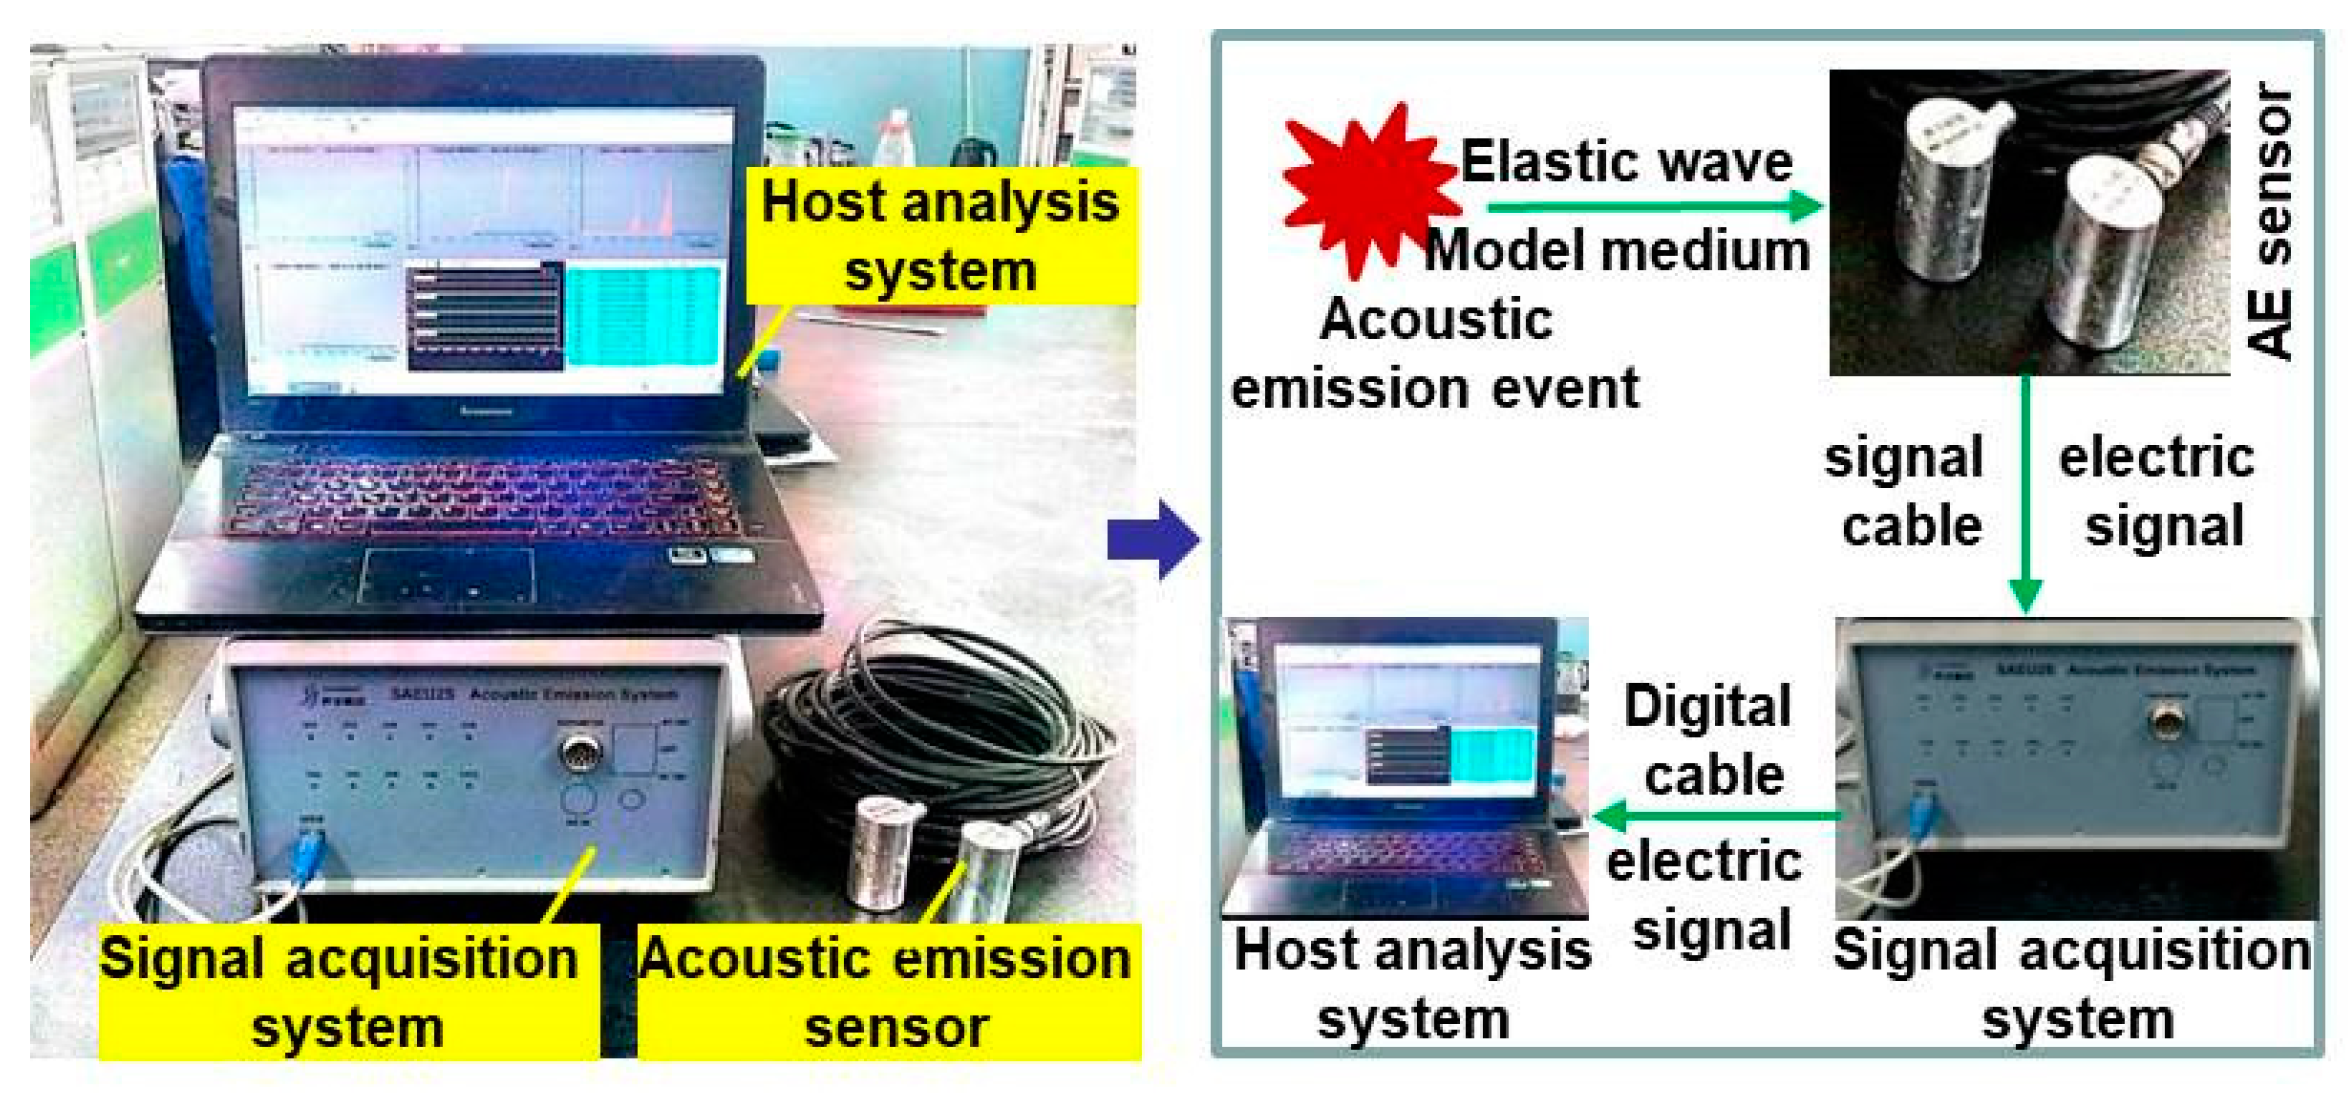
2.2.1. AE Monitoring Principle and Monitoring Device

Figure 2 shows the AE monitoring system used in the physical similar material simulation experiment. This test is equipped with SAEU2S AE monitoring system, which is used to monitor the magnitude of energy released and the number of AE events during the process of mining. Through the analysis of AE signals in the mining process, this can reveal the failure and fracture of overburden in the mining process of working face, so as to grasp the law of overburden breakage and complete the assessment of possibility of rock burst in the mining process.

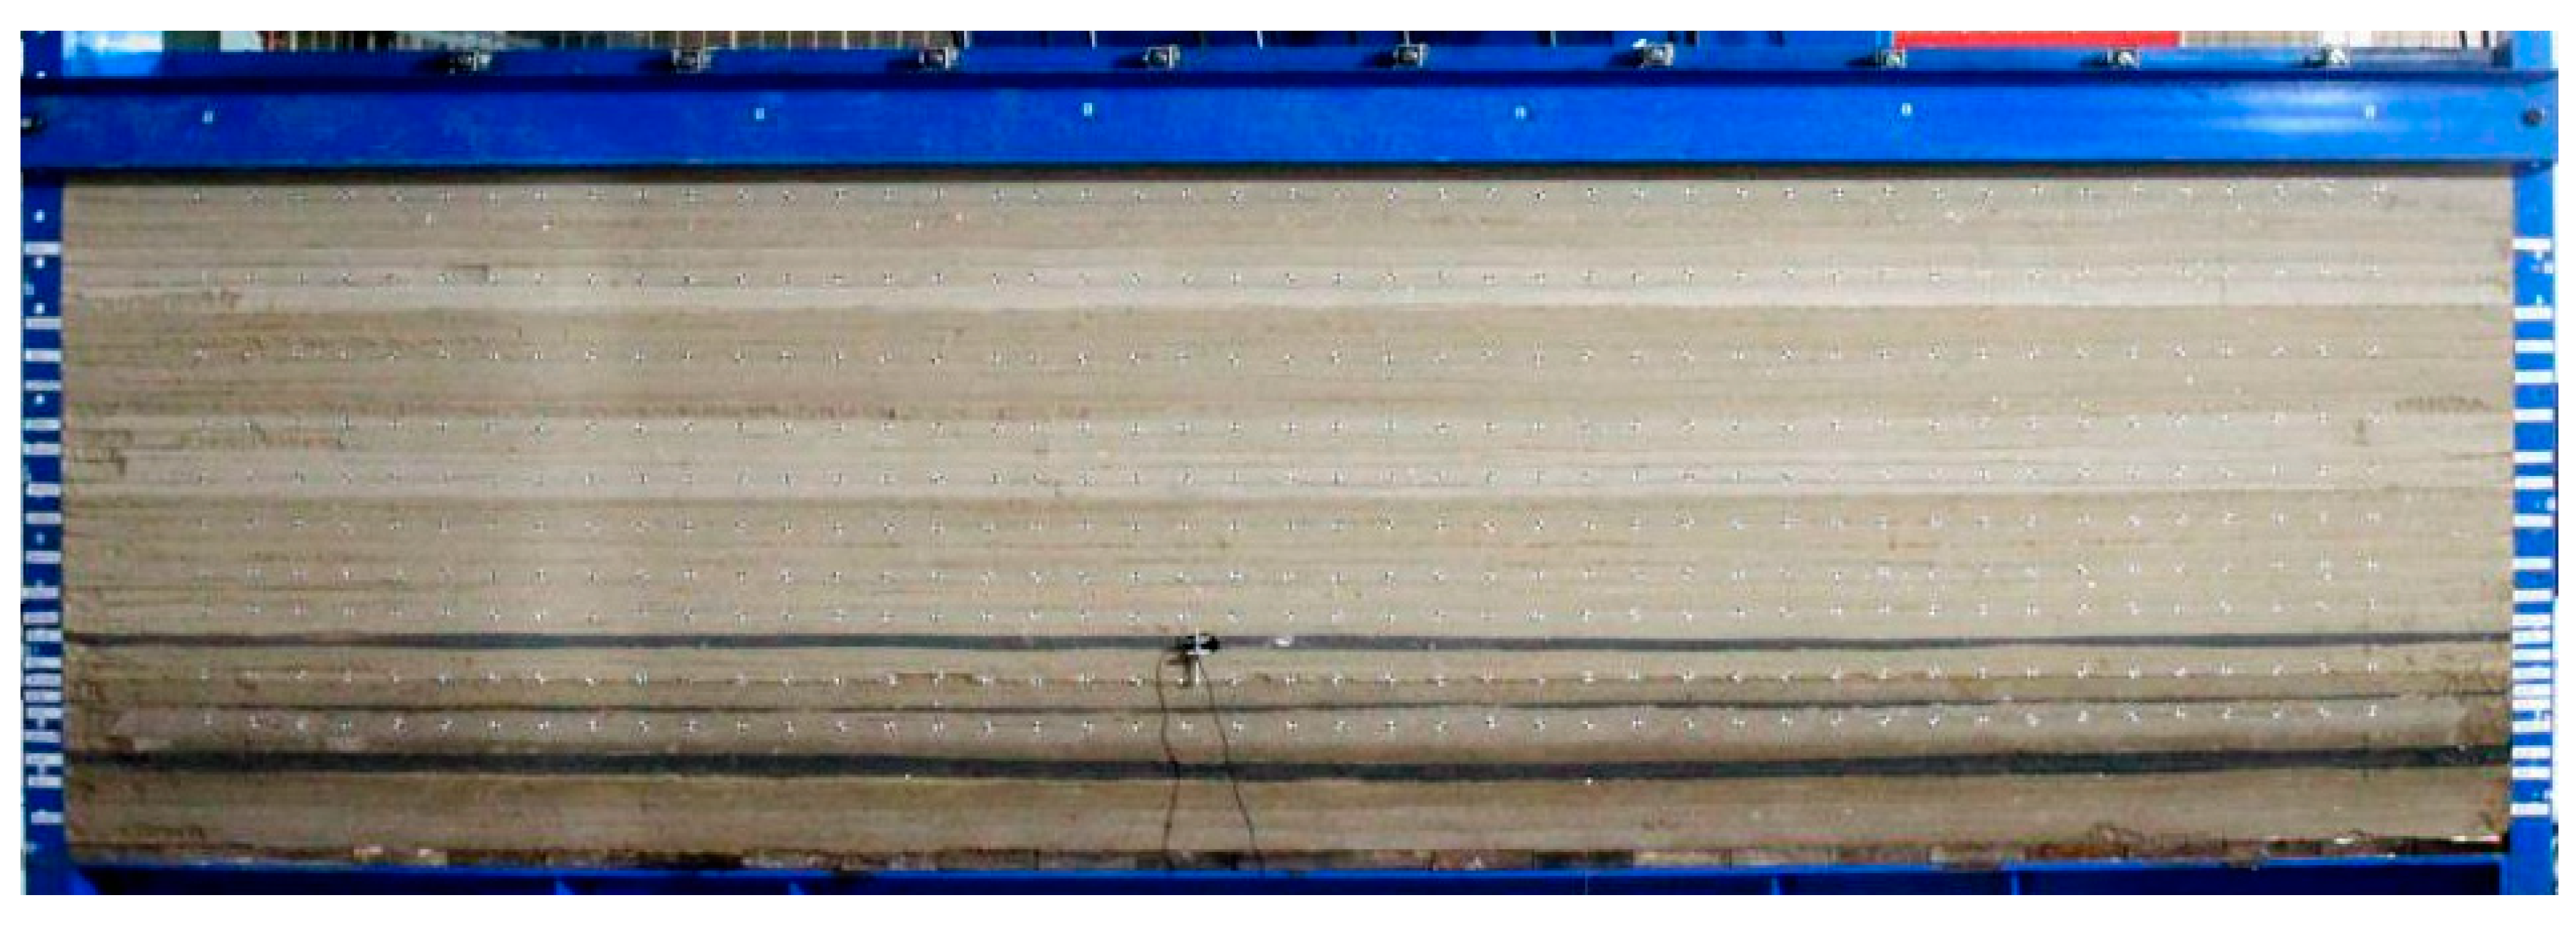
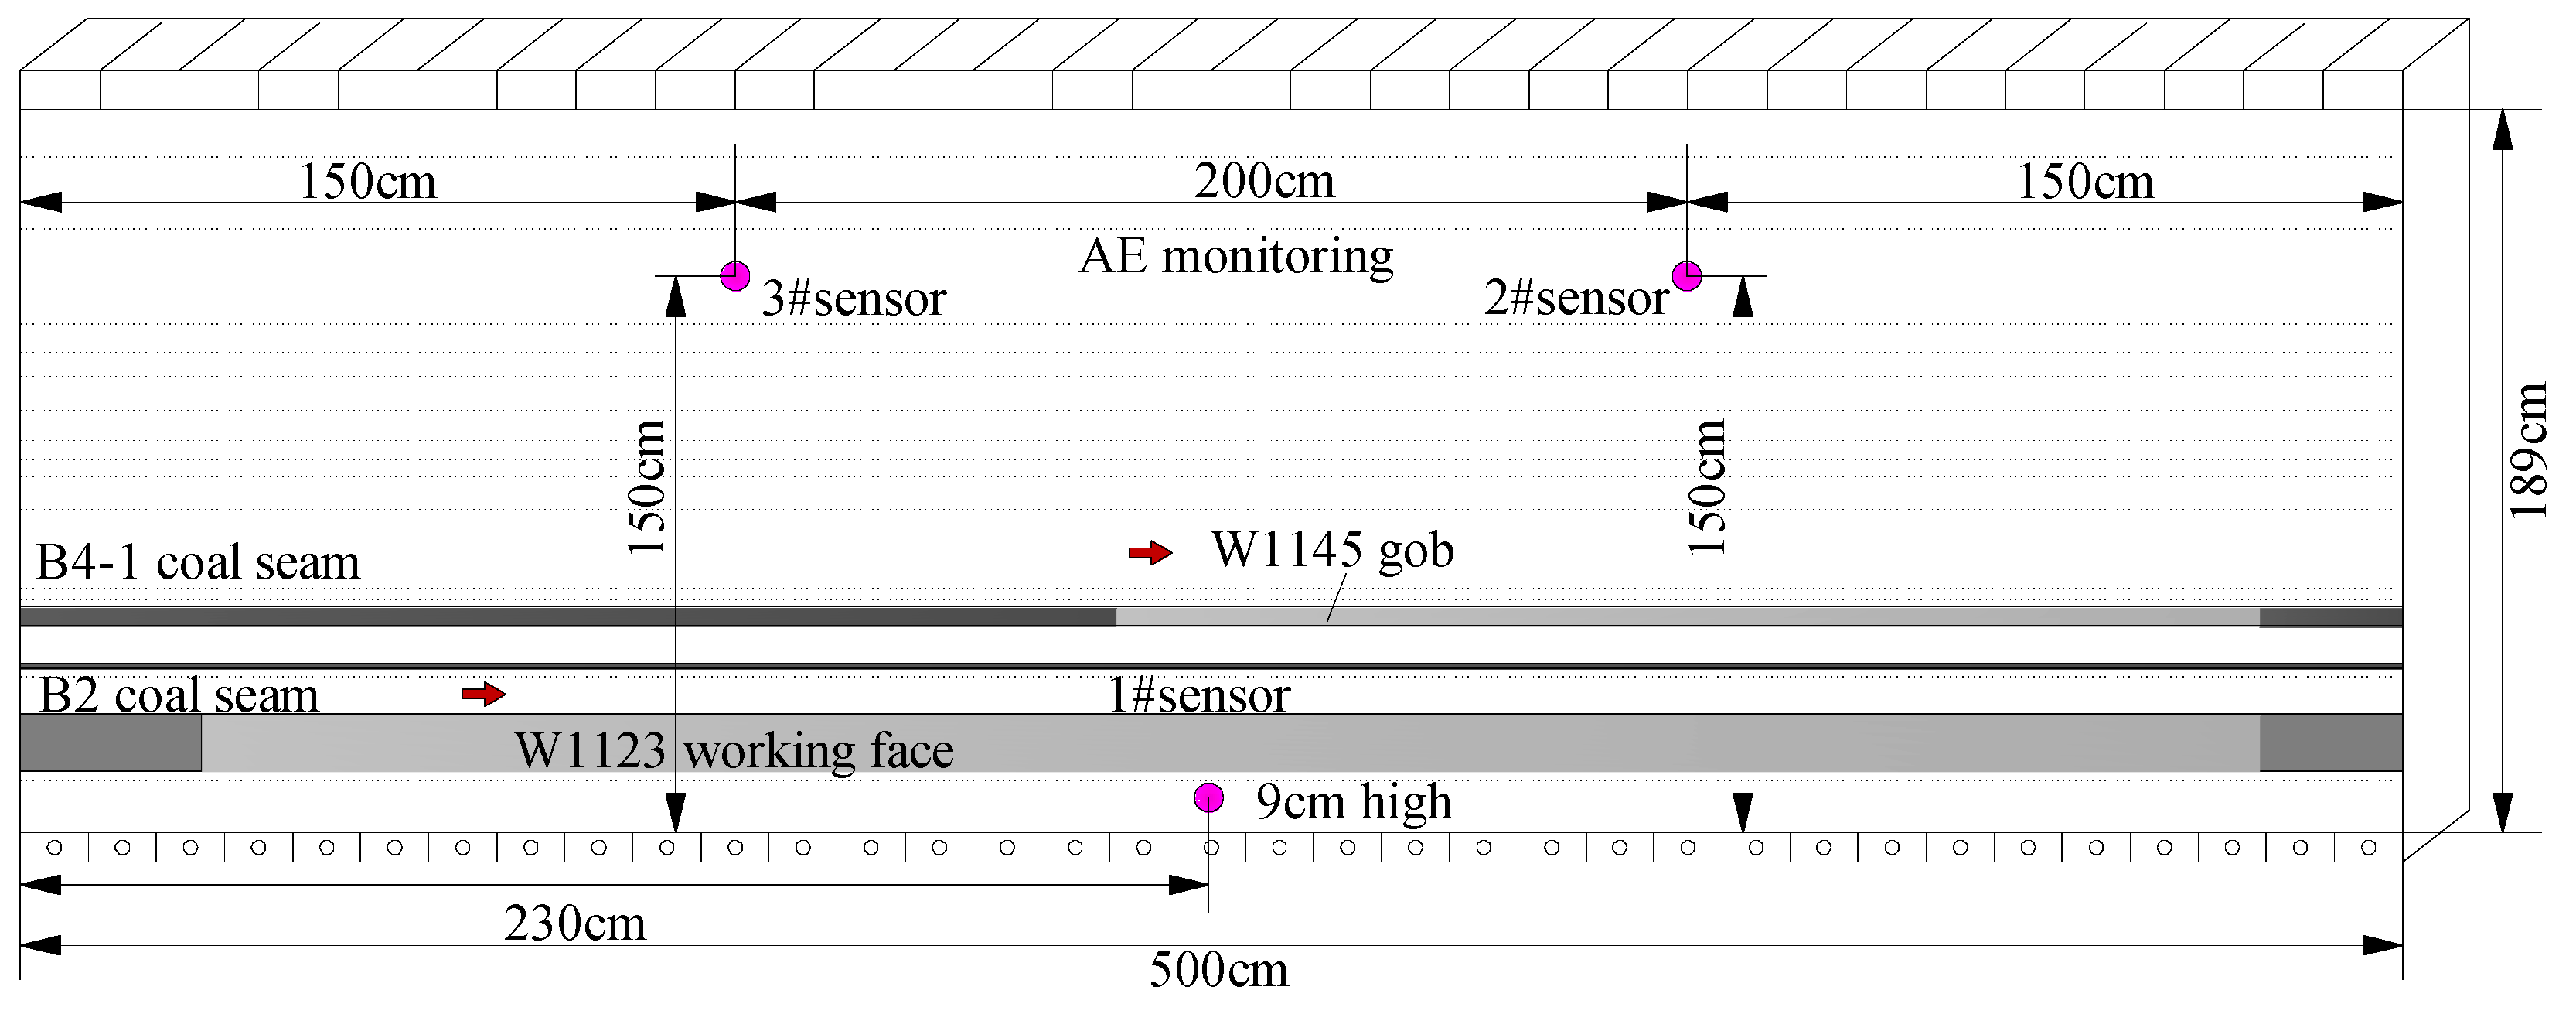
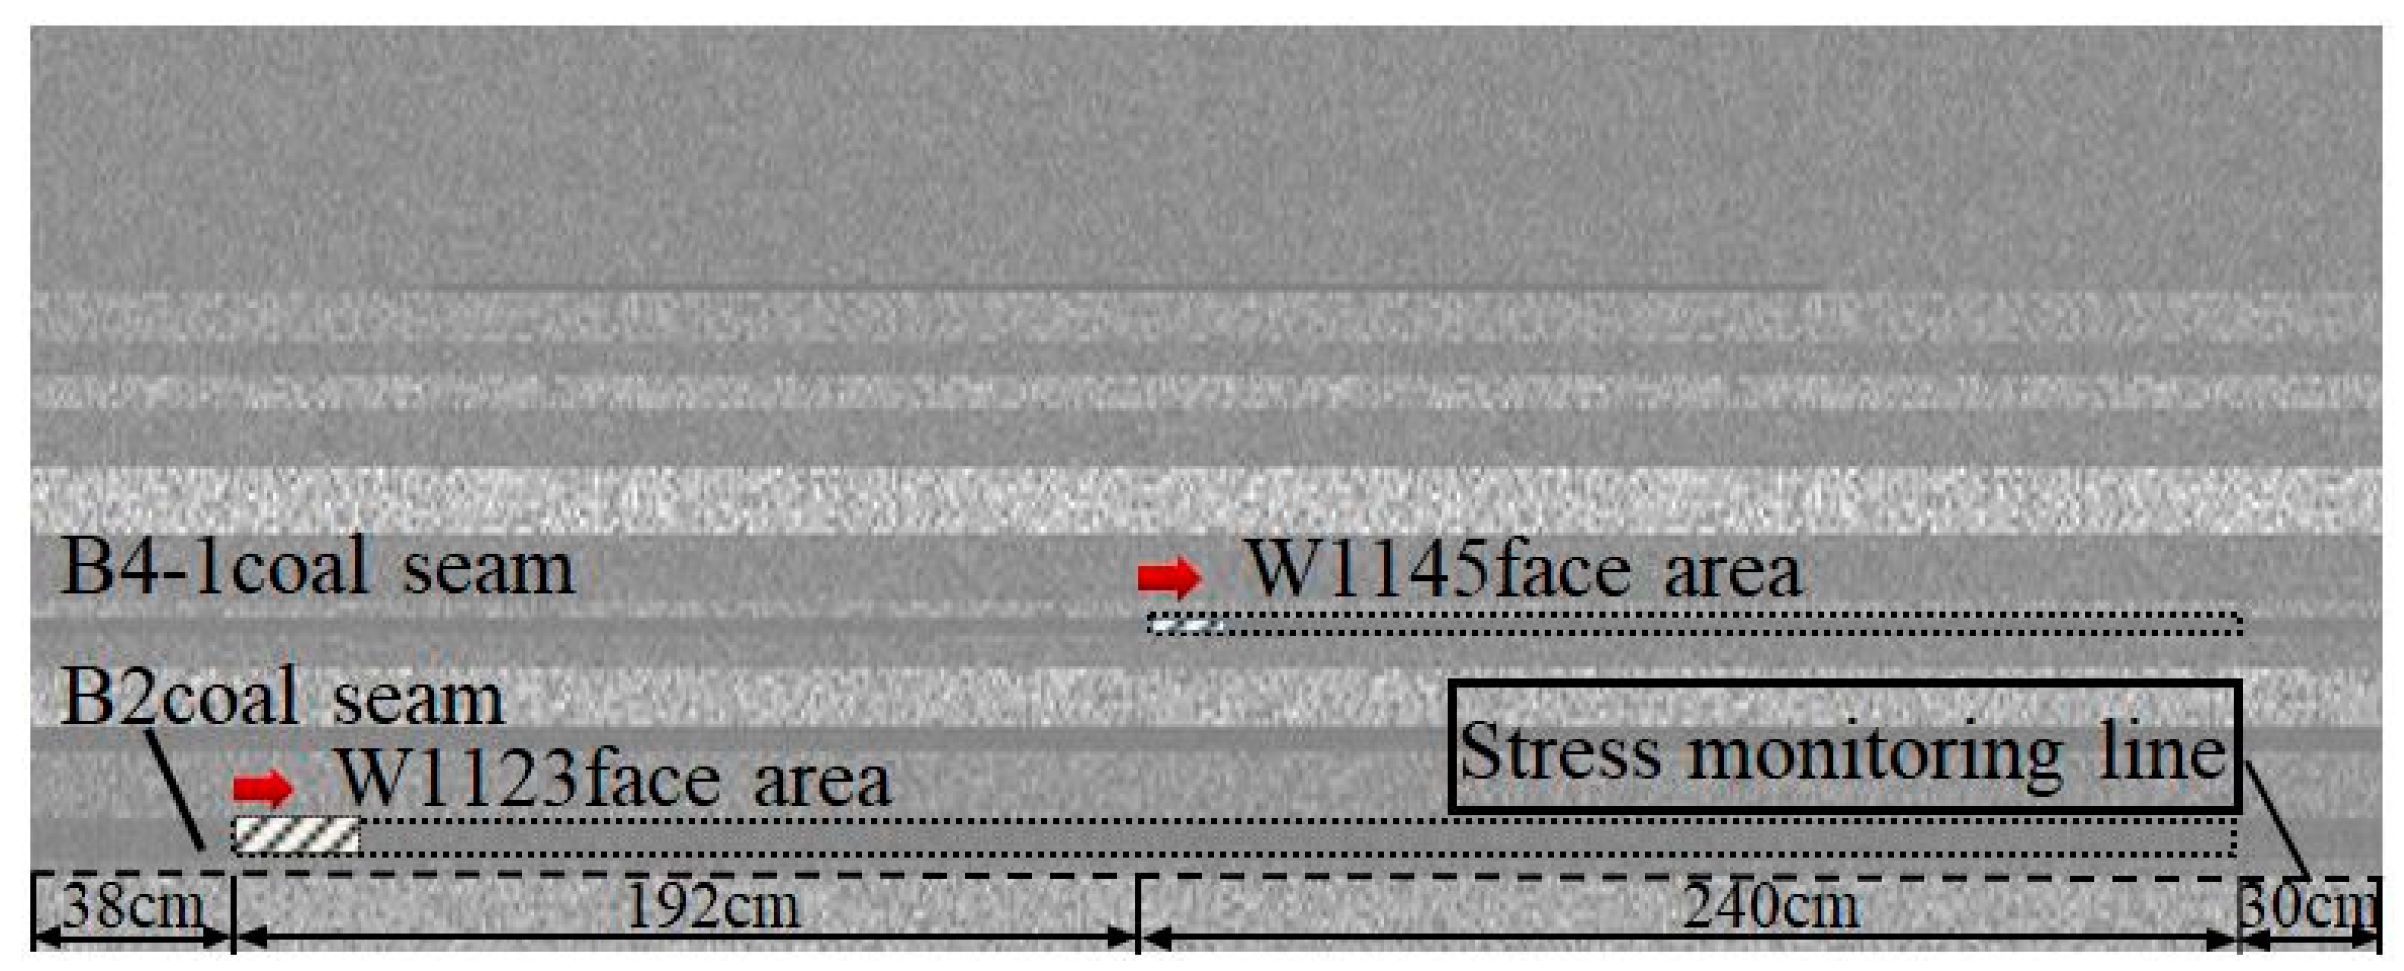
2.2.2. Construction of Similar Model and Layout of AE Monitoring

Figure 3 is the physical similar material simulation experiment model, which is built on the background of W1123 working face in Kuangou Coal Mine. The plane strain model frame with the size of 5.0 × 0.3 × 2 m (long × wide × high) is used in the experiment. The test model with the size of 5.0 × 0.3 × 1.89 m (long × wide × high) is constructed. The geometric similarity ratio of the model is determined to be 1 : 200 (model: prototype). Before the experiment, rock mechanics experiment was carried out to obtain the physical and mechanical parameters of coal seam and rock seam, and the reasonable proportion of similar materials was determined. The main materials such as river sand, big white powder, hydrated gypsum, mica and water are used to pave the test model. Fly ash is added to the coal seam when the coal seam is proportioned. The rock layers are separated by mica and then compacted. Due to the limited height of the model frame, the experiment can’t simulate the actual depth of the working face. Therefore, it is necessary to apply iron bricks on the top of the model frame to replace the simulated overburden load. According to the relevant conversion, an average layer of iron bricks (with a thickness of 10 cm) is paved on the top of model to replace the 40 m simulated rock strata.
Figure 4 is the position of working faces and layout of AE sensors. W1145 working face is firstly mined in the experiment model. After the overburden failure stably, the W1123 working face begins to mine at a distance of 38 cm away from the left boundary in the model, it stops mining at a distance of 30 cm away from the right boundary in the model. Due to the W1145 working face is shorter, there will be a part of solid coal (192 cm) and a part of gob (240 cm) above the W1123 working face. In the on-site mining, the W1145 working face is mined 8 m per day. According to the geometric similarity ratio of 1 : 200 (model: prototype), in the experiment, the W1145 working face is mined 4 cm per time, 60 times in total. After the mining of W1145 working face, the mining of W1123 working face began. Because in the on-site mining, the mining of W1123 working face is 2.4 m per day, so in the experiment, the mining of W1123 working face is 1.2 cm per time, a total of 360 times. The AE signal of overburden failure is monitored during mining.
Because the hard roof of working face is the key part, in order to accurately monitor the AE signal characteristics, 1# AE probes is buried under the B2 coal seam, 2# and 3# AE probes are buried above the roof of the B2 coal seam. The AE devices are debugged before the experiment. The threshold value is 40 dB, sampling frequency is 10 MHz, filtering frequency is 20–100 kHz. The sensor is embedded in the model by coupling agent.

2.3. Definition of AE Large Energy Event

The energy released by overburden failure and the number of failures for AE events can reflect the overburden breakage. Understanding those two can help to grasp the rock movement with ongoing mining disturbance. The relationship between the number of AE events (n) and the nonlinear deformation of coal and rock mass is as follows [25]:
n = a ( d ε ν d t ) b
where a and b are constant, b is generally greater than 1, ε ν is the volume strain of coal and rock mass.
After the coal rock mass reaches the expansion stress, it should be as follows:
ε ν σ 1 = 0
where σ1 is the maximum principal stress.
When the deformation of coal and rock mass enters the stage of non-linear expansion, the volume expands rapidly, the micro-fissures expand to large fracture, the number and intensity of AE events (n) increases significantly, which indicates that the internal stress in coal and rock mass has increased. Therefore, the measurement of AE event can be used to determine the rock burst hazard during the coal mining.
The change velocity of AE energy rate (Er) reflects the fluctuation of AE average energy per unit propulsion length, and its corresponding expression is as follows:
E r = E i N i
where Ei represents the sum of AE energy in the first propulsion, Ni represents the sum of AE ringing counts in the second propulsion, and i is 1–360 in this experiment.
E r ¯ represents the average energy rate of AE in mining process, and its corresponding expression is as follows:
E r ¯ = 1 360 E i N i ¯
For the change velocity of the AE energy rate Er in the unit propellance of coal and rock mass, the corresponding deviation value X is expressed as follows:
X i = E r E r ¯ E r ¯ × 100 %
Formula (3) and Formula (4) are introduced into Formula (5) to obtain:
X i = E i N i 1 360 E i N i ¯ 1 360 E i N i ¯ × 100 %
where Xi represents the deviation of AE energy rate in the ith propulsion length.
In the experiment, AE monitoring is used to obtain the basic data in the whole process of coal seam excavation, then, according to Formula (6), the deviation value of AE event energy rate and AE energy rate are analyzed, and the degree of rock burst hazard can be divided theoretically [26,27].
Based on the statistical analysis of AE monitoring data in this experiment, the average energy rate of AE event during the mining process is obtained, E r ¯ = 2.04 mv·us/n, If E r ¯ ≤ 2.04 mv·us/n is brought into Formula (5), Xi ≤ 0 is obtained, and it is considered that the working face is no rock burst hazard at this time.
According to the distribution statistics of AE energy rate in the mining process of W1123 working face, if the range of AE energy rate Er is 0–4.08 mv·us/n as the confidence interval, the corresponding confidence level and significance level are 90% and 10% respectively. If the AE energy rate Er = 4.08 mv·us/n is taken as the critical value of AE large energy rate event in this experiment, then 2.04 mv·us/n < Eri ≤ 4.08 mv·us/n is brought into Equation (5), and 0 < Xi ≤ 1 is obtained It is considered that there is weak rock burst hazard on the working face at this time.
Considering that the maximum value of AE event energy rate Er in the experiment is 5.59 mv·us/n, if Er = 3 E r ¯ = 6.13 mv·us/n is taken as the critical value of AE event energy rate in this experiment, then 4.08 mv·us/n < Eri ≤ 6.13 mv·us/n will be brought into Formula (5), and 1 < Xi ≤ 2 can be obtained. It is considered that the working face has strong rock burst hazard at this time.
If the AE energy rate Er = 4 E r ¯ = 8.16 mv·us/n is taken as the critical value of AE event energy rate in this experiment, and 6.13 mv·us/n < Eri ≤ 8.16 mv·us/n is taken into Formula (5), then 2 < Xi ≤ 3 can be obtained, and it is considered that the working face has extremely strong rock burst hazard at this time.
Formula (7) gives a clearer summary of the division with the rock burst hazard of the working face:
C r = { X i 0   No   rock   shock   hazard   0 < X i 1   Weak   rock   shock   hazard 1 < X i 2   Strong   rock   shock   hazard 2 < X i 3   Extremely   strong   rock   shock   hazard  
In Equation (7), Cr indicates the degree of rock burst hazard.
When rock burst occurs, Er value will change suddenly. In the past research, when the Er value of AE is greater than 3 mv·us/n, it can predict the impact pressure better. Considering that the average energy rate of AE in this experiment is 2.04 mv·us/n, the event with the energy rate of AE more than 3 mv·us/n in the experiment is defined as the event with potential rock burst hazard, and the event with the energy rate of AE more than 4.08 mv·us/n is defined as the event with high rock burst hazard, that is, the AE large energy event. so as to analyze the region and rule of the occurrence of the large energy rate event in the similar simulation experiment.

3. Results and Discussions

3.1. Simulation of Overburden Breakage Based on AE Monitoring

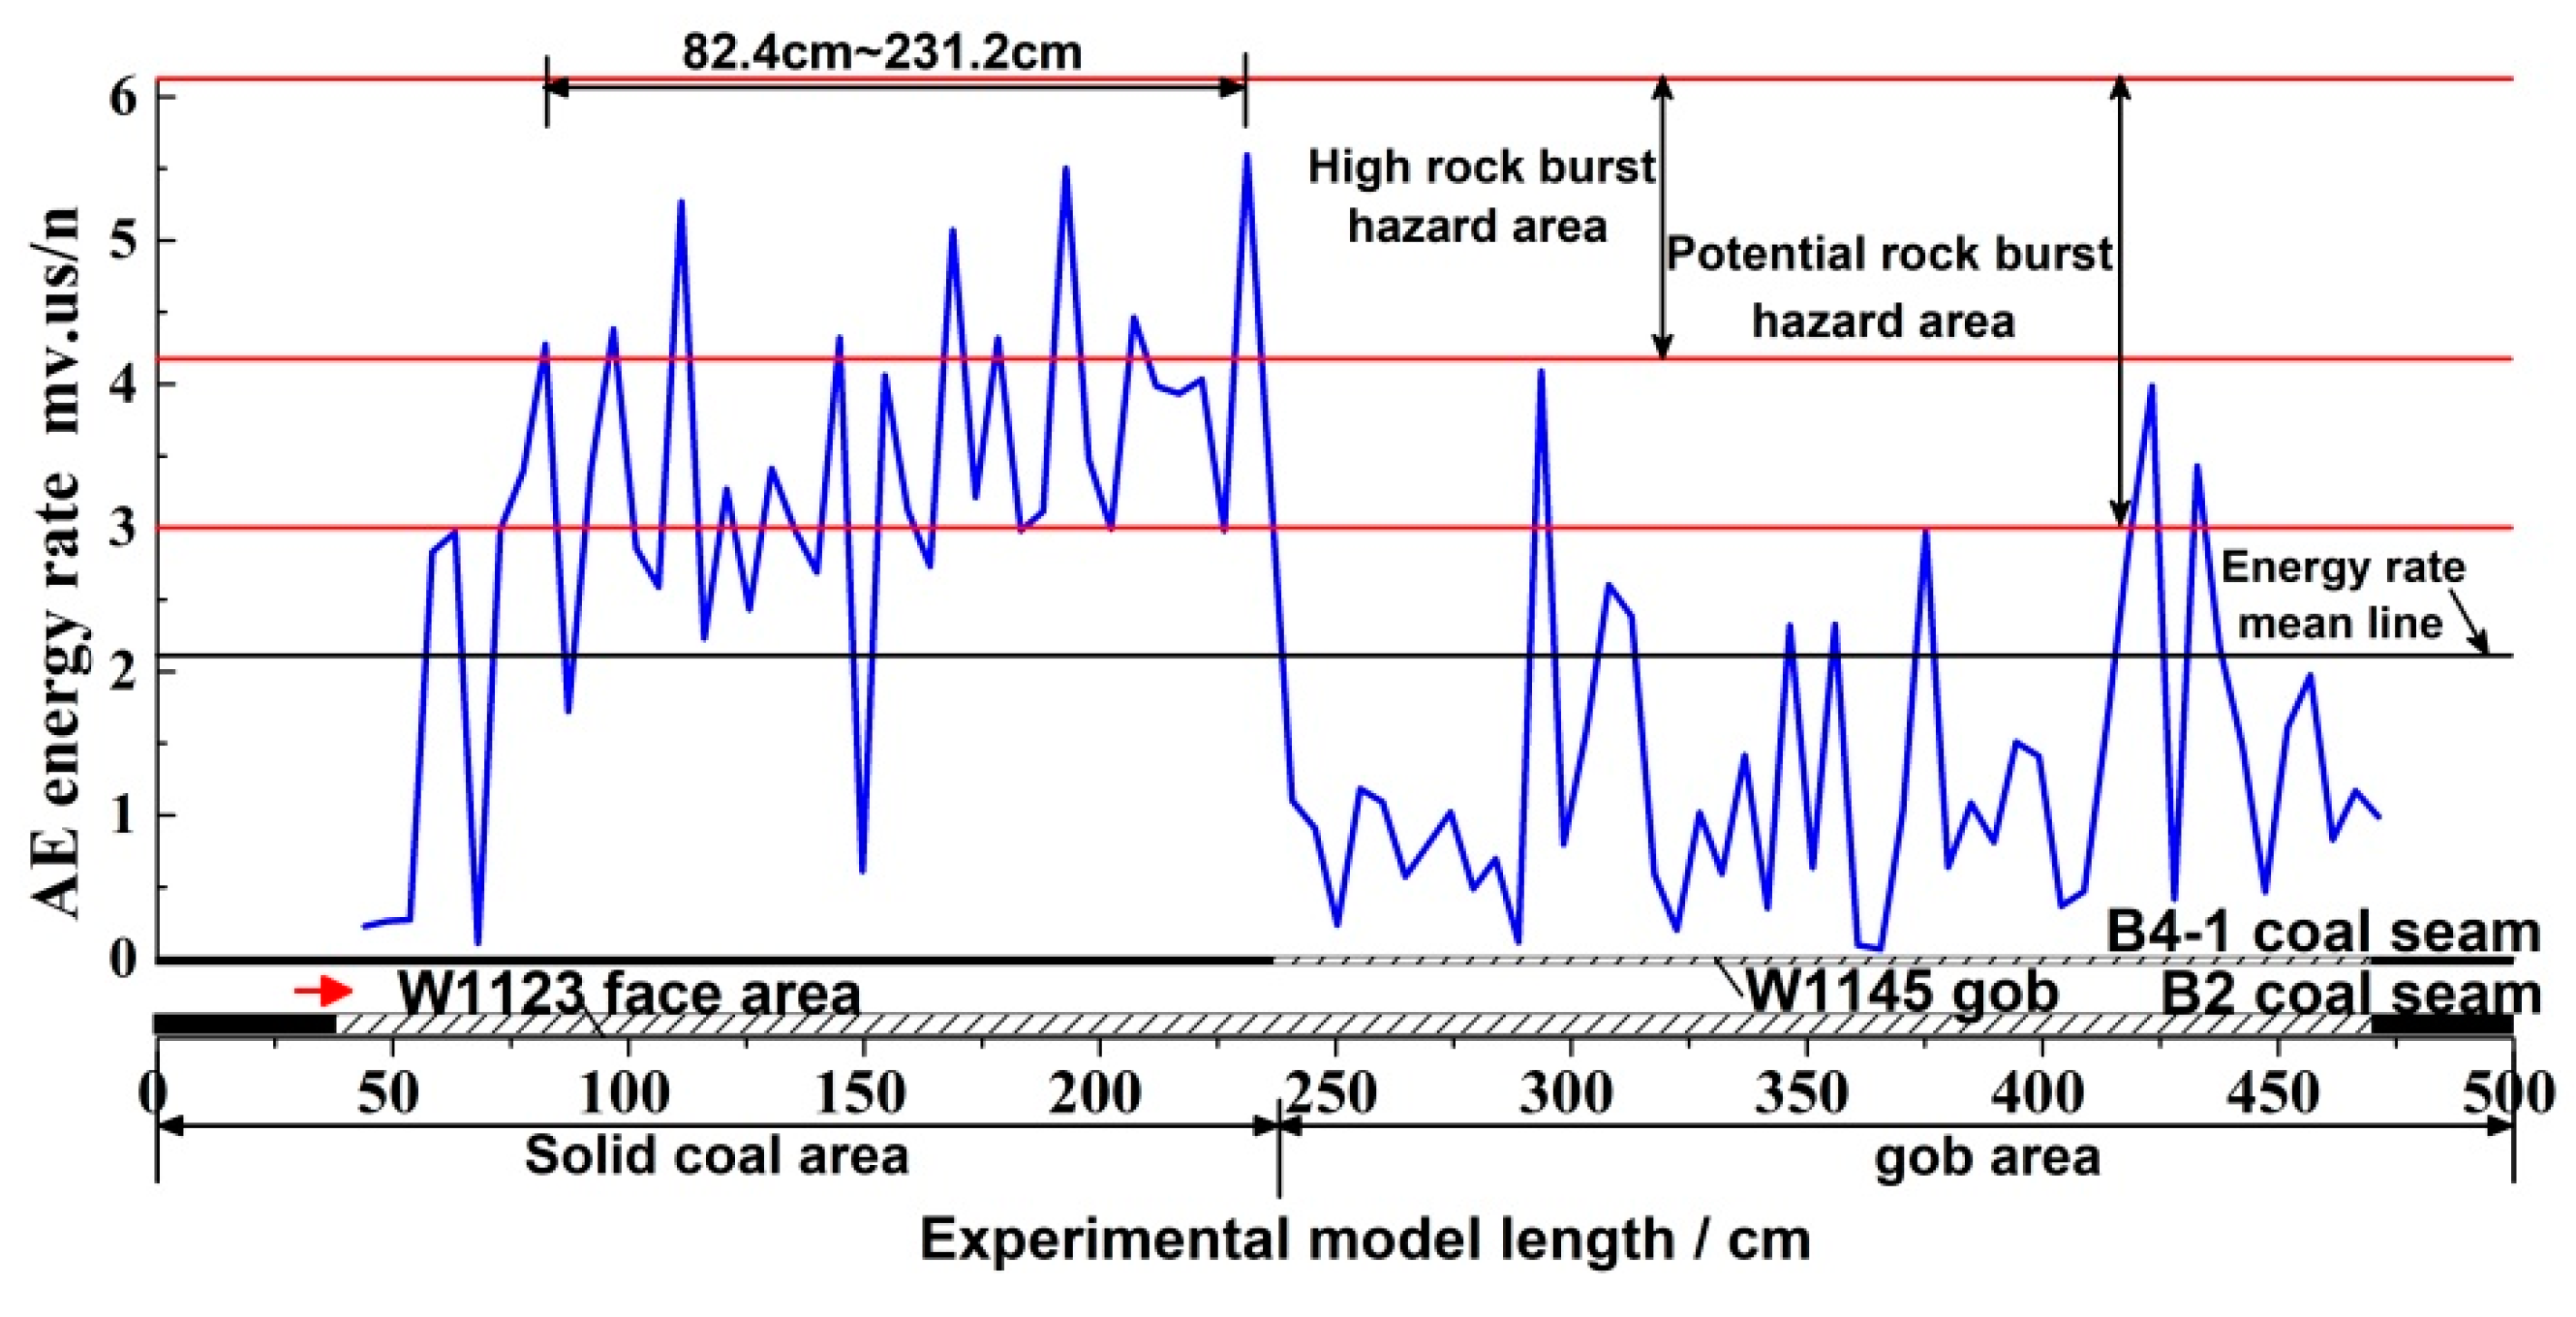
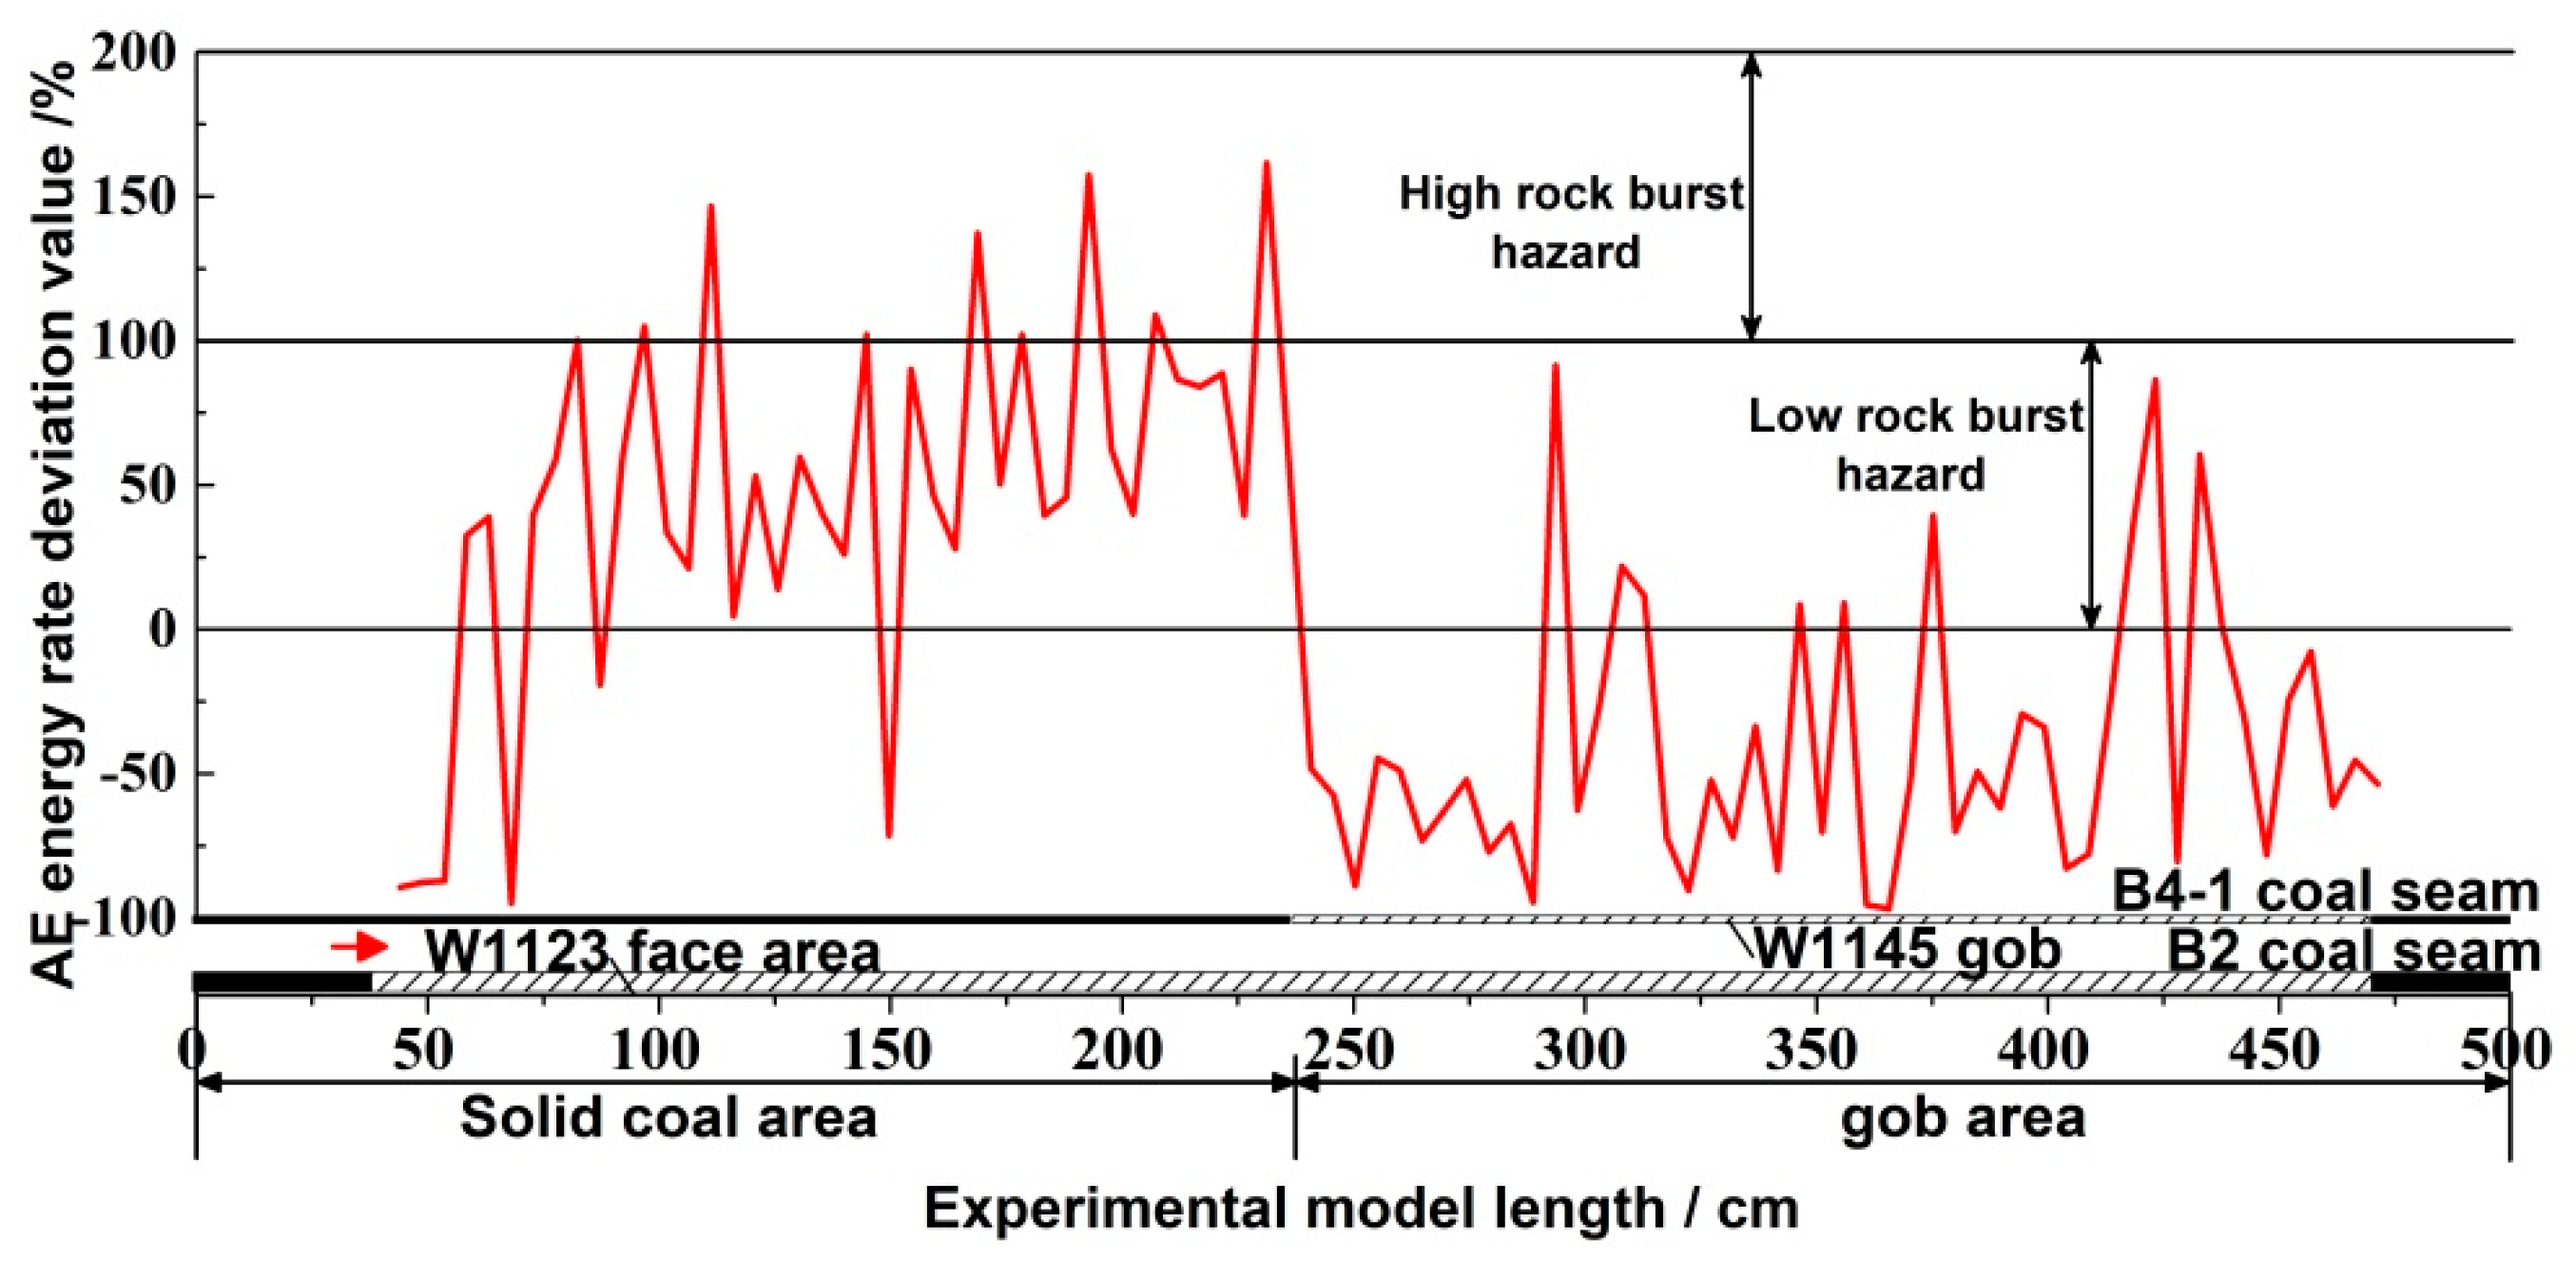
3.1.1. Distribution Characteristics of AE Large Energy Event in W1123

Figure 5 shows the distribution characteristics of AE energy rate in the mining process of W1123 working face. It can be seen from Figure 5 that the AE energy rate value is distributed within the range of 0–5.59 mv·us/n during the mining process in W1123 working face. The average value of AE energy rate is 2.04 mv·us/n. There are 25 events with AE value greater than 3 mv·us/n, of which 21 occurred under B4-1 solid coal, accounting for 84%, only 3 occurred under B4-1 gob, accounting for 12%, and 9 events with AE value greater than 4.08 mv·us/n, all occurred during the mining process under B4-1 solid coal. The events with AE energy ratio higher than 3 mv·us/n mainly occurred under B4-1 solid coal, between 82.4 cm and 231.2 cm.
Figure 6 shows the distribution characteristics of deviation value of AE energy rate in the mining process in W1123 working face. The deviation value of AE energy rate fluctuates in the range of −0.97–1.62, the minimum deviation value of AE energy rate is −0.97, the maximum deviation value of AE energy rate is 1.62, the difference between the two is 2.59, and the deviation value of AE energy rate is greater than 1 for 9 times, all of which occur under B4-1 solid coal, and under B4-1 gob Most of the deviation values of the AE rate are less than 0, without rock burst hazard. Only the deviation values of the AE rate at some positions are greater than 0, but all of them are less than 1, with low rock burst hazard. The overall change trend of the AE rate value is silence active silence, which is more obvious in the gob.
Table 1 shows the distribution position of AE large energy rate events and the corresponding deviation value of AE energy rate of W1123 working face. It can be seen from Table 1 that the AE large energy rate events (AE energy rate greater than 4.08 mv·us/n) all occurred under B4-1 solid coal for 9 times in total. It can be seen from the analysis of Figure 5 and Figure 6 that the AE energy rate of W1123 working face is large during the mining process under B4-1 solid coal, the AE energy rate is mostly in the high-level state above the mean line, and the deviation value of the AE energy rate is mostly in the high-level state above 0. In the mining process of 192.8–231.2 cm, the deviation value of AE energy rate has two big leaps. The calculation shows that the two AE energy rates are greater than 5.5 mv·us/n. According to the mining conditions of the working face, 192.8–231.2 cm is located near the W1145 open-off cut. In order to master the relationship between the rule of overburden failure and the progress of face pushing in different areas during the repeated mining process of the working face, the author monitored the energy released by overburden failure and AE events during the mining process of W1123 working face under B4-1 solid coal and gob.

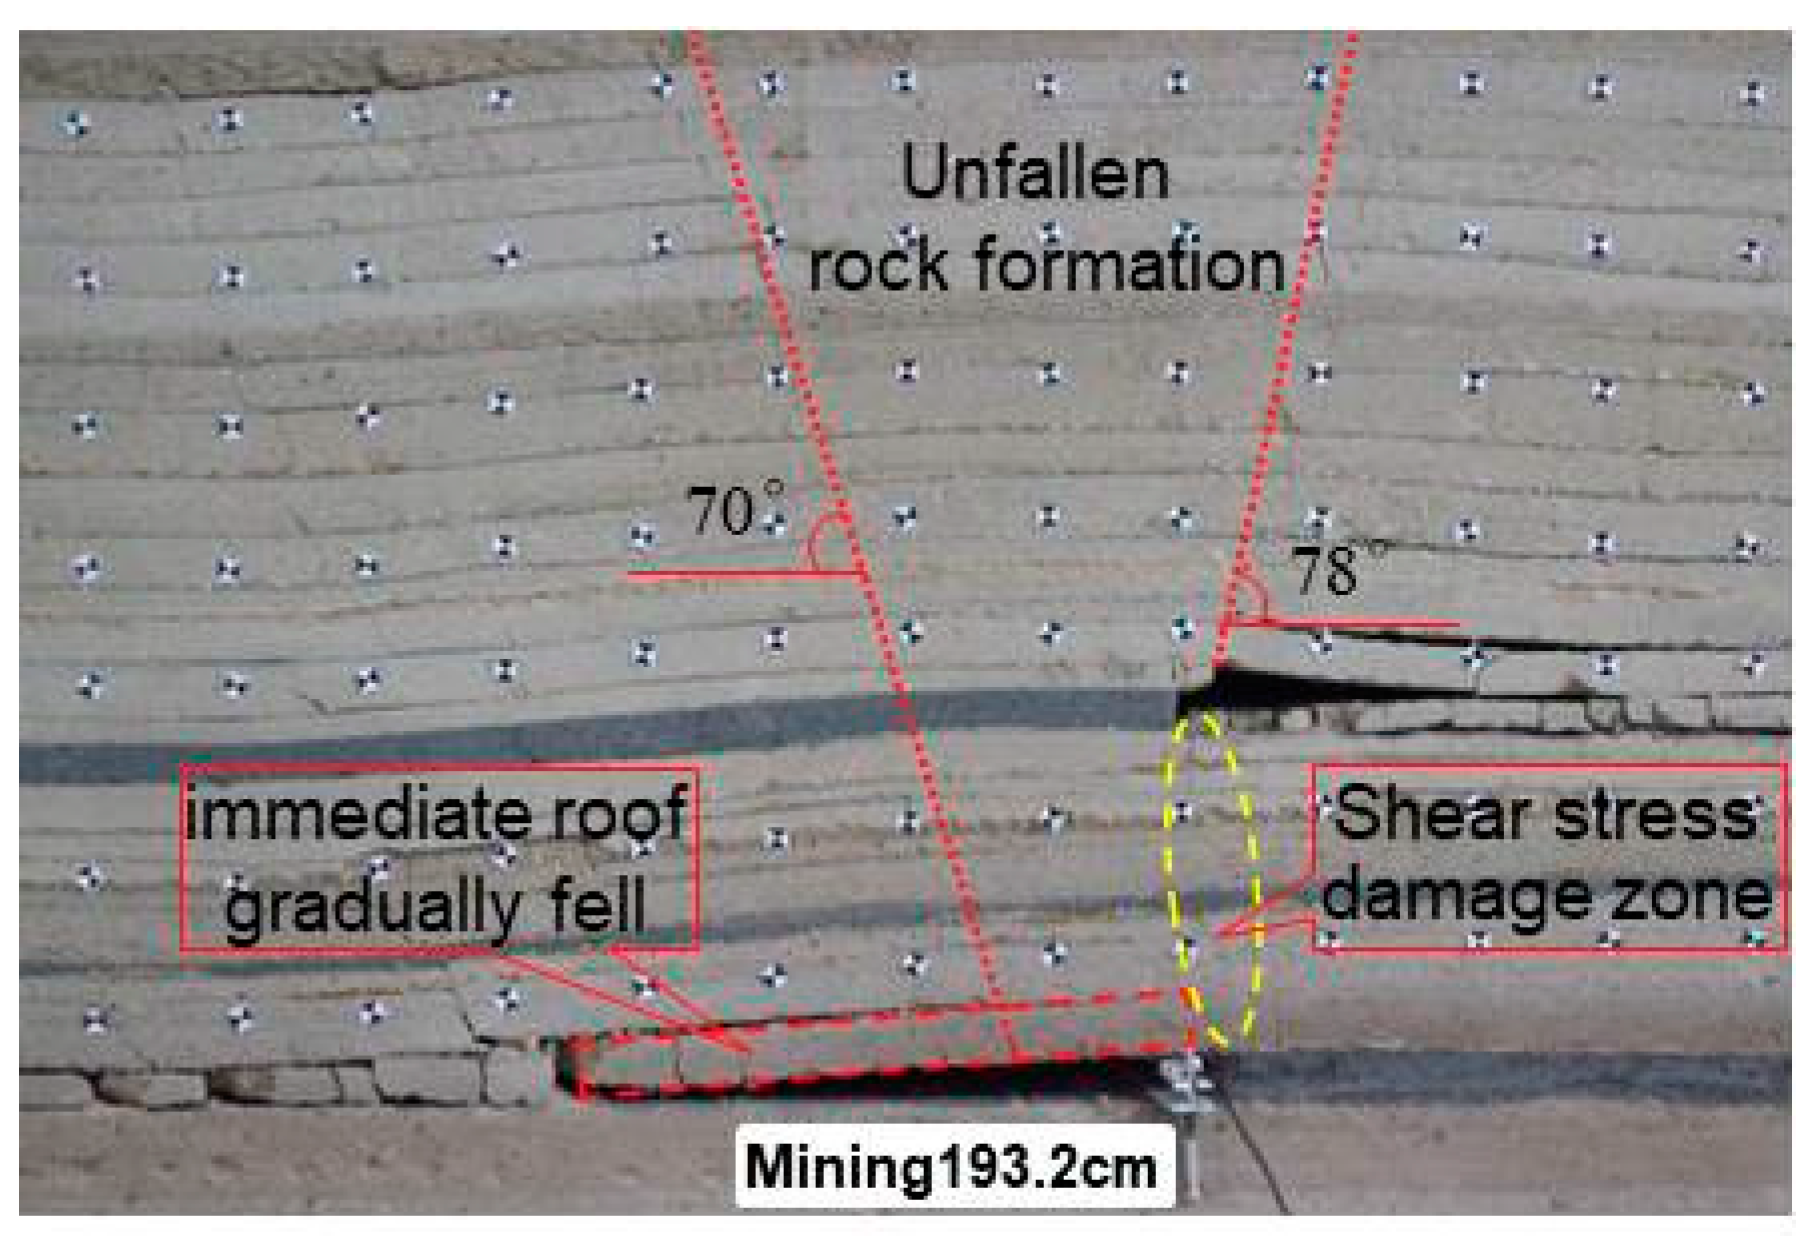
3.1.2. Rule of Overburden Breakage and Characteristics of AE in W1123 Working Face

Figure 7 shows the characteristics of AE signal in the mining process of W1123 working face. Through monitoring the energy released by overburden failure and the number of AE events in the mining process of W1123 working face, it is helpful to master the overburden migration under mining disturbance.
(1) Characteristics of AE signals during mining under B4-1 solid coal
It can be seen from Figure 7 that the AE signal of B4-1 solid coal is weak at the initial stage of mining. The AE signal is gradually enhanced as the work is forward facing. When the working face is mined to 82.4 cm from the left end of the model, the AE signal fluctuates obviously, the total energy value of AE reaches 6.84 × 10⁴ mv·us, and the total number of events reaches 1.6 × 10⁴. From the mining situation, when the working face is mined near 82.4 cm, the immediate roof first failure. In the later mining process, the AE signal grows slowly. When the working face is mined to 111.2 cm from the left end of the model, the AE signal has a sudden change. The total energy value of AE reaches 2.57 × 10⁵ mv·us, and the total number of events reaches 4.87 × 10⁴. According to the mining situation, when the working face is mined near 111.2 cm, the main roof failure, accompanied by obvious pressure phenomenon, andthe overburden of gob appears caving. In the mining process of a certain distance after that, the AE signal fluctuates obviously, showing the change trend of silence active silence as a whole.
Figure 8 shows the failure characteristics of overburden, when the working face is mined near 231.2 cm from the left end of the model. Combined with the mining situation, at this time, the working face is mined at the junction of B4-1 solid coal and gob. When the working face is mined near this time point, there are shear fracture from top to bottom in the overburden, which connects the working face and the upper layer gob. The pressure of the working face is obvious, the roof support is difficult, and the support is pressed. In this stage of mining, the AE signal again appears jumping mutation. The total energy value and total event number of AE reach the maximum value in the model mining process, reaching 3.14 × 10⁵ mv·us and 5.62 × 10⁴ respectively.
(2) Characteristics of AE signals during mining under B4-1 gob
In the early stage of mining under B4-1 gob, the AE signal is weak. When the working face is mined to 264.8 cm from the left end of the model, the AE signal fluctuates obviously. The total energy value of AE reaches 1.74 × 10⁴ mv·us, and the total number of events reaches 3.03 × 10⁴. Combined with the mining situation of the working face, the immediate roof of the working face failure, When the working face is mined to 293.6 cm, the total energy value of AE is 1.06 × 10⁴ mv·us, and the total number of events is 4.32 × 10⁴. Combined with the mining situation of the working face, the main roof of the working face failure, resulting in the re cracking of the compacted strata in the B4-1 gob, and the greater migration of the overburden. After that, the AE signal in the mining process of the working face fluctuates periodically, which is characterized by (high frequency and low energy) with more total AE events and small total energy value. This is related to the re cracking of compacted strata in B4-1 gob. When the working face is mined to 356 cm, the total energy value of AE reaches1.24 × 104 mv·us, and the total number of events reaches 2.89 × 10⁴. Combined with the mining situation of the working face, the separation layer of the working face has developed to the top of the model. During the mining process, the AE signal waveform gradually weakens and tends to be stable.
In summary, during the mining process of W1123 working face under B4-1 solid coal, the AE signal fluctuated obviously, and the AE large energy rate event occurred in the 82.4–231.2 cm range of the model. With the mining of the working face, the AE signal generally presents the trend of silence active silence. In the process of solid coal mining, the energy value of AE is higher, which reflects that the energy released by overburden fracture is larger, and it is easy to induce rock burst. With the working face advancing under B4-1 gob, the AE signal increases gradually. When the working face is mined near the W1145 open-off cut, the AE signal reaches the maximum value. At this time, the working face pressure is obvious. When the working face is mined under the B4-1 gob, the AE signal shows the characteristics of more total events and lower total energy value (high frequency and low energy), which is related to that when the W1123 working face is mined under the B4-1 gob, the compacted strata in the B4-1 gob are disturbed and re cracked by mining. In order to verify the AE monitoring results in the range of 82.4–231.2 cm, the author continues to use the finite element numerical simulation method to analyze the law of stress evolution in this area.

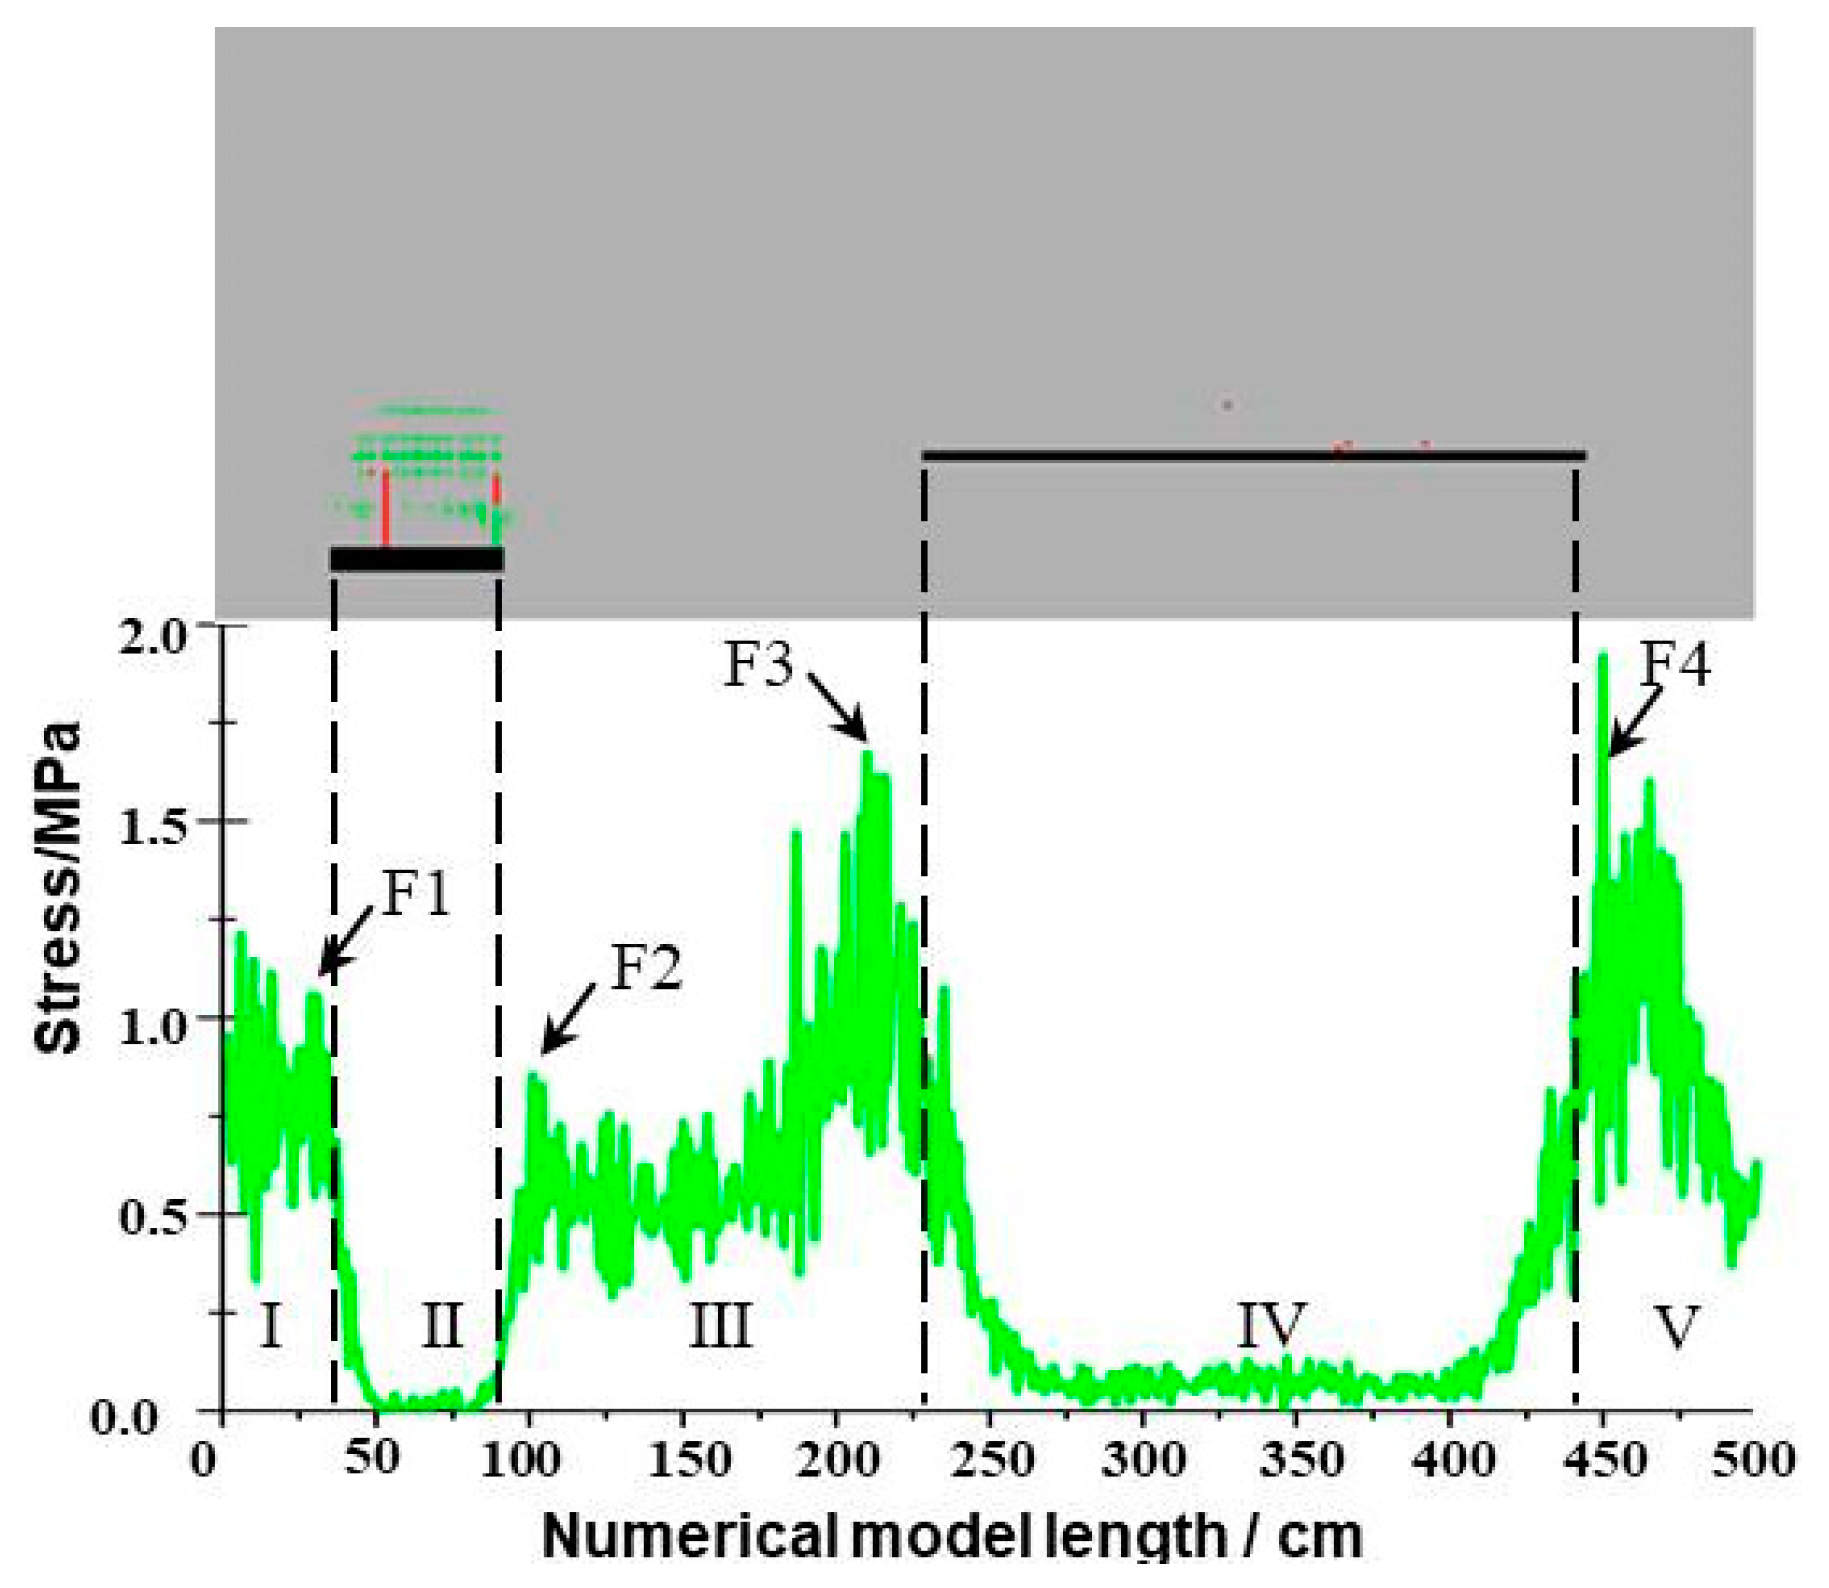
3.2. Numerical Simulation of Stress and AE Distribution Characteristics During Overburden Failure

3.2.1. Election of Numerical Simulation Software and Establishment of Model

RFPA2D (a numerical simulation method based on nonlinearity, heterogeneity, and anisotropy in rock fracturing, which was developed by Dalian Mechanics Software Co. Ltd. in China.) can calculate and dynamically demonstrate the whole process of material from loading to fracture. The whole system has strong openness and expansibility, which is especially suitable for studying the influence of stress redistribution caused by local failure process on further deformation and failure process, as well as the AE characteristics of rock fracture simulation. Because this paper needs to analyze the characteristics of the overall structure and stress change, we choose two dimensional finite difference program RFPA2D is used for numerical calculation and analysis.
Figure 9 is the numerical calculation model of RPFA2D with the size of 500 cm × 189 cm. The basic elements of the model are 0.5 cm × 0.2 cm and the total number of numerical models is 9.45 × 10⁵. In the process of building the model, the actual situation of the working face is fully taken into account. There are beddings between the overburden rocks, the lateral side of the model restricts horizontal movement, and the bottom restricts vertical movement. A stress monitoring line is arranged at the bottom of the model to monitor the stress change characteristics. The mine sequence of coal seam is carried out with reference to similar simulation experiment.

3.2.2. Analysis of Numerical Simulation Results

Figure 10 shows the numerical simulation results when the working face is mined to 82.4 cm. It can be seen from Figure 10 that when the working face is mined to the vicinity of model 82.4 cm, the roof above the working face will be damaged near the coal wall. At this time, the AE signal is obvious, and the AE at the failure point will be concentrated on the model working face and above the gob, indicating that the fracture will continue to expand and develop along the joints and bedding of the overburden. (In the figure, the green failure point is the AE generated by tensile failure, the yellow failure point is the AE generated by shear failure, and the red failure point is the AE generated by the previous calculation steps.)
Figure 10 shows the numerical simulation results when the working face is mined to 82.4 cm. When the working face is advanced to 82.4 cm, there is stress concentration in the monitoring lines I, III and V. In the figure, F3 and F4 are the peak value of residual stress of W1145 working face, F1 is the peak value of residual stress of W1123 working face, F2 is the peak value of advance bearing pressure of W1123 working face, with the maximum stress reaching 0.85 MPa., which appears near 87.4 cm of area III and about 5 cm of advance working face.
Figure 11 shows the numerical simulation results when the working face is mined to 111.2 cm. It can be seen from Figure 11 that when the working face is mined to the vicinity of model 111.2 cm, the failure point develops upward, the number of AE at the failure point increases significantly, and the overburden collapse. With the advance of the working face, there is still a stress concentration phenomenon in the monitoring line I, III and V areas, among which the stress changes little in the areas I and V, and the stress in the area III increases. The stress in F2 increases to 1.25 MPa, 0.4 MPa higher than that in the last monitoring. At this time, F2 is located near 115.8 cm in the area III, about 4.6 cm ahead of the working face.
Figure 12 shows the numerical simulation results when the working face is mined to 231.2 cm. It can be seen from Figure 12 that when the working face is mined to the vicinity of 231.2 cm of the model, the overburden fissures gradually expand and run through, and the number of AE at the failure points increases. There is still a stress concentration phenomenon in areas I, III and V of the monitoring line, where the stress changes little in areas I and V, and the stress increases significantly in Area III, with the maximum stress reaching 7.1 MPa. At this time, F2 is located near 233 cm in the area III and about 1.8 cm ahead of the working face.
Figure 13 shows the numerical simulation results when the working face is mined to 250.4 cm. It can be seen from Figure 13 that when the working face is mined to the vicinity of model 250.4 cm, the overburden is gradually failure, and the number of AE at the failure point is significantly increased. The stress concentration still exists in the areas I, III and V of the monitoring line, among which the stress value in the area III decreases significantly, and the stress value in F2 decreases to 3.6 MPa, 3.5 MPa lower than the last stress value. At this time, F2 is located near 251.6 cm in the area III and about 1.2 cm ahead of the working face.
Based on the numerical simulation experiment, the stress change characteristics of B4-1 face are obtained. The results show that in the process of mining under B4-1 solid coal, the coal wall in front of w1123 working face will release more energy, when the overburden is broken under the superimposition of the advance bearing pressure of this working face and the residual stress of B4-1 gob, which is easy to induce the impact ground pressure. Thus, the reason for the frequent occurrence of AE large energy rate events in the working face mining under B4-1 solid coal in the process of similar simulation experiment is explained and verified.

3.3. Discussions

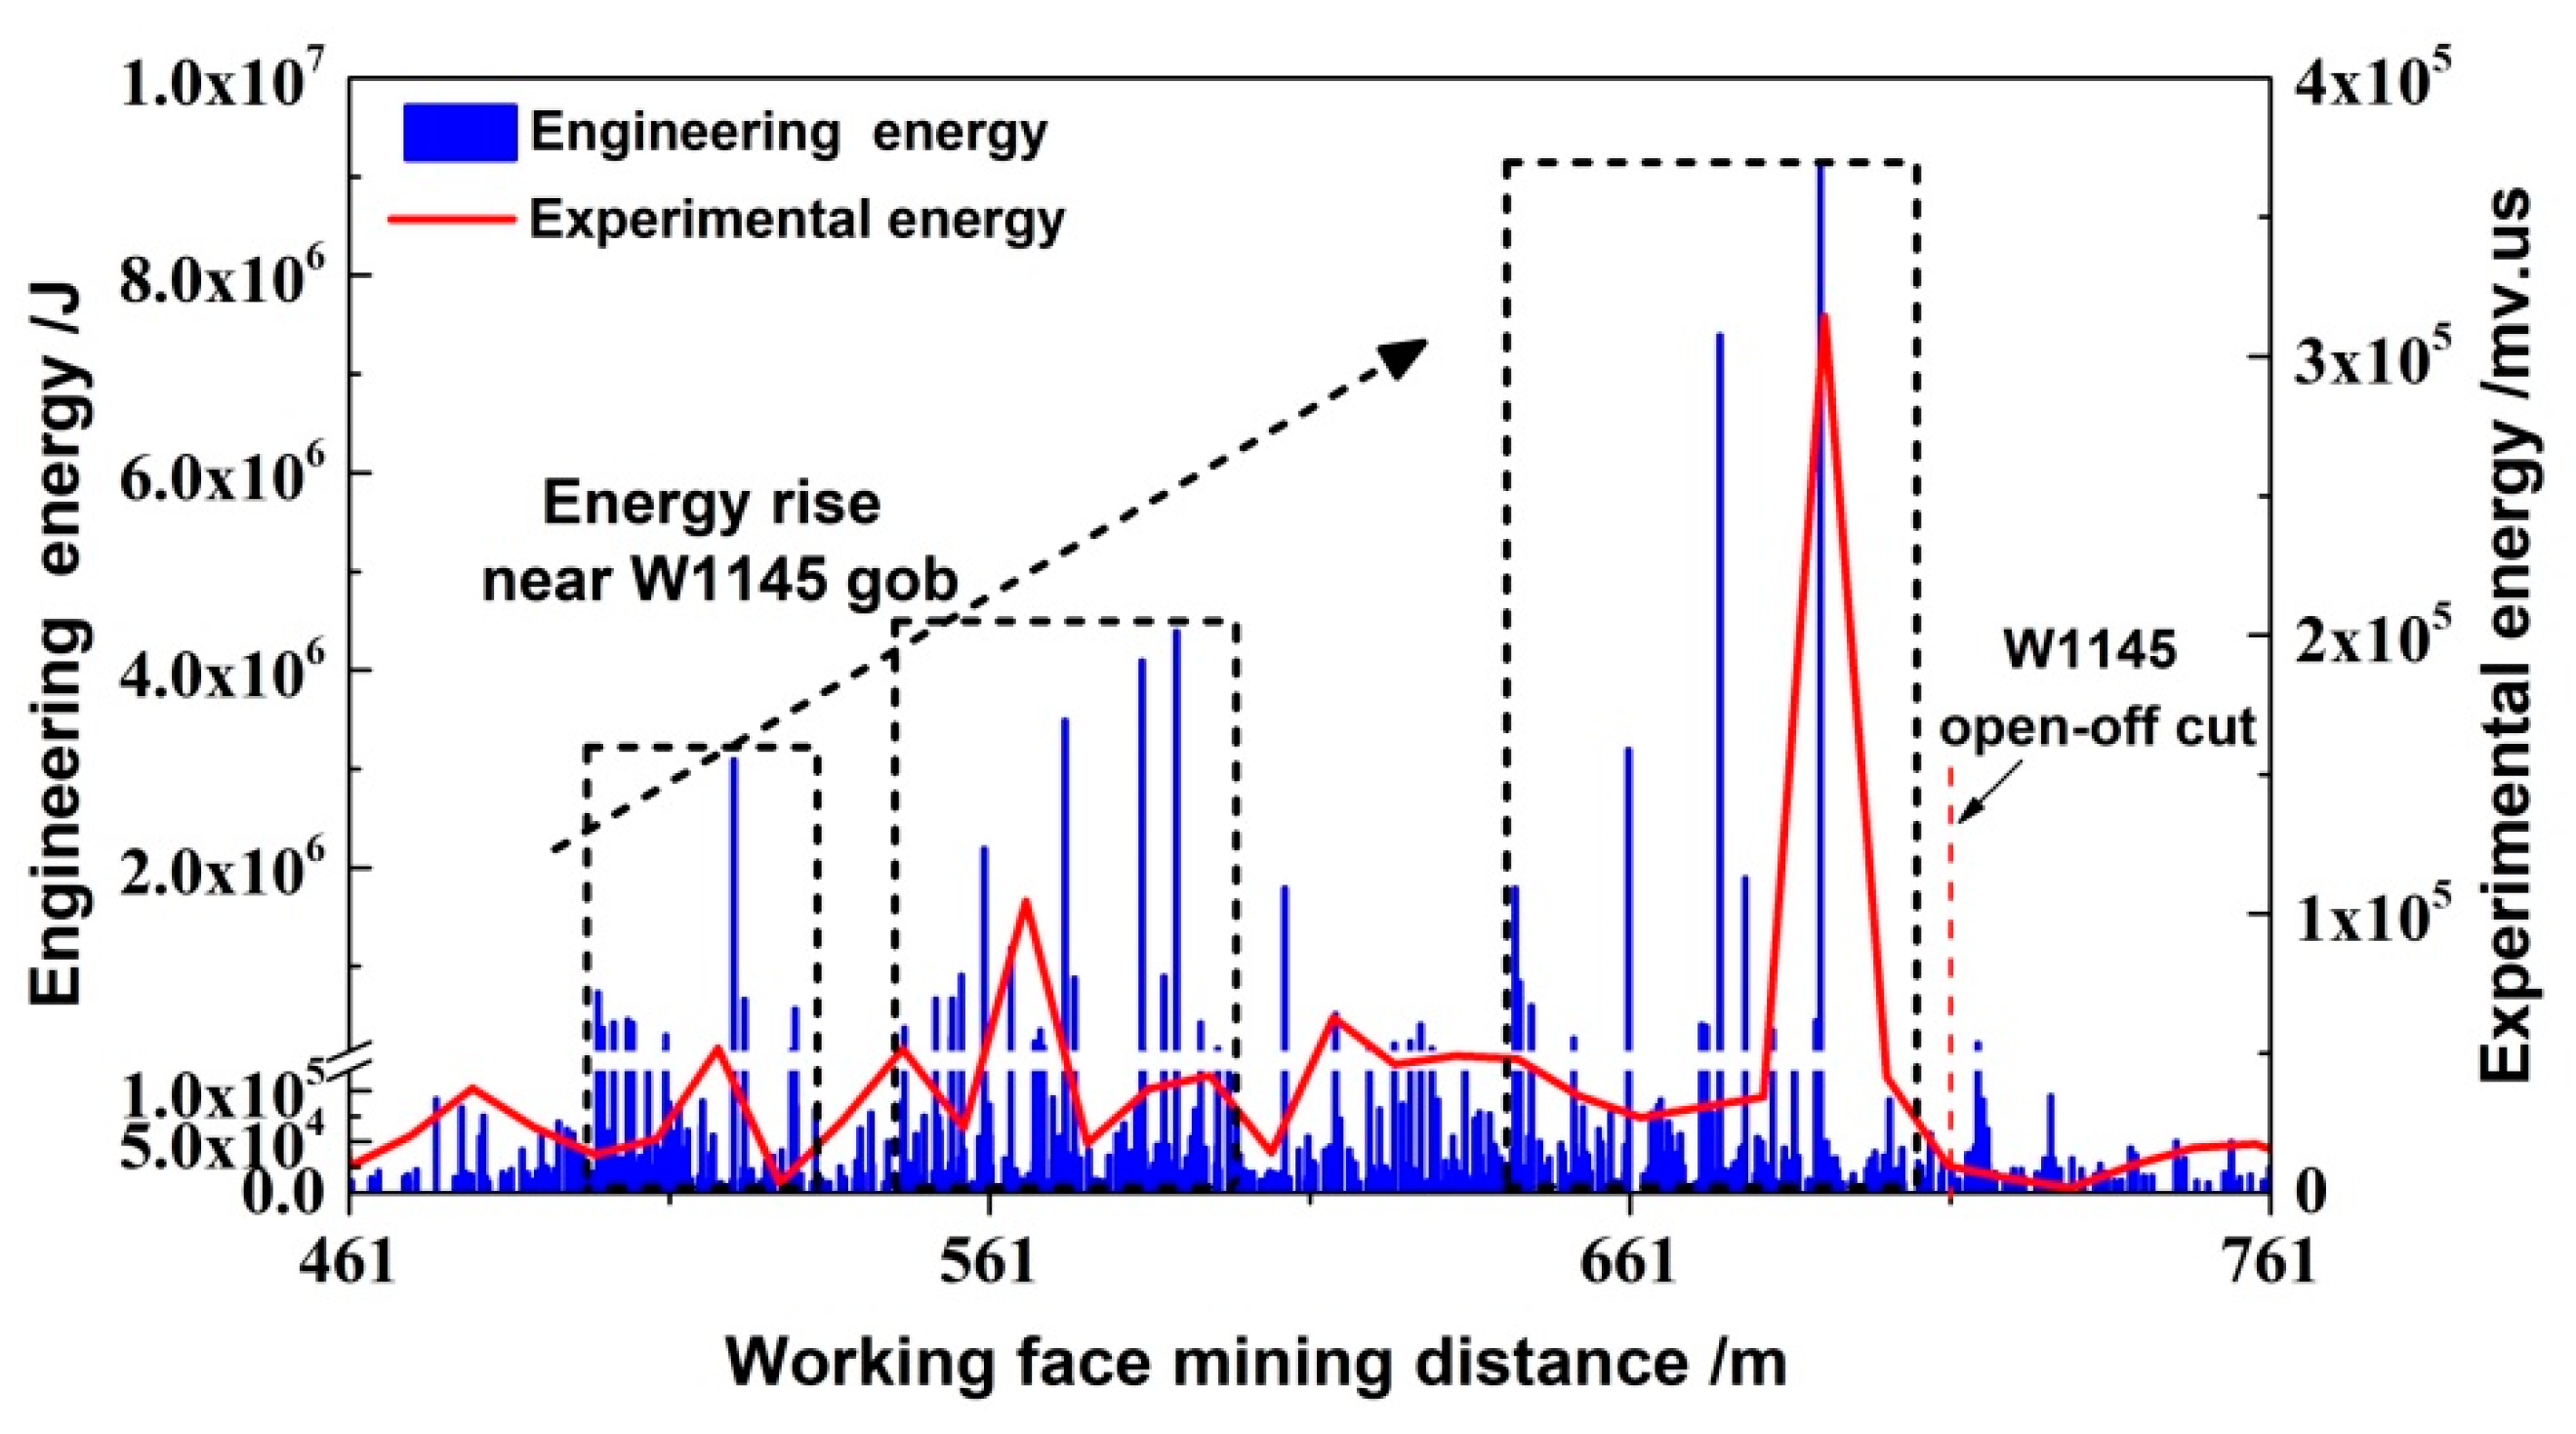
3.3.1. Analysis of Rock Burst Hazard in Working Face

The above experimental results show that in the early stage of mining, the AE signal is not obvious due to the hard roof and good integrity. When the working face is mined to 82.4 cm, the advance bearing pressure of the working face increases, the AE signal increases, and the event of AE large energy rate occurs. The AE energy rate reaches 4.28 mv.us/n, and the rock burst hazard index Cr reaches 1.09, which indicates that the rock burst hazard of the working face begins to appear. When the working face is from 82.4 cm to 111.2 cm, the advance bearing pressure of W1123 working face increases rapidly, the AE signal fluctuates obviously, the event that the AE energy rate is greater than 4.08 mv·us/n occurs twice, the maximum value of the rock burst hazard index Cr reaches 1.58, and the dynamic pressure phenomenon is obvious in the mining of working face. In the mining process of working face from 111.2 cm to 231.2 cm, the advance bearing pressure of working face W1123 and the residual stress of gob W1145 are superposed each other, which makes the peak value of advance bearing pressure of working face increase continuously, the AE signal is obviously enhanced, and the event that the AE energy rate is greater than 4.08 mv·us/n occurs six times, among which when the working face W1123 is mined near 231.2 cm, the advance bearing pressure of working face W1123 is increased It overlaps with the residual stress of W1145 gob as a single peak stress, which makes the pressure coming from the working face obvious, the AE signal fluctuates obviously again, and there is an event of AE large energy rate, the AE energy rate reaches 5.59 mv·us/n, and the rock burst hazard index Cr reaches 1.74, which has a high rock burst hazard. Based on the above research results, it is considered that the W1123 face has a high rock burst hazard when mining under B4-1 solid coal. The rock burst hazard area is mainly located in 82.4–231.2 cm of the model. It is considered that the hard roof of coal seam and the stress concentration in the process of mining from the solid coal to the gob are the main factors inducing the rock burst of W1123 working face.

3.3.2. Engineering Practice Verification and Suggestions

Based on the characteristics of on-site microseismic energy distribution, the above analysis results are verified. The specific way is to expand the laboratory model according to the geometric similarity ratio, and to compare the laboratory energy distribution characteristics with the on-site microseismic energy distribution characteristics in the same length of the open-off cut W1145. Figure 14 is obtained. The abscissa of Figure 14 is the actual mining length of working face W1123, the blue column is the on-site energy peak, and the red broken line is the laboratory energy peak. It can be seen from Figure 14 that the on-site energy distribution is highly consistent with the laboratory energy distribution. With the mining position of the working face close to the W1145 open-off cut, the peak energy shows a growing trend. This is consistent with the conclusion that the rock burst hazard increases gradually with the approach of W1123 working face to W1145 open-off cut. After the open-off cut of W1145, the on-site energy and laboratory energy showed a significant downward trend. This is consistent with the conclusion that when the working face is mined under B4-1 solid coal, the rock burst hazard higher. During the gradual advancement of W1123 working face, there were 11 events with the peak energy greater than 1 × 10⁶ J in total, among which there were 8 events with the peak energy greater than 2 × 10⁶ J, which were respectively located in the three areas of 480–540 m, 550–600 m and 650–700 m, as shown in the black block diagram in the figure. However, in the similar simulation experiment, there were large energy events in the peak area, which showed that it was true that near the gob W1145. It will increase the rock burst hazard events.
It is suggested to strengthen the management in the area of rock burst hazard, on the one hand, to reduce the hanging area of the roof in the working face. on the other hand, to reduce the stress concentration in front of the coal wall. The concrete method is to carry out deep hole presplitting blasting and top cutting blasting in the roof, it can reduce the accumulation of high stress. During the mining period, the main methods are deep hole loose blasting, coal body pressure relief blasting and large-diameter empty hole blasting, which can improve the caving ability of top coal and reduce the transmission efficiency of energy released by overburden breaking to the working face space.

4. Conclusions

Based on the statistical analysis of the AE data of the similar simulation experiment W1123 working face, the average AE energy rate of this experiment is 2.04 mv·us/n. The event with the AE energy rate more than 4.08 mv·us/n is defined as the AE large energy rate event of this experiment. It is found that the AE large energy rate event in the mining process of W1123 working face mainly occurs under the B4-1 solid coal, located between 82.4 cm and 231.2 cm of the model, In the process of mining under the gob, the AE energy rate of the working face is mostly in the low-level state below the mean line. In the process of mining under the B4-1 gob, the AE signal shows the characteristics of “high frequency and low energy”.
Through monitoring the stress distribution of numerical simulation, it is found that the model 82.4–231.2 cm is the stress superposition area. As the working face moves from B4-1 solid coal to the gob, the advance bearing pressure of W1123 working face overlaps with the residual stress of W1145 working face, the peak stress increases continuously, and finally reaches the maximum value near the open-off cut of W1145, forming a single high stress pressure peak, and it is confirmed by the AE signal in this area.
Based on the comparison of energy distribution characteristics in this area with that on-site mining process, it is considered that the rock burst hazard of W1123 working face is the result of the joint action of hard roof and stress concentration in the repeated mining process. It is suggested that necessary prevention and control measures should be taken for the working face in this area to ensure the safe production of the mine.

Author Contributions

F.C., X.L. and J.C. (Jianqiang Chen) conceived and designed the experiments; S.D., J.C. (Jiantao Cao) and P.S. performed the experiments and analyzed the data; F.C., J.C. (Jianqiang Chen), P.S. and S.D. wrote the paper.

Funding

This work is sponsored by the National Natural Science Foundation of China (No. 51874231, 51504184), which is part of the Shaanxi Natural Science Fundamental Research Program Enterprise United Fund (2019JLZ-04). “Special Support Program” of Shanxi Province in 2017 and Shaanxi Innovation Team Program (No. 2018TD-038) are gratefully acknowledged. The authors wish to acknowledge the financial supports of Outstanding Youth Science Fund of Xi’an University of Science and Technology (2019YQ2-16).

Conflicts of Interest

The authors declare no conflict of interest.

References

  1. Wang, G.F.; Gong, S.Y.; Dou, L.M.; Cai, W.; Yuan, X.Y.; Fan, C.J. Rock burst mechanism and control in coal seam with both syncline and hard strata. Saf. Sci. 2019, 115, 320–328. [Google Scholar] [CrossRef]
  2. Wang, P.; Jiang, L.S.; Zheng, P.Q.; Qin, G.P.; Zhang, G.P. Inducing mode analysis of rock burst in fault-affected zone with a hard–thick stratum occurrence. Environ. Earth Sci. 2019, 78, 467. [Google Scholar] [CrossRef]
  3. Feng, X.J.; Wang, E.Y.; Shen, R.X.; Wei, M.Y.; Chen, Y.; Cao, X.Q. The dynamic impact of rock burst induced by the fracture of the thick and hard key stratum. Procedia Eng. 2011, 26, 457–465. [Google Scholar]
  4. Shen, W.L.; Wang, M.; Cao, J.; Su, F.Q.; Nan, H.; Li, X.L. Mining-Induced Failure Criteria of Interactional Hard Roof Structures: A Case Study. Energies 2019, 12, 3016. [Google Scholar] [CrossRef] [Green Version]
  5. Zhao, T.B.; Guo, W.Y.; Tan, Y.L.; Yin, Y.C.; Cai, L.S.; Pan, J.F. Case Studies of Rock Bursts Under Complicated Geological Conditions During Multi-seam Mining at a Depth of 800 m. Rock Mech. Rock Eng. 2018, 51, 1539–1564. [Google Scholar] [CrossRef]
  6. Sun, S.G.; Gong, Z.Q.; Wei, S.Y. The Study of Rock Burst Induced by Underground Mining Excavation. DEStech Trans. Environ. Energy Earth Sci. 2017, 7857. [Google Scholar] [CrossRef]
  7. Liang, P.; Zhang, Y.B.; Tian, B.Z.; Yao, X.L.; Sun, L.; Liu, X.X. Experimental study on energy evolution characteristics in the process of tunnel rock burst. Chin. J. Rock Mech. Eng. 2019, 38, 736–746. [Google Scholar]
  8. He, J.; Dou, L.M.; Wang, S.W.; Shan, C.H. Study on mechanism and type of hard roof inducing rock burst. J. Min. Saf. Eng. 2017, 34, 1122–1127. [Google Scholar]
  9. Pan, Y.S.; Li, Z.H.; Zhang, M.T. Distribution, type, mechanism and prevention of rock burst in China. Chin. J. Rock Mech. Eng. 2003, 22, 1844–1851. [Google Scholar]
  10. Lan, H.; Du, T.T.; Peng, Y.W.; Zhang, C.J. Rock-burst mechanism and prevention in working face of shallow buried coal-seam. J. China Coal Soc. 2012, 7, 1618–1623. [Google Scholar]
  11. Lu, J.G.; Jiang, Y.D.; Li, S.G. Characteristics and mechanism research of coal bumps induced by faults based on extra thick and hard roof. J. China Coal Soc. 2014, 39, 1961–1969. [Google Scholar]
  12. Pang, X.F. Study on the Mechanism and Prevention Technology of Rock Burst in Isolated Island Face with Hard Roof; China University of Mining and Technology: Beijing, China, 2013. [Google Scholar]
  13. Li, X.H.; Zhang, X.D. Mechanism and prevention of rock-burst by immediate roof breakage in shallow-buried coal seam. J. China Coal Soc. 2017, 42, 510–517. [Google Scholar]
  14. Li, H.G.; Li, H.M. Mechanical properties and AE characteristics of thick hard roof sandstone in Shendong coal field. Int. J. Coal Sci. Technol. 2017, 4, 147–158. [Google Scholar] [CrossRef]
  15. Rasskazov, I.Y.; Migunov, D.S.; Anikin, P.A.; Gladyr’, A.V.; Tereshkin, A.A.; Zhelnin, D.O. New-generation portable geoacoustic instrument for rock burst hazard assessment. J. Min. Sci. 2015, 51, 614–623. [Google Scholar] [CrossRef]
  16. Li, N.; Wang, E.Y.; Ge, M.C.; Liu, J. The fracture mechanism and AE analysis of hard roof: A physical modeling study. Arab. J. Geosci. 2015, 8, 1895–1902. [Google Scholar] [CrossRef]
  17. Dou, L.M.; Chen, T.J.; Gong, S.Y.; He, H.; Zhang, S.B. Rock burst hazard determination by using computed tomography technology in deep workface. Saf. Sci. 2012, 50, 736–740. [Google Scholar] [CrossRef]
  18. Lu, C.P.; Liu, G.J.; Liu, Y.; Zhang, N.; Xue, J.H.; Zhang, L. Microseismic multi-parameter characteristics of rock burst hazard induced by hard roof fall and high stress concentration. Int. J. Rock Mech. Min. Sci. 2015, 76, 18–32. [Google Scholar] [CrossRef]
  19. XU, J.; Ma, F.H.; Han, J. Rock burst hazard assessment based on electromagnetic emission in Xingfu Mine. J. Coal Sci. Eng. 2012, 18, 25–28. [Google Scholar] [CrossRef]
  20. Dou, L.M.; Cai, W.; Cao, A.Y.; Guo, W.H. Comprehensive early warning of rock burst utilizing microseismic multi-parameter indices. Int. J. Min. Sci. Technol. 2018, 28, 767–774. [Google Scholar] [CrossRef]
  21. Wang, S.H.; Liu, J.X.; Tang, C.N. Study on generation and numerical simulation of impact pressure in coal layer mining process. Chin. J. Rock Mech. Eng. 2002, 21, 2480–2483. [Google Scholar]
  22. Xiong, Z.Q.; He, H.J. Numerical Simulation of Rock Burst Stress and Its Control by Stress-Relief. J. Min. Saf. Eng. 2006, 32, 489–493. [Google Scholar]
  23. Shan, P.F.; Lai, X.P. Numerical Simulation of the Fluid-Solid Coupling Process During the Failure of a Fractured Coal-Rock Mass Based on the Regional Geostress Characteristics. Transp. Porous Media 2018, 124, 1061–1079. [Google Scholar] [CrossRef]
  24. Shan, P.F.; Lai, X.P. Influence of CT scanning parameters on rock and soil images. J. Vis Commun. Image Represent 2019, 58, 642–650. [Google Scholar] [CrossRef]
  25. Liu, Z.G. Research and Application of Monitoring Equipment Based on the AE Principle Rock Burst; Shandong University of Science and Technology: Qingdao, China, 2011. [Google Scholar]
  26. Li, X.W. AE Mode and Application of Working Face Impact Ground Pressure; Shandong University of Science and Technology: Qingdao, China, 2004. [Google Scholar]
  27. Yang, G.Y.; Jiang, F.X.; Qu, X.C.; Li, L.; Wei, Q.D.; Li, N.L. Study on comprehensive monitoring and early warning technology of rock burst in ultra-thick coal seam heading face. Chin. J. Geotech. Eng. 2019, 41, 1949–1958. [Google Scholar]
Figure 1. Schematic diagram of the working plane horizon.
Energies 12 04780 g001
Figure 2. AE monitoring system diagram.
Energies 12 04780 g002
Figure 3. Physical similarity experimental model.
Energies 12 04780 g003
Figure 4. The position of working faces and AE monitoring location.
Energies 12 04780 g004
Figure 5. Characteristics of AE energy rate Er.
Energies 12 04780 g005
Figure 6. The deviation characteristics of Xi for AE energy rate.
Energies 12 04780 g006
Figure 7. AE characteristics of W1123 working face.
Energies 12 04780 g007
Figure 8. Overburden failure characteristics of W1123 mined to 231.2 cm.
Energies 12 04780 g008
Figure 9. Physical model of numerical computation.
Energies 12 04780 g009
Figure 10. AE and stress characteristics at mining 82.4 cm.
Energies 12 04780 g010
Figure 11. AE and stress characteristics at mining 111.2 cm.
Energies 12 04780 g011
Figure 12. AE and stress characteristics at mining 231.2 cm.
Energies 12 04780 g012
Figure 13. AE and stress characteristics at mining 250.4 cm.
Energies 12 04780 g013
Figure 14. Comparison diagram of energy distribution in W1123 working face.
Energies 12 04780 g014
Table 1. Location of AE large energy rate event of W1123.
Distance (cm)Energy Rate (Er, mv·us/n)Energy Rate Deviation (Xi, %)
82.44.28109.8
96.84.38114.71
111.25.27158.33
144.84.32111.76
168.85.07148.53
178.44.32111.76
192.85.50169.61
207.24.46118.63
231.25.59174.02
Note: Distance is the length between the occurrence point of AE large energy rate event and the left end of the model.

