1. Introduction
For the period from 2019 to 2024, one of the national projects in Russia was the “Digital Economy” project, the main tasks of which were to ensure information security in the transmission, processing, and storage of data [
1]. This task was fully valid for modern power supply systems and grids, especially in modern conditions, where smart electronic devices and software-defined networks are embedded in energy power infrastructures [
2,
3].
This fact confirms the relevance of information security and the need for diverse solutions in this area. References [
4,
5,
6,
7,
8,
9,
10,
11,
12,
13,
14,
15] describe the most common types of attacks, especially DDOS attacks. According to the Kaspersky Lab, in 2019 the total number of attacks and the number of smart attacks (i.e., attacks which require more thorough preparation and are directed on the most vulnerable network element) were increased. Moreover, despite a decrease in the average duration of DDOS attacks, the duration of smart attacks increased. The longest attacks that were employed lasted 509 h. The dynamics of the distribution of the total duration of attacks during the year had not changed much: those attacks that lasted no more than 4 hours dominate. At the same time, the cost of DDOS attacks was reduced due to their simple implementation [
16]. However, if we take into account the fact that each year the implementation time of the longest attacks significantly increases (329 h in 2018 and 509 in 2019), the ever-increasing influence of these attacks on various organizations becomes obvious. Thus, the negative effect of attacks increases. Therefore, the issue of timely detection of such actions on the network in order to make decisions and minimize the consequences of the attack becomes increasingly urgent.
DDOS attacks are characterized by a sharp increase in the malicious traffic being processed. This results in denial of service to legitimate traffic [
17,
18,
19,
20,
21]. As a result, when a DDOS attack is carried out, for example, at critical facilities, the result of such an attack will be not only financial loss and destruction of reputation, but also a threat to the life and health of the population, including the possibility of organizing a terrorist act.
To implement DDOS attacks, the intruder must fulfill training, which consists of carrying out a group of the following cyber-attacks [
22]:
Analysis of network traffic;
Scanning of transfer protocols;
Analysis of network and its vulnerabilities.
After carrying out this group of attacks, the attacker proceeds to the implementation of the last stage of a DDOS-attack, which is implemented faster than preparation for the attack, and which causes inevitable damage, as the decision to minimize the consequences of the attack is made after the start of its implementation. This indicates the need for early detection of this type of attacks during the cyber intelligence phase.
Currently, DDOS attacks are detected mainly by three kinds of methods: signature-based (SB), statistical analysis (SA), and machine learning (ML) [
23,
24,
25,
26]. At present, additional mechanisms are used to implement signature-based DDOS attack detection methods, for example, the fuzzy-genetic algorithms and game theory methods for performance evaluation [
27], the inference mechanisms [
28], and so on. This increases their effectiveness. However, signature methods are typically used for a limited number of protocols and do not allow real-time operation, which is critical when preparing un-targeted attacks. DDOS attack detection mechanisms based on machine learning use various classifiers [
29,
30] and deep neural networks [
31] while analyzing various parameters, such as the distance between IP addresses [
32], traffic entropy [
33], intensity stream [
34], and others. Machine learning methods tend to have high accuracy in detecting attacks. However, they require a lot of time for training. For this reason, they cannot be used efficiently for early detection of attacks. Statistical methods are usually based on various analytical models [
35,
36], which do not require large computational costs. For this reason, such methods can be used for early detection of attacks.
Table 1 demonstrates the main advantages and disadvantages of these cyber-attack detection methods. It can be seen that earlier detection of DDOS attacks is effective with statistical analysis methods. Given the nature of the damage caused by a DDOS attack in telecommunication networks, especially in networks of modern energy infrastructures, the possibility of early detection of DDOS attacks can increase the stability and continuity of telecommunication networks by reducing the network recovery time after the attack.
This paper suggests a new method of early detection of cyber-attacks (by using DDOS attacks as an example). The method suggested in the paper belongs to the group of statistical methods for attack detection. It works in real time, which is important for preparing un-targeted attacks. However, the impact of the intruder introduces some additional component into the network traffic. Using filtering methods, as well as knowing the model of the intruder’s actions and their order, it is possible to identify this additional component and perform early attack detection. Therefore, one of the goals of the paper is to confirm the fact that the proposed method can significantly reduce the recovery time of telecommunication networks after DDOS attacks.
The method of early detection of cyber-attacks is suggested in the second section. The third section presents the results of experiments. The fourth section summarizes the main results and considers the direction of further research.
2. Method of Early Detection of Cyber-Attacks
Since the process of implementing a DDOS attack includes the preparation process, which in turn is a complex of attacks aimed at detecting the most vulnerable network elements, the early detection of a DDOS attack is aimed at finding the activity of the attacker that precedes the DDOS attack. This detection method is the most effective, since at the time of the start of a DDOS attack it is practically impossible to restore the network’s performance due to the lack of tools to influence network elements. However, when a specific activity in the network is detected (traffic anomalies) at an earlier time, the possible consequences of an impending attack will be minimized.
The method of early detection of cyber impact on the network involves the traffic analysis in a time mode close to real, which imposes a number of requirements on the selected method, namely simplicity of mathematical calculations and small volume of the studied data.
As a method of detecting the change in traffic structure, the authors in [
37,
38] used the method of extreme filtering, which is based on parallel high-frequency and low-frequency filtering. The algorithm of operation within the selected method is quite simple to implement and does not require large computational costs. Therefore, it enables real-time data processing.
Let us represent the impact on the network as a time-ordered sequence of events (where the y-axis values depict the number of received packets per unit time), given as a time series, and select a time interval for analysis. The time interval must be selected so that it is equal to the time of the control cycle of the system. The selected gap is searched for extremes. Then, the operator smoothing the function by extreme alternating values:
where
is the value in the point
i, relatively to which smoothing is performed, and
is the extremum in the point
i.
Then, the sign-variable component is separated:
where
is the value of sign-variable component in the point
i.
Theoretical justification of extreme filtering, as well as proof that the coefficients used are the only possible ones, are given in [
39].
Further calculations are made in a similar way with the "remainder" of the signal. At the first iteration, the highest frequency component is highlighted. Next, low frequency components are extracted. Thus, this decomposition procedure allows us to allocate components introduced into traffic, even minor components, to evaluate them relatively to the desired component, defined by the model of actions of the intruder and their order.
Using the given technique, in the environment of MatLab (The MathWorks, Inc., 1 Apple Hill Dr, Natick, MA 01760, United States), two variants of impact of the malefactor on the network are simulated: 1) determined, with identical intervals between phases of carrying out the attack, and 2) accidental, with accidental intervals. Let us spread out a summed signal to the making components.
During decomposition, the received components are compared to the noise (influence of the malefactor) imposed on a legitimate signal. As a desired signal, we use a random number generator with distribution of time of consistently received Internet Protocol (IP) packages to the normal law. When modeling, we will accept the amplitude of the entered component commensurable with a signal amplitude. To define the values of sign-variable components, assessment of the sign of the received values should be made relatively mathematical expectation.
Let us apply the influence of the attacker additively to the traffic of the attacked node of the computer network.
To spread out the summed signal thus received, it is necessary to select the sign-variable components. For this purpose, values of a signal in a full form register in the form of a matrix of amplitudes and a matrix of values of the times corresponding to them. For a definition of an interval search of extrema, the values in a matrix of amplitudes are multiplied by couples consistently:
Furthermore, we ran a search of negative values in the matrix. Two consecutive negative values defined the interval of the search of minima and maxima. Moreover, they correspond to intersections by function of a time axis. The maxima and minima found thus will be sign-variable extrema. The result of iteration in a full form is presented in the form of two matrixes—a matrix of extrema of amplitude and a matrix of the time points corresponding to them:
The results of each iteration are used to approximate cubic splines and remove the selected component from the total signal. The next iteration is performed with signal "remainder" values.
During the simulation, the time scale was set by readings (150 samples). The values analyzed at different points in time represent the number of packets transmitted over the protocol (for example, (Transmission Control Protocol (TCP)) per unit of time.
Let us assume that the violator influence happens with regular intervals between phases (a determined mode), and the volume of the entered packets in unit of time is a constant, that is it can be described by means of function with the equal periods, for example, a sinusoid. Let us impose it on a desired signal and decompose it according to the described algorithm. Let us compare initial influence to the selected component.
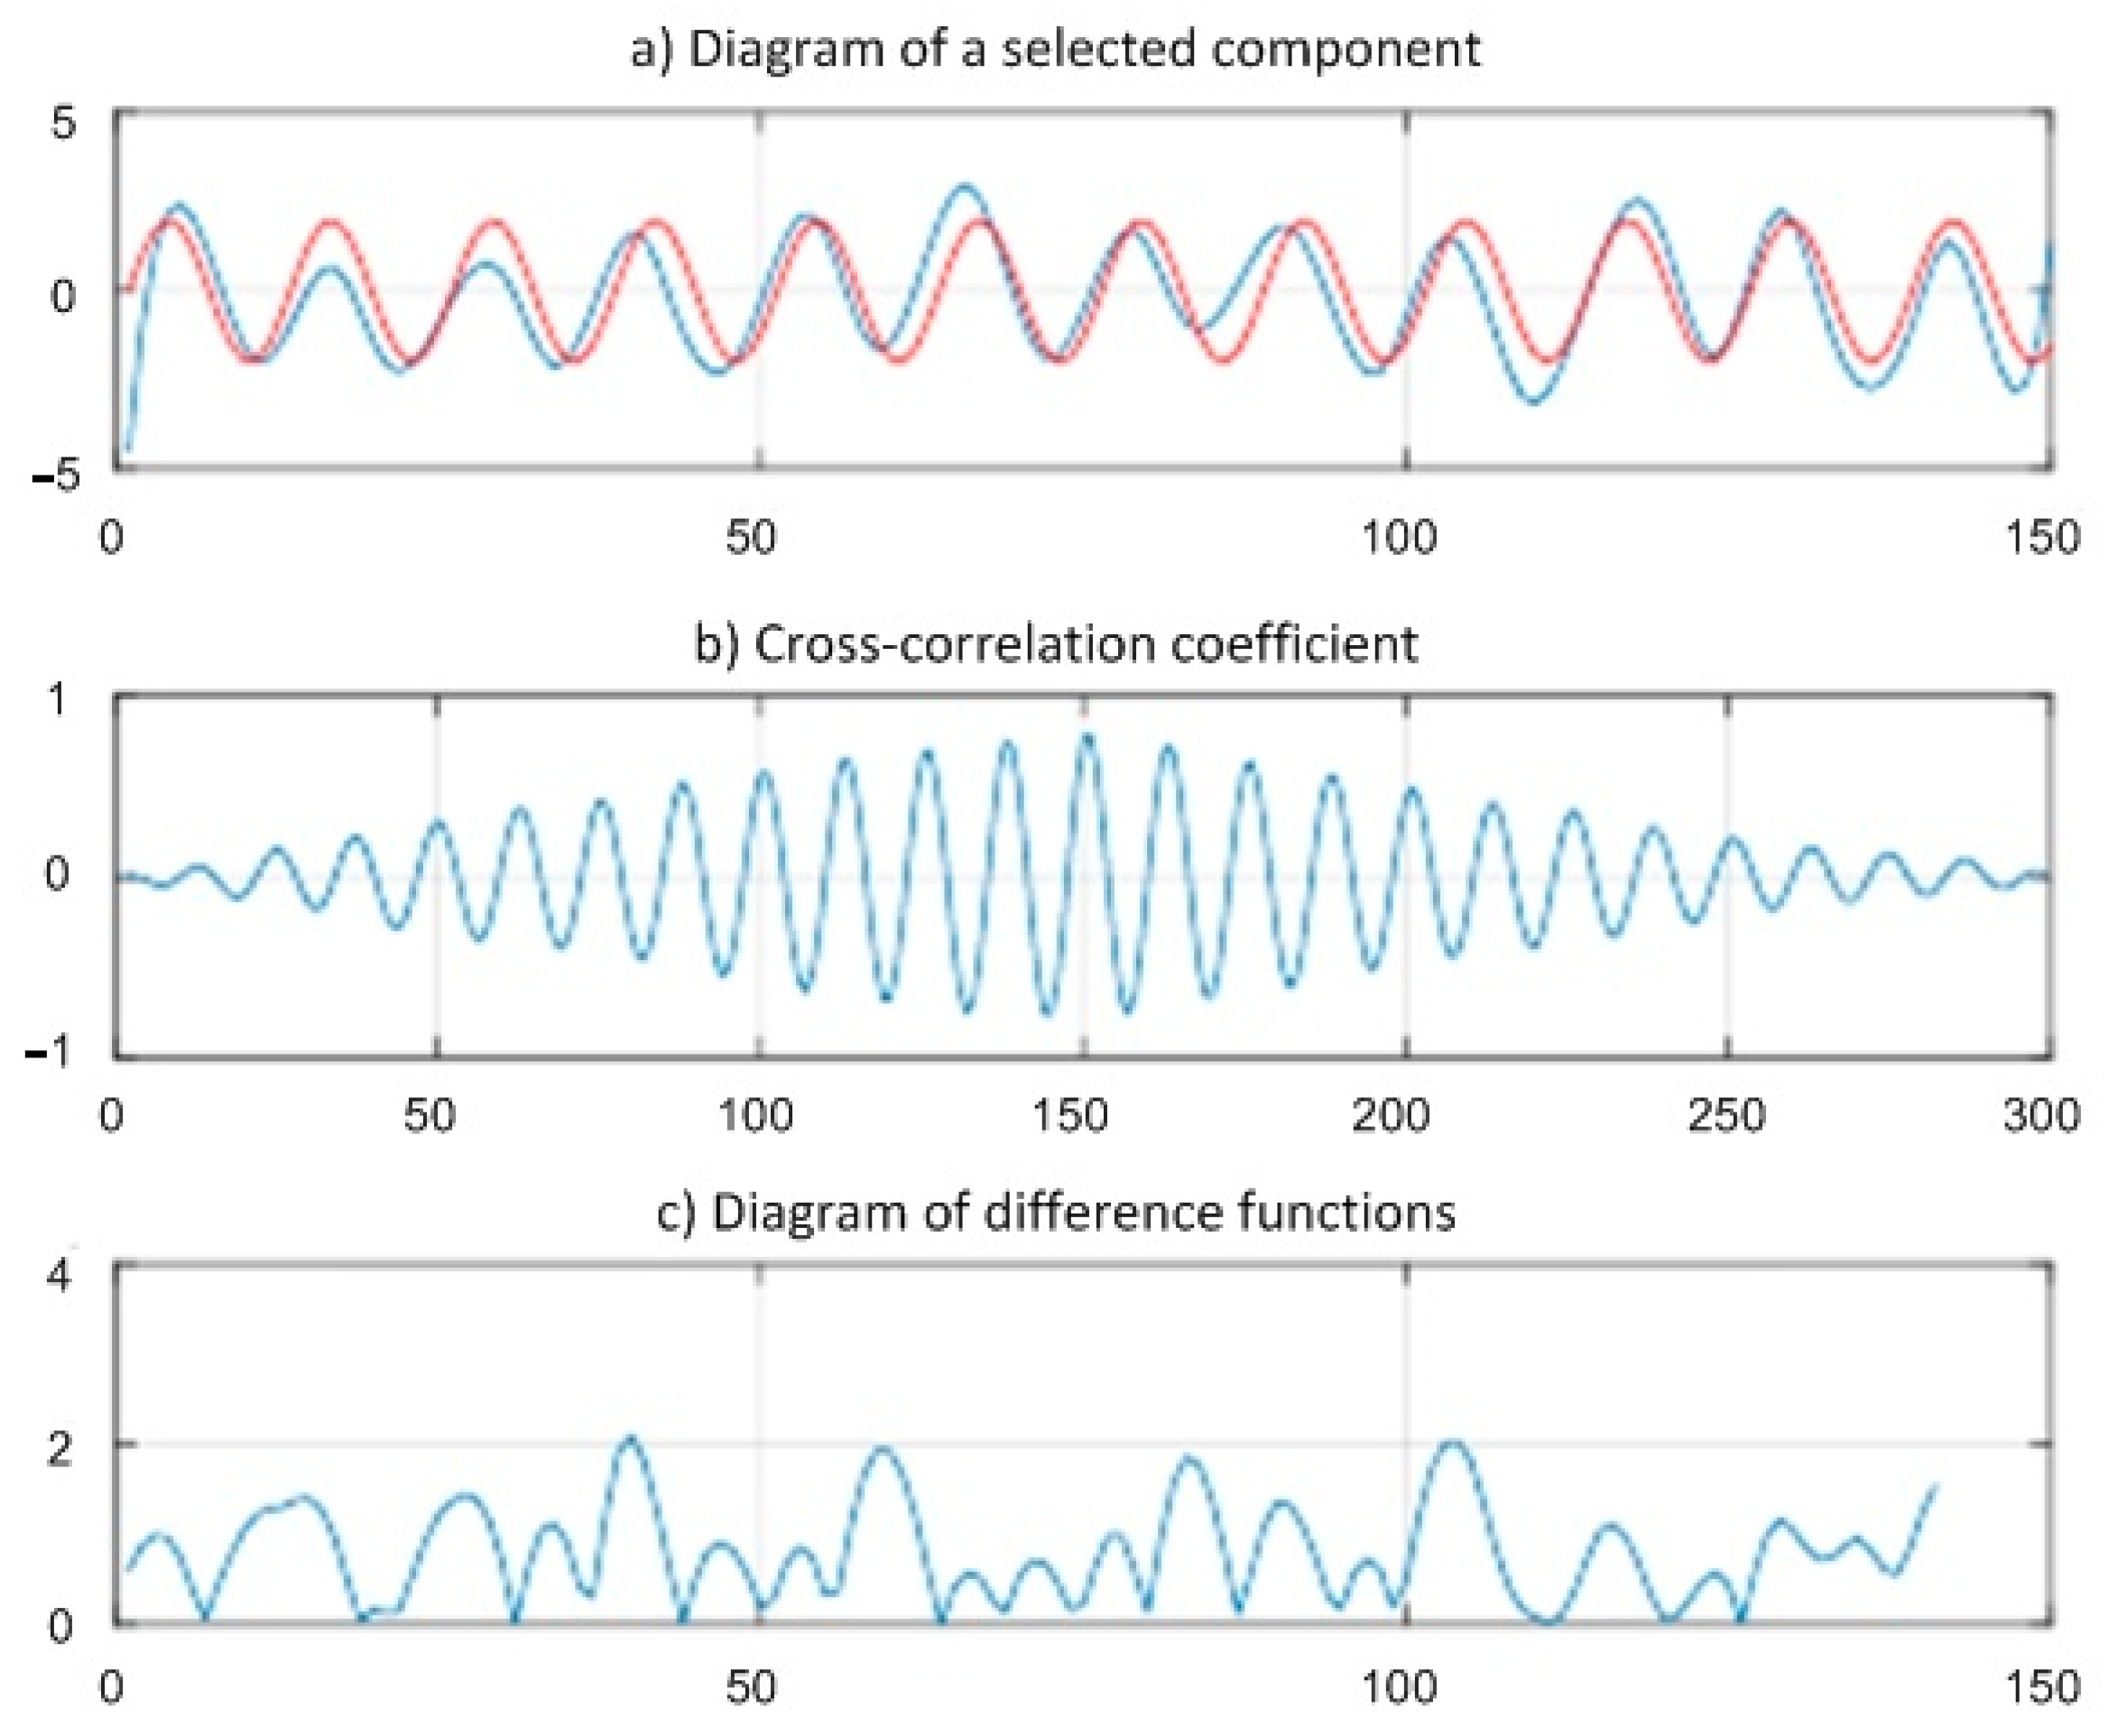
In
Figure 1, the result received on the second iteration of decomposition is shown. This iteration has the highest coefficient of cross correlation among five consecutive iterations of one selection.
Figure 1a shows a similarity of initial influence and influence that was received by method of extreme filtering of a summed signal. Red color shows initial influence, and blue shows the selected component.
Figure 1b displays coefficient of cross correlation of two sequences discrete on time (initial and selected from a summed signal).
The analysis of this diagram allows us to draw a conclusion that on borders of the studied interval, both components have low correlation and, therefore, the reliability of detection of influence is also low. At the same time, in the middle of an interval, the coefficient of cross correlation reaches value 0.91, which demonstrates high reliability of detection of initial influence.
The diagram of a difference of functions (
Figure 1c) shows a difference of amplitudes of two functions in discrete time points. It should be noted that the result of the carried-out iteration can be counted up the most reliable on an interval from 10th to the 80th counting on the general segment in 150 counting.
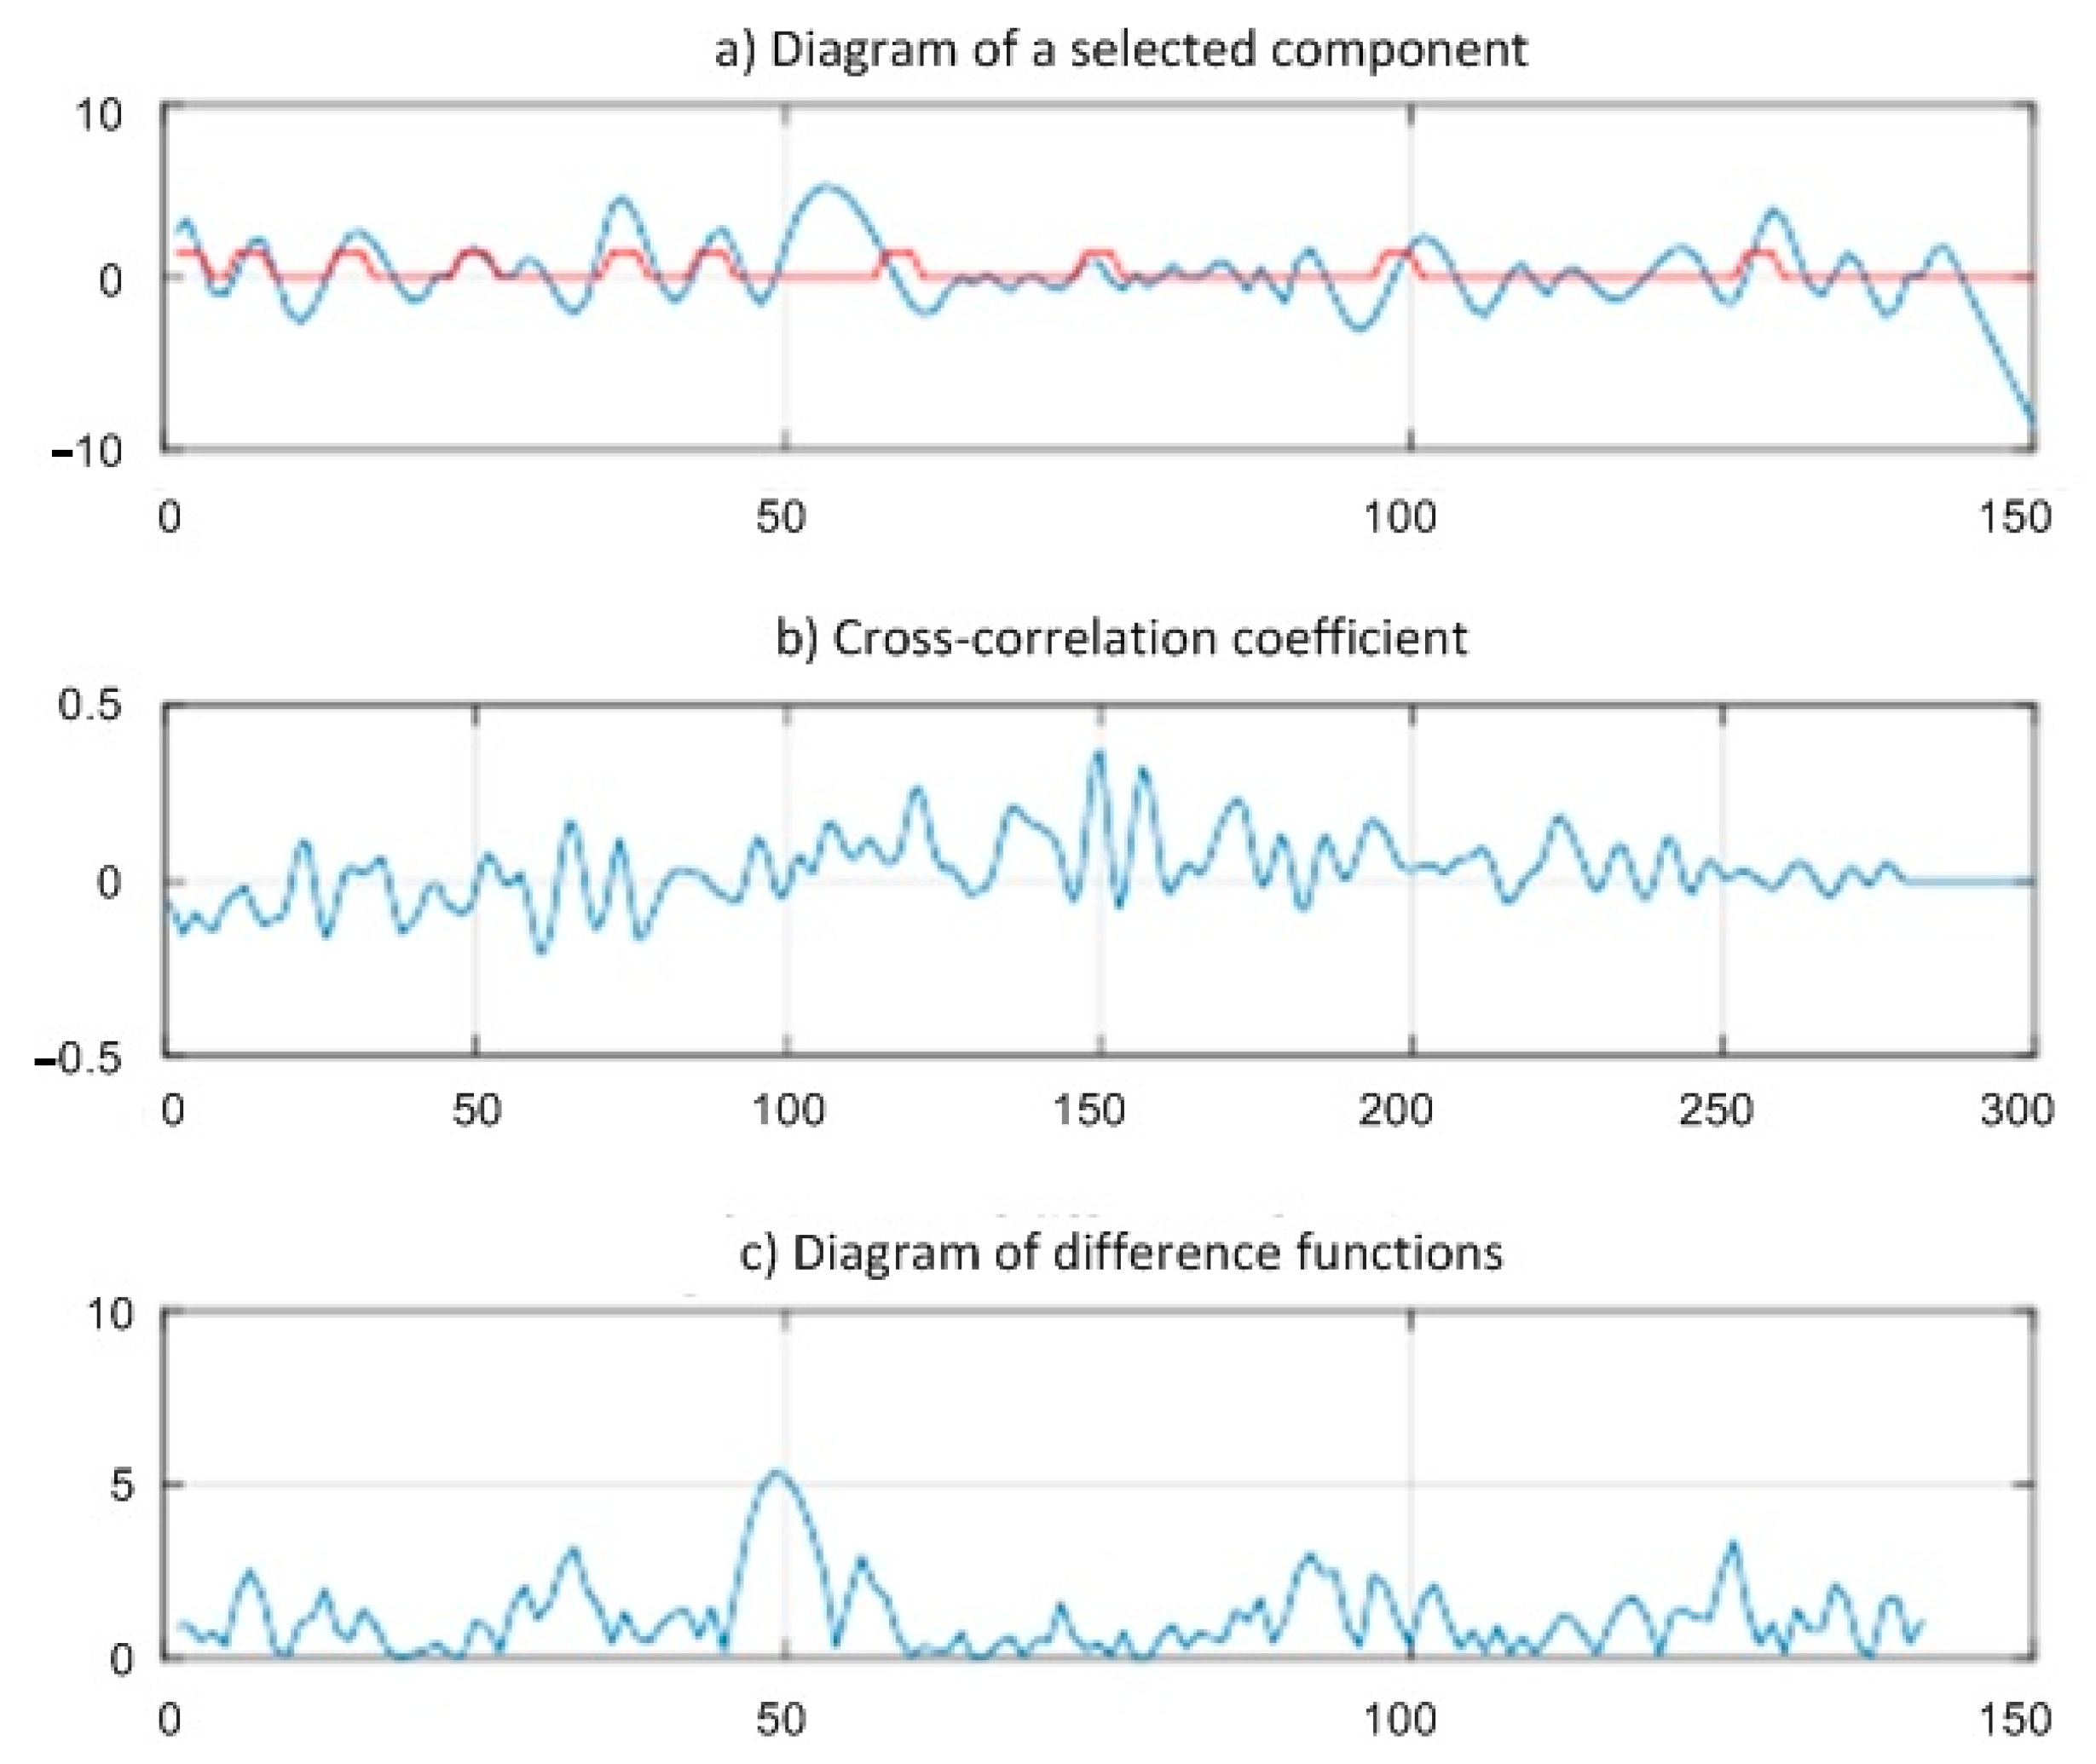
Let us assume further that the violator influence happens with accidental intervals between phases (an accidental mode). Then, it is possible to present this influence in the form of pulse sequences with a different frequency of following.
In
Figure 2, the result of decomposition on the first iteration is shown. This iteration has the highest coefficient of cross correlation among five consecutive iterations of one selection.
Figure 2a allows us to analyze phase coincidence and amplitudes in the imposed component and selected from a summed signal. On an interval [0–60], the phase of two signals almost completely matches; their amplitudes are approximately identical. On the subsequent counting, it is visible that the imposed influence matches on a phase at the moments of "activity" of the violator, but amplitudes can significantly differ. At the same time, at moments of long absence of "activity" of the violator, the selected component saves frequency.
On the basis
Figure 2b,c, it can be judged that the coefficient of cross correlation and the amplitude difference of functions do not display these patterns, as their values are not informative for influence detection confirmation.
Thus, analysis of the calculation results shows that in the above embodiment of the attacker’s impact on the network, detection of a given function is performed with very high accuracy (
Figure 1). However, in the case where the pause intervals between the series of packets of the intruder are random (
Figure 2), the detection accuracy of a given function is reduced by the extreme filtering method.
To set the attack function of the intruder, consider the process of preparation of DDOS-attack from the point of view of the stochastic network conversion method [
22]. Let us present this process as a sequence of events, each characterized by a distribution function, average time, and variance. These indicators make it possible to determine with a given degree of probability the number of packets transmitted by an attacker at the moments of exposure to the network and the time intervals between these actions. They allow one to specify mathematically the process of influencing the network in order to collect data on the network architecture, its elements installed on the elements of software components in order to identify vulnerabilities through which it is possible to affect the network.
A complete description of the DDOS attack model is presented in [
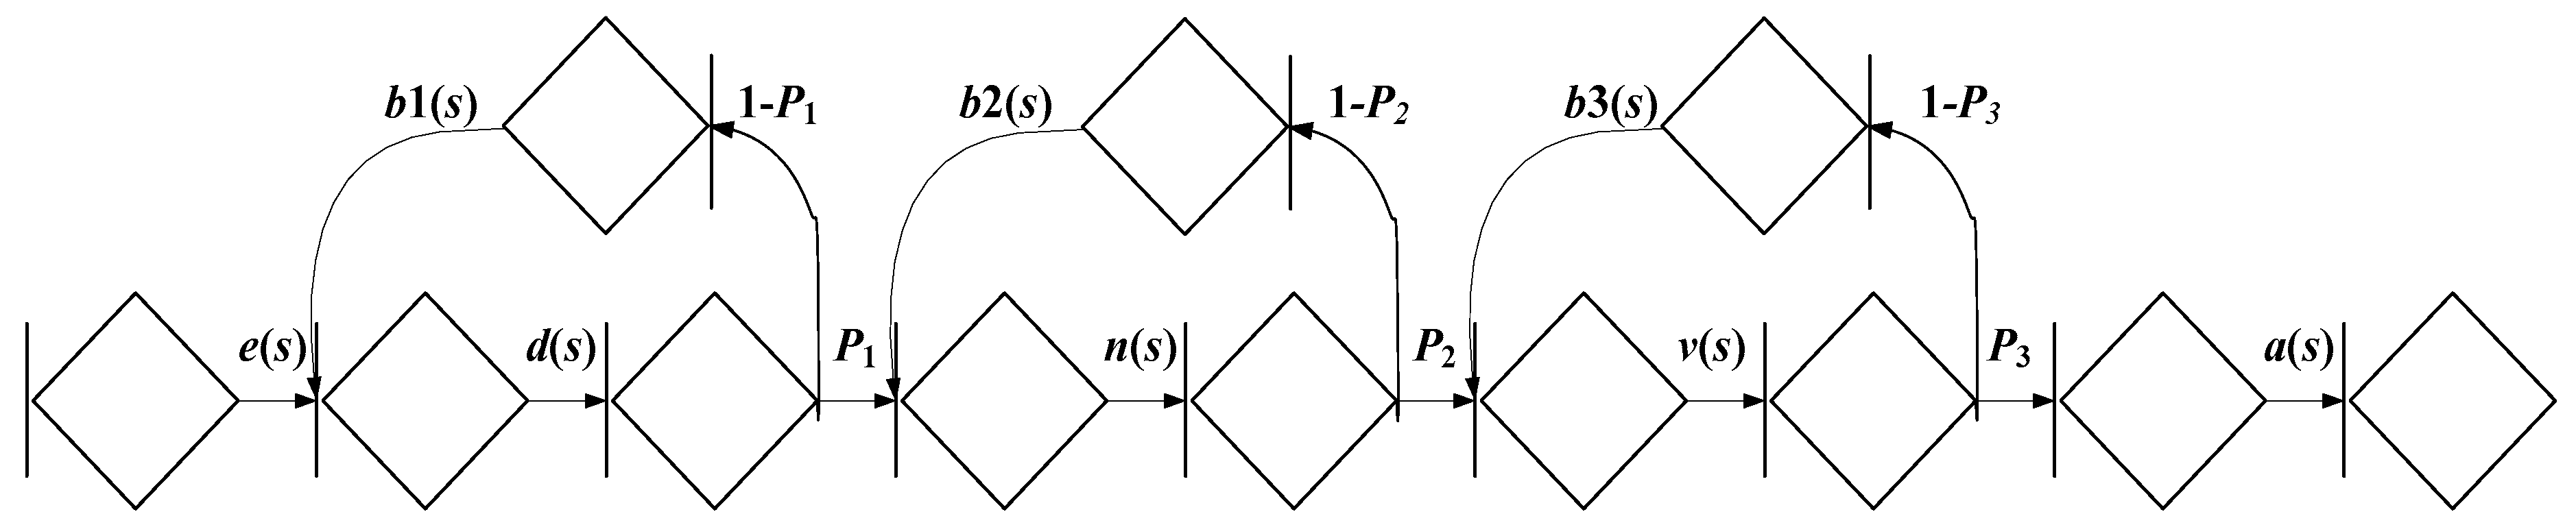
40], which shows that the DDOS attack profile model consists of the following steps (
Figure 3):
Carrying out the attack “The analysis of network traffic” with probability P1 for average time 1 with time distribution function D(t);
Carrying out the attack “Scanning of data transfer protocols” with probability P2 for average time 2 with time distribution function N(t);
Carrying out the attack "Scanning of network and its vulnerabilities" with probability P3 for average time 3 with time distribution function V(t).
If the equivalent attack is not realized, then repeated performance happens for the average time repeat with time distribution functions b1(t), b2(t), and b3(t).
To describe the profile model, let us consider the sequential implementation of these events.
Each phase of the equivalent attack can be presented in the form of several simpler implementations. To carry out "The analysis of network traffic", it is necessary to carry out the analysis of packets at the data link layer (with probability P1.1 and with an average time of 1.1) and at the network layer (with probability P1.2 and with an average time 1.2). For an implementation the attack "Scanning of transfer protocols", it is necessary to scan for an attack by a TCP packet with SYN flags (with probability P2.1 and an average time 2.1), FIN (with probability P2.2 and an average time 2.2), ACK (with probability P2.3 and an average time 2.3), XMAS (with probability P2.4 and an average time 2.4), NULL (with probability P2.5 and an average time 2.5), UDP packets (with probability P2.6 and an average time 2.6) and ICMP (with probability P2.7 and an average time 2.7). For an implementation of the attack "Scanning of network and its vulnerabilities", scanning is carried out in the protocols RIP, OSPF, SNMP, HTTP, SAMBA, TELNET, POP3, NNTP, FINGER, FTP, TFTP, RLOG-IN, IDENT, MAC, and RPC.
Let us assume that the effects of the intruder (the time intervals between incoming non-concrete packets) are subject to the exponential law of distribution. According to the stochastic network conversion method, the stochastic network is closed by a dummy branch that connects the end of the last node and the beginning of the first node. Then, the equivalent function of the stochastic network is as follows:
where
are calculated by following formulas:
Given the exponential law of private process allocation, the probability of execution of the
k-th attack process is determined by the following formulas:
Let us substitute the expression (8)–(15) in (7) and bring the equivalent function of the stochastic network to the following form:
Coefficients A, B, C, D, E, and H correspond to the numerical coefficients of the polynomial. To define the integral function of time distribution, we use the Heaviside decomposition [
41]:
To define deductions in poles, we will find roots of the polynom , considering that e = 1/query, d = 1/traffic, n = 1/scan, v = 1/vuln, a = report., b1 (2; 3) = repeat, which correspond to the following intensities: sending requests with the average time query and the time distribution function E(t); the analysis of traffic with the average time traffic and the time distribution function D(t); scanning of data transfer protocols with the average time scan and the time distribution function N(t); search of vulnerabilities with the average time vuln and the time distribution function V(t); drawing up the report with the average time report and the time distribution function A(t), repetition of the private attack with the average time repeat and the time distribution function B1 (2; 3) (t).
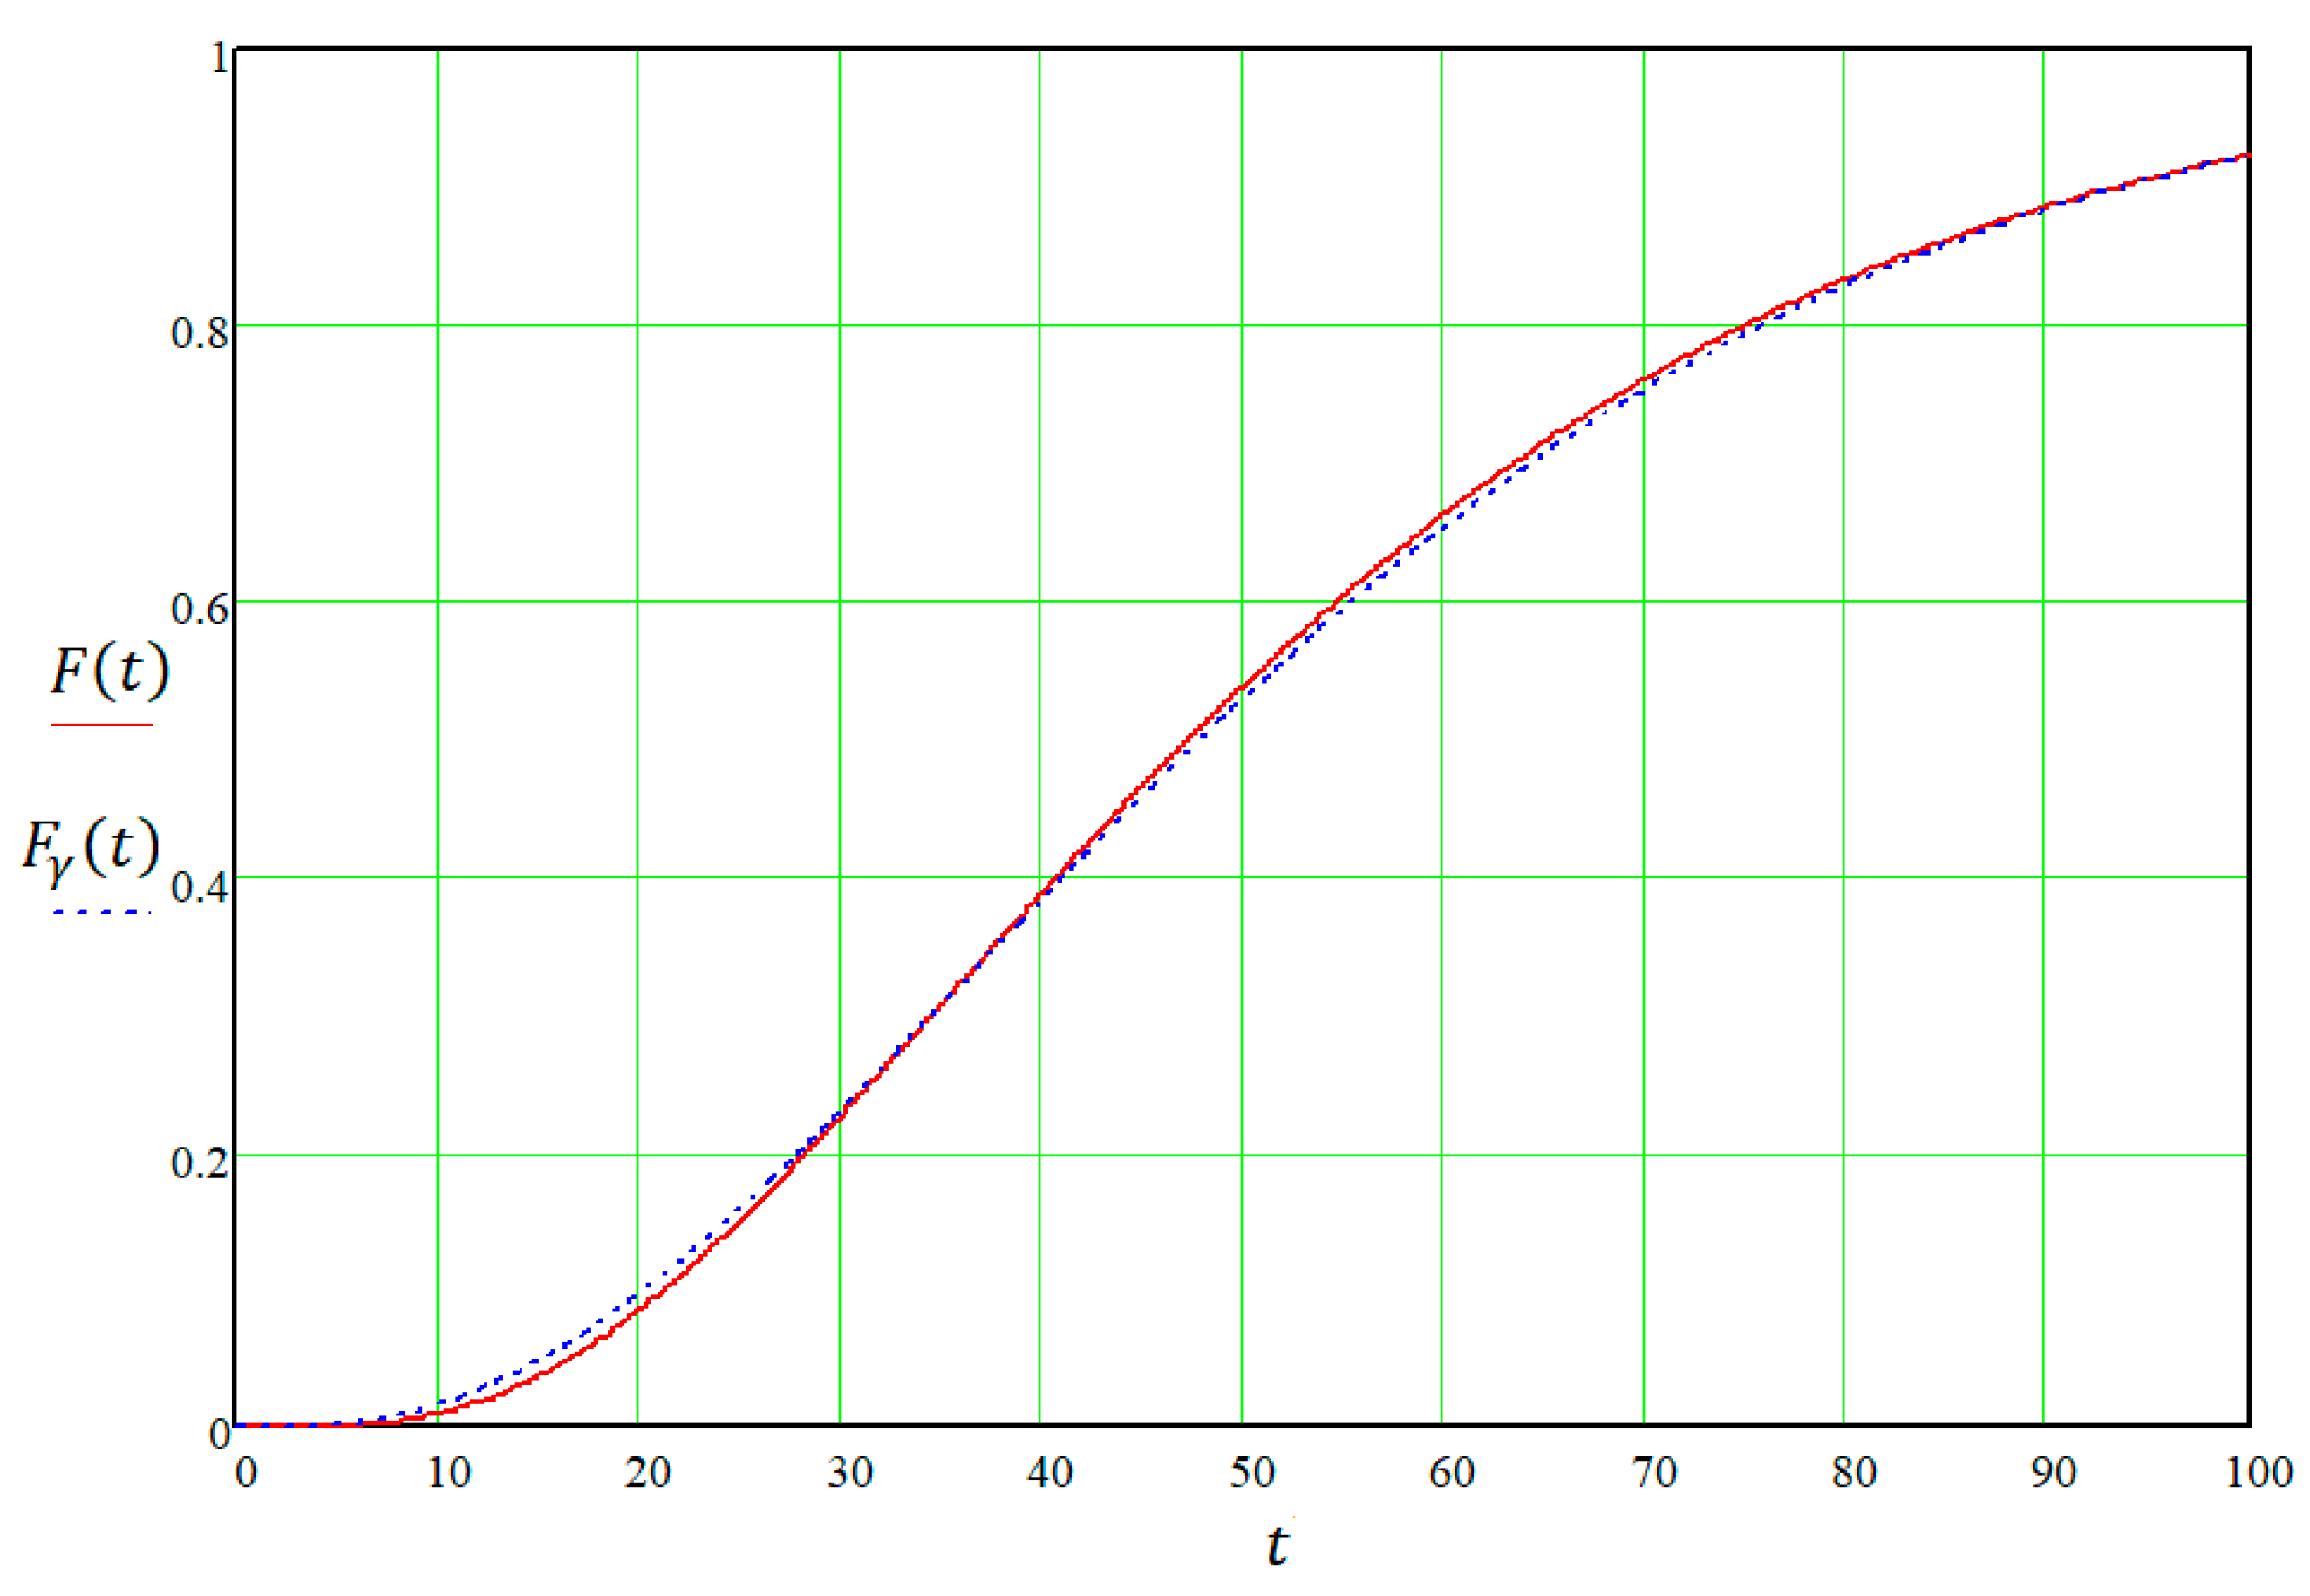
Let us integrate (16) and make calculations. As basic data, we will accept
query = 2 min,
traffic = 7 min,
scan = 7 min,
vuln = 5 min,
report.= 6 min
, repeat = 4 min,
p1 = 0.3,
p2 = 0.5,
p3 = 0.8. The time distribution function
F(
t) is presented in
Figure 4.
The distribution function
F(
t) can be approximated by an incomplete gamma function:
where
are parameters of the scale and the form of an incomplete gamma function;
is the average time for attack implementation; and
is the variance of the attack implementation time.
The average attack implementation time is determined by the following function:
The variance of the attack time is determined by the following function:
The function
as a result of the approximation is also presented in
Figure 4.
Knowing the time distribution function, it is possible to determine the function of probability density
h(
t), as well as the intensity λ(
t), using the following expressions:
Thus, preparation of the DDOS attack can be presented in the form of the sequence of incoming packets on interfaces of the firewall or the server. At the same time, this sequence of requests is characterized by the following functions: F(t)-the quantity of the arrived illegal packets in unit of time (amplitude of the imposed noise); λ(t)-the time between series of requests of the malefactor. Thus, the presented model allows to formalize implementation process of the attack and to define function which is required to be found in the set period.
3. Experimental Results
In order to increase the accuracy of the method considered and reduce the number of false positives, we propose to consider indirect supporting signs of attack, namely network characteristics. [
42,
43,
44,
45,
46,
47] describe the metrics by which cyber-attacks are indirectly detected. As an example, there is a model of a telecommunications network operating in an attack mode consisting of two steps, each of which violates the operation of the system with the probability
pi. As initial data, we will accept:
The average time to repair of a system after cyber action td = 2 s,
The average time of successful implementation of the first attack tr1 = 400 s,
The average time of successful implementation of the second attack tr2 = 300 s,
The average volume of a data packet V = 0.25 Mbit,
The data transmission rate Rv = 150 Mbit/s,
The flow is self-similar with Hurst index equaled 0.71,
The entering flow of packets is characterized by Veybull’s distribution.
We will use the method of transformation of stochastic networks in modeling the behavior of the intruder.
In the simulation process, we determine the dependence of the average packet delay time, the probability of packet loss, and the packet delay time jitter on the incoming flow rate (
λ1 = 10 packet/s and
λ2 = 13 packet/s). The results are summarized in
Table 2.
Let us evaluate the network characteristics at the incoming flow intensity
λ = 10 and the varying average volume of the data packet. The results are presented in
Table 3.
The findings results suggest that the metrics given are sensitive to minor changes in both flow intensity and average packet volume. In both cases, with increasing intensity of incoming flow and average volume of packets, average delay time of packets, and jitter of delay time of packets change most clearly, probability of packet loss changes less appreciably. This confirms the conclusion that the selected metrics allow additional traffic analysis to early detect cyber-attacks in computer networks.
The system, which includes a complex to detect an attack at an early stage (at the stage of preparation), has less recovery time during retransmission or preparation time for the next stage of the attack.
Table 4 presents the simulation results (network characteristics) in a system where only the recovery time from the attack phase will change.
The given data confirm that the system, which includes the proposed complex of early detection of cyber-attacks, has significantly better metrics with equal effects from the violator. This means reducing the impact of cyber-attacks on system performance.
Table 5 shows the results of a comparative evaluation of the proposed method with well-known approaches in terms of accuracy and duration of attack detection.
Table 5 demonstrates that none of the known methods for DDOS attack detection has such a small value of the detection duration as the extreme filtering method has. Moreover, this method has fairly good attack detection accuracy. This is a fair result, since the method of extreme filtering allows one to quickly process the flow of data arriving at the network element, and at the same time, it is not demanding in terms of the power of hardware resources. The advantage of the method in comparison with the signature analysis is the lower number of false positives during the same detection time. Machine learning requires additional hardware resources (which leads to an increase in the cost of the attack detection complex) and has a significant detection time, which does not allow analysis in a time mode close to real, but the detection accuracy is very high. Therefore, the proposed method is most suitable for implementing early detection of DDOS attacks. In addition, the extreme filtering method can be used in combination with machine learning methods at the stage of preprocessing of the data stream on network elements.
Thus, the proposed system of early detection of cyber-attacks using the method of extreme filtering, functioning in "real time," allows to minimize the effect of carrying out cyber-attacks.
4. Discussion
As was shown by the experimental results, the proposed method of extreme filtering allows, with high and fairly fast accuracy, to detect equal periodic actions of the intruder, which may correspond to the initial stages of the DDOS attack implementation. This is an essential advantage of the proposed method. At the same time, it should be noted that if the intruder generates his requests at random intervals, then the probability (accuracy) of network traffic detection is slightly reduced.
The conducted simulation scenario corresponded to a case of a rather strong DDOS attack. In this scenario, the amplitude of the superimposed signal was comparable to the amplitude of the desired signal. In other words, the number of incoming illegitimate packets to the attacked ports of the communication node per unit time was comparable with the total number of packets entering the server.
At the same time, the secondary features of cyber-attacks were used in the work. As main secondary features, it was proposed to use such network characteristics as the times of the successful implementation of the first and second attacks, the recovery time of the system after the attack, the volume of the data packet, the data transfer rate, and the distribution law to which the network flow follows. Using these features allows one to successfully detect a DDOS attack at an early stage of its spread and, thereby, minimize its consequences.
The suggested profile model of the stochastic network for the initial stage of the DDOS attack implementation allows in real-time one to obtain the probability-time characteristics of this process. All the necessary mathematical calculations and transformations that must be performed during the processing of the stochastic network of the analyzed process are quickly performed on the modern means of mathematical calculations, for example, in the MatLab (The MathWorks, Inc., 1 Apple Hill Dr, Natick, MA 01760, United States) system.
The proposed model of the process of the DDOS attack implementation allows one to estimate the network recovery time after an attack if the proposed attack detection mechanism is used in the security system. Based on the results of the experimental assessment, it is possible to conclude that the network recovery time lies in the range from 3 s to 9 s. At the same time, the parameters of quality of service remain in an acceptable range.
It should be noted that the realized studies thus far only demonstrate the potentiality and effectiveness of the proposed attack detection method. The practical implementation and further improvement of this method, its distribution to other types of cyber-attacks, as well as its interaction in the security system with other methods, determine further areas of research.


