Article

Insights into Multifractal Characterization of Coals by Mercury Intrusion Porosimetry

1
School of Energy Resource, China University of Geosciences, Beijing 100083, China
2
Coal Reservoir Laboratory of National Engineering Research Center of CBM Development & Utilization, China University of Geosciences, Beijing 100083, China
3
Beijing Key Laboratory of Unconventional Natural Gas Geological Evaluation and Development Engineering, Beijing 100083, China
4
College of Chemistry, Nankai University, Tianjin 300071, China
5
Beijing Oil and Gas Pipeline Control Center, Beijing 100083, China
*
Author to whom correspondence should be addressed.
Energies 2019, 12(24), 4743; https://doi.org/10.3390/en12244743
Submission received: 17 November 2019 / Revised: 6 December 2019 / Accepted: 10 December 2019 / Published: 12 December 2019

Abstract

:
Mercury intrusion porosimetry (MIP) as a practical and effective measurement has been widely used in characterizing the pore size distribution (PSD) for unconventional reservoirs (e.g., coals and shales). However, in the process of MIP experiments, the high mercury intrusion pressure may cause matrix compressibility and result in inaccurate estimations of PSD. To get a deeper understanding of the variability and heterogeneity characteristics of the actual PSD in coals, this study firstly corrected the high mercury intrusion pressure data in combination with low-temperature N2 adsorption (LTNA) data. The results show that the matrix compressibility was obvious under the pressure over 24.75 MPa, and the calculated matrix compressibility coefficients of bituminous and anthracite coals range from 0.82 to 2.47 × 10⁻¹⁰ m2/N. Then, multifractal analysis was introduced to evaluate the heterogeneity characteristics of coals based on the corrected MIP data. The multifractal dimension Dmin is positively correlated with vitrinite content, but negatively correlated with inertinite content and mercury intrusion saturation. The multifractal dimension Dmax shows negative relationships with moisture and ash content, and it also emerges as a “U-shaped” trend with efficiency of mercury withdrawal. It is concluded that multifractal analysis can be served as a practical method not only for evaluating the heterogeneity of coal PSDs, but also for other unconventional reservoirs (e.g., shale and tight sandstone).

1. Introduction

The pore size distribution (PSD) properties of coals play an important role in characterizing coal reservoirs since it has significant effects on the exploration coalbed methane (CBM) [1,2,3,4]. To simplify the study, we define the “pores” as all pore void types in the coal, including fractures (large extending length but small pore aperture), macropore (pore diameter >1000 nm), mesopore (100–1000 nm), transitional pore (10–100 nm) and micropore (<10 nm), as stated by Hodot in 1966. In recent decades, various constantly updated methods have been applied to evaluate the coal PSD characteristics, including direct observational methods and indirectly inferred methods. Direct observation methods are, for example, scanning electron microscopy (SEM) [5,6], X-ray computerized tomography (X-CT) [7,8] and atomic force microscope (AFM) [9,10], which can be used to characterize the two- or three-dimensional distribution of coal PSDs. Indirectly inferred methods include mercury intrusion porosimetry (MIP) [11,12], gas adsorption (N2 and CO2) [13,14,15,16] and nuclear magnetic resonance (NMR) [17,18,19]. Among of these methods, MIP measurement has been proven as an effective method to estimate the PSD of coals. However, in the process of MIP experiments, the high mercury intrusion pressure may cause coal matrix compressibility and result in inaccurate estimation of coal PSDs [20,21]. Thus, before characterizing coal PSDs only by MIP measurement, the effects of matrix compressibility in a high mercury intrusion pressure range ought to be considered first.
Previous studies have shown that it is a feasible method to evaluate coal matrix compressibility by combining low-temperature N2 adsorption (LTNA) and MIP data [22,23,24]. By using this method, Guo et al. [23] calculated the coal matrix compressibility coefficients and found it emerges as a “U-shaped” trend with coal ranks. Cai et al. [24] found the coal matrix compressibility coefficients are in the range of 0.24−13.56 × 10⁻¹⁰ m2/N, and then they revealed the influence factors of compressibility in differently ranked coals.
The PSD of the porous mediums are commonly not homogeneous distributed in a three-dimensional space, which makes it hard to describe its heterogeneity characteristics by using conventional Euclidean geometry. Fractal analysis, proposed by Mandelbrot [25], has been proven as an important and effective tool for evaluating the physical-geometrical properties of spatially non-uniform system [26,27,28,29]. The sporadic distribution of objects can be described by fractal dimension (D), which can be expressed as
D = lim δ 0 log N ( δ ) log δ ,
where δ is the size of the box; and N (δ) is the number of boxes with the same size of δ.
Previous studies have shown that porous rocks are usually with good self-similar characteristics, which can quantitatively describe the complexity of pore structures by fractal analysis. For example, Krohn and Thompson [30] analyzed the fractal characteristics of sandstones by SEM technique and found that the fractal dimension shows a positive relationship with porosity. Yao et al. [13] conducted fractal analysis by using LTNA measurements and revealed that less heterogeneity in pore structures indicates a higher methane adsorption capacity of coals. Peng et al. [31] found that fractal analysis can be used to estimate the rock pore radius based on the CT image fractal results. Zheng et al. [4] presented a novel method for characterization of full-scale PSD, porosity and permeability of coals by combining an NMR technique and fractal analysis.
However, studies have shown that the conventional single fractal method has its drawbacks, because it is incapable to describe the local portion heterogeneity distribution of an object [32,33,34,35]. Multifractal analysis is regarded as an extension of single fractal theory, which can overcome the limitations of the single fractal theory and characterize the variability and heterogeneity in more detail. Ge et al. [34] investigated the multifractal distribution of pore space and developed a valid method for PSD classification for tight reservoirs. Zhao et al. [29] combined multifractal analysis with NMR technique to investigate the heterogeneity distribution of tight sandstone reservoirs. Zhao et al. [36] revealed the multifractal characterization of PSDs for Middle Bakken by using LTNA and NMR measurements. Zheng et al. [37] presented a novel method to determine NMR T2 cutoff values by applying multifractal analysis for coals. By combining MIP measurement and multifractal analysis, Li et al. [38] investigated the variability and heterogeneity of tectonically deformed coals with Ro, m (mean maximum vitrinite reflectance) in the range of 1.72% to 1.86%, and then found that multifractal analysis can be served as a useful method for describing the internal heterogeneity characteristics of PSD. However, the coal samples studied in Li et al. [38] are only low volatile bituminous coal, which limit the application of multifractal analysis in sub-bituminous and anthracite coal.
In this study, we performed MIP and LTNA experiments on 15 different coal ranks collected from the southern Junngar basin and Qinshui basin. Combining MIP and LTNA data, the coal matrix compressibility coefficients were determined first. Then, based on the determined coal matrix compressibility coefficients, the PSDs from MIP measurement were corrected. Finally, multifractal analysis was applied in describing the heterogeneity characterizations for the corrected coal PSDs.

2. Samples and Experiments

Fifteen coal samples were taken from the underground mines in the southern Junggar basin and Qinshui basin, and then quickly carried to the lab for basic petrophysical analysis, as well as MIP and LTNA analysis. The analysis results of vitrinite reflectance, maceral composition and proximate analysis are given in our previous studies [19].
MIP measurements were conducted with the Micromeritics Autopore 9520 instrument, that can automatically record mercury intrusion pressure, pore size and mercury intrusion volume. For sample preparation, based on the Standard SY/T 5346-2005, the coal sample size required was approximately 2 mm. The mercury intrusion pressure with an interval of 0.012–206.825 MPa corresponded to a pore size of 50–0.03 μm.
LTNA analyses were performed using the Micromeritics ASAP 2020N. For sample preparation, the coal samples were crushed into the size of 60–80 mesh. Then, the coal powders were dried at 110 °C for 12 h in a drying oven to remove moisture. After drying, all coal powders were evacuated for complete outgassing in a high vacuum system within 5 h. Lastly, the coal powders for quantitative adsorption isotherm analyzing were measured at −196 °C with a relative pressure of of 0.011–0.995 MPa.

3. Multifractal Analysis

Different to single fractal analysis, multifractal analysis cannot describe self-similarity by a single fractal dimension, but rather by a continuous function (i.e., multifractal spectrum). More detailed information about the principle of multifractal analysis can be found in previous studies [12,33,35,38]. Here, we just made a brief introduction to multifractal analysis by using the box-counting method. Based on the cardinal theory of the box-counting method, a cubic box with a size of δ × δ can be used to cover the pore volume of objects. As a result, the objects can be divided into N(δ) boxes. Thus, the probability mass distribution Pi (δ) in the ith box can be defined as
P i ( δ ) = N i ( δ ) i = 1 N ( δ ) N i ( δ ) ,
where Ni (δ) is the pore volumes in the ith box.
For a target object with a multifractal property, the probability mass distribution Pi (δ) follows a power-law equation with scale δ:
P i ( δ ) δ α i
where αi is the singularity strength in the ith box.
Possibly, there are many boxes that have the same value of α. Here, the number of boxes having a singularity strength range of α + da was represented as Nα (δ), then:
N α ( δ ) δ f ( α )
where f (α) is the multifractal spectrum and can achieve the maximum value when
d f ( α ( q ) ) d α ( q ) = 0
where q is the moment order and can be any real number in the range of [−∞, +∞].
The partition function for the moment order q was denoted as X (q,δ). Then:
X ( q , δ ) = i = 1 N i P i q ( δ ) ε ( q 1 ) D q
where Dq is the multifractal dimension for the moment order q. When q ≠ 1, Dq can be expressed as
D q = 1 q 1 lim δ 0 log i = 1 N ( δ ) P i q ( δ ) log δ
When q = 1, Equation (7) does not make mathematical sense. D1 can be determined by L’Hôpital rules:
D 1 = lim δ 0 i = 1 N ( δ ) P i ( δ ) log P i ( δ ) log δ
The mass exponent τ (q) which related to multifractal dimension Dq [39]:
( q ) = ( 1 q ) D q
The singularity strength α (q) and multifractal spectrum f (α) can be evaluated by the Legendre transformation:
α ( q ) = d τ ( q ) d q
f ( α ) = q α ( q ) τ ( q )
The singularity strength range Δα, commonly used as an indicator to describe the heterogeneity characteristic of subjects, is defined as
Δ α = α m a x α m i n
where αmax and αmin are the maximum and minimum values of the singularity strength, respectively.

4. Results and Discussion

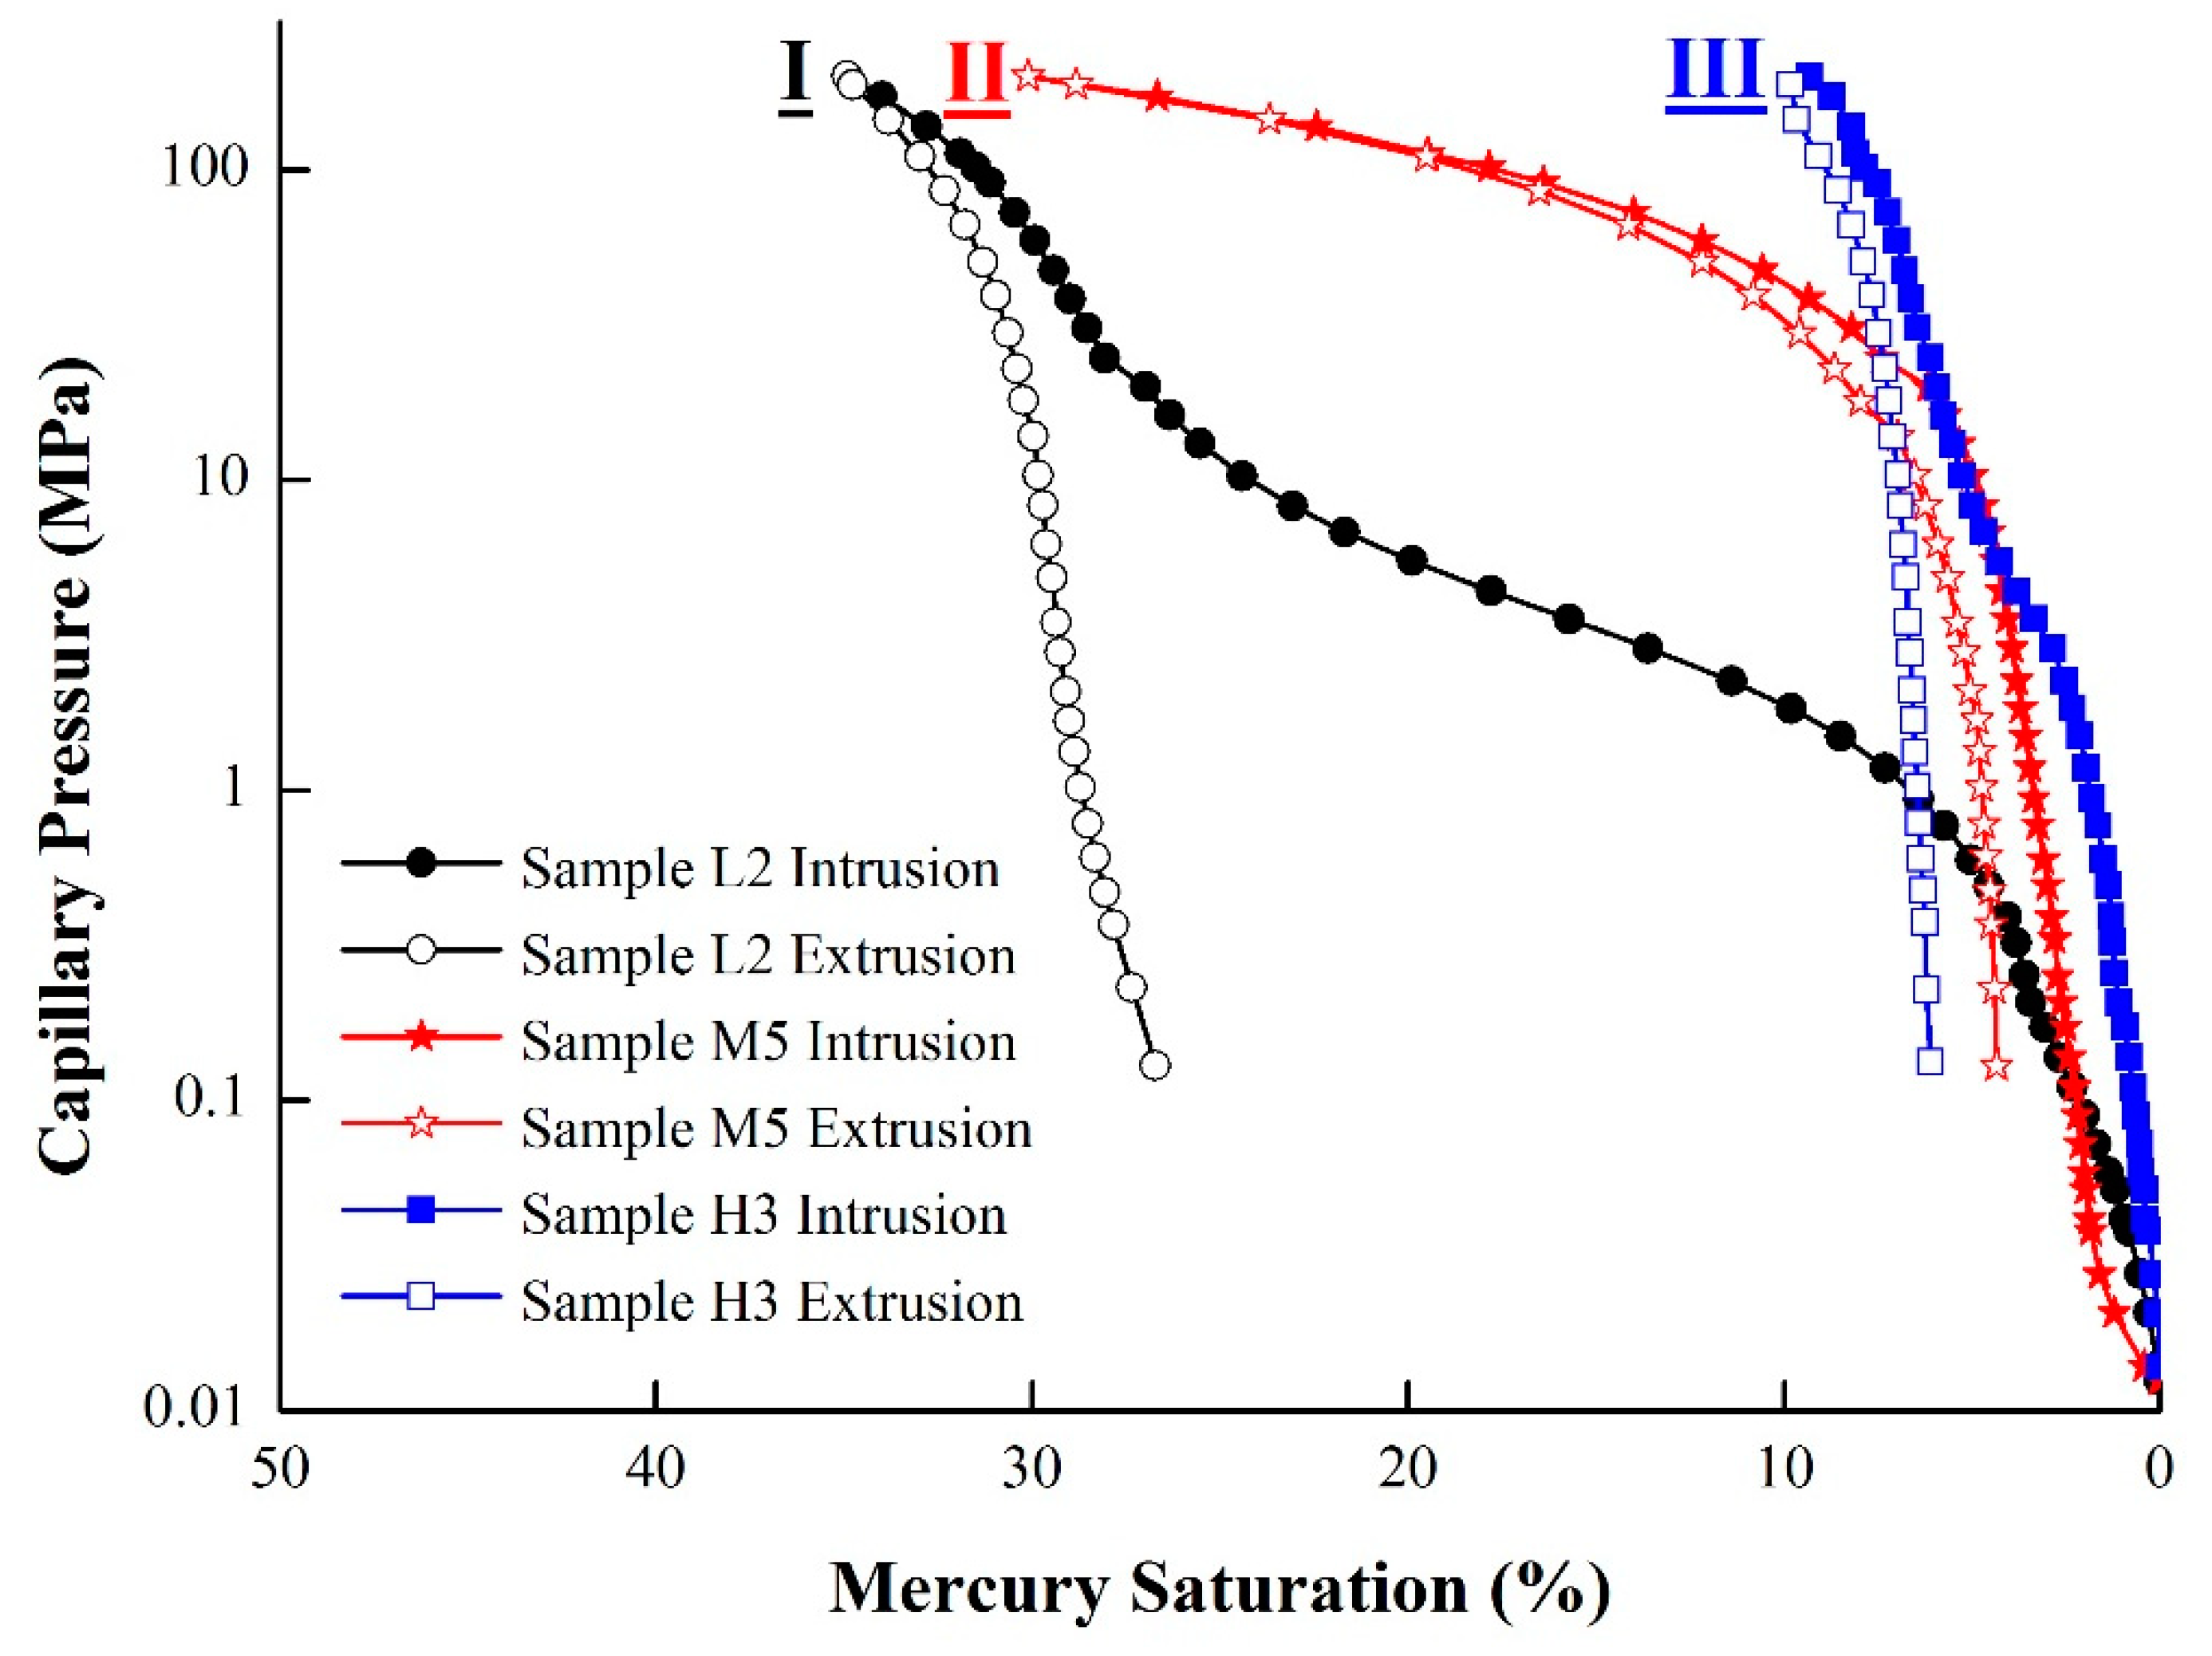
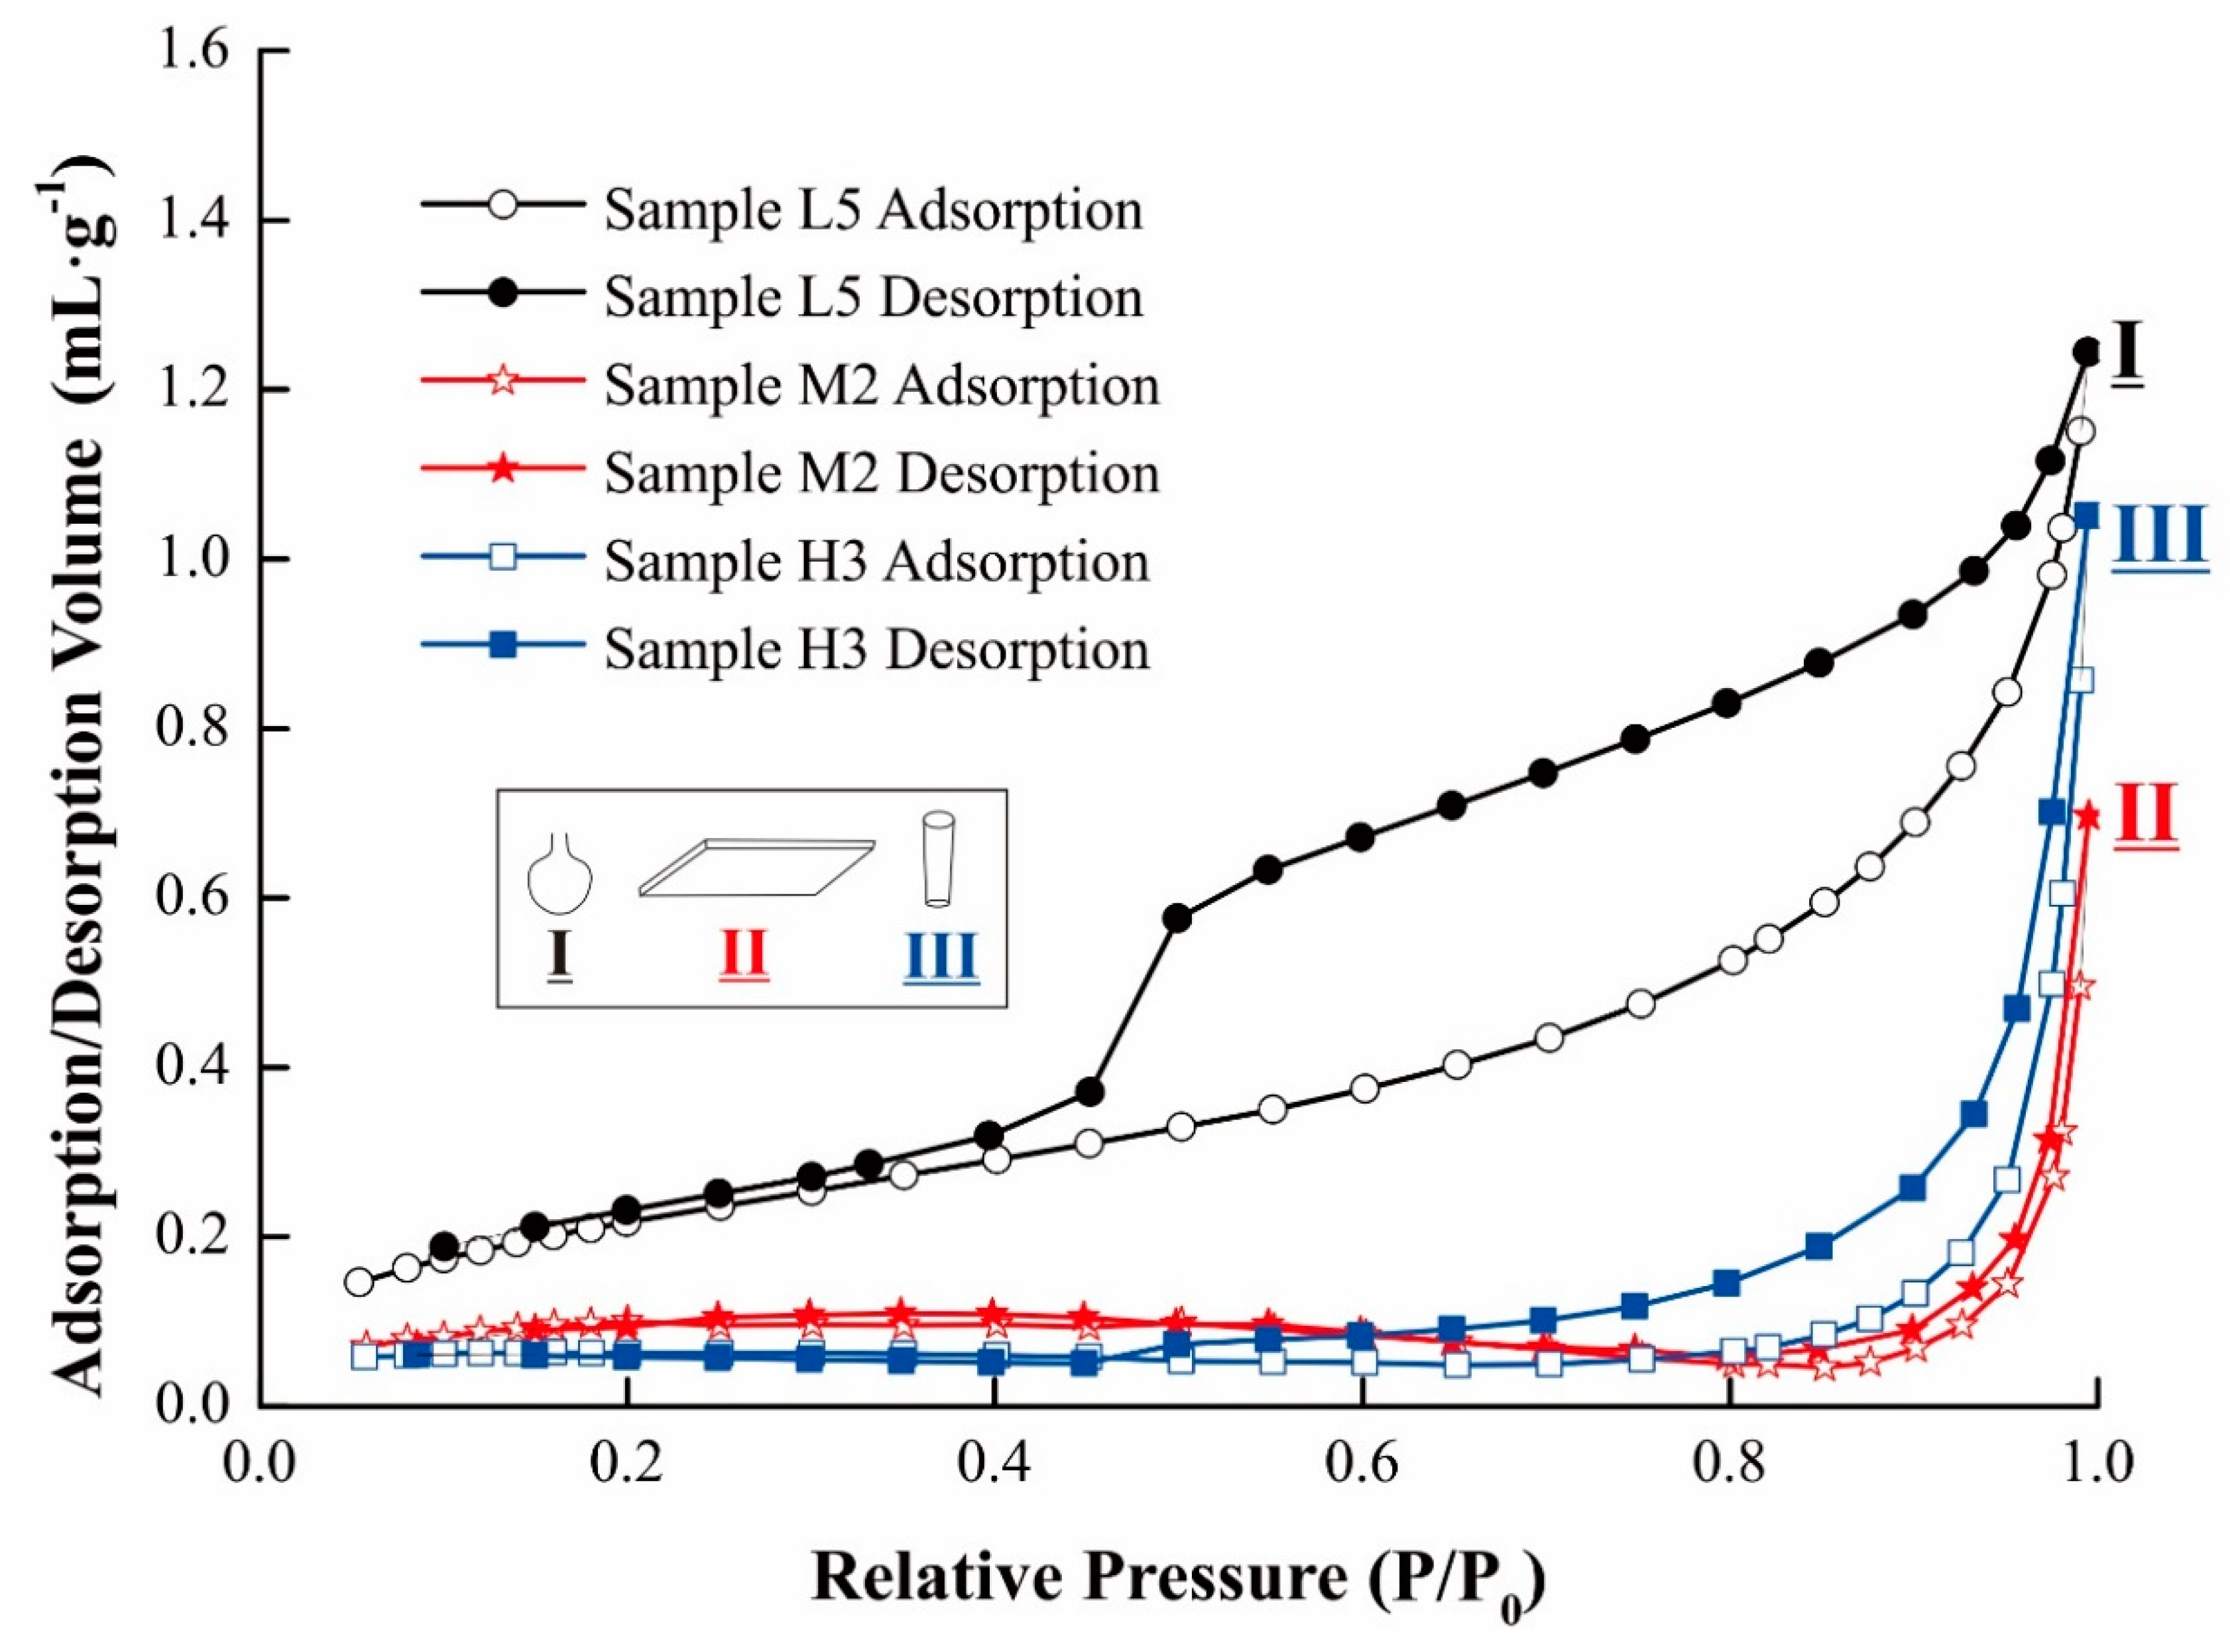
4.1. Pore Structures by MIP and LTNA Measurement

As shown in Figure 1 and Table 1, the mercury intrusion and extrusion curves of the MIP measurements for the selected coal samples are classified into three types. For type I, represented by sample L2, there is a large hysteresis loop between the intrusion and extrusion curves, indicating good development of fractures and macro pores. For type II, represented by sample M5, the intruded mercury increases rapidly when the intrusion pressure >10 MPa, which means good connectivity of the macro pores but poor connectivity of the micropores. For type III, represented by sample H3, there is low intruded mercury saturation, indicating the connectivity between the macro pores and the micropores is very poor.
Figure 2 and Table 1 show the three typical types of nitrogen adsorption/desorption curves at 77 K according to the IUPAC classification. For type I, represented by sample L2, an evident hysteresis loop occurring at a relative pressure range of 0.4–1 MPa, indicating that the ink bottle-like pores are well developed in Type I. For Type II, represented by sample M5, the adsorption curve shows a slight increase when the relative pressure is less than 0.8, while it emerged that there is a significant increase when the relative pressure approaches to 1. The desorption curve is similar to the adsorption curve, indicating the pore morphology is plate-like pores. For Type III, represented by sample H3, the adsorption curve looks like type II. While for the desorption curve, there is a significant hysteresis loop occurring at a relative pressure range of 0.7–1 MPa. This indicates the pore morphology of type III is cylinder-like pores.

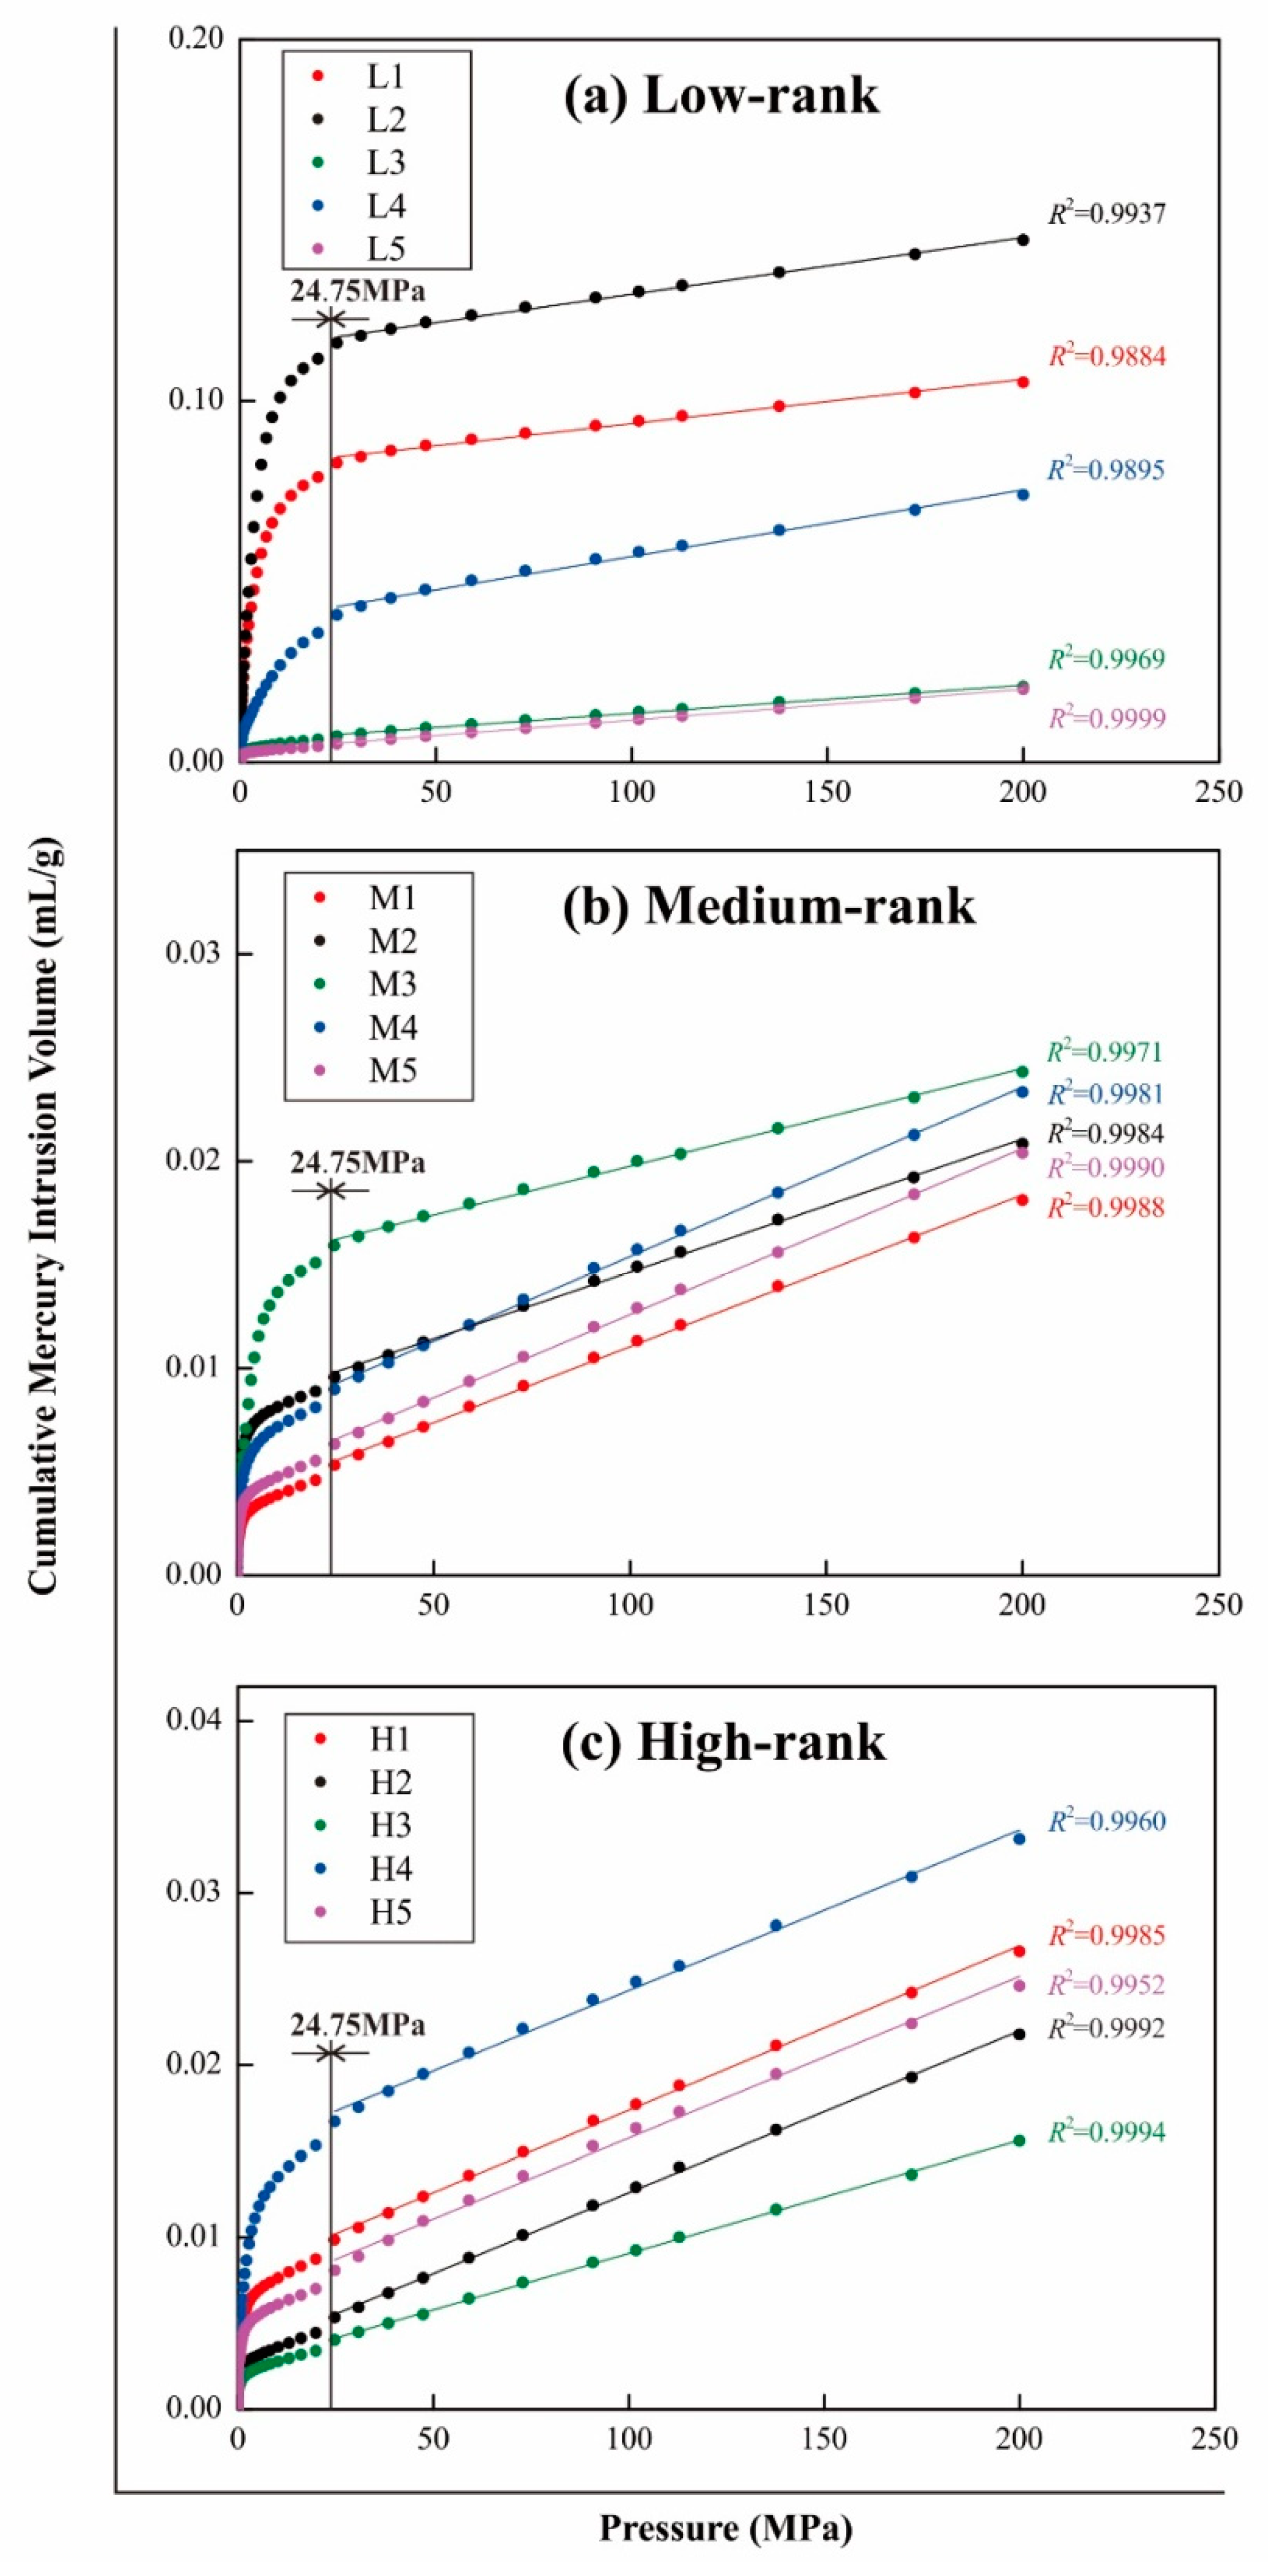
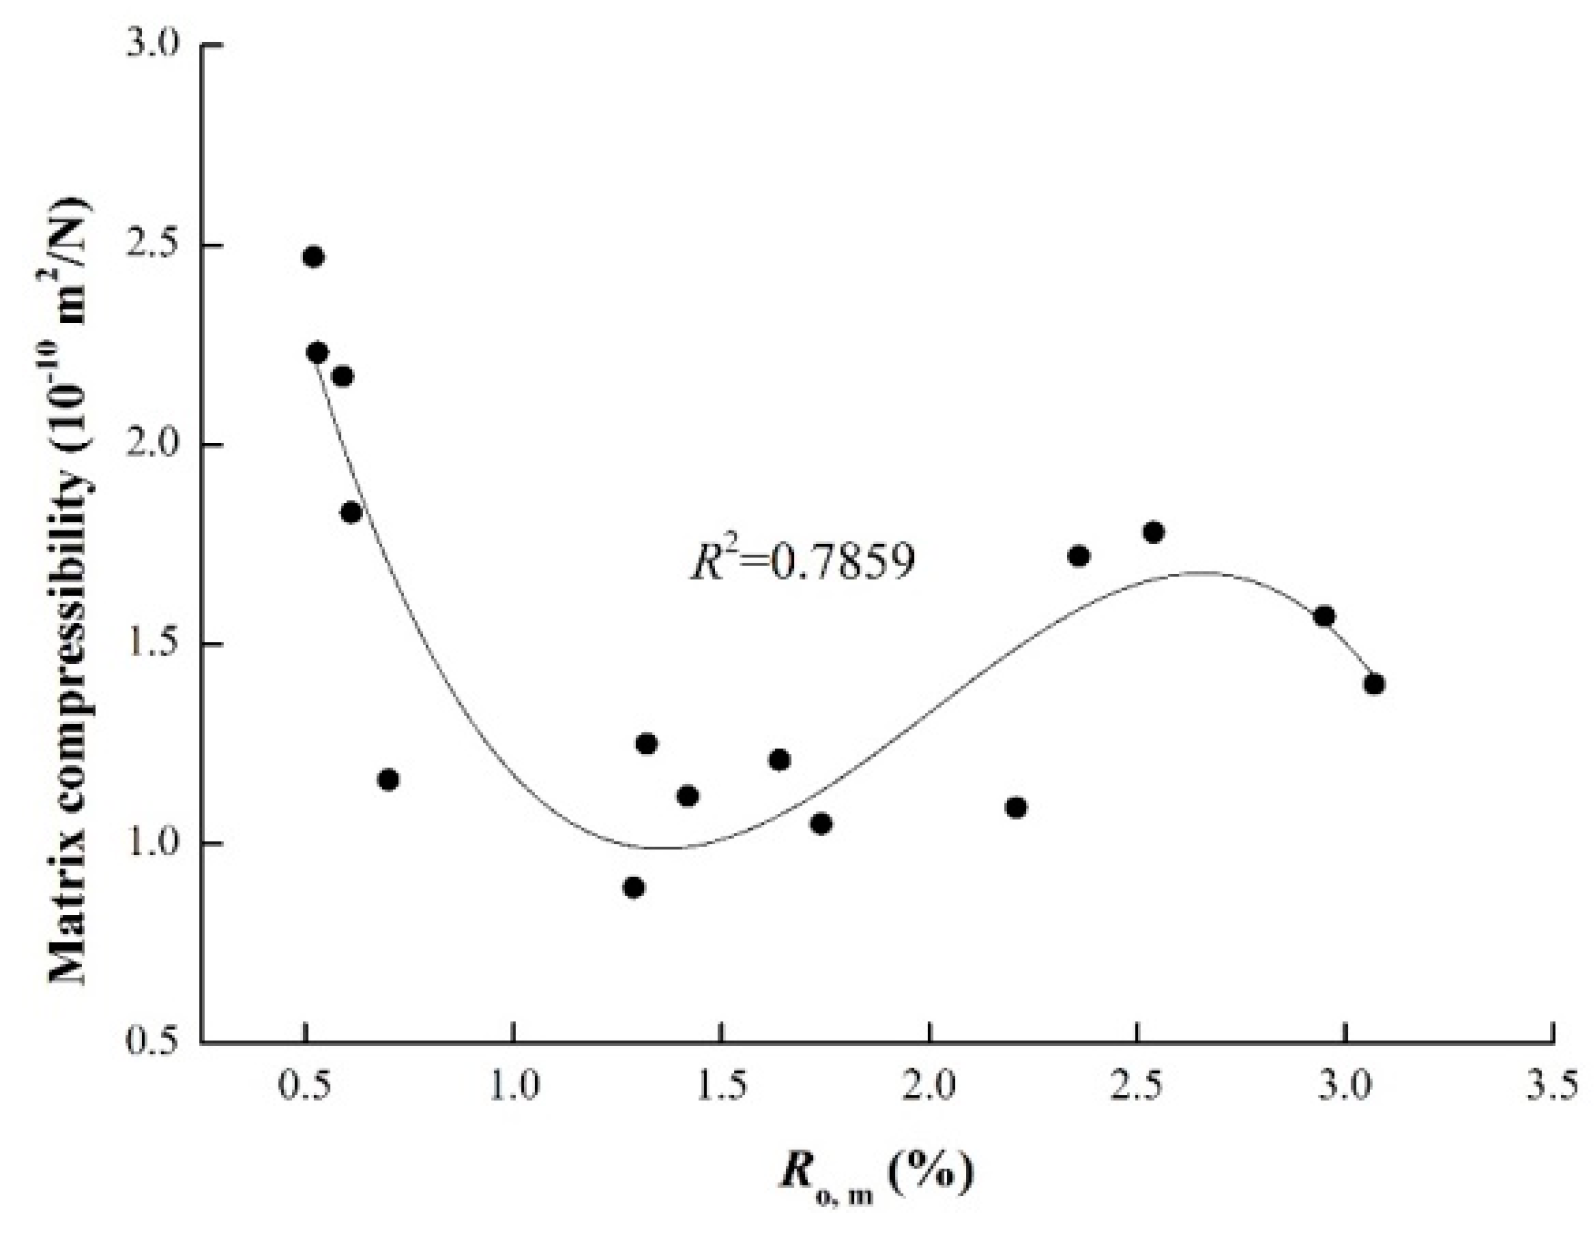
4.2. Coal Matrix Compressibility Coefficient Calculation.

Previous studies have shown that the coal matrix compressibility can have a significant influence on the results of MIP experiments when the mercury intrusion pressure is > 20 MPa [22,24]. In this study, as shown in Figure 3, it can be found that the cumulative mercury intrusion volume and mercury intrusion pressure shows a good linear relationship when the mercury intrusion pressure is higher than 24.75 MPa, and the correlation coefficients are higher than 0.98 for all selected coal samples. This means the coal matrix compressibility effect begins at a mercury intrusion pressure of 24.75 MPa. In case of ignoring the compressibility effects of mercury, the coal matrix compressibility coefficient (Kc) can be expressed as
K c = d V c V c d P
where dVc/dP represents the coal matrix volume changes as a function of pressure, and Vc is the coal matrix volume that can be defined as
V c = 1 ρ V B
where ρ is the true density of coals in g/mL, and VB is the pore volume evaluated using the BJH theoretical model by LTNA data in mL/g.
In the process of MIP measurement, the detected changes of the mercury intrusion volume (ΔVd) is commonly due to the changes of the pore filling volume (ΔVp) and solid compression volume (ΔVc), which follows a function of
Δ V d = Δ V p + Δ V c
In this study, the high mercury intrusion pressure ranges from 24.75 MPa to 199.94 MPa (corresponding to a pore radius of 25 nm to 3 nm based on the Washburn equation). There is a good linear relationship between the cumulative mercury intrusion volume and mercury intrusion pressure (Figure 3). Thus, ΔVdP can be a constant ε in the mercury intrusion pressure range of 24.75–199.94 MPa, and the calculated ε is listed in Table 1. In this case, ΔVcP can be redefined as
Δ V c Δ P = Δ V d Δ P Δ V p Δ P = ε 3   nm 25   nm Δ V p Δ P
where 3   nm 25   nm Δ V p is the sum of pore volumes in the pore radius of 3–25 nm, which is calculated by LTNA measurements.
Assuming ΔVcP is independent of mercury intrusion pressure, in this case, dVc/dP can be replaced by ΔVcP. Hence, the matrix compressibility coefficient can be calculated by combining Equations (13) and (16). In this study, the calculated matrix compressibility coefficient for the selected coal samples is in the range of 0.89–2.47 × 10⁻¹⁰ m2/N (Table 1), averaging at 1.21 × 10⁻¹⁰ m2/N, which is consistent with previous researches, such as Cai et al. [2] (1.55–2.37 × 10⁻¹⁰ m2/N), Guo et al. [23] (0.35−2.91 × 10⁻¹⁰ m2/N), and Shao et al. [40] (1.13–3.06 × 10⁻¹⁰ m2/N).
Figure 4 displays the cross plot of the coal matrix compressibility coefficients vs. Ro,m. We found that when Ro,m is less than 1.3%, the coal matrix compressibility coefficients decreases rapidly with increasing Ro,m. It is possible because the mechanical compaction and degasification effect increases with an increase in coalification degree. When Ro,m is in the range of 1.3–2.5%, the coal matrix compressibility shows an increased trend with an increase in Ro,m. Because the internal specific surface area of the micropores increases rapidly with the continued increase in coalification degree, the coals become more sensitive to stress. When the Ro,m is more than 2.5%, the coal matrix compressibility coefficients increases with increasing Ro,m, since the condensed humus complex and aromatic rings increase [24].

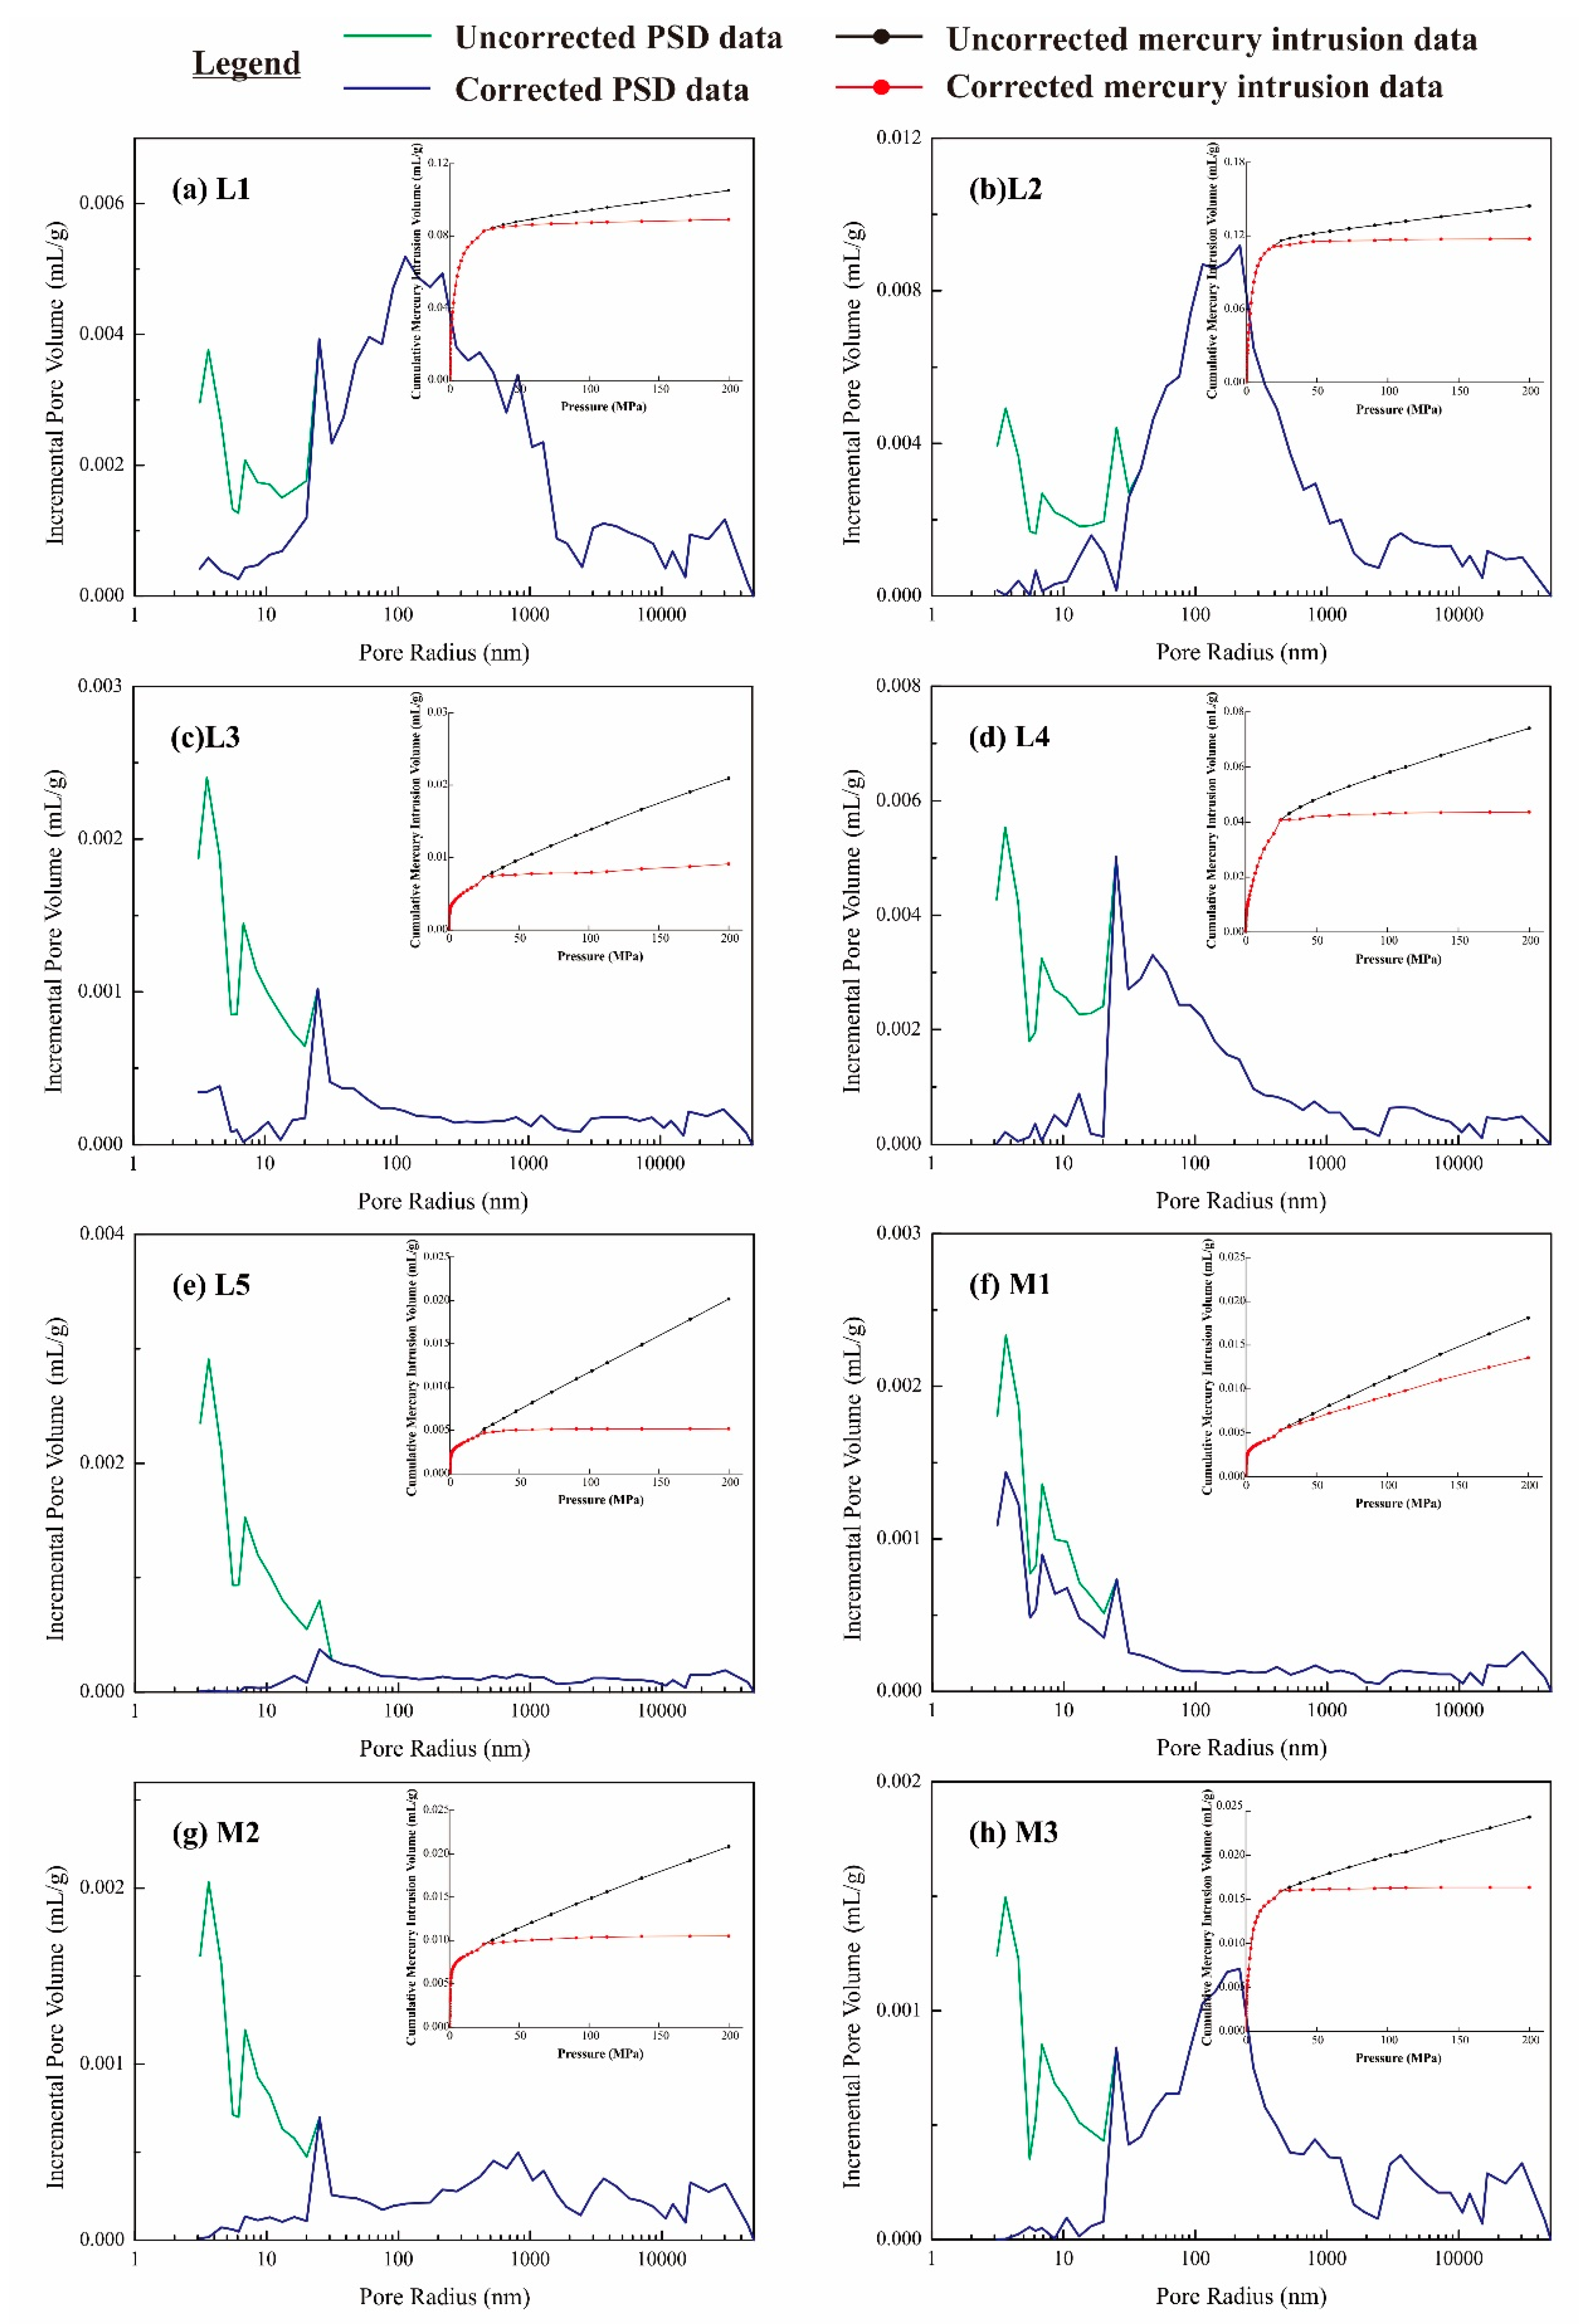
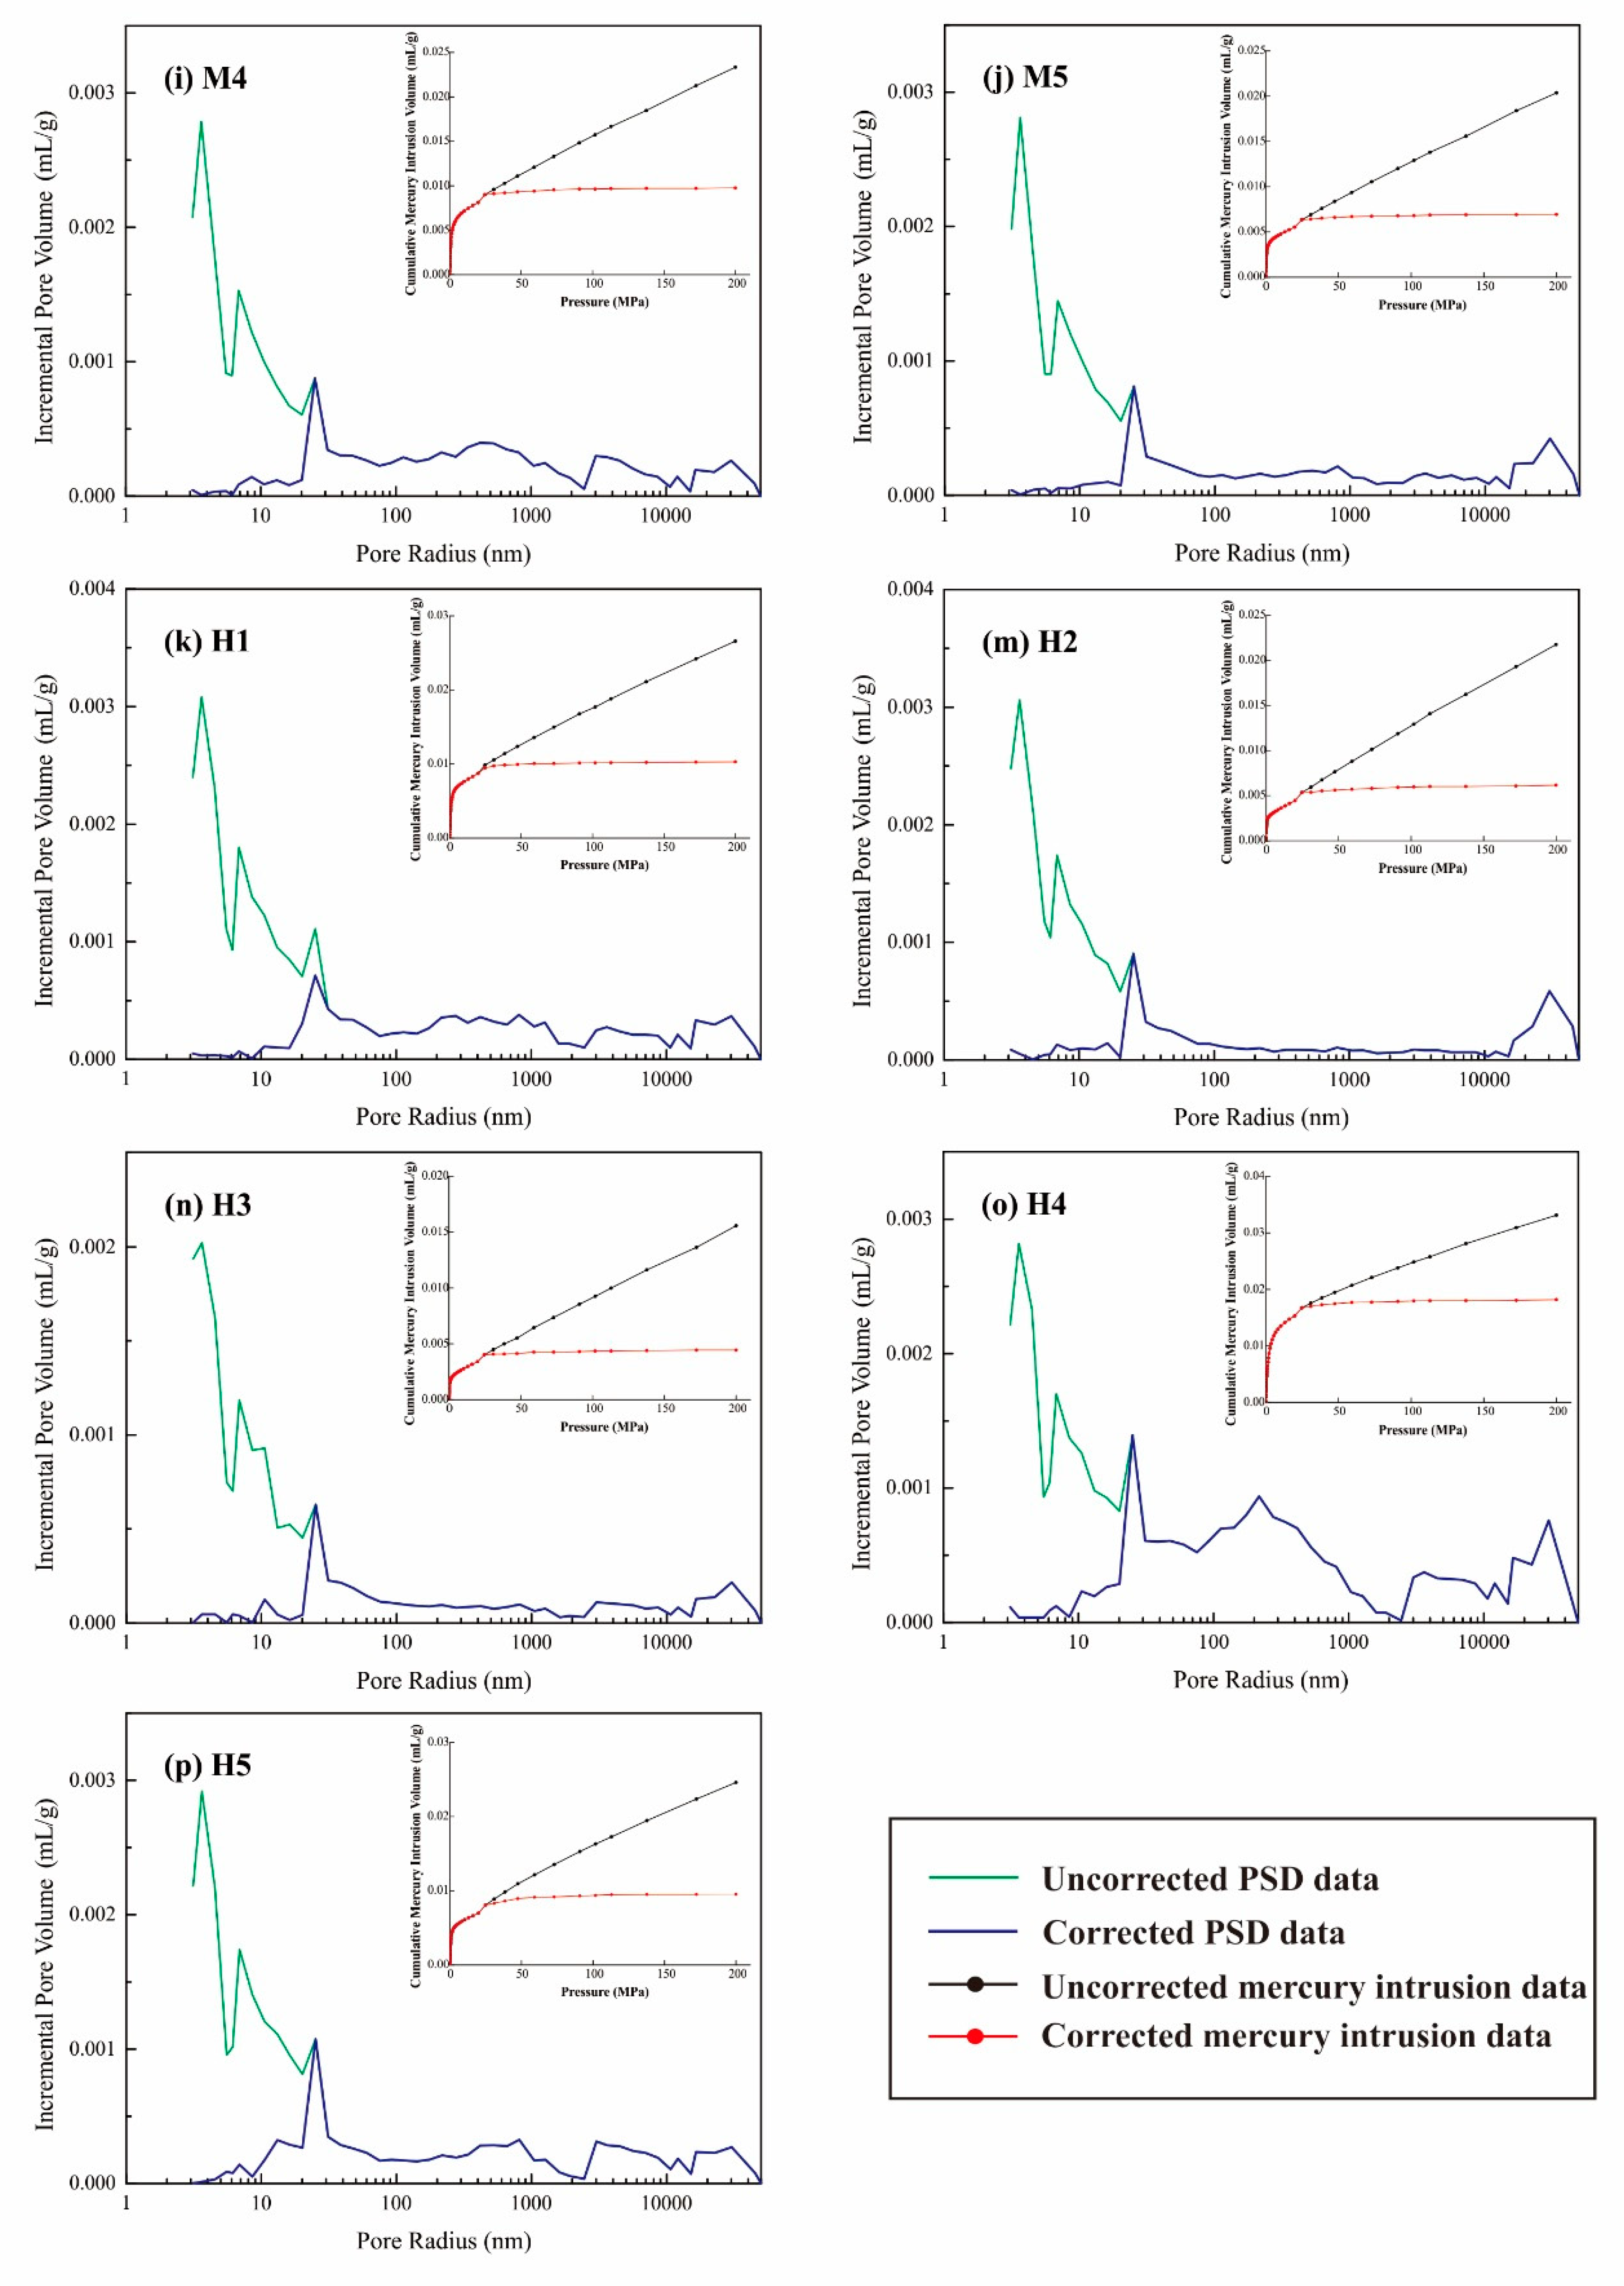
4.3. Mercury Intrusion Porosimetry Pore Size Distributions Correction

Previous studies have shown the method to correct the original PSDs of MIP in combination with LTNA data [20,41,42]. As discussed in Section 4.2, the coal matrix compression begins at the mercury intrusion pressure of 24.75 MPa. Thus, in this study, the pressure range for the MIP data correction is 24.75–199.94 MPa. The pore volume in this stage can be redefined as
Δ V p i = Δ V d ( p i ) Δ V m ( p i ) = V d ( p i ) V d ( p 0 ) k c V c ( p i ) ( p i p 0 )
where ΔVpi, ΔVd(pi) and ΔVm(pi) are the changes of filling pore volume, detected mercury volume, and matrix compression volume when pressure increases from p0 to pi, respectively; Vd(pi) represents the detected mercury intrusion volume at a pressure of pi; and Vc(pi) is the coal matrix compressed volume, which can be defined as
V c ( p i ) = V c d V c d P ( p i p 0 )
Combining Equations (17) and (18), the corrected mercury intrusion data and PSDs from MIP measurements for all selected coal samples are shown in Figure 5. Compared with the uncorrected mercury intrusion volume in a pore radius of 3–25 nm, the corrected mercury intrusion volume decreased by 35.51–96.65%. This indicates that the matrix compressibility has an evident impact on coal PSDs estimation. By using MIP measurement, previous studies evaluated the heterogeneity characteristics of coals only through the original PSDs data and single fractal method [43,44], rather than the corrected PSDs data and multifractal analysis. This may result in inaccuracy estimation of the variability and heterogeneity of coals. In the next section, based on the corrected PSDs from MIP measurement, the heterogeneity characteristics of coals were investigated by the introduced multifractal analysis.

4.4. Multifractal Characteristics of the Corrected Pore Size Distributions

Figure 6 shows the double log relationship between X (q, ε) and ε for the presentative sample L2. We find that the log X (q, ε) shows a great linear relationship with log (ε), with the correlation coefficients higher than 0.99 for all q values. This indicates the corrected PSDs for the presentative sample has multifractal characteristics.
Figure 7 shows the cross plots of generalized dimension (Dq) and q (i.e., generalized dimension spectrum) for all selected coal samples. We found that all generalized dimension spectra show an inverse S-shaped. When q < 0, Dq decreases sharply with the increases of q. On the contrast, Dq decreases slightly with the increases of q when q > 0.
D0, D1 and D2 are known as the capacity dimension, information dimension, and correlation dimension, respectively [45,46]. The calculated values of D0, D1, and D2 are presented in Table 2. Dmin and Dmax values for all coals range from 1.358 to 1.825 (average at 1.500), 0.626 to 0.818 (average at 0.704), respectively (Table 2).
Figure 8 represents the relationship between the f (α) and α (q) (i.e., multifractal spectra). The multifractal spectrum shows a typical shape of a concave-down parabola. On the left of the parabola, f (α) increases with the increase of α (q). In contrast, f (α) decreases with the increase of α (q) on the right of parabola. The values of singularity strength range (Δα) range from 0.816 to 1.279, average at a high value of 1.000 (Table 2), indicating the variability and heterogeneity characteristics of the corrected PSDs. Considering the similar pore structure characterization in some unconventional reservoirs, the multifractal analysis used in this study (i.e., coal) can also be applied for shales and tight sandstone PSD heterogeneity investigations.
Figure 9 displays the relationship of τ (q) and q (i.e., mass exponent spectra). It can be found that when q < 0, τ (q) emerges an obvious increase trend with the increasing of q. In contrast, it emerges a slight increase when q > 0. The changing trend of τ (q) at q < 0 is much weaker than q > 0.

4.5. Petrophysical Characteristics and Multifractal Parameters

Previous studies show that the multifractal parameters (i.e., Dmin, Dmax and Δα) can be used for describing the heterogeneity characterization of PSDs [34,36]. The parameters Dmin and Dmax are more sensitive to the heterogeneity of a low and high probability interval, respectively. In this study, the parameters Dmin and Dmax were chosen to investigate the relationship between petrophysical characteristics and heterogeneity characteristics.
The relationship between vitrinite and inertinite contents versus Dmin and Dmax are shown in Figure 10. The vitrinite and inertinite contents are positively and negatively correlated with Dmin, respectively, whereas they emerge as having no meaningful relationship with Dmax. As shown in Figure 11, the moisture and ash contents only show a negative relationship with Dmax, and no relationship with Dmin. The results indicate that the increase in moisture and ash content reduce the heterogeneity of the PSDs with a high probability interval. However, in Li et al. [38], they found there is no significant relationships between moisture and ash content with multifractal parameters. It is possible that the samples studied in Li et al. [38] are only the tectonically deformed coal which limits the analysis in other types of coals.
Figure 12 displays relationships of multifractal dimensions (Dmin and Dmax) vs. MIP parameters (injection of mercury saturation and efficiency of mercury withdrawal). Dmin is negatively correlated with the injection of mercury saturation, whereas it shows no obvious correlation with the efficiency of mercury withdrawal. The Dmax shows a “U-morph” relationship with the efficiency of mercury withdrawal, with a minimum value at 55%, and it shows no relationship with the injection of mercury saturation. This may suggest that the multifractal dimension Dmax is more sensitive to the efficiency of mercury withdrawal, while Dmin is more sensitive to the injection of mercury saturation.

5. Conclusions

This study firstly combined MIP and LTNA data to correct the mercury intrusion volume under high pressure ranges. Then, the multifractal analysis was applied to characterize the variability and heterogeneity of the corrected PSDs in coals. The major conclusions made are as follows:
  • Coal matrix compressibility has an evident impact on MIP data when the mercury intrusion pressure >24.75 MPa. Combined with LTNA data, the MIP PSDs ranging between 3 and 25 nm was corrected. The corrected mercury intrusion volume decreased by 35.51–96.65%. The matrix compressibility coefficients vary from 0.89 × 10⁻¹⁰ m2/N to 2.47 × 10⁻¹⁰ m2/N, following a cubic polynomial relationship with the increasing Ro,m.
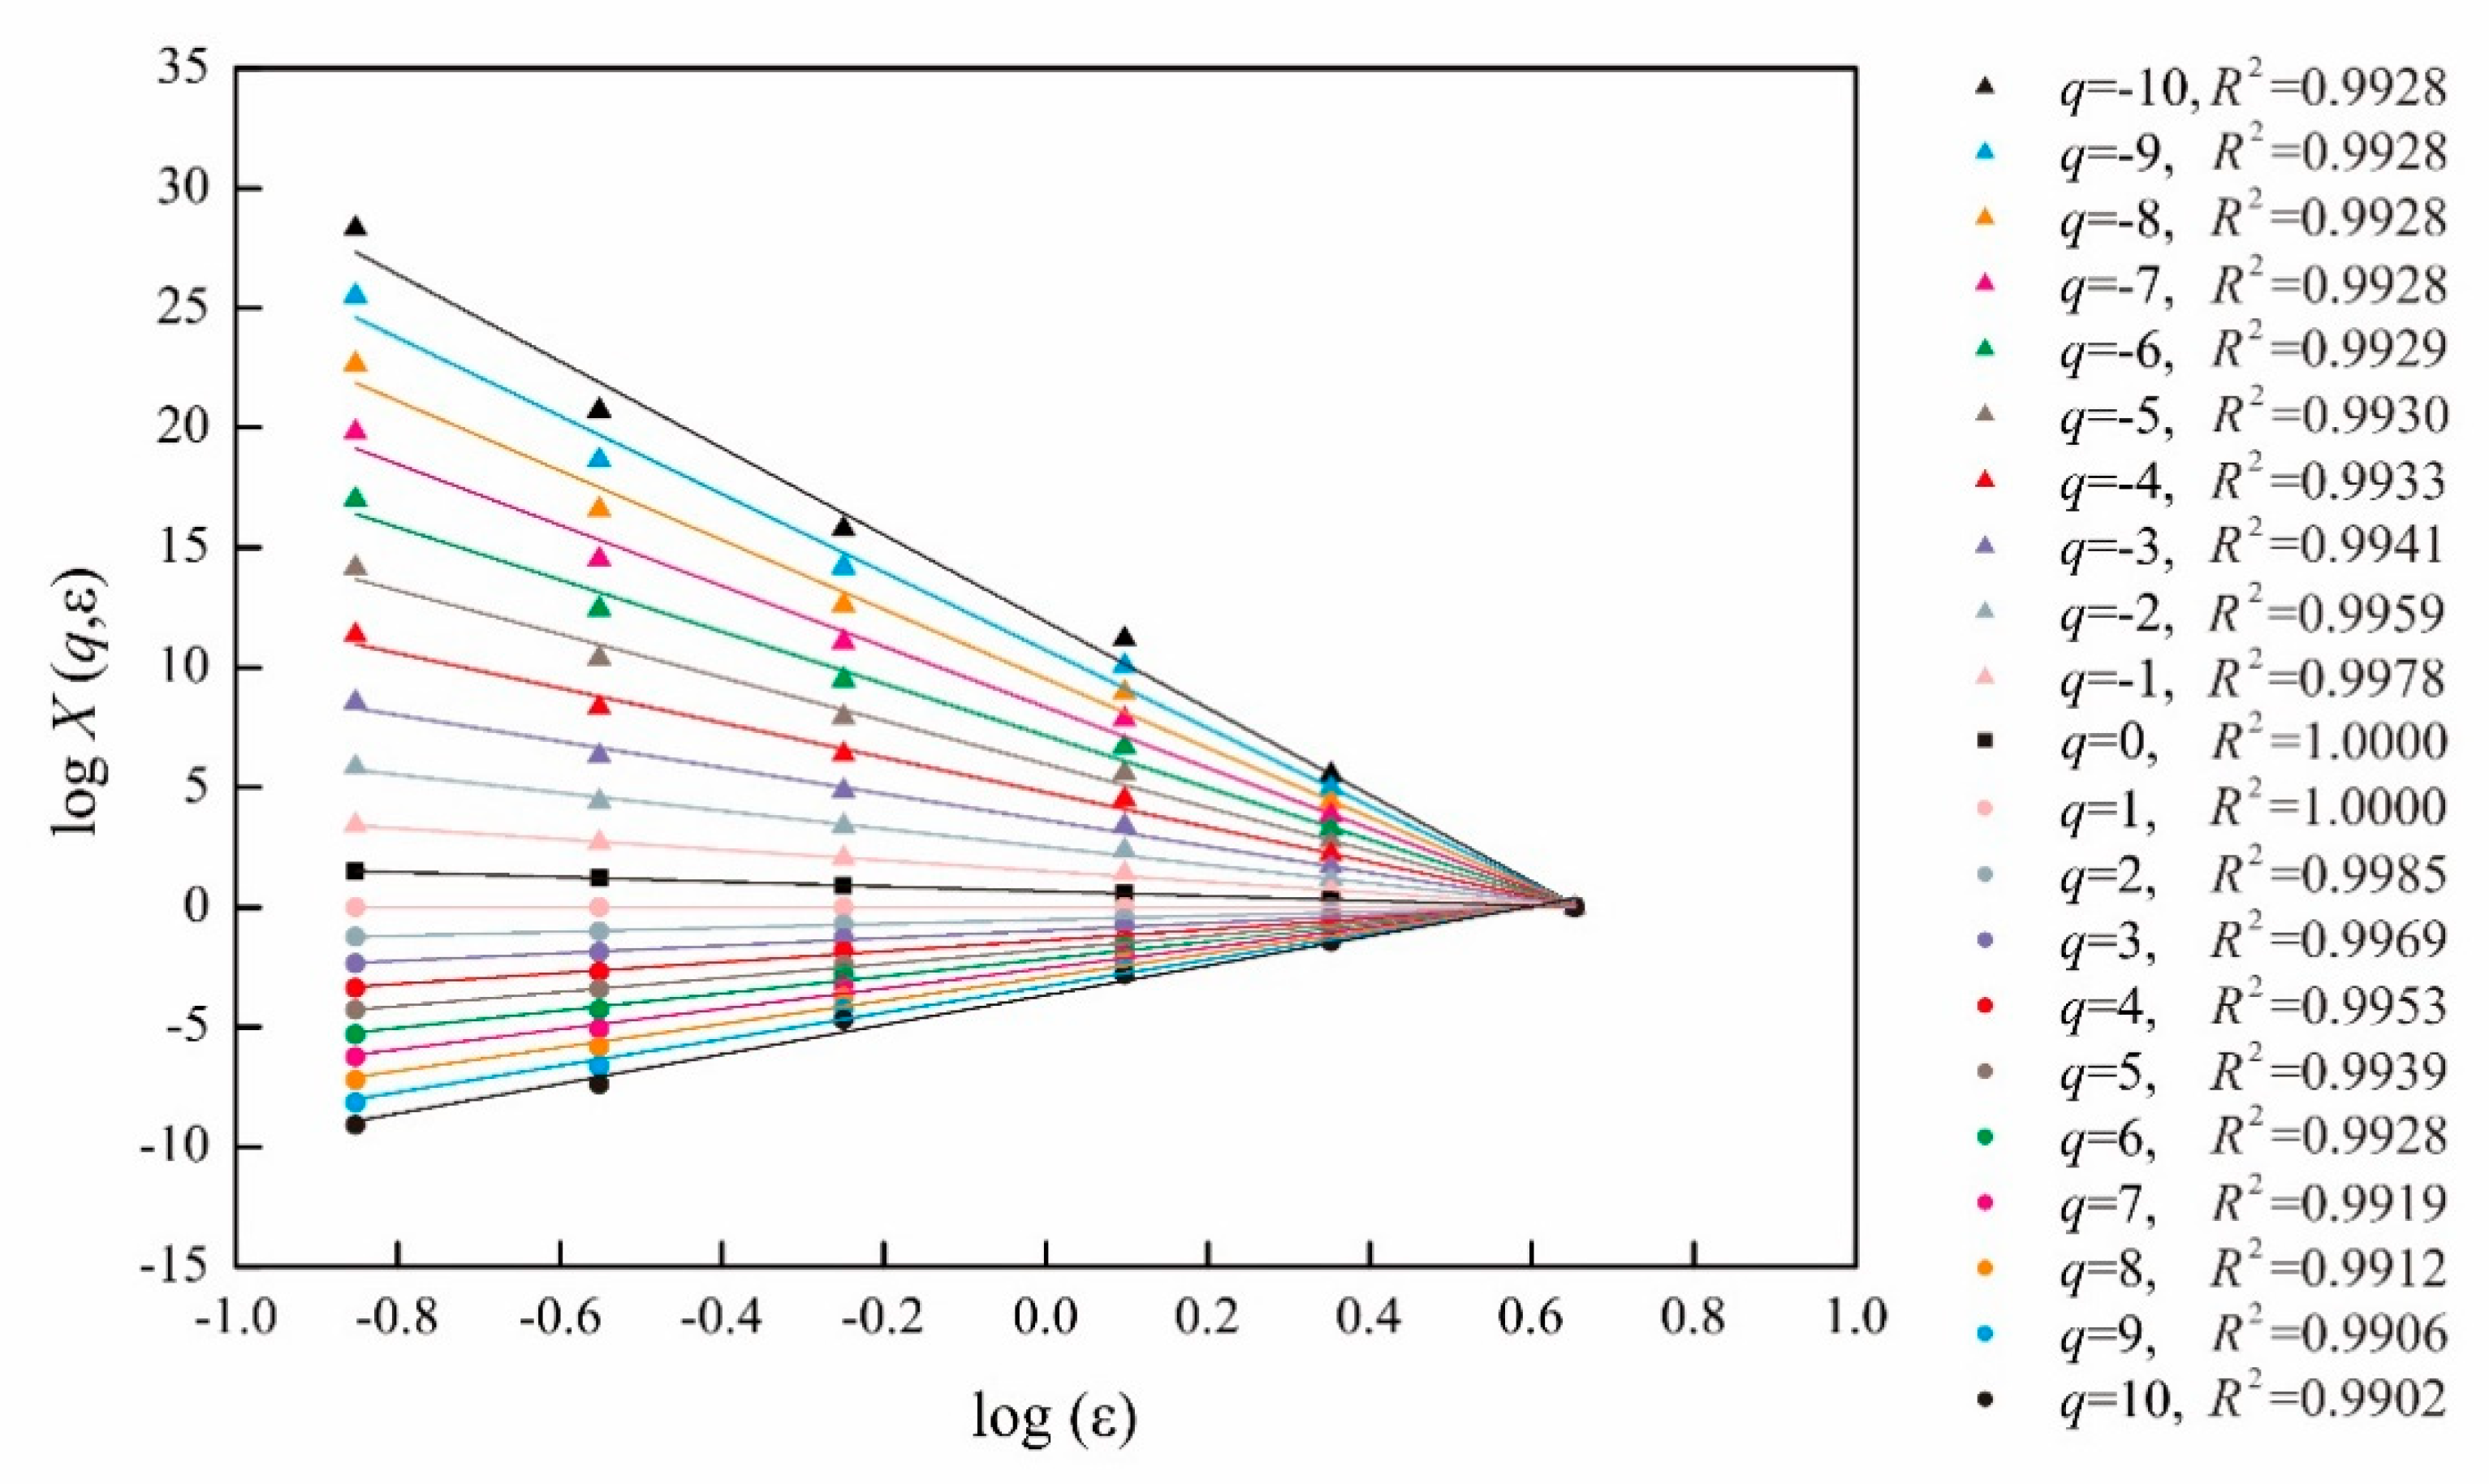
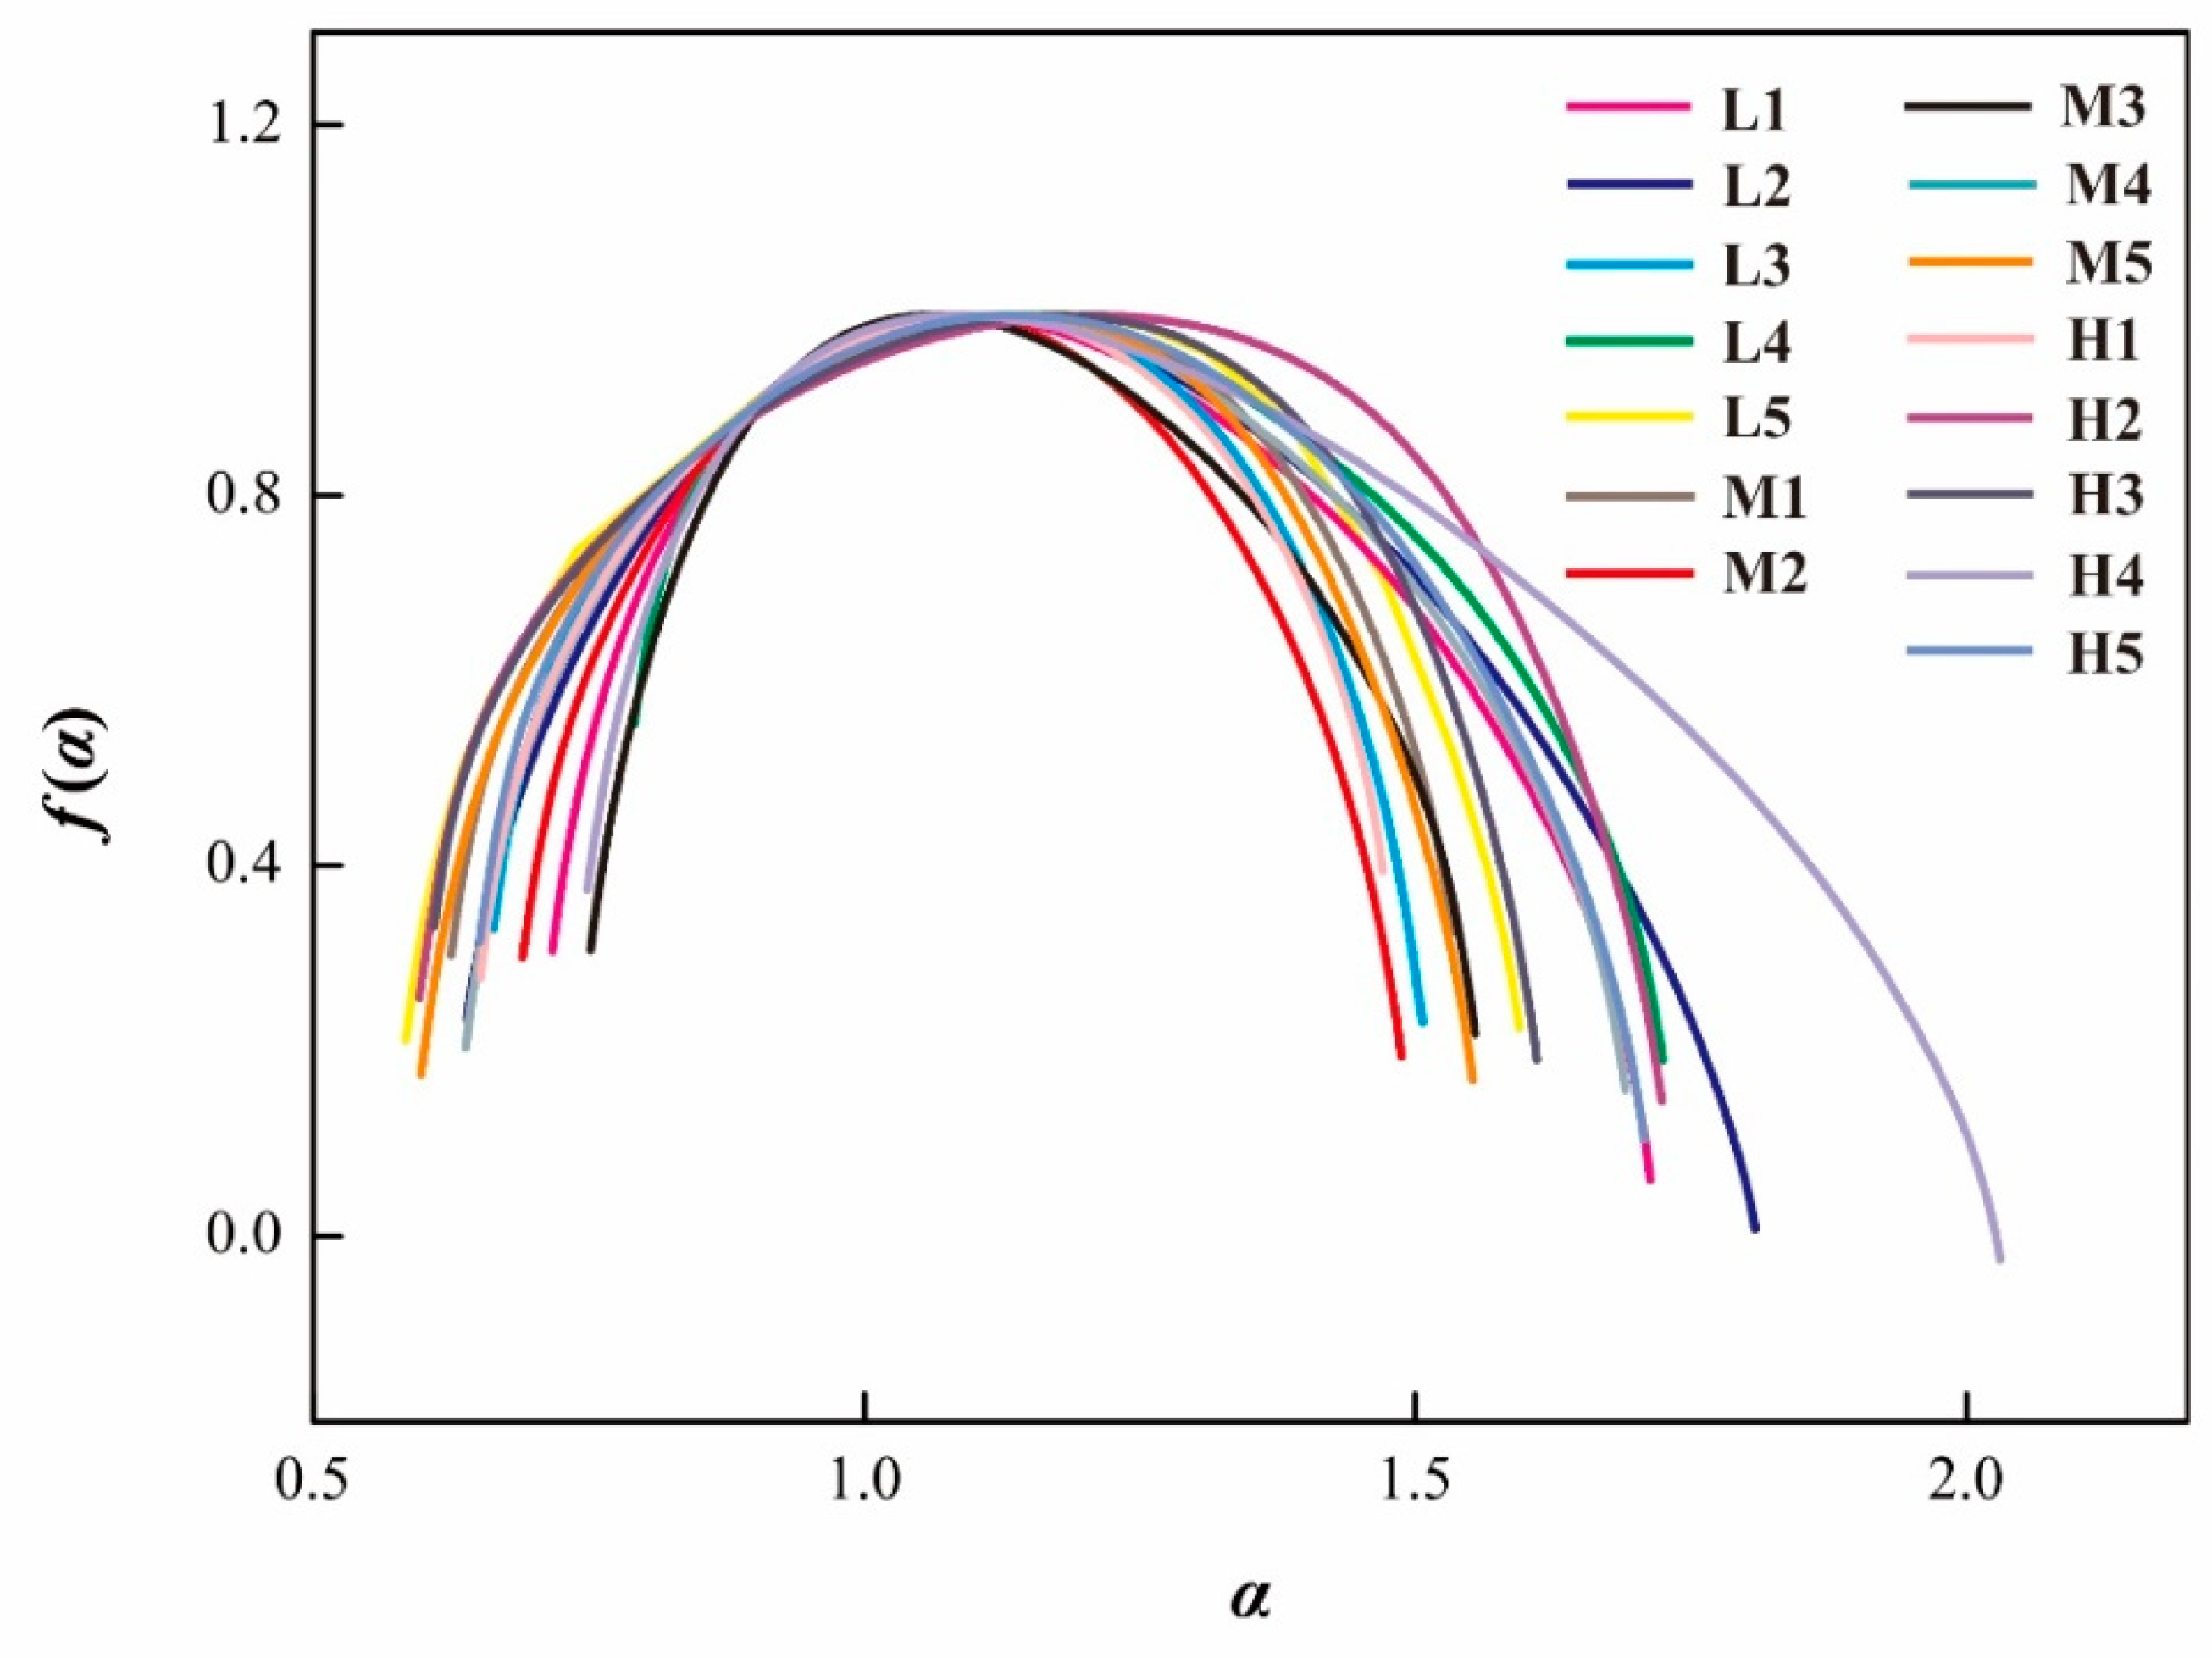
  • The multifractal analysis of corrected PSDs, which were determined using a combination of MIP and LTNA data, was conducted. The multifractal spectrum shows a typical concave-down parabola shape. On the left of the parabola, f (α) increases with the increase of α (q). In contrast, f (α) decreases with the increase of α (q) on the right of parabola.
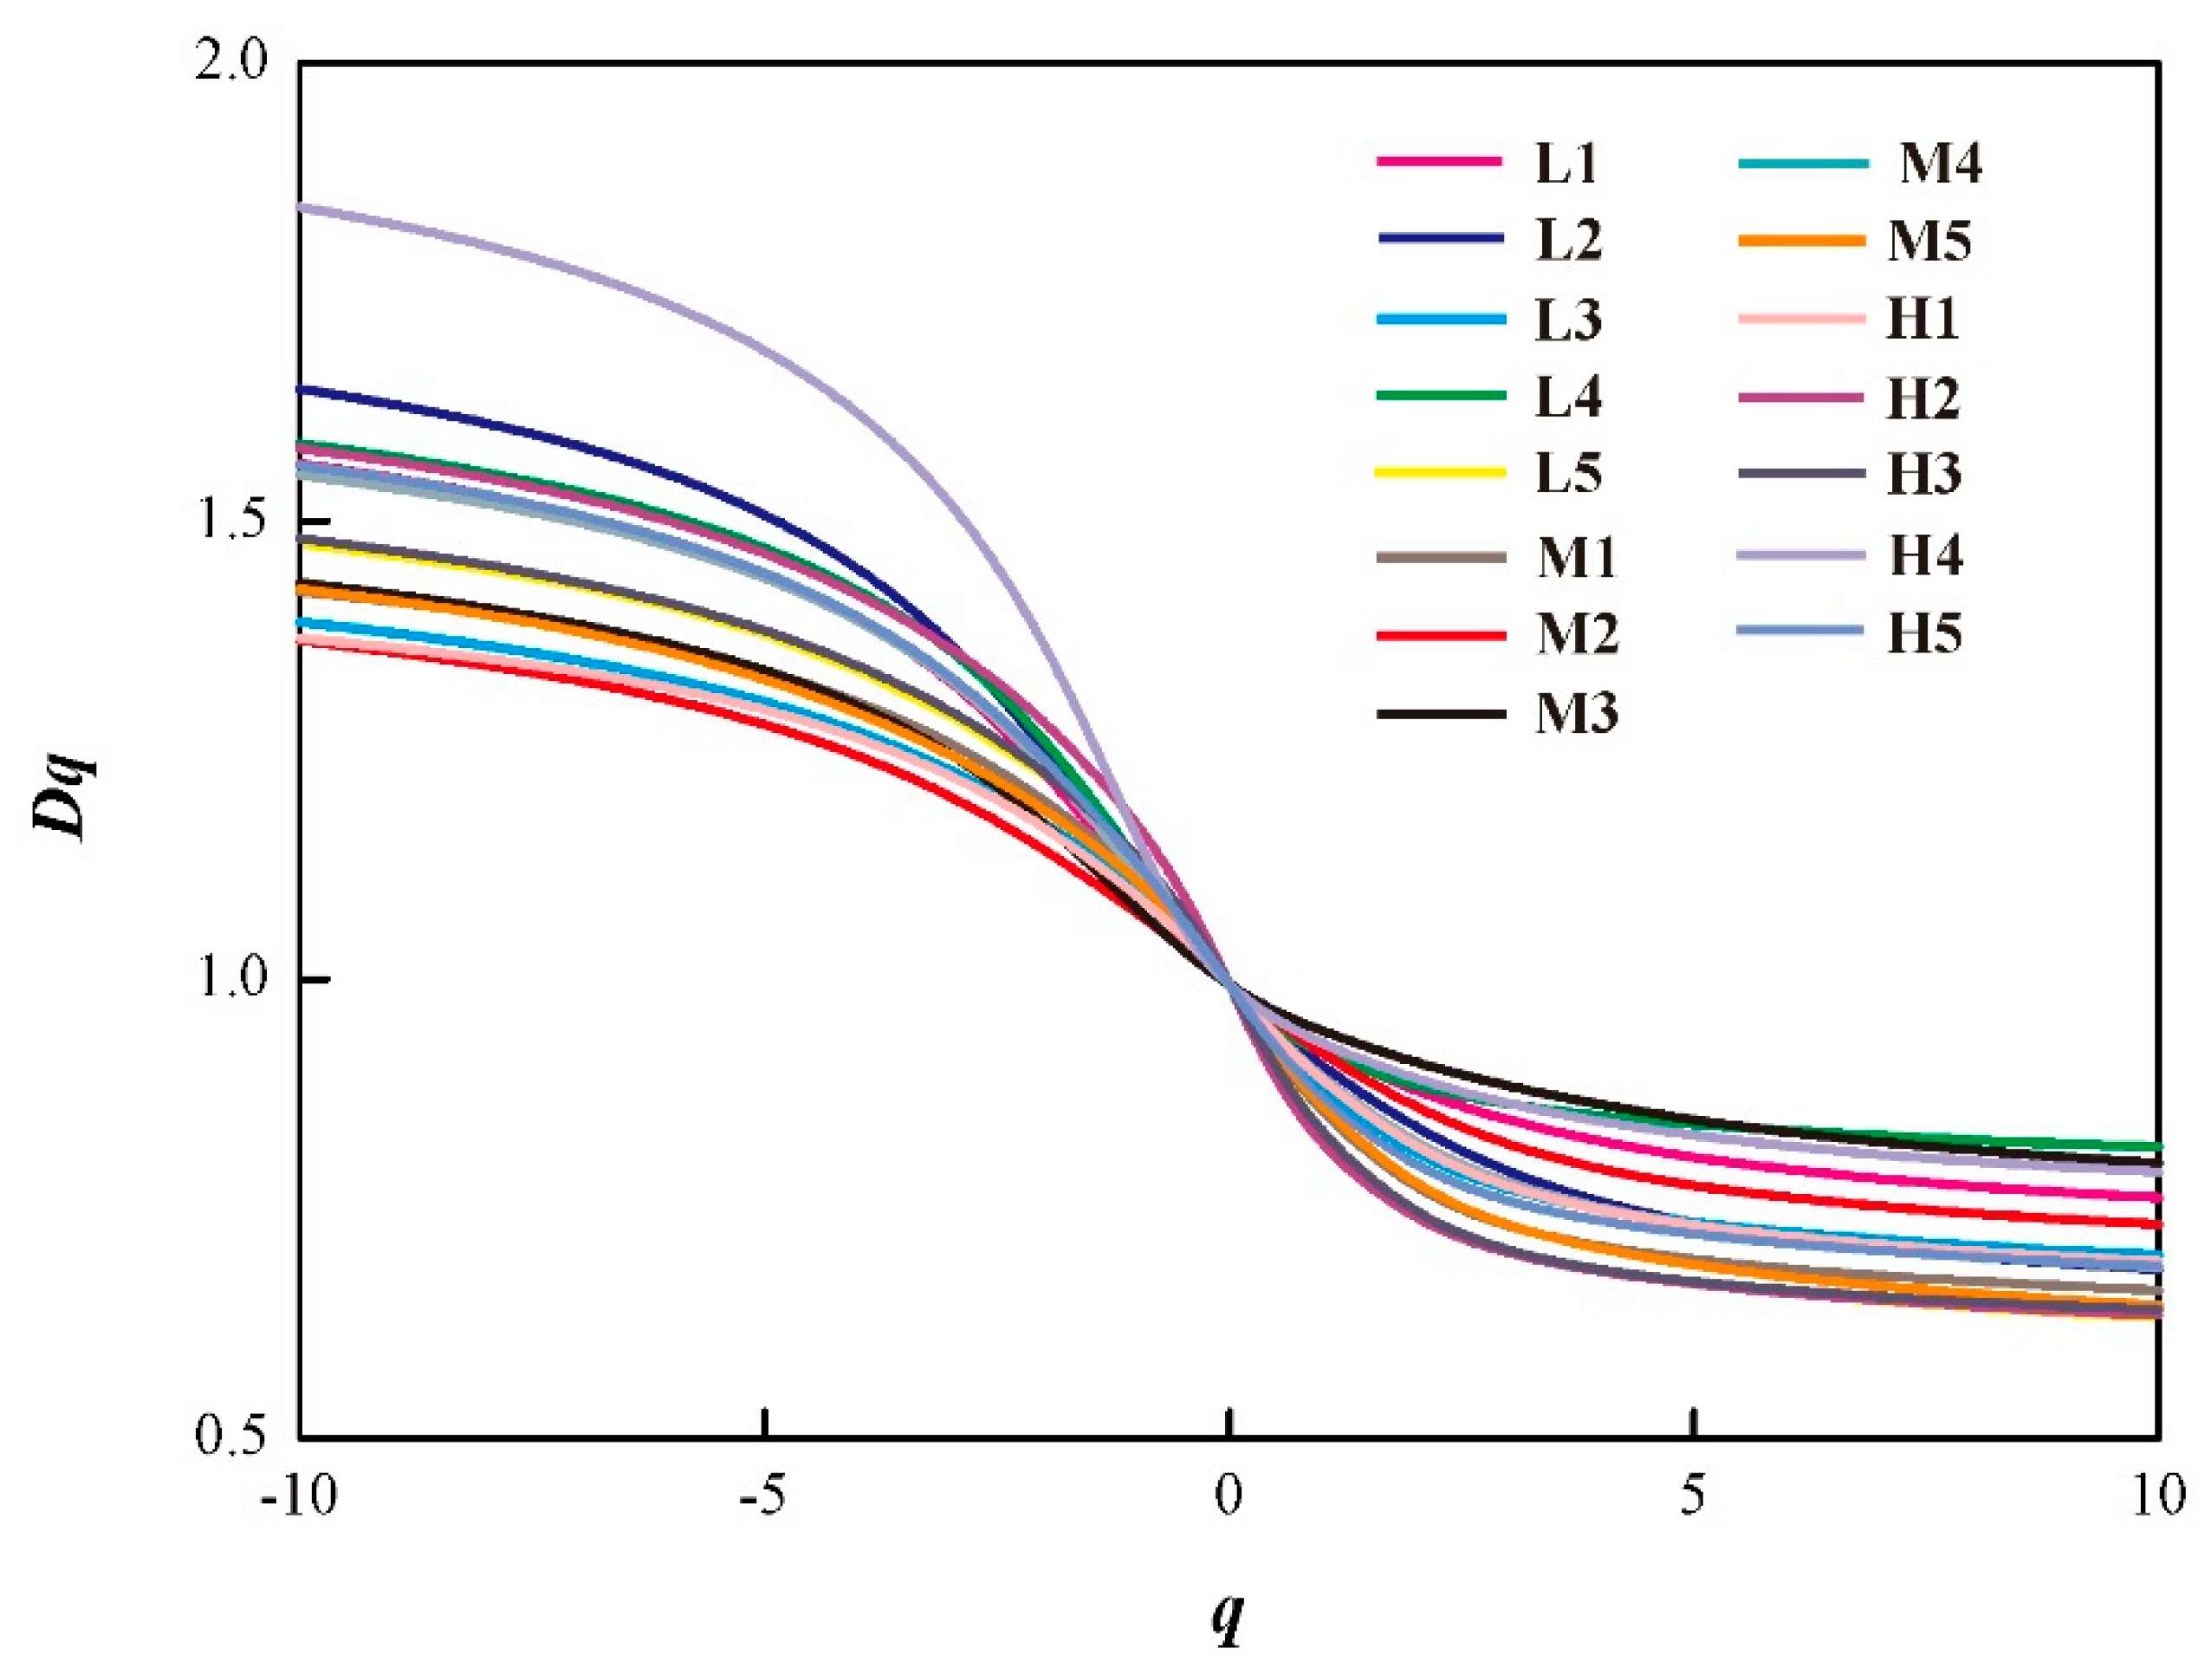
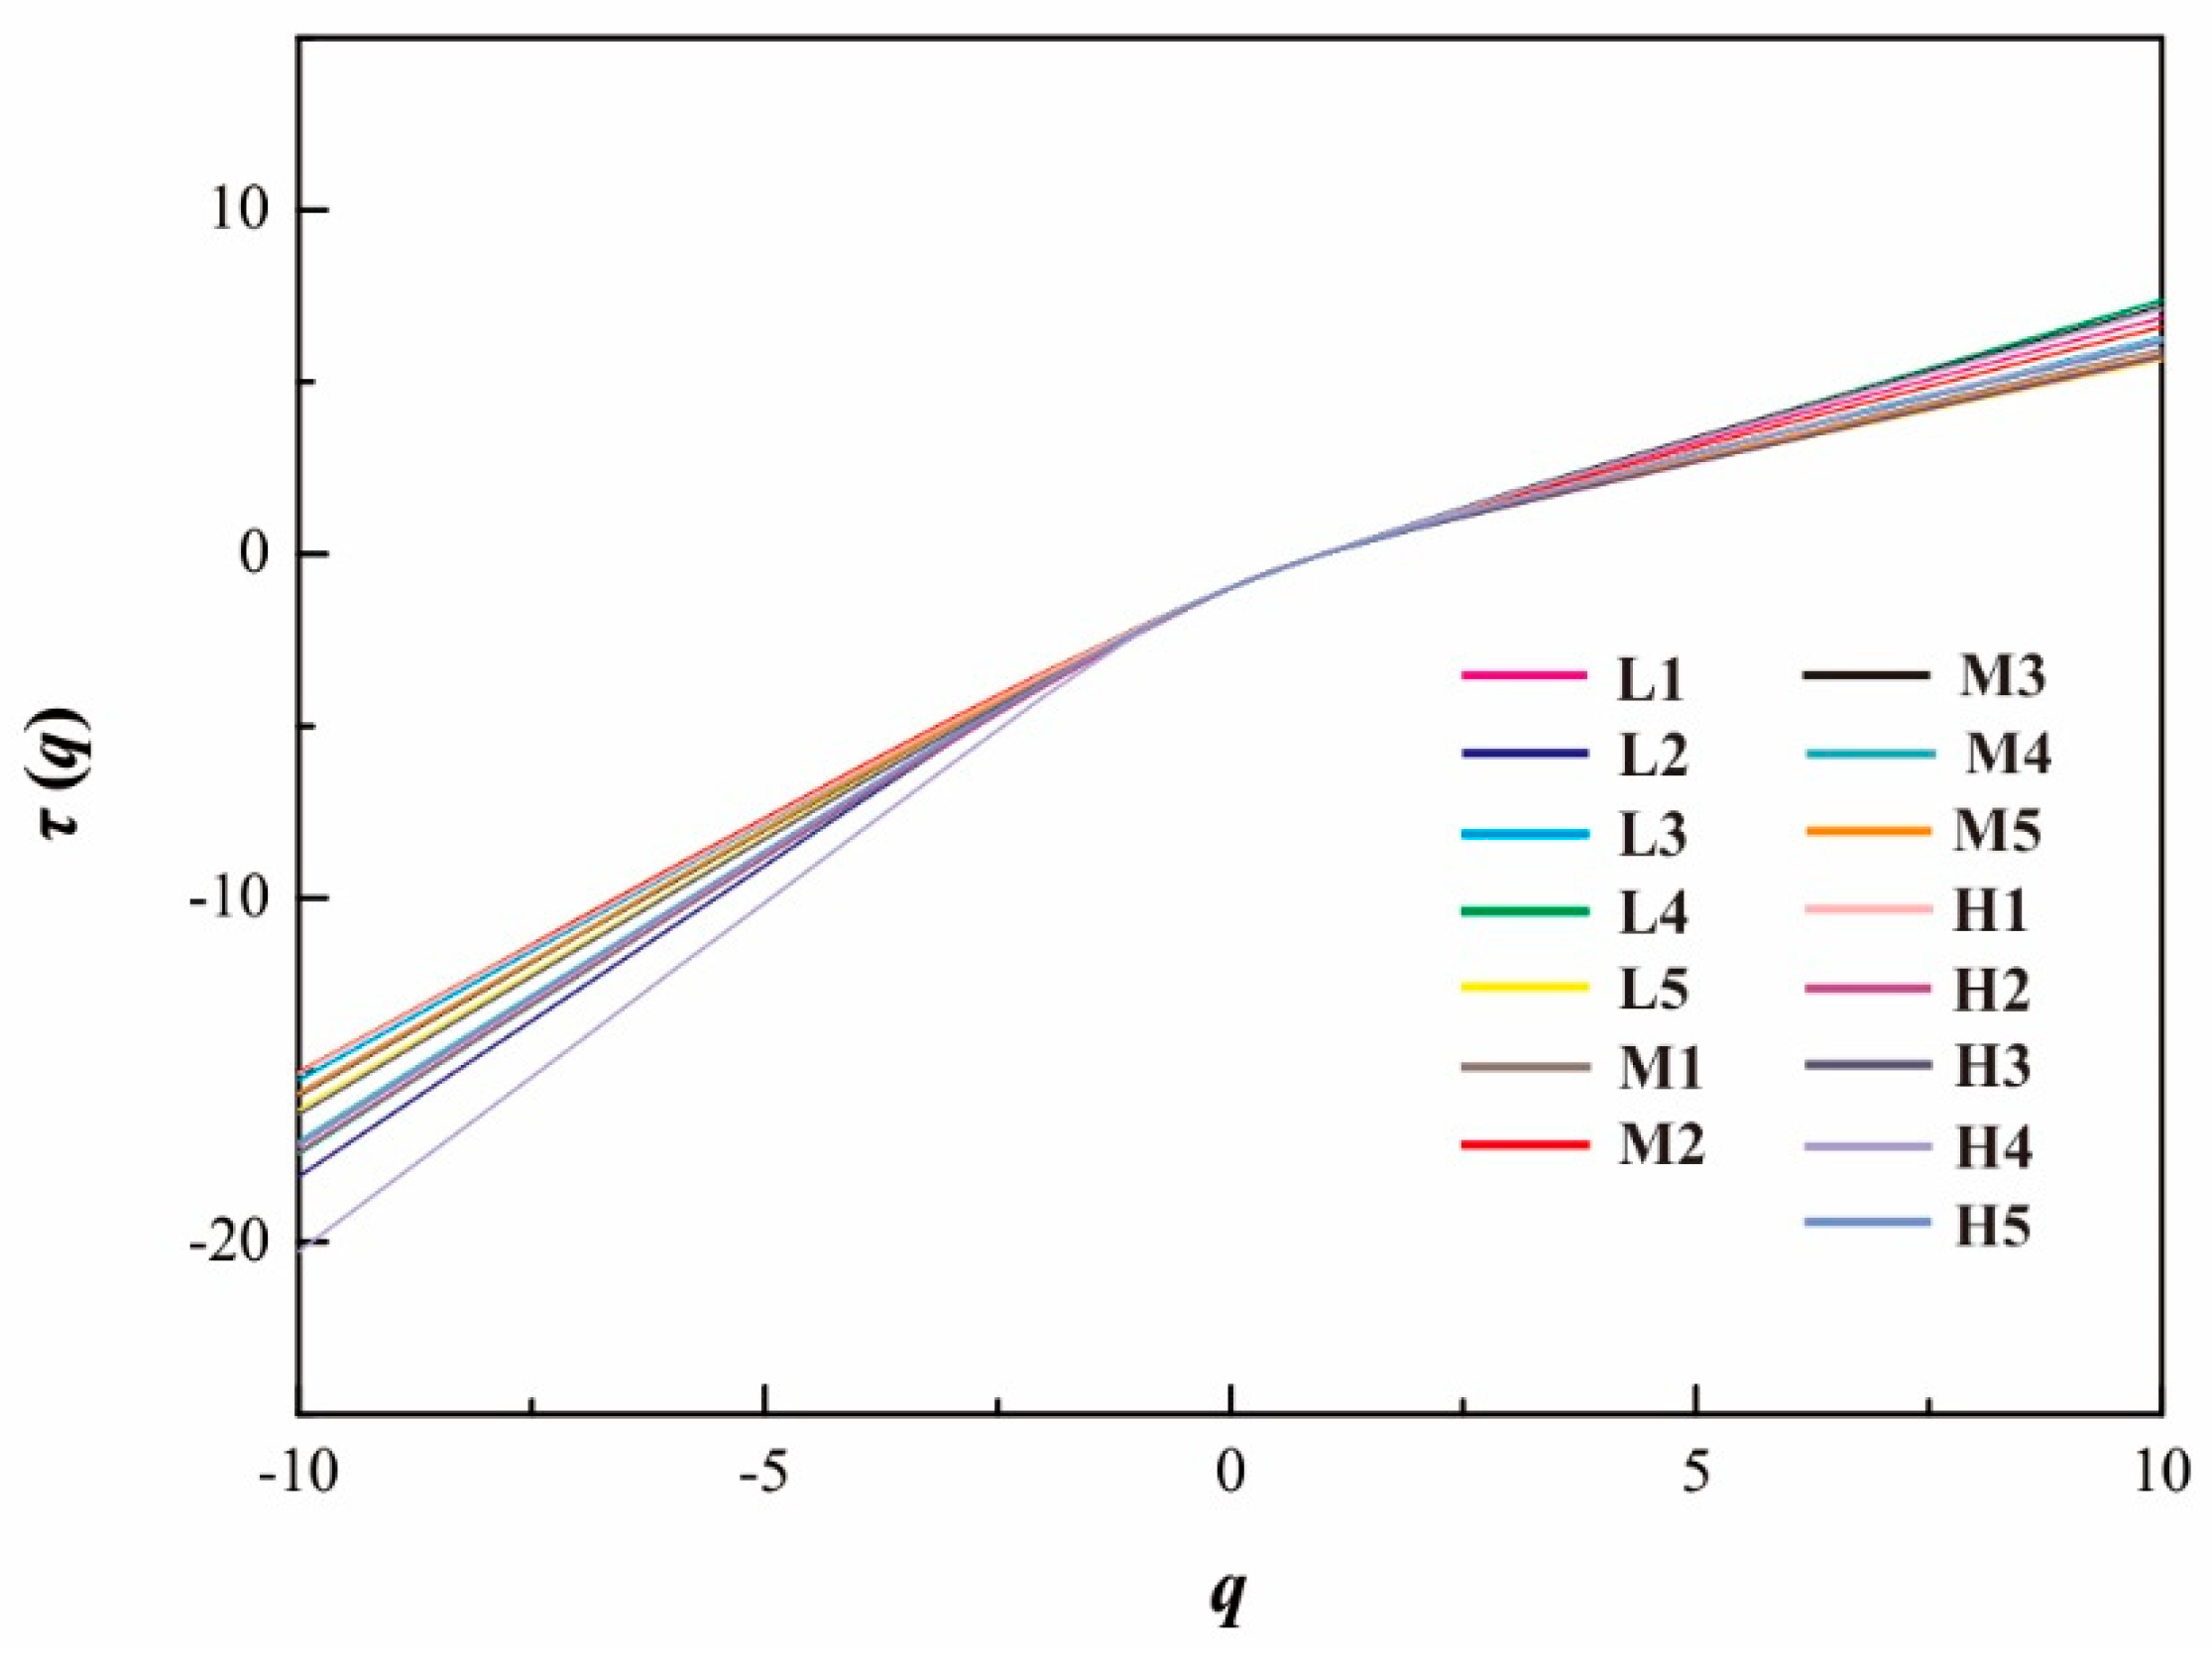
  • When q < 0, the mass exponent spectra emerges, showing an obvious increasing trend with the increase in q. In contrast, there is a slight increase when q > 0. The multifractal spectra generalized dimensions and mass exponent spectra indicate the typical multifractal characteristics of corrected PSDs for the coals.
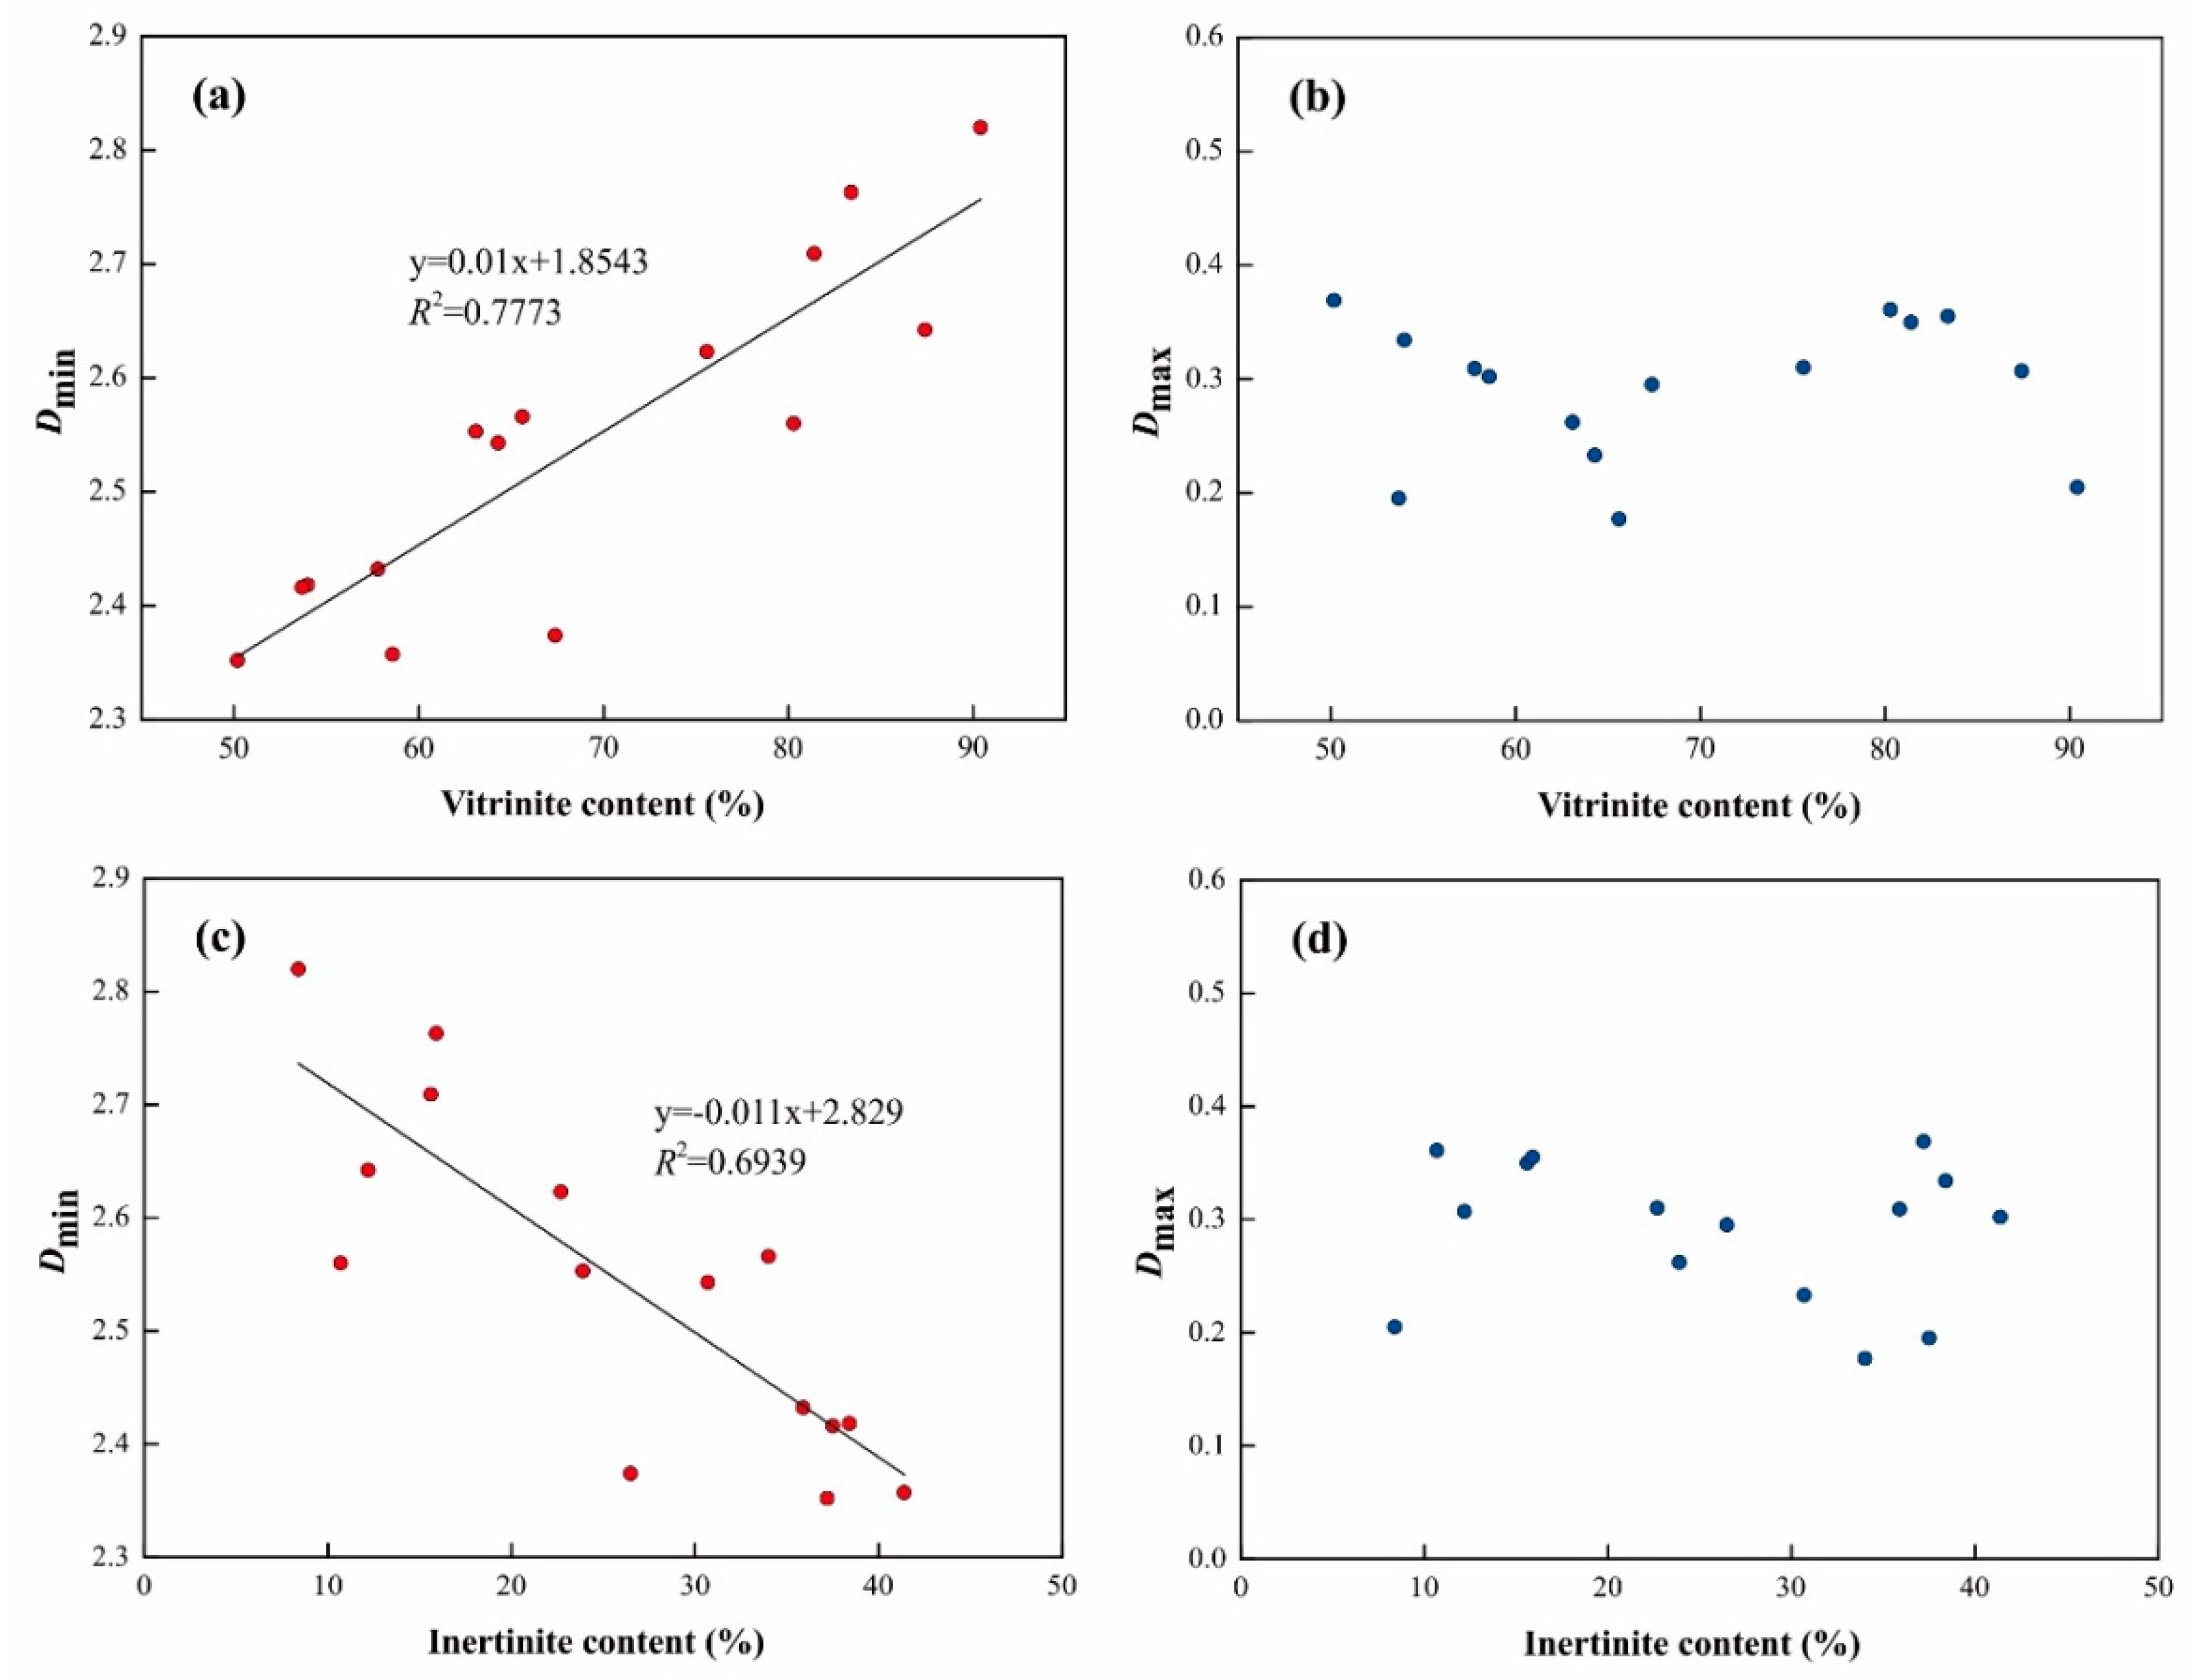
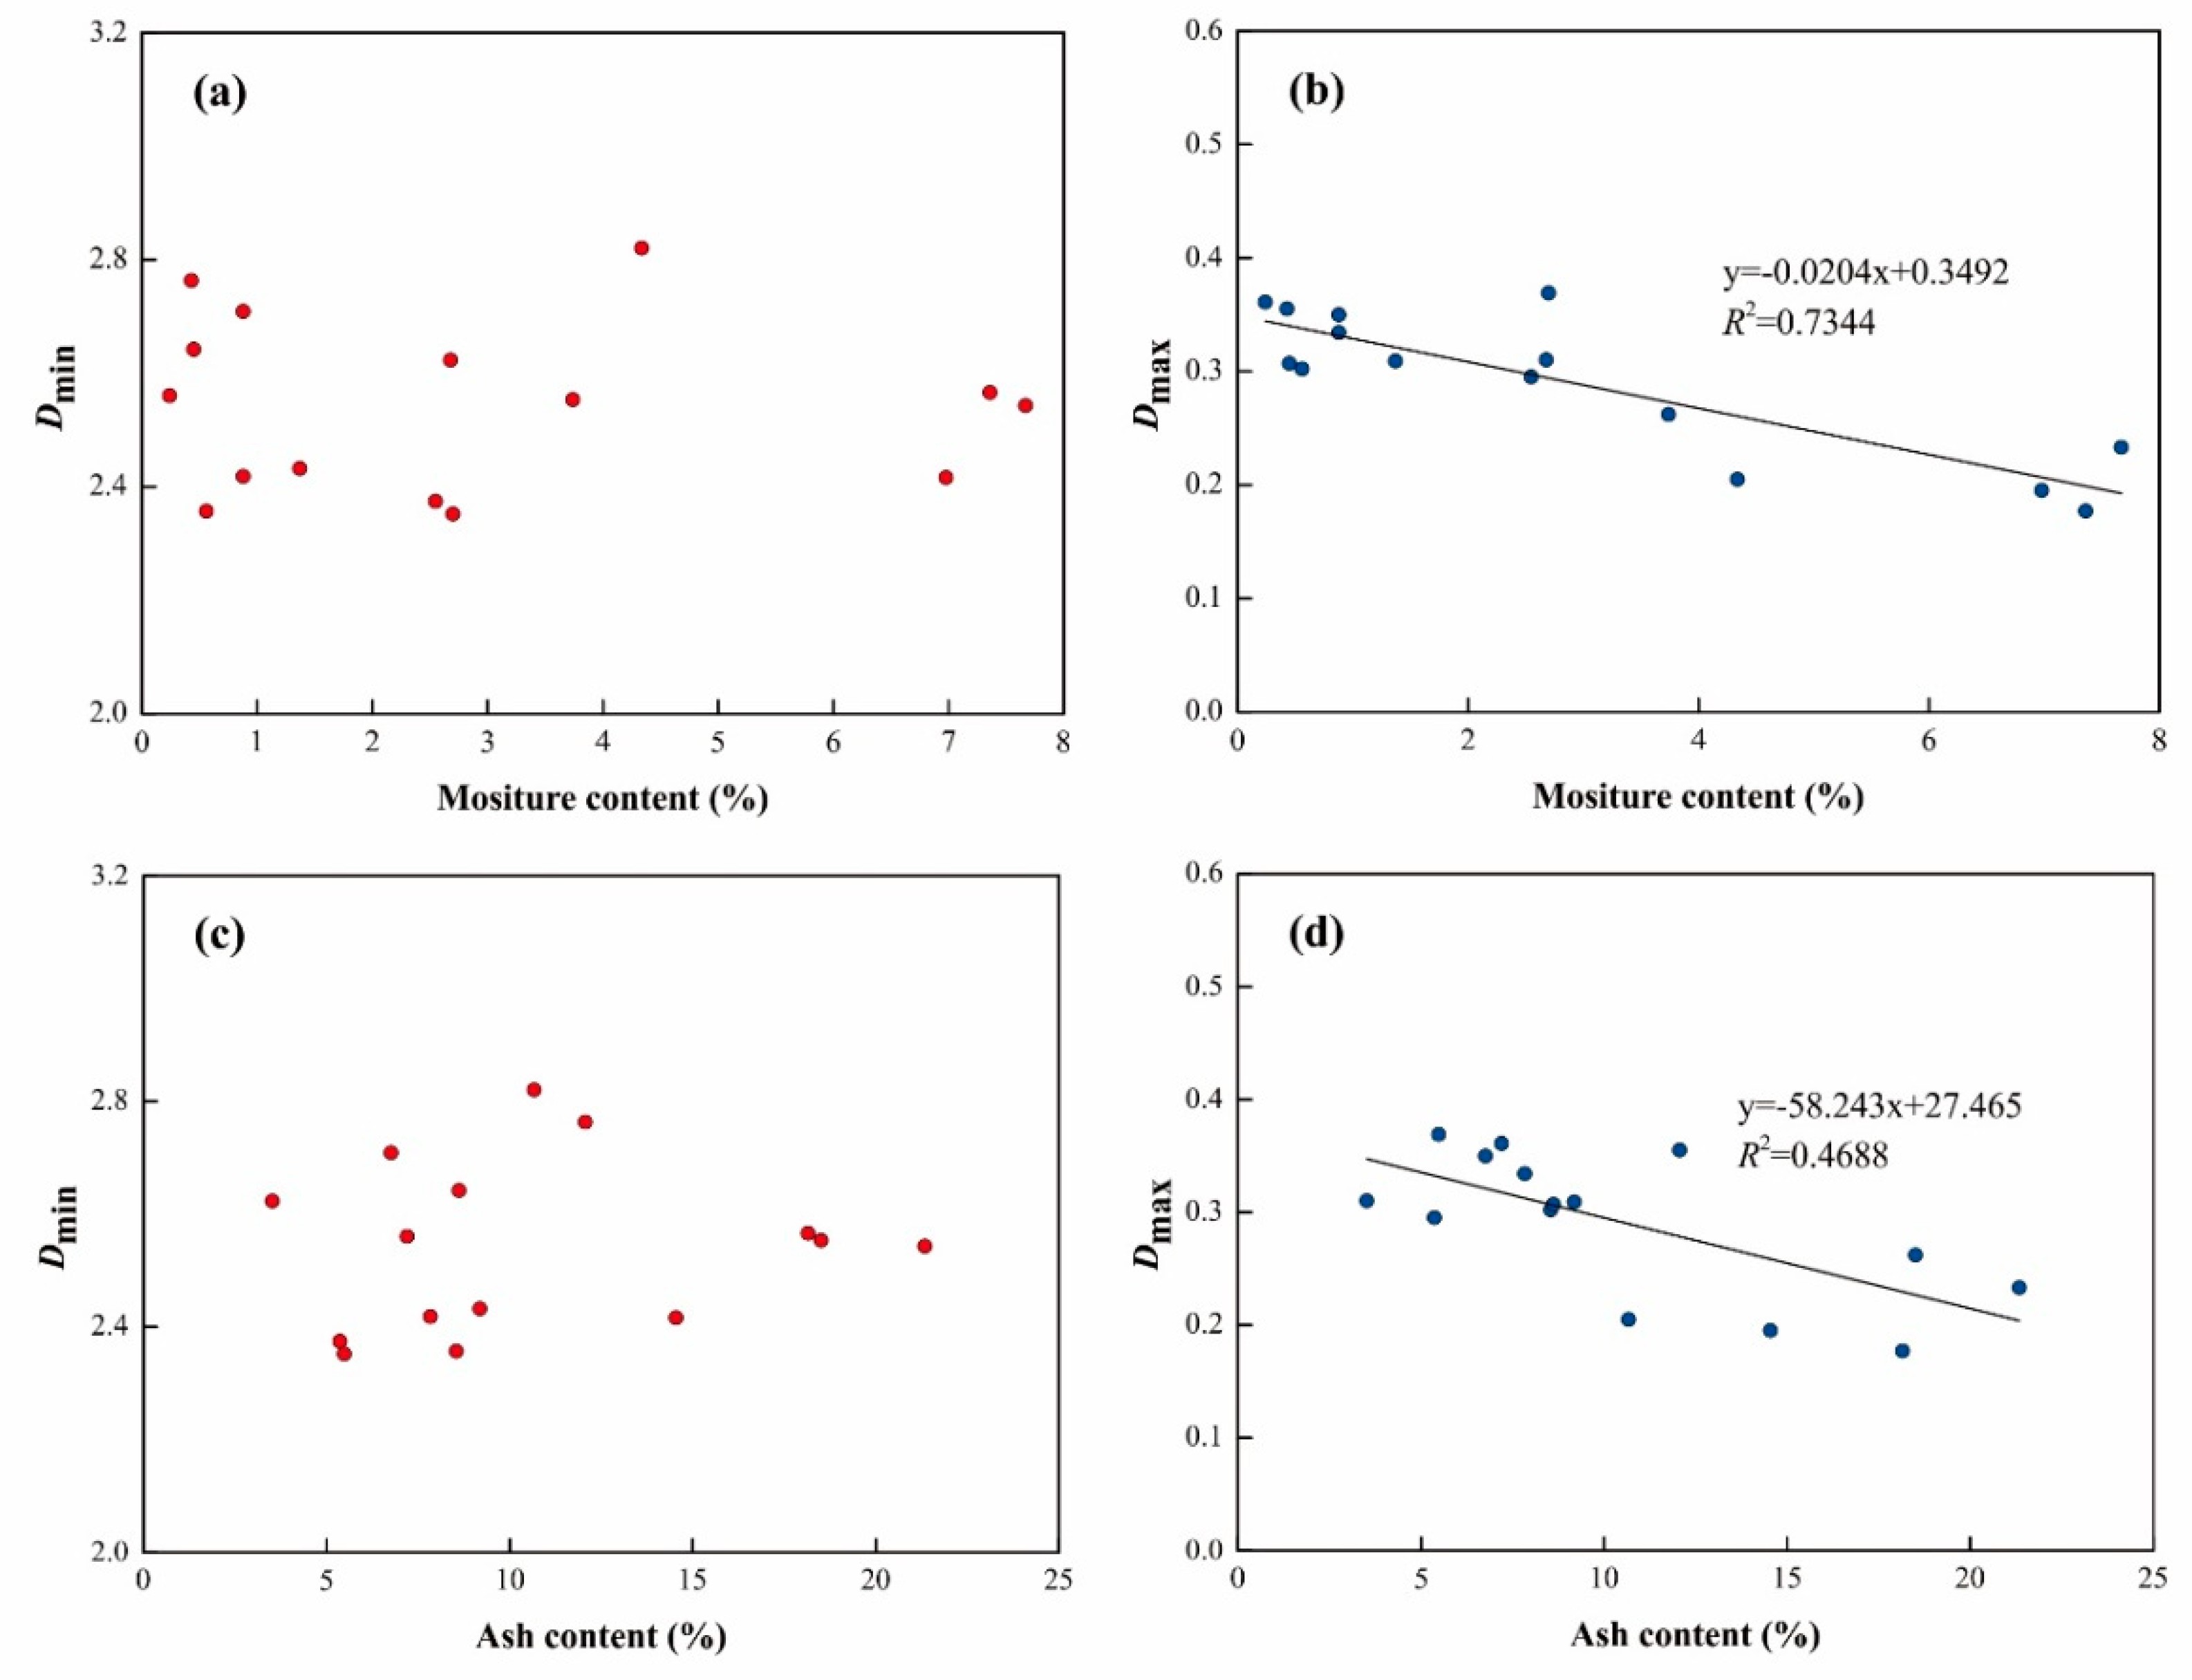
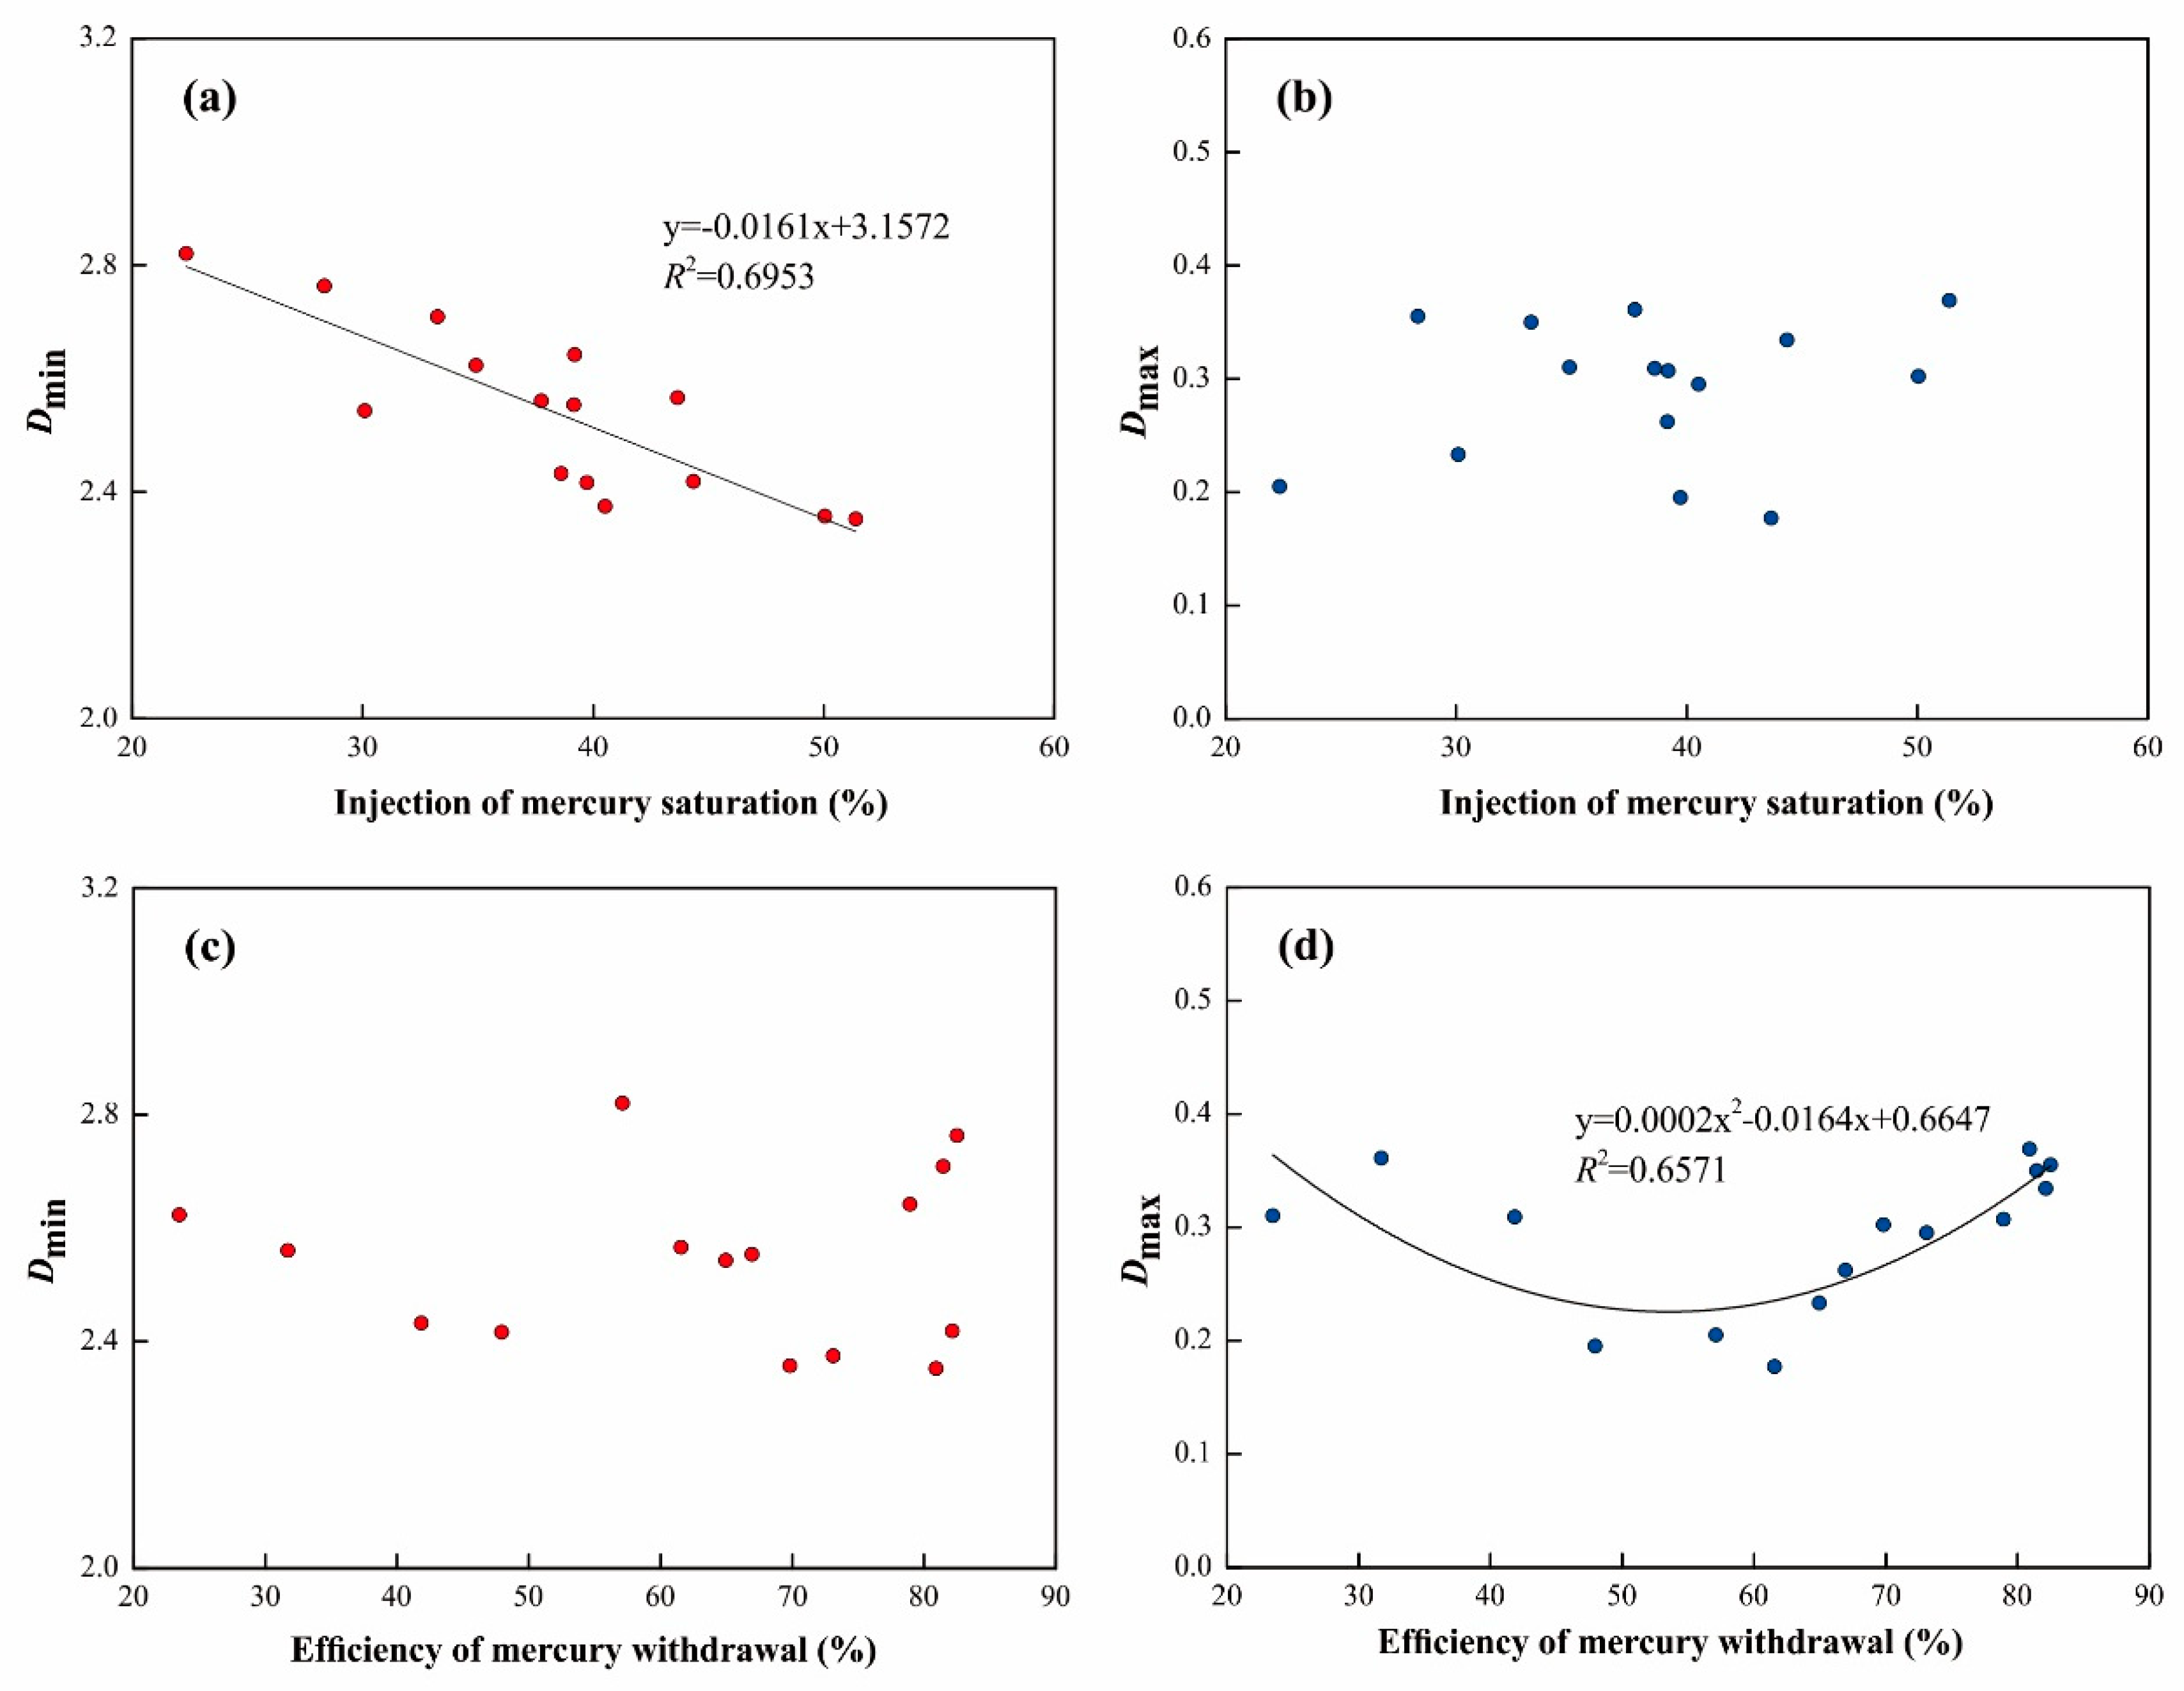
  • Multifractal parameter Dmin shows a negative relationship with inertinite contents and mercury intrusion saturation, whereas it shows a positive relationship with the vitrinite contents. Dmax shows a negative relationship with moisture and ash content, and a “U-shaped” trend with efficiency of mercury withdrawal.

Author Contributions

Y.Y. conceived and designed the experiments; S.Z. (Sijian Zheng) performed the experiment sand wrote the paper; S.Z. (Sijian Zheng) and S.Z. (Shasha Zhang) analyzed the data; Y.Y. and Y.L. revised the paper and provided language support; J.Y. provided technical support.

Funding

This research was funded by the National Natural Science Foundation of China (grant Nos. 41830427 and 41872123), the National Major Research Program for Science and Technology of China (grant No. 2016ZX05043-001), the Key research and development project of Xinjiang Uygur Autonomous Region (grant No. 2017B03019-1), and the Fundamental Research Funds for the Central Universities (292018227).

Conflicts of Interest

The authors declare no conflict of interest.

References

  1. Moore, T.A. Coalbed methane: A review. Int. J. Coal Geol. 2012, 101, 36–81. [Google Scholar] [CrossRef]
  2. Cai, Y.D.; Liu, D.M.; Pan, Z.J.; Yao, Y.B.; Li, J.Q.; Qiu, Y.K. Pore structure and its impact on CH4 adsorption capacity and flow capability of bituminous and subbituminous coals from Northeast China. Fuel 2013, 103, 258–268. [Google Scholar] [CrossRef]
  3. Cai, Y.D.; Liu, D.M.; Yao, Y.B.; Li, J.Q.; Qiu, Y.K. Geological controls on prediction of coalbed methane of No. 3 coal seam in Southern Qinshui Basin, North China. Int. J. Coal Geol. 2011, 88, 101–112. [Google Scholar] [CrossRef]
  4. Zheng, S.J.; Yao, Y.B.; Liu, D.M.; Cai, Y.D.; Liu, Y. Characterizations of full-scale pore size distribution, porosity and permeability of coals: A novel methodology by nuclear magnetic resonance and fractal analysis. Int. J. Coal Geol. 2018, 196, 148–158. [Google Scholar] [CrossRef]
  5. Liu, X.F.; Nie, B.S. Fractal characteristics of coal samples utilizing image analysis and gas adsorption. Fuel 2016, 182, 314–322. [Google Scholar] [CrossRef]
  6. Cai, Y.D.; Liu, D.M.; Mathews, J.P.; Pan, Z.J.; Elsworth, D.; Yao, Y.B.; Li, J.Q.; Guo, X.Q. Permeability evolution in fractured coal—Combining triaxial confinement with X-ray computed tomography, acoustic emission and ultrasonic techniques. Int. J. Coal Geol. 2014, 122, 91–104. [Google Scholar] [CrossRef]
  7. Yao, Y.B.; Liu, D.M.; Che, Y.; Tang, D.Z.; Tang, S.H.; Huang, W.H. Non-destructive characterization of coal samples from China using microfocus X-ray computed tomography. Int. J. Coal Geol. 2009, 80, 113–123. [Google Scholar] [CrossRef]
  8. Golab, A.; Ward, C.R.; Permana, A.; Lennox, P.; Botha, P. High-resolution three-dimensional imaging of coal using microfocus X-ray computed tomography, with special reference to modes of mineral occurrence. Int. J. Coal Geol. 2013, 113, 97–108. [Google Scholar] [CrossRef]
  9. Pan, J.N.; Zhu, H.T.; Hou, Q.L.; Wang, H.C.; Wang, S. Macromolecular and pore structures of Chinese tectonically deformed coals studied by atomic force microscopy. Fuel 2015, 139, 94–101. [Google Scholar] [CrossRef]
  10. Wang, S.Q.; Liu, S.M.; Sun, Y.B.; Jiang, D.; Zhang, X.M. Investigation of coal components of Late Permian different ranks bark coal using AFM and Micro-FTIR. Fuel 2017, 187, 51–57. [Google Scholar] [CrossRef]
  11. Wang, G.C.; Ju, Y.W.; Yan, Z.F.; Li, Q.G. Pore structure characteristics of coal-bearing shale using fluid invasion methods: A case study in the Huainan–Huaibei Coalfield in China. Mar. Pet. Geol. 2015, 62, 1–13. [Google Scholar] [CrossRef]
  12. Song, Y.; Jiang, B.; Shao, P.; Wu, J.H. Matrix compression and multifractal characterization for tectonically deformed coals by Hg porosimetry. Fuel 2018, 211, 661–675. [Google Scholar]
  13. Yao, Y.B.; Liu, D.M.; Tang, D.Z.; Tang, S.H.; Huang, W.H. Fractal characterization of adsorption-pores of coals from North China: An investigation on CH4 adsorption capacity of coals. Int. J. Coal Geol. 2008, 73, 27–42. [Google Scholar] [CrossRef]
  14. Chen, Y.L.; Qin, Y.; Wei, C.T.; Huang, L.L.; Shi, Q.M.; Wu, C.F.; Zhang, X.Y. Porosity changes in progressively pulverized anthracite subsamples: Implications for the study of closed pore distribution in coals. Fuel 2018, 225, 612–622. [Google Scholar] [CrossRef]
  15. Pajdak, A.; Kudasik, M.; Skoczylas, N.; Wierzbicki, M.; Teixeira Palla Braga, L. Studies on the competitive sorption of CO2 and CH4 on hard coal. Int. J. Greenh. Gas Con. 2019, 90, 102798. [Google Scholar] [CrossRef]
  16. Kudasik, M.; Skoczylas, N.; Pajdak, A. The repeatability of sorption processes occurring in the coal-methane system during multiple measurement series. Energies 2017, 10, 661. [Google Scholar] [CrossRef] [Green Version]
  17. Yao, Y.B.; Liu, J.; Liu, D.M.; Chen, J.Y.; Pan, Z.J. A new application of NMR in characterization of multiphase methane and adsorption capacity of shale. Int. J. Coal Geol. 2019, 201, 76–85. [Google Scholar] [CrossRef]
  18. Yao, Y.B.; Liu, D.M.; Che, Y.; Tang, D.Z.; Tang, S.H.; Huang, W.H. Petrophysical characterization of coals by low-field nuclear magnetic resonance (NMR). Fuel 2010, 89, 1371–1380. [Google Scholar] [CrossRef]
  19. Zheng, S.J.; Yao, Y.B.; Liu, D.M.; Cai, Y.D.; Liu, Y. Nuclear magnetic resonance surface relaxivity of coals. Int. J. Coal Geol. 2019, 205, 1–13. [Google Scholar] [CrossRef]
  20. Friesen, W.I.; Mikula, R.J. Mercury porosimetry of coals—Pore volume distribution and compressibility. Fuel. 1988, 67, 1516–1520. [Google Scholar] [CrossRef]
  21. Yao, Y.B.; Liu, D.M. Comparison of low-field NMR and mercury intrusion porosimetry in characterizing pore size distributions of coals. Fuel 2012, 95, 152–158. [Google Scholar] [CrossRef]
  22. Li, Y.; Lu, G.Q.; Rudolph, V. Compressibility and fractal dimension of fine coal particles in relation to pore structure characterisation using mercury porosimetry. Part. Part. Syst. Char. 1999, 16, 25–31. [Google Scholar] [CrossRef]
  23. Guo, X.Q.; Yao, Y.B.; Liu, D.M. Characteristics of coal matrix compressibility: An investigation by mercury intrusion porosimetry. Energy Fuels 2014, 28, 3673–3678. [Google Scholar] [CrossRef]
  24. Cai, Y.D.; Li, Q.; Liu, D.M.; Zhou, Y.F.; Lv, D. Insights into matrix compressibility of coals by mercury intrusion porosimetry and N2 adsorption. Int. J. Coal Geol. 2018, 200, 199–212. [Google Scholar] [CrossRef] [Green Version]
  25. Mandelbrot, B.B. The Fractal Geometry of Nature; W. H. Freeman and Co.: New York, NY, USA, 1983; p. 495. [Google Scholar]
  26. Pape, H.; Tillich, J.E.; Holz, M. Pore geometry of sandstone derived from pulsed field gradient NMR. J. Appl. Geophys. 2006, 58, 232–252. [Google Scholar] [CrossRef]
  27. Jin, Y.; Zhu, Y.B.; Li, X.; Zheng, J.L.; Dong, J.B. Scaling invariant effects on the permeability of fractal porous media. Transp. Porous Media 2015, 109, 433–453. [Google Scholar] [CrossRef]
  28. Chen, X.J.; Yao, G.Q.; Cai, J.C.; Huang, Y.T.; Yuan, X.Q. Fractal and multifractal analysis of different hydraulic flow units based on micro-CT images. J. Nat. Gas Sci. Eng. 2017, 48, 145–156. [Google Scholar] [CrossRef]
  29. Zhao, Y.X.; Zhu, G.P.; Dong, Y.H.; Danesh, N.N.; Chen, Z.W.; Zhang, T. Comparison of low-field NMR and microfocus X-ray computed tomography in fractal characterization of pores in artificial cores. Fuel 2017, 210, 217–226. [Google Scholar] [CrossRef]
  30. Krohn, C.E.; Thompson, A.H. Fractal sandstone pores: Automated measurements using scanning-electron-microscope images. Phys. Rev. B 1986, 33, 6366–6374. [Google Scholar] [CrossRef]
  31. Peng, R.D.; Yang, Y.C.; Ju, Y.; Mao, L.T.; Yang, Y.M. Computation of fractal dimension of rock pores based on gray CT images. Chin. Sci. Bull. 2011, 56, 3346–3357. [Google Scholar] [CrossRef] [Green Version]
  32. Gould, D.J.; Vadakkan, T.J.; Poché, R.A.; Dickinson, M.E. Multifractal and lacunarity analysis of microvascular morphology and remodeling. Microcirculation 2011, 18, 136–151. [Google Scholar] [CrossRef] [PubMed]
  33. Ge, X.M.; Fan, Y.R.; Zhu, X.J.; Chen, Y.G.; Li, R.Z. Determination of nuclear magnetic resonance T2 cutoff value based on multifractal theory-An application in sandstone with complex pore structure. Geophysics 2015, 80, 11–21. [Google Scholar] [CrossRef]
  34. Ge, X.M.; Fan, Y.R.; Li, J.T.; Zahid, M.A. Pore structure characterization and classification using multifractal theory-An application in Santanghu Basin of western China. J. Pet. Sci. Eng. 2015, 127, 297–304. [Google Scholar] [CrossRef]
  35. Bu, H.L.; Ju, Y.W.; Tang, J.Q.; Wang, G.C.; Li, X.S. Fractal characteristics of pores in non-marine shales from the Huainan coalfield, eastern China. J. Nat. Gas Sci. Eng. 2015, 24, 166–177. [Google Scholar] [CrossRef]
  36. Zhao, P.D.; Wang, X.X.; Cai, J.C.; Luo, M.; Zhang, J.; Liu, Y.M.; Rabiei, M.; Li, C.C. Multifractal analysis of pore structure of Middle Bakken formation using low temperature N2 adsorption and NMR measurements. J. Pet. Sci. Eng. 2019, 176, 312–320. [Google Scholar] [CrossRef]
  37. Zheng, S.J.; Yao, Y.B.; Liu, D.M.; Cai, Y.D.; Liu, Y.; Li, X.W. Nuclear magnetic resonance T2 cutoffs of coals: A novel method by multifractal analysis. Fuel 2019, 241, 715–724. [Google Scholar] [CrossRef]
  38. Li, W.; Liu, H.F.; Song, X.X. Multifractal analysis of Hg pore size distributions of tectonically deformed coals. Int. J. Coal Geol. 2015, 145, 138–152. [Google Scholar] [CrossRef]
  39. Halsey, T.C.; Hensen, M.H.; Kadanoff, L.P.; Procaccia, I.; Shraiman, B.I. Scaling structure of the surface layer of diffusion-limited aggregates. Phys. Rev. 1986, 33, 1141–1151. [Google Scholar] [CrossRef]
  40. Shao, P.; Wang, X.; Song, Y.; Li, Y. Study on the characteristics of matrix compressibility and its influence factors for different rank coals. J. Nat. Gas Sci. Eng. 2018, 56, 93–106. [Google Scholar] [CrossRef]
  41. Debelak, K.A.; Schrodt, J.T. Comparison of pore structure in Kentucky coals by mercury penetration and carbon dioxide adsorption. Fuel 1979, 58, 732–736. [Google Scholar] [CrossRef]
  42. Xu, L.; Liu, C.; Xian, X.; Zhang, D. Compressibility of coal matter and coal pore. Colloids Surf. A Physicochem. Eng. Aspect. 1999, 157, 219–222. [Google Scholar] [CrossRef]
  43. Zhang, B.; Liu, W.; Liu, X. Scale-dependent nature of the surface fractal dimension for bi- and multi-disperse porous solids by mercury porosimetry. Appl. Surf. Sci. 2006, 253, 1349–1355. [Google Scholar] [CrossRef]
  44. Yao, Y.B.; Liu, D.M.; Tang, D.Z.; Tang, S.H.; Huang, W.H.; Liu, Z.H.; Che, Y. Fractal characterization of seepage-pores of coals from China: An investigation on permeability of coals. Comput. Geosci. 2009, 35, 1159–1166. [Google Scholar] [CrossRef]
  45. Caniego, J.; Martin, M.A.; San, J.F. Singularity features of pore-size distribution: Singularity strength analysis and entropy spectrum. Fractals 2001, 9, 305–316. [Google Scholar] [CrossRef]
  46. Tarquis, A.; Giménez, D.; Saá, A.; Díaz, M.C.; Gascó, J.M. Scaling and multiscaling of soil pore systems determined by image analysis. In Scaling Methods in Soil Physics; Pachepsky, Y., Radcliffe, D.E., Magdi Selim, H., Eds.; CRC Press: Boca Raton, FL, USA, 2003; p. 434. [Google Scholar]
Figure 1. Mercury intrusion/extrusion curves of the represented coals. Reprint with permission [19]; 2019, Int. J. Coal Geol.
Energies 12 04743 g001
Figure 2. LTNA adsorption/desorption curves of the represented coals. Reprint with permission [19]; 2019, Int. J. Coal Geol.
Energies 12 04743 g002
Figure 3. Cross plots of cumulative mercury intrusion volume vs. pressure for (a) low-rank coals; (b) medium-rank coals; (c) high-rank coals.
Energies 12 04743 g003
Figure 4. Relationship between the Ro,m and coal matrix compressibility.
Energies 12 04743 g004
Figure 5. Comparisons between the uncorrected and corrected pore size distributions (PSDs) of the coals from MIP measurements. (a) sample L1; (b) sample L2; (c) sample L3; (d) sample L4; (e) sample L5; (f) sample M1; (g) sample M2; (h) sample M3; (i) sample M4; (j) sample M5; (k) sample H1; (m) sample H2; (n) sample H3; (o) sample H4; (p) sample H5.
Energies 12 04743 g005aEnergies 12 04743 g005b
Figure 6. Log plots of the partition function, X (q, ε), versus box size, ε, of the coal named L2.
Energies 12 04743 g006
Figure 7. Generalized dimension (Dq) versus variable q from q = −10 to q = 10.
Energies 12 04743 g007
Figure 8. The relationship between the f (α) and α (q), i.e., multifractal spectra of all coals.
Energies 12 04743 g008
Figure 9. The relationship between the τ (q) and q.
Energies 12 04743 g009
Figure 10. The cross plots of vitrinite and inertinite content versus multifractal parameter Dmin and Dmax. (a) vitrinite content versus Dmin; (b) vitrinite content versus Dmax; (c) inertinite content versus Dmin; (d) inertinite content versus Dmax.
Energies 12 04743 g010
Figure 11. The cross plots of moisture and ash content versus multifractal parameter Dmin and Dmax. (a) moisture content versus Dmin; (b) moisture content versus Dmax; (c) ash content versus Dmin; (d) ash content versus Dmax.
Energies 12 04743 g011
Figure 12. The cross plots of injection of mercury saturation and efficiency of mercury withdrawal versus multifractal parameter Dmin and Dmax. (a) injection of mercury saturation versus Dmin; (b) injection of mercury saturation versus Dmax; (c) efficiency of mercury withdrawal versus Dmin; (d) efficiency of mercury withdrawal versus Dmax.
Energies 12 04743 g012
Table 1. Mercury intrusion porosimetry (MIP) and low-temperature N2 adsorption (LTNA) results for the selected coals.
Sample No.MIP ResultsLTNA Results
True Density (g/cm3)IMS (%)EMW (%)Kc × 10−10 (m2/N)ε (×10−4)Type of CurveBJH Pore Volume (10−3 cm3/g)Pore Volume in 3–25 nm (10−3 cm3/g)Type of Curve
L11.4130.1084.952.471.00II7.271.41I
L21.2134.9223.492.232.00I16.112.09III
L31.3636.5373.112.170.80II9.100.68I
L41.2743.6771.561.832.00I1.251.01III
L51.4331.3977.911.160.90II8.313.42I
M11.3644.3582.160.890.70II1.520.77III
M21.4339.1766.951.250.60I1.080.16II
M31.709.7437.961.120.50III2.730.44III
M41.3738.6241.861.210.80I16.783.16I
M51.4333.2681.451.050.80II2.270.37III
H11.3237.0569.821.091.00II2.170.39I
H21.3837.7631.721.720.90I11.674.56I
H31.5428.3482.521.780.70III3.811.14III
H41.3632.3557.111.570.90I1.350.40I
H51.3839.2078.931.400.90II10.743.22II
Notes: IMS—injection of mercury saturation; EMW—efficiency of mercury withdrawal.
Table 2. Multifractal parameters by multifractal analysis of the selected coal samples.
Sample No.D−10D0D1D2D10Δα
L11.5481.0000.9240.8780.7621.002
L21.6281.0000.9050.8370.6851.169
L31.3791.0000.8790.8070.7000.866
L41.5711.0000.9180.8830.8180.952
L51.4571.0000.8280.7390.6261.032
M11.4231.0000.8520.7680.6610.941
M21.3581.0000.9190.8590.7330.816
M31.4211.0000.9430.9090.8000.825
M41.5371.0000.8920.8190.6861.068
M51.4141.0000.8580.7720.6450.971
H11.3621.0000.8880.8130.6930.858
H21.5651.0000.8130.7340.6341.127
H31.4681.0000.8270.7400.6401.020
H41.8251.0000.9300.8910.7901.279
H51.5471.0000.8670.7930.6881.067

