Powering a Sustainable and Circular Economy—An Engineering Approach to Estimating Renewable Energy Potentials within Earth System Boundaries


Abstract
1. Introduction
2. Method Development
2.1. Core Modeling Principles
2.1.1. Quantities and Units of Comparison
2.1.2. System Model
2.1.3. Precautionary Approach, Uncertainty, and Assumptions
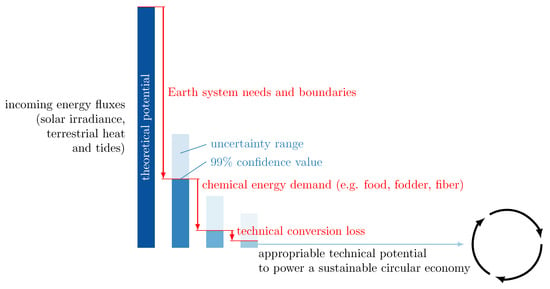
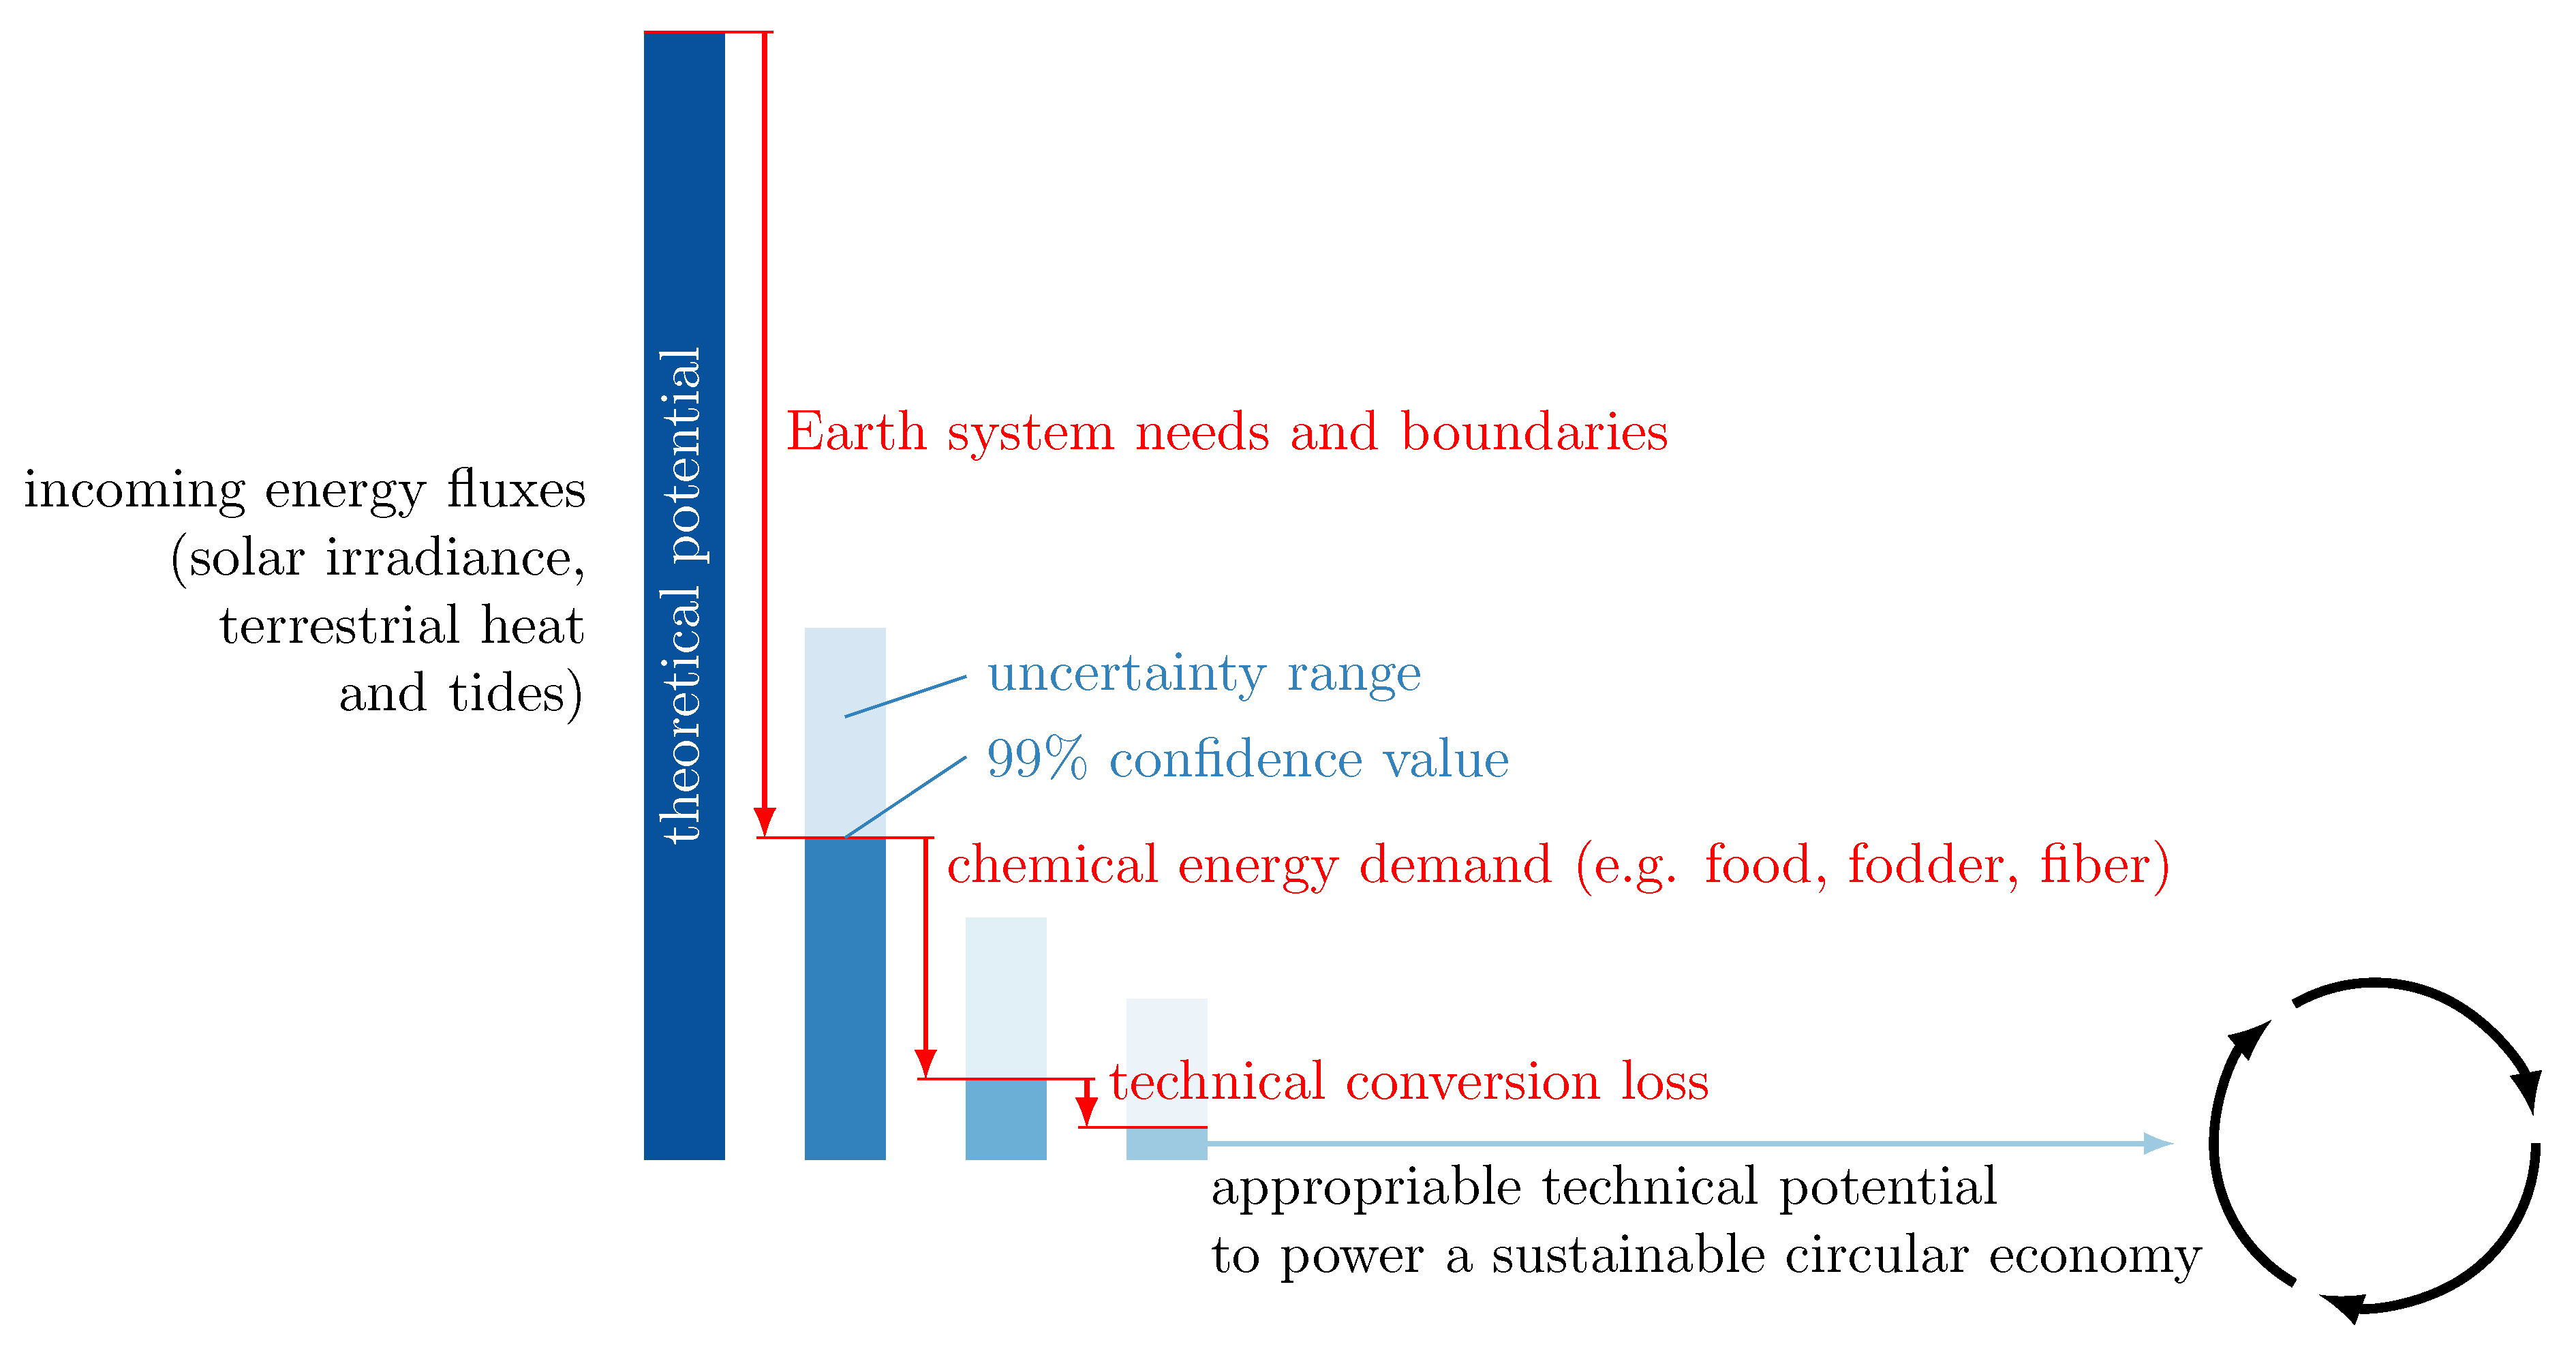
2.2. Limits to the Appropriation of RE
2.2.1. Human Need for Chemical Energy
2.2.2. Environmental Sustainability Criteria
2.2.2.1. Land System Change
2.2.2.2. Freshwater Withdrawal
2.3. Indicators to Evaluate a Given Energy Mix against ATP
3. Results
4. Discussion and Conclusion
4.1. Comparison to Current Energy Demand
- to supply the still growing population with adequate energy;
- to balance the unevenly distributed RE in space and time; and
- to enable the massive restoration and mitigation efforts required to unwind past environmental impacts (e.g., DAC).
4.2. Comparison with Other Studies
4.3. Limitations and Further Developments
4.4. Relevance to the Circular Economy
Supplementary Materials
Author Contributions
Funding
Conflicts of Interest
Abbreviations
| ATP | Appropriable technical potential |
| BECCS | Bioenergy carbon capture and storage |
| CCS | Carbon capture and storage |
| CE | Circular economy |
| CSP | Concentrated solar power |
| DAC | Direct air capture |
| EoL | End of life |
| FO | Forward osmosis |
| GIS | Geographical information system |
| HANPP | Human appropriation of net primary production |
| IEA | International Energy Agency |
| IPCC | Intergovernmental Panel on Climate Change |
| LCA | Life cycle assessment |
| NPP | Net primary production |
| PB | Planetary Boundaries |
| PV | Photovoltaic |
| RE | Renewable energy |
| RoL | Rest of land |
References
- Ellen MacArthur Foundation. Towards the Circular Economy; Report; Ellen MacArthur Foundation: Cowes, UK, 2013; Available online: https://www.ellenmacarthurfoundation.org/publications/towards-the-circular-economy-vol-1-an-economic-and-business-rationale-for-an-accelerated-transition (accessed on 9 December 2019).
- Desing, H.; Brunner, D.; Takacs, F.; Nahrath, S.; Frankenberger, K.; Hischier, R. A Circular Economy within the planetary boundaries: towards a resource-based, systemic approach. Resour. Conserv. Recycl. submitted.
- Ayres, R. The second law, the fourth law, recycling and limits to growth. Ecol. Econ. 1999, 29, 473–483. [Google Scholar] [CrossRef]
- Baum, H.G. Eco-efficiency–A measure to determine optimal recycling rates? In Science to Support Circular Economy; Fellner, J., Laner, D., Lederer, J., Eds.; Christian Doppler Laboratory “Anthropogenic Resources”; TU Wien Institute for Water Quality and Resource Management: Vienna 2018. Available online: https://iwr.tuwien.ac.at/circular-economy/home/ (accessed on 9 December 2019).
- Valero, A.; Valero, A.D. Thanatia—The Destiny of the Earth’s Mineral Resources; World Scientific: Singapore, 2015. [Google Scholar]
- International Energy Agency. Energy Balance for the World, 2015; International Energy Agency: Paris, France, 2018; Available online: https://www.iea.org/Sankey/#?c=World&s=Balance (accessed on 9 December 2019).
- Tukker, A.; Bulavskaya, T.; Giljum, S.; de Koning, A.; Lutter, S.; Simas, M.; Stadler, K.; Wood, R. The Global Resource Footprint of Nations. Carbon, water, land and materials embodied in trade and final consumption calculated with EXIOBASE 2.1. Report, Leiden/Delft/Vienna/Trondheim. 2014. Available online: https://www.researchgate.net/publication/264080789_The_Global_Resource_Footprint_of_Nations_Carbon_water_land_and_materials_embodied_in_trade_and_final_consumption_calculated_with_EXIOBASE_21 (accessed on 9 December 2019).
- Rockström, J.; Steffen, W.; Noone, K.; Persson, A.; Chapin, S.; Lambin, E.; Lenton, T.M.; Scheffer, M.; Folke, C.; Schnellhuber, H.; et al. Planetary Boundaries: Exploring the Safe Operating Space for Humanity. Ecol. Soc. 2009, 14, 1–33. [Google Scholar] [CrossRef]
- Steffen, W.; Richardson, K.; Rockstrom, J.; Cornell, S.E.; Fetzer, I.; Bennett, E.M.; Biggs, R.; Carpenter, S.R.; de Vries, W.; de Wit, C.A.; et al. Sustainability. Planetary boundaries: Guiding human development on a changing planet. Science 2015, 347, 1259855. [Google Scholar] [CrossRef]
- Intergovernmental Panel on Climate Change. Assessment Report 5: Climate Change 2013, the Physical Science Basis; Report; IPCC: Geneva, Switzerland, 2013. [Google Scholar]
- Intergovernmental Panel on Climate Change. Global Warming of 1.5 Degree C. An IPCC Special Report on the Impacts of Global Warming of 1.5 Degree C above Pre-industrial Levels and Related Global Greenhouse Gas Emission Pathways, in the Context of Strengthening the Global Response to the Threat of Climate Change, Sustainable Development, and Efforts to Eradicate Poverty; Report; IPCC: Geneva, Switzerland, 2018. [Google Scholar]
- Jacobson, M.Z.; Delucchi, M.A. Providing all global energy with wind, water, and solar power, Part I: Technologies, energy resources, quantities and areas of infrastructure, and materials. Energy Policy 2011, 39, 1154–1169. [Google Scholar] [CrossRef]
- Brundtland, G.H. Our Common Future: Report of the World Commission on Environment and Development; World Commission on Environment and Development, 1987; Available online: http://www.un-documents.net/wced-ocf.htm (accessed on 9 December 2019).
- Kleidon, A. Thermodynamik des Erdsystems–Was leistet die Erde? Physik unserer Zeit 2012, 3, 136–144. [Google Scholar] [CrossRef]
- Kleidon, A.; Miller, L.; Gans, F. Physical Limits of Solar Energy Conversion in the Earth System. In Solar Energy for Fuels; Tuysuz, H., Chan, C.K., Eds.; Topics in Current Chemistry-Series; Springer International Publishing Ag: Cham, Switzerland, 2016; Volume 371, pp. 1–22. [Google Scholar] [CrossRef]
- Szargut, J.T. Anthropogenic and natural exergy losses (exergy balance of the Earth’s surface and atmosphere). Energy 2003, 28, 1047–1054. [Google Scholar] [CrossRef]
- Chen, G.Q. Exergy consumption of the earth. Ecol. Model. 2005, 184, 363–380. [Google Scholar] [CrossRef]
- L’Ecuyer, T.; Beaudoing, H.K.; Rodell, M.; Olsen, W.; Lin, B.; Kato, S.; Clayson, C.; Wood, E.; Sheffield, J.; Adler, R.; et al. The Observed State of the Energy Budget in the Early Twenty-First Century. J. Clim. 2015, 28, 8319–8346. [Google Scholar] [CrossRef]
- Intergovernmental Panel on Climate Change. Renewable Energy Sources and Climate Change Mitigation; Report; Intergovernmental Panel on Climate Change: IPCC: Geneva, Switzerland, 2012. [Google Scholar]
- Krewitt, W.; Nienhaus, K.; Kleßmann, C.; Capone, C.; Stricker, E.; Graus, W.; Hoogwijk, M.; Supersberger, N.; von Winterfeld, U.; Samadi, S. Role and Potential of Renewable Energy and Energy Efficiency for Global Energy Supply; Report; German Federal Environmental Agency: Dessau-Rosslau, Germany, 2009; ISSN 1862-4359. [Google Scholar]
- Schilling, R. Vorlesungskript Wasser- und Windturbinen; Technical University Munich: Munich, Germany, 2011. [Google Scholar]
- Miller, L.M.; Gans, F.; Kleidon, A. Estimating maximum global land surface wind power extractability and associated climatic consequences. Earth Syst. Dyn. 2011, 2, 1–12. [Google Scholar] [CrossRef]
- Miller, L.M.; Brunsell, N.A.; Mechem, D.B.; Gans, F.; Monaghan, A.J.; Vautard, R.; Keith, D.W.; Kleidon, A. Two methods for estimating limits to large-scale wind power generation. Proc. Natl. Acad. Sci. USA 2015, 112, 11169–11174. [Google Scholar] [CrossRef]
- Gagnon, P.; Margolis, R.; Melius, J.; Phillips, C.; Elmore, R. Rooftop Solar Photovoltaic Technical Potential in the United States: A detailed Assessment; Report; National Renewable Energy Laboratory: Golden, CO, USA, 2016. [Google Scholar]
- Gagnon, P.; Margolis, R.; Melius, J.; Phillips, C.; Elmore, R. Estimating rooftop solar technical potential across the US using a combination of GIS-based methods, lidar data, and statistical modeling. Environ. Res. Lett. 2018, 13. [Google Scholar] [CrossRef]
- International Energy Agency. Technology Roadmap Wind Energy; Report; International Energy Agency: Paris, France, 2013; Available online: https://webstore.iea.org/technology-roadmap-wind-energy-2013 (accessed on 9 December 2019).
- International Energy Agency. Technology Roadmap Solar Photovoltaic; Report; International Energy Agency: Paris, France, 2014; Available online: https://webstore.iea.org/technology-roadmap-solar-photovoltaic-energy-2014 (accessed on 9 December 2019).
- International Energy Agency. Technology Roadmap Solar Thermal Electricity; Report; International Energy Agency: Paris, France, 2014; Available online: https://webstore.iea.org/technology-roadmap-solar-thermal-electricity-2014 (accessed on 9 December 2019).
- Klauser, D. Solarpotentialanalyse für Sonnendach.ch - Schlussbericht; Report; Bundesamt für Energie: Bern, Switzerland, 2016. [Google Scholar]
- Pelland, S.; Poissant, Y. An evaluation of the potential of building integrated photovoltaics in Canada. In Proceedings of the 31st Annual Conference of the Solar Energy Society of Canada, Montreal, QC, Canada, 20–24 August 2006. [Google Scholar]
- Steffen, W.; Rockstrom, J.; Richardson, K.; Lenton, T.M.; Folke, C.; Liverman, D.; Summerhayes, C.P.; Barnosky, A.D.; Cornell, S.E.; Crucifix, M.; et al. Trajectories of the Earth System in the Anthropocene. Proc. Natl. Acad. Sci. USA 2018, 115, 8252–8259. [Google Scholar] [CrossRef]
- van Vuuren, D.P.; Stehfest, E.; Gernaat, D.E.H.J.; van den Berg, M.; Bijl, D.L.; de Boer, H.S.; Daioglou, V.; Doelman, J.C.; Edelenbosch, O.Y.; Harmsen, M.; et al. Alternative pathways to the 1.5 degree celcius target reduce the need for negative emission technologies. Nat. Clim. Chang. 2018, 8, 391–397. [Google Scholar] [CrossRef]
- Zahoransky, R. Energietechnik, 4th ed.; Vieweg + Teubner: Wiesbaden, Germany, 2009. [Google Scholar]
- Popper, K.R. The Logic of Scientific Discovery, 5th ed.; Hutchinson and CO LTD: London, UK, 1968. [Google Scholar]
- Hupfer, A. Konstruktionsaspekte bei Flugantrieben; Report; Technical University Munich: Munich, Germany, 2011. [Google Scholar]
- Volkmer, M. Kernenergie Basiswissen; Report; Informationskreis KernEnergie: Berlin, Germany, 2007. [Google Scholar]
- Molland, A.F. The Maritime Engineering Reference Book; The Maritime Engineering Reference Book; Butterworth-Heinemann: Oxford, UK, 2008. [Google Scholar] [CrossRef]
- Sigloch, H. Strömungsmaschinen, 4th ed.; Carl Hanser: Munich, Germany, 2009. [Google Scholar]
- Woodward, F.I.; Sheehy, J.E. Principles and Measurements in Environmental Biology; London Boston Durban Singapore Sydney Toronto Wellington: Butterworths, Malaysia, 1983; Available online: http://search.ebscohost.com/login.aspx?direct=true&db=edsbvb&AN=EDSBVB.BV006024556&site=eds-live (accessed on 9 December 2019).
- Running, S.W. A measurable planetary boundary for the biosphere. Science 2012, 337, 1458–1459. [Google Scholar] [CrossRef]
- Haberl, H.; Erb, K.H.; Krausmann, F.; Gaube, V.; Bondeau, A.; Plutzar, C.; Gingrich, S.; Lucht, W.; Fischer-Kowalski, M. Quantifying and mapping the human appropriation of net primary production in earth’s terrestrial ecosystems. Proc. Natl. Acad. Sci. USA 2007, 104, 12942. [Google Scholar] [CrossRef]
- Bar-On, Y.M.; Phillips, R.; Milo, R. The biomass distribution on Earth. Proc. Natl. Acad. Sci. USA 2018, 115, 6506–6511. [Google Scholar] [CrossRef]
- Erb, K.H.; Fetzel, T.; Plutzar, C.; Kastner, T.; Lauk, C.; Mayer, A.; Niedertscheider, M.; Körner, C.; Haberl, H. Biomass turnover time in terrestrial ecosystems halved by land use. Nat. Geosci. 2016, 9, 674–678. [Google Scholar] [CrossRef]
- Foley, J.A.; Monfreda, C.; Ramankutty, N.; Zaks, D.P. Our share of the planetary pie. Proc. Natl. Acad. Sci. USA 2007, 104, 12585–12586. [Google Scholar] [CrossRef]
- Intergovernmental Science-Policy Platform on Biodiversity and Ecosystem Services (IPBES). Global Assessment Report on Biodiversity and Ecosystem Services of the Intergovernmental Science-Policy Platform on Biodiversity and Ecosystem Services; Report; IPBES: Bonn, Germany, 2019. [Google Scholar]
- Ramankutty, N. Farming the planet: 1. Geographic distribution of global agricultural lands in the year 2000. Glob. Biochem. Cycles 2008, 22, 1–19. [Google Scholar] [CrossRef]
- Pfister, S.; Bayer, P. Monthly water stress: Spatially and temporally explicit consumptive water footprint of global crop production. J. Clean. Prod. 2014, 73, 52–62. [Google Scholar] [CrossRef]
- Postel, S.; Daily, G.; Ehrlich, P. Human Appropriation of renewable fresh water. Science 1996, 271, 785–788. [Google Scholar] [CrossRef]
- Intergovernmental Panel on Climate Change. IPCC Special Report on Climate Change, Desertification, Land Degradation, Sustainable Land Management, Food Security, and Greenhouse gas fluxes in Terrestrial Ecosystems; Report; IPCC: Geneva, Switzerland, 2019. [Google Scholar]
- Intergovernmental Science-Policy Platform on Biodiversity and Ecosystem Services (IPBES). The IPBES Assessment Report on Land Degradation and Restoration; Report; Secretariat of the Intergovernmental Science-Policy Platform on Biodiversity and Ecosystem Services; IPBES: Bonn, Germany, 2018. [Google Scholar]
- Zhao, M.; Running, S.W. Drought induced reduction in global terrestrial NPP. Science 2010, 329, 940–943. [Google Scholar] [CrossRef] [PubMed]
- United Nations Department of Economic and Social Affairs. World Population Prospects 2019: Highlights; Report ST/ESA/SER:A/423; United Nations: New York, NY, USA, 2019; Available online: https://population.un.org/wpp/Publications/ (accessed on 9 December 2019).
- United Nations. Sustainable Development Goals. Dev. Coop. 2015, 42, 4. [Google Scholar]
- Willett, W.; Rockström, J.; Loken, B.; Springmann, M.; Lang, T.; Vermeulen, S.; Garnett, T.; Tilman, D.; DeClerck, F.; Wood, A.; et al. Food in the Anthropocene: The EAT–Lancet Commission on healthy diets from sustainable food systems. Lancet 2019, 393, 447–492. [Google Scholar] [CrossRef]
- Bringezu, S.; O’Brien, M.; Schütz, H. Beyond biofuels: Assessing global land use for domestic consumption of biomass A conceptual and empirical contribution to sustainable management of global resources. Land Use Policy 2012, 29, 224–232. [Google Scholar] [CrossRef]
- Chowdhury, R.B.; Moore, G.A.; Weatherley, A.J.; Arora, M. Key sustainability challenges for the global phosphorus resource, their implications for global food security, and options for mitigation. J. Clean. Prod. 2017, 140, 945–963. [Google Scholar] [CrossRef]
- Foley, J.A.; Ramankutty, N.; Brauman, K.A.; Cassidy, E.S.; Gerber, J.S.; Johnston, M.; Mueller, N.D.; O’Connell, C.; Ray, D.K.; West, P.C.; et al. Solutions for a cultivated planet. Nature 2011, 478, 337–342. [Google Scholar] [CrossRef]
- Tilman, D.; Clark, M. Global diets link environmental sustainability and human health. Nature 2014, 515, 518–522. [Google Scholar] [CrossRef]
- Eshel, G.; Shepon, A.; Makov, T.; Milo, R. Land, irrigation water, greenhouse gas, and reactive nitrogen burdens of meat, eggs, and dairy production in the United States. Proc. Natl. Acad. Sci. USA 2014, 111, 11996–12001. [Google Scholar] [CrossRef]
- Cassidy, E.S.; West, P.C.; Gerber, J.S.; Foley, J.A. Redefining agricultural yields: From tonnes to people nourished per hectare. Environ. Res. Lett. 2013, 8. [Google Scholar] [CrossRef]
- West, P.C.; Gerber, J.S.; Engstrom, P.M.; Mueller, N.D.; Brauman, K.A.; Kimberly, M.C.; Cassidy, E.S.; Johnstrom, M.; MacDonald, G.K.; Ray, D.K.; et al. Leverage points for improving food security and the environment. Science 2014, 345, 325–328. [Google Scholar] [CrossRef]
- Shepon, A.; Eshel, G.; Noor, E.; Milo, R. Energy and protein feed-to-food conversion efficiencies in the US and potential food security gains from dietary changes. Environ. Res. Lett. 2016, 11. [Google Scholar] [CrossRef]
- Shepon, A.; Eshel, G.; Noor, E.; Milo, R. The opportunity cost of animal based diets exceeds all food losses. Proc. Natl. Acad. Sci. USA 2018, 115, 3804–3809. [Google Scholar] [CrossRef]
- O’Brien, M. Timber Consumption and Sustainable Forest Use: Assessing the EU’s Current and Expected Consumption of Global Timber in Relation to the Global Capacity for Sustainable Supply; Kassel University Press: Kassel, Germany, 2015. [Google Scholar]
- Krausmann, F.; Erb, K.H.; Gingrich, S.; Haberl, H.; Bondeau, A.; Gaube, V.; Lauk, C.; Plutzar, C.; Searchinger, T.D. Global human appropriation of net primary production doubled in the 20th century. Proc. Natl. Acad. Sci. USA 2013, 110, 10324–10329. [Google Scholar] [CrossRef]
- Smith, W.K.; Zhao, M.; Running, S.W. Global Bioenergy Capacity as Constrained by Observed Biospheric Productivity Rates. BioScience 2012, 62, 911–922. [Google Scholar] [CrossRef]
- Daioglou, V.; Stehfest, E.; Wicke, B.; Faaij, A.; van Vuuren, D.P. Projections of the availability and cost of residues from agriculture and forestry. GCB Bioenergy 2016, 8, 456–470. [Google Scholar] [CrossRef]
- Sabag-Munoz, O.; Gladek, E. One Planet Approaches - Methodology Mapping and Pathways Forward; Report; WWF, Swiss Federal Office for the Environment, Metabolic: Amsterdam, The Netherlands, 2017. [Google Scholar]
- Ramankutty, N.; Foley, J.A. Estimating historical changes in global land cover: Croplands from 1700 to 1992. Glob. Biochem. Cycles 1999, 13, 997–1027. [Google Scholar] [CrossRef]
- Snyder, P.K.; Delire, C.; Foley, J.A. Evaluating the influence of different vegetation biomes on the global climate. Clim. Dyn. 2004, 23, 279–302. [Google Scholar] [CrossRef]
- Rodell, M.; Beaudoing, H.K.; L’Ecuyer, T.; Olsen, W.; Famiglietti, J.; Houser, P.; Adler, R.; Bosilovich, M.; Clayson, C.; Chambers, D.; et al. The Observed State of the Water Cycle in the Early Twenty-First Century. J. Clim. 2015, 28, 8289–8310. [Google Scholar] [CrossRef]
- Newbold, T.; Hudson, L.N.; Arnell, A.P.; Contu, S.; De Palma, A.; Ferrier, S.; Hill, S.L.L.; Hoskins, A.J.; Lysenko, I.; Phillips, H.R.P.; et al. Has land use pushed terrestrial biodiversity beyond the planetary boundary? A global assessment. Science 2016, 353, 288–291. [Google Scholar] [CrossRef] [PubMed]
- Newbold, T.; Hudson, L.N.; Hill, S.L.; Contu, S.; Lysenko, I.; Senior, R.A.; Borger, L.; Bennett, D.J.; Choimes, A.; Collen, B.; et al. Global effects of land use on local terrestrial biodiversity. Nature 2015, 520, 45–50. [Google Scholar] [CrossRef] [PubMed]
- Dinerstein, E.; Olson, D.; Joshi, A.; Vynne, C.; Burgess, N.D.; Wikramanayake, E.; Hahn, N.; Palminteri, S.; Hedao, P.; Noss, R.; et al. An Ecoregion-Based Approach to Protecting Half the Terrestrial Realm. Bioscience 2017, 67, 534–545. [Google Scholar] [CrossRef] [PubMed]
- Monfreda, C.; Ramankutty, N.; Foley, J.A. Farming the planet: 2. Geographic distribution of crop areas, yields, physiological types, and net primary production in the year 2000. Glob. Biochem. Cycles 2008, 22, 1–19. [Google Scholar] [CrossRef]
- Schneider, D. Quantitative Ecology; Academic Press: London, UK, 2009. [Google Scholar] [CrossRef]
- Center for International Earth Science Information Network, Ciesin Columbia University and International Food Policy Research Institute, Ifpri and The World, Bank and Centro Internacional de Agricultura Tropical, Ciat. Global Rural-Urban Mapping Project, Version 1 (GRUMPv1): Urban Extents Grid; NASA Socioeconomic Data and Applications Center (SEDAC): Palisades, NY, USA, 2011. [Google Scholar] [CrossRef]
- Erb, K.H.; Gaube, V.; Krausmann, F.; Plutzar, C.; Bondeau, A.; Haberl, H. A comprehensive global 5 min resolution land-use data set for the year 2000 consistent with national census data. J. Land Use Sci. 2007, 2, 191–224. [Google Scholar] [CrossRef]
- Joint Research Center. Atlas of the human planet 2016 - Mapping Human Presence on Earth with the Global Human Settlement Layer; Report; JRC: Brussels, Belgium, 2016. [Google Scholar] [CrossRef]
- Joint Research Center. Operating Procedure for the Production of the Global Human Settlement Layer from Landsat Data of the Epochs 1975, 1990, 2000, and 2014; Report; JRC: Brussels, Belgium, 2016. [Google Scholar] [CrossRef]
- World Bank. Land Conversion Data; World Bank: Washington, DC, USA, 2018; Available online: https://data.worldbank.org/indicator/AG.LND.TOTL.K2 (accessed on 9 December 2019).
- Pastor, A.V.; Ludwig, F.; Biemans, H.; Hoff, H.; Kabat, P. Accounting for environmental flow requirements in global water assessments. Hydrol. Earth Syst. Sci. 2014, 18, 5041–5059. [Google Scholar] [CrossRef]
- 2000 W Society. Worum geht es bei der 2000-Watt-Gesellschaft? 2019. Available online: https://www.local-energy.swiss/programme/2000-watt-gesellschaft#/ (accessed on 9 December 2019).
- Gunn, K.; Stock-Williams, C. Quantifying the global wave power resource. Renew. Energy 2012, 44, 296–304. [Google Scholar] [CrossRef]
- Yip, N.; Elimelech, M. Thermodynamic and Energy Efficiency Analysis of Power Generation from Natural Salinity Gradients by Pressure Retarded Osmosis. Environ. Sci. Technol. 2012, 46, 5230–5239. [Google Scholar] [CrossRef]
- Knutti, R.; Rogelj, J. The legacy of our CO2 emissions: A clash of scientific facts, politics and ethics. Clim. Chang. 2015, 133, 361–373. [Google Scholar] [CrossRef]
- Visser, N. Future Material Resource Demand under 2 Degree C Climate Policy. Master’s Thesis, Utrecht University, Utrecht, The Netherlands, 2019. [Google Scholar]
- Boubault, A.; Maïzi, N. Devising Mineral Resource Supply Pathways to a Low-Carbon Electricity Generation by 2100. Resources 2019, 8, 33. [Google Scholar] [CrossRef]


| Appropriable Share of Land Area Biome | Appropriable Land Area | |||
|---|---|---|---|---|
| Biome | According to [74] | According to [9] | Combined | / |
| tropical forest | ||||
| temporal forest | ||||
| boreal forest | ||||
| others (excl. polar and RoL) | ? | |||
| sum | ||||
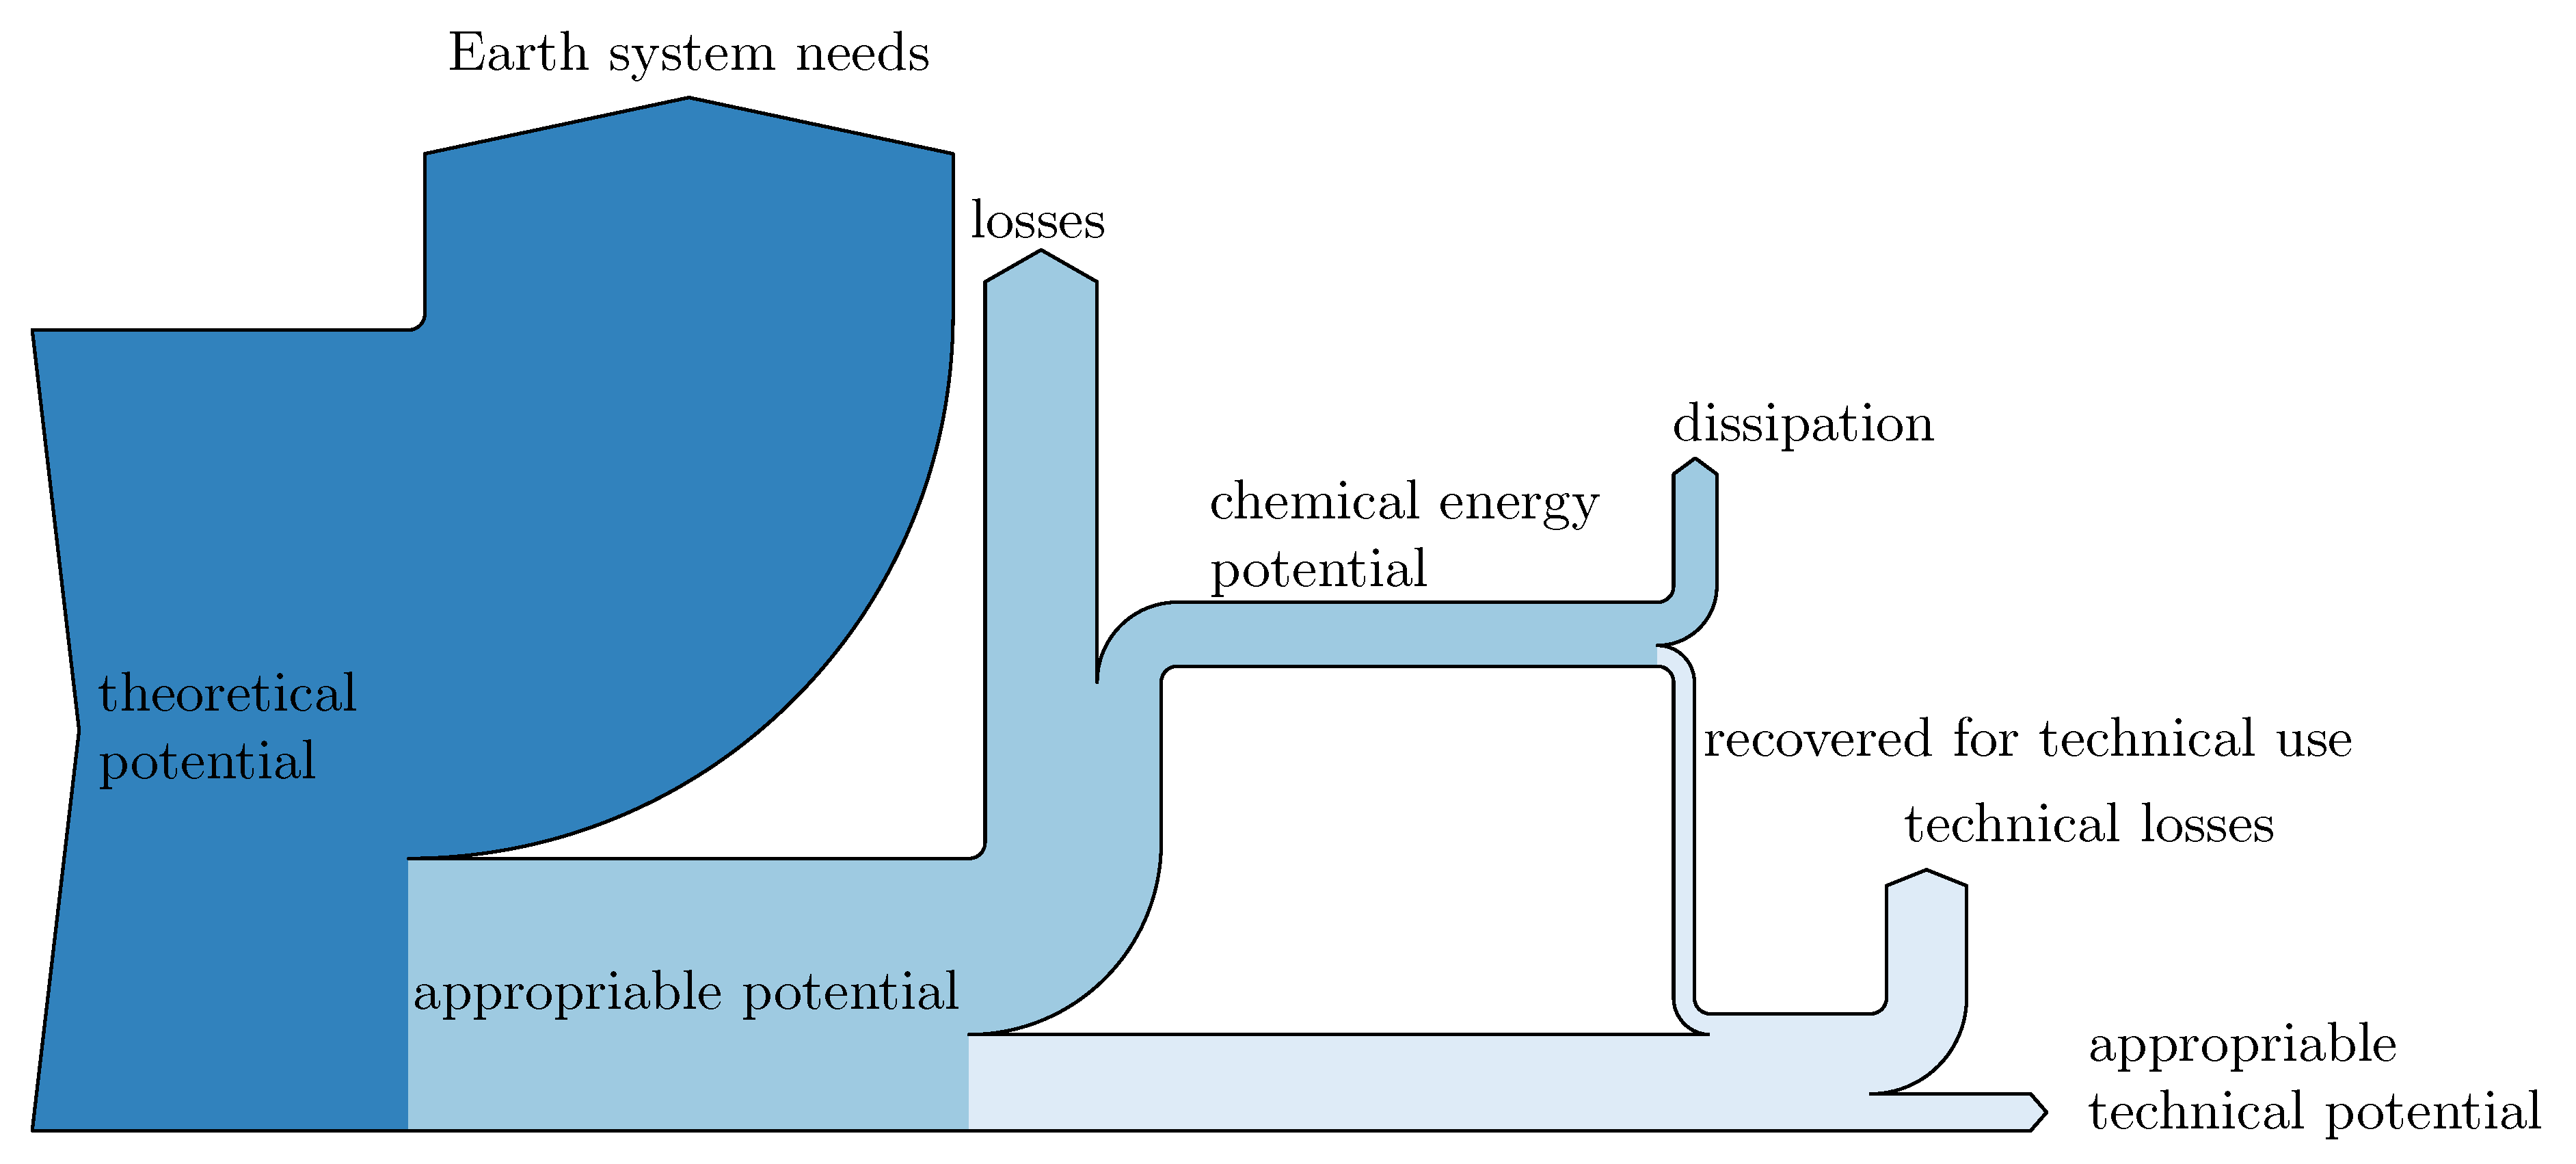
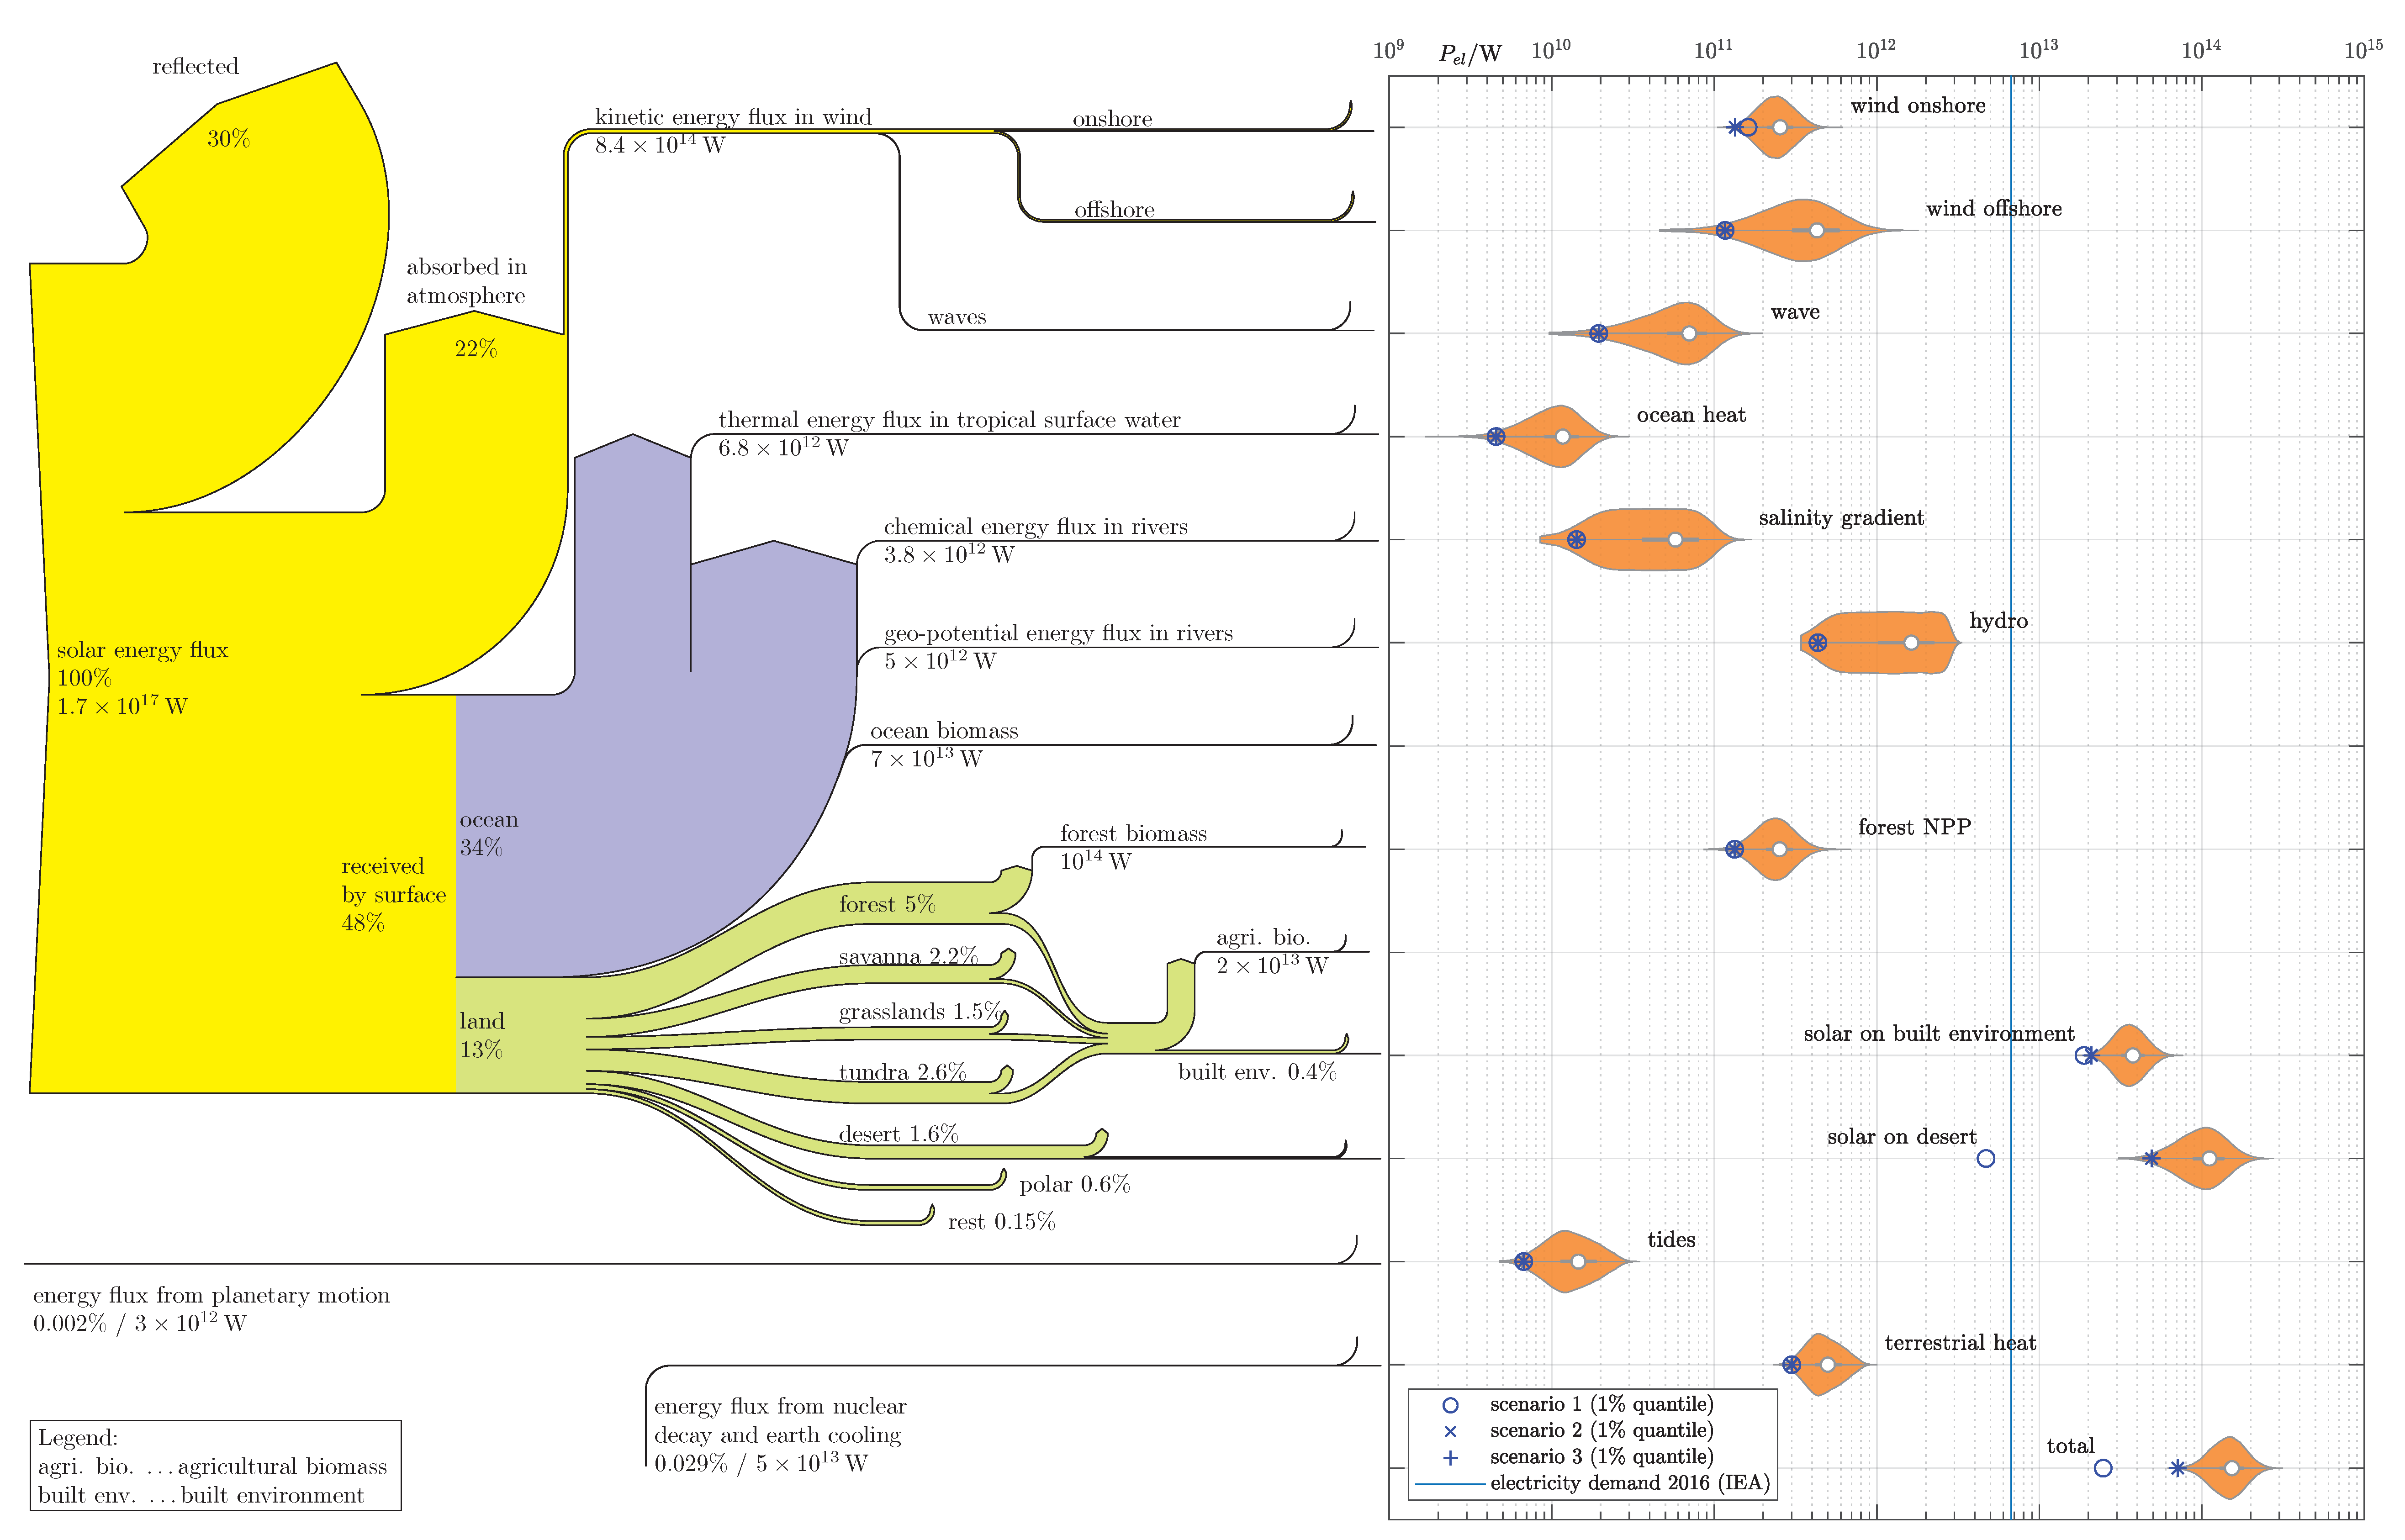
| RE Resource | Technology | Appropriable Technical Potential ATP/TW | Energy Mix |
|---|---|---|---|
| wind onshore | wind turbine | 0.13 | 0.19% |
| wind offshore | wind turbine | 0.12 | 0.16% |
| wave | WEC | 0.019 | 0.03% |
| ocean temperature gradient * | OTEC | 0.0045 | 0.01% |
| salinity gradient * | forward osmosis | 0.014 | 0.02% |
| freshwater runoff | hydro turbine | 0.43 | 0.61% |
| ocean NPP | combustion | 0 | 0% |
| forest NPP | combustion | 0.14 | 0.19% |
| agricultural NPP | combustion | 0 | 0.% |
| solar on built environment | PV | 21 | 29.43% |
| solar on desert | PV / CSP | 49 | 68.94% |
| tides | hydro turbine | 0.0067 | 0.01% |
| terrestrial heat | geothermal power | 0.30 | 0.42% |
| total | 71 | 100.% |
© 2019 by the authors. Licensee MDPI, Basel, Switzerland. This article is an open access article distributed under the terms and conditions of the Creative Commons Attribution (CC BY) license (http://creativecommons.org/licenses/by/4.0/).
Share and Cite
Desing, H.; Widmer, R.; Beloin-Saint-Pierre, D.; Hischier, R.; Wäger, P. Powering a Sustainable and Circular Economy—An Engineering Approach to Estimating Renewable Energy Potentials within Earth System Boundaries. Energies 2019, 12, 4723. https://doi.org/10.3390/en12244723
Desing H, Widmer R, Beloin-Saint-Pierre D, Hischier R, Wäger P. Powering a Sustainable and Circular Economy—An Engineering Approach to Estimating Renewable Energy Potentials within Earth System Boundaries. Energies. 2019; 12(24):4723. https://doi.org/10.3390/en12244723
Chicago/Turabian StyleDesing, Harald, Rolf Widmer, Didier Beloin-Saint-Pierre, Roland Hischier, and Patrick Wäger. 2019. "Powering a Sustainable and Circular Economy—An Engineering Approach to Estimating Renewable Energy Potentials within Earth System Boundaries" Energies 12, no. 24: 4723. https://doi.org/10.3390/en12244723
APA StyleDesing, H., Widmer, R., Beloin-Saint-Pierre, D., Hischier, R., & Wäger, P. (2019). Powering a Sustainable and Circular Economy—An Engineering Approach to Estimating Renewable Energy Potentials within Earth System Boundaries. Energies, 12(24), 4723. https://doi.org/10.3390/en12244723