Article

Research on Gas-Path Fault-Diagnosis Method of Marine Gas Turbine Based on Exergy Loss and Probabilistic Neural Network

College of Power and Energy Engineering, Harbin Engineering University, Harbin 150001, China
*
Author to whom correspondence should be addressed.
Energies 2019, 12(24), 4701; https://doi.org/10.3390/en12244701
Submission received: 31 October 2019 / Revised: 5 December 2019 / Accepted: 5 December 2019 / Published: 10 December 2019

Abstract

:
In order to improve the accuracy of gas-path fault detection and isolation for a marine three-shaft gas turbine, a gas-path fault diagnosis method based on exergy loss and a probabilistic neural network (PNN) is proposed. On the basis of the second law of thermodynamics, the exergy flow among the subsystems and the external environment is analyzed, and the exergy model of a marine gas turbine is established. The exergy loss of a marine gas turbine under the healthy condition and typical gas-path faulty condition is analyzed, and the relative change of exergy loss is used as the input of the PNN to detect the gas-path malfunction and locate the faulty component. The simulation case study was conducted based on a three-shaft marine gas turbine with typical gas-path faults. Several results show that the proposed diagnosis method can accurately detect the fault and locate the malfunction component.

1. Introduction

A marine gas turbine operates under hostile ocean environments. The air contains salt-ingested particles, which will have an impact on the gas-path components such as the compressor, combustion chamber, and turbine, and can lead to fouling, erosion, and corrosion [1,2]. These faults will change the structure of the components and cause performance degradation, reducing the safety and stability of the gas turbine [3,4,5]. The diagnosis of gas-path faults is becoming a major issue [6,7].
Physical failure can be reflected by changes in efficiency and flow of the components, and, in turn, causes changes in gas-path thermal parameters of a gas turbine, such as pressure, temperature, rotational speed, and fuel flow rate. Such relationships were described by Urban who proposes the linear gas-path analysis method [8]. In recent years, many gas-path fault diagnosis methods have been proposed to assess gas turbine health status, such as non-linear gas-path analysis [9,10,11], the rule-based fuzzy expert system [2,12,13], Bayesian hierarchical models [14,15], neural networks [16,17,18,19], the genetic algorithm [4,20,21], the multiple-model method [3,22] and exergy analysis [23]. Gas-path analysis is an inversely mathematical problem to obtain the deviation of component performance parameters over gas-path measured variables. Most case studies show that artificial intelligence methods, such as artificial neural networks, Bayesian hierarchical models, and fuzzy expert systems, may effectively isolate the faulty components but may not assess the severity of the fault easily [24].
The traditional gas-path analysis method is based on the first law of thermodynamics which may lead to the strong coupling effect when the number of components involved in fault diagnosis is large, and the malfunction may not be effectively identified [10]. Exergy analysis is a new branch of model-based diagnosis method. The fault diagnosis approach of energy system using the exergy analysis approach is summarized in [25,26,27]. At present, exergy analysis has been widely studied and applied in the field of thermal system fault diagnosis, because it can detect efficiency deviations, and identify the causes of performance degradation.
This paper proposes a fault-diagnosis method based on exergy loss and a probabilistic neural network for a three-shaft marine gas turbine. In this method, gas-path fault feature extraction is based on exergy loss which is from a comprehensive sight of the system to solve the parameter-coupling problem of traditional gas-path analysis method and to assess the severity of the fault, and a probabilistic neural network is applied to gas-path fault isolate to locate the malfunction component.
The remainder of this paper is organized as follows. In Section 2, through the analysis of the exergy flow of the gas turbine, the exergy loss model of the gas path of the marine gas turbine is established. In Section 3, the fault diagnosis method of the gas turbine based on exergy loss and a probabilistic neural network is studied. In Section 4, the fault simulation and the results and discussions of gas-path fault diagnosis are presented. The conclusions of this paper are shown in Section 5.

2. Exergy Model for Marine Gas Turbine

The current gas turbines fault-diagnosis method is generally based on the first law of thermodynamics, selecting parameters such as temperature, pressure, and rotating speed to diagnose gas-path faults [28], and mainly concerns the deviation of measured variables. In this section, an exergy model for the marine gas turbine was established to analyse the gas-path fault effect from a comprehensive sight of the system. Exergy is defined as the useful part of the energy which can perform work when the system is brought into equilibrium with the environment [29]. The irreversibility of the conversion process often occurs in the system, such as heat transfer with temperature difference, mechanical friction, chemical reaction and malfunction etc., which will cause the exergy loss. Exergy is not conserved, and its destruction provides an excellent indication of where and how losses occur. Exergy losses are stable between gas turbine systems and the external environment under healthy conditions. When a component performance of the gas turbine deteriorates, the exergy flow state of the system will change, and the exergy flow of other systems will also change at the same time. Therefore, based on the second law of thermodynamics, the parameter of exergy loss is introduced, in which only one parameter is used to characterize the change of component fault to solve the measured variables’ coupling problems.

2.1. Exergy Flow Analysis of Gas Turbine

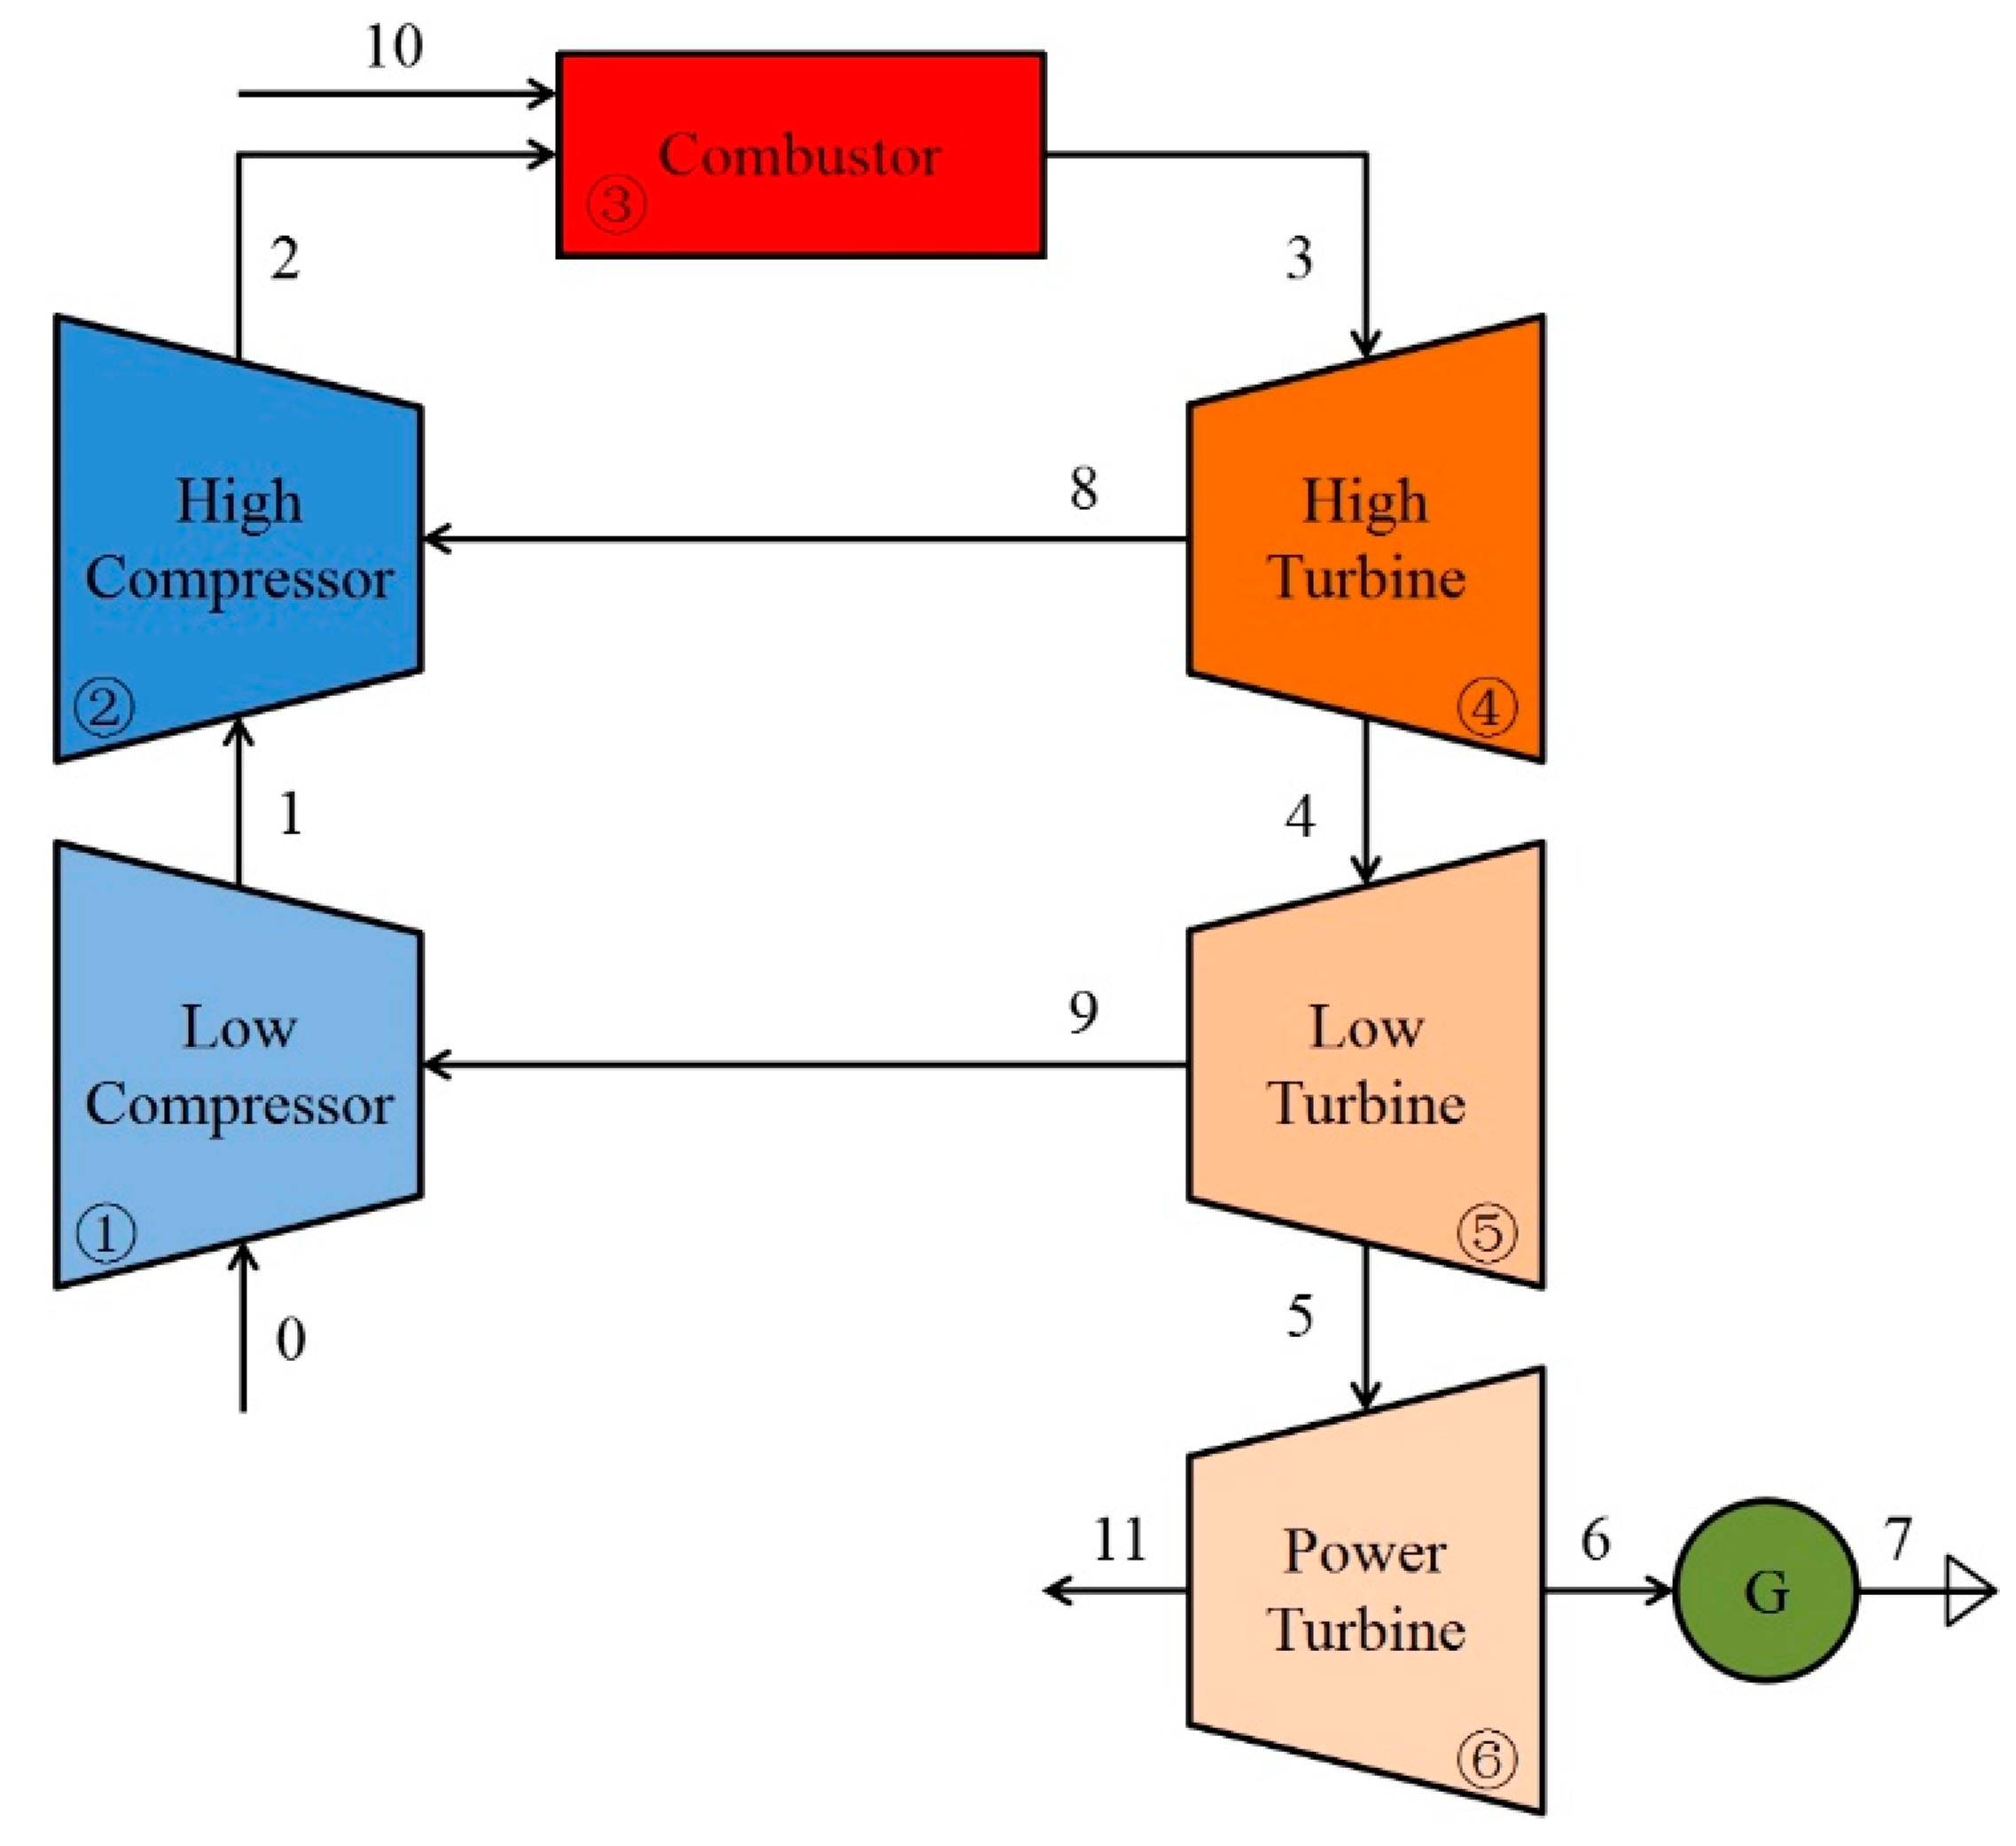
The general layout of the three-shaft marine gas turbine is shown in Figure 1, and gas-path components include a low-pressure compressor, a high-pressure compressor, a combustion chamber, a high-pressure turbine, a low-pressure turbine, and a power turbine. The marine gas turbine is driven by a low-pressure turbine, and compressed air is then further compressed by a high-pressure compressor. The compressed air enters the combustion chamber, expands, and burns with the fuel. The mixture then expands into the high- and low-pressure turbines, and finally enters the power turbine, where power and torque are output, and the exergy flow of the gas turbine is shown in Figure 2.
There are 11 exergy flows among the components and the external environment, regardless of the generator connected to the power turbine. Flow 0 (atmosphere) is compressed by the low-pressure compressor, generating flow 1 (compressed air). Flow 1 is compressed by a high-pressure compressor, generating flow 2 (compressed air). Flow 2 and flow 10 (fuel) are mixed and burned in the combustion chamber to form flow 3 (gas) and expand into a high-pressure turbine to do work. The energy flowing out of the high-pressure turbine subsystem is split into flow 8 and flow 4. Flow 8 drives the high-pressure compressor to rotate, and flow 4 enters the low-pressure turbine to continue to expand and do work. The energy outflow from the high-pressure turbine subsystem is divided into flow 9 and flow 5. Flow 9 drives the low-pressure compressor to rotate, and flow 5 expands into the power turbine to do work. Flow 6 enters the generator to generate energy flow 7 (electrical energy). Flow 11 is exhaust gas.
The operation of a gas turbine is accompanied by exergy flow among components and the environment, and the process of exergy flow will produce irreversible loss, which we call exergy loss. The exergy flow and exergy loss of each component are shown in Table 1.

2.2. Exergy Models for Gas Turbine

In order to derive the loss of gas turbine systems, it is necessary to establish exergy models of the high-pressure compressor, low-pressure compressor, combustion chamber, high-pressure turbine, low-pressure turbine, and power turbine.
Enthalpy and entropy are the key parameters for calculating exergy and are related to temperature. The enthalpy and entropy of air can be obtained from a table of thermodynamic properties of air. The specific enthalpy and entropy of air can be obtained by the air temperature. T0 is standard temperature, s0 is standard-specific entropy, and h0 is standard-specific enthalpy.
(1) Exergy model of the low-pressure compressor
The formula for calculating the specific exergy of energy flow at the outlet of the low-pressure compressor of a marine gas turbine BLCout is as follows:
B L C o u t = B 1 = h L C o u t h 0 T 0 ( s L C o u t s 0 )
where hLCout is the specific enthalpy of the outlet of the low-pressure compressor, kJ/kg; s L C o u t is the specific entropy of isentropic variation at the outlet of the low-pressure compressor, kJ/(kg·K); and B1 is the specific exergy of the energy of compressed air flowing out of the low-pressure compressor and entering the high-pressure compressor.
The formula for calculating the specific exergy of energy flow at the inlet of the low-pressure compressor of a marine gas turbine BLCin is as follows:
B L C in = B 0 + B 9
where B0 is the specific exergy of air flowing into the low-pressure compressor, B0 = 0; B9 is the specific exergy of energy flow (mechanical energy) flowing out of the low-pressure turbine subsystem and driving the rotation of the low-pressure compressor:
B 9 = 1 2 J L C L T ω 1 2
where JLCLT is the rotary inertia of the shaft connecting the low-pressure compressor and the low-pressure turbine; and ω1 is the rotation rate of the shaft connecting the low-pressure compressor and the low-pressure turbine.
The exergy loss of the low-pressure compressor ILC is expressed as Equation (4):
I L C = B 0 + B 9 B 1
(2) Exergy model of the high-pressure compressor
The specific exergy of energy flow at the outlet of the high-pressure compressor of a marine gas turbine BHCout is calculated by Equation (5):
B H C o u t = B 2 = h H C o u t h 0 T 0 ( s H C o u t s 0 )
where h H C o u t is the specific enthalpy of the outlet of the high-pressure compressor, kJ/kg; s H C o u t is the specific entropy of isentropic variation at the outlet of the high-pressure compressor, kJ/(kg·K); and B2 is the specific exergy of the energy of compressed air flowing out of the high-pressure compressor and entering the combustion chamber.
Equation (6) is used to calculate the specific exergy of energy flow at the inlet of the high-pressure compressor for marine gas turbine B H C i n :
B H C i n = B 1 + B 8
where B8 is the specific exergy of the energy flow (mechanical energy) flowing out of the high-pressure turbine subsystem and driving the high-pressure compressor to rotate:
B 8 = 1 2 J H C H T ω 2 2
where JHCHT is the rotary inertia of the shaft connecting the high-pressure compressor and the high-pressure turbine; and ω2 is the rotation rate of the shaft connecting the high-pressure compressor and the high-pressure turbine.
Exergy loss of the high-pressure compressor is expressed as Equation (8):
I H C = B 1 + B 8 B 2
(3) Exergy model of the combustion chamber
Equation (9) is used to calculate the specific exergy of energy flow at the outlet of the combustion chamber for a marine gas turbine BCCout:
B C C o u t = B 3 = h C C o u t h 0 T 0 ( s C C o u t s 0 )
where hCCout is the specific enthalpy at the outlet of the combustion chamber, kJ/kg; s C C o u t is the specific entropy at the outlet of the combustion chamber, kJ/(kg·K); and B3 is the specific exergy flow 9, as shown in Figure 2.
Equation (10) is used to calculate the specific exergy of energy flow at the inlet of the combustion chamber for a marine gas turbine BCCin:
B C C i n = B 2 + B 10
where B10 is the specific exergy of the energy of the fuel entering the combustion chamber:
B 10 = 0.975 Δ H f f
f = G f G B i n
where ΔHf is the specific enthalpy of fuel in the combustion chamber, kJ/kg; f is the fuel–air ratio; Gf is the fuel flow, and GBin is the air flow.
The exergy loss of the combustion chamber ICC is expressed as Equation (13):
I C C = B 2 + B 10 B 3
(4) Exergy model of the high-pressure turbine
Equation (14) is used to calculate the specific exergy of energy flow at the outlet of the high-pressure turbine for a marine gas turbine BHTout:
B H T o u t = B 4 + B 8
B 4 = h H T o u t h 0 T 0 ( s H T o u t s 0 )
where h H T o u t is the outlet specific enthalpy of the high-pressure turbine, kJ/kg; s H T o u t is the specific entropy of isentropic variation at the outlet of the high-pressure turbine, kJ/(kg·K); and B4 is the energy flowing out of the high-pressure turbine entering the low-pressure turbine.
Equation (16) is used to calculate the specific exergy of energy flow at the inlet of the high-pressure turbine for a marine gas turbine BHTin:
B H T i n = B 3
Exergy loss of high-pressure turbine IHT is expressed as Equation (17):
I H T = B 3 B 4 + B 8
(5) Exergy model of the low-pressure turbine
Equation (18) is used to calculate the specific exergy of energy flow at the outlet of the low-pressure turbine of a marine gas turbine BLTout:
B L T o u t = B 5 + B 9
B 5 = h L T o u t h 0 T 0 ( s L T o u t s 0 )
where h L T o u t is the outlet specific enthalpy of the low-pressure turbine, kJ/kg; s L T o u t is the specific entropy of isentropic variation at the outlet of the low-pressure turbine, and B5 is the specific exergy of the energy flowing out of the high-pressure turbine expanding into the power turbine to do work.
Equation (20) is used to calculate the specific exergy of energy flow at the inlet of the low-pressure turbine for marine gas turbine BLTin:
B L T i n = B 4
Exergy loss of the low-pressure turbine ILT is expressed as Equation (21):
I L T = B 4 B 5 + B 9
(6) Exergy model of the power turbine
A power turbine is a kind of impeller used to drive an external load (propeller, motor, etc.) and convert energy into mechanical work. The gas at the outlet of the low-pressure turbine expands for the last time in the power turbine, outputs external mechanical power, and emits exhaust gas. In this paper, no waste heat boiler is considered, and the exhaust gas is discharged to the atmosphere.
Equation (22) is used to calculate the specific exergy of the outlet energy of the power turbine:
B P T o u t = B 6 = W n e t
where B6 is the specific exergy of energy entering the generator; and Wnet is the work done by the power turbine.
Equation (23) is used to calculate the specific exergy of the inlet energy of the power turbine:
B P T i n = B 5
The exergy loss of the power turbine IPT is expressed as Equation (24):
I P T = B 5 B 6
The marine gas turbine exergy model can generate large amounts of fault simulation data, which will extract the exergy loss feature of the component under the healthy condition and typical faulty condition.

3. Gas-Path Fault-Diagnosis Approach Based on Exergy Loss and Probabilistic Neural Network (PNN)

When the gas turbine is in fault status, the exergy loss of each component will change, and its range of change can be used to assess the severity of the fault. However, the outlet temperature of the combustor does not install the temperature sensor for high temperature and costly, B3 (flow 3) can not be calculated. Therefore, the proposed exergy model in Section 2 can only get the exergy of the low-pressure compressor, the high-pressure compressor, the low-pressure turbine, and the power turbine by Equations (4), (8), (21) and (24), To detect and isolate the fault location accurately under different operating conditions, this paper introduces the probabilistic neural network (PNN) classifier in the traditional exergy analysis method.

3.1. Probabilistic Neural Network (PNN)

A PNN is a kind of neural network based on statistical principles, which is commonly employed to solve problems of pattern classification [30]. The PNN is an efficient and robust classifier, obtained when the Bayes strategy for decision making is combined with a non-parametric estimator for probability density functions [31]. Unlike a traditional multilayer feed-forward network, which requires a back-propagation algorithm for back-propagation computation, it is a fully forward computational process. It can be trained very easily and has high classification accuracy [12,32]. The fault diagnosis method based on PNN is a widely accepted decision method in probability statistics, which can be described as follows [33]: assuming there are two known fault modes θA, and θB, for the test sample X = [X1, X2, ..., Xs] to be judged, then:
  • If h A l A f A ( X ) > h B l B f B ( X ) , X θ A ;
  • If h A l A f A ( X ) < h B l B f B ( X ) , X θ B .
where hA, hB is the prior probability of the fault mode θA, θB, respectively (hA = NA/N, hB = NB/N); NA, NB is the number of training samples for fault mode θA, θB, respectively; and N is the total number of training samples; lA and lB are the loss functions associated respectively with the decision X θ B and X θ A ; fA(X) and fB(X) are respectively the probability density functions of the category A and B.
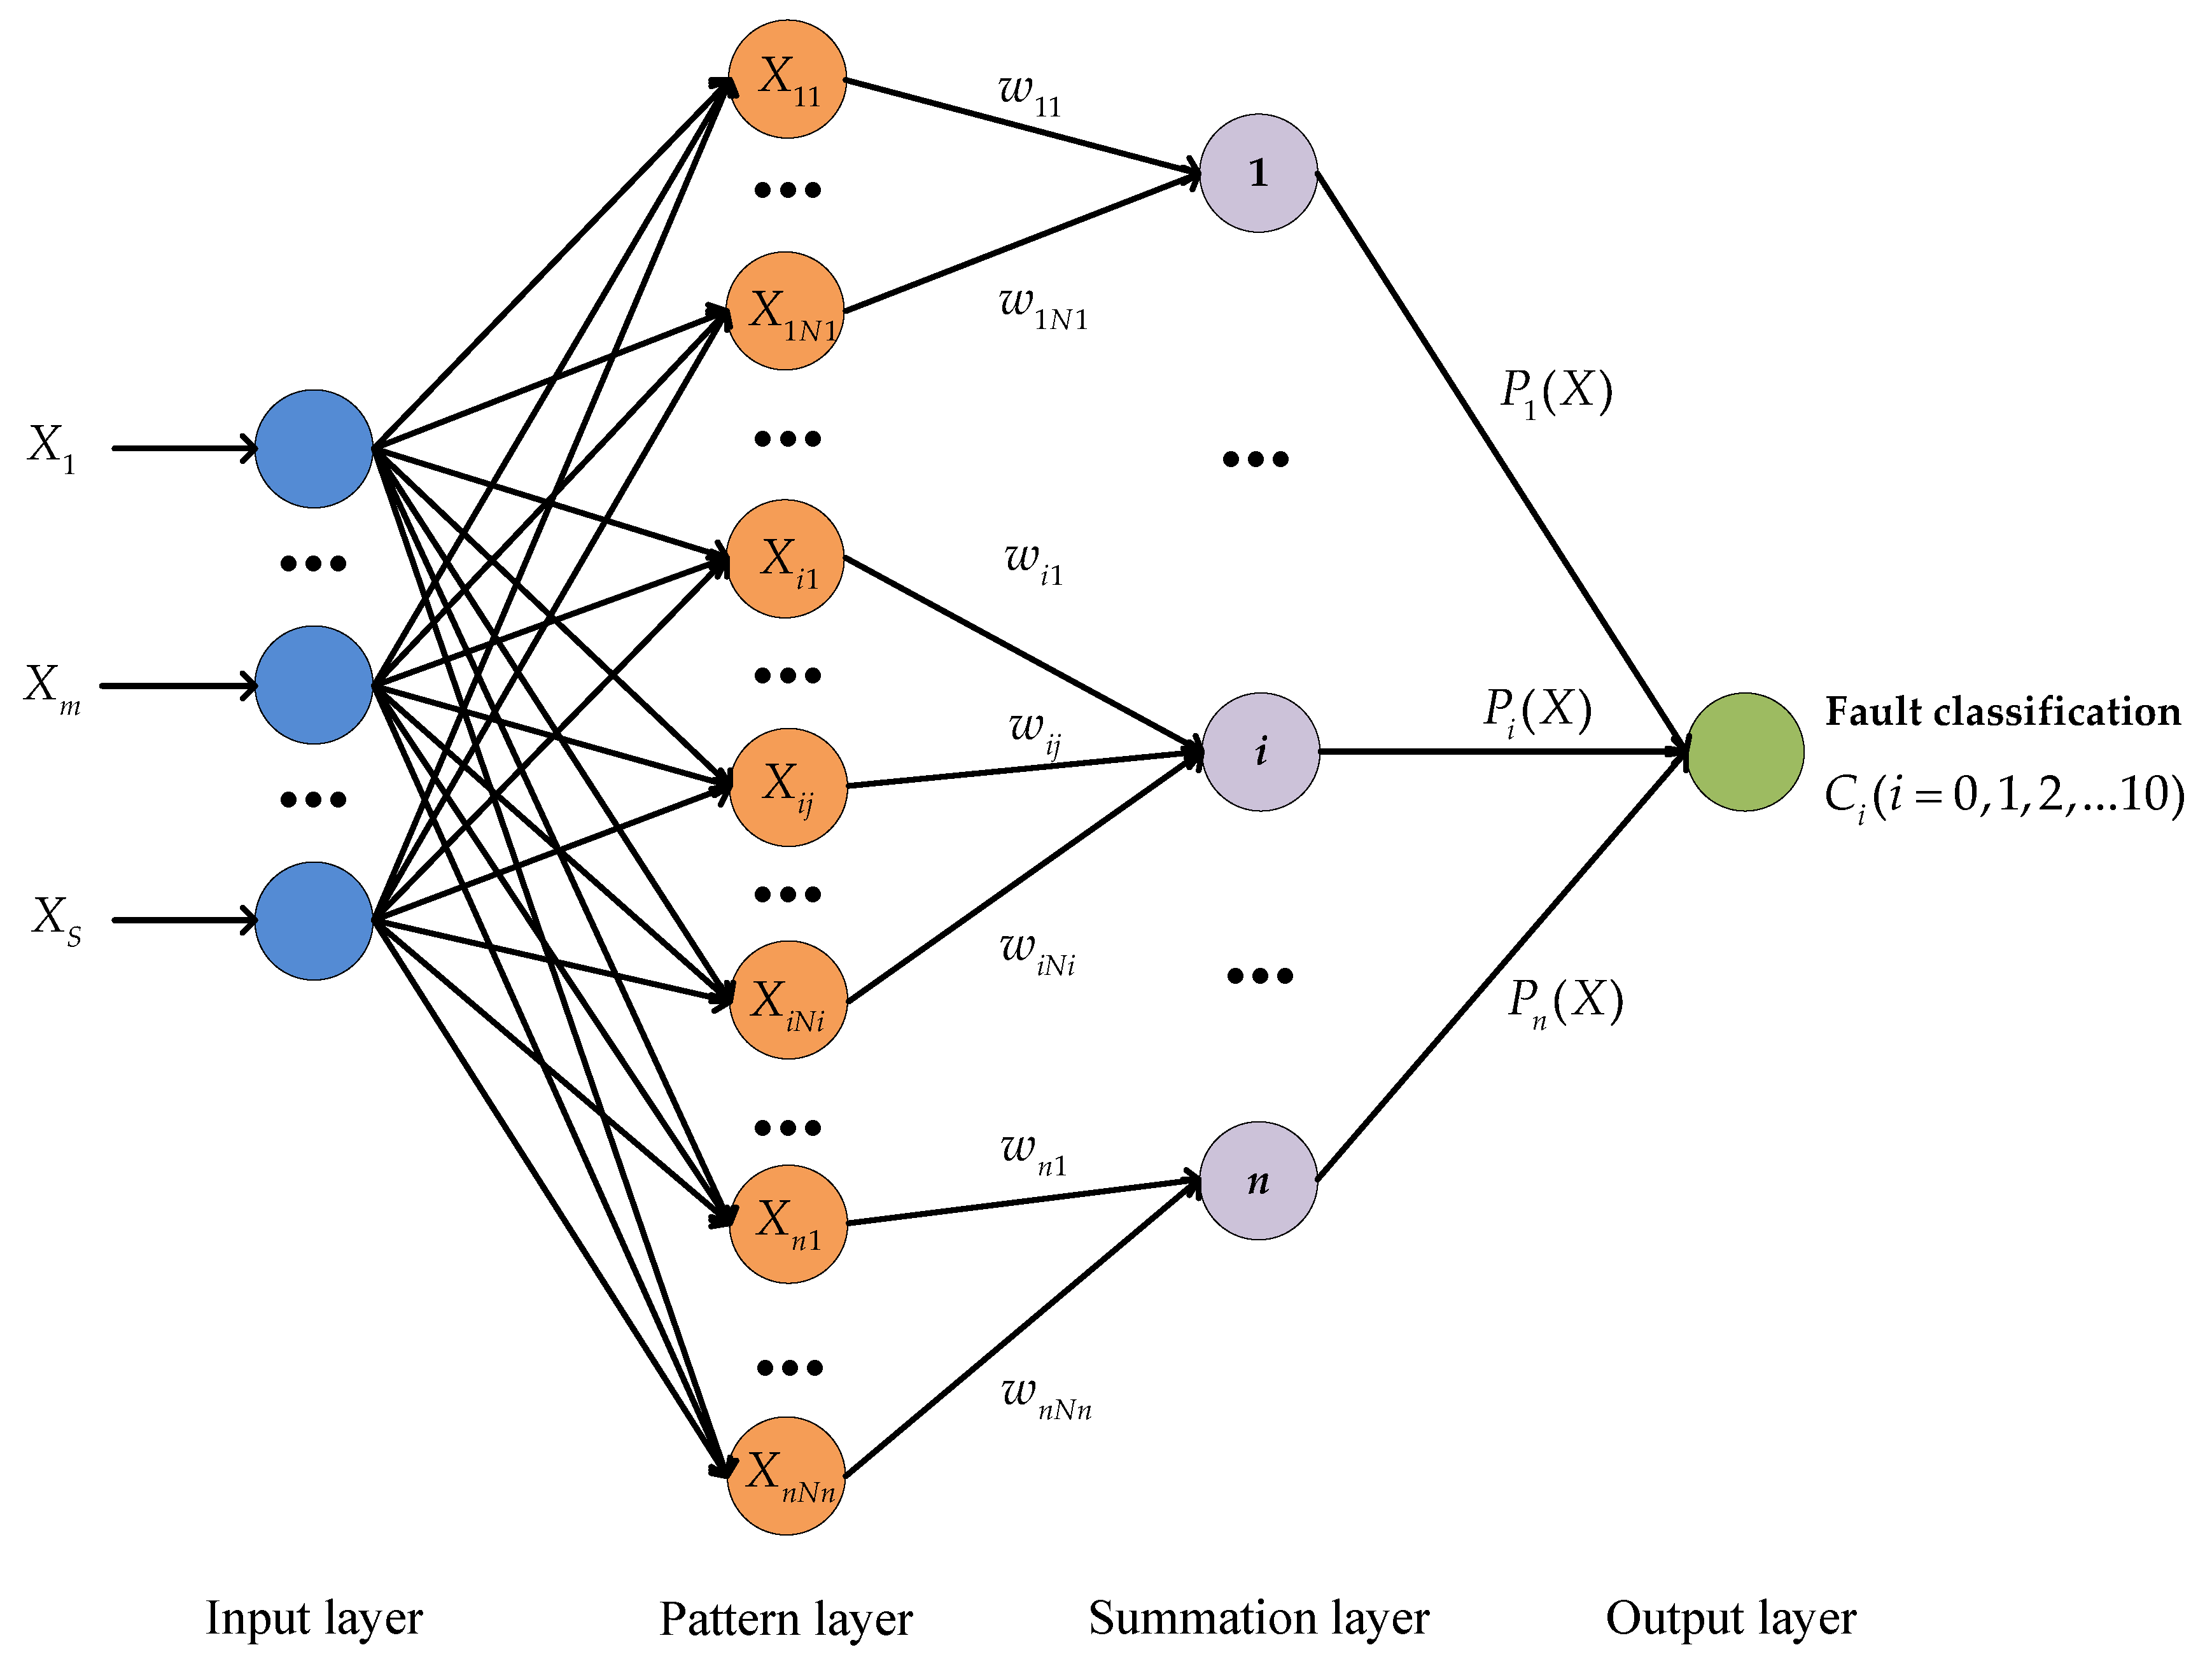
The PNN is composed of an input layer, a pattern layer, a summation layer, and an output layer, as shown in Figure 3 [34].
The input layer does not perform any computation and simply distributes the input to the neurons in the pattern layer. The number of neurons is equal to the dimension of the sample vector.
The task of the pattern layer is to calculate the pattern, matching the relationship between the testing samples and the training samples, and to centralize the categories with high similarity. The number of neurons in the pattern layer is equal to the sum of the number of trained samples in all categories, and the neuron Xij computes the pattern layer output as follows [30]:
Q i j ( X ) = 1 σ s × ( 2 π ) s 2 exp ( ( X X i j ) ( X X i j ) T 2 σ 2 )
where X = [X1, X2, ..., XS] is the test sample with s dimension; s is the dimension of the input vector X; Xij is the jth training sample of the ith class; and σ = [0, 1] is a smoothing factor.
The summation layer adds the cumulative probability of the class to obtain the estimated density function of the fault patterm. Each summation node receives the outputs from pattern nodes associated with a given class [35]:
P i ( X ) = ( j = 1 N i w j Q i j ( X ) ) + w 0
where Ni is the number of samples in the ith class (i = 1, 2, ..., n); n is the number of classes; weights wi = (wi0, wi1, ..., wiNi) are created during the training process; and P i ( X ) ( 1 , 1 ) .
The output layer receives all kinds of density functions. The class of an unknown pattern X is obtained in the output layer using Equation (27):
C l a s s ( X ) = arg   max ( P i ( X ) )
The output value of the category with the largest function value is 1, and the output value of the remaining categories is 0.

3.2. Fault Diagnosis Process

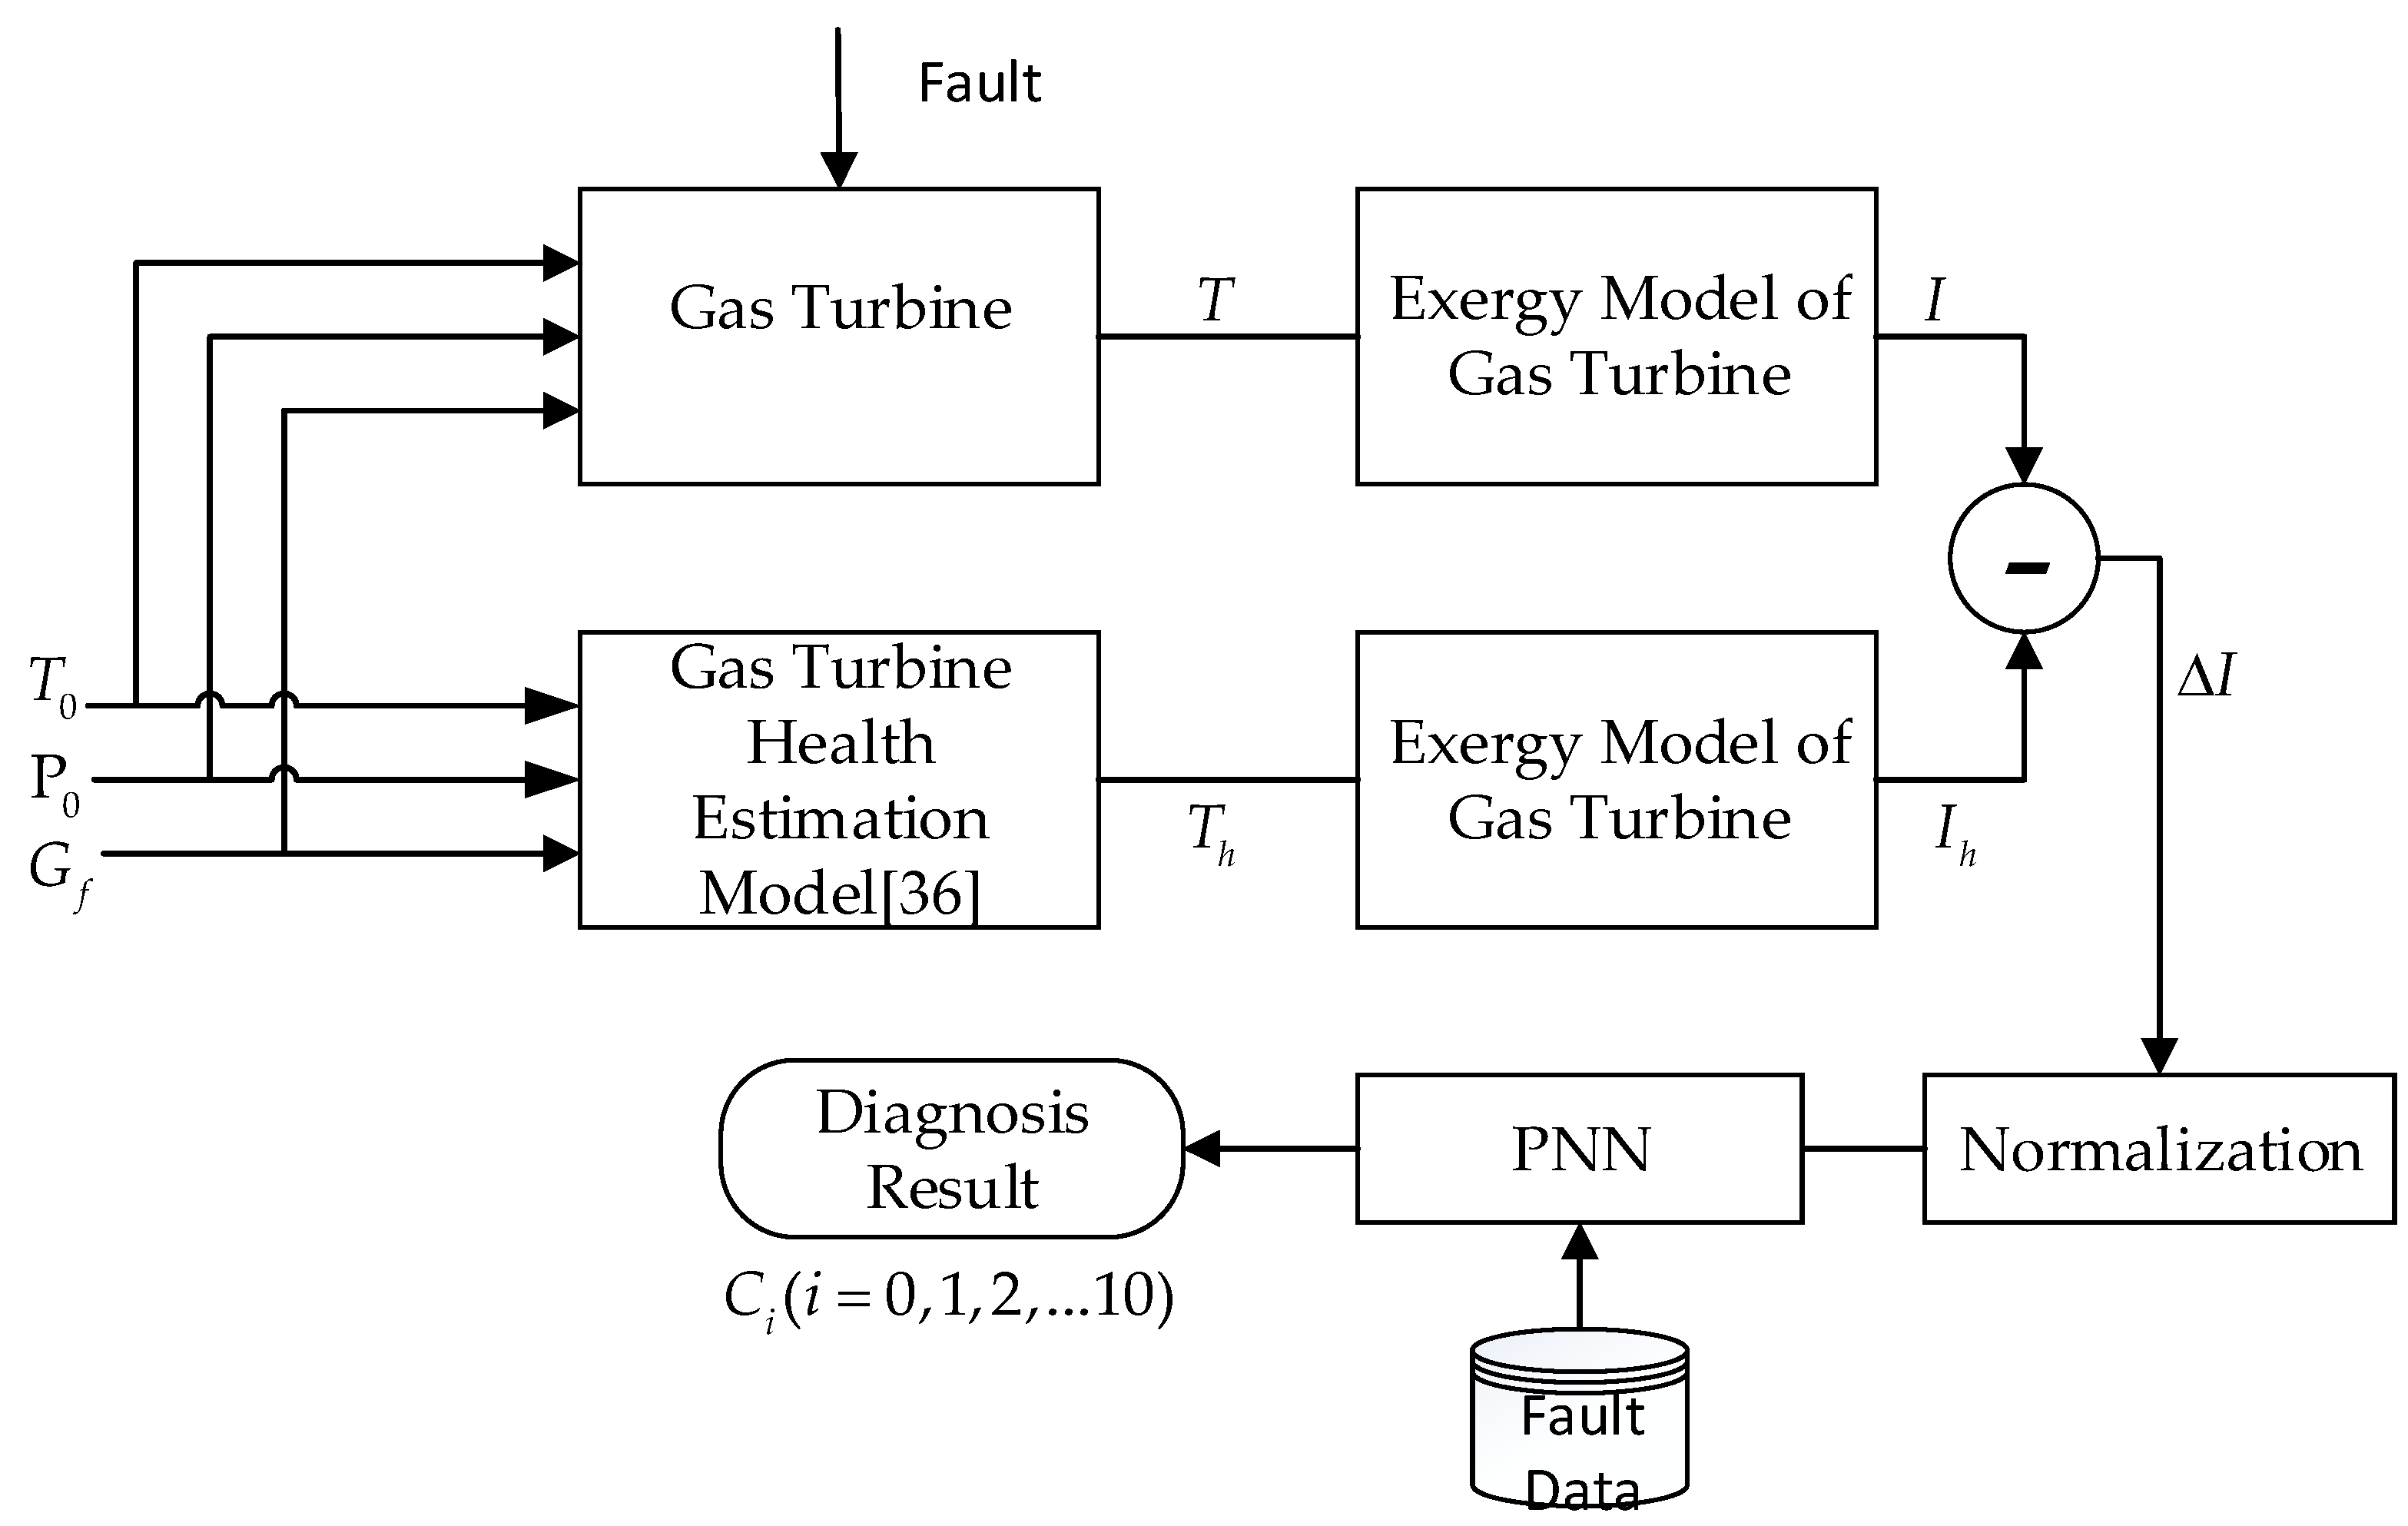
The fault-diagnosis process is shown in Figure 4.
Step 1: Data acquisition
The measured variables that acquire from the gas turbine monitoring and control system include the outlet temperatures of four components, boundary condition (T0, P0), and fule flow wf. The outlet temperatures of the four components make up the set T = {T1, T2, T3, T4}. T1 is the outlet temperature of the low-pressure compressor, T2 is the outlet temperature of the high-pressure compressor, T3 is the outlet temperature of the high-pressure turbine, and T4 is the outlet temperature of the low-pressure turbine.
Step 2: Parameter estimation under the healthy condition
Parameters estimation under healthy condition is on the healthy condition estimation model of a gas turbine that is established by back-propagation neural networks [36]. For the gas turbine health estimation model, the inputs are the environment parameters (T0, P0) and fuel flow control variable wf, and the outputs are temperature set Th on the healthy condition.
Step 3: Exergy-loss calculation
T and Th are input into the exergy model, respectively. The output of the exergy model is the exergy loss of gas turbine I = {I1, I2, ..., Is}, and exergy loss of its healthy condition estimation model I h = { I h 1 , I h 2 , , I h s } .
Step 4: Data normalization
To eliminate the magnitude differences among different input parameters, the relative change of exergy loss ΔI = IIh = {ΔI1, ΔI2, ..., ΔIs} are normalized to a s-dimensional vector X = [X1, X2, ..., Xs].
The data of one component of the gas turbine in the training samples are gathered together to form a one-dimensional array ΔIm (m = 1, 2, ..., s), where s is the number of components. The maximum ΔImmax and minimum ΔImmin of the array ΔIm are selected, and normalization of the one-dimensional array is carried out according to Equation (28):
X m = Δ I m Δ I m min Δ I m max Δ I m min
Step 5: Fault detection and isolation
The input X of the PNN that has been trained by the training samples which select from the fault database, and the fault mode Ci (i = 0, 1, 2, ..., n) will be output from the output layer of the PNN. Finally, the fault diagnosis results are obtained by consulting the fault discrimination matrix which is established for fault detection and isolation and can be expressed as Equation (29):
{C0; C1; C2; ...; Cn} = E(n+1)×(n+1)
where Ci (i = 0, 1, 2, ..., n) is one kind of fault pattern; and n is the total number of fault patterns, which is equal to the dimension of the fault discrimination matrix. E(n+1)×(n+1) is an n + 1 dimensional identity matrix.

4. Example Verification

4.1. Simulation and Result Analysis of Exergy Loss of Typical Gas-Path Faults

In this paper, it is considered that the faulty condition of a gas path will affect some characteristics of components, such as compressor fouling, erosion, turbine wear, and damage, and the main performance parameters are its efficiency and flow rate. This section conducts fault implantation studies for a marine gas turbine low-pressure compressor, high-pressure compressor, high-pressure turbine, low-pressure turbine, and power turbine [21].
To simulate the gas-path fault of the marine gas turbine with different severity, the severity of the fault is reflected in the decrease of the efficiency and flow of each component, as shown in Table 2.
In this paper, the exergy loss of the main components of the marine gas turbine is simulated, the performance parameter decline factor is determined, and the variation of exergy loss of each component with the severity of the fault is studied.
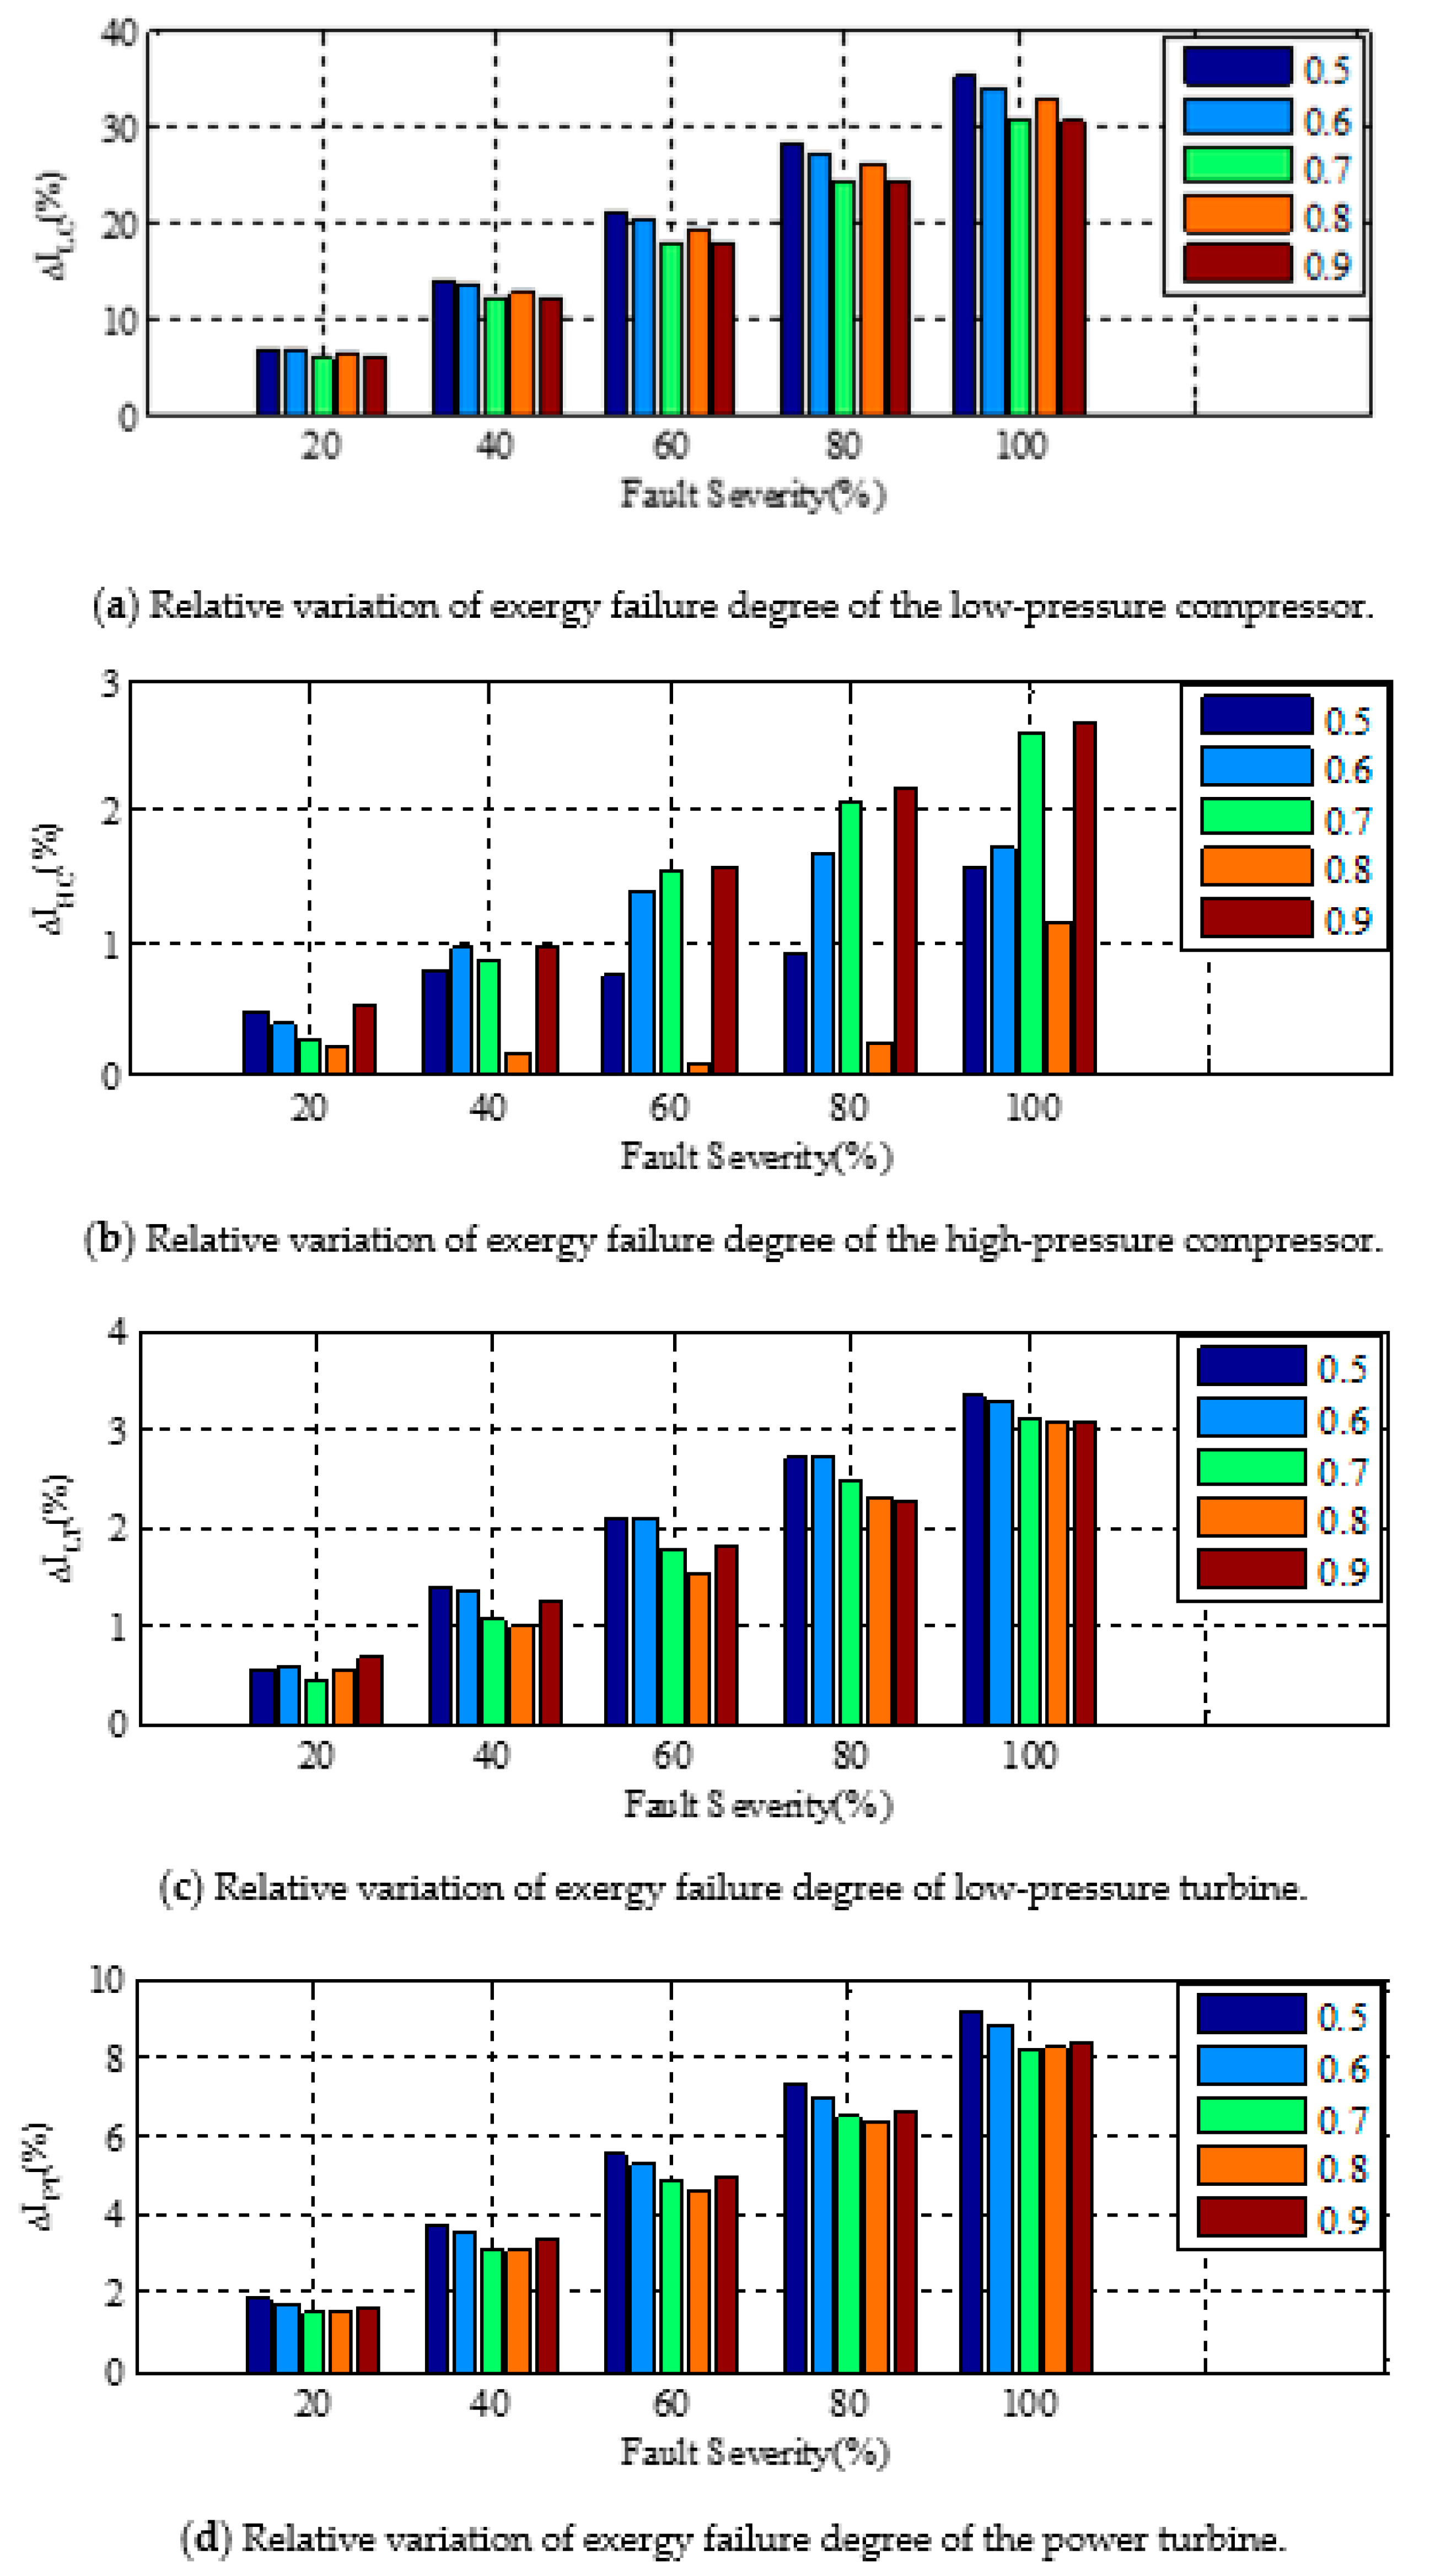
The efficiency and flow rate are implanted in the simulation model with severity from 20% to 100% (efficiency and flow rate reduce by 1–5%), respectively. The relative changes of the exergy loss of the main components under the condition of 0.5 to 0.9 are obtained. Taking the efficiency decline fault of the low-pressure compressor as an example, the exergy loss of each component of the marine gas turbine is analyzed.
The relative variation of exergy loss of marine gas turbine components with the severity of low-pressure compressor efficiency fault is shown in Figure 5a–d.
As can be seen from Figure 5, as the efficiency of the low-pressure compressor is reduced, the relative exergy changes of each component of the marine gas turbine are increased. The relative change in the exergy loss of the low-pressure compressor is the highest in comparison with other components, which can indicate that the low-pressure compressor is the source of failure. It is found that the exergy loss of the component increases with the severity of the gas-path fault, and the change of the exergy loss of the component is clear when the efficiency fault occurs.
In addition, as can be seen from Figure 5a, when the low-pressure compressor malfunctions, the change degree of exergy loss is much greater than that of efficiency. Therefore, exergy loss is more sensitive to fault diagnosis compared with efficiency.

4.2. Analysis of PNN Fault Diagnosis Based on Exergy Loss

4.2.1. Fault-Detection Index

We select the error rate and the missing rate as the evaluation performance indexes of fault diagnosis. A reliable fault diagnosis system should minimize the error rate and the missing rate. If the total number of test event is T, then the missing rate is defined as the proportion of missed events in the specified events. Equation (30) is used to calculate the missing rate Mr.
M r = M L × 100 %
where M is the number of missed events for detecting a specific fault; and L is the number of specific fault events.
The error rate is defined as the proportion of misreported events. Equation (31) is used to calculate the error rate Fr.
F r = F T L × 100 %
where F is the number of misreported events for detecting a specific fault.

4.2.2. Example of Marine Gas Turbine Fault Diagnosis under Certain Operating Conditions

According to the established exergy model of the marine gas turbine, the simulation models of health conditions and faulty conditions was established in MATLAB/SIMULINK, and the simulation time set to 500 s, time step set to 0.2 s. Therefore, the total number of test event T is 2500.
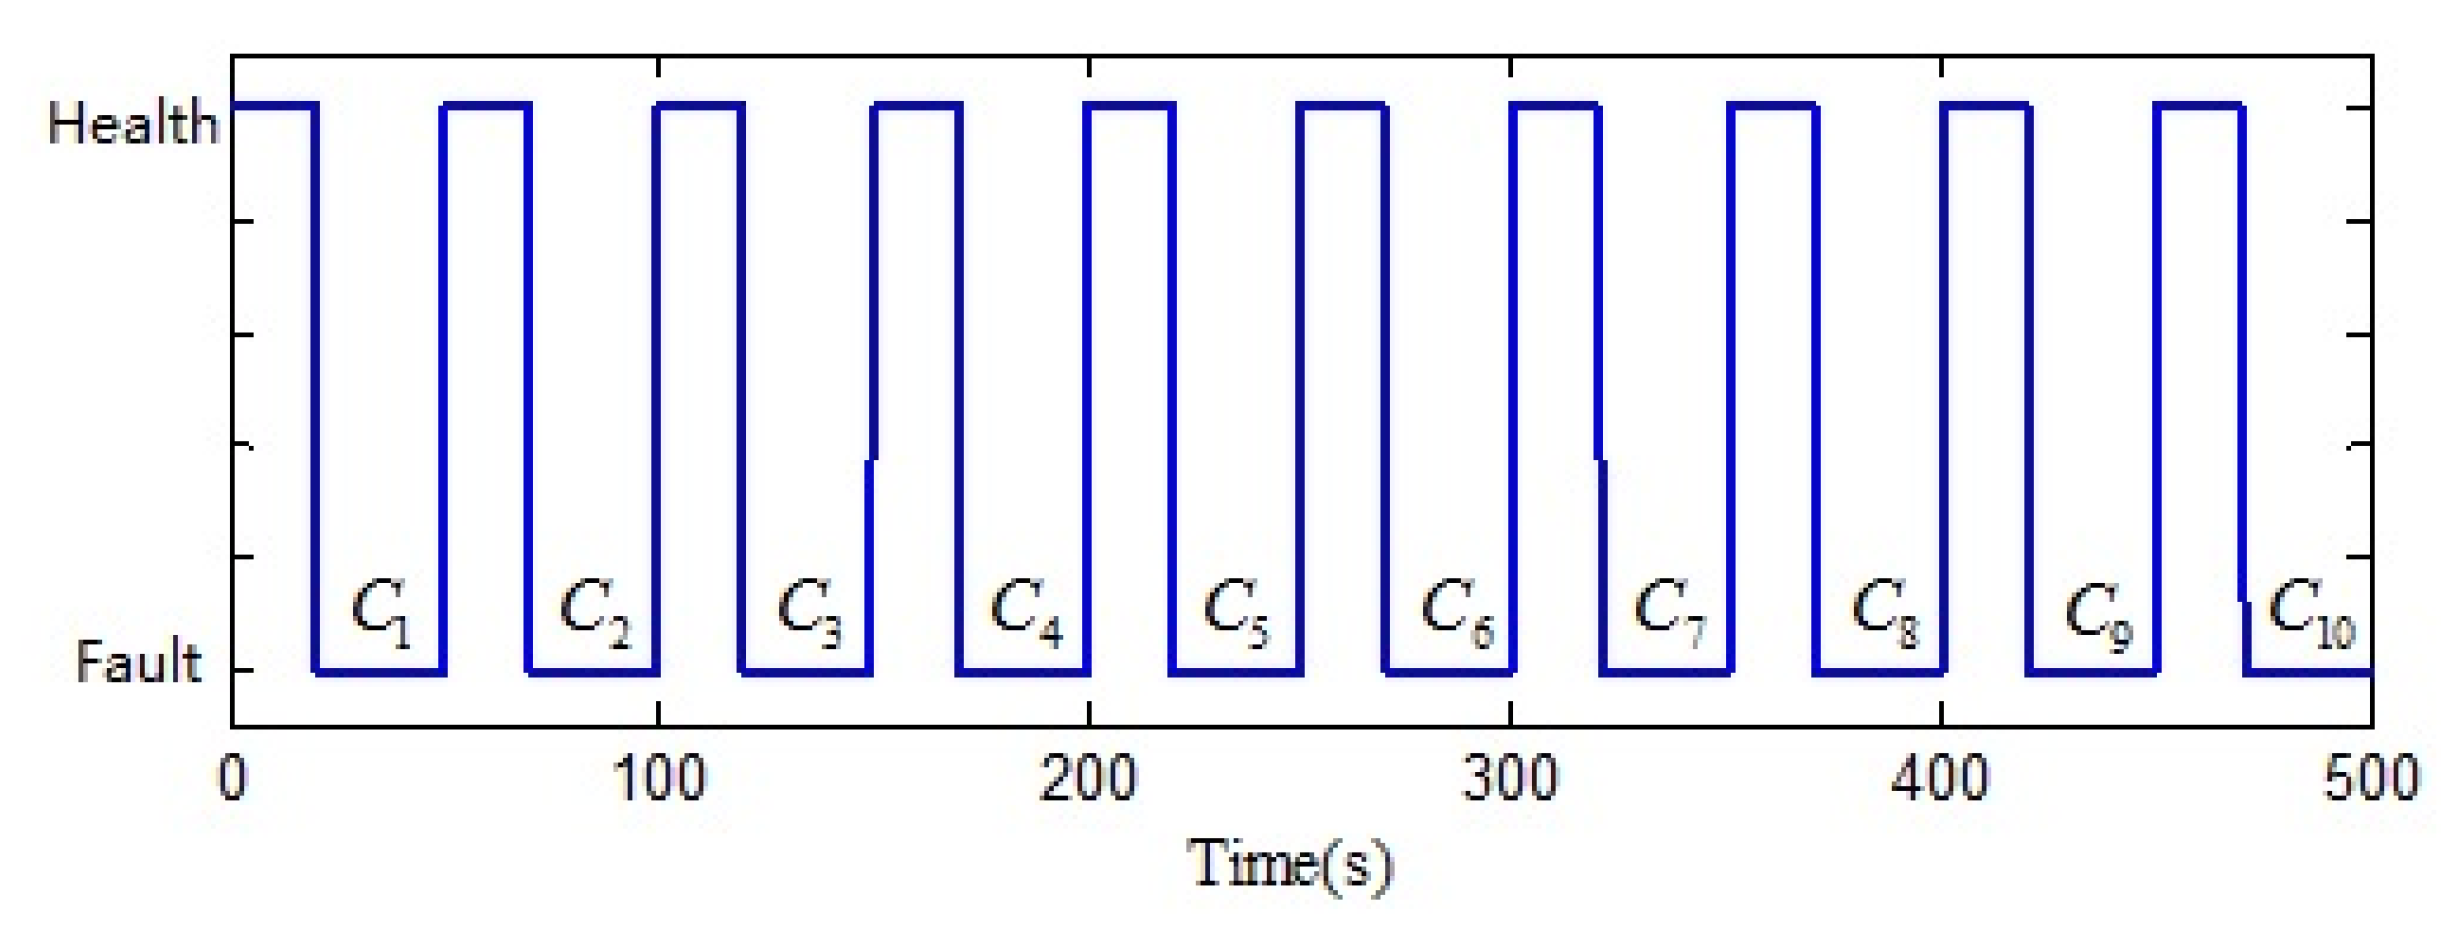
The moment of gas path fault (C1, C2, ..., C10) implantation for the marine gas turbine is shown in Figure 6 with 50 s as an interval. A fault is set at 20 s of each interval, and the system returned to normal at 50 s.
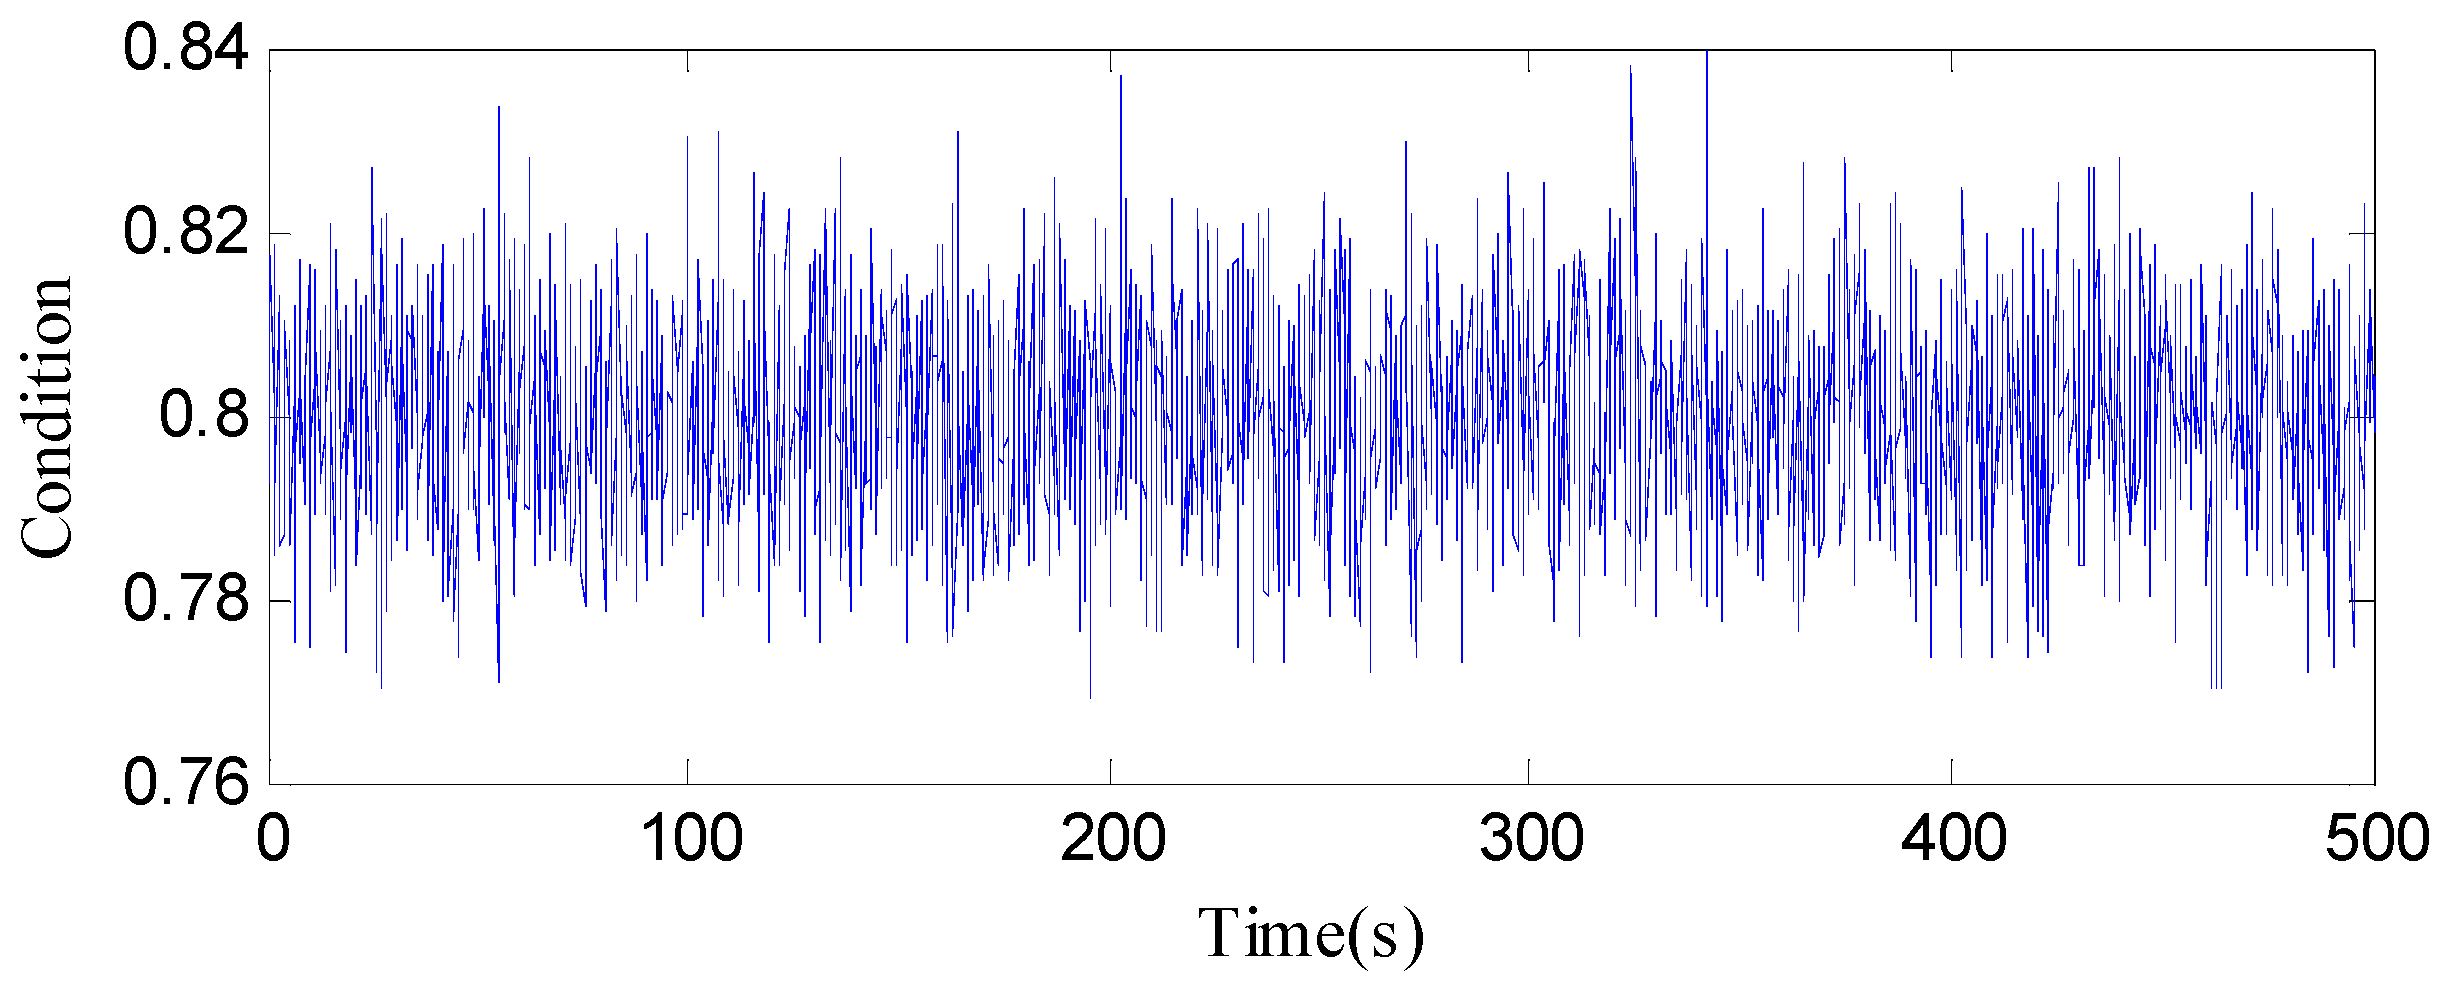
The proposed fault-diagnosis method was verified under the 0.8 perating condition which means the marine gas turbine outputs 80% of its rated power. The ambient temperature was set to a variable varying with the simulation time, as shown in Figure 7. The operating condition setting is shown in Figure 8.
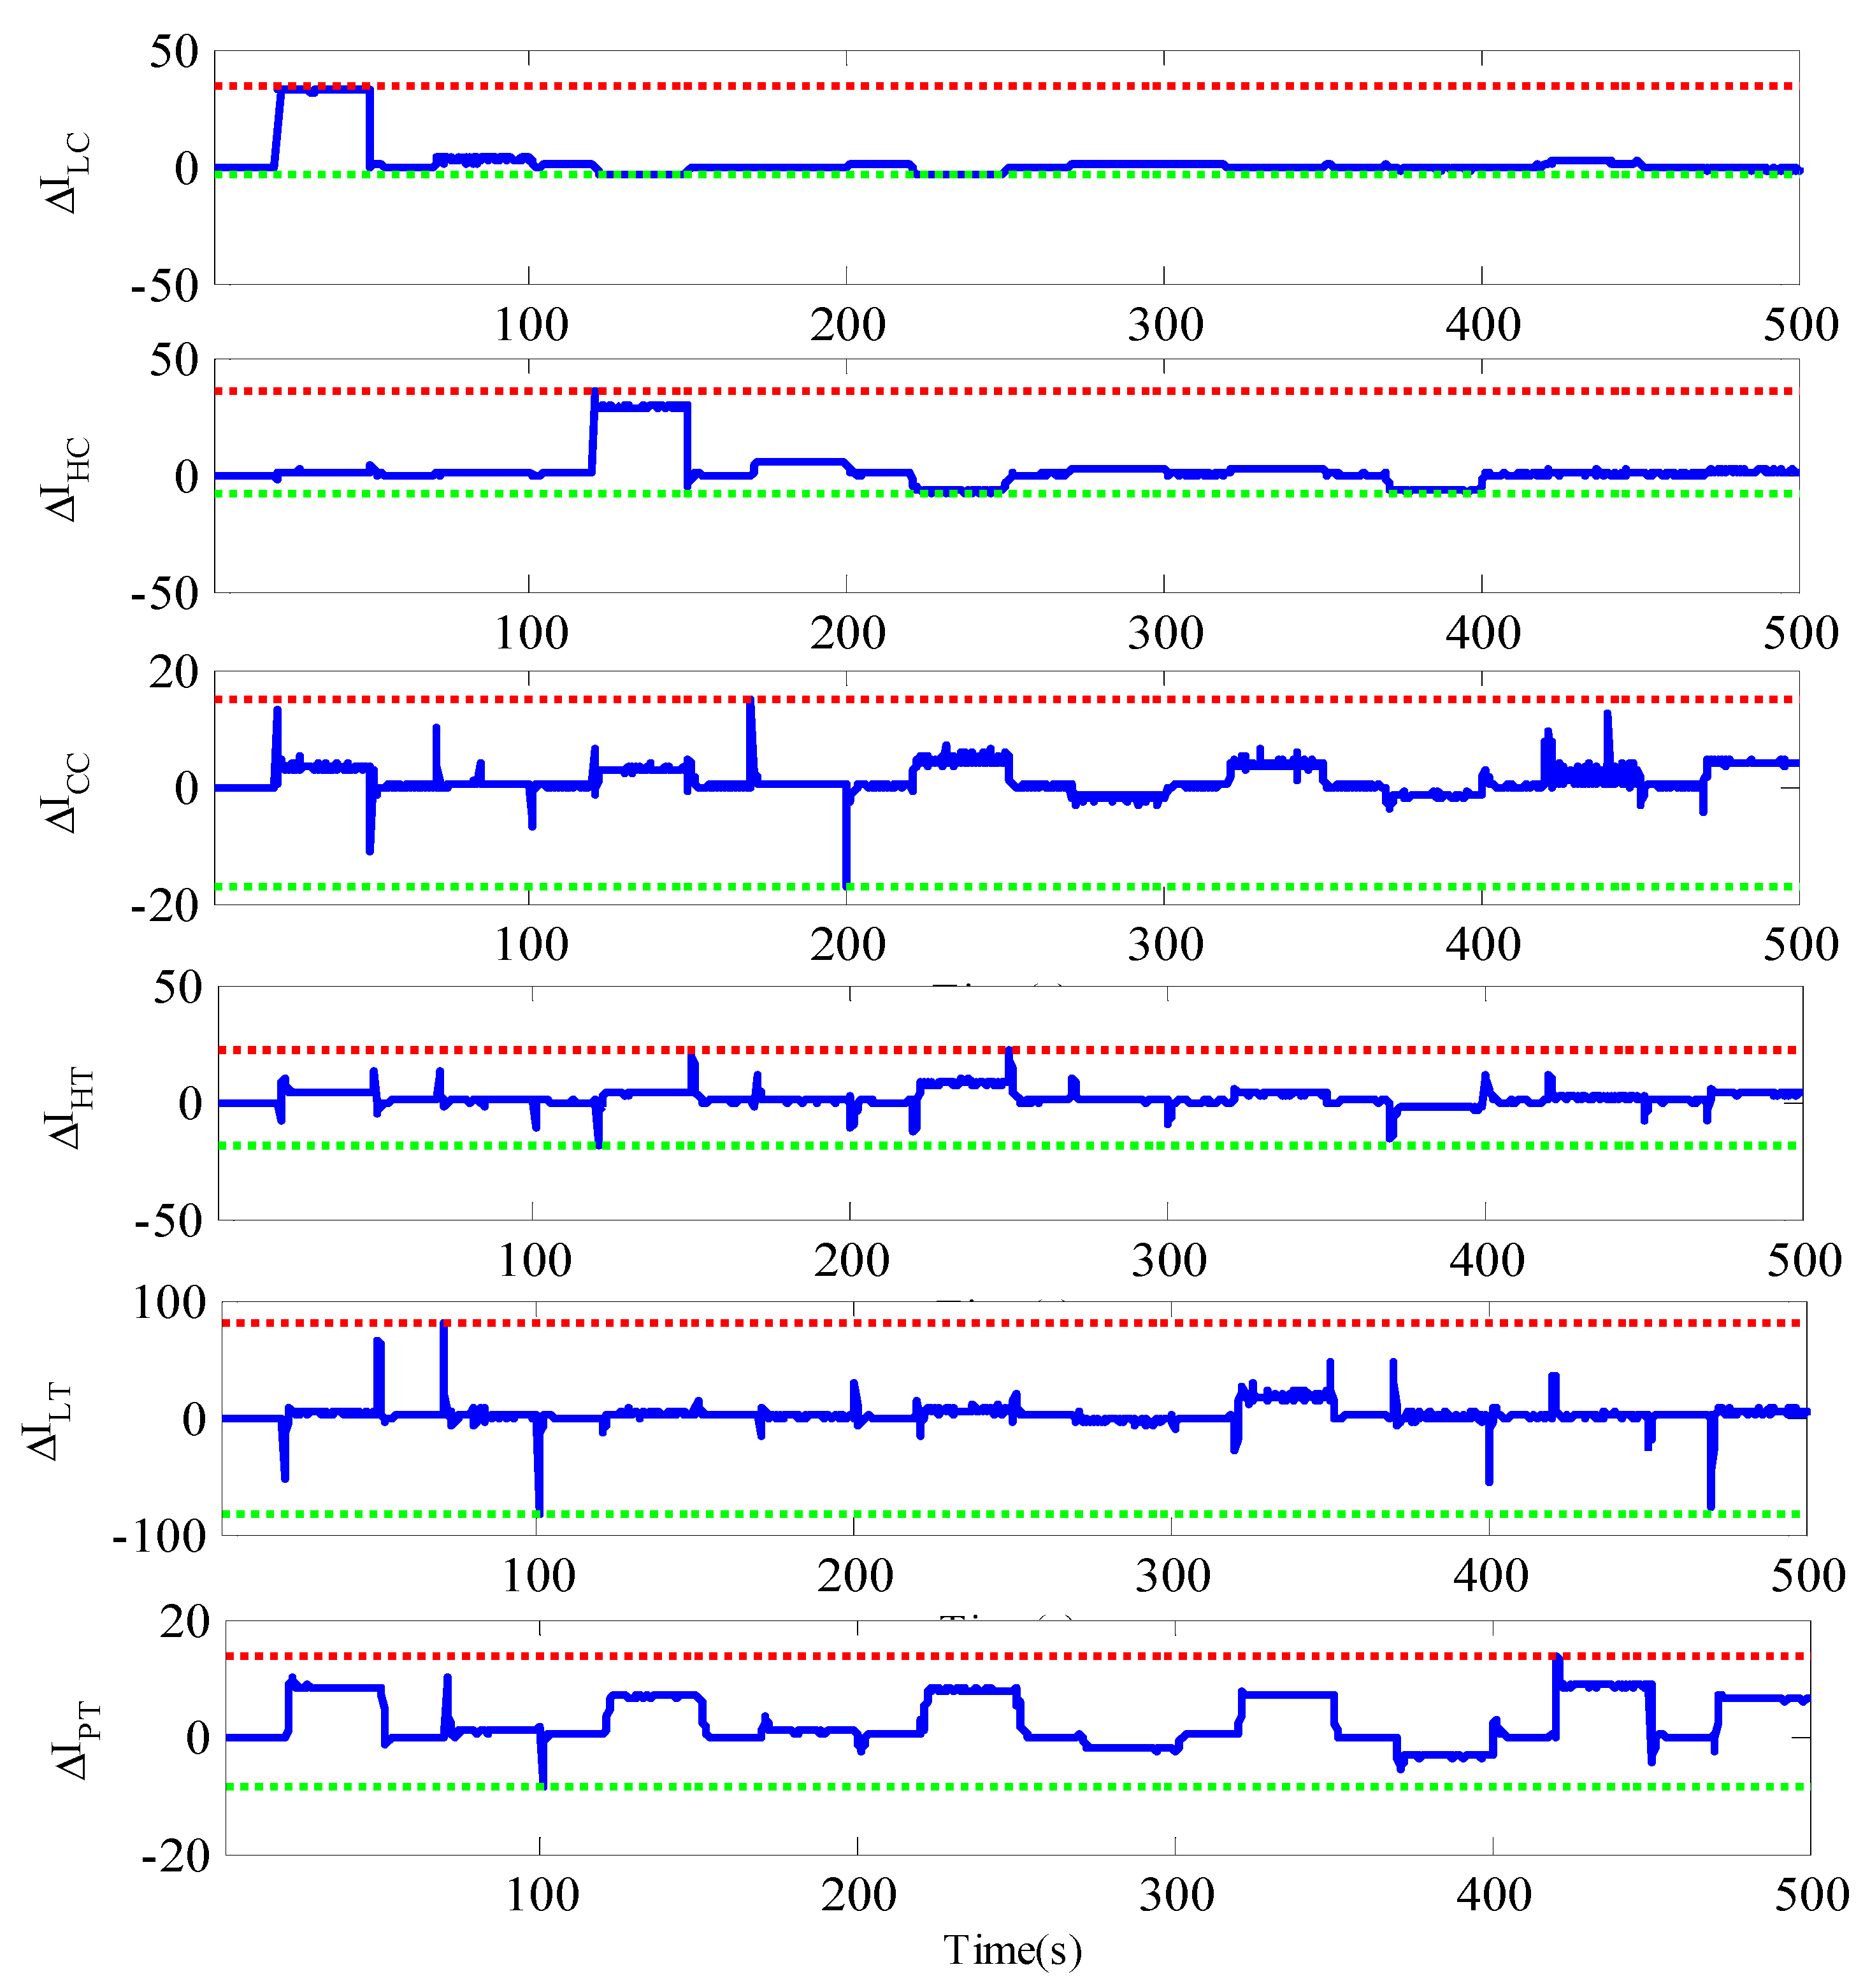
The relative change in the exergy loss of each component of a marine gas turbine over the simulation time is shown in Figure 9.
Figure 9 shows the change of the relative exergy loss of each system when the gas-path fault of the marine gas turbine (C1, C2, ..., C10) varies with the simulation time, which provides the database for subsequent fault diagnosis.
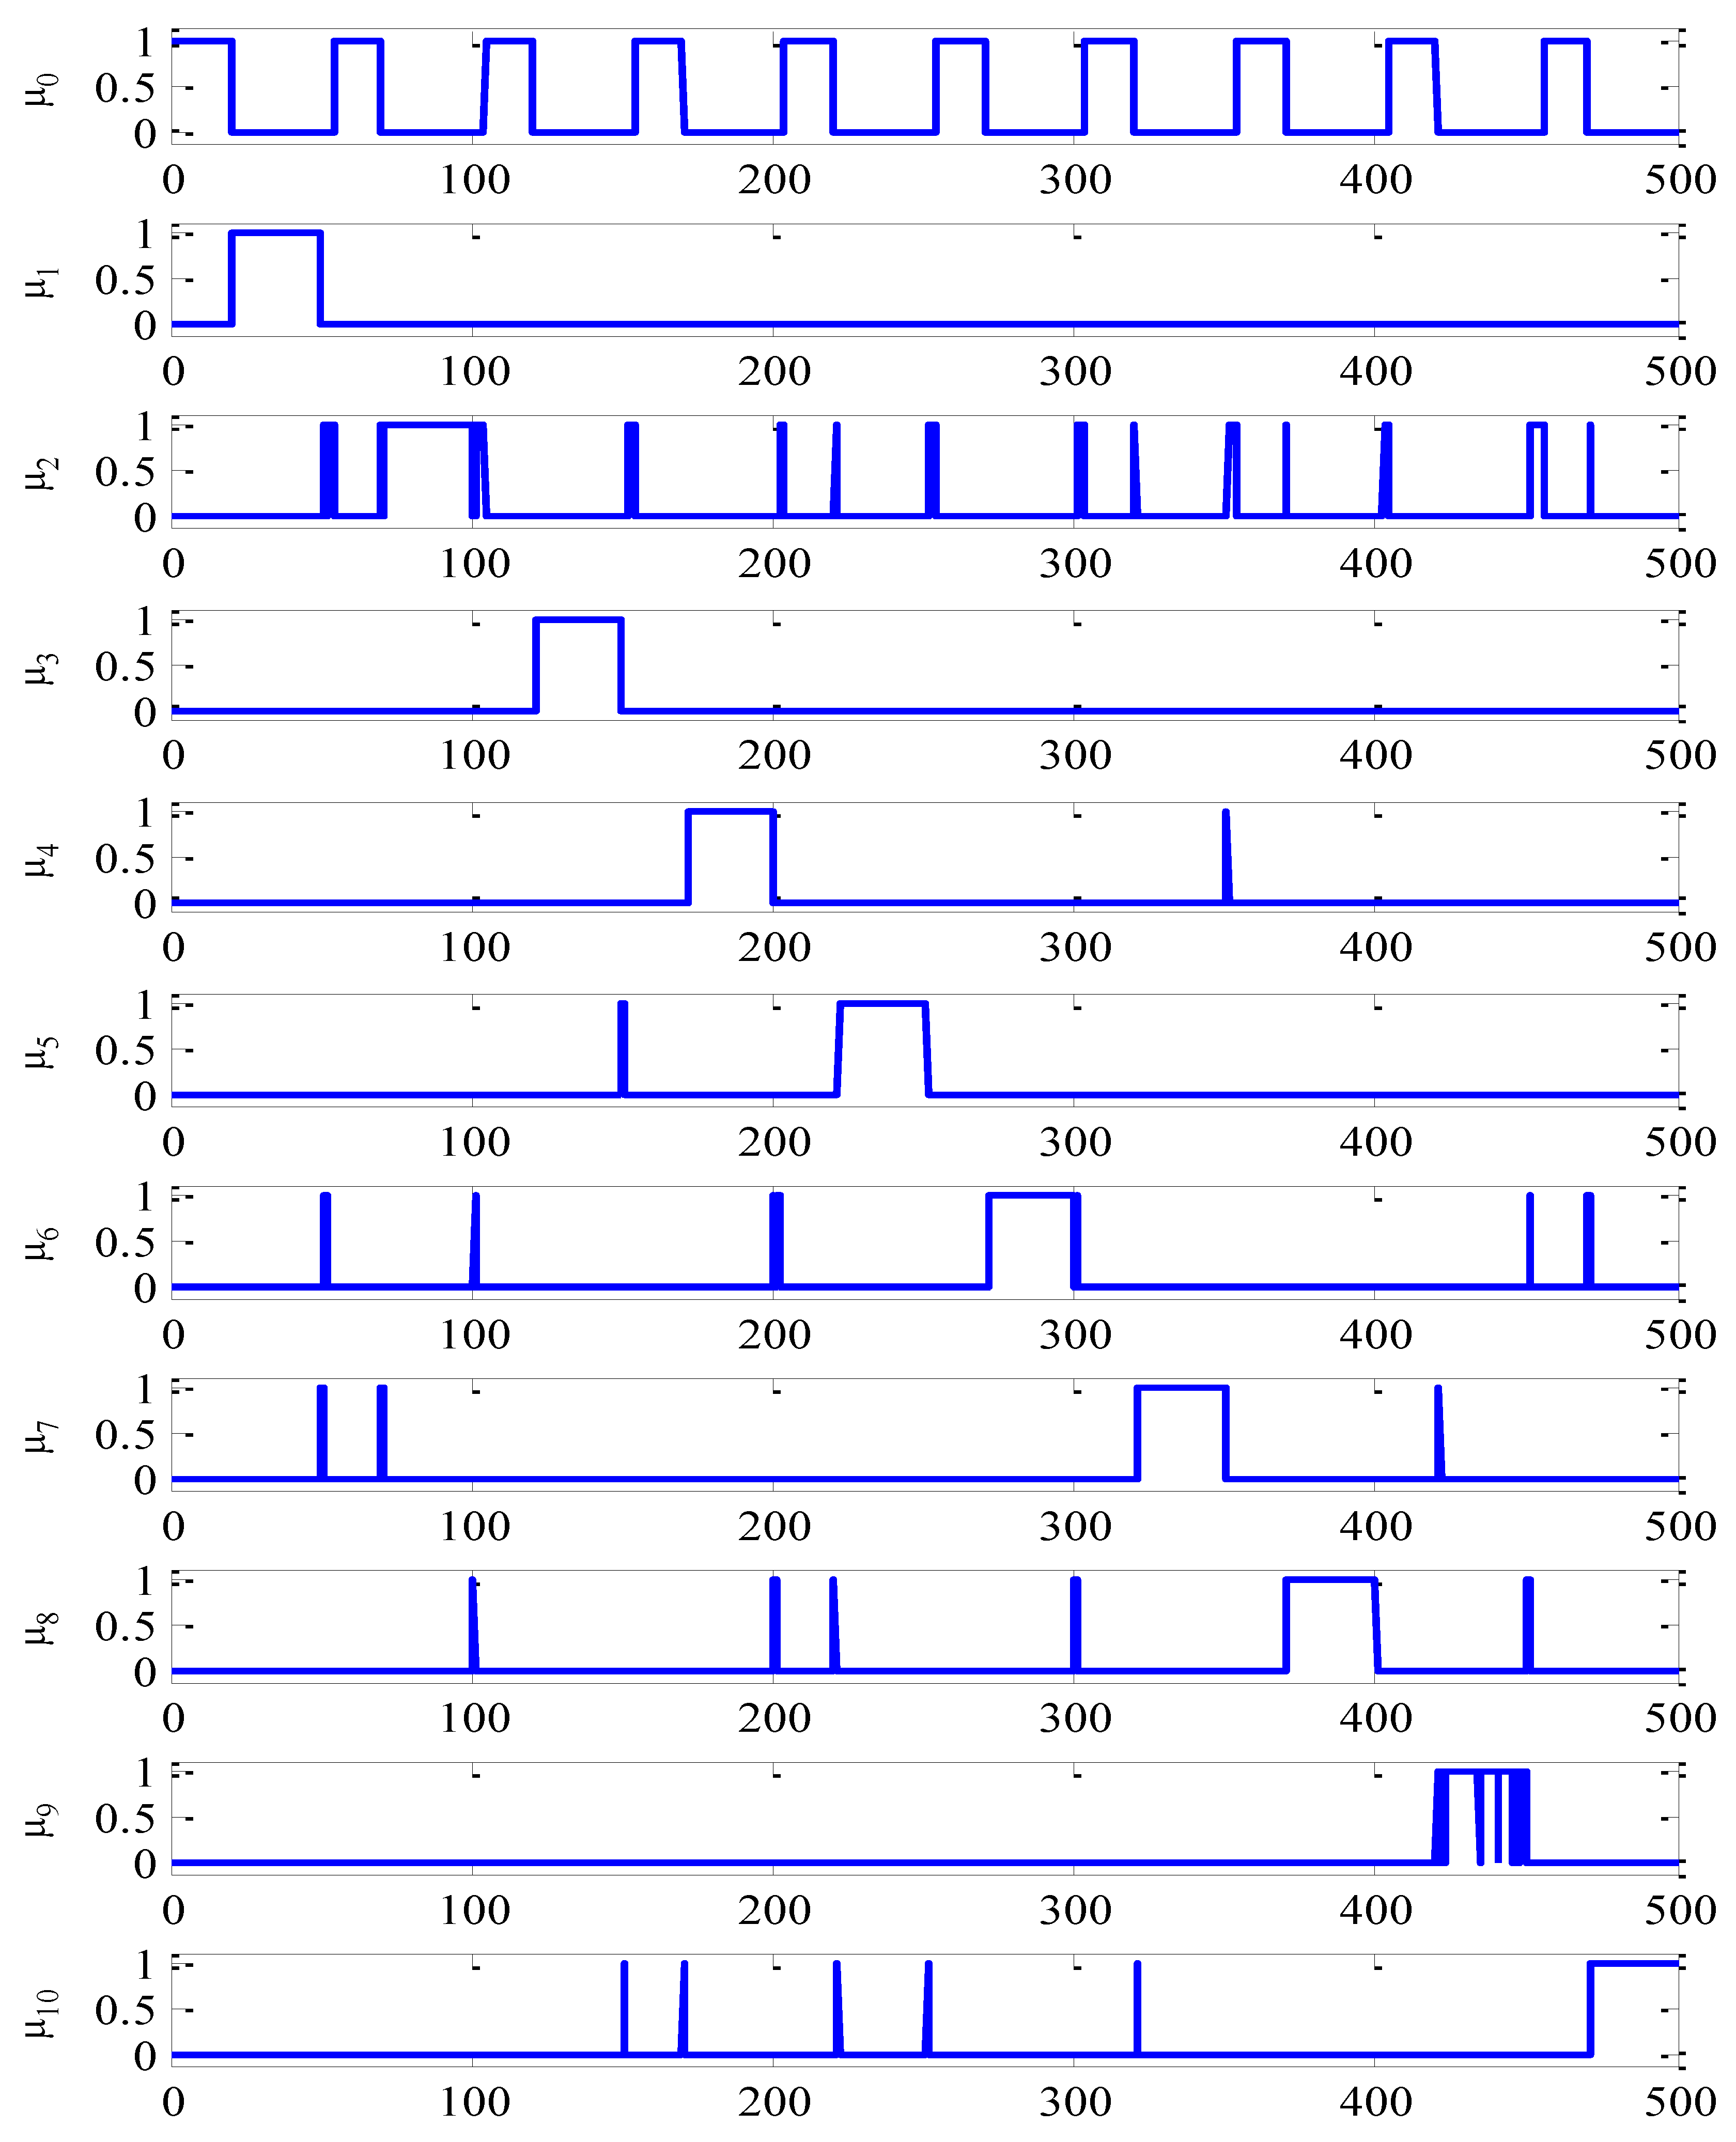
The first step of diagnosis is to judge the overall state of the system; the diagnosis model is μ0. If μ0 = 1, the system is healthy; if μ0 = 0, the system is under fault. The second step is to judge the specific faults of each system. μ1–μ10 represent typical faults of marine gas turbines (C1, C2, ..., C10), respectively. μi = 1 means fault detected; and μi = 0 means fault undetected. (i = 1, 2, 3, ..., 10).
Using MATLAB Neural Network Toolbox to carry out the PNN fault diagnosis of the marine gas turbine, it can be seen in Figure 10 that the diagnosis effect of each fault is good when the fault occurs, and the error rate is relatively low, but the missing rate is relatively high. Omissions usually occur at the switching time between normal mode and fault mode and decrease with detection time. Error rate, missing rate, and detection time are shown in Table 3. As can be seen in Table 3, the probability neural network diagnosis method based on the exergy loss can diagnose the gas path failure of the marine gas turbine well and can diagnose the specific fault at a maximum of 3.3 s, which means its sensitivity is good.

5. Conclusions

In this paper, a gas-path fault-diagnosis method of a marine gas turbine based on exergy loss and a probabilistic neural network was proposed. The exergy model of the three-shaft marine gas turbine was established based the exergy flow analysis to extract the exergy loss feature of the component under the healthy condition and typical faulty condition. A PNN classifier was introduced in the exergy analysis method to achieve good performance in detecting and isolating the gas-path fault. A simulation case study was conducted based on a three-shaft marine gas turbine with typical gas-path faults and environmental change. The simulation results show that the proposed diagnosis method can accurately detect the gas-path fault and locate the malfunction component.
The exergy losses of 10 typical gas-path faults with different severity were analyzed, and we found that the exergy loss relative change of components is the monotone increasing function of the operating condition and fault severity, respectively. Moreover, they are also highly sensitive to the performance parameters of components, which is conducive to locating the fault cause.
In this paper, the proposal was verified by a single gas-path fault. In future work, we will continue to improve and evaluate the performance of the proposed method on a multiple gas-path fault condition.

Author Contributions

Conceptualization, Y.C.; methodology, Y.C. and X.L.; software, G.H.; validation, J.L., S.L. and Y.C.; formal analysis, Y.C.; investigation, X.L.; resources, Y.C.; data curation, S.L.; writing—original draft preparation, Y.C.; writing—review and editing, X.L.; visualization, G.H.; supervision, S.L.; project administration, Y.C.; funding acquisition, Y.C.

Funding

This research was funded by National Science and Technology Major Project (2017-I-0007-0008) and Fundamental Research Funds for the Central Universities (HEUCFP201722).

Conflicts of Interest

The authors declare no conflict of interest.

References

  1. Lu, F.; Jiang, J.; Huang, J.; Qiu, X. An Iterative Reduced KPCA Hidden Markov Model for Gas Turbine Performance Fault Diagnosis. Energies 2018, 11, 1807–1828. [Google Scholar] [CrossRef] [Green Version]
  2. Amare, F.D.; Gilani, S.I.; Aklilu, B.T. Two-shaft stationary gas turbine engine gas path diagnostics using fuzzy logic. J. Mech. Sci. Tech. 2017, 31, 5593–5602. [Google Scholar] [CrossRef]
  3. Yang, Q.; Li, S.; Cao, Y. A Gas Path Fault Contribution Matrix for Marine Gas Turbine Diagnosis Based on a Multiple Model Fault Detection and Isolation Approach. Energies 2018, 11, 3316–3337. [Google Scholar] [CrossRef] [Green Version]
  4. Li, J.; Fan, D.; Sreeram, V. SFC optimization for aero engine based on hybrid GA-SQP method. Int. J. Turbo. Jet-Engines 2013, 30, 383–391. [Google Scholar] [CrossRef]
  5. Kraft, J.; Sethi, V.; Singh, R. Optimization of aero gas turbine maintenance using advanced simulation and diagnostic methods. J. Eng. Gas. Turbines Power 2014, 136, 111601. [Google Scholar] [CrossRef]
  6. Zwebek, A.; Pilidis, P. Degradation Effects on Combined Cycle Power Plant Performance—Part I: Gas Turbine Cycle Component Degradation Effects. J. Eng. Gas. Turbines Power 2003, 125, 306–315. [Google Scholar] [CrossRef]
  7. Volponi, A.J. Gas Turbine Engine Health Management: Past, Present, and Future Trends. J. Eng. Gas Turbines Power 2014, 136. [Google Scholar] [CrossRef]
  8. Tahan, M.; Tsoutsanis, E.; Muhammad, M. Performance-based health monitoring, diagnostics and prognostics for condition-based maintenance of gas turbines: A review. Appl. Energy 2017, 198, 122–144. [Google Scholar] [CrossRef] [Green Version]
  9. Li, Y.G. Gas turbine performance and health status estimation using adaptive gas path analysis. J. Eng. Gas Turb. Power 2010, 132, 041701. [Google Scholar] [CrossRef]
  10. Ying, Y.; Cao, Y.P.; Li, S. Study on gas turbine engine fault diagnostic approach with a hybrid of gray relation theory and gas-path analysis. Adv. Mech. Eng. 2016, 8, 1–14. [Google Scholar] [CrossRef] [Green Version]
  11. Simon, D.L.; Bird, J.; Davison, C.; Volponi, A.; Iverson, R.E. Bench marking gas path diagnostic methods: A public approach. In Proceedings of the ASME Turbo Expo 2008: Power for Land, Sea, and Air, Berlin, Germany, 9–13 June 2008; pp. 325–336. [Google Scholar]
  12. Kyriazis, A.; Mathioudakis, K. Gas Turbine Fault Diagnosis Using Fuzzy-Based Decision Fusion. J. Propuls. Power 2009, 25, 335–343. [Google Scholar] [CrossRef]
  13. Marinai, L.; Singh, R. A fuzzy logic approach to gas path diagnostics in Aero-engines. In Computational Intelligence in Fault Diagnosis; Springer: Berlin/Heidelberg, Germany, 2006; pp. 37–79. [Google Scholar]
  14. Zaidan, M.A.; Mills, A.R.; Harrison, R.F.; Fleming, P.J. Gas turbine engine prognostics using Bayesian hierarchical models: A variational approach. Mech. Syst. Sig. Proc. 2016, 70, 120–140. [Google Scholar] [CrossRef]
  15. Zaidan, M.A.; Mills, A.R.; Harrison, R.F.; Fleming, P.J. Bayesian hierarchical models for aerospace gas turbine engine prognostics. Expert Syst. Appl. 2015, 42, 539–553. [Google Scholar] [CrossRef]
  16. Romessis, C.; Stamatis, A.; Mathioudakis, K. Setting up a belief network for turbofan diagnosis with the aid of an engine performance model. ISABE Pap. 2001, 1032, 19–26. [Google Scholar]
  17. Cao, Y.P.; Li, S.Y.; Yi, S.; Zhao, N.B. Fault diagnosis of a gas turbine gas fuel system using a self-organizing network. Adv. Sci. Lett. 2012, 8, 386–392. [Google Scholar] [CrossRef]
  18. Côme, E.; Cottrell, M.; Verleysen, M.; Lacaille, J. Aircraft engine health monitoring using self-organizing maps. In Industrial Conference on Data Mining; Springer: Berlin/Heidelberg, Germany, 2010; pp. 405–417. [Google Scholar]
  19. Talaat, M.; Gobran, M.H.; Wasfi, M. A hybrid model of an artificial neural network with thermodynamic model for system diagnosis of electrical power plant gas turbine. J. Eng. Appl. Artif. Intell. 2018, 68, 222–235. [Google Scholar] [CrossRef]
  20. Zedda, M.; Singh, R. Gas Turbine Engine and Sensor Fault Diagnosis Using Optimization Techniques. J. Propuls. Power 2002, 18, 1019–1025. [Google Scholar] [CrossRef]
  21. Alfredo, G.; Raniero, S. A multi-variable multi-objective methodology for experimental data and thermodynamic analysis validation: An application to micro gas turbines. J. Appl. Therm. Eng. 2018, 134, 501–512. [Google Scholar] [CrossRef]
  22. Meskin, N.; Naderi, E.; Khorasani, K. A Multiple Model-Based Approach for Fault Diagnosis of Jet Engines. IEEE Trans. Control Syst. Technol. 2013, 21, 254–262. [Google Scholar] [CrossRef]
  23. Iacentino, A.; Catrini, P. Assessing the Robustness of Thermoeconomic Diagnosis of Fouled Evaporators: Sensitivity Analysis of the Exergetic Performance of Direct Expansion Coils. Entropy 2016, 18, 85. [Google Scholar] [CrossRef] [Green Version]
  24. Keshavarzian, S.; Rocco, M.V.; Colombo, E. Thermoeconomic diagnosis and malfunction decomposition: Methodology improvement of the Thermoeconomic Input-Output Analysis (TIOA). Energy Convers. Manag. 2018, 157, 644–655. [Google Scholar] [CrossRef]
  25. Valero, A.; Correas, L.; Zaleta, A.; Lazzaretto, A.; Verda, V.; Reini, M.; Rangel, V. On the thermoeconomic approach to the diagnosis of energy system malfunctions Part 2. Malfunction definitions and assessment. Energy 2004, 29, 1889–1907. [Google Scholar] [CrossRef]
  26. Verda, V.; Valero, A.; Serra, L.; Rangel, V.; Zaleta, A.; Lazzaretto, A.; Toffolo, A.; Reini, M.; Taccani, R.; Donatini, F.; et al. On the thermoeconomic approach to the diagnosis of energy system malfunctions. Part 3 Approaches to the diagnosis problem. In Proceedings of the 16th International Conference on Efficiency, Costs, Optimization, Simulation and Environmental Impact of Energy Systems, Copenhagen, Denmark, 30 June–2 July 2003. [Google Scholar]
  27. Valero, A.; Correas, L.; Zaleta, A.; Lazzaretto, A.; Verda, V.; Reini, M.; Rangel, V. On the thermoeconomic approach to the diagnosis of energy system malfunctions: Part 1: The TADEUS problem. Energy 2004, 29, 1875–1887. [Google Scholar] [CrossRef]
  28. Yang, Q.; Li, S.; Cao, Y. Multiple model-based detection and estimation scheme for gas turbine sensor and gas path fault simultaneous diagnosis. J Mech. Sci. Technol. 2019, 33, 1959–1972. [Google Scholar] [CrossRef]
  29. Taheri, K.; Gadow, R. Industrial compressed air system analysis: Exergy and thermoeconomic analysis. J. Manuf. Sci. Technol. 2017, 18, 10–17. [Google Scholar] [CrossRef]
  30. Loboda, I.; Robles, M.A. Gas Turbine Fault Diagnosis Using Probabilistic Neural Networks. J. Int. J. Turbo. Jet-Engines 2015, 32, 175–191. [Google Scholar] [CrossRef]
  31. Khashei, M.; Bijari, M.; Ardali, G.A.R. Hybridization of autoregressive integrated moving average (ARIMA) with probabilistic neural networks (PNNs). Comput. Ind. Eng. 2012, 63, 37–45. [Google Scholar] [CrossRef]
  32. Lakshmi, R.S.; Sivakumar, A.; Rajaram, G.; Swaminathan, V.; Kannan, K. A novel hypergraph-based feature extraction technique for boiler flue gas components classification using PNN—A computational model for boiler flue gas analysis. J. Ind. Inf. Integr. 2017, 9, 35–44. [Google Scholar] [CrossRef]
  33. Ali, J.B.; Saidi, L.; Mouelhi, A.; Chebel-Morello, B.; Fnaiech, F. Linear feature selection and classification using PNN and SFAM neural networks for a nearly online diagnosis of bearing naturally progressing degradations. Eng. Appl. Artif. Intell. 2015, 42, 67–81. [Google Scholar] [CrossRef] [Green Version]
  34. Bushehri, S.M.; Zarchi, M.S. An expert model for self-care problems classification using probabilistic neural network and feature selection approach. Appl. Soft Comput. 2019, 82. [Google Scholar] [CrossRef]
  35. Porwik, P.; Doroz, R.; Orczyk, T. Signatures verification based on PNN classifier optimised by PSO algorithm. Pattern Recognit. 2016, 60, 998–1014. [Google Scholar] [CrossRef]
  36. Cao, Y.; He, Y.; Yu, F.; Du, J.; Li, S.; Yang, Q.; Liu, R. A Two-Layer Multi-Model Gas Path Fault Diagnosis Method. In Proceedings of the ASME Turbo Expo 2018: Turbomachinery Technical Conference and Exposition, Oslo, Norway, 11–15 June 2018. Volume 6: Ceramics; Controls, Diagnostics, and Instrumentation; Education; Manufacturing Materials and Metallurgy. [Google Scholar]
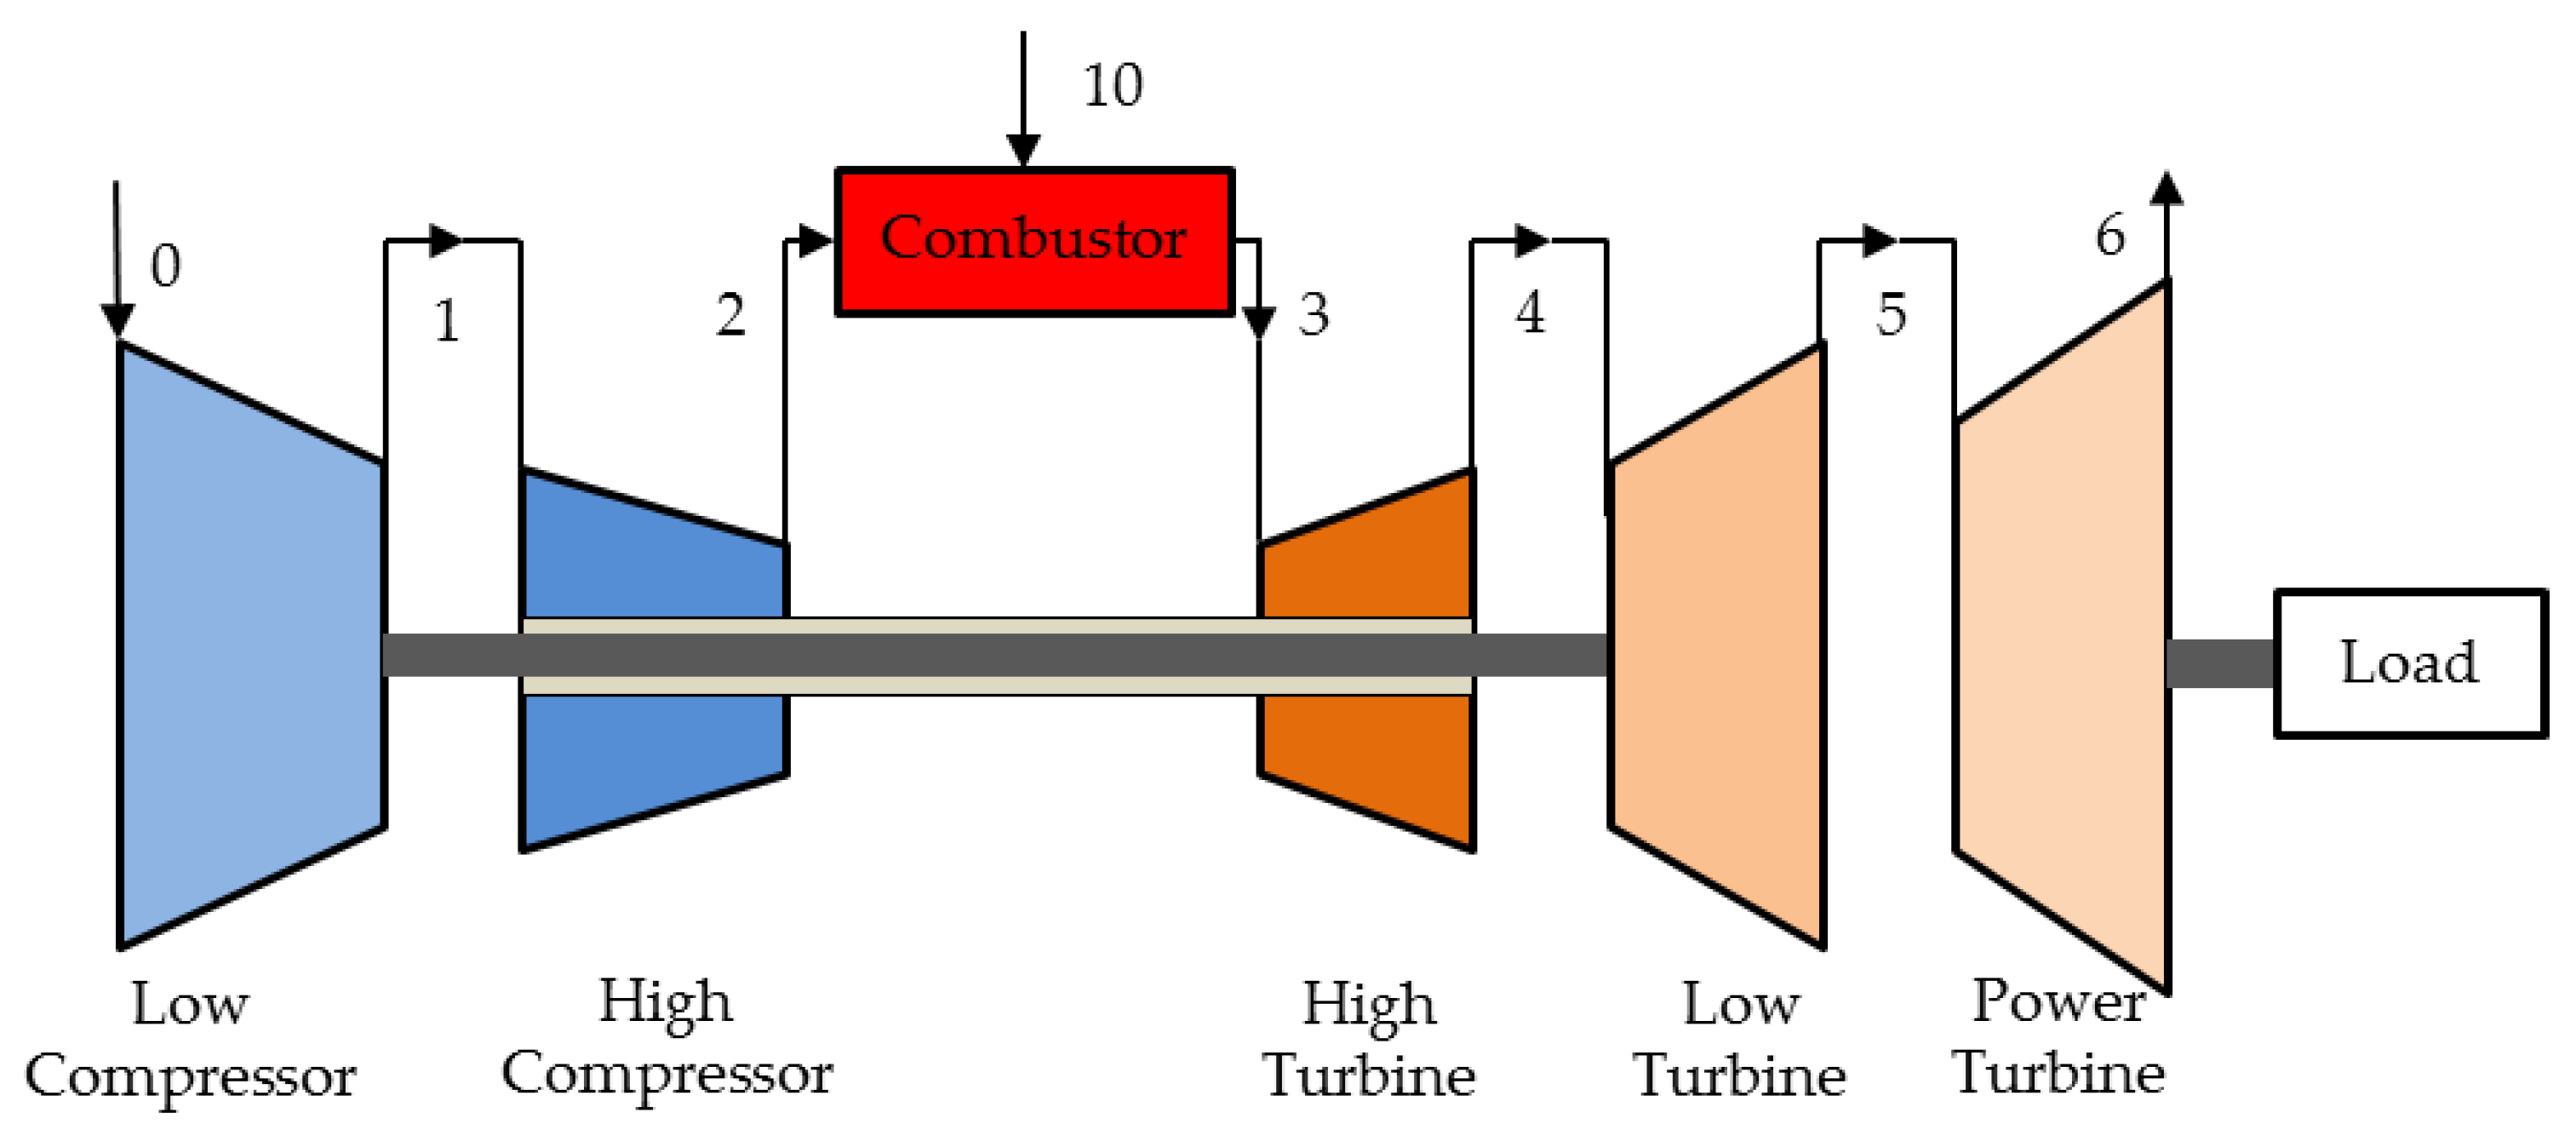
Figure 1. Working schematic of the three-shaft marine gas turbine.
Energies 12 04701 g001
Figure 2. Exergy flow diagram of marine three-shaft gas turbine.
Energies 12 04701 g002
Figure 3. The probabilistic neural network (PNN) schematic diagram.
Energies 12 04701 g003
Figure 4. The fault-diagnosis process.
Energies 12 04701 g004
Figure 5. The relative variation of components exergy loss under a given faulty condition.
Energies 12 04701 g005
Figure 6. Marine gas turbine gas-path fault implantation.
Energies 12 04701 g006
Figure 7. Setting of ambient temperature for the marine gas turbine.
Energies 12 04701 g007
Figure 8. Setting of operating condition.
Energies 12 04701 g008
Figure 9. Relative change of exergy loss for marine gas turbine systems under simulated faults.
Energies 12 04701 g009
Figure 10. Fault-diagnosis result of a marine gas turbine system.
Energies 12 04701 g010
Table 1. Exergy flow and exergy loss of marine gas turbine components.
NumberComponent Exergy InflowExergy OutflowExergy Loss
1Low-pressure compressor B 0 + B 9 B 1 B 0 + B 9 B 1
2High-pressure compressor B 1 + B 8 B 2 ( B 1 + B 8 ) B 2
3Combustion chamber B 2 + B 10 B 3 ( B 2 + B 10 ) B 3
4High-pressure turbine B 3 B 4 + B 8 B 3 B 4 + B 8
5Low-pressure turbine B 4 B 5 + B 9 B 4 B 5 + B 9
6Power turbine B 5 B 6 = w n e t B 5 B 6
Table 2. Summary of marine gas turbine gas-path fault simulation.
Fault CodeFault-PatternFault ComponentFault SeverityFault Simulation Coefficient
C0Healthy---
C 1 Low-pressure compressor efficiency decreaseLow-pressure compressor20% to 100%compressor efficiency decrease (1% to 5%)
C 2 High-pressure compressor efficiency decreaseHigh-pressure compressor20% to 100%compressor efficiency decrease (1% to 5%)
C 3 High-pressure turbine efficiency decreaseHigh-pressure turbine 20% to 100%turbine efficiency decrease (1% to 5%)
C 4 Low-pressure turbine efficiency decrease Low-pressure turbine 20% to 100%turbine efficiency decrease (1% to 5%)
C 5 Power turbine efficiency decreasePower turbine20% to 100%turbine efficiency decrease (1% to 5%)
C 6 Low-pressure compressor flow rate decrease Low-pressure compressor20% to 100%compressor flow rate decrease (1% to 5%)
C 7 High-pressure compressor flow rate decreaseHigh-pressure compressor20% to 100%compressor flow rate decrease (1% to 5%)
C 8 High-pressure turbine flow rate decreaseHigh-pressure turbine 20% to 100%turbine flow rate decrease (1% to 5%)
C 9 Low-pressure turbine flow rate decreaseLow-pressure turbine 20% to 100%turbine flow rate decrease (1% to 5%)
C 10 Power turbine flow rate decreasePower turbine20% to 100%turbine flow rate decrease (1% to 5%)
Table 3. Fault-diagnosis indicators.
Fault CodeError RateMissing RateDetection Time
C00%16.4%3.3 s
C10.0000%0.0000%0 s
C25.0780%3.3333%1 s
C30.0000%4.0000%1.2 s
C40.0400%6.0000%1.8 s
C50.3998%6.0000%1.8 s
C60.6797%4.0000%1.2 s
C70.5198%4.0000%1.2 s
C80.6397%1.3333%0.4 s
C90.0400%8.6667%2.6 s
C100.0000%4.0000%1.2 s