Article

Optimal Design of PMSM Based on Automated Finite Element Analysis and Metamodeling

Department of Automotive Engineering, Honam University, Gwangju 62399, Korea
Energies 2019, 12(24), 4673; https://doi.org/10.3390/en12244673
Submission received: 30 October 2019 / Revised: 3 December 2019 / Accepted: 4 December 2019 / Published: 9 December 2019
(This article belongs to the Special Issue Advances in Rotating Electric Machines)

Abstract

:
To obtain accurate optimal design results in electric machines, the finite element analysis (FEA) technique should be used; however, it is time-consuming. In addition, when the design of experiments (DOE) is conducted in the optimal design process, mechanical design, analysis, and post process must be performed for each design point, which requires a significant amount of design cost and time. This study proposes an automated DOE procedure through linkage between an FEA program and optimal design program to perform DOE easily and accurately. Parametric modeling was developed for the FEA model for automation, the files required for automation were generated using the macro function, and the interface between the FEA and optimal design program was established. Shape optimization was performed on permanent magnet synchronous motors (PMSMs) for small electric vehicles to maximize torque while maintaining efficiency, torque ripple, and total harmonic distortion of the back EMF using the built-in automation program. Fifty FEAs were performed for the experimental points selected by optimal Latin hypercube design and their results were analyzed by screening. Eleven metamodels were created for each output variable using the DOE results and root mean squared error tests were conducted to evaluate the predictive performance of the metamodels. The optimization design based on metamodels was conducted using the hybrid metaheuristic algorithm to determine the global optimum. The optimum design results showed that the average torque was improved by 2.5% in comparison to the initial model, while satisfying all constraints. Finally, the optimal design results were verified by FEA. Consequently, it was found that the proposed optimal design method can be useful for improving the performance of PMSM as well as reducing design cost and time.

Graphical Abstract

1. Introduction

The necessity of eco-friendly vehicles has been highlighted owing to environmental pollution and depletion of fossil fuels. Global electric car stocks are growing rapidly, crossing the 3 million vehicle threshold in 2017. The estimated demand for electric vehicles by 2030 is 100 to 140 million. The core of an electric vehicle is the electric powertrain, which consists of a traction motor, a reduction drive, an inverter, and a power delivery module. Permanent magnet synchronous motors (PMSMs) have been mainly used as a traction motor for electric vehicles because they have high efficiency and high output power density characteristics.
Several studies have been conducted on the PMSMs used in electric vehicles that require various characteristics such as torque, efficiency, and harmonic distortion (THD). Optimal design is essential to satisfy the various design requirements of PMSM at once. Optimal design is a method of finding the values of design variables to obtain an optimal solution within a range of constraints. The optimal design for PMSMs is created by combining design methods such as the analytical model, magnetic equivalent circuits (MEC) model, and finite element analysis (FEA) with optimal design algorithms [1,2,3,4,5,6,7,8]. First of all, there are studies on optimal design using the analytical model [1,2]. In [1], the optimal design of a PMSM based on the magnetic field analytical model was determined. The objective function used in that study consisted of efficiency, electrical time constant, and mechanical time constant. The experimental results showed that the efficiency increased by 1%. To minimize torque ripple, a novel analytical solution of a PMSM was proposed [2]. The stator current was optimized considering magnetic saturation using an analytical expression. The following are studies on optimization using the MEC model [3,4]. In [3] it was reported that the MEC optimization method combined with an optimization algorithm can optimize the volume and energy loss of a PMSM. A novel MEC model of a PMSM to obtain the maximum efficiency, minimum weight, and price was developed [4]. K-means clustering algorithm was utilized to obtain the best solution out of the eight clusters. Finally, some research on optimization combined with FEA have been published [5,6,7]. The work in [5] performed multi-objective shape optimization of a PMSM based on FEA and particle swarm optimization algorithm. Five rotor topologies were compared, aimed at efficiency, flux-wakening rate, and price. The work in [6] proposed an optimization process of a PMSM to optimize the weight, output power, and suitability. It performed shape optimization of permanent magnets and rotor core using FEA with the fuzzy inference system strategy. Using a novel memetic algorithm, an optimal design based on FEA to minimize torque ripple in a PMSM was created [7]. In [8], multi-physics and multi-objective optimization of a PMSM based on FEA and analytical magnetic model were studied. Although the FEA optimization method combined with optimization algorithm has the highest accuracy, it has high computational cost [5].
There are two main ways to optimize design variables: To combine the optimal algorithm with design methods directly and combine the optimal algorithm with the metamodel from the results of design of experiments (DOE). Metamodel is a mathematical model that approximates the relationships between design variables and responses. DOE is an application of statistics aimed at designing experimental methods and analyzing the results to identify relationships between design variables and responses. First, directly connecting the optimal algorithm with the design methods can determine the best solution more clearly [9]. However, this method takes a long time to optimize and it is difficult to predict the design time. Additionally, if the formulation of the optimal design is wrong, it is difficult to find the best solution. In the case of optimization by creating metamodels using DOE results, it is possible to predict the optimal results by analyzing the sensitivity between design variables and target goals. In addition, the time taken for the optimization design is clear. However, the number of DOE and test points must be selected properly, and the metamodel must be made correctly. Meanwhile, non-automated DOE requires a lot of effort and time because mechanical modeling and analysis must be performed as many times as DOE. Although a large number of DOEs are required to achieve good optimal design results, it takes a significant amount of effort and time. The work in [10] reported optimization results using response surface methodology combined with metamodels from the DOE results. To produce DOE results, a total of 15 models were made and 15 FEAs were conducted. The study in [11] optimized a PMSM by combining an optimal algorithm and metamodel, i.e., the genetic algorithm and the Kriging model, based on DOE. In that study, to obtain the DOE results, several models had to be designed and FEAs were required.
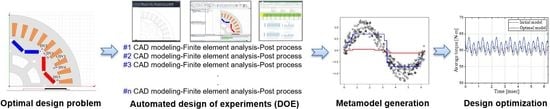
The novelty of this distinguishes it from previous studies for the following reasons: First, optimal design can be easily processed based on a novel automated DOE procedure based on FEA, so it can be done faster and more accurately. In general, DOE by FEA consists of modeling process using CAD tools, analysis condition setting process for FEA, FEA process, and post process for extracting and organizing results. To obtain a reliable optimal design result, a large number of DOE have to be carried out. However, the conventional method of manually performing the process was complicated and time consuming, and thus the number of DOE was limited [10,11,12,13,14,15,16,17,18]. However, using the automated DOE process proposed in this study, not only can the DOE be easier but also the number of DOE can be dramatically increased, resulting in high reliability of the optimal design result. The proposed automated design method is expected to reduce the design cost and time. Moreover, it can be used to find the optimal solution for various design problems as well as PMSMs. In addition, since the proposed procedure is based on commercial tools, it has a ripple effect that can easily apply optimal design in academia and industry.
Most of the previous studies have been applied to optimal design using metamodel generated in one way. There have been a lot of optimizations recently using a single metamodeling technique such as Kriging and response surface method [10,11,12,13,14,15,16,17,18]. However, since a suitable metamodel is different according to each design problem and condition, it is necessary to select the best metamodel through accuracy evaluation after generating several metamodels. This is because the accuracy of the metamodel must be high to obtain good optimal design results. In this study, metamodels of objective functions and constraints are generated in 11 ways, and the most accurate metamodels are selected through the root mean squared error (RMSE) test, respectively.
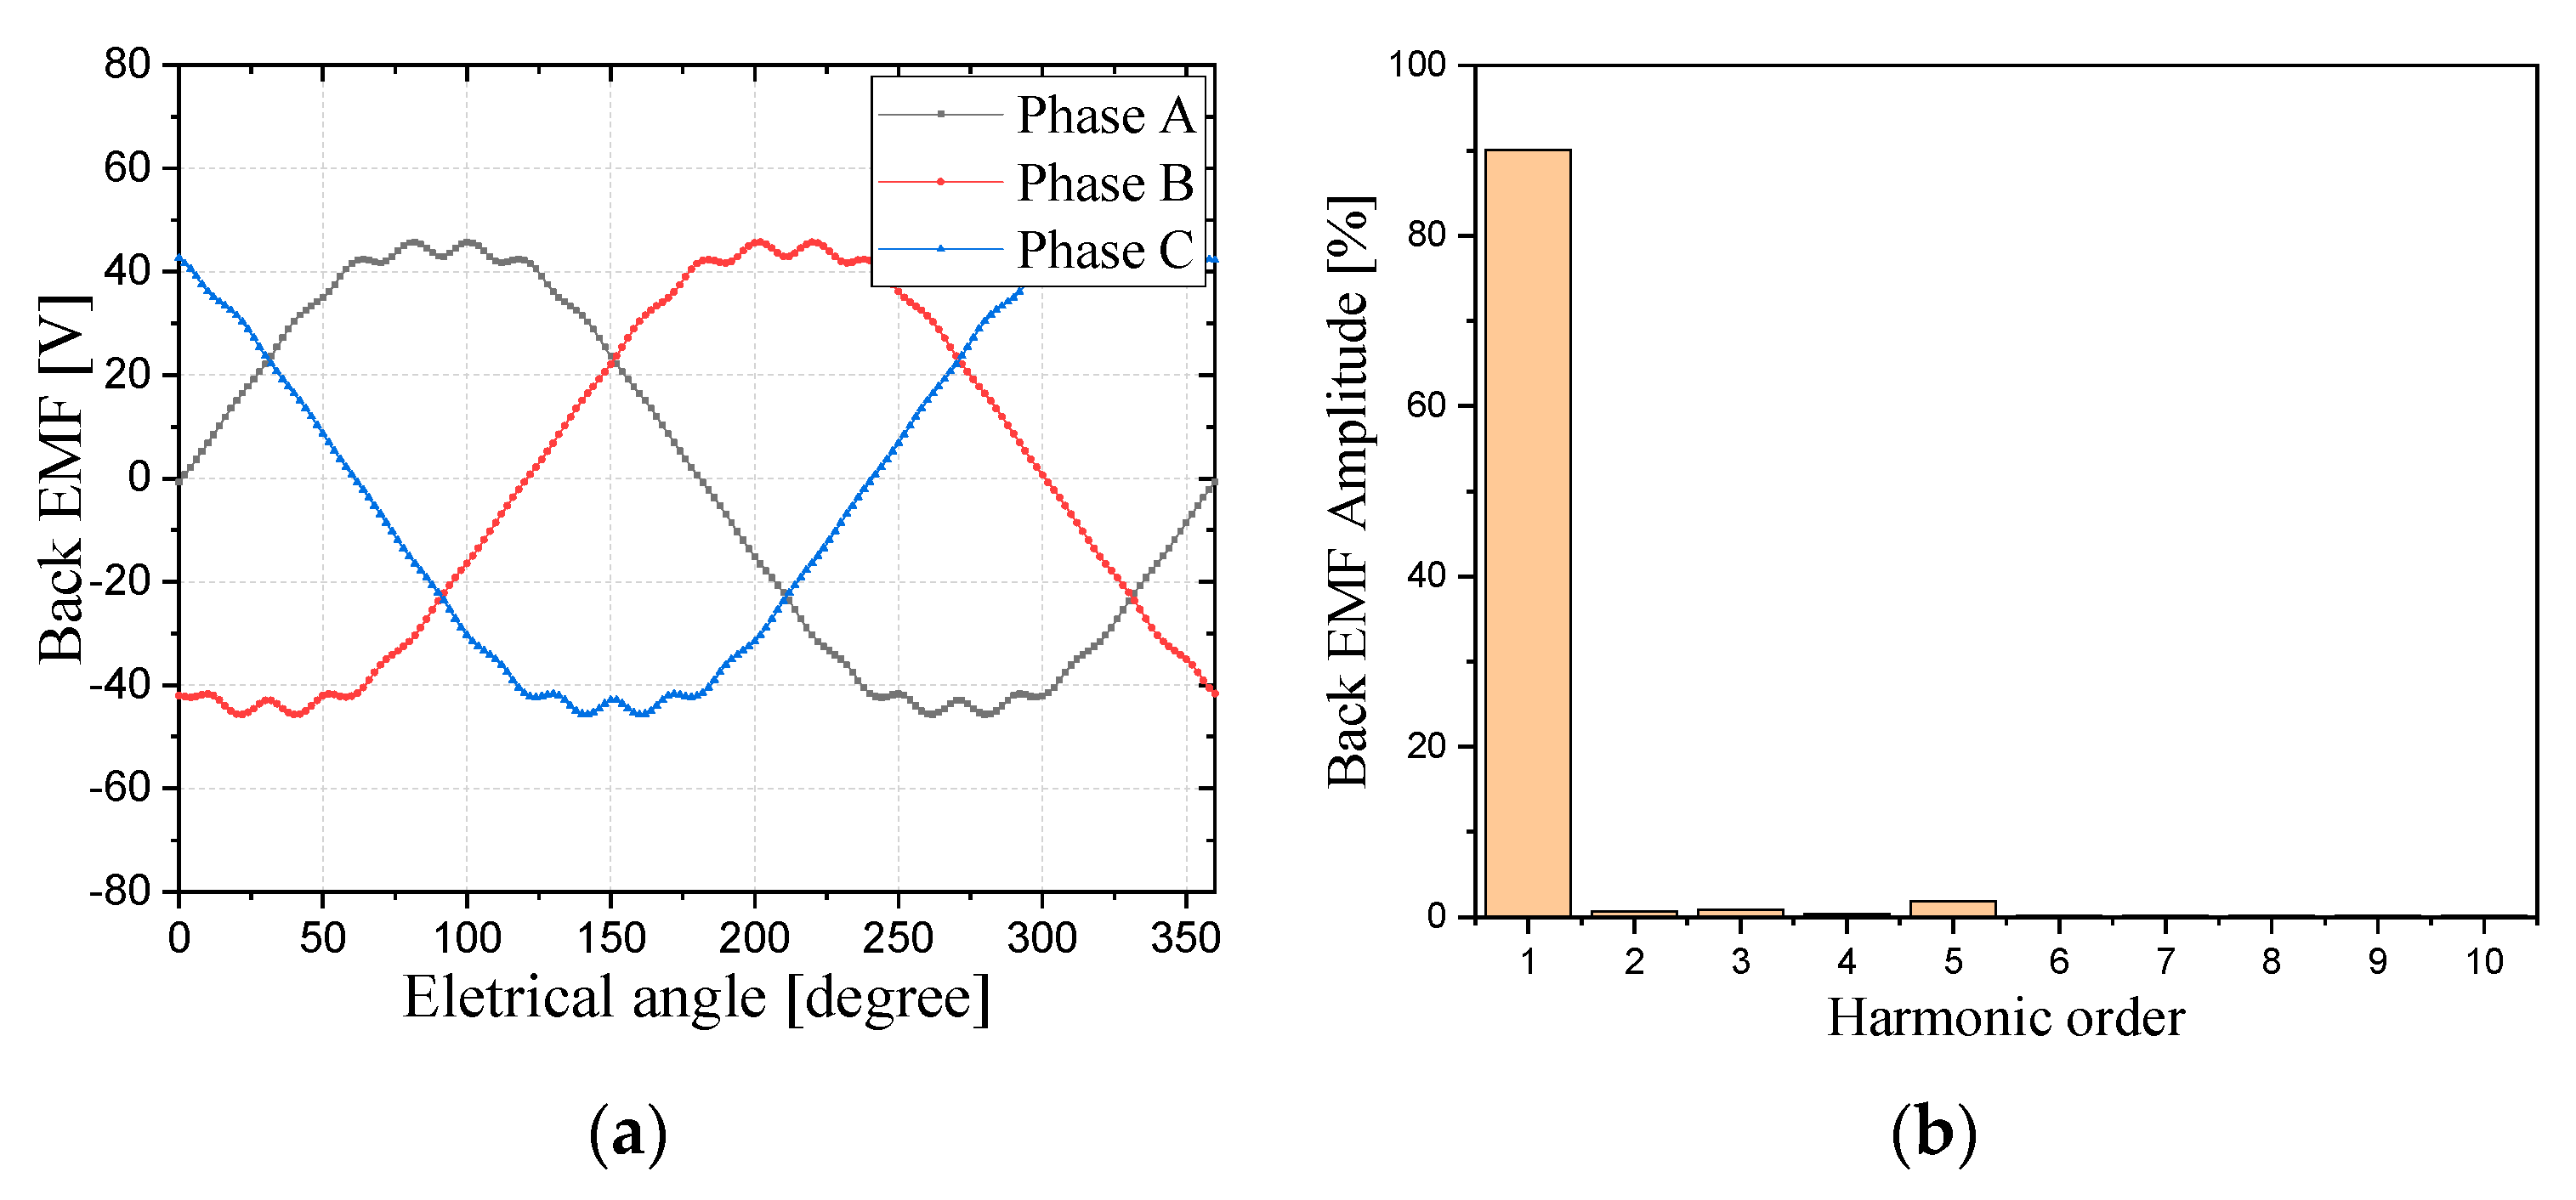
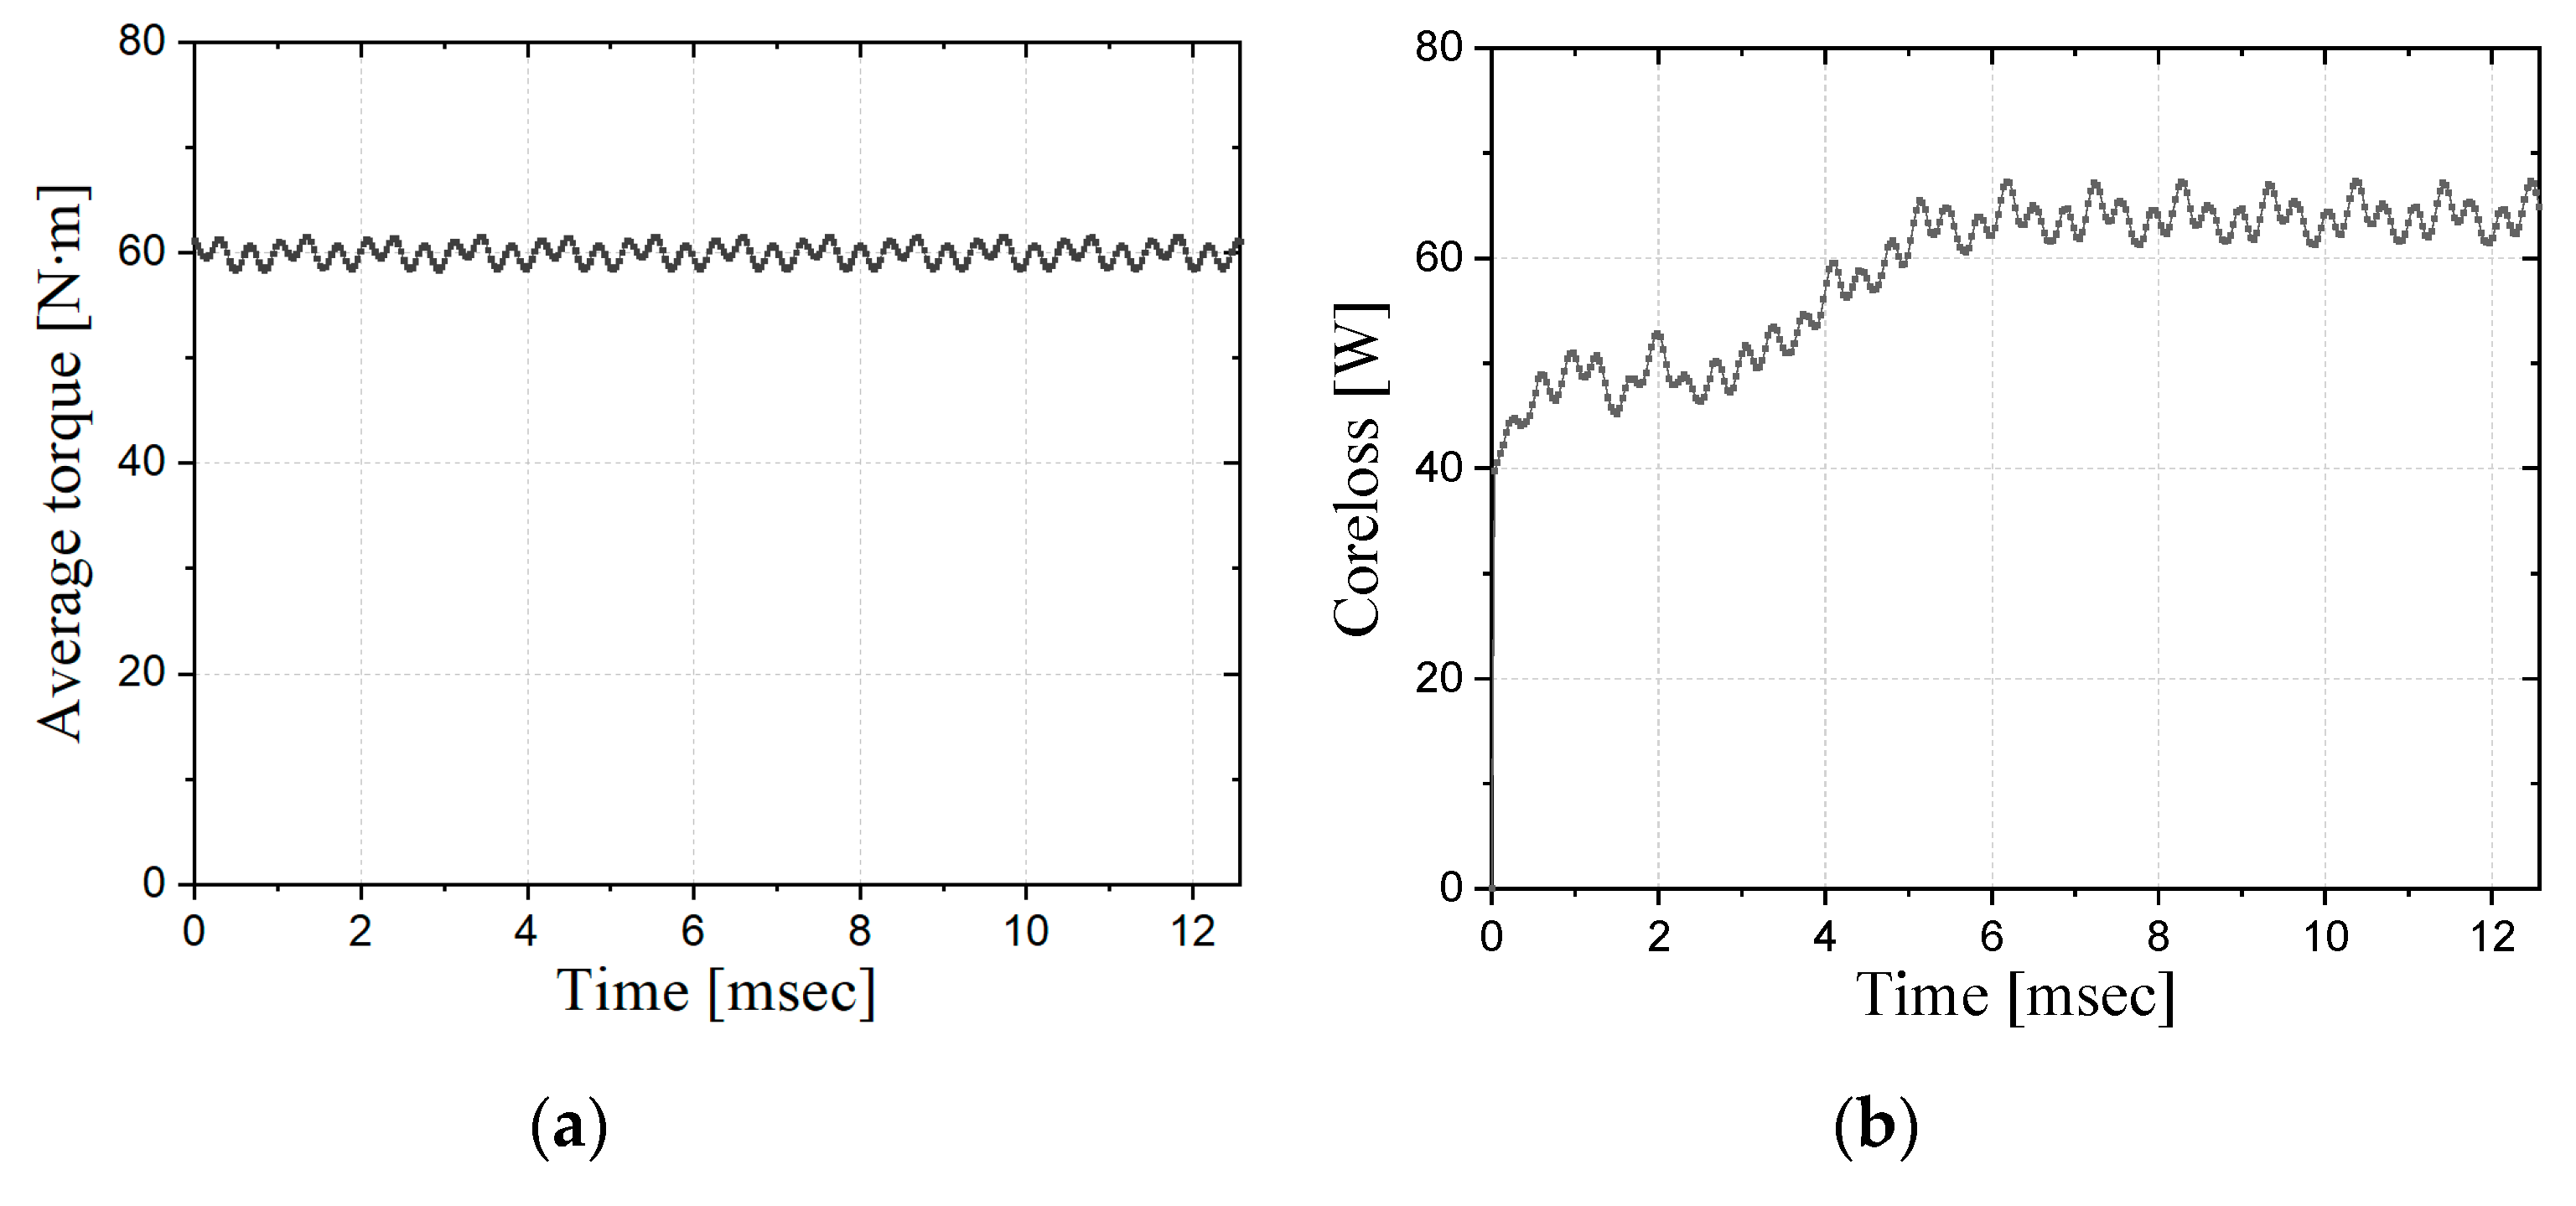
In this study, shape optimization is performed for a PMSM to maximize the torque while maintaining efficiency, torque ripple and THD in the back electromotive force (EMF). First, the design target specification of a PMSM for small electric vehicles is established, and the characteristics of the initial model are analyzed using FEA. To improve the accuracy of the design results, DOE is performed using FEA. After the creation of metamodels using the DOE results, the optimal values are obtained by the optimal algorithm. The optimal Latin hypercube design (OLHD) technique [19] is applied for the DOE, and the appropriate DOE number and test point number are selected to produce accurate metamodels. To perform DOE easily and accurately, this study proposes an automated DOE procedure through linkage between an FEA program and an optimal design program. Using the DOE results, the relationship between the design and output variables are analyzed by screening. To generate an accurate metamodel, the RMSE tests are performed on eleven metamodels for each output variable, and the best metamodels are selected for each output variable. Optimization based on metamodels is performed, and the global optimization algorithm hybrid metaheuristic algorithm (HMA) [20] is utilized as the optimal algorithm. The overall process of this study is represented in a flowchart, as shown in Figure 1.

2. Finite Element Analysis

The target specifications are determined by referring to the Renault’s Twizy with a torque of 57 N∙m and an output power of 13 kW at 2100 rpm. In this study, a PMSM is selected as the design model, and the target output power is 15 kW which should satisfy 60 N∙m at 2387 rpm.

2.1. Initial Model

Figure 2 and Table 1 show the structure and specifications of a 15 kW PMSM for a small electric vehicle, respectively. The PMSM has 8 poles, 36 slots, and distributed winding.
The electromagnetic, mechanical and thermal properties of the 35PN210 core material are shown in Table 2. Core loss is the sum of hysteresis loss, eddy-current loss, and excess loss, and is calculated by Equation (1). The core loss varies with frequency, but the analysis is based on 60 Hz.
P c = K h f ( B m ) 2 + K c ( f B m ) 2 + K e ( f B m ) 1.5  
where P c is the core loss, K h is the hysteresis loss coefficient, K c is the eddy current loss coefficient, K e is the excess loss coefficient, f is the frequency, and B m is the amplitude of the alternating flux component.
The electromagnetic, mechanical and thermal properties of permanent magnets are shown in Table 3. V-shaped N38UH grade NdFeB are applied to concentrate the magnetic flux. The magnetic flux density and coercivity decreased with increasing temperature, but the analysis is conducted at 20 °C.

2.2. No Load Analysis

Characteristic analysis of the initial model is performed by FEA under the no load condition without current excitation. When the rotor of the initial model rotates at the rated speed, back EMF is induced in the stator winding. Since the back EMF simulation is performed while rotating the rotor under the no load condition, the equivalent circuit when the PMSM operates as a generator should be considered, as shown in Figure 3. The voltage equation of the equivalent circuit is shown in Equation (2). However, since no current flows in the armature winding under the no load condition, the terminal voltage and the no load EMF are the same. The back EMF of phase A can be obtained by Equation (3), and the analysis result by FEA is illustrated in Figure 4a.
V ˙ = E 0 ˙ ( j ( X a + X l ) + R a ) I a ˙   [ V ]
where V ˙ is the terminal voltage, E 0 ˙ is the no load EMF, X a is the armature reation reactance, X l is the leakage reactance, R a is the armature resistance and I a . is the load current.
E a = N ω c o s ω t   [ V ]
where E a . is the back EMF of phase A, N is the number of the amarture turns, is the magnetic flux and ω is the electrical angular velocity.
THD is an important factor in the electrical equipment and power systems. THD can be obtained by adding the harmonic components to the fundamental wave components of voltage or current as shown in Equation (4) [21]. A higher THD increases the core loss in electric machines, which can reduce the efficiency and generate excessive heat. The harmonic analysis result of the back EMF waveform is shown in Figure 4b, and the THD of the back EMF calculated by Equation (4) is 3.52%.
V THD = V 2 2 + V 3 2 + V 4 2 + + V n 2   V 1 × 100
where V THD is the THD of the back EMF, V 1 is the RMS voltage of the fundamental frequency and V n is the RMS voltage of nth harmonic.

2.3. Load Analysis

Target specifications are 15 kW and 60 N∙m at 2387 rpm as shown in Table 1. To perform load analysis, a current condition satisfying the target torque of 60 N∙m at 2387 rpm should be found. Through static torque analysis, the current condition is determined as the RMS value of 146 A and phase angle of 25°. As shown in Figure 5a, the average torque is 59.95 N∙m and the torque ripple is 5.09% of torque. The core loss is interpreted as shown in Figure 5b, and total losses are the sum of the core loss and copper loss. The output power of the motor is calculated as the product of torque and angular velocity, and the efficiency can be calculated from the output power and total losses of the motor. The efficiency of the initial model is calculated to be 91.42%.

3. Design Optimization

3.1. Design Process

The design optimization process for maximizing the average torque, while maintaining THD of the back EMF, efficiency, and torque ripple, is shown in Figure 6. The objective function, constraints, thermal condition, and design variables are established, as described in Equations (5)–(9) and Figure 7. To improve the average torque, the average torque is set as both an objective function and a constraint, with a goal of 2% improvement over the initial model. THD of the back EMF and the efficiency are set as constraints to maintain the same level as the initial model. The torque ripple is set below 10%, which is an acceptable level as a traction motor for electric vehicles [22]. To improve the accuracy of the design results, DOE is performed using FEA. Because DOE using FEA requires a significant amount of time and effort, interworking is conducted between the FEA and optimal design programs, which are ANSYS Maxwell and PIAnO, respectively, to automatically perform DOE. When the analysis and extraction of results for one experiment is finished, the values of the design variables are automatically changed to perform the FEA at the next DOE point. From the DOE results, sensitivity analysis between design variables and output variables is conducted using screening, and each metamodel for output variables is generated. RMSE test was conducted to evaluate the predictive performance of the metamodels, and the best metamodel is selected for each output variable. Based on the selected metamodels, the optimal values are obtained using the HMA.
Objective   function
Maximize   the   average   torque
Mechanical   Constraints
Average   torque 61.152   N · m   Torque   ripple 10   %
Electrical   Constraints
THD   of   the   back   EMF 3.414   % Efficiency 91.42   %
Thermal   condition
Reference   temperature = 20   C °
Design   variables   ( based   on   the   value   of   the   initial   model )
4   mm DV 1   ( Barrier   length ) 10   mm 1.0   mm DV 2   ( Rib   thickness ) 0.5   mm 1.0   mm DV 3   ( Teeth   width ) 0   mm 0   mm DV 4   ( Teeth   thickness ) 1.0   mm 0   mm DV 5   ( Barrier   gap ) 2.0   mm
The mechanical constraints of the barrier length are set from a range that facilitates the flow of magnetic flux to a range that inhibits the flow of magnetic flux very much, as shown in Figure 8a. Rib thickness is set to be at least 1 mm in consideration of workability at manufacture and mechanical rigidity at high speed, as shown in Figure 8b. Figure 8c shows the mechanical constraints of the teeth width, and the range is set so that the slot is smaller than the initial model and maintains the proper fill factor. The range of teeth thickness is set up to reduce the saturation of the magnetic flux at the tip of the teeth and maintain the proper fill factor, as shown in Figure 8d. Barrier gap size affects the formation of magnetic flux and the motor performance since the permanent magnet position also changes. Therefore, its mechanical constraints are set as shown in Figure 8e.

3.2. Automated DOE Procedure

To perform DOE, the shape of design variable should be changed. However, when DOE is processed manually, the shape of each model is drawn using the CAD tool. Next, the designed shape should be imported into the FEA program and the FEA should be performed for each model. After FEA, the post process is required to calculate the desired result. As manual DOE requires a lot of effort and time, this study suggests the automation of the DOE process. First, the Maxwell’s parametric sweep setup function is used to change the shape of design variables without using the CAD tool. The use of this function can change the shape of the FEA model by inputting numerical values in the Maxwell program. Next, Maxwell’s Macro function is used to perform DOE using PIAnO, an optimal design program. As the design variables change, the vbscript and batch files are created to automatically change the shape of the FEA model. In addition, vbscript and batch files are generated for FEA under the no load and load conditions for each experiment. Vbscript and batch files also are generated to output and quantify the torque, core loss and FFT analysis results of the back EMF obtained through FEA. The files created through the Macro function are shown in Figure 9. Next, the interface configuration between Maxwell and PIAnO for automation is shown in Figure 10. To process DOE in PIAnO, the files created in Maxwell are imported as shown in Figure 10a, and the script for calculating the output variables is shown in Figure 10b.

3.3. Design of Experiment

The number of experiments and the number of test points are determined in three steps [23]. First, the number of experiments should be selected according to the number of design variables. When the number of design variables is ten or less, the number of experimental points is determined by Equation (10),
nEXP > 1.5 × nSAT = 1.5 × ( nDV + 1 ) × ( nDV + 2 ) 2  
where nEXP is the number of DOE, nSAT is the number of saturation, and nDV is the number of design variables.
Next, the number of DOEs that can be used as test points for evaluating the accuracy of the metamodel should be secured by Equation (11):
nEXP > min [ ( nDV + 1 ) × ( nDV + 2 ) 2 ,   10 × nDV ] + ( 5 × nDV )
Because five design variables are used in this study, the number of DOE should be more than 46 by Equations (10) and (11). Therefore, the number of DOE is determined to be 50, which is a multiple of the design variables. If fifty experiments are manually operated, a significant amount of effort and time would be required. However, in this study, automation is implemented so that DOE can be easily developed and design cost can be reduced. Finally, the number of test points for evaluating the accuracy of the metamodel is determined to be five by Equation (12),
nEXP _ ts > min [ nEXP × 10 % ,   10 × nDV ]  
where nEXP_ts is the number of test points.
The OLHD technique is applied to determine the sampling point of the DOE. OLHD is a type of DACE sampling technique developed for computational experiments. In the computer experiment, because there are no random errors, only the bias error should be considered and the test point should be spread evenly inside the design area. OLHD improves the space-filling property by using the optimum conditions and spreads the test points evenly; thus, even if there are several test points, they can be selected efficiently. DOE for fifty test points selected by OLHD is easily performed using the automated program. Sensitivity analysis is conducted to analyze the correlation between the design variables and design results. Figure 11 shows that the barrier length has the highest impact on the output variables among the five design variables. However, as shown in Table 4, even the most optimal experimental point among the 50 experiments does not satisfy the constraints. Therefore, metamodeling based on DOE results is conducted.

3.4. Metamodeling

Five test points are selected to evaluate the metamodel, and eleven metamodels are generated for each output variable. The metamodel can be classified into a regression model and an interpolation model. The regression model, i.e., polynomial regression (PR), radial basis function regression (RBFr), ensemble of decision trees (EDT), and multi-layer perceptron (MLP), smoothens the noise data because they do not pass through the test points exactly. Therefore, this model is useful for real experiments with random errors. PR allows free choice of regression terms [24]. RBF is easy to design and generalize, and has strong tolerance to input noise [25]. EDT is advantageous for expressing nonlinearity in large amounts of data. MLP is type of deep learning algorithm and has the advantage of being able to represent the nonlinear relationships between input and output variables [26]. In contrast, the interpolation model, i.e., Kriging and radial basis function interpolation (RBFi), is well suited for function approximation using analytical results without random errors because it passes through the test points exactly. The estimated equation of the Kriging model was defined to eliminate bias and thereby minimize error variance [27]. Thus, a numerically robust model is provided. RBFi was first popularized in the machine learning community and has been used in computer graphics [28].
The accuracy of the metamodel is a very important factor in the optimal design using metamodel [12]. This is because the predictive performance of the metamodel affects the reliability of the optimal design. Most of the existing studies have been metamodeled by a single method such as Kriging and RSM, and the accuracy evaluation has not been performed [10,11,12,13,14,15,16,17,18]. In this study, however, metamodels for the objective function and constraints are generated in 11 ways provided by PIAnO, and the best metamodels are selected, respectively, by comparing the RMSE test results to evaluate the metamodel accuracy. The predictive performance of the metamodel is evaluated by the RMSE test and is calculated by Equation (13) [23],
RMSE = 1 nEXP _ ts i = 1 nEXP _ ts [ y ( X i ) y ^ ( X i ) ] 2
where y ( X i ) is the value of the real function and y ^ ( X i ) is the value of the metamodel.
Through the RMSE test, the predictive performances of the metamodels are evaluated for the output variables. The RMSE test showed the best predictive performance of RBFr as a metamodel of the average torque as shown in Table 5. Similarly, the RMSE tests are conducted on the metamodel for efficiency, torque ripple, and THD of the back EMF. Based on the test results, the metamodels with the best predictive performance for each output variable are selected for use in the optimal design, as shown in Table 6.

3.5. Design Optimization Based on Metamodel

The HMA, a global optimization algorithm, is used for the optimal design based on the metamodel. The HMA was proposed in 2016 by Park [20]. HMA can determine the global optimum faster than other global optimizers owing to the combined advantages of improved constrained differential evolution and modified cuckoo search.
The optimum design results predicted from the metamodel based HMA are shown in Table 7 and verified through FEA. The predicted results showed that the average torque, THD of the back EMF, efficiency and torque ripple results are similar to the FEA results. Therefore, the automated DOE procedure and the generation and evaluation of the metamodel were verified. The average torque of the optimal model was 2.5% better than the initial model, and the torque ripple increased slightly, as shown in Figure 12. THD of the back EMF and efficiency set by the constraints were slightly improved. Although the torque ripple of the optimal model is 7.822%, it is very acceptable as a traction motor for electric vehicles [22].

3.6. Consideration of Optimal Design Results

Figure 13 and Figure 14 show the flux distributfion and flux density of the initial and optimal models, respectively. In comparison to the initial model, the rib thickness and barrier length of the optimal model were reduced, and the barrier gap was increased. As the rib thickness decreased, the unnecessary flux flow between the north pole and south pole through the rotor rib was reduced. In addition, the flux flow was smoothly improved owing to the reduction in barrier length, and consequently, more flux passed through the stator core. The improvements in the magnetic flux flow and the change in reluctance can be considered to be the cause of the increase in the back EMF and torque [29]. Owing to the improvements of in the flux flow, the back EMF of the optimum model was 35.0 V, which showed an improvement of 7.4% in comparison to 32.6 V of the initial model, as shown in Figure 15. In addition, owing to the sinusoidal improvement in the waveform of the back EMF of the optimal model, the THD was slightly improved from 3.414% to 3.065%.

4. Conclusions

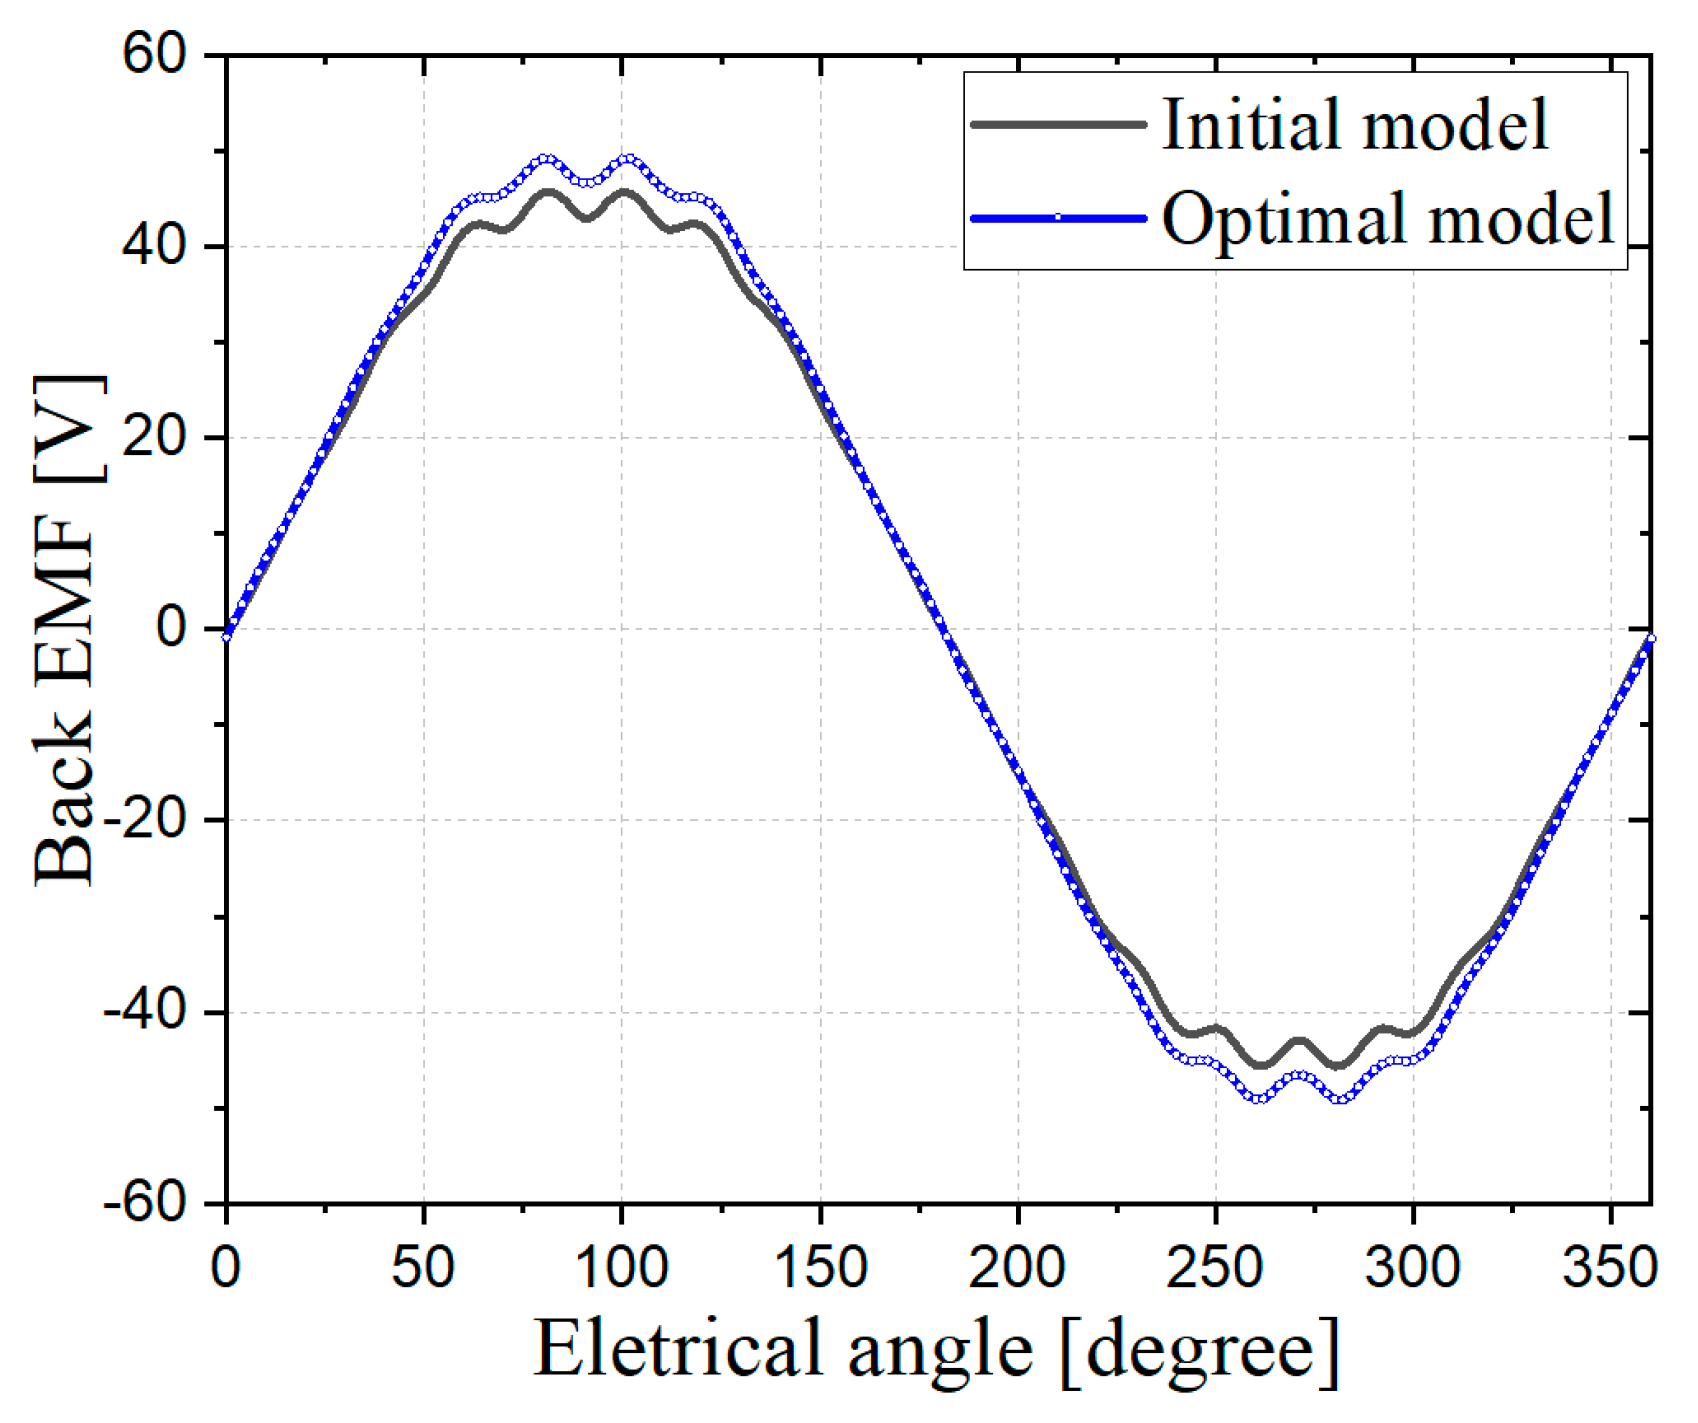
This paper presented shape optimization of a PMSM for small electric vehicles to maximize torque while maintaining efficiency, torque ripple and THD of the back EMF. To improve the accuracy of the optimal design results, DOE was performed using FEA. This study proposed an automated DOE procedure through linkage between an FEA and optimal design programs to perform DOE easily and accurately. Parametric modeling was performed for the FEA model to change the shape variables automatically, and automation-related files were created using Maxwell’s Macro function. In addition, an interface was established to link the FEA program with PIAnO, an optimal design program. Using the built-in automation program, 50 FEAs for the experimental points selected by OLHD were easily performed. From the DOE results, the relationship between the design and output variables was analyzed by screening. Among the five design variables, the barrier length was found to have the greatest effect on the output variables. Eleven metamodels were created for each output variable and RMSE test was conducted to evaluate the predictive performance of the metamodels. Consequently, the metamodels with the best predictive performance for each output variable were selected. Finally, the optimization design based on the metamodel was determined using the HMA to find the global optimum. The objective average torque improved by 2.5% over the initial model while satisfying all the constraints. The optimal design results were finally verified by FEA.
The proposed automated design method is expected to reduce design cost and time. Moreover, it can be used to find the optimal solution for various design problems as well as PMSMs. By following the procedure given below, the proposed optimal design method can be applied to any type of motor without any special constraints. First, in order to change the shape of the optimum design variable automatically, the dimension of the optimal design variable should be set using Maxwell’s parametric sweep setup function. Next, determine the values that you want to extract from Maxwell and create vbscript and batch files to extract them. Finally, an interface setting must be performed to accommodate Maxwell’s output values in an optimization program called PIAnO.
Optimization of multi-physics systems by simulation takes significant computing time for each simulation run, and its process depends on numerous runs, making it difficult and expensive [30]. However, using the automated DOE procedure suggested in this study can reduce design cost and time, so I think multi-physics analysis is possible in the near future. In the next project, I will consider multi-physics analysis that takes into account the mechanical and thermal properties.

Funding

This study was supported by research fund from Honam University, 2017 and the National Research Foundation of Korea (NRF). Grant funded by the Korea government (MSIT). (No. NRF-2018R1C1B5046117).

Acknowledgments

The author express gratitude to PIDOTECH and FRONTIS for their technical support.

Conflicts of Interest

The authors declare no conflict of interest.

Abbreviations

AcronymDescriptor
DOEDesign of Experiments
EDTEnsemble of Decision Trees
FEAFinite Element Analysis
HMAHybrid Metaheuristic Algorithm
MECMagnetic Equivalent Circuits
MLPMulti-layer Perceptron
OLHDOptimal Latin Hypercube Design
PMSMPermanent Magnet Synchronous Motor
PRPolynomial Regression
RBFiRadial Basis Function Interpolation
RBFrRadial Basis Function Regression
RMSERoot Mean Squared Error
THDTotal Harmonic Distortion

References

  1. Guo, H.; Tian, W.; Xaiofeng, D. Multi-objective Optimal Design of Permanent Magnet Synchronous Motor for High Efficiency and High Dynamic Performance. IEEE Access 2018, 6, 23568–23581. [Google Scholar]
  2. Feng, G.; Lai, C.; Kar, N.C. An Analytical Solution to Optimal Stator Current Design for PMSM Torque Ripple Minimization with Minimal Machine Losses. IEEE Trans. Ind. Electron. 2017, 64, 7655–7665. [Google Scholar] [CrossRef]
  3. Dang, L.; Bernard, N.; Bracikowski, N.; Berthiau, G. Design Optimization with Flux Weakening of High-Speed PMSM for Electrical Vehicle Considering the Driving Cycle. IEEE Trans. Ind. Electron. 2017, 64, 9834–9843. [Google Scholar] [CrossRef]
  4. Ilka, R.; Alinejad-Beromi, Y.; Yaghobi, H. Techno-economic Design Optimisation of an Interior Permanent-Magnet Synchronous Motor by the Multi-Objective Approach. IET Electr. Power Appl. 2018, 12, 972–978. [Google Scholar] [CrossRef]
  5. Song, T.; Zhang, Z.; Liu, H.; Hu, W. Multi-objective Optimisation Design and Performance Comparison of Permanent Magnet Synchronous Motor for EVs based on FEA. IET Electr. Power Appl. 2019, 13, 1157–1166. [Google Scholar] [CrossRef]
  6. Krasopoulos, C.T.; Beniakar, M.E.; Kladas, A.G. Multicriteria PM Motor Design based on ANFIS Evaluation of EV Driving Cycle Efficiency. IEEE Trans. Electr. 2018, 4, 525–535. [Google Scholar] [CrossRef]
  7. Lee, J.H.; Kim, J.W.; Song, J.Y.; Kim, Y.J.; Jung, S.Y. A Novel Memetic Algorithm Using Modified Particle Swarm Optimization and Mesh Adaptive Direct Search for PMSM Design. IEEE Trans. Magn. 2016, 52, 7001604. [Google Scholar] [CrossRef]
  8. Zhao, W.; Wang, X.; Gerada, C.; Zhang, H.; Liu, C.; Wang, Y. Multi-Physics and Multi-Objective Optimization of a High Speed PMSM for High Performance Application. IEEE Trans. Magn. 2018, 54, 8106405. [Google Scholar] [CrossRef]
  9. Kim, S.W.; Kang, K.B.; Yoon, K.C.; Choi, D.H. Design Optimization of an Angular Contact Ball Bearing for the Main Shaft of a Grinder. Mech. Mach. Theory 2016, 104, 278–302. [Google Scholar] [CrossRef]
  10. Chung, S.U.; Kim, J.W.; Chun, Y.D.; Woo, B.C.; Hong, D.K. Fractional Slot Concentrated Winding PMSM with Consequent Pole Rotor for a Low-Speed Direct Drive Reduction of Rare Earth Permanent Magnet. IEEE Trans. Energy Convers. 2015, 30, 103–109. [Google Scholar] [CrossRef]
  11. You, Y.M.; Chung, D.W. Optimal Design of a Permanent Magnet Synchronous Motor to Improve Torque and Demagnetization Characteristics. J. Magn. 2017, 22, 423–429. [Google Scholar] [CrossRef]
  12. Kang, G.J.; Park, C.H.; Choi, D.H. Metamodel-based Design Optimization of Injection Molding Process Variables and Gates of an Automotive Glove Box for Enhancing its Quality. J. Mech. Sci. Technol. 2016, 30, 1723–1732. [Google Scholar] [CrossRef]
  13. Zhang, B.S.; Song, B.W.; Mao, Z.Y.; Tian, W.L.; Li, B.Y.; Li, B. Novel Parametric Modeling Method and Optimal Design for Savonius Wind Turbines. Energies 2017, 10, 301. [Google Scholar] [CrossRef] [Green Version]
  14. You, Y.M.; Lipo, T.A.; Kwon, B.I. Optimal Design of a Grid connected to Rotor Type Doubly Fed Induction Generator for Wind Turbine Systems. Energies IEEE Trans. Magn. 2012, 48, 3124–3127. [Google Scholar] [CrossRef]
  15. You, Y.M.; Jung, D.W. A Study on Performance Improvement of Polygon Mirror Scanner Motor. J. Electr. Eng. Technol. 2019, 14, 745–755. [Google Scholar] [CrossRef]
  16. Kwon, J.W.; Lee, J.H.; Zhao, W.L.; Kwon, B.I. Flux-Switching Permanent Magnet Machine with Phase-Group Concentrated-Coil Windings and Cogging Torque Reduction Technique. Energies 2018, 11, 2758. [Google Scholar] [CrossRef] [Green Version]
  17. Chai, W.P.; Lipo, T.A.; Kwon, B.I. Design and Optimization of a Novel Wound Field Synchronous Machine for Torque Performance Enhancement. Energies 2018, 11, 2111. [Google Scholar] [CrossRef] [Green Version]
  18. Li, Y.K.; Song, B.W.; Mao, Z.Y.; Tian, W.L. Analysis and Optimization of the Electromagnetic Performance of a Novel Stator Modular Ring Drive Thruster Motor. Energies 2018, 11, 1598. [Google Scholar] [CrossRef] [Green Version]
  19. Butler, N.A. Optimal and Orthogonal Latin Hypercube Designs for Computer Experiments. Biometrika 2001, 88, 847–857. [Google Scholar] [CrossRef]
  20. Park, K.B. An Efficient Hybrid Metaheuristic Algorithm for Solving Constrained Global Optimization Problems. Ph.D. Thesis, Hanyang University, Seoul, Korea, February 2016. [Google Scholar]
  21. Narayanan, G.; Ranganathan, V.T. Analytical Evaluation of Harmonic Distortion in PWM AC Drives Using the Notion of Stator Flux Ripple. IEEE Trans. Power Elctron. 2005, 20, 466–474. [Google Scholar] [CrossRef]
  22. Chau, K.T. Electric Vehicle Machines and Drives: Design, Analysis and Application, 1st ed.; Wiley-IEEE: Hoboken, NJ, USA, 2015; p. 243. [Google Scholar]
  23. PIDOTECH Inc. PIAnO User’s Manuals and Tutorials; PIDOTECH Inc.: Seoul, Korea, 2019. [Google Scholar]
  24. Myers, R.H.; Montgomery, D.C. Response Surface Methodology: Process and Product Optimization Using Designed Experiments, 2nd ed.; John Wiley & Sons: New York, NY, USA, 1995. [Google Scholar]
  25. Orr, M.J.L. Introduction to Radial Basis Functions Networks; Edinburgh University: Edinburgh, UK, 1996. [Google Scholar]
  26. Zhang, L.; Tian, F. Performance Study of Multilayer Perceptrons in a Low-Cost Electronic Nose. IEEE Trans. Instrum. Meas. 2014, 36, 1670–1679. [Google Scholar] [CrossRef]
  27. Sacks, J.; Welch, W.J.; Mitchell, T.J.; Wynn, H.P. Design and Analysis of Computer Experiments. Stat. Sci. 1989, 4, 409–435. [Google Scholar] [CrossRef]
  28. Anjyo, K.; Lewis, J.P. RBF Interpolation and Gaussian Process Regression through an RKHS Formulation. J. Math Ind. 2011, 3, 63–71. [Google Scholar]
  29. Du, X.; Liu, G.; Chen, Q.; Xu, G.; Xu, M.; Fan, X. Optimal Design of an Inset PM Motor With Assisted Barriers and Magnet Shifting for Improvement of Torque Characteristics. IEEE Trans. Magn. 2017, 53, 8109204. [Google Scholar] [CrossRef]
  30. Robert, F.; Bensetti, M.; Santos, V.D.; Dufour, L.; Dessante, P. Multiphysics Modeling and Optimization of a Compact Actuation System. IEEE Trans. Ind. Electron. 2017, 64, 8626–8634. [Google Scholar] [CrossRef] [Green Version]
Figure 1. Flowchart of the overall research procedure.
Energies 12 04673 g001
Figure 2. Structure of initial permanent magnet synchronous motor (PMSM) model (1/4 model).
Energies 12 04673 g002
Figure 3. The equivalent circuit of PMSM (generator mode).
Energies 12 04673 g003
Figure 4. The back EMF of initial model under the no load condition: (a) Waveform; (b) Harmonic.
Energies 12 04673 g004
Figure 5. Torque and core loss of the initial model under the load condition: (a) Torque; (b) Core loss.
Energies 12 04673 g005
Figure 6. Optimization design process.
Energies 12 04673 g006
Figure 7. Shape design variables.
Energies 12 04673 g007
Figure 8. Mechanical constraints of design variables: (a) DV1 (barrier length); (b) DV2 (rib thickness); (c) DV3 (teeth width); (d) DV4 (teeth thickness); (e) DV5 (barrier gap). Notes: The values of the design variables are relative to the values of the initial model.
Energies 12 04673 g008
Figure 9. Vbscript, batch, and output files using the Macro function of Maxwell.
Energies 12 04673 g009
Figure 10. Interface configuration with Maxwell using PIAnO: (a) Interface setting; (b) Script for calculating output variables.
Energies 12 04673 g010aEnergies 12 04673 g010b
Figure 11. Sensitivity analysis using screening.
Energies 12 04673 g011
Figure 12. Torque waveforms.
Energies 12 04673 g012
Figure 13. Flux distribution under no load condition: (a) Initial model; (b) Optimal model.
Energies 12 04673 g013
Figure 14. Flux density under no load condition: (a) Initial model; (b) Optimal model.
Energies 12 04673 g014
Figure 15. Back EMF waveforms.
Energies 12 04673 g015
Table 1. Specifications of analysis model.
ItemsUnitValue
Required specificationMax. output powerkW15
Max. torqueN∙m60
Rated speedrpm2387
ElectricalContinuous currentArms146
Current phase angle°25
Winding specification-ø 0.9, 11 turns (3 strand)
MechanicalNo. of poles and slotsea8/36
Outer diameter of statormm202
Inner diameter of statormm140
Outer diameter of rotormm138
Inner diameter of rotormm40
Air-gapmm1
Laminationmm45
ThermalReference temperature°C20
Table 2. Properties of electrical steel.
ItemsUnitValue
Grade (Manufacturer)-35PN210 (POSCO)
ElectromagneticAnisotropy type-Isotropic
Flux density at 2.5 kA/mT1.56
Flux density at 5 kA/mT1.65
ConductivityS/m1,694,915
FrequencyHz60
Hysteresis loss coefficientw/m385.0512
Eddy-current loss coefficientw/m30.34153
excess loss coefficientw/m34.94904
MechanicalThicknessmm0.35
Mass densitykg/m37600
ThermalReference temperature°C20
Table 3. Properties of permanent magnets.
ItemsUnitValue
Grade-N38UH
ElectromagneticMagnetizing direction-Parallel
Permeability type-Anisotropic
Relative permeability-1.05
Residual inductionT1.23
CoercivitykA/m−932.193
Bulk conductivityS/m625,000
MechanicalThicknessmm5
Lengthmm20
Mass densitykg/m37650
ThermalReference temperature°C20
Reversible temp. coefficient of induction%/°C−0.12
Reversible temp. coefficient of coercivity%/°C−0.465
Table 4. DOE results.
ItemsUnitInitial ModelBest Solution of DOE
Design variablesBarrier lengthmm0−0.642
Rib thicknessmm00.37
Teeth widthmm0−0.34
Teeth thicknessmm00.337
Barrier gapmm00.76
Design resultsAverage TorqueN∙m59.9559.9
THD of the back EMF%3.4143.245
Efficiency%91.4291.41
Torque ripple%5.0864.131
Table 5. RMSE test results of metamodels for the objective function.
RankMetamodelRMSE Test Value
1RBFr0.34648496
2RBFi0.38436657
3PR (Backward stepwise regression)0.40021405
4PR (Simple cubic model)0.44883739
5PR (Full quadratic model)0.50425469
6PR (Forward stepwise regression)0.68032589
7PR (Linear model)1.15518494
8PR (Simple quadratic model)1.21540869
9Kriging1.30829623
10EDT1.32713329
11MLP1.38523885
Table 6. Selected metamodels of the output variable by RMSE test.
Output VariableMetamodelRMSE Test Value
Average torqueRBFr0.346485
THD of the back EMFKriging1.276249
EfficiencyMLP0.025028
Torque rippleKriging0.228137
Table 7. Optimization results.
ItemsUnitInitial ModelOptimal ModelOptimal Model (FEA)
(FEA)(Predicted)
Design variablesBarrier lengthmm0−0.356−0.356
Rib thicknessmm0−0.893−0.893
Teeth widthmm0−0.236−0.236
Teeth thicknessmm00.2690.269
Barrier gapmm01.3881.388
Design resultsAverage torqueN∙m59.9561.0361.43
THD of the back EMF%3.4143.4243.065
Efficiency%91.4291.5791.61
Torque ripple%5.0867.2587.822

