1. Introduction
Listed by the World Economic Forum as one of the biggest threats to the world’s economies, environment and people, water scarcity sets an unprecedented challenge to water management and energy policy makers [
1]. The 2007 European Commission Communication on water scarcity and droughts stated that these issues are now a major challenge, and climate change is expected to make matters worse [
2]. Despite water availability above the European average, mainland Portugal is characterized by a severe seasonal concentration of precipitation, unevenly distributed water resources, and frequent droughts and floods. The water supply in Portugal, namely in the Algarve region, is under stress, and the problem is expected to increase with climate change [
3].
Water desalination technologies, namely seawater reverse osmosis (SWRO), have matured in the last decade from being a last resort solution to becoming strong candidates in water resource diversification. This shift was made possible by bringing down desalination’s energy consumption, its main drawback, towards the thermodynamic limit and plateauing at around 3 kWh/m
3 [
4,
5].
The main recent developments have been in the pairing of SWRO desalination plants with renewable energy sources (RES) and in dealing with the challenges that intermittent power sources entail. It has been shown [
6,
7] that solar photovoltaic (PV) and wind turbines are two of the strongest candidates to power low carbon-emission desalination.
Gude et al. [
8] suggested a holistic approach of coupling RES with technologies for the recovery, reuse and recycling of both energy and water in order to achieve a sustainable path to meet the world’s energy and water needs. The authors carried out a review on the possible configurations of RES to drive different desalination technologies, and they concluded that the selection of these configurations depends on several factors (plant size, feed water salinity, remoteness, availability of grid power, technical infrastructure, and type and potential of the local RES) [
8]. Khan et al. [
9] reviewed the current status of using RES for small and large-scale water desalination plants. The authors focused on the use of wind and PV power with reverse osmosis (RO) and concluded that solar and wind profiles have a strong effect on the economics of RES desalination. In addition, the option of integrating wind and PV power is more economical than using either of these technologies alone, and the optimization of this RES integration is crucial to lower the production cost of water [
9].
Case studies in pairing reverse osmosis plants with RES have been dedicated to locations of varying scales: islands [
10,
11,
12], edge-of-grid rural communities [
13], and large coastal cities [
14,
15,
16].
Mentis et al. [
10] considered the arid islands in the Aegean Sea. Comparing desalination technologies and local RES potential, the authors opted for an RO plant powered by wind turbines and PV panels. This system was dimensioned in order to supply 100% of the local water demand within the Greek RES legislation framework. The resulting production cost of water and suggested selling price (from 145 to 260 c€/m
3) indicate that RES-powered desalination is a suitable alternative to the expensive and polluting solution of water transportation from the mainland [
10]. In a study by Segurado et al. [
11], an integrated power and water supply system was proposed for the island of S. Vicente, in Cape Verde, in order to increase RES penetration. The authors proposed a methodology to optimize the size and operational strategy of this system—a wind-powered desalination and pumped hydro storage system. The results showed that RES penetration could reach 84%, with almost 100% of wind-powered desalination water. The power and water production costs decreased by 27%, and the CO
2 emissions decreased by 67% in relation to the values foreseen for 2020 [
11]. Giudici et al. [
12] proposed a dynamic multi-objective approach to optimize the operation of an integrated water-power system of small off-grid islands. The case study considered was the island of Ustica, in Italy. The results showed that the optimal dynamic solutions able to satisfy the whole water demand allowed for RES penetrations up to 40%, reductions of net present cost of about 2–3 M€, and CO
2 emission reductions of more than 200 ton/year [
12].
Fornarelli et al. [
13] compared seven energy configurations (consisting of centralized or decentralized PV panels, wind turbines, and a connection to the grid) to determine the most cost-effective solution to power a brackish water RO desalination plant, dimensioned to supply a rural community in the coastal town of Denmark, Australia. RES intermittency was accounted for by allowing the plant feed flow rate and operating pressure to vary within admissible limits. The results showed that the inclusion of 2.4 MW of wind and 2.8 MW of PV power reduced the levelized cost of energy by 47% in relation to the current system [
13].
Vakilifard et al. [
14] developed a multi-period long-term planning model for an integrated urban water and energy supply system. Grid power and the surplus output of grid connected residential PV panels were considered as energy sources for a desalination-based water supply system. The optimal operational scheduling of the system was determined while considering the fluctuations of the available RES. The case study considered was the city of Perth, Australia. The results showed a 10% reduction in the levelized cost of water (reaching 184 c€/m
3) due to the operation flexibility and the decentralized configuration considered. Furthermore, the addition of a flexible water-related energy load to the existing power grid at the time of surplus PV generation significantly increased the potential uptake of this technology over the long-term horizon [
14].
In July 2009, in the municipality of El Prat del Llobregat, a desalination plant was inaugurated to provide fresh water to the 4.5 million inhabitants of the Barcelona metropolitan area. The plant has a capacity of 200,000 m
3/day and is able to supply about 20% of the total needs of the area. The plant has 1.3 MW of solar PV installed on its rooftops [
15]. The total investment was about 230 M€, covered with contributions by the European Union’s Cohesion Fund (150 M€) and from Spain’s Ministry of Environment (52 M€). The company operating the water supply concession defrayed 28 M€, 12.2% of the total investment [
16].
This study aimed to assess if SWRO powered by a hybrid of RES and grid power is a viable solution to guarantee water security in mainland Portugal, namely through a novel cost structure. The Algarve region was chosen as a case study because it is particularly water stressed and subject to highly varying demographics depending on the season. Three scenarios were considered:
A baseline scenario, where one desalination plant supplies the whole Algarve and is powered exclusively by the grid.
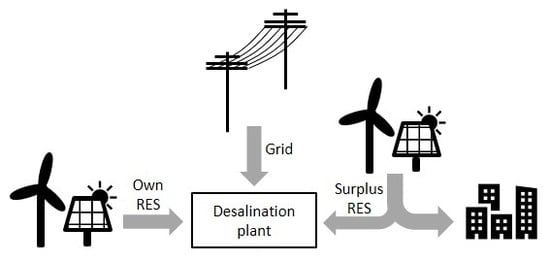
A centralized scenario, where one desalination plant supplies the whole Algarve and is powered by three different power sources (excess RES, the plant’s own production RES and grid power as backup).
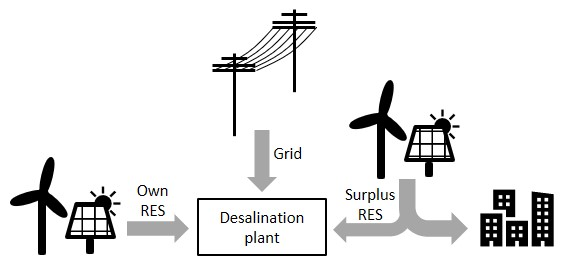
A decentralized scenario, where two plants supply their respective sub-regions of Algarve and are powered by three different power sources (excess RES, the plant’s own production RES, and grid power as backup).
The viability of such solutions was assessed by estimating the levelized cost of water (LCOW) and comparing it to the estimated production cost of the conventional water supply. To estimate the LCOW, two models were developed: a simplified model with a constant hourly output and a subsequent optimization model to find the operational strategy that minimizes electricity costs. Once the resulting LCOWs were obtained, a comparative analysis of the various scenarios was made in order to conclude on the project’s viability and to advise on the best setup.
The main contributions of this work are as follows: (i) introducing a novel cost structure, using excess RES, that allows for both a reduction of LCOW and an increase in RES exploitation; and (ii) establishing three scenarios of desalination integration into the existing water supply network of Algarve.
2. Materials and Methods
2.1. Costs Structure
The LCOW of the desalination plant is calculated as:
where CAPEX is the total capital expenditure, CRF is the capital recovery factor, OPEX is the total annual operational expenditure, EC is the energy costs, and TWP is the total annual desalinated water produced.
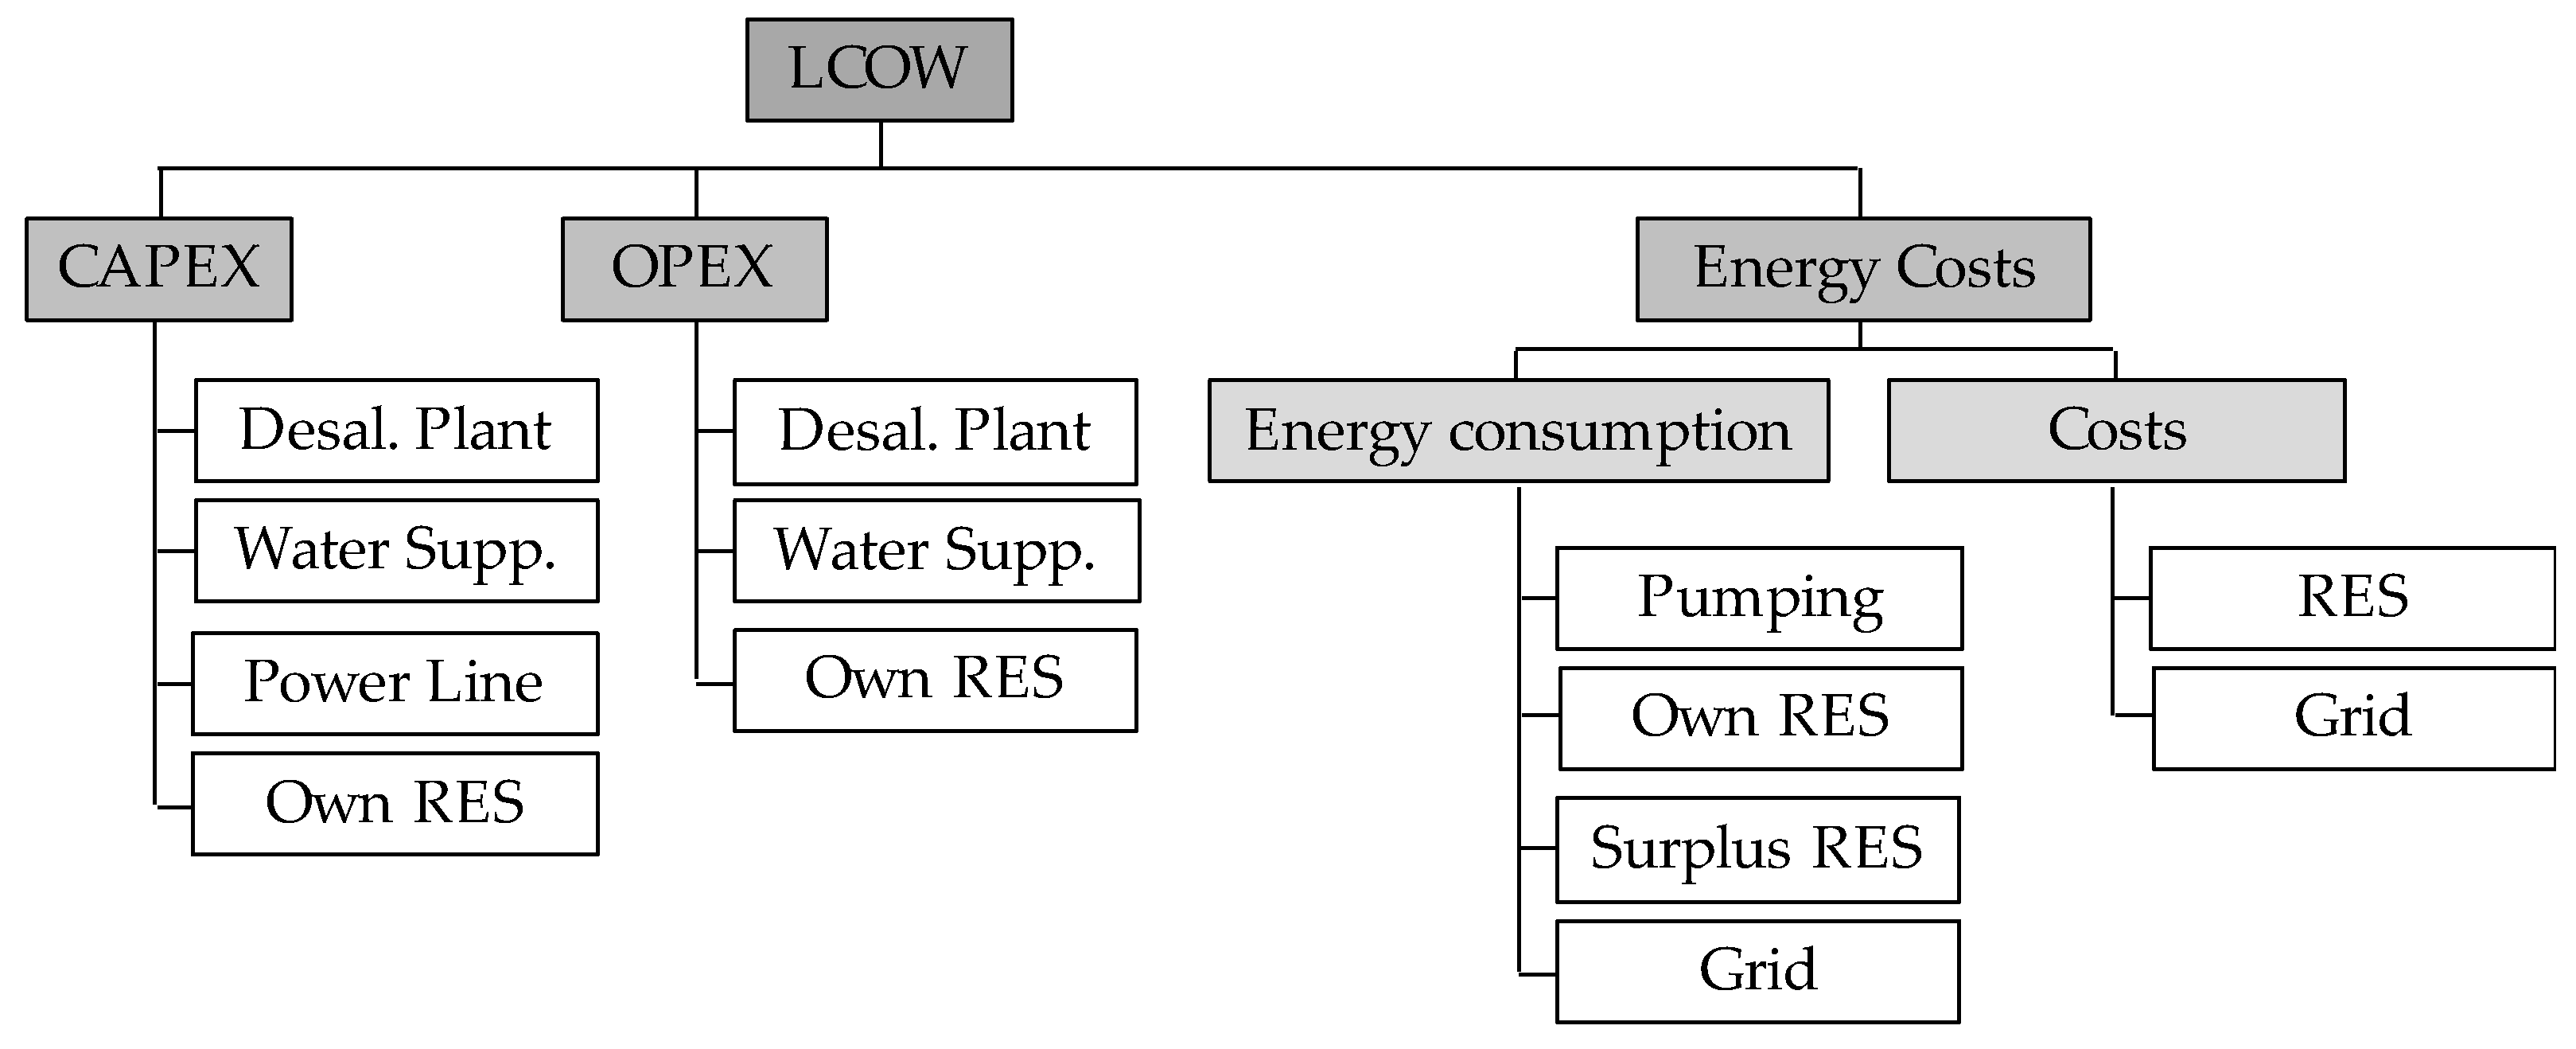
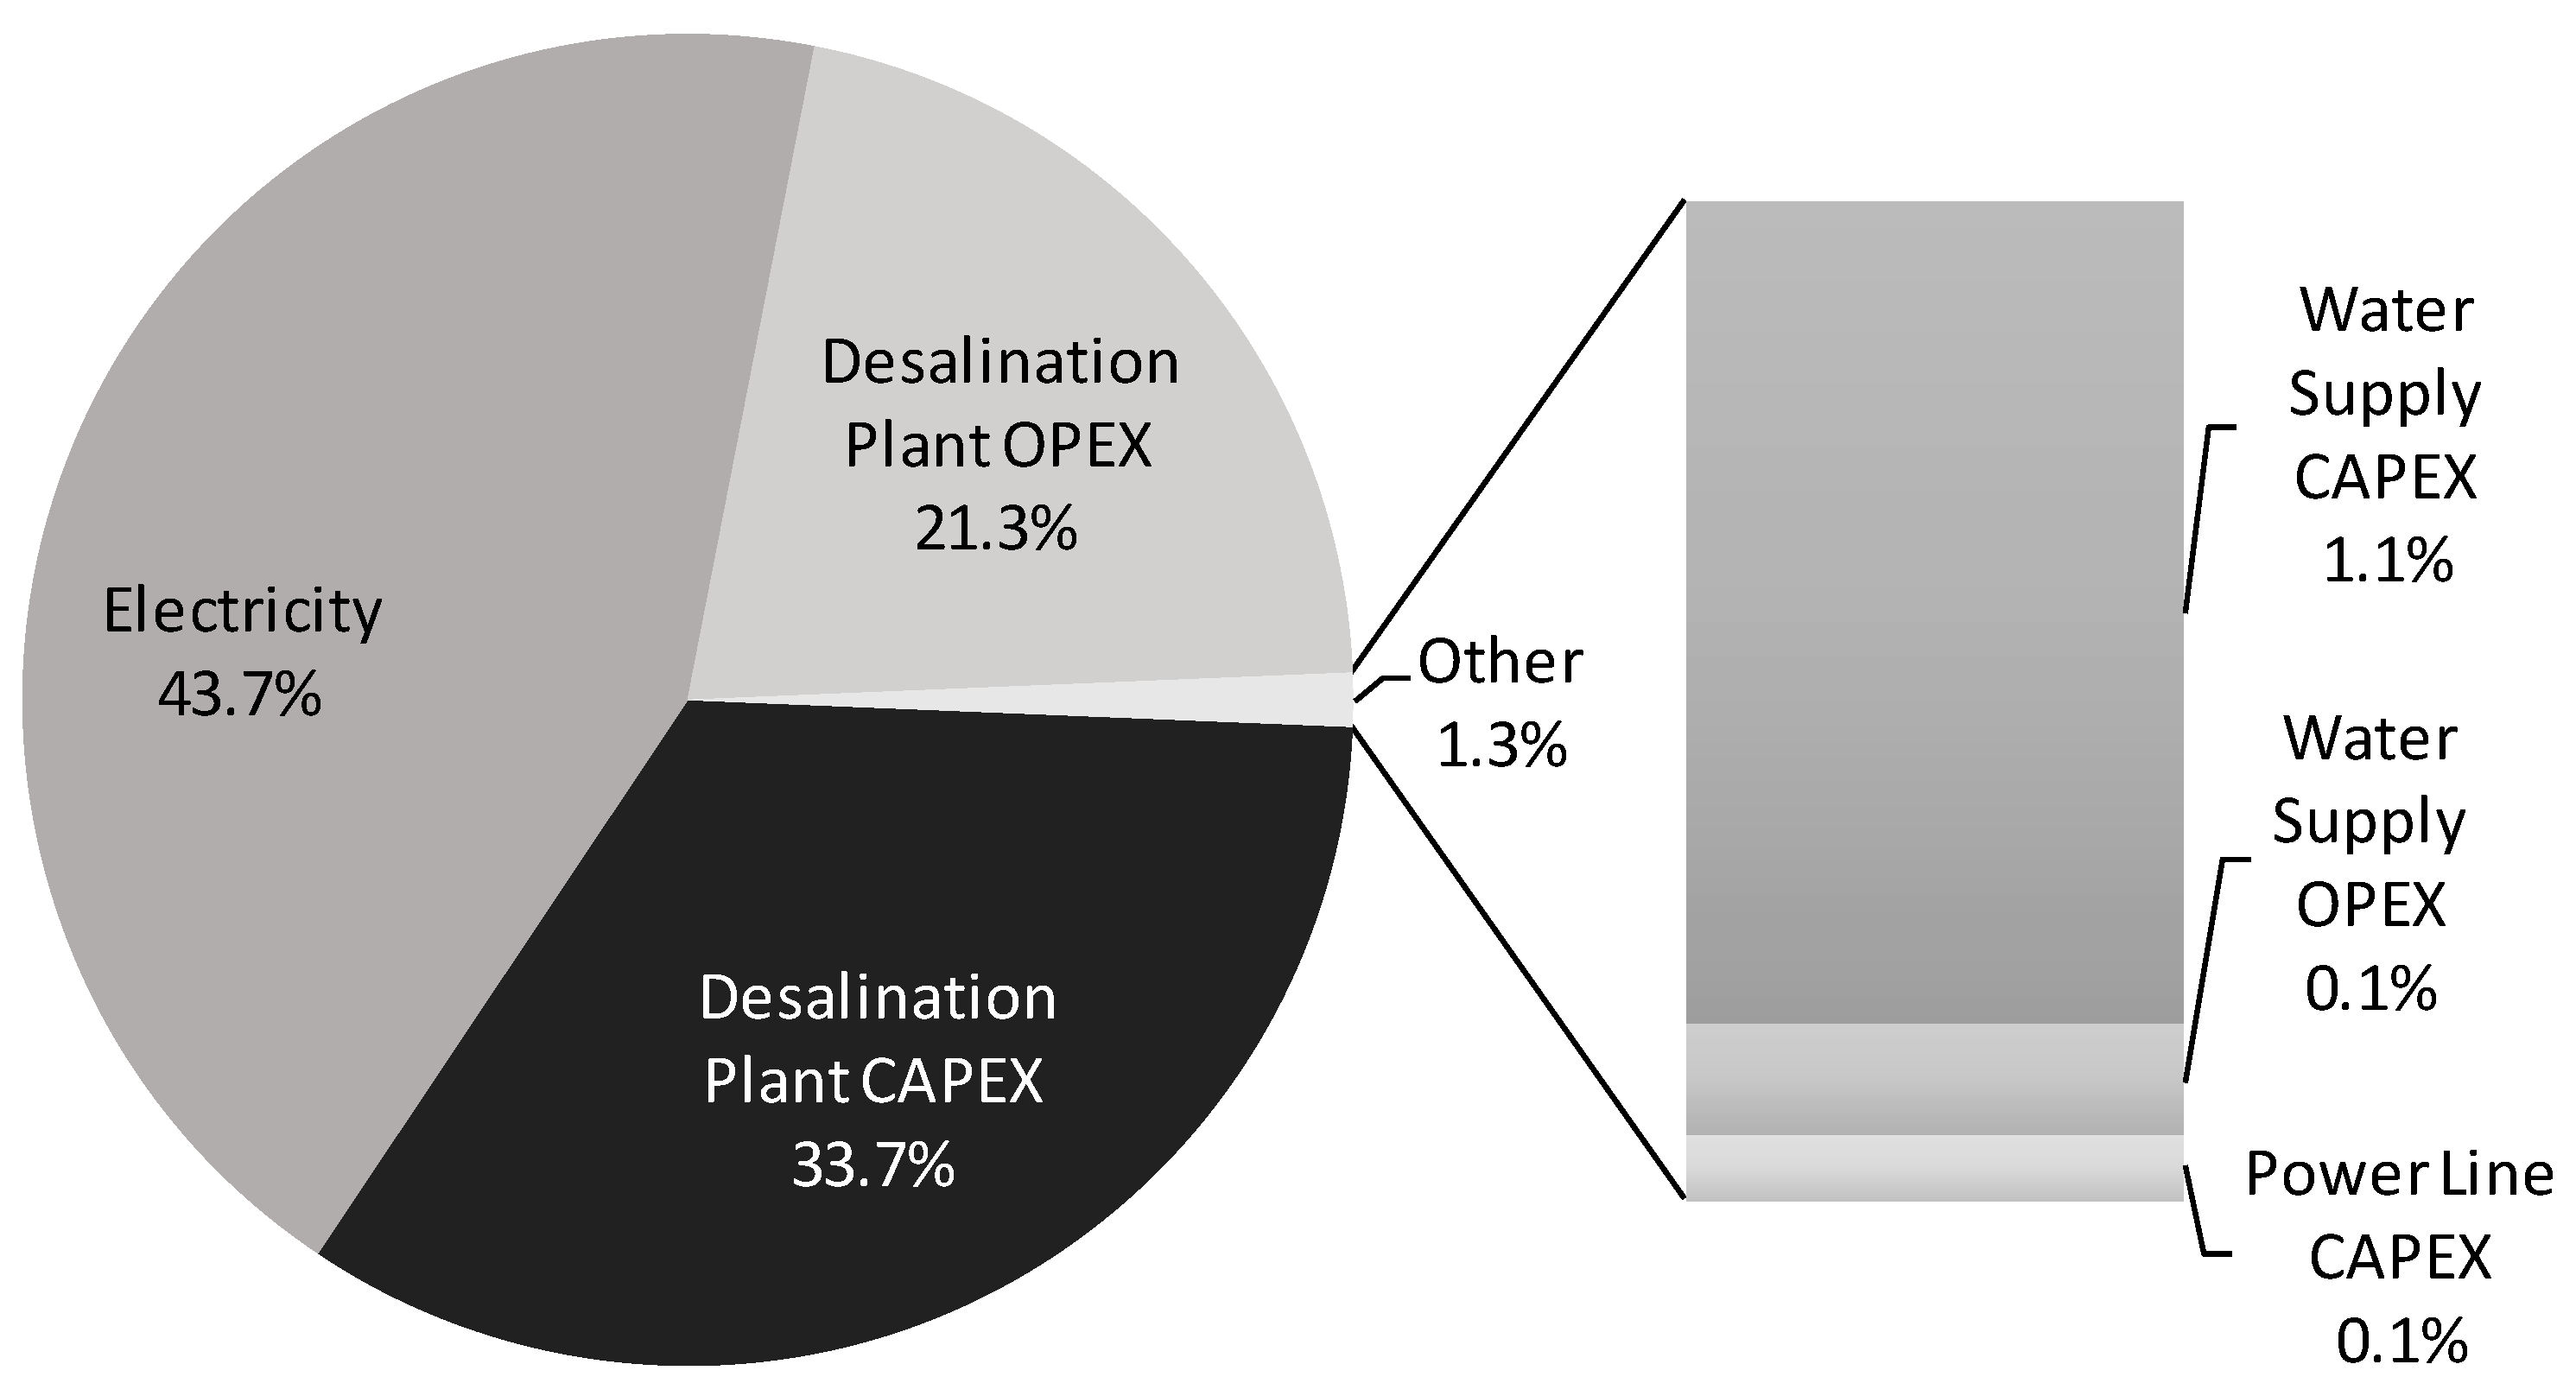
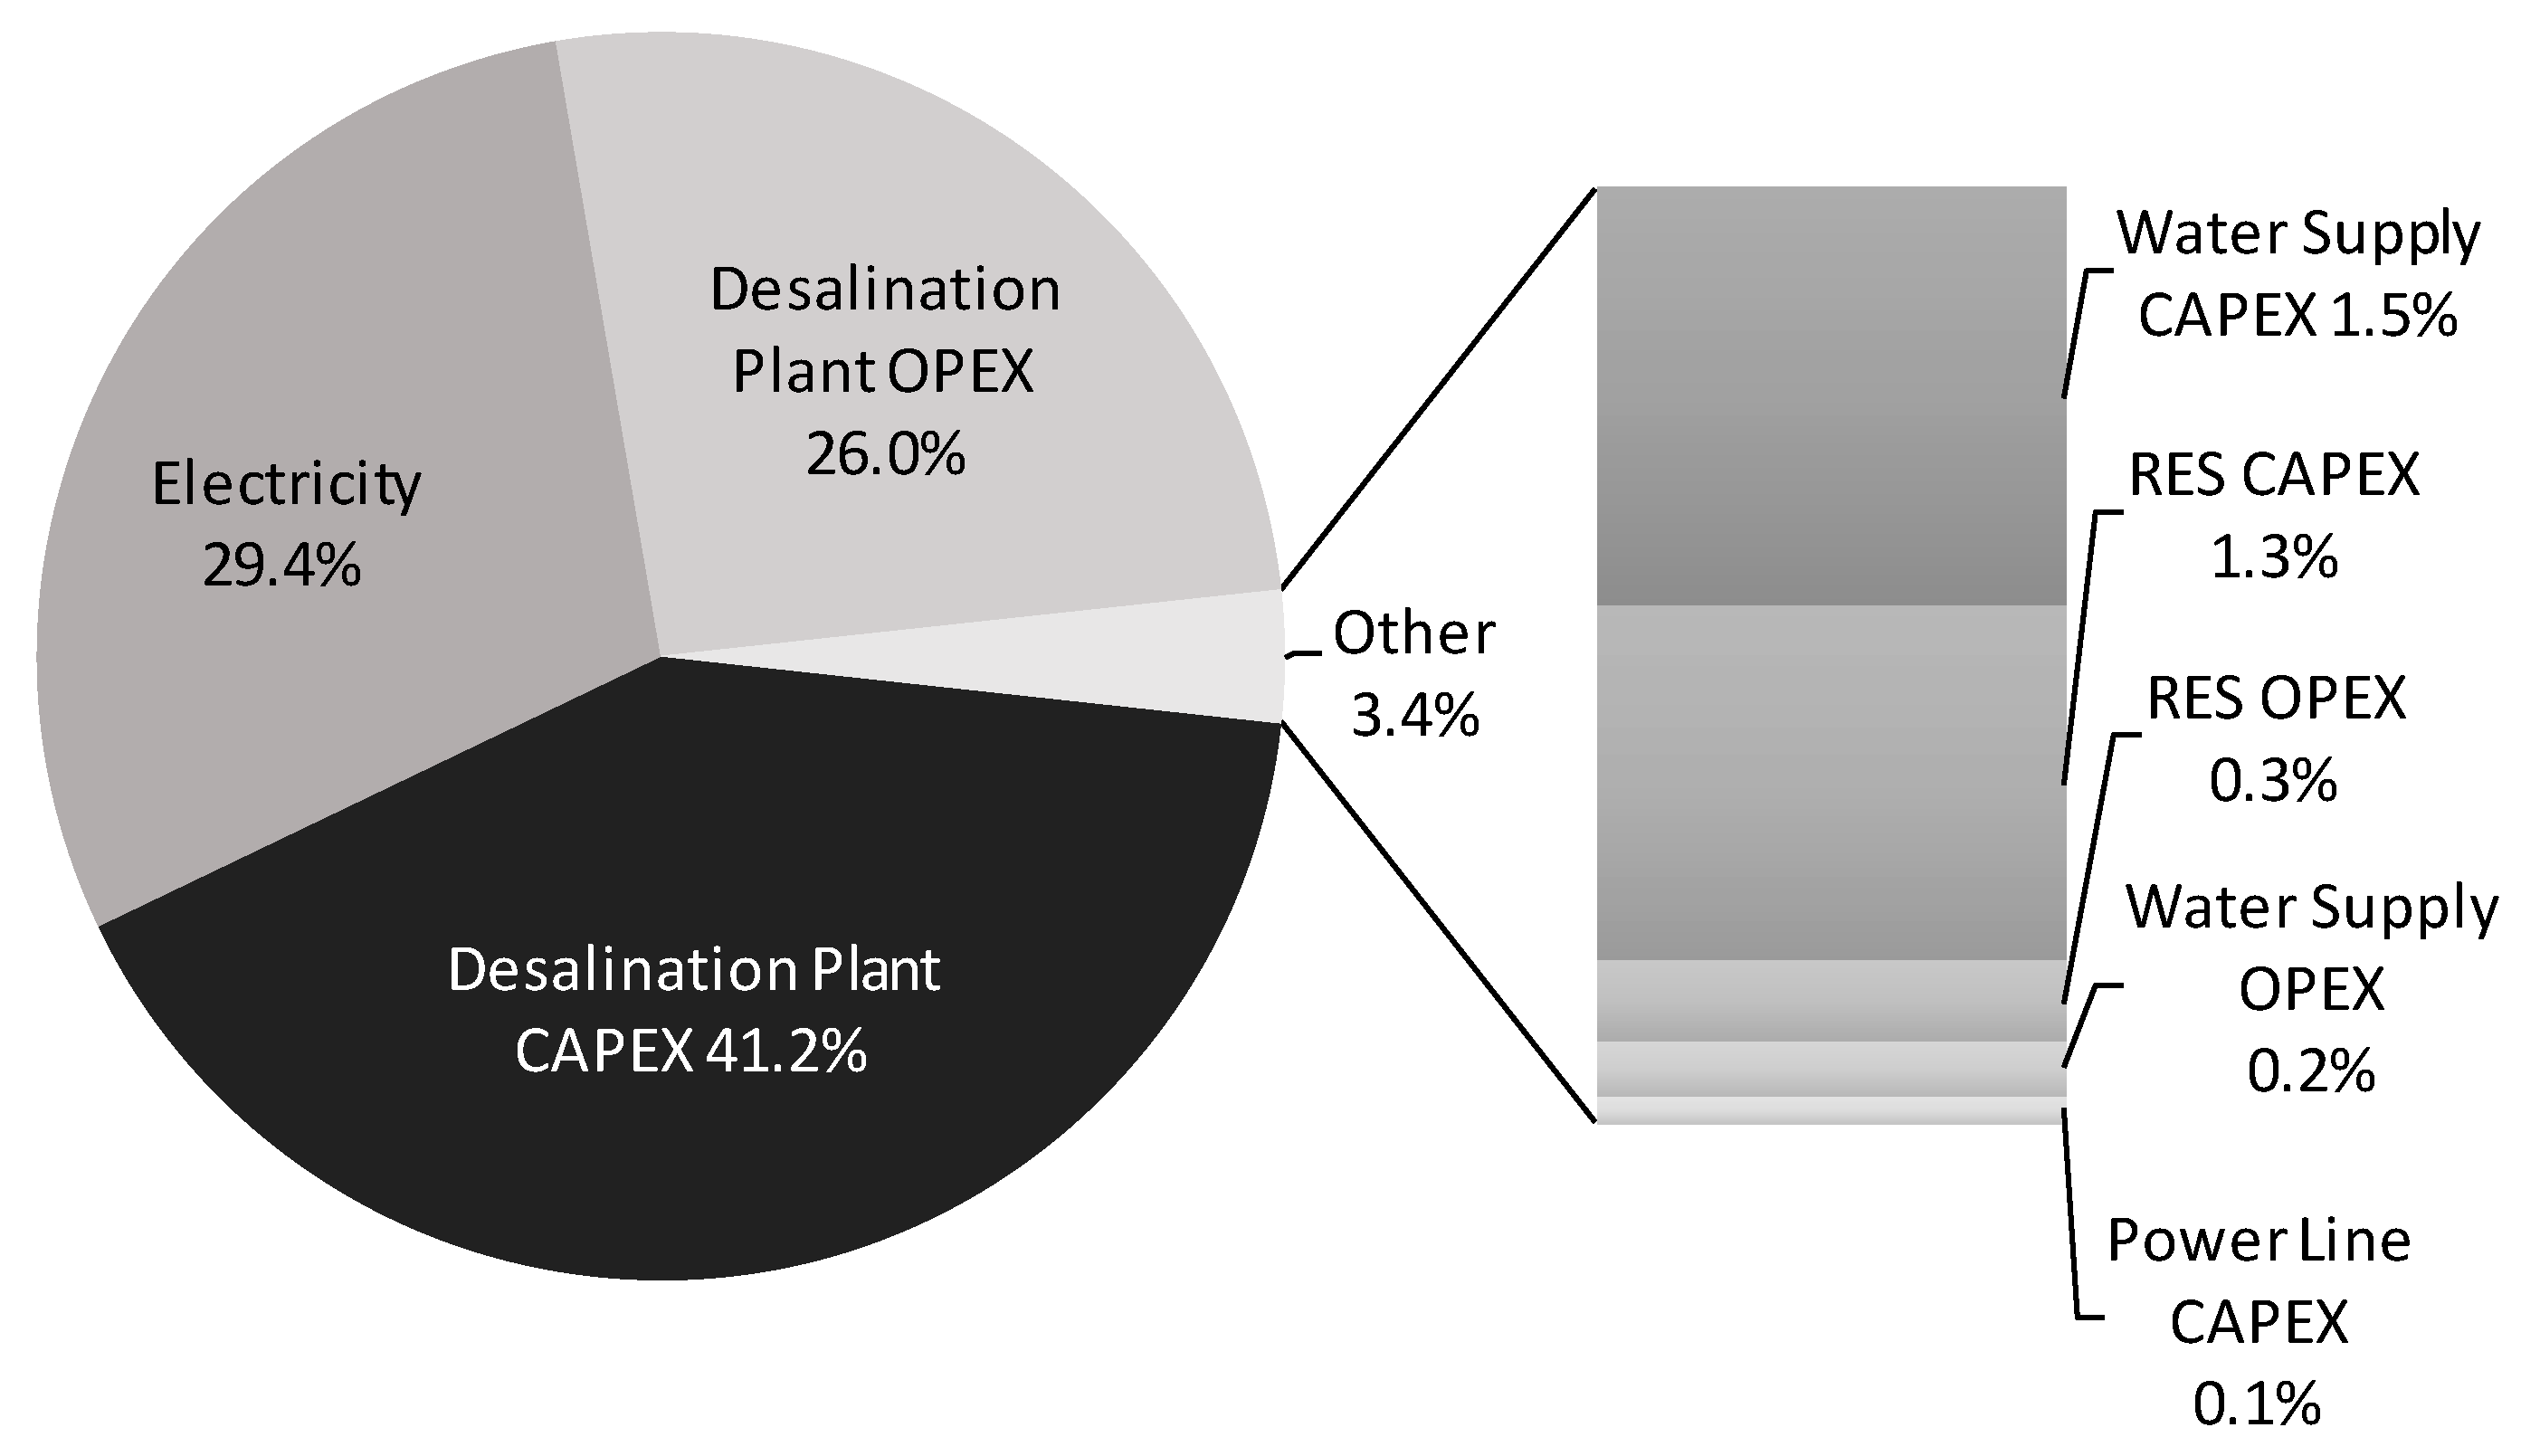
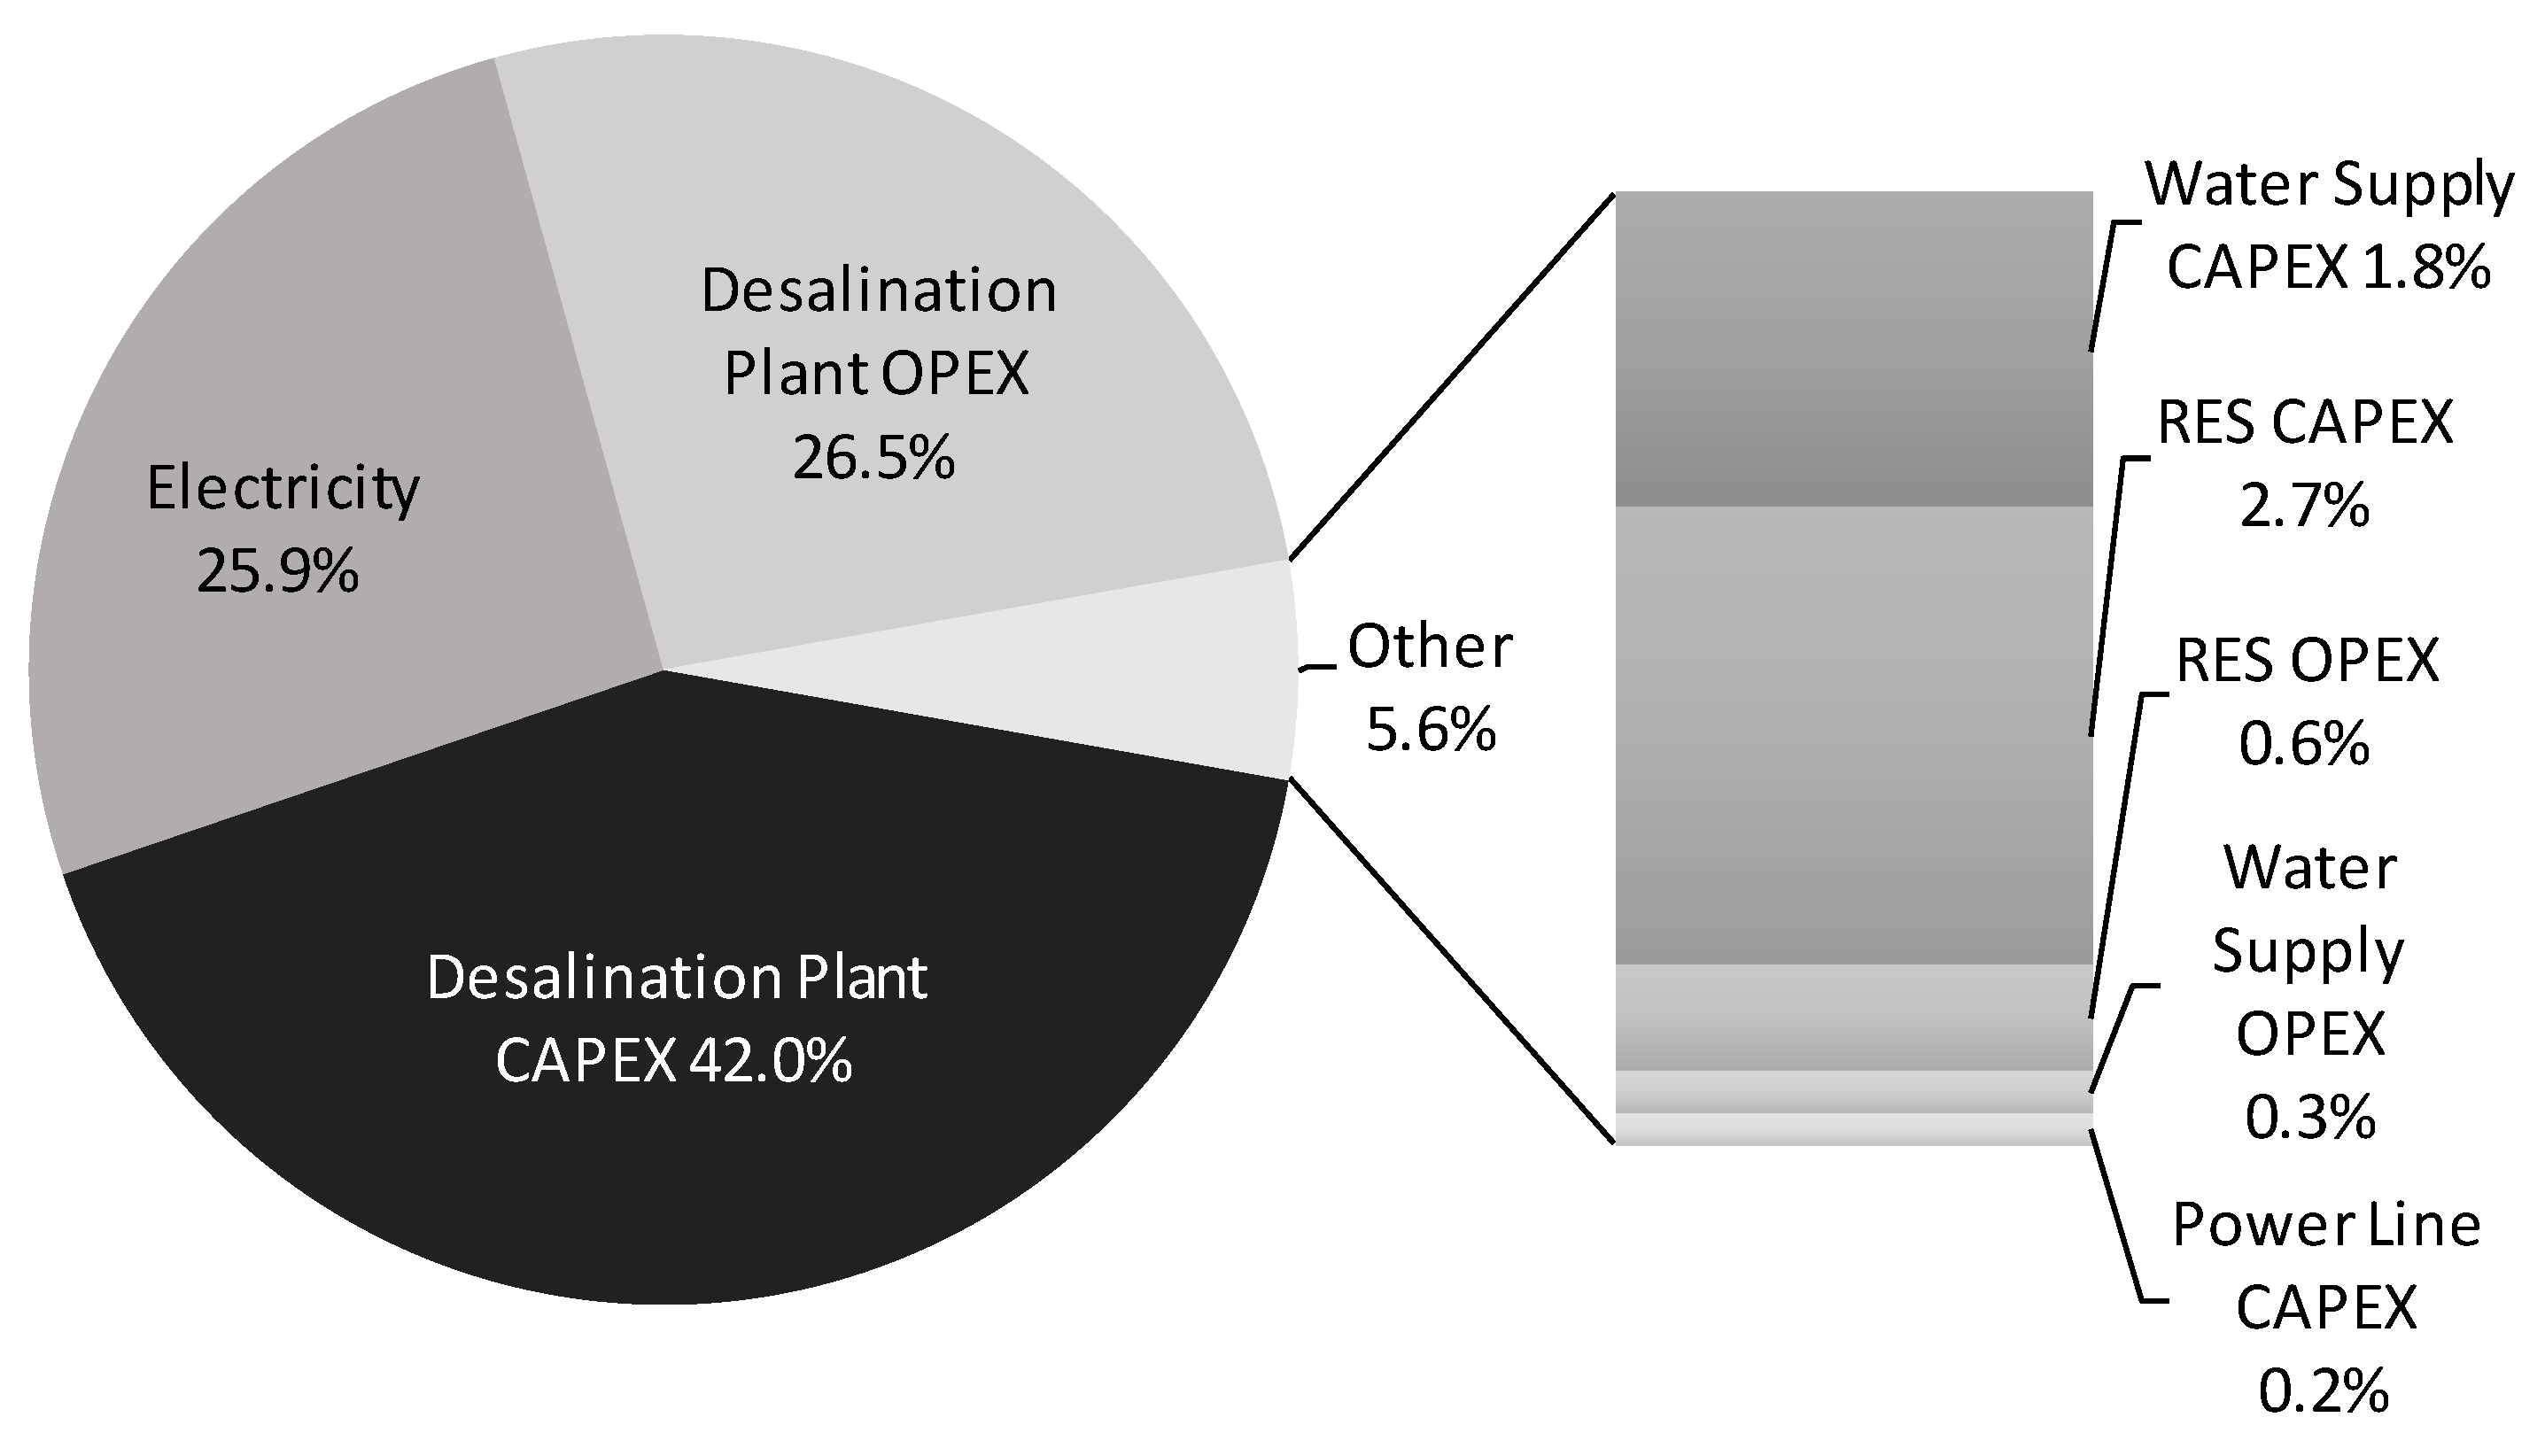
Figure 1 shows the different components considered for the calculation of the LCOW, apart from CRF and TWP. The CAPEX and OPEX consider the desalination plant, the water supply system, the power line, and the plant’s own RES power installation. To estimate the energy costs, there is firstly the need to determine the power consumption from each source considered (excess RES, the plant’s own production RES, and grid power), and the respective costs. The power consumption is divided between the power used for pumping, i.e., used for distributing water, and the power used for water production. Nevertheless, the power used for water production is also pumping power, since the desalination technology is based on RO.
The electricity cost of the RES surplus was calculated based on the hourly average cost of kWh of the Iberian electricity market (MIBEL) over a decade for each season of the year. The costs of power from the plant’s own production were included in the CAPEX and OPEX. The cost of electricity from the grid was based on the power supplier’s tariffs.
Table 1 summarizes the CAPEX relative to the capacity installed and the OPEX relative to the produced volume for a large SWRO plant (>100,000 m
3/day).
The CAPEX of the power line depends on the length of the high voltage line and its capacity. This cost was estimated using a tool provided by the local grid supplier [
19]. The OPEX of the power line was not considered, as this cost is the responsibility of the local grid supplier.
A pipeline and a pumping station were designed to inject the desalinated water into the water distribution network. The capacity of a pipeline (namely its diameter) must be sufficient to drain out the daily water volume needed for peak demand, assuming a flow velocity of 1.5 m/s (i.e., the recommended upper limit [
20]). The pumping station was designed accordingly by considering the pumping head needed between the plant, the closest connection to the water supply network, and the pumping capacity, dimensioned to be as close as possible to the desalination output to avoid bottlenecks and a pumping efficiency of 90%. The CAPEX of the water supply system was the sum of the CAPEX of the pipeline, the pumping station construction, and the pumping station’s equipment. The OPEX of the water supply was also the sum of the OPEX of these three components. The OPEX of the pipeline was considered 0.75% of the CAPEX of the pipeline. The OPEX of the pumping station construction was considered to be 1% of the CAPEX of the pumping station construction. Finally, the OPEX of the pumping station equipment was 2.5% of the CAPEX of the pumping station equipment [
20].
2.2. General Assumptions
In order to determine the necessary capacity of the desalination plant, the average daily water demand was computed for each of the four seasons of the year. Taking the highest consumption of the four and dividing by a plant factor of 85% [
14] to account for maintenance downtime, the nominal plant capacity was chosen so that the real capacity could cover 100% of the demand.
A desalination plant must be connected to both the water supply network and the power grid. It could be assumed that both these networks have the capacity to absorb/supply the flows generated/needed by the plant.
Three different power sources are used to desalinate and pump water: the plant’s own power production (through a private wind and/or PV solar installation), the region’s RES excess output, and the national power grid. The optimization model seeks to minimize the total cost associated with energy consumption. The power source with the lowest marginal cost will be consumed first, until it is exhausted, and then the model starts using the second cheapest source. Since the marginal cost considered for the plant’s own RES power production is zero, the model gives priority to this source. This solution aims to ensure that the share of RES used for powering the plant is maximized and that the high electricity cost of the grid is avoided as much as possible.
To accurately grasp the availability and subsequent costs of each power source, it was determined that the analysis should be hourly based, with one representative day (comprised of 24 h blocks) for each one of the four seasons of the year.
The region’s RES production was estimated by considering the existing wind farms and PV solar installed capacities as of 2018, to which the PV solar capacities of the plants whose construction is in progress and due until 2021 are added.
PV solar output was computed as the seasonal average of the estimated hourly output of each location. Wind power being particularly unpredictable, its output was computed as the seasonal average over three years of the estimated hourly output of each location. The same methodology was used to estimate the production profile of the desalination plant’s own power production. A PV installation of 1.3 MW covering the rooftops of the plant was considered, to which two capacities (1.3 and 5 MW) of both PV solar and wind turbines could be added. The installation capacity chosen was the one that results in the lowest LCOW.
Assuming that the penetration of RES will increase significantly in the next decade, it was considered that, on average, RES will supply 80% of the total power demand. If there is a surplus of RES power after the deduction of this power demand, the surplus will either be exported (if there is instantaneous demand) or not used. It was considered that ensuring a power demand for desalination, whatever time of the day, represents an added guarantee to RES producers. This guarantee was assumed to ensure a price discount of 25% on the RES surplus, relative to the instantaneous MIBEL price.
To define this available RES surplus, the power demand of the region had to be quantified. Taking one representative day in 2018 for each season, an hourly power consumption profile for the whole country was first obtained. Using the latest census on population, a per capita profile was then computed. Having no precise data on the number of temporary residents resulting from tourism inflow in summertime, the increase in water consumption throughout the year was taken as an indication of population variation and used to estimate the power consumption profile of the region.
2.3. Model Specific Assumptions
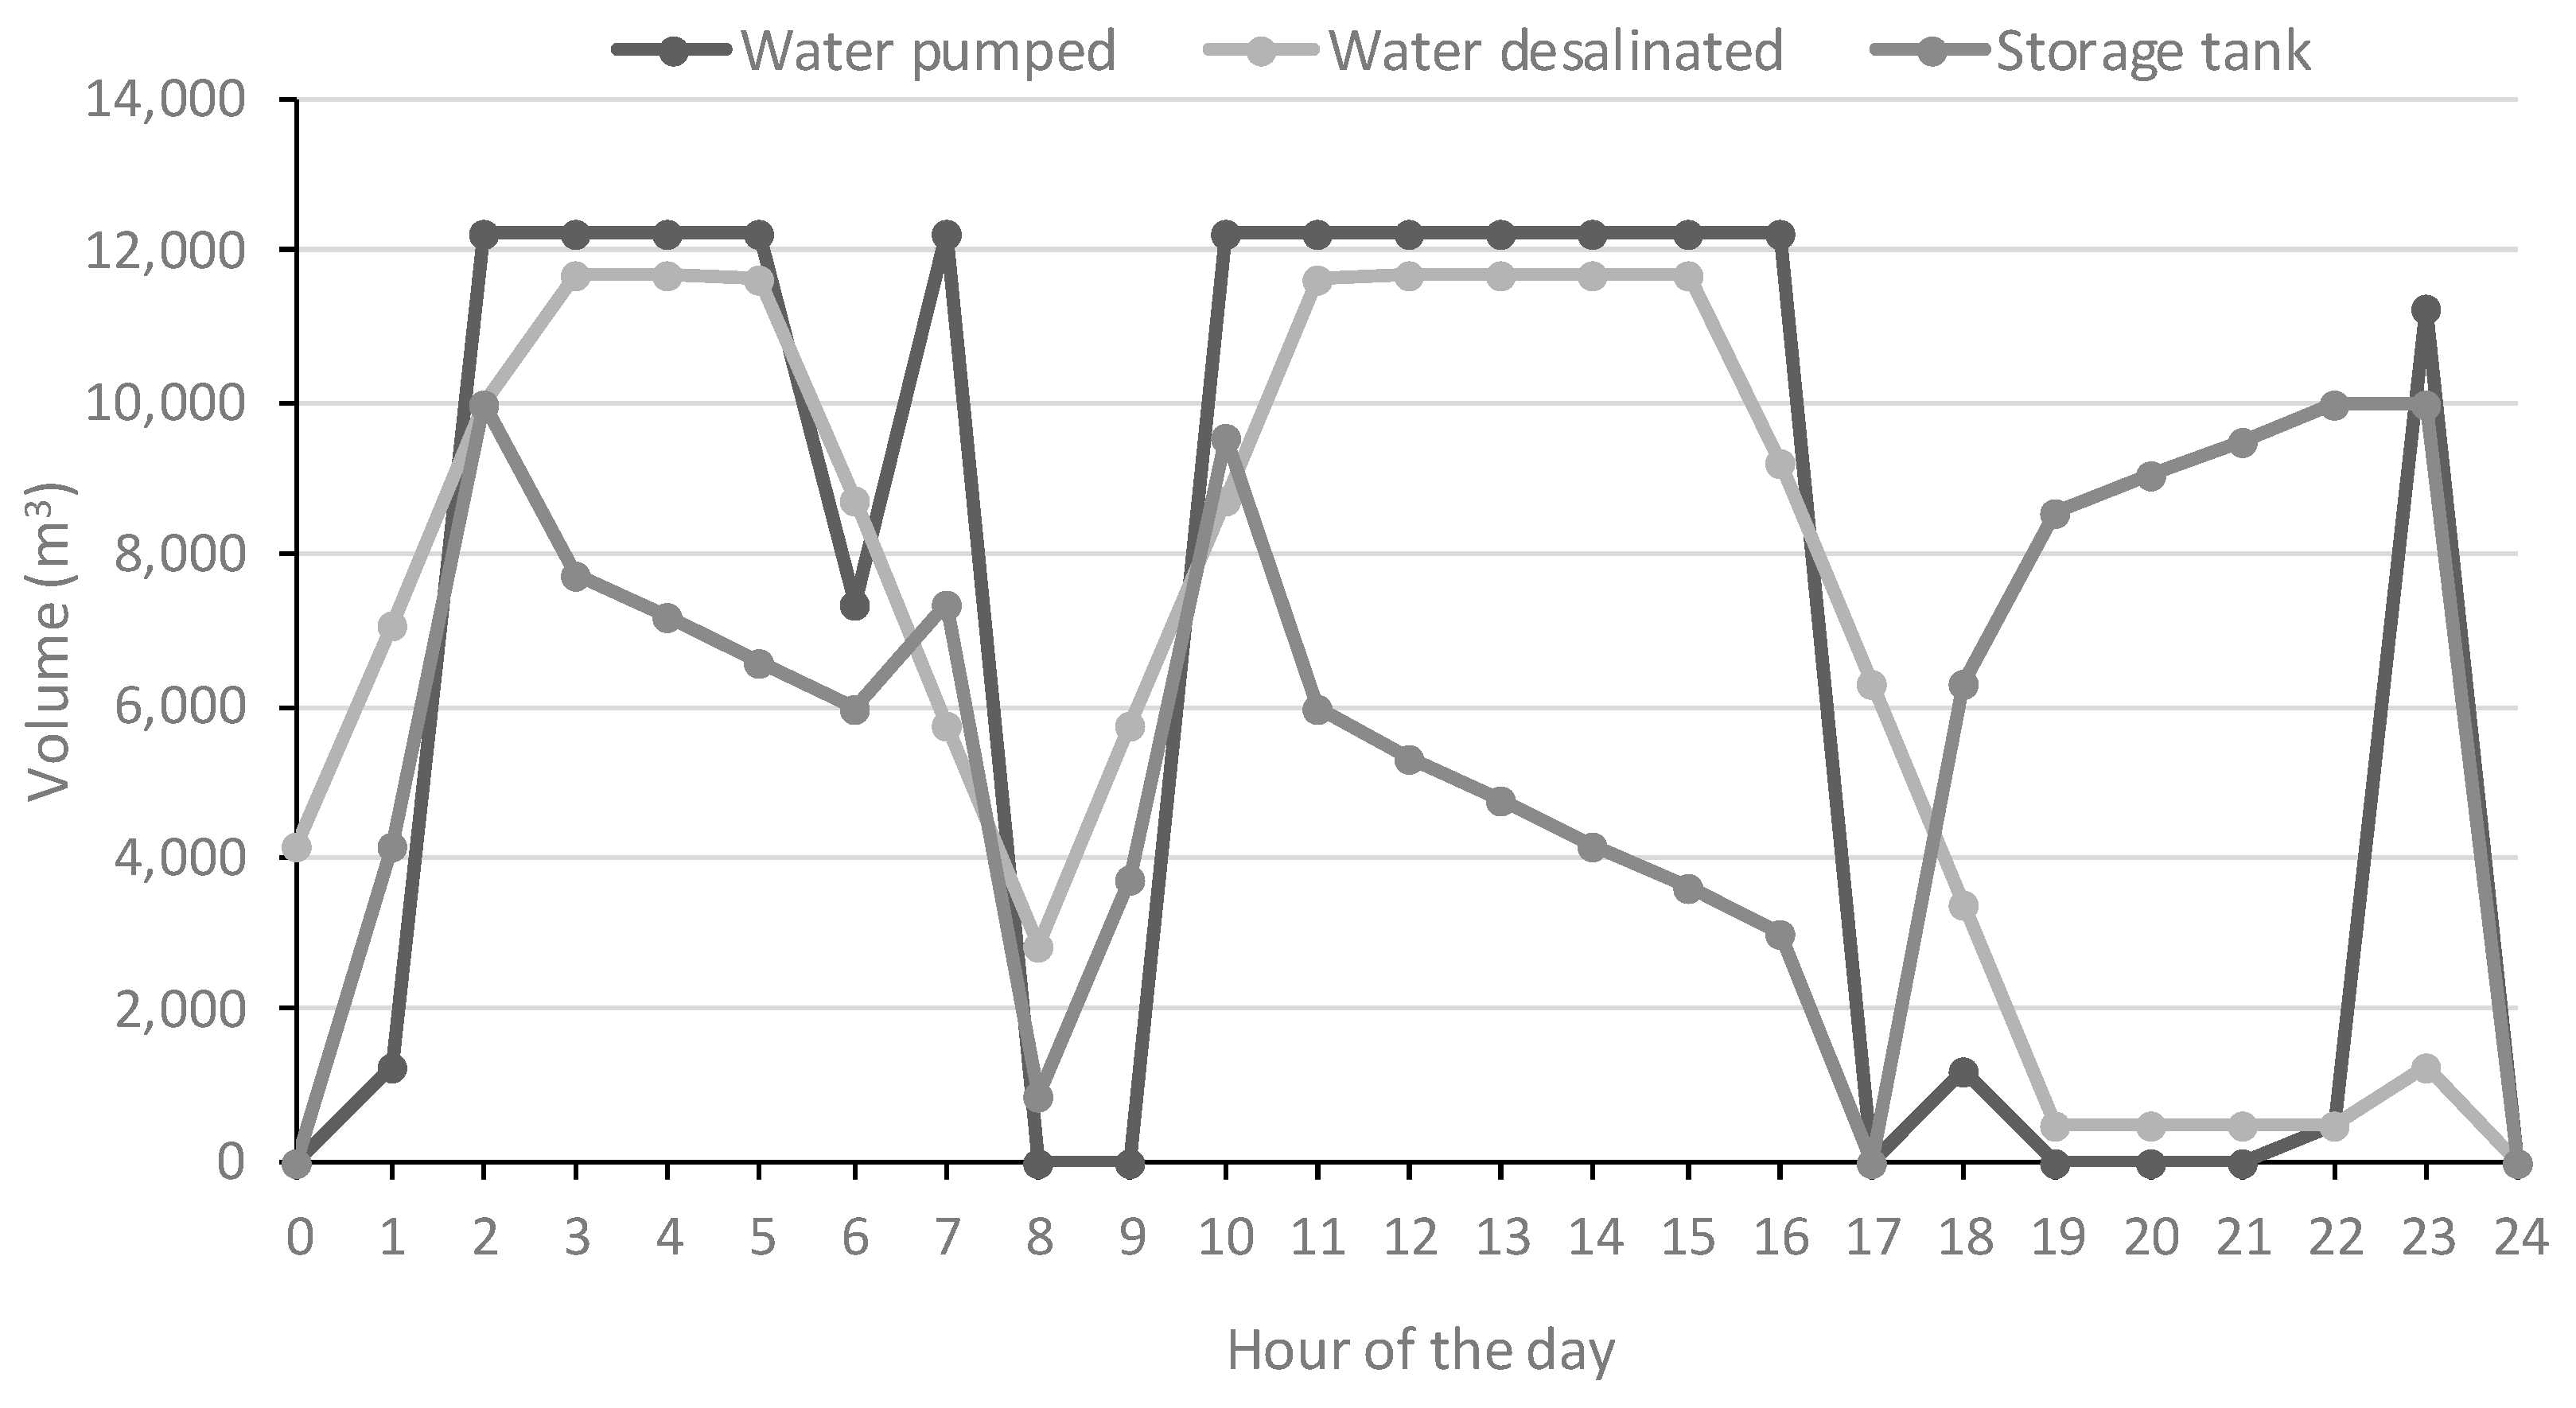
As previously mentioned, two different models were developed to estimate the LCOW of the centralized and the decentralized scenarios: a simplified model and an optimization model. The simplified model takes a simpler approach, as it considers the production and pumping a constant output of desalinated water for every hour of the day (no water storage is considered). In turn, the optimization model determines the operational schedule of the desalination plant that minimizes the total electricity costs. In these models, the SWRO plants are modelled with a pressure center design that evenly splits the total output capacity into four modules. This gives the desalination plant the ability to mirror demand fluctuations without incurring fouling problems, while also staying under the optimal pumping regime.
The optimization variables in this model are:
The power consumption from each one of the three sources, for desalination purposes (3 variables).
The power consumption from each one of the three sources, for pumping purposes (3 variables).
Plant modules in use (4 variables).
The dimension of the vector space was 10 × 24: from 0 to 23 h, for the 10 optimization variables.
The optimization model also considers the usage of a storage tank for added operational flexibility, although its level is forced to be at 0 at the start and at the end of each day.
The details of the model developed are presented in
Appendix A.
2.4. Sensitivity Analysis
Using the optimization model applied to the centralized scenario, a sensitivity analysis was carried out on three key input variables in order to understand how much of an impact they might have had on the obtained LCOW. The chosen variables are:
FactorRESpenetr—the share of electricity demand to be supplied by regional RES production, varying by −30/+20 percentage points;
PriceFactor—the price discount awarded to SWRO plants for buying electricity in bulk, varying by −20/+10 percentage points;
StorageTankcapacity—the volume available for water storage, for capacities from 0 to 15,000 m3.
2.5. Carbon Footprint of Power Consumption
Powering desalination with RES helps decrease the total carbon footprint of water desalination. The carbon footprint of the baseline scenario was estimated by taking the total grid power consumed in a year and converting it by using the grid supplier’s average CO
2 emission of 256 ton/GWh [
21]. The same method was then used to estimate the CO
2 emissions of both the centralized and decentralized scenarios, and the emission savings were computed referring to the baseline scenario’s emissions.
3. Case Study
Algarve, the southernmost region of continental Portugal, has a challenging water supply. It is one of the most water stressed regions of Portugal, with a water exploitation index of 27% versus a 14% national average [
22]. Superficial water sources, despite being fairly abundant, are subject to precipitation fluctuations. The main subterranean source and water supply backup of the region, the Campina de Faro, was systematically in the lower 20th percentile of its capacity in 2017/2018 [
23]. Adding the severe seasonal fluctuation in water consumption caused by the touristic inflow in the summer, the effects of climate change on aquifer recharge rate, precipitation variability and the impending desertification of the region, Algarve could use the added robustness in water sources provided by water desalination.
Table 2 shows the estimated daily average drinking water supply for each season. The peak daily supply (nearly 280,000 m
3/day) was observed in the summer and set the total desalination capacity needed.
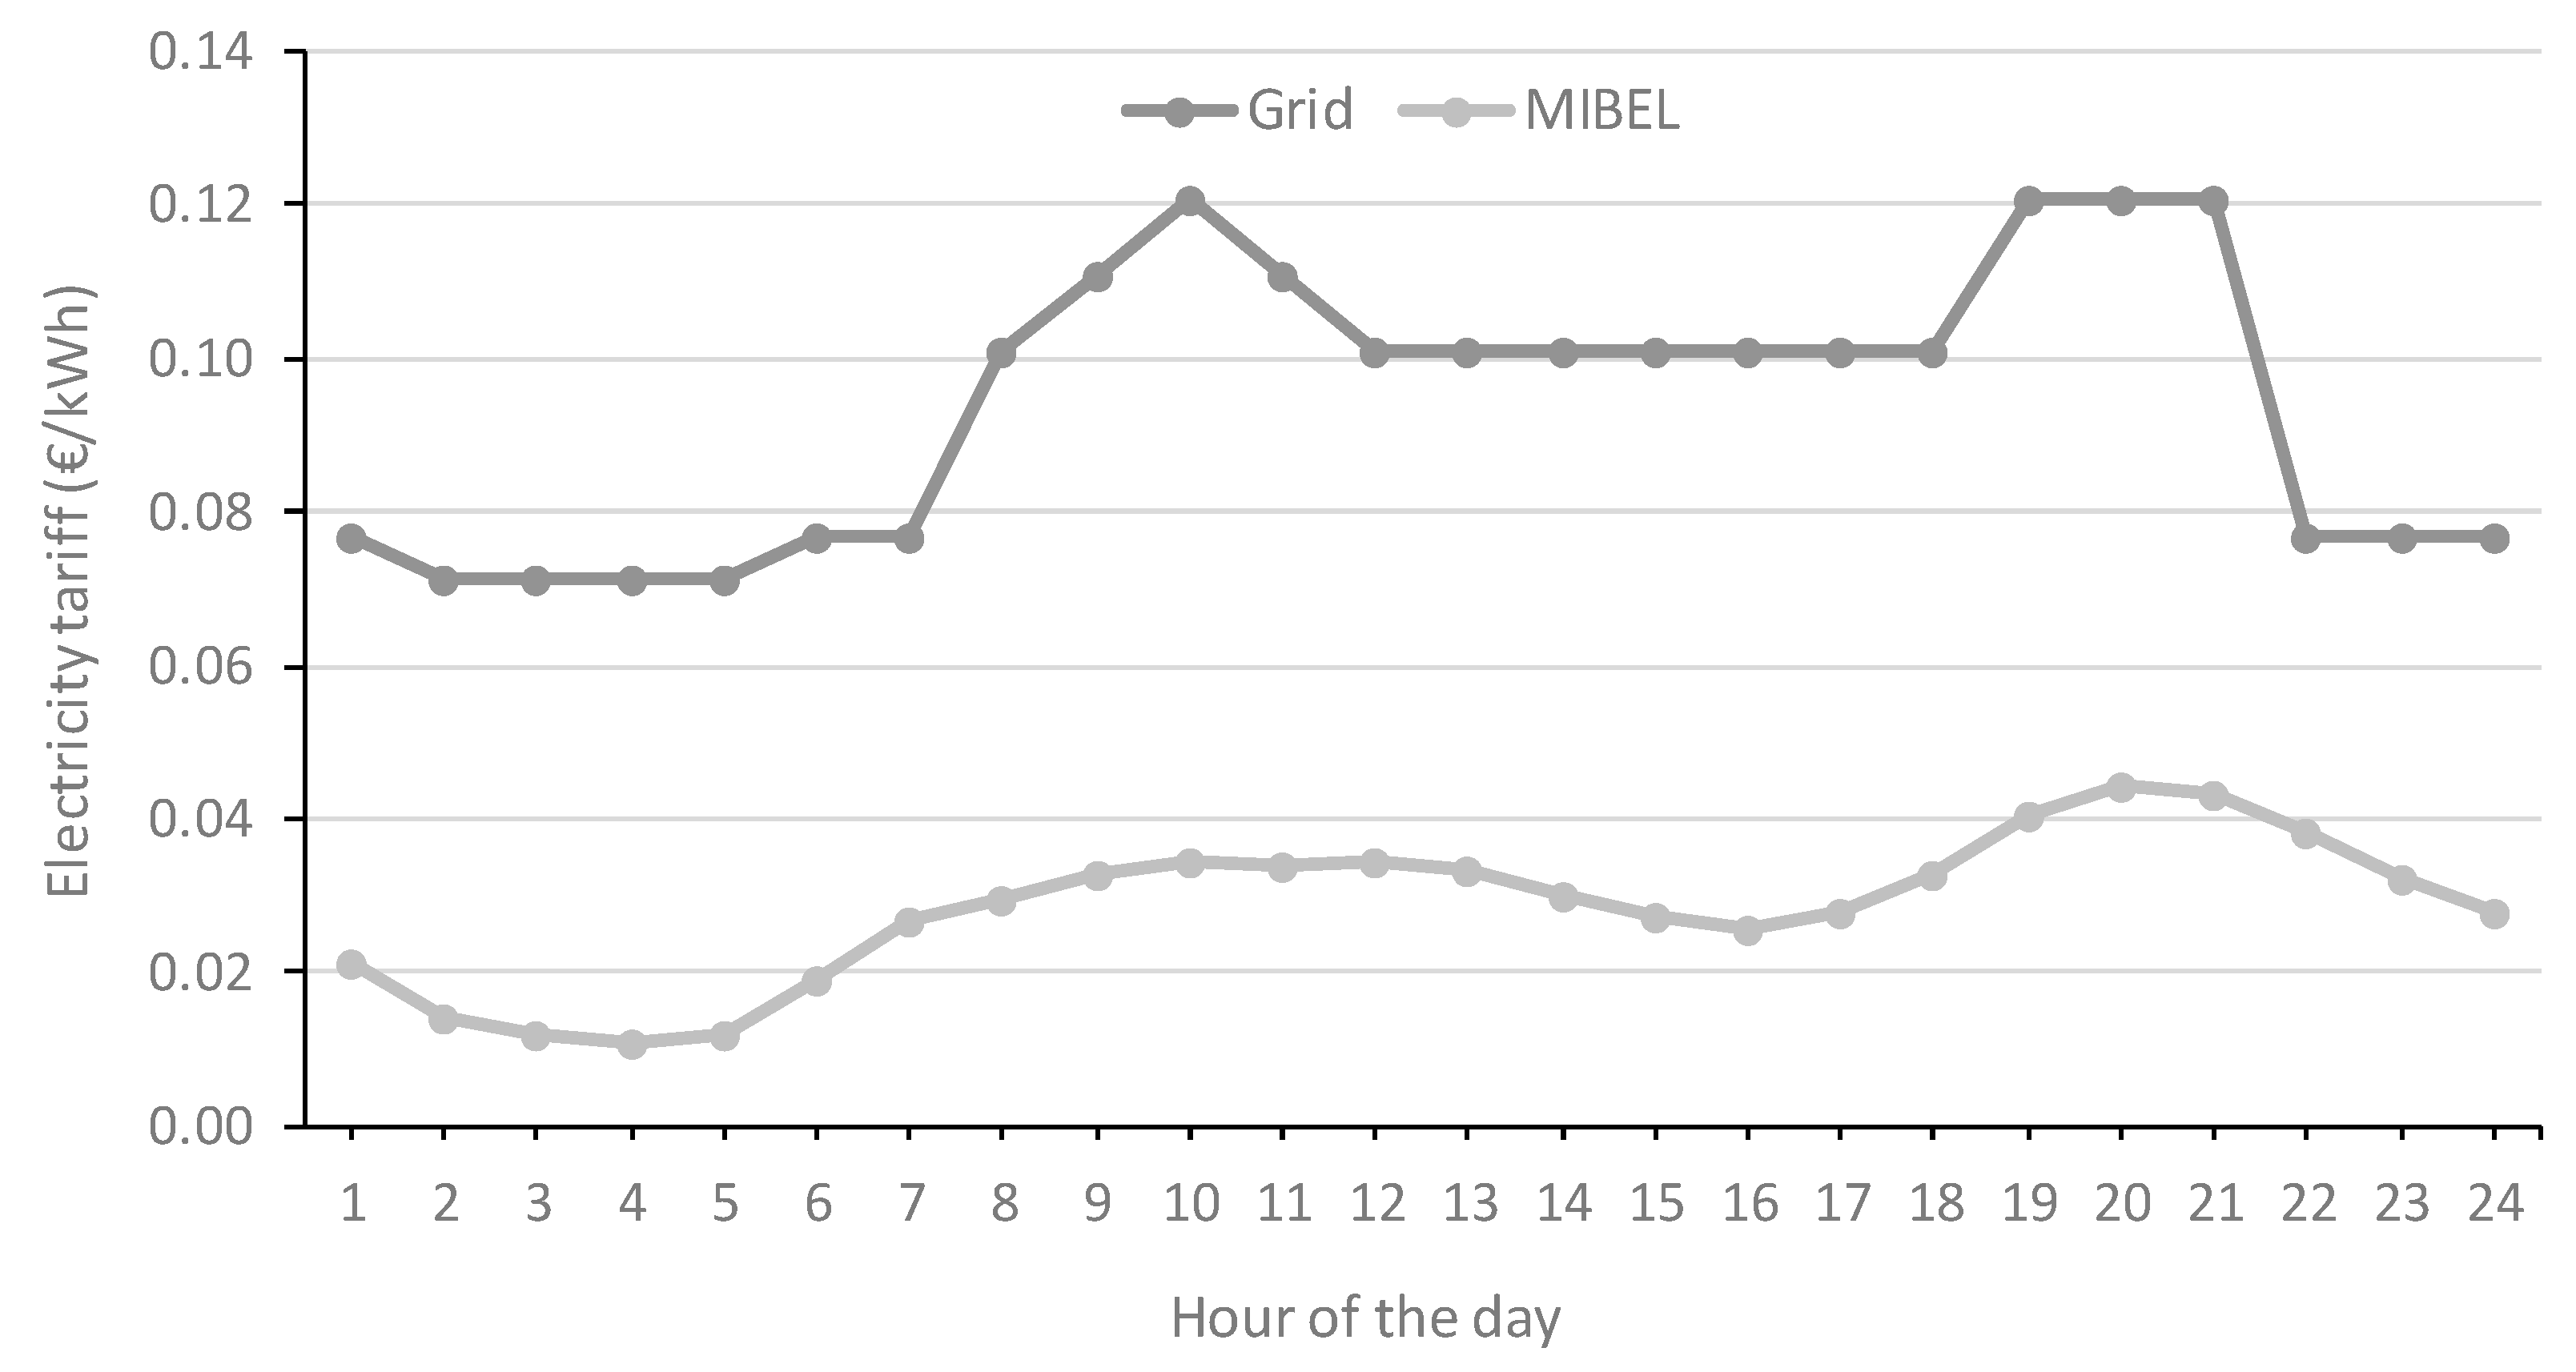
Figure 2 shows the current electricity tariff of the Portuguese grid supplier [
25] and the average tariff over the last decade on the MIBEL [
26], for a summer day.
The wind power installed in Algarve is about 225 MW. The current PV power installed in this region is 45 MW, and 472 MW are expected to be installed by 2021.
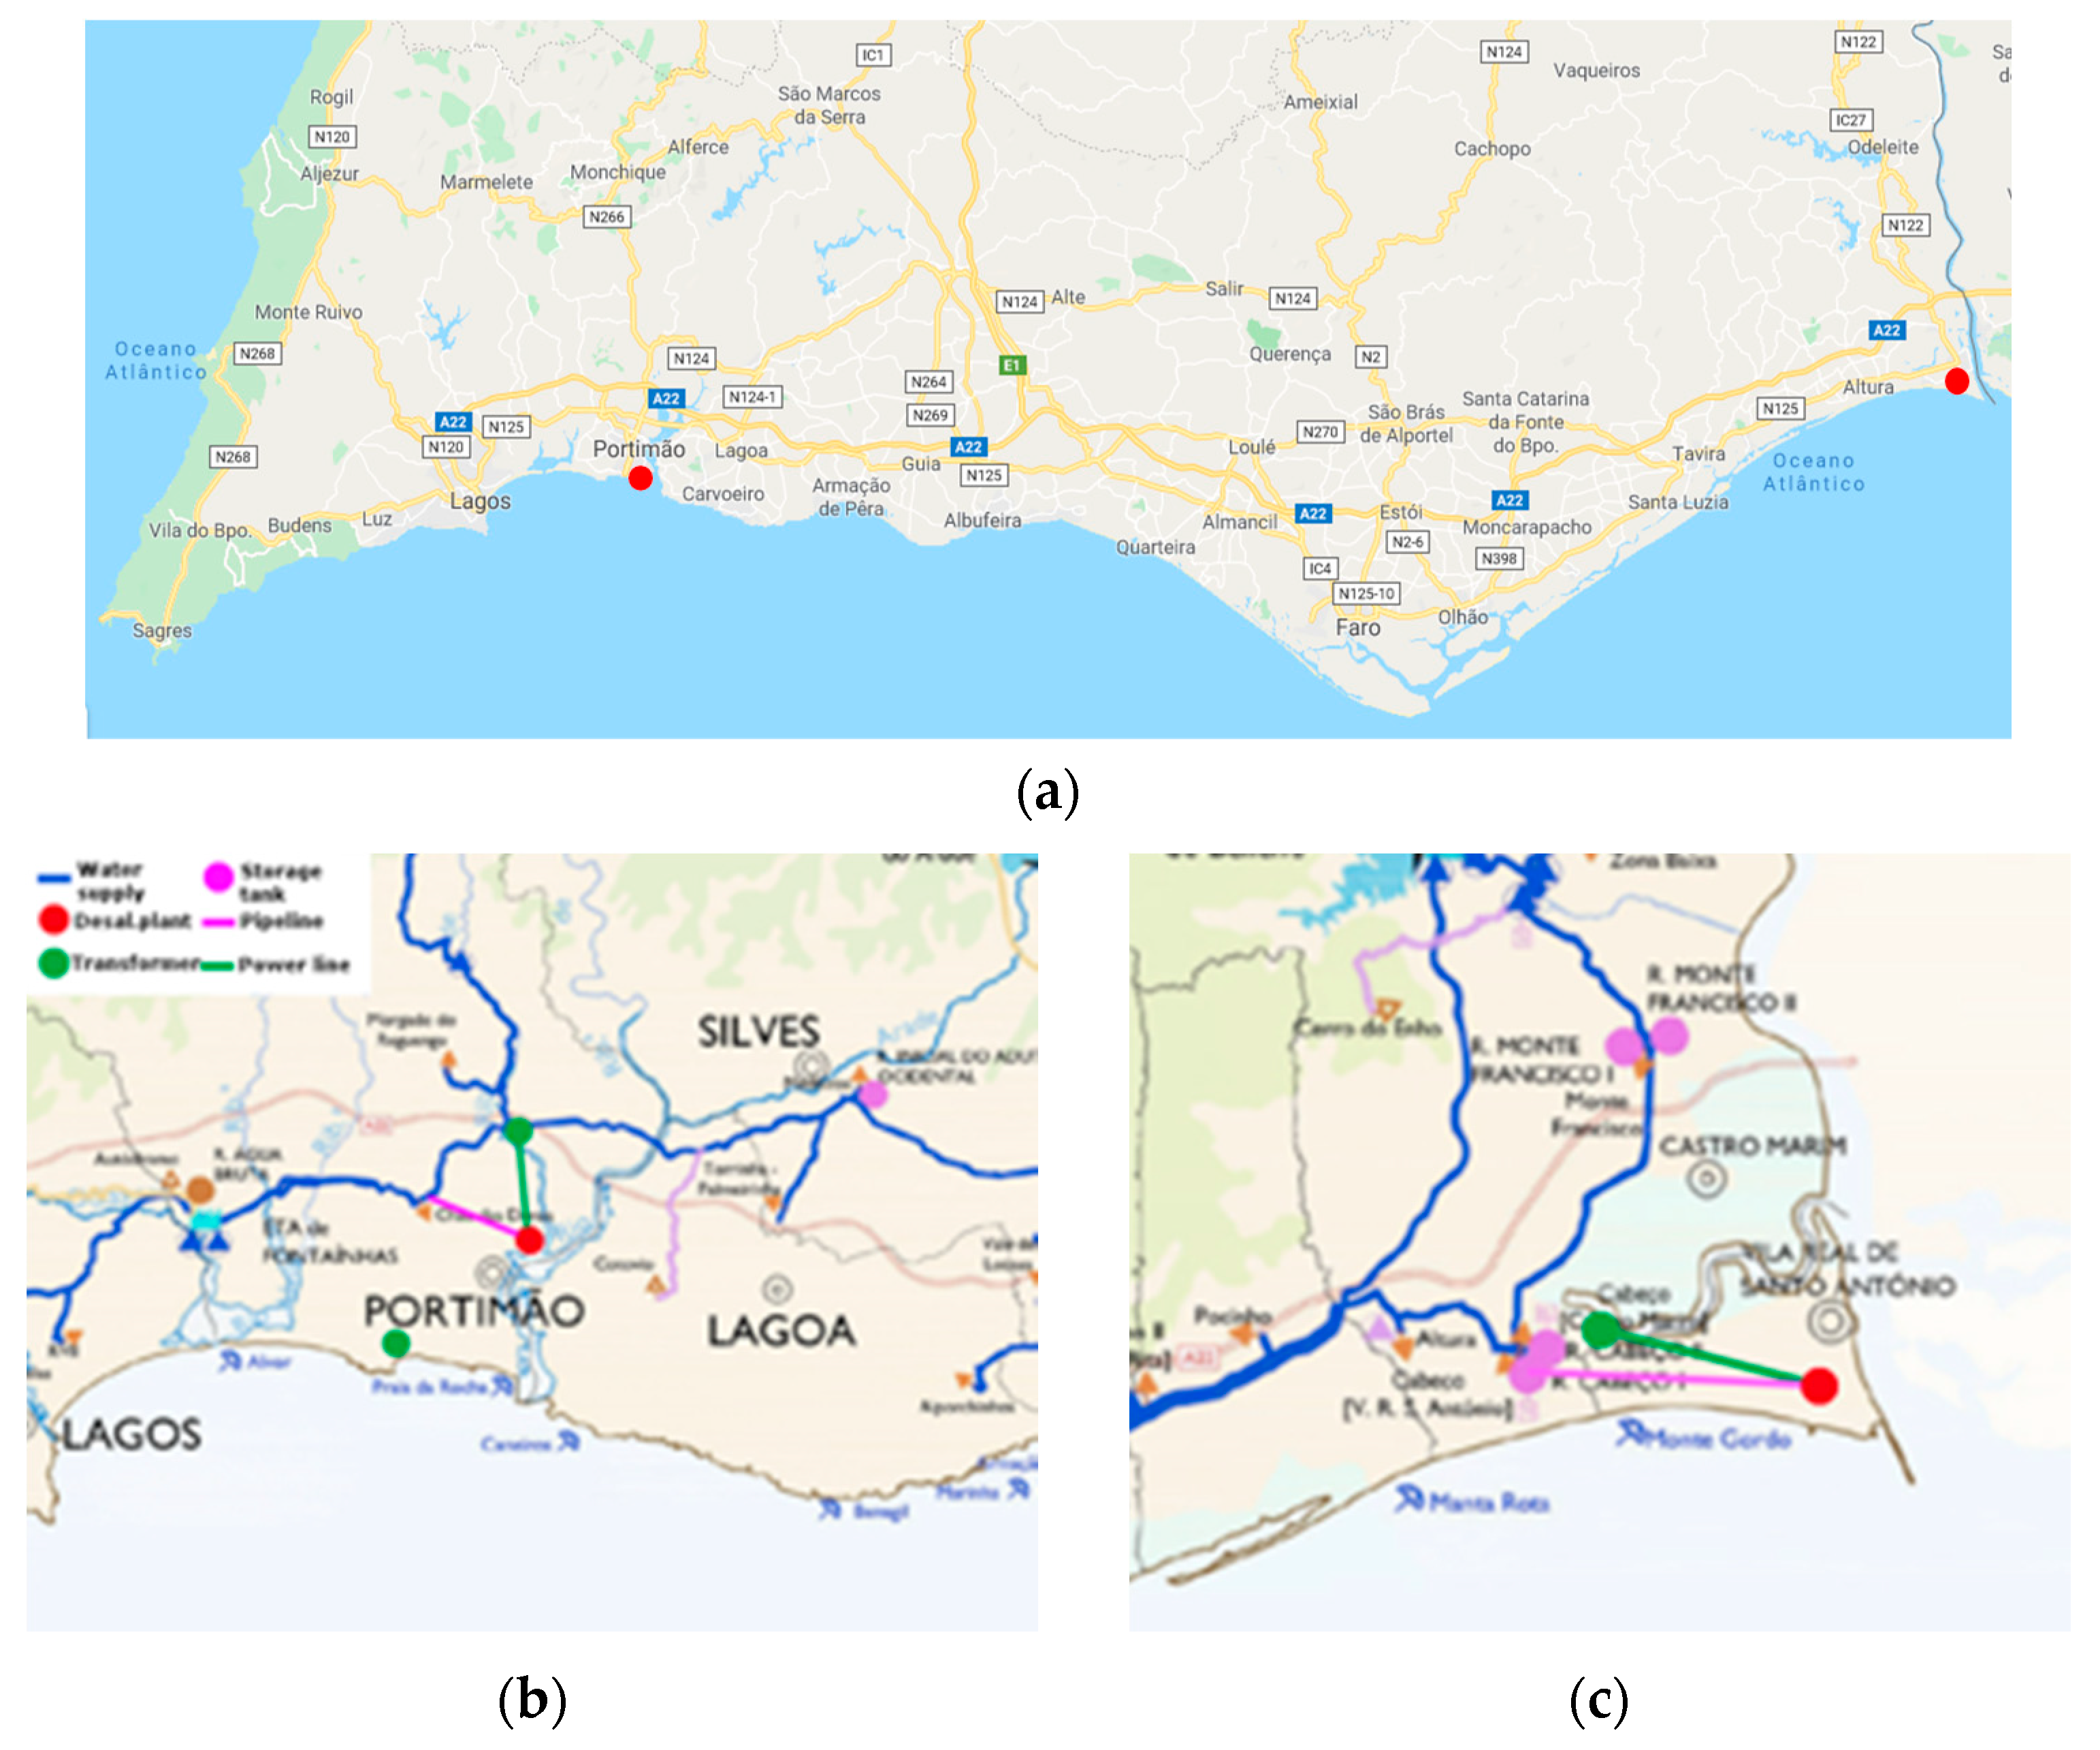
Figure 3 shows the map of the Algarve region with the two potential locations for the desalination plants. The main selection criteria were the proximity to the ocean, to the water distribution network, and to the power grid, while avoiding national park areas and main recreational beaches.
Table 3 and
Table 4 present the characteristics and the CAPEX of the power line and the water supply system, respectively, for each potential location of the desalination plant for the centralized (Algarve) and decentralized scenarios (windward and leeward).
5. Policy Implications
There has been a steady growth in RES production globally, but the larger share of this source of power in the energy mix is aggravating the challenge posed by power demand and supply mismatch. The available surplus RES should increase in the next few decades, and using water desalination as a deferrable load with a setup such as the one proposed in this work will be an increasingly attractive option to policy makers of coastal regions affected by both water scarcity and RES power curtailment.
Desalination technologies should not, however, be used in isolation. Though the plants in this work were dimensioned to supply 100% of the drinking water demand, mixing water coming from desalination, water reuse, and rain harvesting technologies might lead to solutions that are both more cost-effective and sustainable. Policy makers should take a holistic approach when rethinking water supply networks, and they should gradually introduce desalination solutions as the lifetime of current water treatment plants comes to an end. They must also consider the challenges that come with large scale SWRO projects (namely the management of large quantities of brine waste) whose biological impact on marine ecosystems is yet to be fully understood but is known to be very significant.
6. Conclusions
The main purpose of this work was to understand how RES-powered desalination could become a viable solution for water stressed regions such as Algarve, Portugal, and to determine whether a centralized or a decentralized strategy yields the lowest LCOW.
The results of the optimization model indicate that the decentralized scenario is the solution with the lowest LCOW at 72.7 c€/m3, which was 2.1% lower than the centralized scenario’s LCOW and 19.7% lower than the baseline scenario’s LCOW. This result shows that, under the assumptions set for this project, having two smaller desalination plants comes at a slightly lower cost than having one large one. Though the centralized scenario benefits from economies of scale, with yearly savings of 853,000 € in total CAPEX (−3.5%), the increased installed capacity in RES for the plant’s own consumption of the decentralized scenario leads to 2.11 M€ of savings in electricity costs (−13.6%) every year. It must be noted, however, that if the constraint on total RES capacity installed for the centralized scenario is relaxed and set equal to the total capacity installed for the decentralized scenario, the LCOW obtained for one large plant drops to 72.0 c€/m3.
A sensitivity analysis was carried out on three variables: PriceFactor, StorageTank
capacity and FactorRES
penetr. PriceFactor variations were found to have little impact on the LCOW. StorageTank
capacity variations showed that the lowest LCOW obtained was for a setup with no storage tank and that increasing the storage tank capacity has diminishing returns regarding electricity cost savings (which are exclusively related to water pumping). The retained solution settleed for a total storage tank capacity of 10,000 m
3, a compromise between added expenses and the need for an operational security margin. Lastly, a variation in FactorRES
penetr had a significant impact on the LCOW (−7.5% for a RES penetration of 50%). RES surplus availability strongly influences total electricity costs, which makes RES penetration a very important aspect of feasibility studies. Under the conditions set for this project, the recommended solution considered a nominal plant capacity of 175,000 m
3/day at the windward location (Portimão) and a 155,000 m
3/day plant at the leeward location (Monte Gordo). Each of them is equipped with 5000 m
3 of storage tank capacity (for a total of 10,000 m
3), with 1.3 MW of rooftop solar PV, 5 MW of fixed tilt solar PV panels, and 5 MW wind turbines (for a total installed capacity of 12.6 MW of solar PV and 10 MW of wind turbines). The obtained LCOW of 72.7 c€/m
3 ranks among the lowest production costs mentioned by Gao et al. [
18] at around 70 c€/m
3 but is still 61.3% higher than the reference cost of the conventional water supplier. This means that from a purely economic point of view and under the conditions set in this project, water desalination cannot compete with conventional water suppliers. However, the cost structure analysis carried out in this work shows that with the right operational strategy, the electricity costs can be minimized (33.8% reduction when compared to the simplified model), but further cost reductions are hampered by the total CAPEX (298 M€). To make this project economically viable, it is recommended to follow the example of Barcelona’s Llobregat desalination plant project mentioned above. This plant has a capacity similar to the ones considered in this work (200,000 m
3/day), and its total investment has covered with contributions from the European Union’s Cohesion Fund, Spain’s Ministry of Environment, and the company operating the water supply concession that covered about 12% of the total investment [
16].
The solution presented can supply 100% of Algarve’s freshwater demand, making desalinated water a suitable alternative to water sourced from ground and surface resources. This would greatly reduce the stress on local aquifers, allowing them to slowly replenish themselves and avoid the risk of contamination. It would make Algarve’s fresh water supply drought-proof, and it would free surface resources, which are subject to precipitation and to the effects of advancing desertification, for agricultural use. As for CO2 emissions, the decentralized scenario has an advantage over the centralized scenario by consuming less grid power, resulting in a 26.8% increase in CO2 emission savings compared to the centralized solution and a 51.4% increased savings compared to the baseline scenario.
Finally, to implement this solution in practice, it is necessary to assess the type of contract of the RES producers with the national grid. In cases where the RES producers can inject all the power produced in the national grid, they will not have an incentive to participate in this market; on the other hand, the utility responsible for managing the national grid will have an incentive, since it can have an additional power consumption in times of excess RES production. In the cases where the RES producers have incentive to participate in this market, such as when they cannot inject RES power into the grid when there not enough power consumption, the use of the national grid for power transmission will be certainly possible, but a tariff can be charged by the utility.
7. Further Research
Regarding future research, several hypotheses could be tested in order to improve the developed model:
What is the impact of installing batteries in the desalination plants in order to store surplus RES? What would be the resulting RES share of total power consumption? How would it affect the LCOW?
Is an over-dimensioned plant a better solution? By increasing the desalination output capacity, more surplus power could be exploited around the hours of RES production peak before the capacity constraint forced curtailment. Do the electricity cost savings compensate for the increased CAPEX? How could larger storage tanks contribute?
The present work strictly considered solar PV and wind power for the local RES production estimation: Should other RES power sources such as hydro power and biomass be included? What would be the impact on the hourly profile of surplus RES available?
In addition, to fully integrate the desalination plants into the existing water supply network, assumptions related to water management can also be further developed, and existing water pumping efficiency models found in the literature could be considered. Strong assumptions are made, for instance, with regard to the way water is pumped into the water supply network. As previously mentioned, under model limitations, the point of junction where the desalination plant’s pipeline feeds the water supply network has to be sufficiently large so that the volume demand of the entire region can be injected. Taking the network’s hydraulic constraints in consideration would contribute to a more realistic integration of the desalinated water. Finally, freshwater demand could also be estimated for an hourly basis, instead of assuming that demand is an average taken over 24 h.
Finally, it is very important to consider the brine disposal in these scenarios. On one hand, brine disposal will increase costs, but, on the other hand, brine can be used to produce value added products or energy can be recovered from the brine rejection with turbines.


