Article

Evaluation of the Performance of the Drag Force Model in Predicting Droplet Evaporation for R134a Single Droplet and Spray Characteristics for R134a Flashing Spray

1
State Key Laboratory of Multiphase Flow in Power Engineering, Xi’an Jiaotong University, Xi’an 710049, China
2
School of Mechanical Engineering, Nanjing University of Science and Technology, Nanjing 210094, China
3
Department of Mechanical Engineering, Carnegie Mellon University, Pittsburgh, PA 15213, USA
*
Author to whom correspondence should be addressed.
Energies 2019, 12(24), 4618; https://doi.org/10.3390/en12244618
Submission received: 24 November 2019 / Revised: 29 November 2019 / Accepted: 3 December 2019 / Published: 5 December 2019

Abstract

:
Drag force plays an important role in determining the momentum, heat and mass transfer of droplets in a flashing spray. This paper conducts a comparative study to examine the performance of drag force models in predicting the evolution of droplet evaporation for R134a single droplet and spray characteristics for its flashing spray. The study starts from single moving R134a droplet vaporizing in atomispheric environment, to a fully turbulent, flashing spray caused by an accidental release of high-pressure R134a liquid in the form of a straight-tube nozzle, using in-house developed code and a modified sprayFoam solver in OpenFOAM, respectively. The effect of the nozzle diameter on the spray characteristics of R134a two-phase flashing spray is also examined. The results indicate that most of the drag force models have little effect on droplet evporation in both single isolated droplet modelling and fully two-phase flashing spray simulation. However, the Khan–Richardson model contributes to different results. In particular, it predicts a much different profile of the droplet diameter distribution and a much lower droplet temperature in the radial distance. The nozzle diameter has a significant impact on the flashing spray. A smaller diameter nozzle leads to more internse explosive atomization, shorter penetration distance, lower droplet diameter and velocity, and a faster temperature decrease.

1. Introduction

Two-phase flashing spray is usually caused by a sudden release of high-pressure liquid or liquified gas into a low-pressure environment below its saturation pressure in the form of leakages or nozzles. The liquid pressure will experience a rapid decrease while its temperature usually has very little change during this ultra-short period, which makes the liquid superheated. Thus, the explosive atomization and violent flashing spray occur to release the unstable superheat energy, accompanied by strong boiling and evaporation [1]. Due to the low saturation temperature of ~26.1 °C at atomispheric pressure and high volatility, R134a flashing spray usually forms fine and uniform droplets with quite a low temperature, which has wide applications in many fields. For example, R134a flashing spray is an effective way to solve the extreme heat dissipation problems for high-power density electronic devices [2,3,4,5]. In safety areas, R134a flashing spray is usually employed to simulate the flashing spray caused by high-pressure flammable and poisonous liquid, aiming to understand the behavior and characteristics of two-phase flashing flow and, thus, help to evaluate the hazardous zones [6,7]. R134a flashing spray with a short spurt duration (<100 ms) prior to laser irradiation has been successfully applied in laser dermatology for the treatment of port wine stain (PWS) to protect the epidermis from irreversible thermal injuries due to laser absorption by melanin. This will improve the outcomes of laser treatment for PWS patients significantly [8,9,10].
The spray characteristics of R134a flashing spray including spray mophorlogy, droplet diameter, velocity and temperature, etc., is of great significance for its application. Many studies have been engaged in this field to advance the understanding of flashing spray through experimantal methods. Aguilar et al. [11] studied the variations of droplet diameter and temperature along the axial distance for two straight-tube nozzles with different length for R134a flashing spray and found a minor influence of nozzle length on spray droplet evolution. Vu et al. [12] further did experiment to examine the effect of nozzle length on spray behavior. Similar observations were found with those by Aguilar et al. [11]. Yildiz et al. [12] measured droplet size and velocity variations of R134a flashing spray with different nozzle diameters. They found that a rapid decrease existed in the droplet diameter and velocity near the nozzle field, and the nozzle diameter affected the droplet diameter and velocity greatly. Zhou et al. [13] experimentally investigated the global distributions of droplet diameter, velocity and temperature, and the empirical correlations of droplet velocity and temperature variations were proposed. Afterwards, they comparatively investigated the spray behavior and surface heat transfer of flashing spray cooling with 50 ms spray duration using different refrigerants of R134a, R407C and R404A [9]. Their study revealed that the cooling performance was mainly determined by droplet temperature, droplet diameter and velocity. An optical combination could be achived at certain spray distance, resulting in superior cooling effect.
Compared with the experimental study, there are less numerical study on cyogen flashing spray cooling. Wang et al. [14] conducted a numerical study on R134a flashing spray thourgh a three-dimensional vortex method. Droplet temperature, diameter and veloity variations were reported only in the first 30 mm region near nozzle exit. Zhou et al. [15] used OpenFOAM to numerically study R404A flashing spray. They proved that the numerical results matched the experimental results reasonably in terms of spray mophology and droplet diameter. Recently, Chen et al. [16] conducted a theoretical study on the spray charateristics and surface transient heat transfer of R134a, R404A and R1234yf spray cooling. In this study, droplet properties, such as diameter, velocity and temperature, were obtained by a 3D hybrid vortex method, and then they were related with surface heat transfer through a dimensionless correlation in terms of Jakob number (Ja), Weber number (We), and Reynolds number (Nu). The results indicated that spray characteristics played a decisive role in determining surface transient heat transfer, and the cooling performance could be effectively enhanced by adjusting the spray conditions.
As one of the key processes in flashing spray, droplet motion mainly determines the momentum interaction between droplet(s) and the ambient gas, consequently affecting droplet velocity, breakup and evaporation. Droplet motion depends on the drag force acting on itself because gravity is usually ignored in spray simulations with droplet diameters smaller than 100 μm. There are over 30 equations in the literature relating the drag force coefficient to the Reynolds number for spherical particles [17,18,19]. For a low Reynolds number (Re) flow, in most of the literature, the drag coefficient is defined as C D = 24 Re However, as the Reynolds number increases, deviations from the above equation become progressively greater [19]. On the other hand, how the drag force coefficient influences vaporizing droplet evolution of the diameter, velocity and temperature for a single isolated droplet and for droplets in flashing spray with low saturation temperature and high volatile cryogens is still unclear.
Thus, this paper conducts a comparative study to examine the performance of several selected drag force models in predicting the evolution of droplet evaporation for R134a single droplet and spray characteristics for its two-phase flashing spray through a two-stage procedure. Firstly, the temporal diameter, velocity and temperature evolutions of a single isolated droplet moving in a atmospheric environment is modelled. Then, R134a two-phase flashing spray is simulated by a modified sprayFoam solver in OpenFOAM (The OpenFOAM Foundation Ltd, Incorporated in England, London, UK) through a Reynolds Average Navier–Stokes simulation. Finally, the effect of nozzle diameter on R134a flashing spray is investigated by a selected drag force model.

2. Numerical Models

2.1. Single Droplet Evporation Model

For single droplet evaporation, as schematically shown in Figure 1, we mainly consider mass, heat and momentum transfer between the droplet and the surrounding gas. The following assumptions are made to reduce the complexity of analysis: (1) the droplet is always spherical, (2) the droplet temperature is uniform throughout whole droplet but varies with time, (3) the liquid/gas interface is at local equilibrium and ambient gas is not soluble in droplet, and (4) the Soret and Dufour effects are ignorable and, finally, the radiation is neglected. Considering the mass diffusion and Stefan’s flow effect, the droplet vaporization rate dD/dt can be written as [1,20]:
d D d t = 2 Γ v D ρ ¯ g ρ l S h ln ( 1 + B M ) ,
where t and D are the time and droplet diameter. ρ l and ρ ¯ g are the liquid droplet density and the mixture of vapour and gas density in boundary layer. Sh and Γv are the Sherwood number and binary diffusion coefficient, respectively. BM is the Spalding mass transfer number.
B M = Y v , s Y v , 1 Y v , s ,
Yv, represents the vapour mass fraction at the far field away from the droplet surface (R), which usually equals zero. Yv,s represents the vapour mass fraction on droplet surface (Rs). It can be calculated through Clausius–Clapeyron equation [21].
Given that there is no temperature gradient within the droplet, heat transfer only takes place at the droplet interface through convection. Assuming that the gas temperature is larger than the droplet temperature, the convective heat transfer from the gas will accommodate the latent heat for evaporation and the heat for changing the temperature of the remaining liquid. Therefore, the energy balance equation for vaporizing droplet is given as follows [22]:
d T d t = ( T T g ) ( 6 N u λ ¯ g D 2 ρ l c p l + 3 1 B T 1 D d D d t ) ,
where Tg and T are the gas and droplet temperatures; Nu is the Nusselt number; c p l and λ ¯ g are the liquid specific heat and average thermal conductivity of the mixture gases in the boundary layer; and BT is the Spalding heat transfer number given by:
B T = c ¯ p g ( T g T ) L ,
where L and c ¯ p g are the latent heat of evaporation and average specific heat of the mixture gases in the boundary layer.
For small droplets with diameters smaller than 100 μm, the force of gravity is usually negligible. Therefore, droplet velocity mainly depends on the drag force acting on itself due to the relative motion between the droplet and its surrounding gas. Then, the momentum equation can be written as follows:
d U d t = 3 4 ρ ¯ g ρ l C D D ( U U g ) 2 ,  
where U, Ug and CD are the droplet velocity, ambient gas velocity (Ug = 0) and drag force coefficient. From Equations (5), it can be noticed that droplet velocity mainly depends on drag force model CD, which in return influences the droplet mass and heat transfer. This is due to the mass and heat transfer Equations (1) and (3) being determined by Nu and Sh numbers, which are the functions of Re (Re = ρUD/μ).

2.2. Two-Phase Flashing Spray Model

The numerical model of a two-phase flashing spray includes both the gas phase (continuous phase) and liquid phase (discrete phase), as well as the two-way interaction between them. The Eulerian and Lagrangian approaches are adopted to track the gas and liquid phases, respectively, and the coupling of two phases is through the source term S.

2.2.1. Gas Phase

The continuity conservation of gas phase is given by [23]:
ρ t + · ( ρ U g ) = S e v a p ,
where ρ is the gas density, U g is the gas velocity vector, t is the partial derivative with respect to time and S e v a p is the mass source term due to droplets evaporation.
Based on the Reynolds Average Navier–Stokes assumption (RANS), the momentum conservation equation is given as follows, and S m o m is the momentum source term. The standard k-ε model is employed to calculate the turbulence [23]:
ρ U g t + · ( ρ U g U g ) · μ e f f U g · μ e f f [ ( U g ) T 2 3 t r ( ( U g ) T ) I ] = ρ g p + S m o m ,
where and · are the gradient operator and divergence operator, tr denotes the trace operator, T represents the transpose operation, I is the identity matrix, μ e f f is the effective dynamic viscosity and g and p are the gravitational acceleration and pressure.
Due to droplet evaporation, the species conservation equation is expressed as follows and S e v a p , i is the mass source term caused by spray evaporation [23]:
ρ Y i t + · ( ρ U g Y i ) · μ e f f Y i = S e v a p , i ,
The energy conservation equation is given by [23]:
ρ h s t + · ( ρ U g h s ) · α e f f h s = D p D t + S h e a t ,
where α e f f is the effective thermal diffusivity, h s is specific enthalpy, D p D t is the total derivative of p and S h e a t is the source term which can be calculated from heat transfer model.

2.2.2. Liquid Phase

For the liquid phase, droplet motion, breakup, evaporation/boiling, heat transfer and injection models are all taken into consideration in the numerical simulation. In this paper, the Reitz Diwakar breakup model [24] and Adachi correlation [25] are employed to simulate droplet breakup and superheated liquid boiling, respectively. Droplet equilibrium evaporation and heat transfer models are the same as those for single isolated droplet, i.e., Equations (1) and (3). The injection model used here is a solid-cone injection model, in which the most commonly used Rosin–Rammler form is employed to represent the droplet diameter distribution at nozzle exit. The initial velocity is calculated by the difference between injection and ambient pressures. Details can be found in [15].
For droplet motion, the major force for R134a droplets is the drag force ( F D ) due to the relative motion. The basic equation for droplet motion is given by the following equation if the gravity is neglected:
F D = m p d U d t = m p 18 μ ρ l D 2 C D R e 24 ( U g U ) ,
where m p is the total mass of droplet. Equations (5) and (10) are consistent, in which the drag force coefficient plays a decisive role in determining droplet momentum.
As mentioned above, there are numerous models of drag force coefficient in the previous literature. In this study, several typical models for spherical particles are examined to investigate their effect on the numerical prediction in droplet evaporation and spray characteristics for R134a single isolated droplets and for flashing spray. The details of these models are given in Table 1.

3. Modelling and Simulation Methods

R134a single droplet evaporation has been modelled by a C++ code, in which the conservation equations of mass, energy and momentum are discretized and iterated simultaneously. The validation of single droplet evaporation modelling has been demonstrated in our previous work for water, n-decane and R407C droplets [1,20,29]. The initial parameters of single R134a droplet evaporation modelling are shown in Table 2.
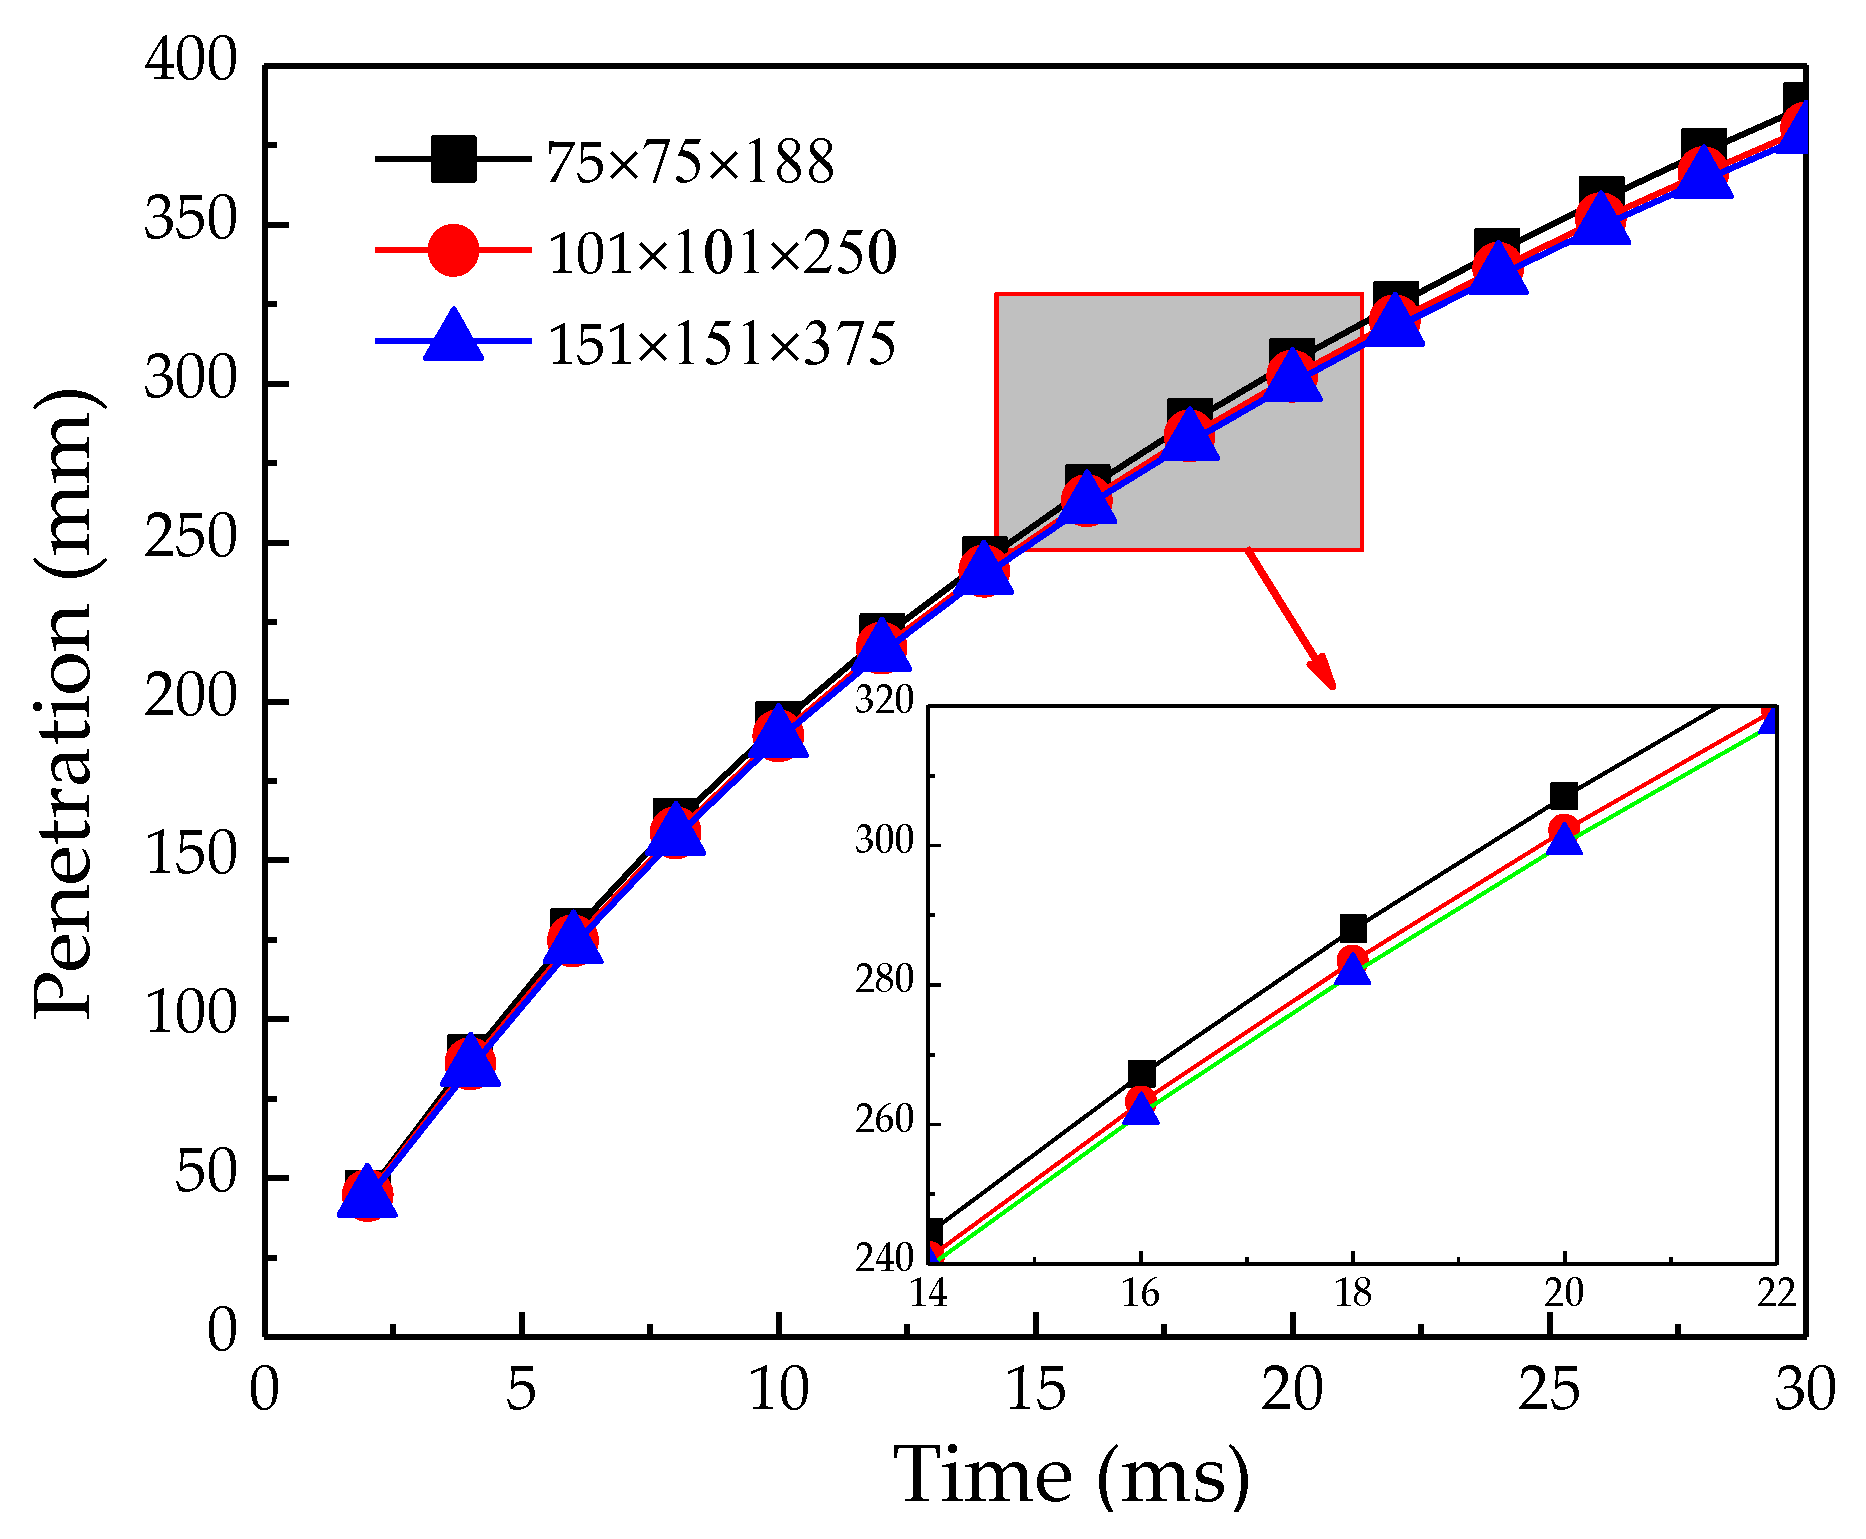
For the simulation of R134a flashing spray through OpenFOAM (The OpenFOAM Foundation Ltd, Incorporated in England, London, UK), we track parcels which represent multi-droplets with the same characteristics, instead of tracing each droplet. This method will enhance the computational efficiency greatly. The initial parameters for the numerical simulation are shown in Table 3, which are consistent with the R134a flashing spray experiment conditions [13]. The cuboid computation domain with uniform grid is adopted with a length, width and height of 200 mm, 200 mm and 500 mm, respectively. The straight-tube nozzle is positioned at the centre of the top surface. Three different size grids are tested to examine the grid independence. As can be seen in Figure 2, the penetration distance of R134a flashing spray does not vary with grid number larger than 101 × 101 × 250. Therefore, this grid was chosen in the simulation with 2,550,250 cells in total. The common method of examining the validation of a spray simulation is to compare the simulated spray morphology or droplet diameter variation with experimental results [15,30]. Here, we first compare the numerical spray morphologies of liquid and gas phases with experimental spray image of R134a flashing spray captured by high speed camera. As can be seen in Figure 3, they are consistent with each other. Both the numerical and experimental spray morphologies expand rapidly towards the radial direction and then remain relatively stable as the spray goes further. Droplet D32 diameters from experiment and numerical simulation will also be compared and discussed in the next section to further validate our simulation. More valuable information about the numerical approach and validation can be found in [31], in which Minea et al. provide good guidance on how to rigorously develop a numerical approach and how to validate the grid and the model.

4. Results and Discussions

In this part, the results of R134a single droplet evaporation will be introduced and discussed firstly, and then it followed by the R134a flashing spray. Finally, we will talk about the nozzle diameter effect on the spray characteristics of R134a flashing spray.

4.1. Effect of Drag Force Model on the Prediction of Single Droplet Evaporation

Figure 4 presents the predictive results of R134a single droplet, (a) diameter, (b) velocity and (c) temperature variations as a function of flight distance by five different drag models given in Table 1. As shown in Figure 4a, droplet diameter variations along the distance predicted by five different drag models show a similar trend. That is, the droplet diameter has a rapid reduction in the first 50 mm because of the higher evaporation rate at the initial stage, and then follows a relative gentle reduction at the downstream region far from 50 mm. The droplet diameter does not show a linear variation as the classical D2 law for a stagnant droplet. This can be explained by the fact that Figure 4a is plotted in the form of D versus flight distance. The O’R, F–B, T–L and H–L models predict almost the same diameter results, obtaining a diameter of 82 μm at a distance of 200 mm. However, the K–R model predicts much different results with a larger evaporation rate, resulting in a much lower droplet diameter than those by other four models. The predicted diameter is about 73 μm at the distance of 200 mm by the K–R model.
As for the droplet velocity variation shown in Figure 4b, all results of the different drag models also follow a similar trend in that the droplet velocity decreases along the distance due to the drag force acting on the droplet. The F–B model predicts a slightly higher velocity than the O’R, T–L and H–L models do. No difference can be found among the results predicted by the O’R, T–L and H–L models. However, the K–R model predicts a far lower droplet velocity and larger decreasing rate compared with the other four models.
The variations of droplet temperature along the distance predicted by five models are shown in Figure 4c. Generally, the droplet temperature firstly shows an exponential decrease due to the high evaporation rate because of the high temperature. For droplet equilibrium evaporation, mass transfer only happens at the droplet surface. The gradient of the vapour mass on the droplet surface governs the magnitude of the mass transfer rate. Vapour concentration is calculated through the Clausius–Clapeyron equation [21], in which a higher droplet temperature causes a higher vapour concentration on the droplet surface. As is well known, evaporation needs to absorb heat, however, the heat transferred from the surrounding gas through convection cannot provide enough heat due to the rapid evaporation in the initial period. As a result, it absorbs heat from the remaining liquid of the droplet, leading to the rapid decrease in the droplet temperature. The decreasing droplet temperature in turn slows down the droplet evaporation rate and enhances the convective heat transfer due to the larger temperature difference between the droplet and the surrounding gas. This leads to a smaller magnitude in the droplet temperature decreasing rate. Finally, the droplet reaches its minimum temperature value once the latent heat of evaporation is completely balanced by the convective heat transfer. In contrast to the cases in the droplet diameter and velocity, the drag force models have less effect on the predictive temperature. The O’R, F–B, T–L and H–L models predict a nearly identical droplet temperature history with final minimum temperature of −59 °C. Although the K–R model predicts a slightly smaller droplet temperature from distances of 20–150 mm, it still predicts the same minimum temperature as those of the other models.

4.2. Effect of Drag Force Model on the Prediction of Flashing Spray

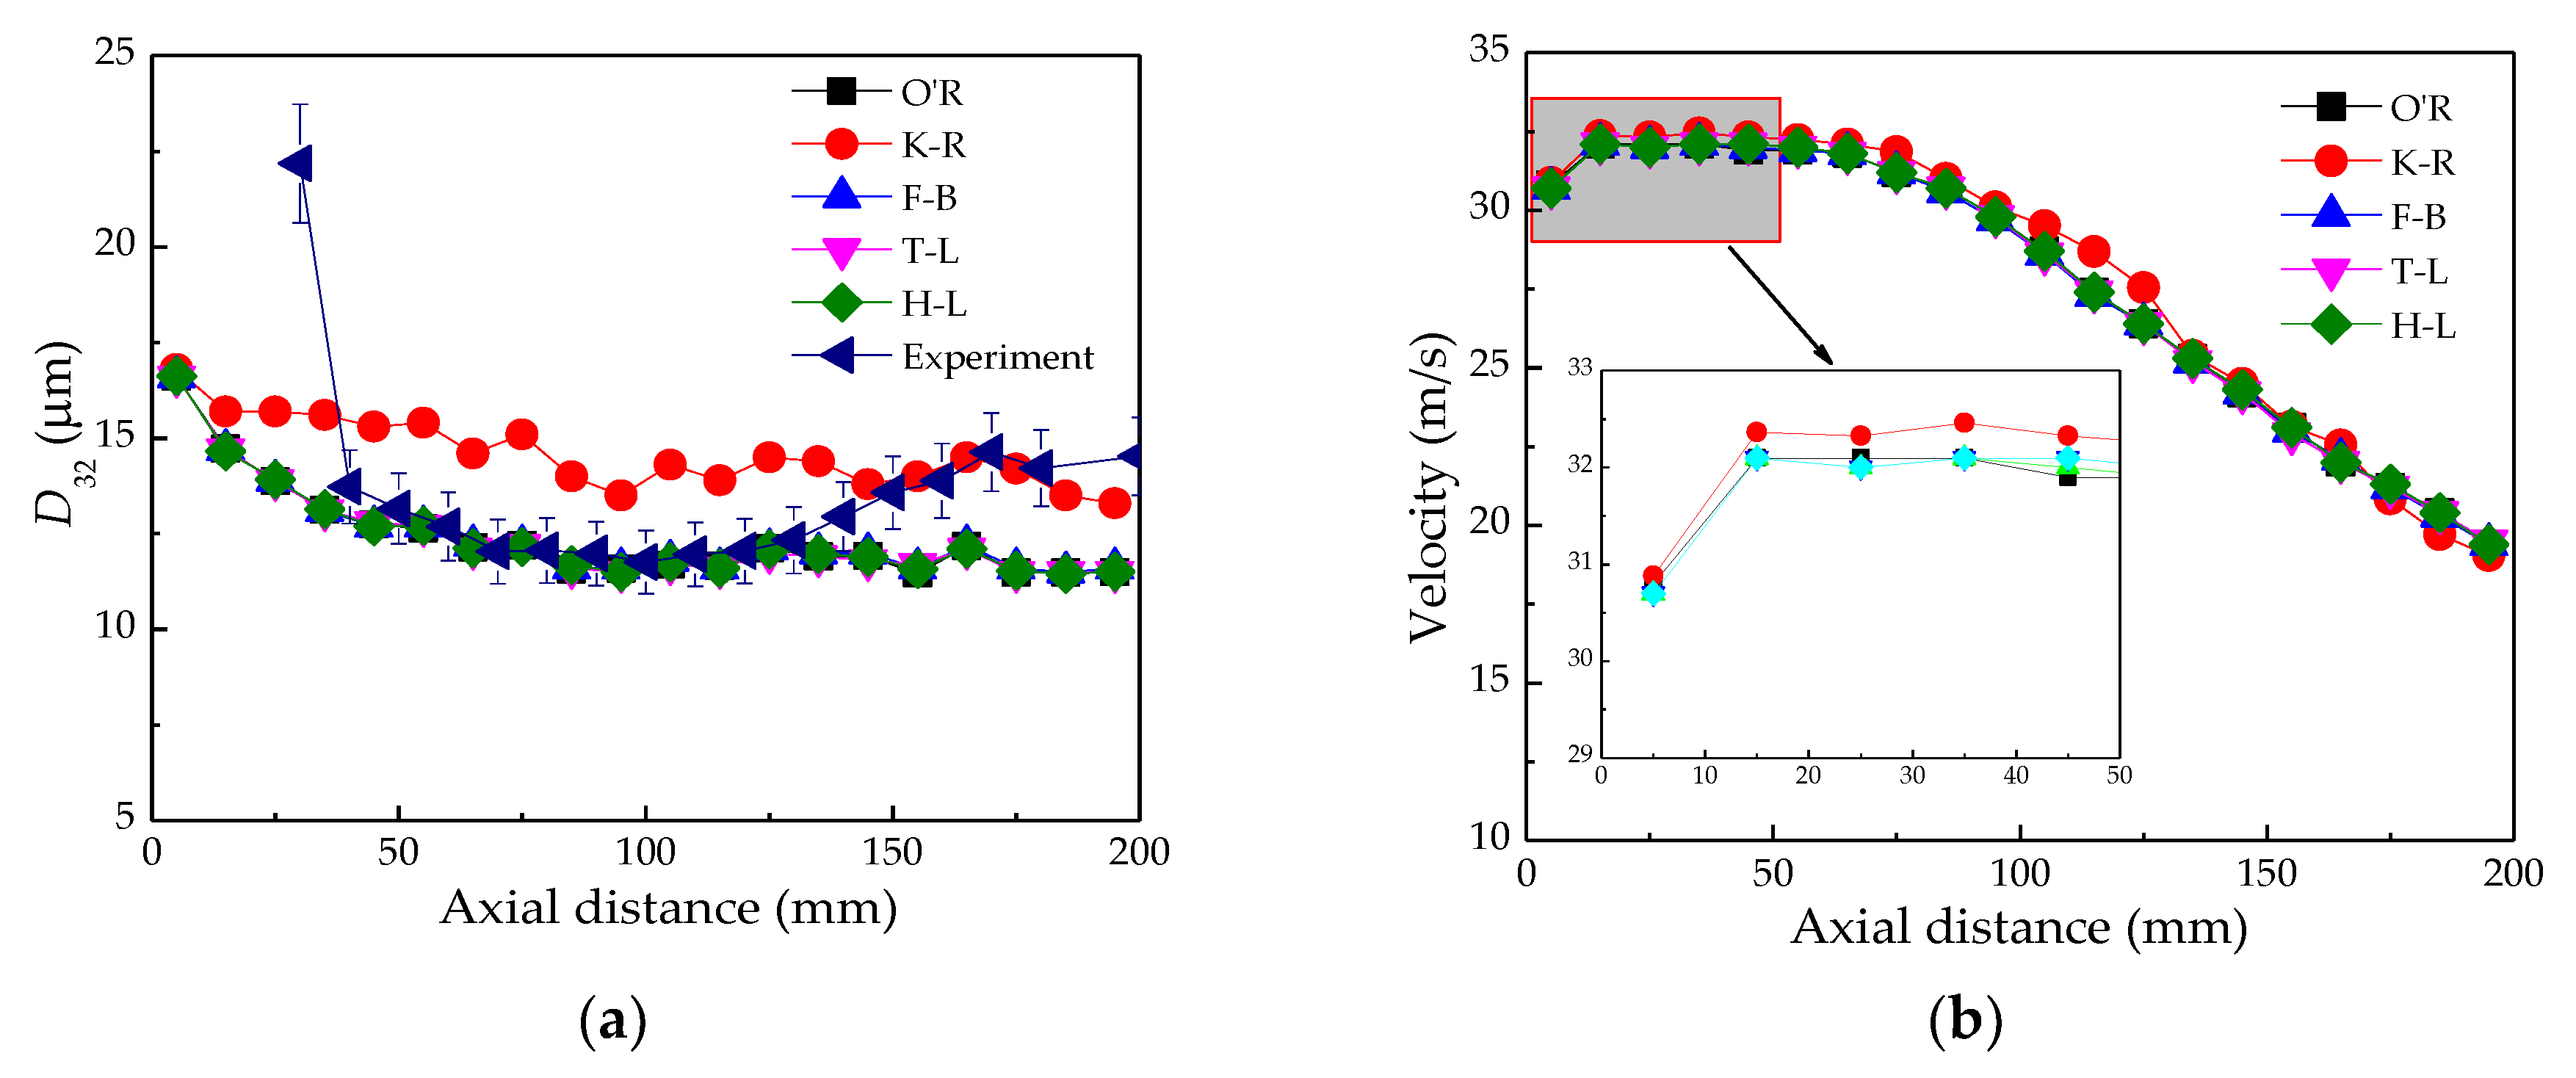
Figure 5 presents the variations of the droplet diameter, velocity and temperature along spray centreline of R134a flashing spray predicted by five models given in Table 1. As shown in Figure 5a, apart from K–R drag model, other four drag models result in a similar pattern of D32 variation that agrees well with the experimental result obtained by a phase Doppler particle analyser [13]. Both the experimental and numerical results witness a quick reduction in the droplet diameter near the nozzle field, which can be explained by the explosive atomization of R134a superheated liquid. The high-pressure saturated or sub-cooled liquid within the nozzle experiences a dramatic pressure drop once it is discharged into the low-pressure atmospheric environment while the liquid temperature changes little, which superheats the liquid. In order to release the non-equilibrium superheated energy as quickly as possible, strong boiling and vaporizing occur both within the liquid and on the liquid’s surface. In addition, the collapse of bubbles near the nozzle exit that might form within the nozzle also helps to shatter the liquid. Both of these cause a strong breakup and a rapid decrease in the droplet diameter near the nozzle field. The droplet diameter does not decrease rapidly when the superheat is completely released, and it becomes relatively stable, fluctuating around 12 μm from 50 mm. However, the K–R drag force model fails to fit the above pattern. The reduction in the droplet diameter predicted by the K–R model can be still observed, but it is not as drastic as those in the experiment and in the simulation by the other four models. Moreover, the K–R model predicts a larger droplet diameter than the experimental data and those of the other models. This is probably because the K–R drag model fits well with solid spheres but it fails to provide the best description of the drag force coefficient for the evaporation of droplets, like with R134a droplets.
As shown in Figure 5b, the droplet axial velocity curves predicted by all models present quite similar profiles. In the first 50 mm away from the nozzle exit, the droplet velocity first experiences an acceleration period, which is a typical characteristic of flashing spray due to the explosion of the superheated liquid. Another possible explanation for the acceleration phenomenon is that the collapse of bubbles will result in a high-speed gas flow near the nozzle exit. The high-speed gas certainly accelerates the low-speed droplets until their velocities are the same. As noticed during the acceleration region, the K–R model generates the highest axial velocity among the five models. No obvious difference can be found in the simulated results by the other four models. The droplet axial velocity starts to decline due to the drag force once the superheat is completely released in the region of 50 mm. Unlike the other four models predicting a near linear decrease, the slope of the droplet axial velocity in K–R drag model fluctuates a great deal along the axial distance.
As shown in Figure 5c, all models predict a similar droplet temperature variation. That is, the droplet temperature has a rapid decrease in the near nozzle field due to the strong boiling and evaporation induced by the superheated liquid. As mentioned above, the convective heat transfer is not enough to provide the latent heat for the rapid evaporation. Afterwards, it follows a gradual decrease because of the continuous evaporation. Finally, the droplet temperature reaches the minimum value at the far end when the convection heat transfer could provide enough energy for droplet vaporizing. Apart from the K–R drag model, the other four models have little impact on the numerical result of droplet temperature along the axial distance. The K–R model results in a more rapid temperature reduction near the nozzle exit. The gap between the results by the K–R model and the other four models becomes smaller as the flashing spray develops further. As can be seen, all models predict almost an identical temperature in the far spray region. Overall, in contrast to the effect on the droplet diameter and velocity, the drag force model has less of an effect on the predictive result of the droplet temperature. This phenomenon is consistent with the case of R134a single isolated droplet modelling.
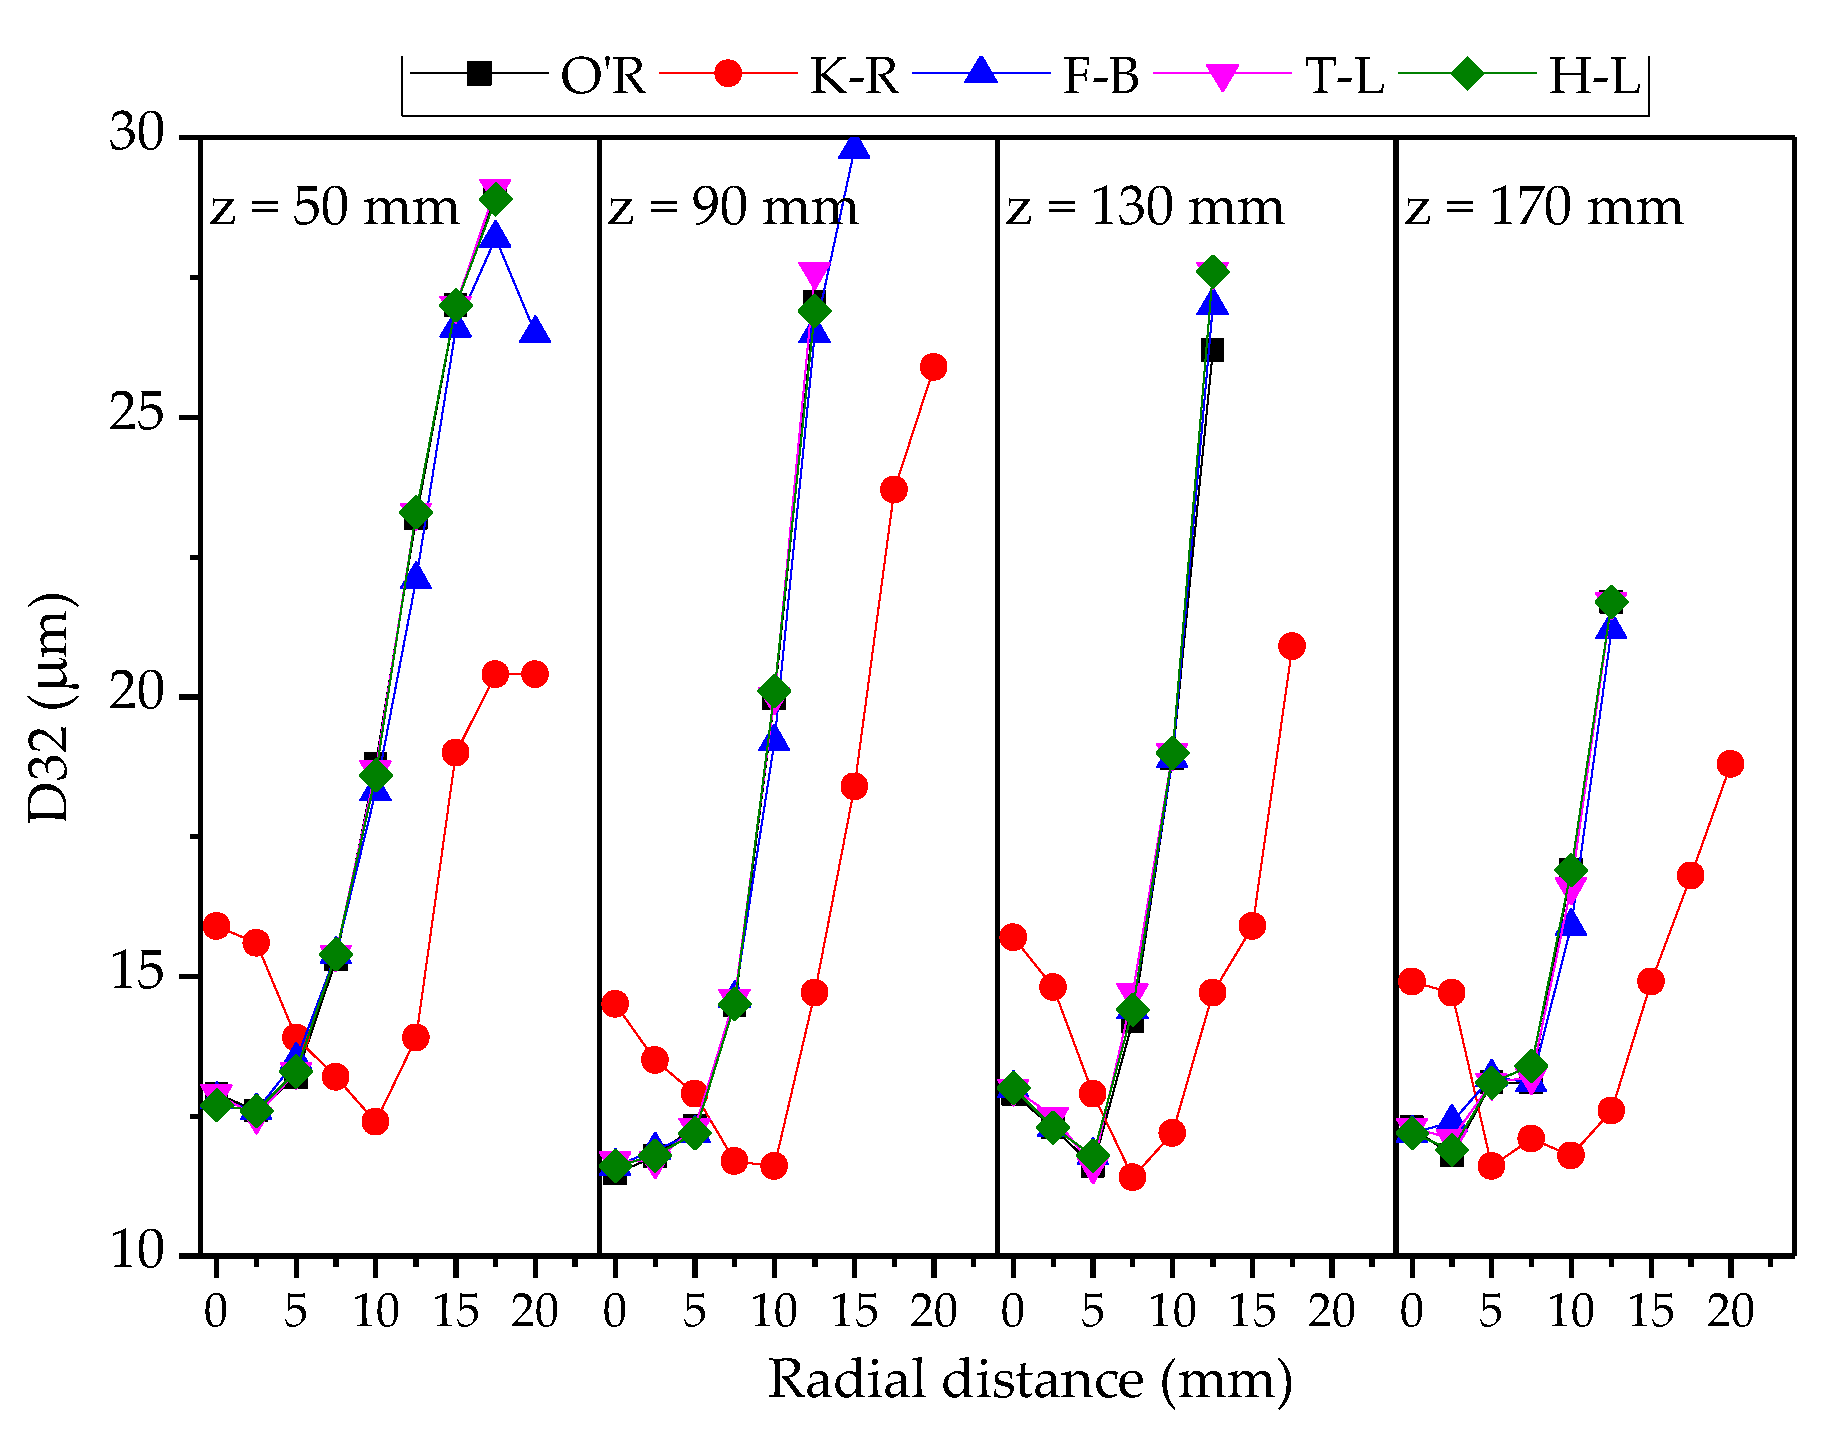
The radial variations of the droplet diameter, velocity and temperature at four spray sections (Z = 50, 90, 130 and 170 mm) of R134a flashing spray predicted by five drag force models are shown in Figure 6, Figure 7 and Figure 8. As shown in Figure 6, O’R, F–B, T–L and H–L models predict similar radial distributions. D32 presents a nearly monotonous increase with radial distance from the spray centre. This is probably due to the stronger shear force acting on droplets in spray centre than that at the spray periphery, which can be proved by Figure 7 that the spray centre has a much higher droplet velocity compared with periphery region. However, the K–R model predicts a “V” shape of the droplet diameter radial distribution, which is quite different from those by the other four models. Droplet diameter decreases firstly as the radial distance increases from the spray centre (R = 0). The minimum droplet diameter appears at a radial distance of around 10 mm, then the droplet diameter starts to increase with the radial distance.
As shown in Figure 7, all five models predict similar radial distribution profiles of the droplet velocity. That is, the highest droplet velocity is located at the spray centre, and the droplet velocity decreases rapidly with the increase of the radial distance due to the more intense interaction between the droplet and ambient gases. The largest difference among the predictions still lies between results by the K–R model and those by other four models. That is, the K–R model predicts a higher droplet axial velocity along the radial distance than its counterparts do. This difference becomes smaller at farther distances. Compared with the relatively large difference in droplet diameter predictions, the drag force model has less impact on the predictions in the droplet velocity radial distribution.
As shown in Figure 8, all models bring about a similar trend of droplet temperature radial variation at the four spray sections. A high-temperature region near the spray centre and a relative low-temperature region near the spray edge can be observed. This is probably attributed to the high concentration of vapour in the spray centre that prohibits the evaporation rate. Moreover, the lowest droplet temperature is not at the edge of the spray but at a point in the middle. As the axial distance increases, the radial temperature distribution becomes more uniform due to the more dispersed spray with more dilute droplet density. This feature of droplet temperature radial variation is highly consistent with the experimental observations [1,13]. Once again, the temperature result of K–R drag model varies much from those of the other models. It generates a much lower minimum temperature than those of the other models and the experimental data [13].
From above results of the performance of drag force models in predicting droplet evaporation for single R134a droplet and spray characteristics for R134a flashing spray, it can be concluded that the K–R model predicts different results than those by other four models and experiment. Therefore, we plot the variation of CD as a function of Re (<1000) from different drag force models. As can be seen from Figure 9, the K–R model predicts quite a different pattern compared with the others. That is, CD predicted by the K–R model varies very little with the Reynolds number ranging from 0 to 1000, while other models predict a rapid decrease in CD at low Re number. Therefore, a far lower value of CD at low Re number (<100) results while a larger value of CD results at a high Re number (>100) than those of the four other drag force models, which causes the discrepancy in the predictive results of the droplet evaporation and flashing spray.

4.3. Effect of Nozzle Diameter on R134a Flashing Spray

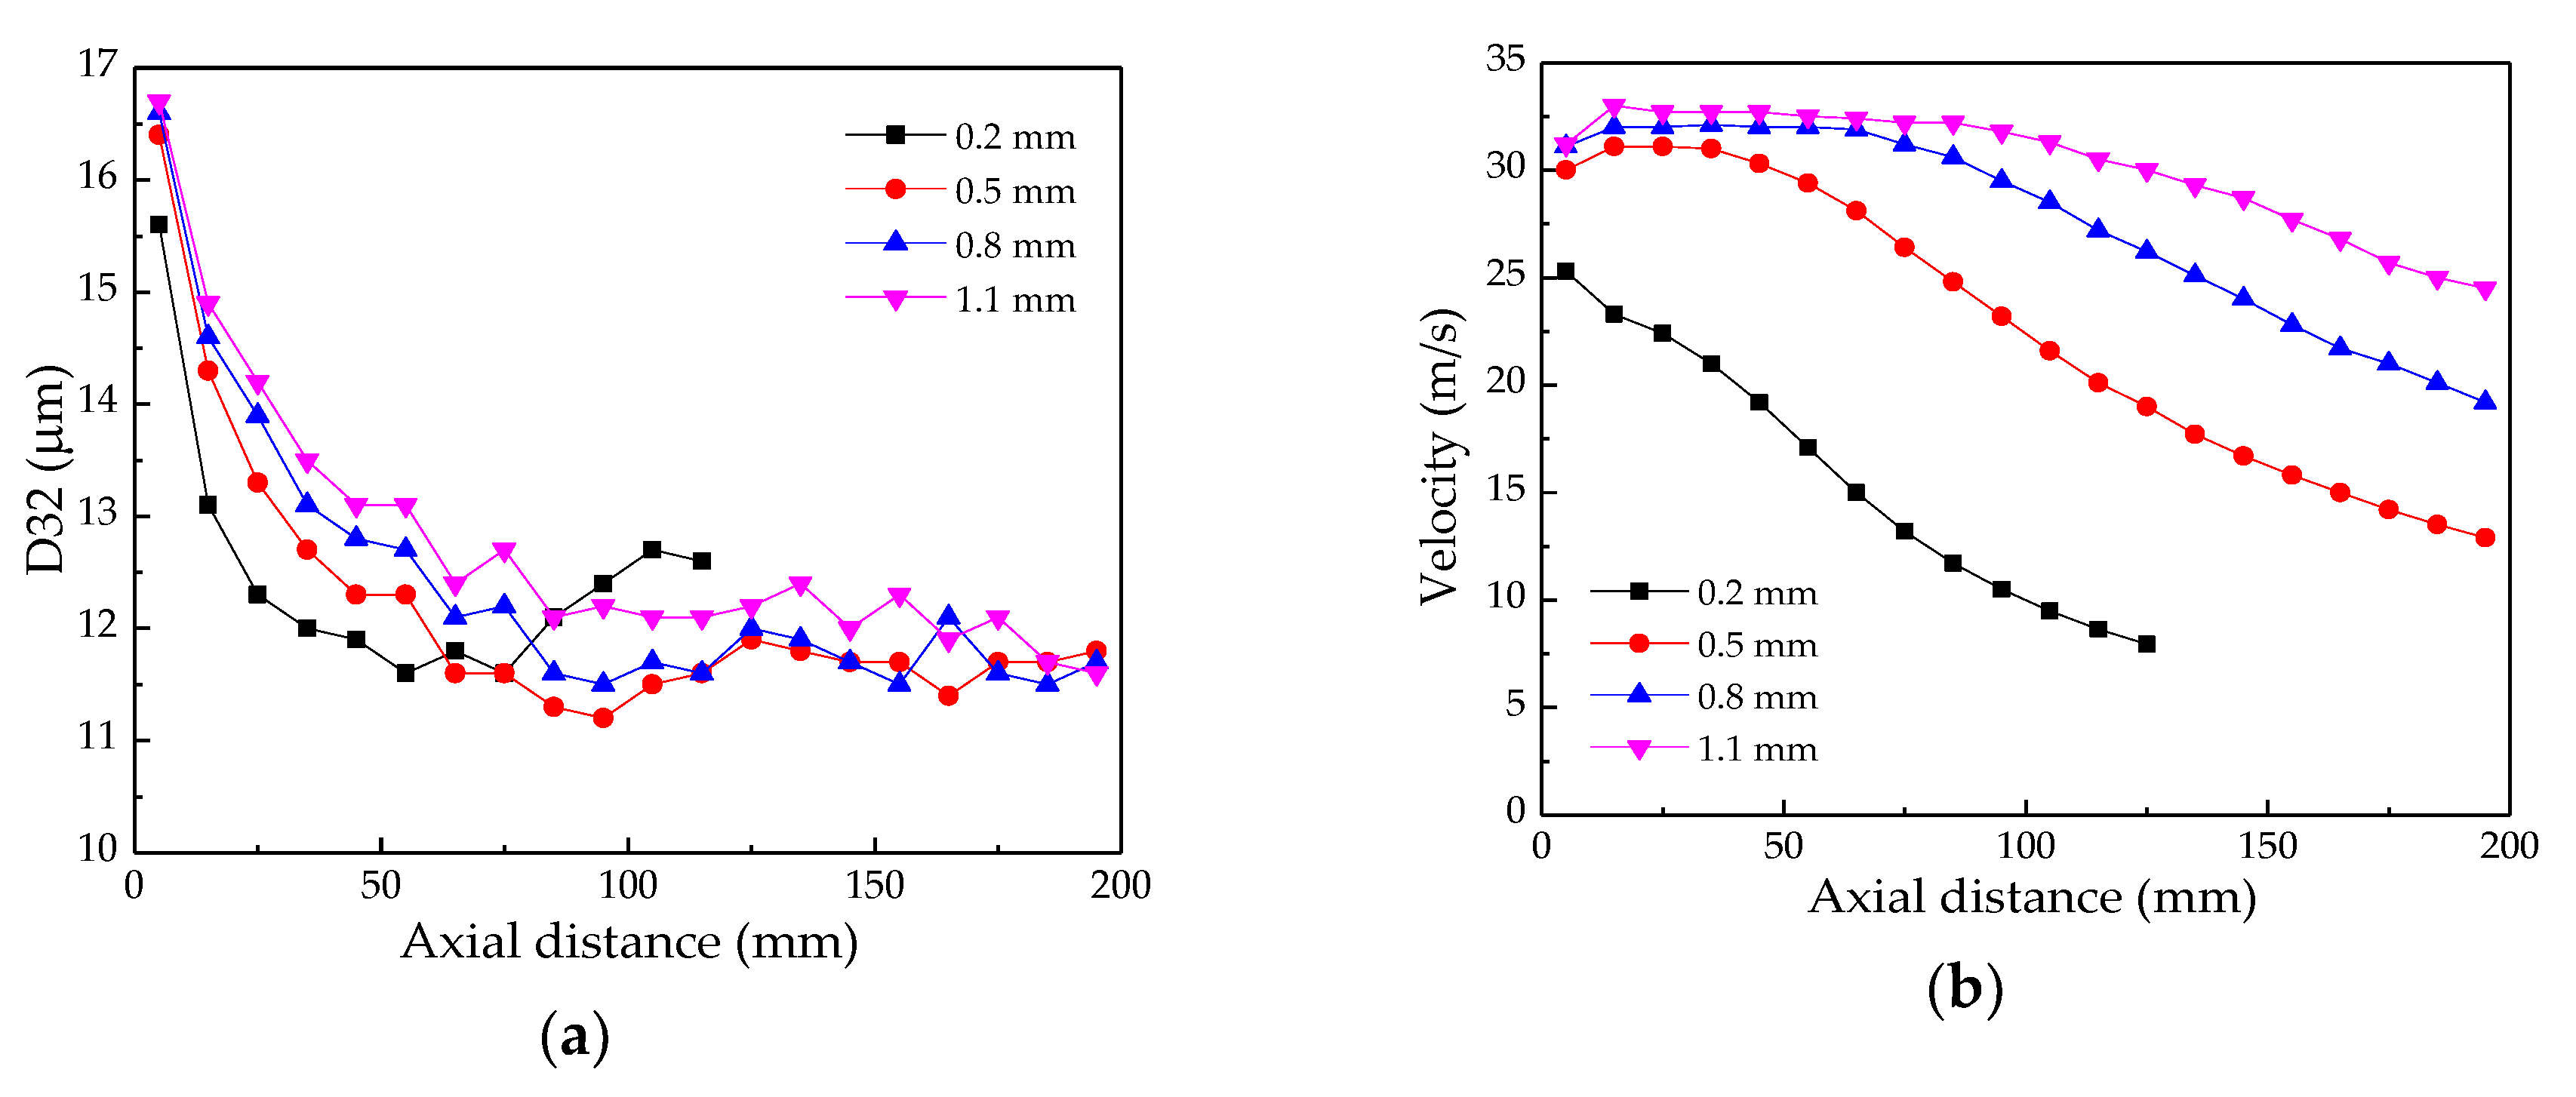
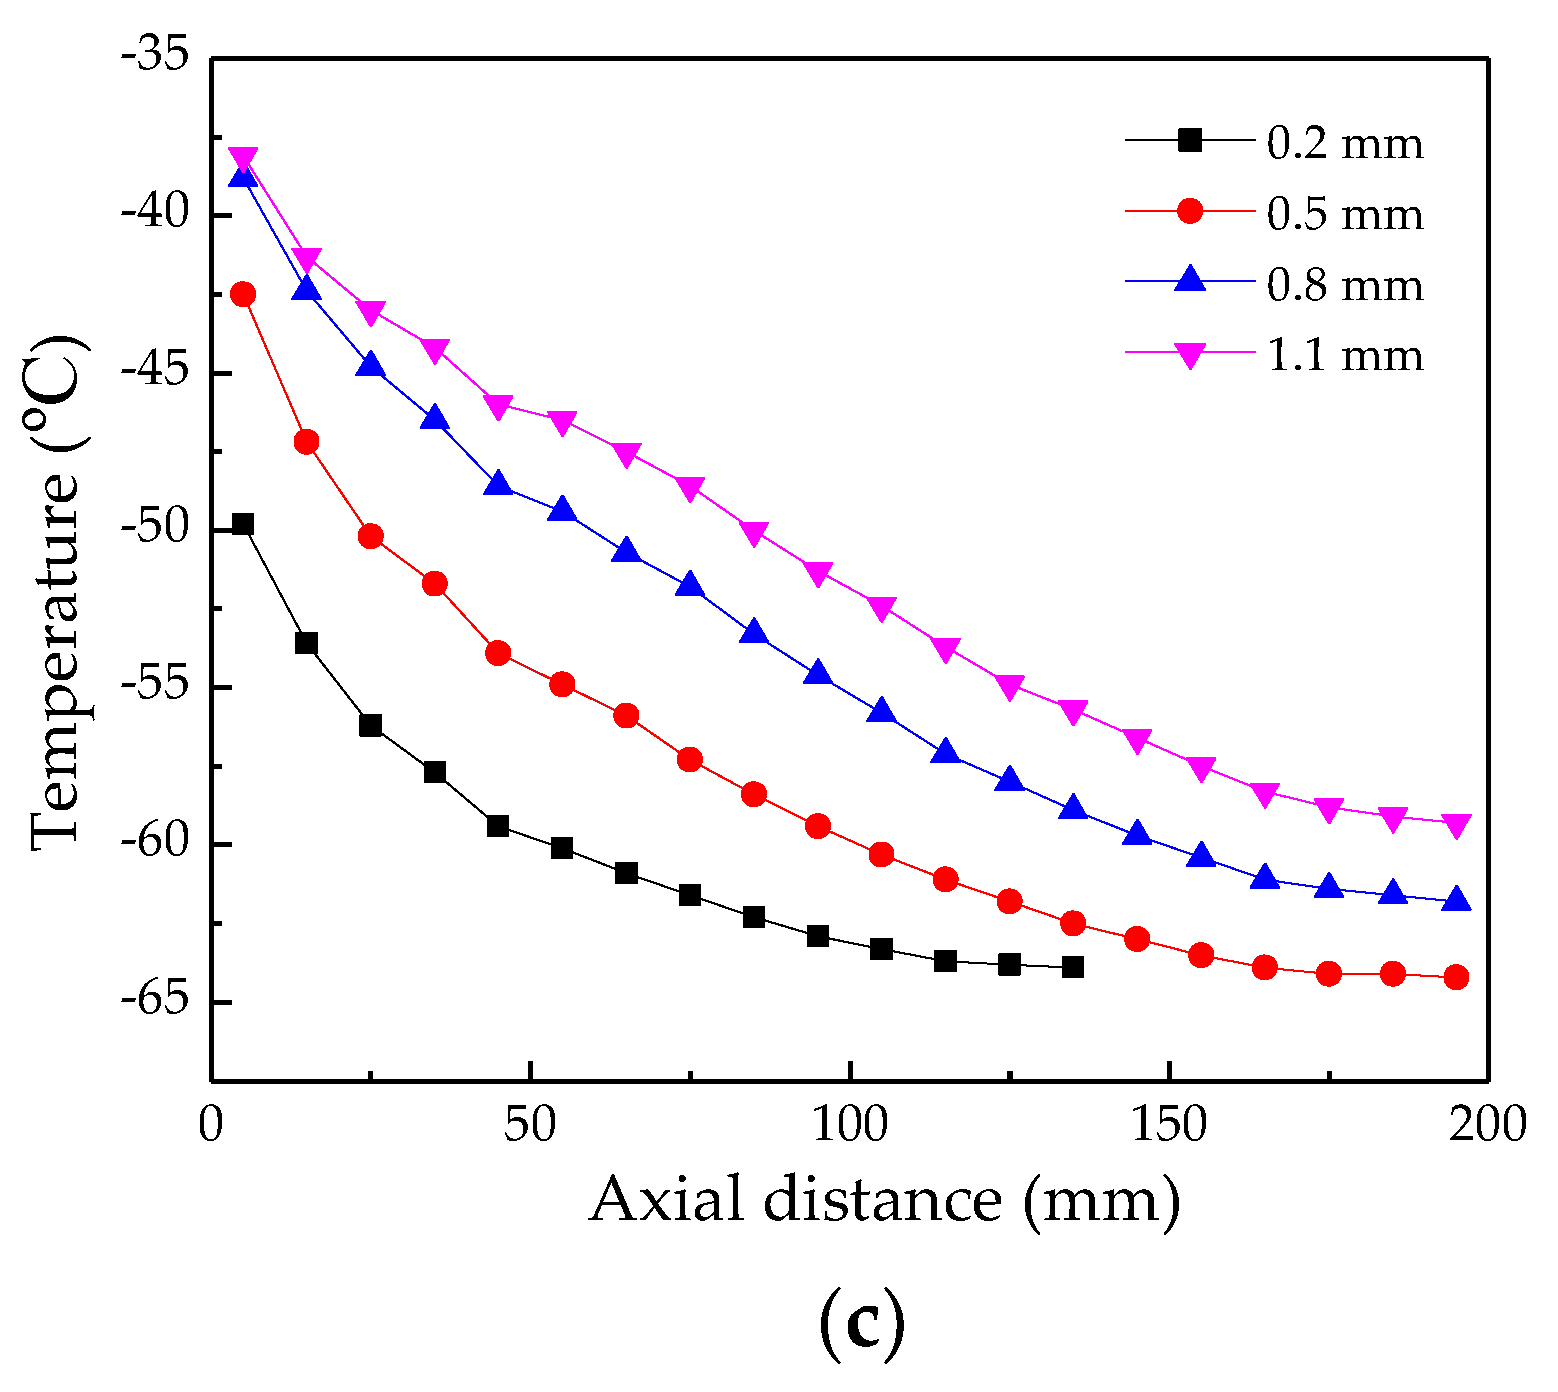
The previous experimental research has demonstrated that the nozzle diameter greatly influences the flashing spray characteristics and, thus, results in substantially different cooling performance [9] and influences nozzle flow and spray characteristics [32]. In this section, the effect of nozzle diameter of 0.2, 0.5, 0.8 and 1.1 mm on the spray characteristics of a R134a flashing spray has been investigated numerically using the O’R drag force model.
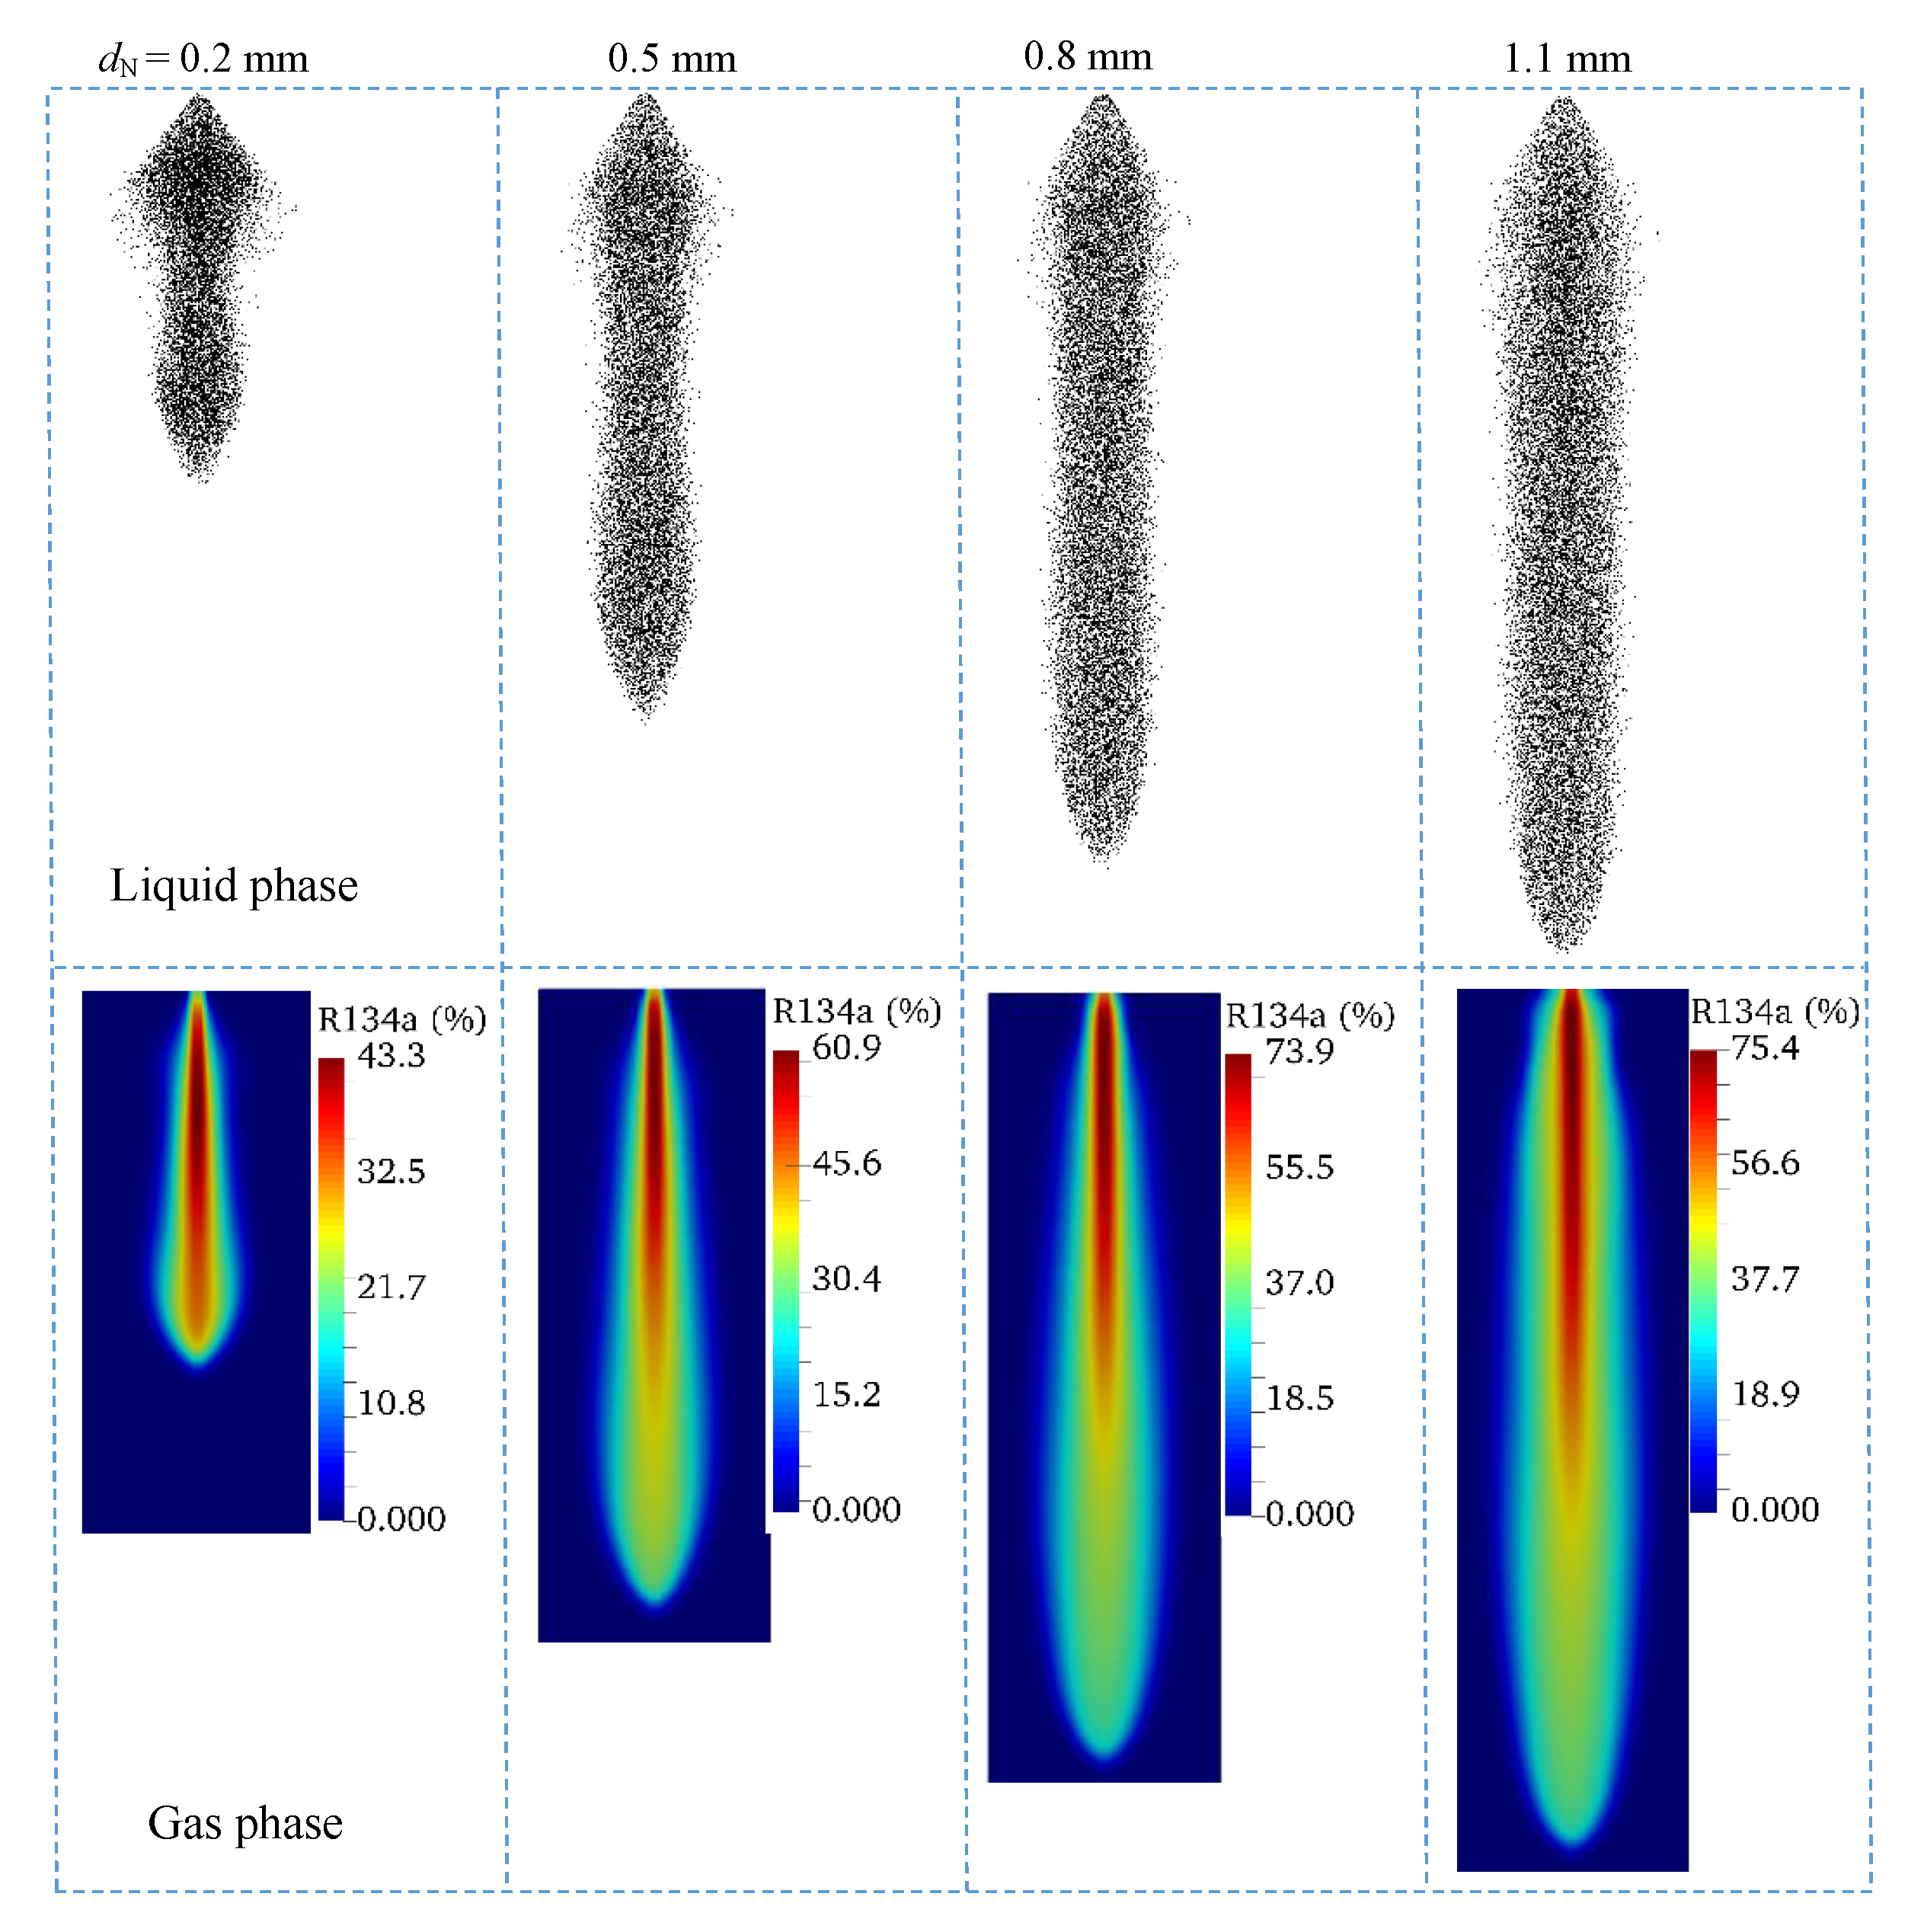
Figure 10 presents the spray morphology results of liquid and gas phases generated from four diameter nozzles. It is found that nozzle diameter has a large effect on spray morphologies. The smallest diameter nozzle contributes to a quite different liquid morphology in comparison with its counterparts, that the explosive atomization phenomenon near the nozzle exit is the greatest. This can be explained by the fact that the smaller-diameter nozzle induces a more intense cavitation and, thus, more bubbles due to the larger pressure drop within the nozzle [33]. The bubbles shatter the liquid once they are discharged from the nozzle because of the sudden pressure drop between the inside and outside nozzle. As a result, more bubbles will lead to a more intense explosive atomization near nozzle field. In addition, larger diameter nozzle causes longer penetration distance and higher vapour concentration in spray central region. This is attributed to the larger-diameter nozzle resulting in a greater mass flow rate and less pressure drop inside the nozzle, which leads to a denser spray and higher momentum with a larger droplet diameter and velocity.
The effect of nozzle diameter on the variations of droplet diameter, velocity and temperature of R134a flashing spray along spray centreline is shown in Figure 11. From Figure 11a, although all cases show a similar quick reduction in droplet D32 diameter near the nozzle field (in the first 50 mm distance), the smaller diameter nozzle produces a smaller droplet diameter due to stronger breakup. In addition, the droplet diameter presents a slight increase from the distance of 100 mm for the smallest nozzle. This is probably attributed to the complete evaporation of finest droplet in the dilute spray region. The divergence of droplet diameters becomes small after the rapid reduction region for other three larger diameter nozzles. As shown in Figure 11b regarding droplet velocity, apart from the smallest diameter nozzle, other larger-diameter nozzles generate a similar variation pattern of droplet velocity. That is, the droplet velocity firstly accelerates to the maximum value due to the propulsion causing by the release of superheated liquid, and then starts to decrease because of the drag force. For the smallest diameter nozzle, the superheat is substantially released in the form of cavitation before being injected into the ambient environment. Cconsequently, there is no acceleration period and the droplet velocity decreases just from the nozzle exit. Generally, larger-diameter nozzles lead to higher droplet velocities accompanied by more intense acceleration near the nozzle field. It can be seen from Figure 11c regarding the droplet temperature, that the nozzle diameter also has great impact on the droplet temperature variation along the axial distance. Smaller-diameter nozzles could result in a quicker decrease in the droplet temperature induced by better atomization and stronger evaporation, which in turn leads to a much lower droplet temperature compared with larger-diameter nozzles. As a result, smaller-diameter nozzles possess the shorter minimum distance where the minimum droplet temperature appears. However, the minimum value of the droplet temperature should be identical for different diameter nozzles as evidenced by the results of 0.2 mm and 0.5 mm nozzles, although the droplet minimum temperature does not appear within the axial distance of 200 mm for other larger-diameter nozzles.

5. Conclusions

Accurate prediction of flashing sprays with low-saturation and high volatile liquid is of great importance in many industrial applications, and is also a significant challenge since there are numerous factors influencing the numerical result, especially the non-equilibrium flashing boiling happening near the nozzle field. In this study, the performance of five typical drag force models in predicting droplet evaporation for an R134a single droplet and spray characteristics for its flashing spray have been investigated numerically. The effect of the nozzle diameter on R134a two-phase flashing spray has also been examined. Some main findings can be summarized as follows:
(1)
The drag force model has no obvious effect on the predictive results of the droplet diameter, velocity and temperature for R134a single moving droplet evaporation, except that the K–R model contributes to different results with a lower droplet diameter and velocity, and a faster decrease in droplet temperature compared with other four models.
(2)
The O’R, F–B, T–L and H–L drag force models predict almost identical results of droplet diameter, velocity and temperature variations along both the axial and radial directions in the R134a two-phase flashing spray simulation. However, the K–R drag model contributes to quite different results than those of its counterparts. In particular, K–R model predicts a much different profile of the droplet diameter and much lower droplet temperature in the radial distance.
(3)
The nozzle diameter influences R134a two-phase flashing spray significantly. Stronger explosive atomization, shorter penetration distance, lower droplet diameter and velocity, and a faster decrease in droplet temperature can be achieved by a smaller diameter nozzle.
(4)
According to the comprephesive study, the K–R drag force model is not recommended in both single isolated droplet modelling and two-phase flashing simulation. The nozzle diameter should be carefully chosen in practice because of its great importance in determining the spray dynamics and thermal characteristics of the flashing spray.

Author Contributions

Conceptualization: Z.-F.Z. and B.C.; data curation: D.-Q.Z.; formal analysis: W.-T.W. and Y.-B.L.; investigation: D.-Q.Z., W.-T.W. and Y.-B.L.; methodology: D.-Q.Z. and G.-Y.L.; writing—original draft: Z.-F.Z. and G.-Y.L.; writing—review and editing: B.C.

Funding

This research was funded by the Ministry of Science and Technology of China [2017YFE0134200], Department of science and technology of Shaanxi Province [2017YFE0134200] and the State Key Laboratory of Engines of Tianjin University (K2019-04).

Acknowledgments

We gratefully acknowledge the financial support from the Ministry of Science and Technology of China with the Key Program for International Science and Technology Cooperation Project (2017YFE0134200), and from Shaanxi Province with the International Science and Technology Cooperation project (2019KW-021). Thanks are also given to the State Key Laboratory of Engines of Tianjin University (K2019-04), China.

Conflicts of Interest

The authors declare no conflict of interest.

Nomenclature

BMSpalding mass transfer numberSSource term
BTSpalding heat transfer numberYMass fraction
cSpecific heatGreek symbols
CDDrag force coefficientαThermal diffusivity or overall heat transfer coefficient
DDroplet diameter (m)ΓvBinary diffusion coefficient
FForce (N)λThermal conductivity (W/(mK))
gGravitational acceleration (m/s2)μDynamic viscosity
hsSpecific enthalpy (J/kg)ρDensity (kg/m3)
LLatent heat (J/kg)Subscripts
NuNusselt numberatmAmbient gas
mMassbBoiling
PPressure (Pa)effEffective
PrPrandtl number evapEvaporation
RRadius or radial distance (m)gAmbient gas
ReReynolds numberlLiquid
ScSchmidt numbermomMomentum
ShSherwood numbersSurface
tTime (s)VVapour
TTemperature (K)Far field
UVelocity (m/s)-Average

References

  1. Zhou, Z.-F.; Hu, M.-Y.; Xin, H.; Chen, B.; Wang, G.-X. Experimental and theoretical studies on the droplet temperature behavior of R407C two-phase flashing spray. Int. J. Heat Mass Tran. 2019, 136, 664–673. [Google Scholar] [CrossRef]
  2. Cheng, W.-L.; Zhang, W.-W.; Chen, H.; Hu, L. Spray cooling and flash evaporation cooling: The current development and application. Renew. Sust. Energ. Rev. 2016, 55, 614–628. [Google Scholar] [CrossRef]
  3. Zhou, Z.-F.; Lin, Y.-K.; Tang, H.-L.; Fang, Y.; Chen, B.; Wang, Y.-C. Heat transfer enhancement due to surface modification in the close-loop R410A flash evaporation spray cooling. Int. J. Heat Mass Tran. 2019, 139, 1047–1055. [Google Scholar] [CrossRef]
  4. Lin, Y.-K.; Zhou, Z.-F.; Fang, Y.; Tang, H.-L.; Chen, B. Heat transfer performance and optimization of a close-loop R410A flash evaporation spray cooling. Appl. Therm. Eng. 2019, 159, 113966. [Google Scholar] [CrossRef]
  5. Li, Q.; Tao, L.; Li, L.; Hu, Y.; Wu, S. Experimental Investigation of the Condensation Heat Transfer Coefficient of R134a inside Horizontal Smooth and Micro-Fin Tubes. Energies 2017, 10, 1280. [Google Scholar]
  6. Polanco, G.; Holdo, A.E.; Munday, G. General review of flashing jet studies. J. Hazard. Mater. 2010, 173, 2–18. [Google Scholar] [CrossRef]
  7. Calay, R.K.; Holdo, A.E. Modelling the dispersion of flashing jets using CFD. J. Hazard. Mater. 2008, 154, 1198–1209. [Google Scholar] [CrossRef]
  8. Zhou, Z.-F.; Chen, B.; Wang, R.; Bai, F.-L.; Wang, G.-X. Coupling effect of hypobaric pressure and spray distance on heat transfer dynamics of R134a pulsed flashing spray cooling. Exp. Therm. Fluid Sci. 2016, 70, 96–104. [Google Scholar] [CrossRef]
  9. Zhou, Z.-F.; Chen, B.; Wang, R.; Wang, G.-X. Comparative investigation on the spray characteristics and heat transfer dynamics of pulsed spray cooling with volatile cryogens. Exp. Therm. Fluid Sci. 2017, 82, 189–197. [Google Scholar] [CrossRef]
  10. Zhou, Z.; Chen, B.; Wang, Y.; Guo, L.; Wang, G. An experimental study on pulsed spray cooling with refrigerant R-404a in laser surgery. Appl. Therm. Eng. 2012, 39, 29–36. [Google Scholar] [CrossRef]
  11. Aguilar, G.; Majaron, B.; Verkruysse, W.; Zhou, Y.; Nelson, J.S.; Lavernia, E.J. Theoretical and experimental analysis of droplet diameter, temperature, and evaporation rate evolution in cryogenic sprays. Int. J. Heat Mass Tran. 2001, 44, 3201–3211. [Google Scholar] [CrossRef]
  12. Yildiz, D.; Ambaud, P.R.; Van Beek, J.; Buchlin, J.M. Evolution of the Spray Characteristics In Superheated Liquid jet Atomization in Function of Initial Flow Conditions. In Proceedings of the Tenth International Conference on Liquid Atomization and Spray Systems, Kyoto, Japan, 27 August–1 September 2006. [Google Scholar]
  13. Zhou, Z.; Wu, W.; Chen, B.W.; Guo, X.; Guo, L. An experimental study on the spray and thermal characteristics of R134a two-phase flashing spray. Int. J. Heat Mass Tran. 2012, 55, 4460–4468. [Google Scholar]
  14. Wang, R.; Chen, B.; Wang, X.-S. Numerical simulation of cryogen spray cooling by a three-dimensional hybrid vortex method. Appl. Therm. Eng. 2017, 119, 319–330. [Google Scholar] [CrossRef]
  15. Zhou, Z.-F.; Lu, G.-Y.; Chen, B. Numerical study on the spray and thermal characteristics of R404A flashing spray using OpenFOAM. Int. J. Heat Mass Tran. 2018, 117, 1312–1321. [Google Scholar] [CrossRef]
  16. Chen, B.; Tian, J.; Wang, R.; Zhou, Z. Theoretical study of cryogen spray cooling with R134a, R404A and R1234yf: Comparison and clinical potential application. Appl. Therm. Eng. 2019, 148, 1058–1067. [Google Scholar] [CrossRef]
  17. Clift, R.; Grace, J.R.; Weber, M.E. Bubbles, Drops, Particles; Courier Corporation: New York, NY, USA, 2005. [Google Scholar]
  18. Haider, A.; Levenspiel, O. Drag Coefficient and Terminal Velocity of Spherical and Nonspherical Particles. Powder Technol. 1989, 58, 63–70. [Google Scholar] [CrossRef]
  19. Khan, A.R.; Richardson, J.F. The Resistance to Motion of a Solid Sphere in a Fluid. Chem. Eng. Commun. 1987, 62, 135–150. [Google Scholar] [CrossRef]
  20. Zhou, Z.-F.; Li, W.-Y.; Chen, B.; Wang, G.-X. A 3rd-order polynomial temperature profile model for the heating and evaporation of moving droplets. Appl. Therm. Eng. 2017, 110, 162–170. [Google Scholar] [CrossRef]
  21. Miller, R.S.; Harstad, K.; Bellan, J. Evaluation of equilibrium and non-equilibrium evaporation models for many-droplet gas-liquid flow simulations. Int. J. Multiphas. Flow 1998, 24, 1025–1055. [Google Scholar] [CrossRef]
  22. Sazhin, S.S. Advanced models of fuel droplet heating and evaporation. Prog. Energ. Combust. 2006, 32, 162–214. [Google Scholar] [CrossRef]
  23. Kärrholm, F.P. Numerical Modelling of Diesel Spray Injection, Turbulence Interaction and Combustion; Chalmers University of Technology: Gothenburg, Sweden, 2008. [Google Scholar]
  24. REITZ. Modeling atomization processes in high-pressure vaporizing sprays. At. Spray Technol. 1987, 3, 309–337. [Google Scholar]
  25. Adachi, M.; McDonell, V.G.; Tanaka, D.; Senda, J.; Fujimoto, H. Characterization of Fuel Vapor Concentration Inside a Flash Boiling Spray. SAE Tech. Pap. 1997, 189, 443–454. [Google Scholar]
  26. O’Rourke, P.J. Collective Drop Effects on Vaporizing Liquid Sprays; LA-9069-T, Ed.; Los Alamos National Lab.: NM, USA, 1981; p. 357. [Google Scholar]
  27. Flemmer, R.L.C.; Banks, C.L. On the drag coefficient of a sphere. Powder Technol. 1986, 48, 217–221. [Google Scholar] [CrossRef]
  28. Turton, R.; Levenspiel, O. A short note on the drag correlation for spheres. Powder Technol. 1986, 47, 83–86. [Google Scholar] [CrossRef]
  29. Zhou, Z.; Wang, G.; Chen, B.; Guo, L.; Wang, Y. Evaluation of Evaporation Models for Single Moving Droplet with a High Evaporation Rate. Powder Technol. 2013, 240, 95–102. [Google Scholar]
  30. Zhou, Z.-F.; Lu, G.-Y.; Zhu, D.-Q.; Zhang, L.; Wang, J.-F.; Chen, B. The performance of droplet evaporation model in predicting droplet dynamics and thermal characteristics for R134a single isolated droplet and two-phase flashing spray. Aerosp. Sci. Technol. 2019, 93, 105363. [Google Scholar] [CrossRef]
  31. Minea, A.A.; Buonomo, B.; Burggraf, J.; Ercole, D.; Karpaiya, K.R.; Di Pasqua, A.; Sekrani, G.; Steffens, J.; Tibaut, J.; Wichmann, N.; et al. A benchmark study on the numerical approach in nanofluids' simulation. Int. Commun. Heat Mass 2019, 108, 104292. [Google Scholar] [CrossRef]
  32. Ishak, M.H.H.; Ismail, F.; Che Mat, S.; Abdullah, M.Z.; Abdul Aziz, M.S.; Idroas, M.Y. Numerical Analysis of Nozzle Flow and Spray Characteristics from Different Nozzles Using Diesel and Biofuel Blends. Energies 2019, 12, 281. [Google Scholar] [CrossRef] [Green Version]
  33. Wang, X.-S.; Chen, B.; Wang, R.; Xin, H.; Zhou, Z.-F. Experimental study on the relation between internal flow and flashing spray characteristics of R134a using straight tube nozzles. Int. J. Heat Mass Tran. 2017, 115, 524–536. [Google Scholar] [CrossRef]
Figure 1. Schematic of single moving droplet evaporation in ambient air.
Energies 12 04618 g001
Figure 2. Spray tip penetration for various grid sizes.
Energies 12 04618 g002
Figure 3. Comparison of R134a flashing spray morphologies: (a) Simulated liquid phase morphology, (b) simulated gas phase morphology and (c) experimental spray image by high-speed camera.
Energies 12 04618 g003
Figure 4. Comparison of the predictive results by the five drag models for an R134a single droplet: (a) Diameter, (b) velocity and (c) temperature as the function of distance.
Energies 12 04618 g004
Figure 5. Comparison of (a) the droplet Sauter mean diameter (D32), (b) the droplets’ average axial velocity and (c) the droplets’ average temperature evolutions as a function of the axial distance of R134a flashing spray as predicted by five drag force models.
Energies 12 04618 g005aEnergies 12 04618 g005b
Figure 6. Evolution of the droplet Sauter mean diameter along the radial distance at four axial distances of R134a flashing spray predicted by five models.
Energies 12 04618 g006
Figure 7. Evolution of the droplet velocity along the radial distance at four axial distances of R134a flashing spray predicted by five models.
Energies 12 04618 g007
Figure 8. Evolution of the droplet velocity along the radial distance at four axial distances of R134a flashing spray predicted by five models.
Energies 12 04618 g008
Figure 9. Variation of CD as a function of Re (<1000) from different drag force models.
Energies 12 04618 g009
Figure 10. Effect of nozzle diameter on spray morphologies of the R134a flashing spray (top line: liquid phase; bottom line: gas phase).
Energies 12 04618 g010
Figure 11. The effect of nozzle diameter on (a) droplet D32 diameter, (b) average velocity and (c) the average temperature variation along the spray centreline of the R134a flashing spray.
Energies 12 04618 g011aEnergies 12 04618 g011b
Table 1. Equations of drag force models in this study.
ModelEquations of Drag Force CoefficientComments
O’R   C D = { 24 R e ( 1 + 0.15 R e 0.687 )     R e 1000 0.44                   R e > 1000   O’Rourke [26]
K–R   C D = ( 2.25 R e 0.31 + 0.36 R e 0.06 ) 0.45     R e < 3 × 10 5  
Khan and Richardson [19]
F-B   C D = 24 R e 10 E  
E = 0.261 R e 0.369 0.105 R e 0.431 0.124 1 + ( log 10 R e ) 2
  R e < 8.6 × 10 4  
Flemmer and Banks [27]
T-L   C D = 24 R e ( 1 + 0.173 R e 0.657 ) + 0.413 1 + 16300 R e 1.09     R e < 2.6 × 10 5  
Turton and Levenspiel [28]
H-L   C D = 24 R e ( 1 + 0.1806 R e 0.6459 ) + 0.4251 1 + 6880.95 R e     R e < 2.6 × 10 5  
Haider and Levenspiel [18]
Table 2. Parameters of a R134a single droplet.
ParameterValue
air temperature, Tambi (°C)25
air pressure, Pambi (MPa)0.1
R134a droplet initial temperature, T0 (°C)−27
R134a droplet initial velocity, V0 (m/s)60
R134a droplet initial diameter (μm)100
Table 3. Initial parameters for R134a flashing spray simulations.
ParameterValue
Ambient temperature, Tambi (°C)25
Ambient pressure, Pambi (MPa)0.1
R134a initial temperature, T0 (°C)25
R134a injection pressure, Pinj (MPa)0.7
Diameter of nozzle, dnozzle (mm)0.81
Rosin-Rammler distribution parameter d (μm)12
Rosin-Rammler distribution parameter n1.7
Spurt duration of spray, tdur (ms)50
Parcels per second20,000,000