Article

Modeling and Simulation Performance Evaluation of a Proposed Calorimeter for Testing a Heat Pump System

1
Graduate School of Mechanical Engineering, Hanbat National University, Yuseong-Gu, Daejeon 34158, Korea
2
Department of Architecture, Korea University, Sungbuk-ku, Seoul 02841, Korea
3
Department of Mechanical Engineering, Hanbat National University, Yuseong-Gu, Daejeon 34158, Korea
*
Author to whom correspondence should be addressed.
Energies 2019, 12(23), 4589; https://doi.org/10.3390/en12234589
Submission received: 29 October 2019 / Revised: 23 November 2019 / Accepted: 28 November 2019 / Published: 2 December 2019

Abstract

:
The energy consumption for heating and cooling in the building sector accounts for more than one-third of total energy used worldwide. In view of that, it is important to develop energy efficient cooling and heating systems in order to conserve energy in buildings as well as reduce greenhouse gas emissions. In both commercial and residential buildings, the heat pump has been adopted as an energy efficient technology for space heating and cooling purposes as compared to conventional air conditioning systems. However, heat pumps undergo standard testing, rating, and certification procedures to ascertain their system performance. Essentially, the calorimeter for testing heat pumps has two test chambers to serve as a heat source and heat sink to control and maintain the test conditions required to simulate the heat pump indoor and outdoor units, simultaneously. In air-to-air heat pump units, the conventional calorimeter controls the air temperature and humidity conditions in each test chamber with separate air handling units consisting of a refrigerator, heater, humidifier, and supply fan, which results in high energy consumption. In this study, using dynamic modeling and simulation, a new calorimeter for controlling air conditions in each test chamber is proposed. The performance analysis based on simulation results showed that the newly proposed calorimeter predicted at least 43% energy savings with the use of a heat recovery unit and small refrigerator capacity as compared to the conventional calorimeter that utilized a large refrigerator capacity for all the weather conditions and load capacities that we investigated.

1. Introduction

In the building sector, the energy consumption for heating and cooling accounts for more than one-third of the total energy worldwide [1]. Currently, there has been a growing demand for energy saving technologies in buildings due to the increasing cost of energy as well as the global warming and environmental impact issues [2]. In view of that, development of energy efficient systems has become significant to fulfil energy conservation demands in buildings while reducing greenhouse gas emissions. Heat pumps have therefore been considered in commercial and residential buildings as an efficient system for space heating and cooling applications due to their potential to reduce energy consumption and CO2 emissions as compared to conventional air conditioning systems [3,4]. However, heat pumps are being subjected to standard testing, rating, and certification procedures to ascertain the system performance. The heat pump calorimeter is the test facility used in determining the performance characteristics of the heat pump system such as the capacity and efficiency [5]. The calorimeter for testing heat pumps has two test chambers to serve as a heat source and heat sink to simulate the indoor and outdoor units of the heat pump simultaneously. The basic performance characteristic of the calorimeter is to control and maintain the standard conditions used in testing and rating the heat pump unit [6,7]. The test facility for controlling air temperature and humidity conditions in an environment is often known as the psychrometric calorimeter where each test chamber is equipped with an air handling unit consisting of a cooling unit, heater, humidifier, and supply fan as represented in Figure 1 [8]. Such calorimeters have been used extensively in open literature [9,10,11,12,13,14].
In as much as calorimeters have been used to investigate performance of various heat pump systems, the focus has been on ways to improve the energy efficiency of the heat pump unit without considering the calorimeter energy consumption. However, the standard psychrometric calorimeter controls the air conditions in each test chamber with a separate air handling unit. Therefore, the energy utilized in both test chambers is used to evaluate the total energy consumption of the calorimeter. This implies that the standard calorimeter for heat pump measurement uses much energy during operation [15]. As such, it is imperative to adopt energy efficient methods to control and reduce the energy usage of the calorimeter.
Heat recovery technologies have become attractive to researchers and energy policy makers throughout the world due to their energy saving potential in buildings and mitigating greenhouse gas emissions [16,17]. As such, efforts have been made by various researchers to reduce energy consumption using heat recovery assisted air conditioning systems in buildings [18,19,20,21,22,23,24,25]. Nasif et al. [21] studied the thermal performance of a heat recovery membrane heat exchanger in hot and humid climates. Their research indicated that the energy utilized by an air conditioning system integrated with a heat recovery heat exchanger reduced as compared to a conventional system.
In this study, a new calorimeter integrated with a heat recovery unit was proposed for controlling the air conditions in each test chamber. By using dynamic modeling and simulation, the energy performance of the proposed system was analyzed and compared to the conventional system. This was to evaluate and predict the energy saving potential of the proposed calorimeter.

2. Materials and Methods

The overall procedure for modeling, simulation, and performance analysis is summarized in the flow chart shown in Figure 2. The Google SketchUp software was used to model the building geometry [26]. The weather data applied in the simulation analysis were provided in EnergyPlus program. The input data, operating schedules, control parameters, and components modeling for the conventional and proposed systems and cases studied were also described using specific objects in the EnergyPlus 8.4 database [27]. The program simulation test data for the modeling system cases were used to predict energy performance based on representative days and months.

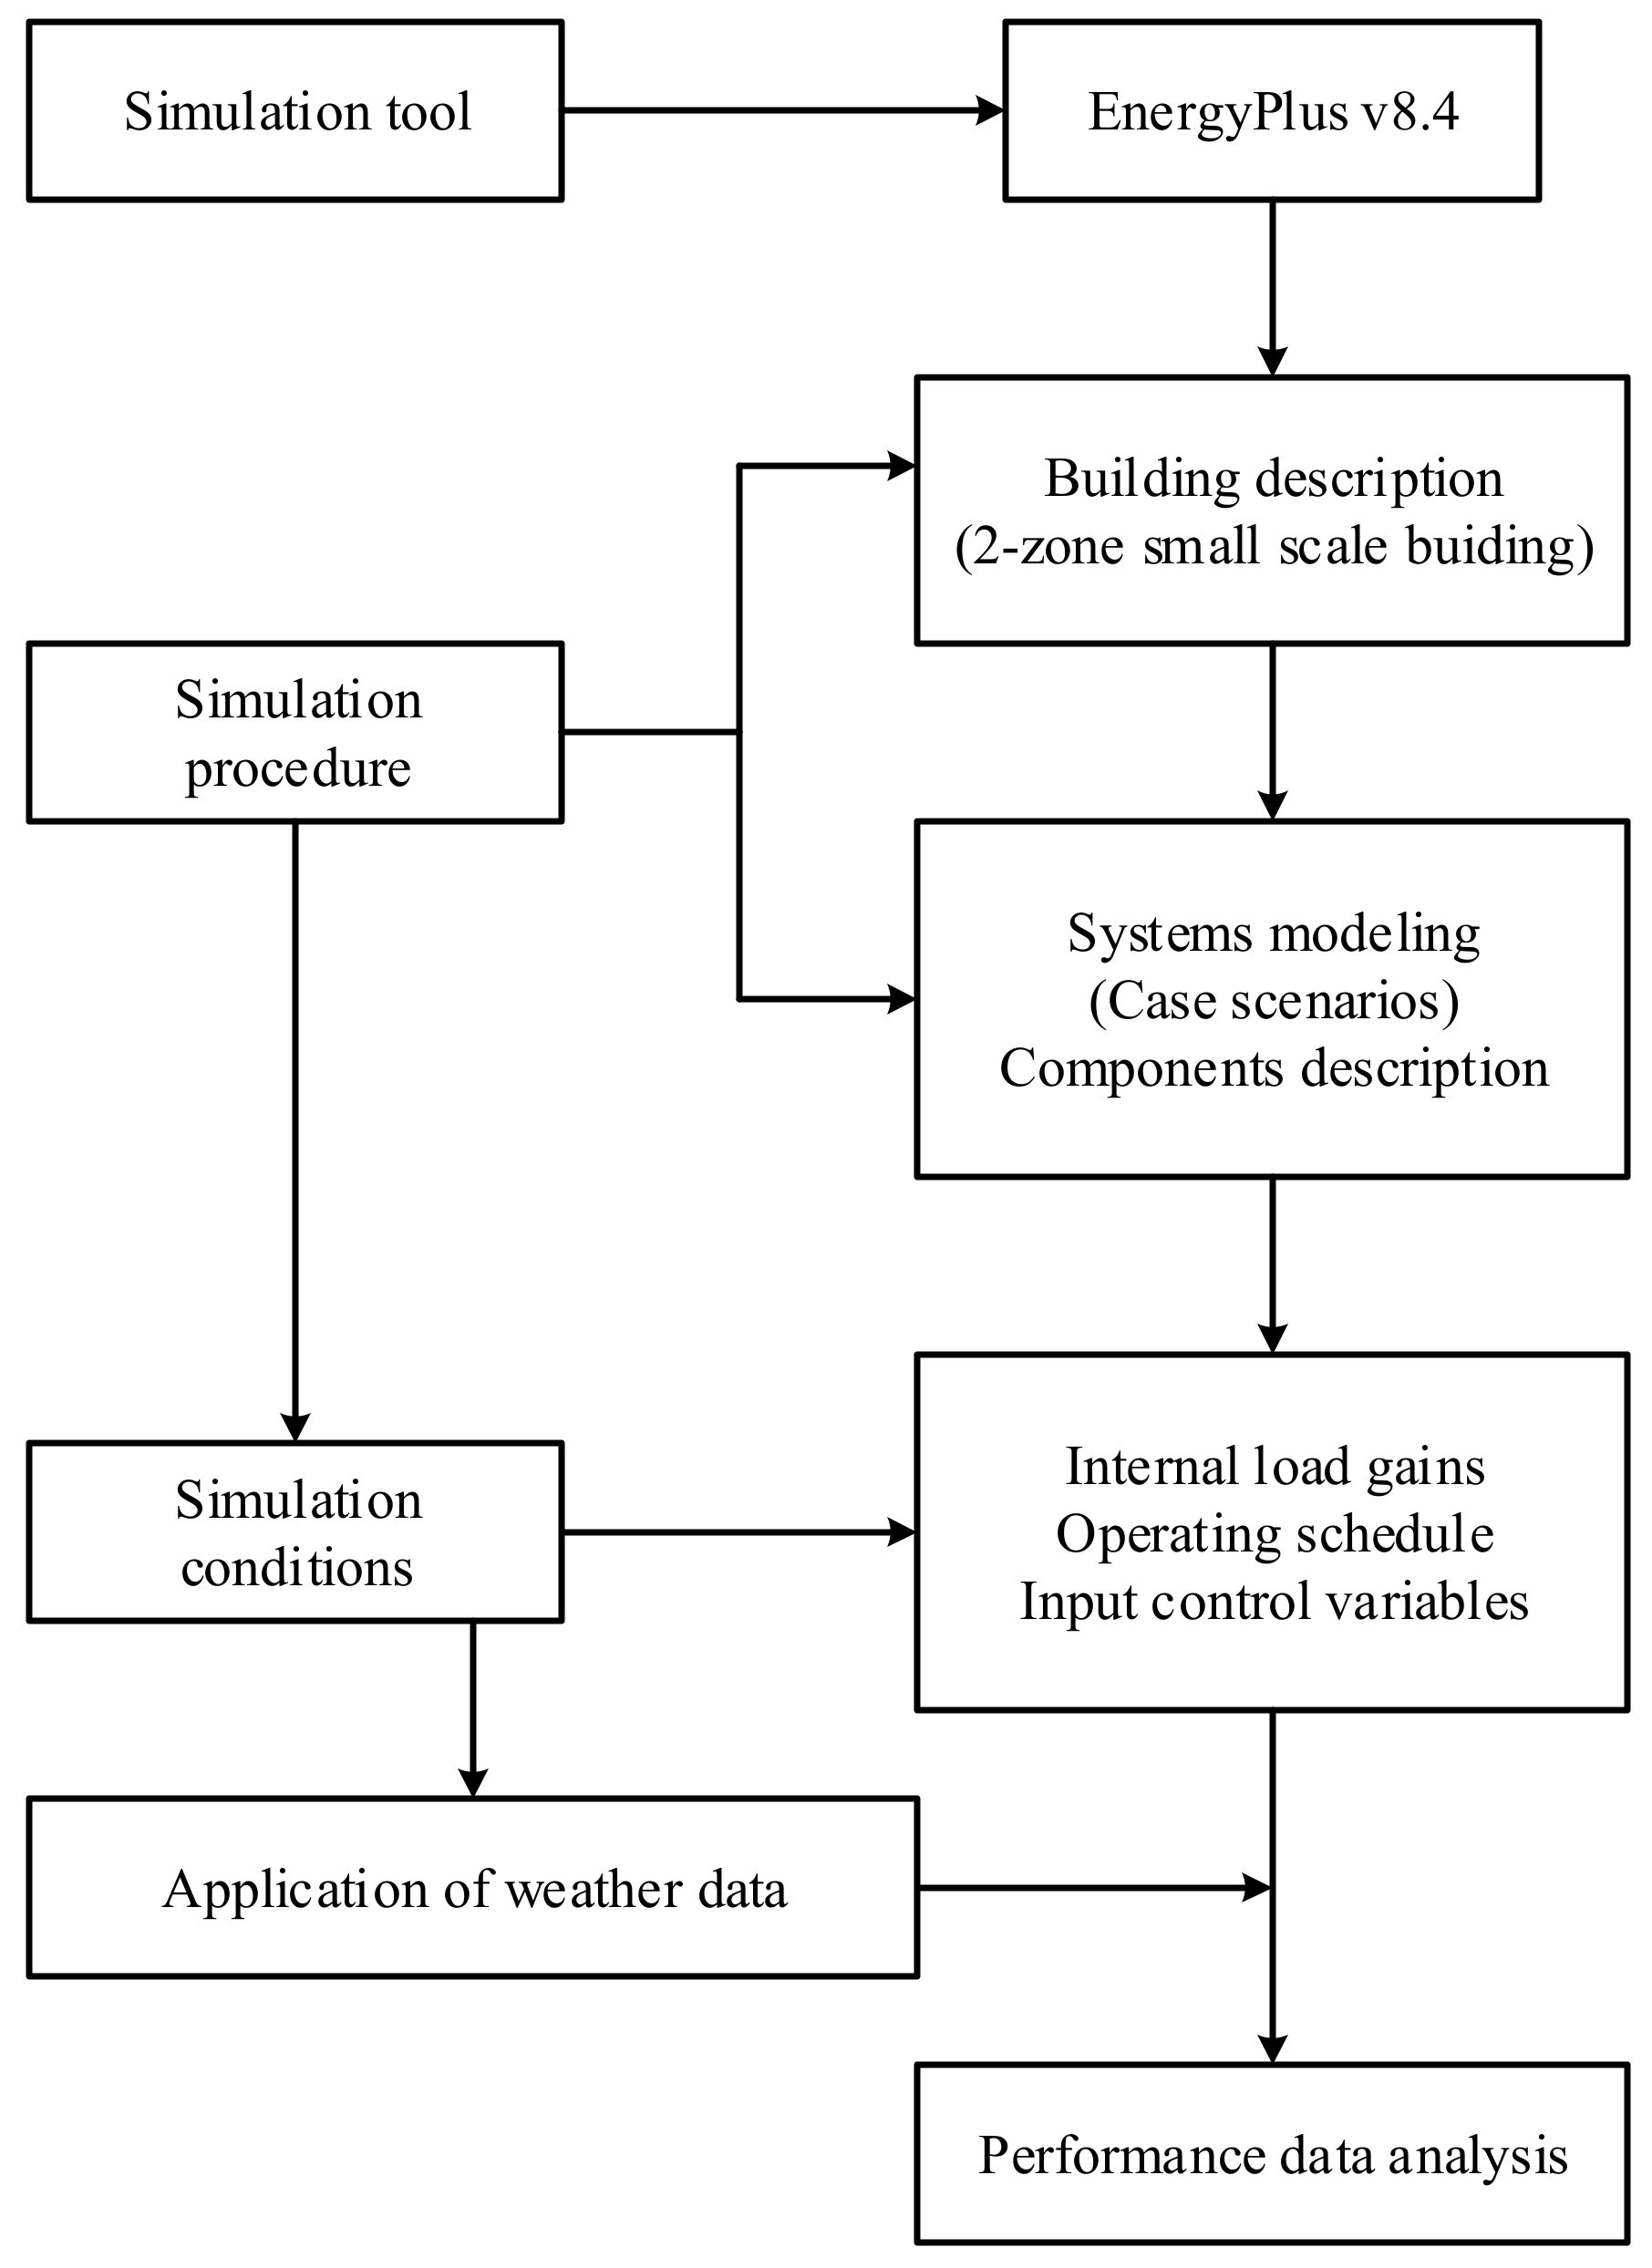
2.1. Simulation Software

EnergyPlus v8.4 is the dynamic modeling and simulation software used in this study due to its ability to analyze the cooling and heating loads of a building and assess the energy performance [27,28]. In the building load calculation, EnergyPlus used the heat balance method recommended by the American Society of Heating, Refrigerating, and Air Conditioning Engineers [29]. Also, EnergyPlus simulation results outlined the importance of using simulation techniques in energy performance assessment for qualitative decision making [30].
The main components of the building simulation are the zone, surface, air heat balance, system, and plant modeling. The EnergyPlus tool can simulate the systematic connection between each of the component integrated at each time step. Moreover, EnergyPlus has been verified through ASHRAE (American Society of Heating, Refrigeration and Air-conditioning Engineers) 140 guidelines and detailed contents regarding the development and verification of the program have been provided [31].

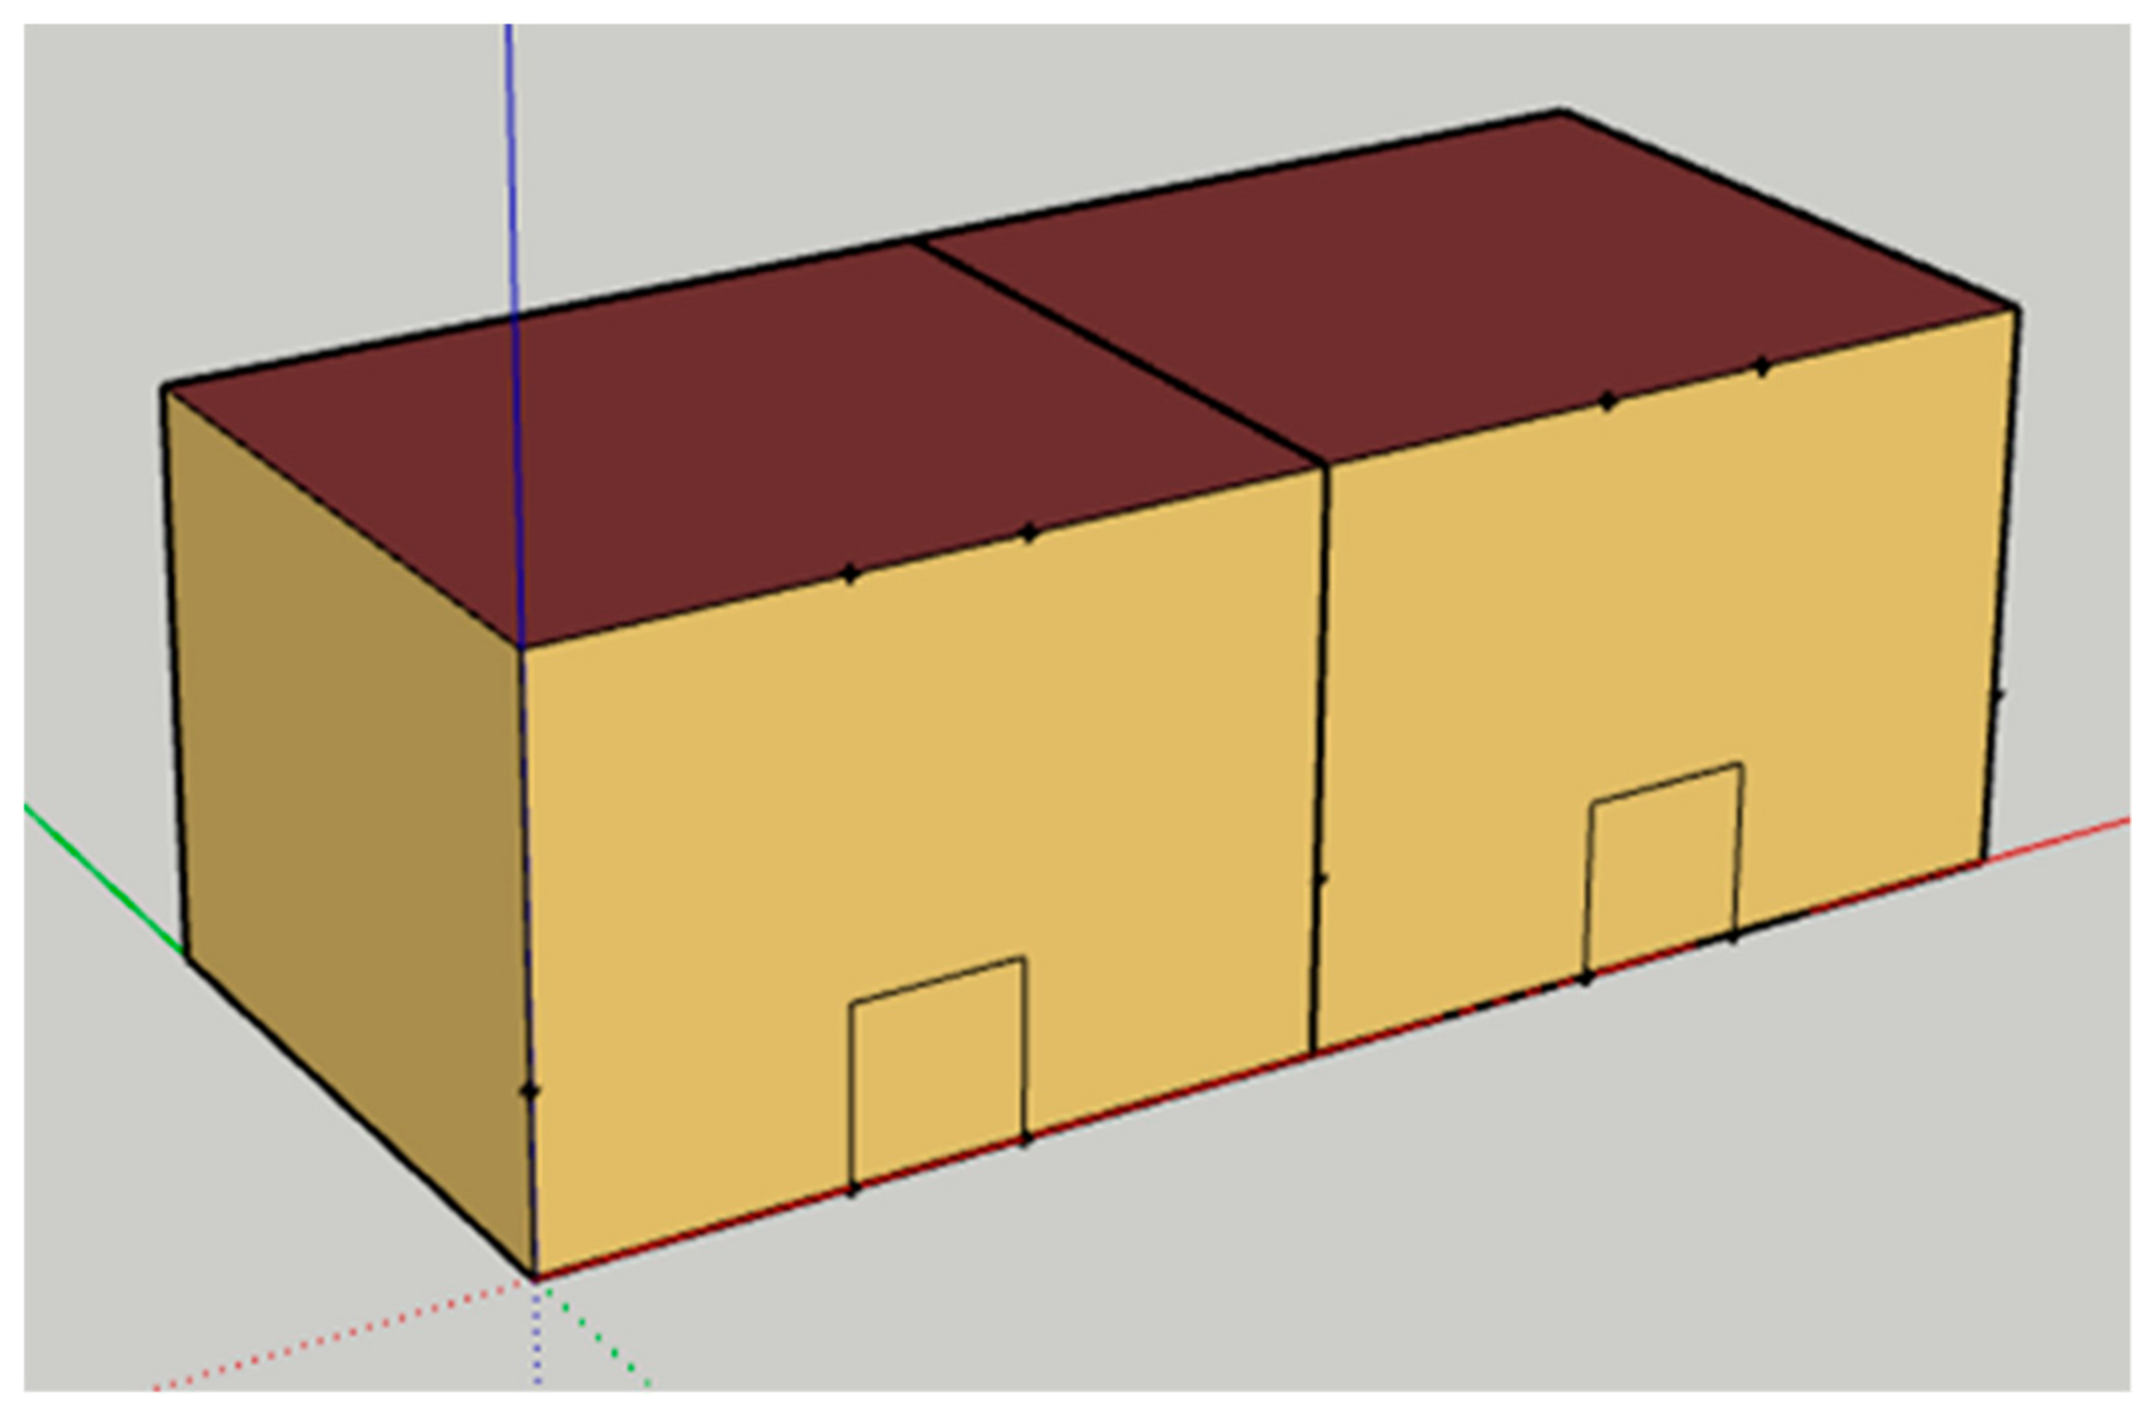
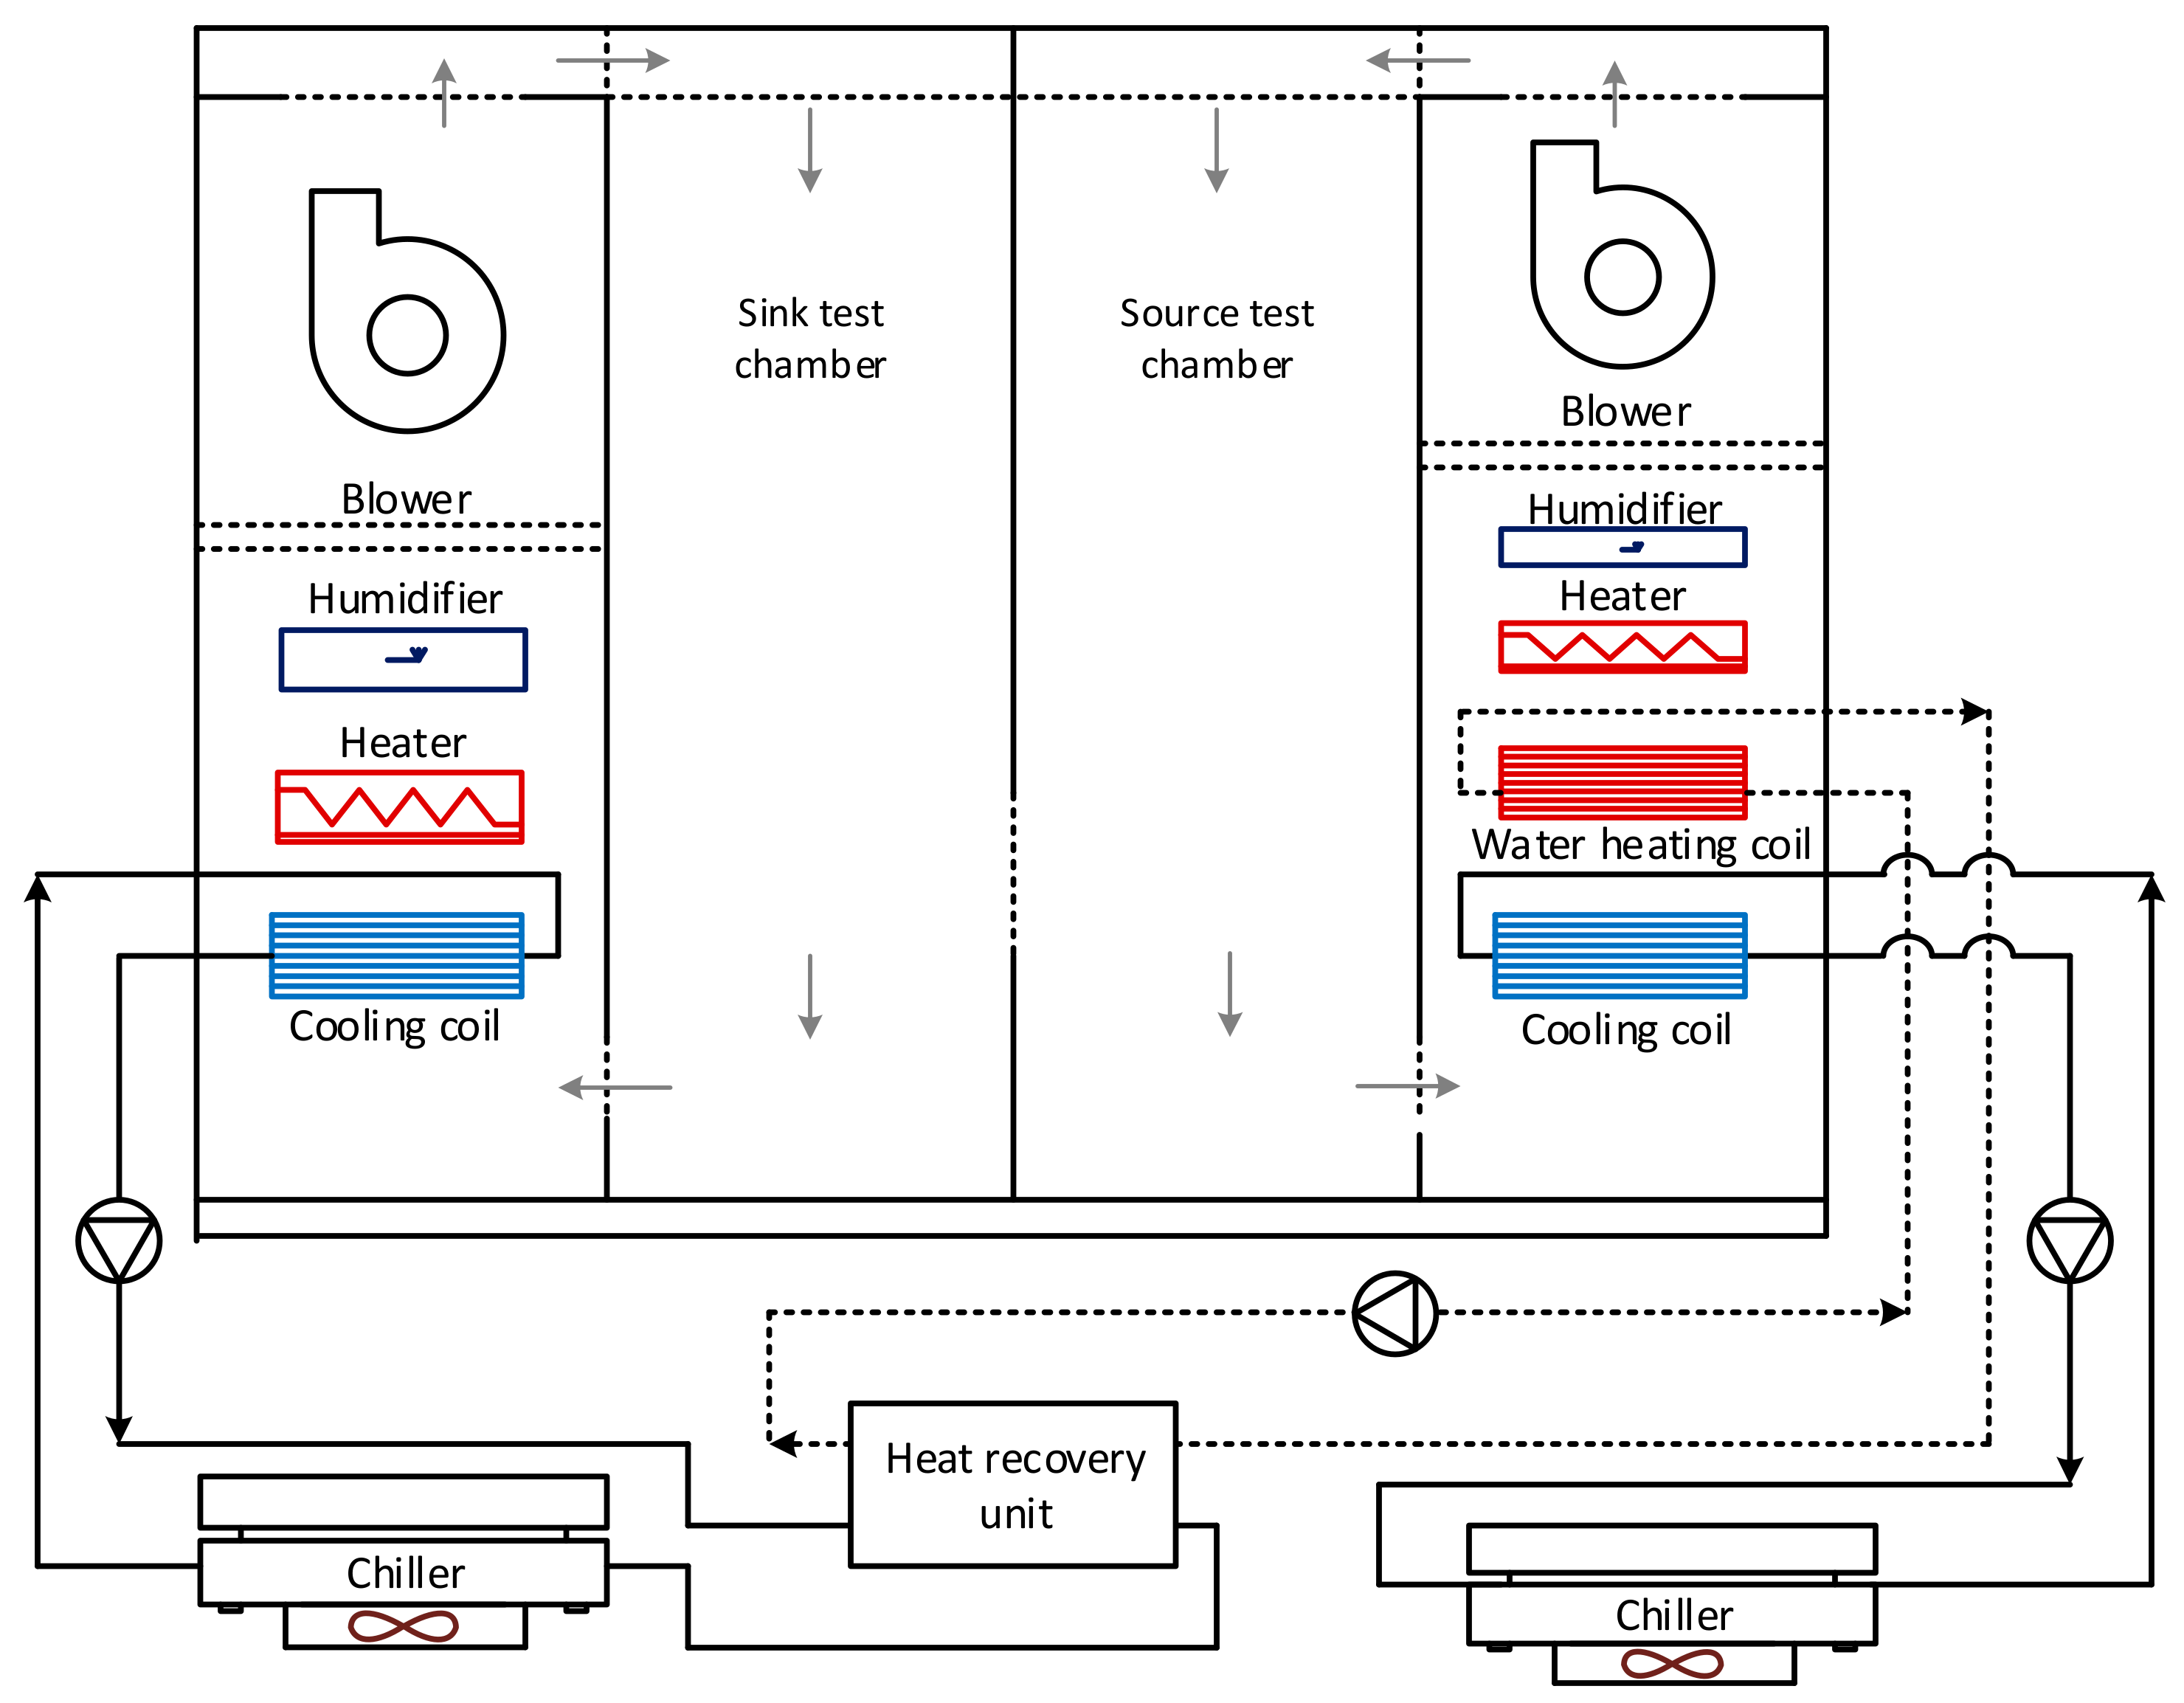
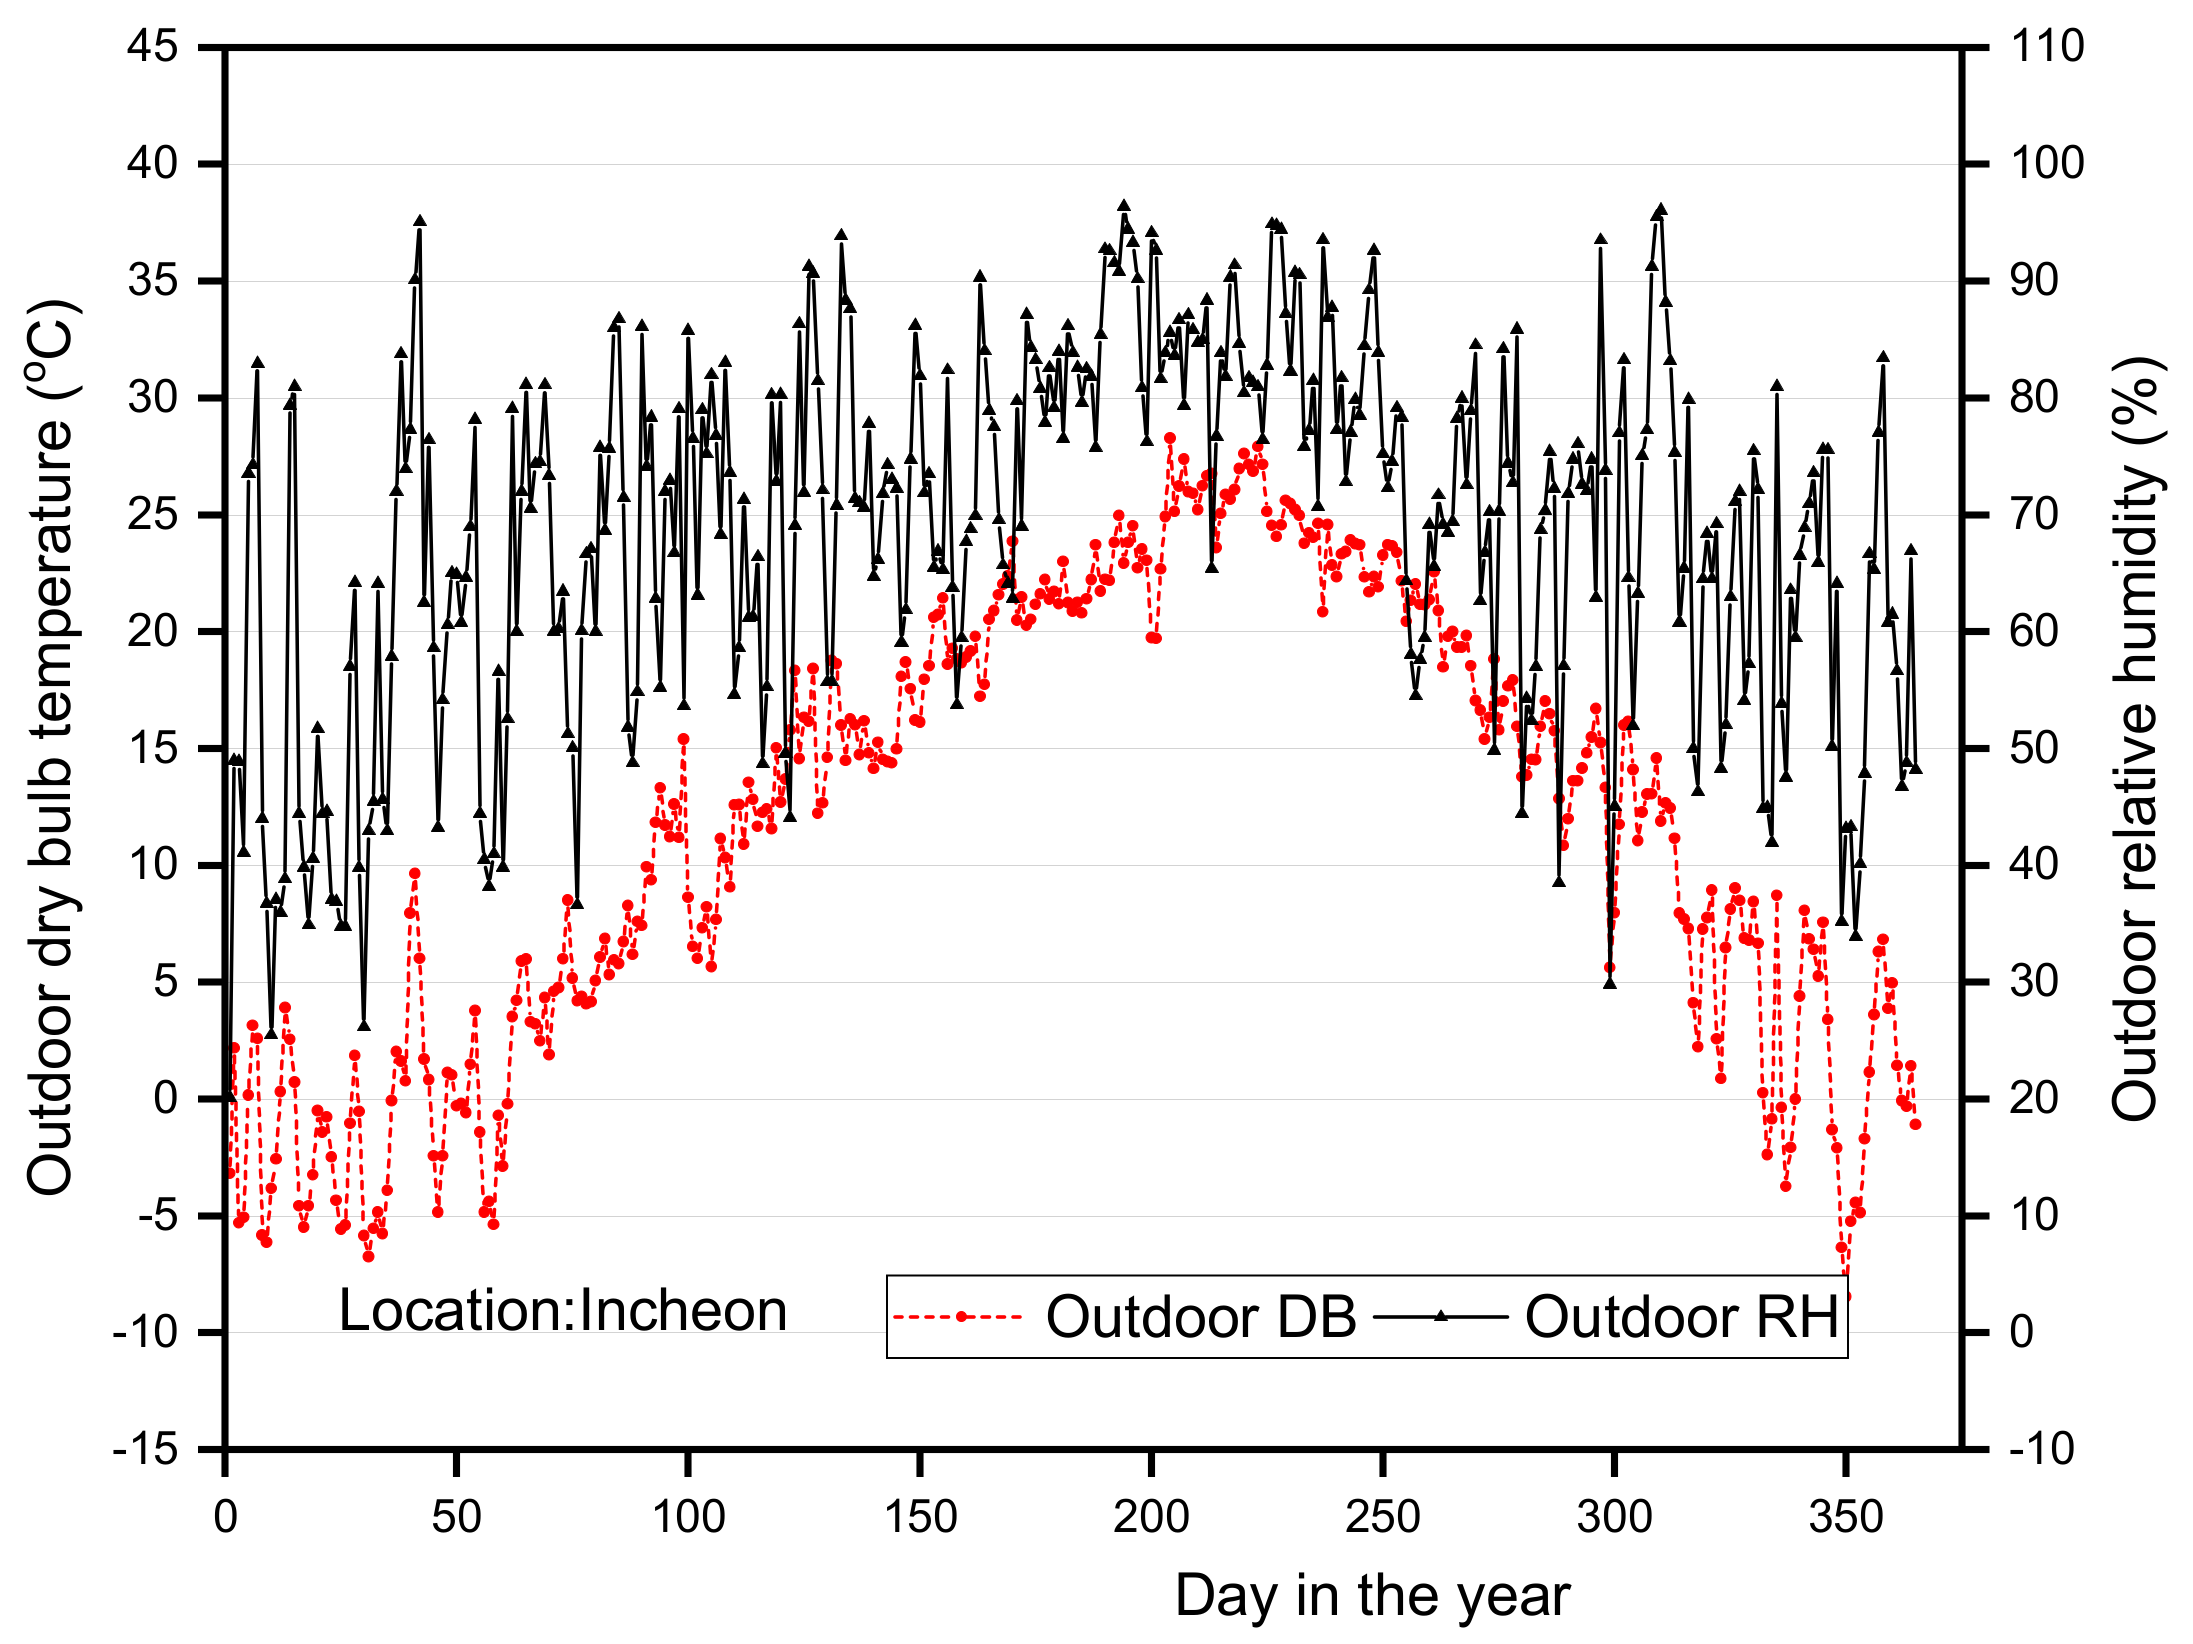
2.2. Building Description

Figure 3 illustrates the model geometry of the small scale building developed in the Google SketchUp program which was integrated in the EnergyPlus software. The building space consists of two thermal zones to represent the two test chambers of the calorimeter. Building construction materials were selected based on reference materials with thermal properties data in the ASHRAE Handbook of Fundamentals [32] and available in EnergyPlus.

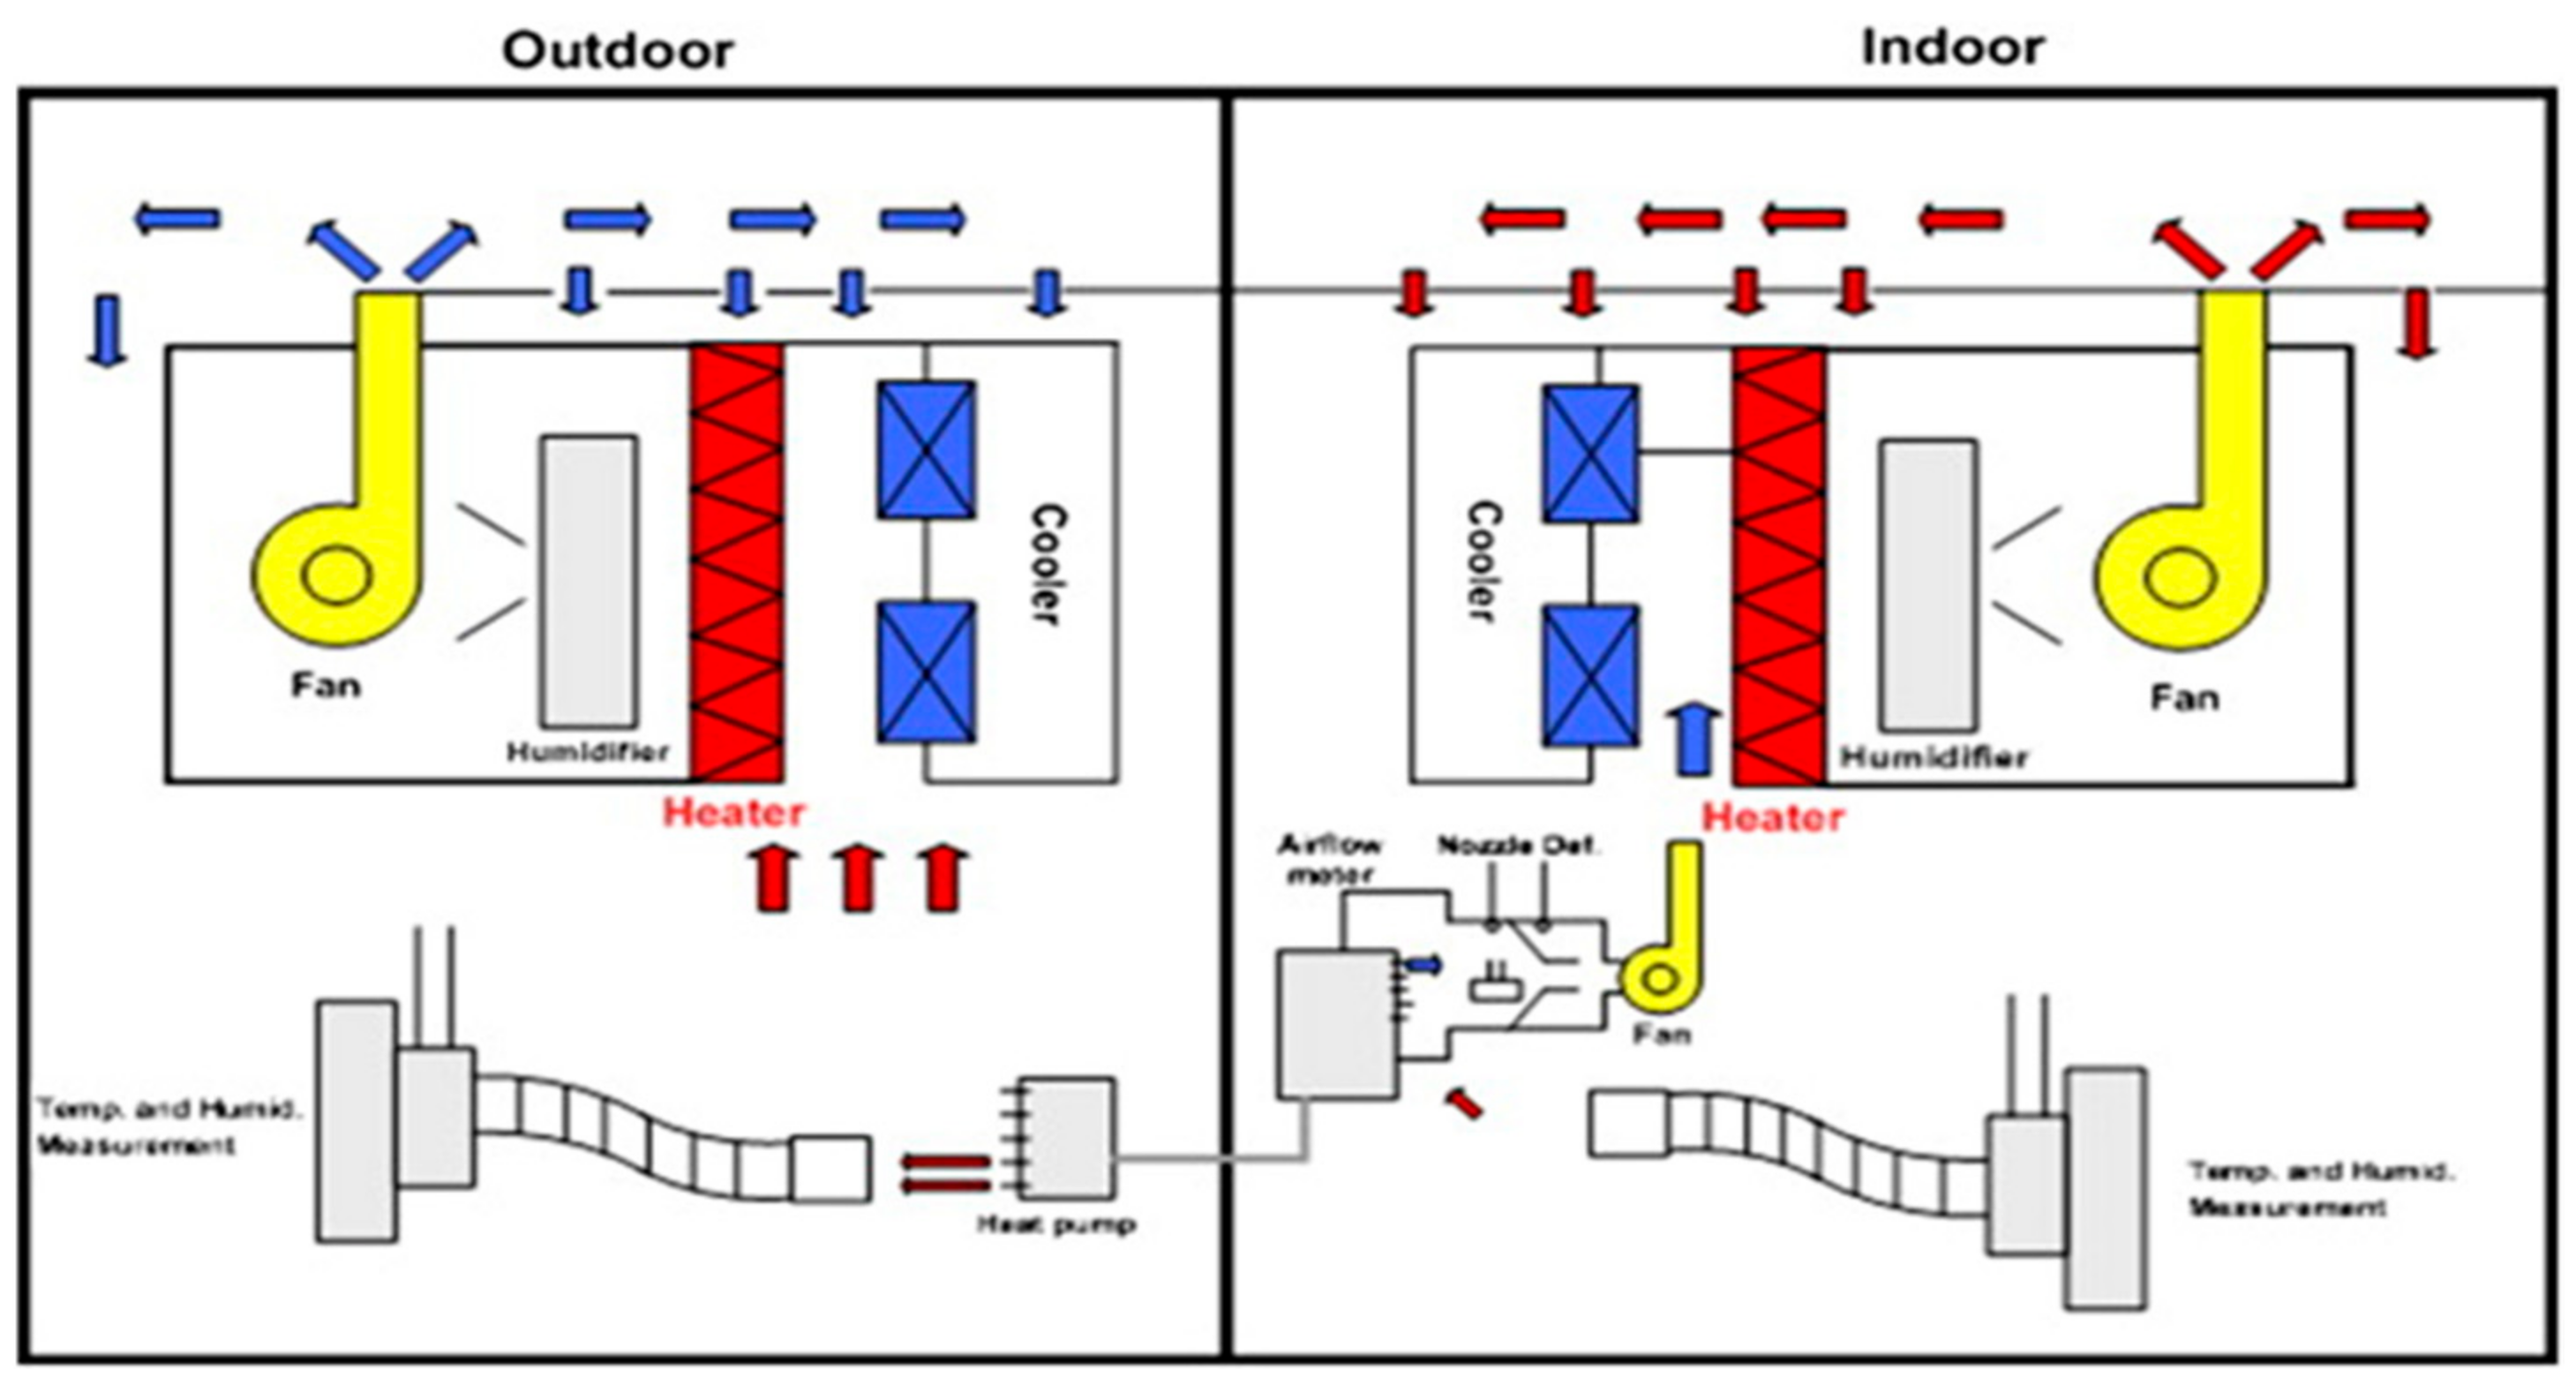
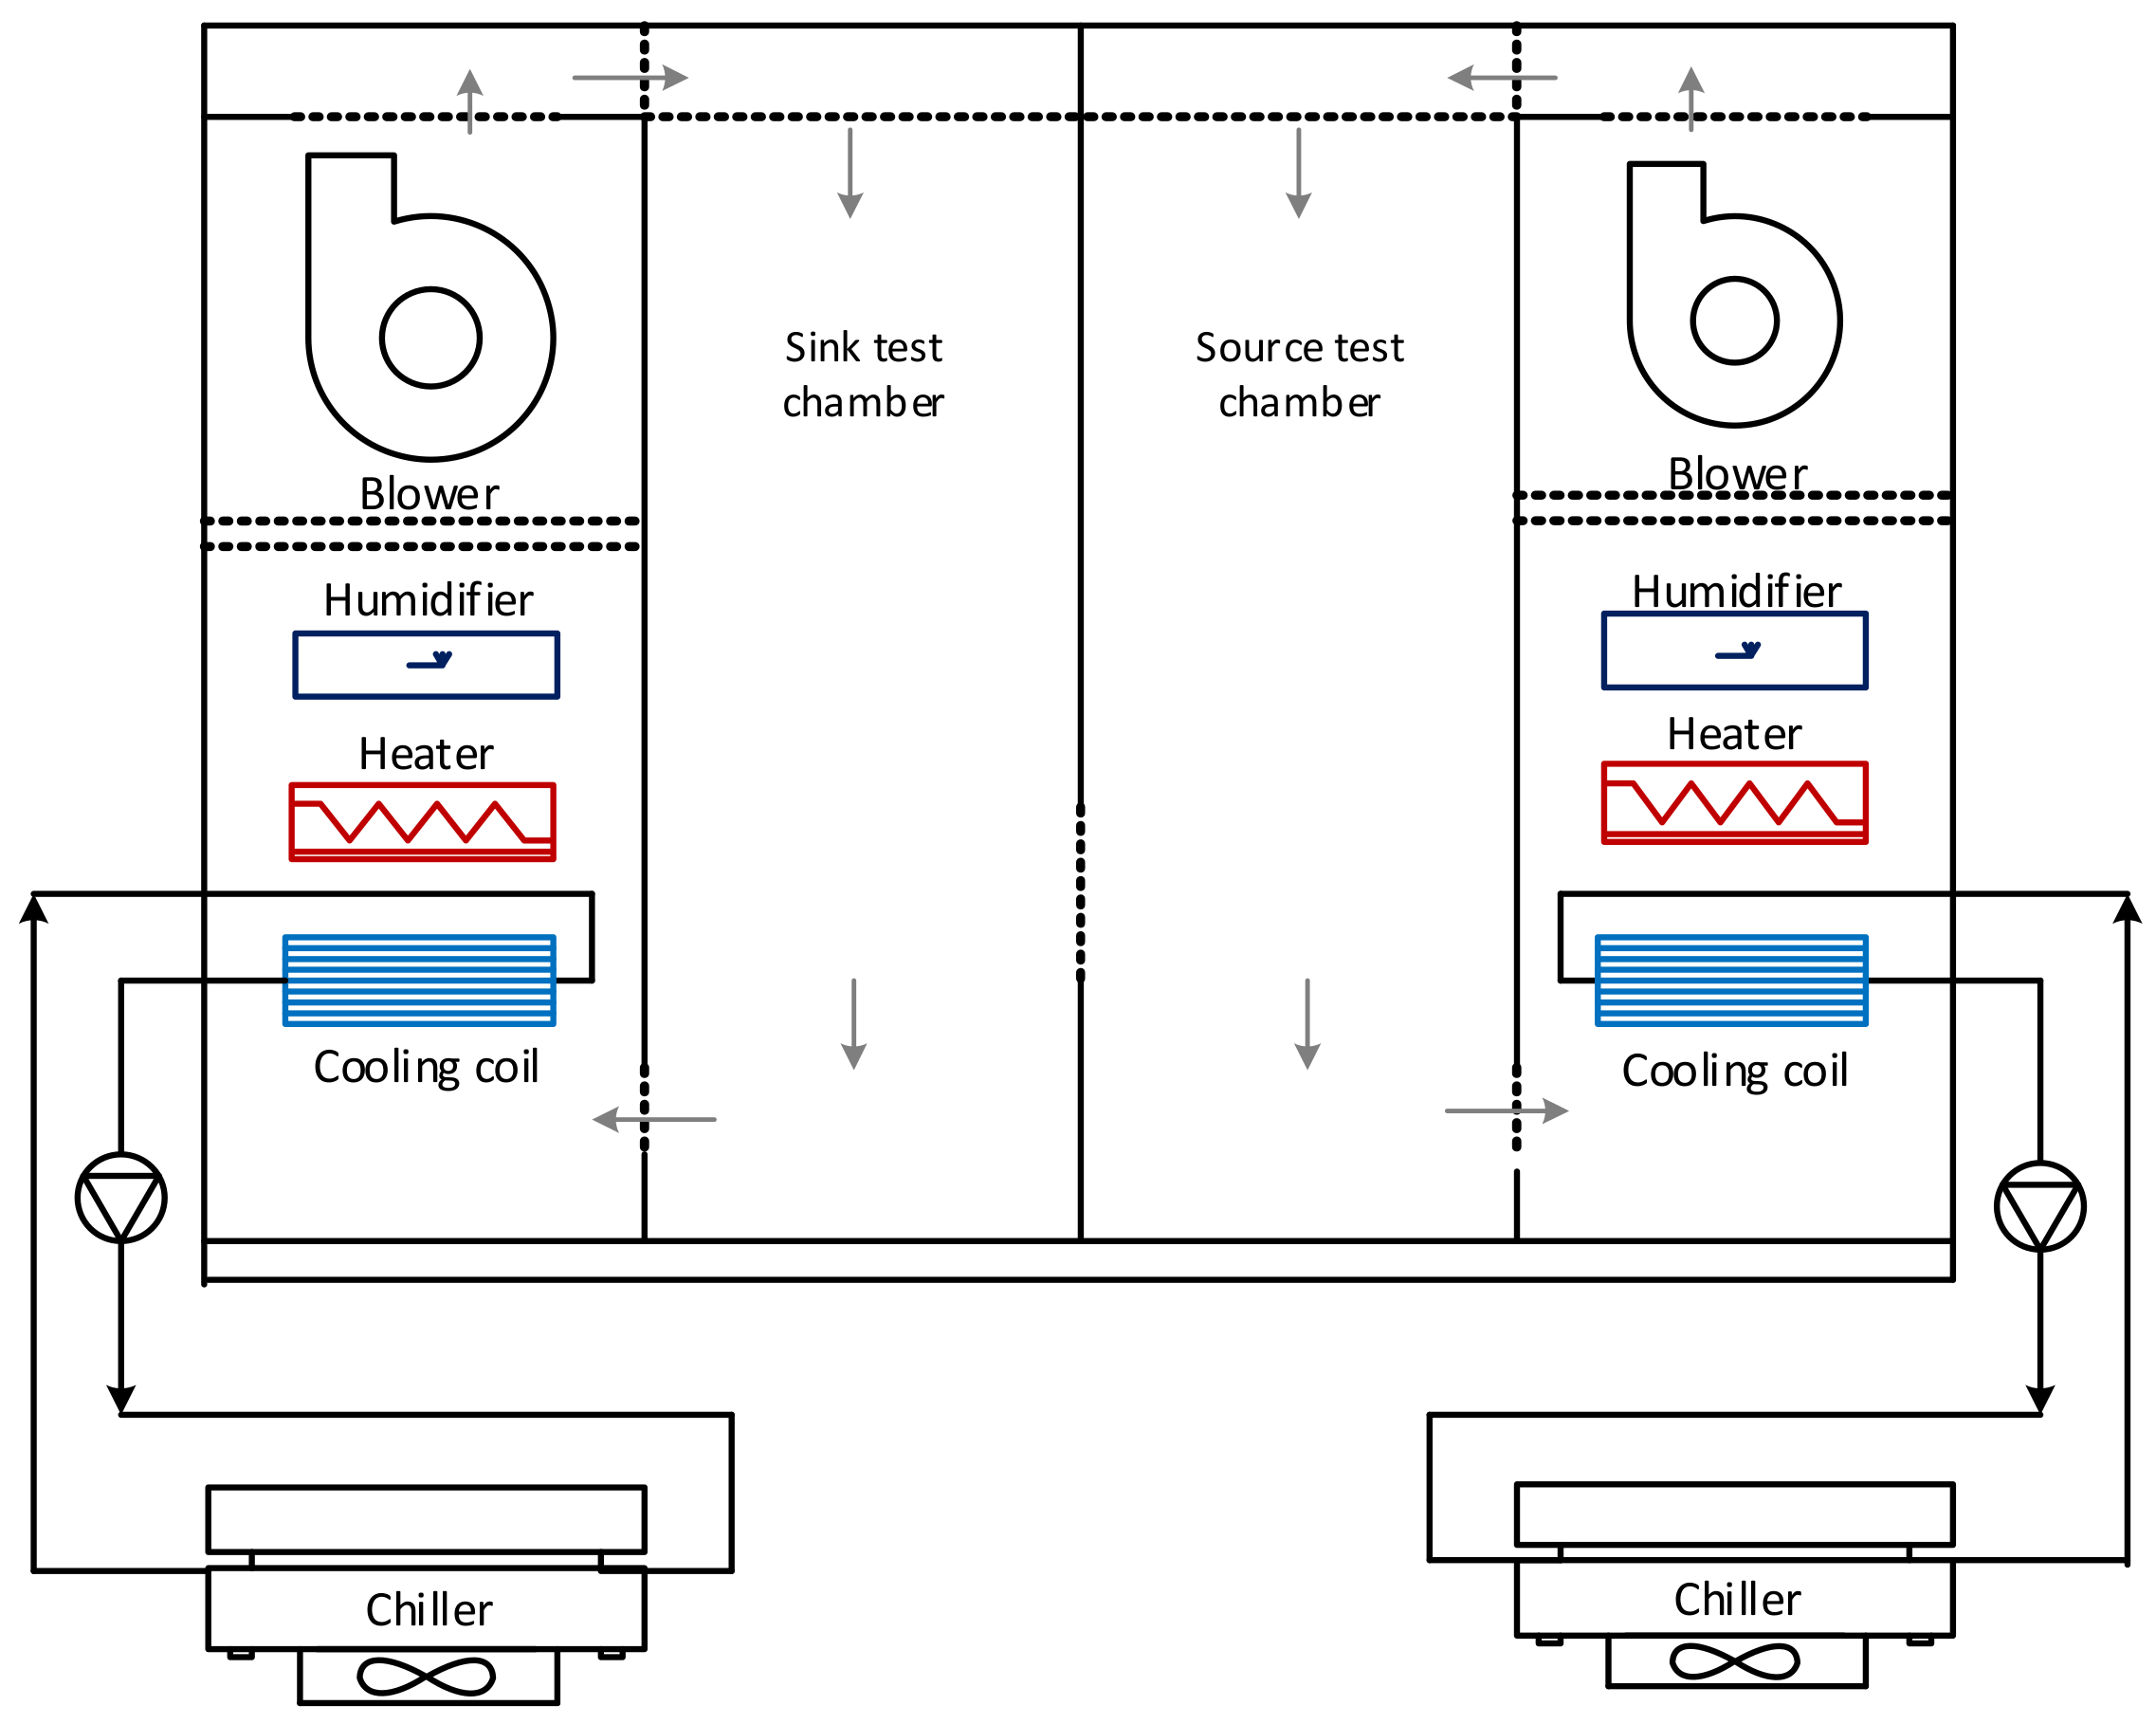
2.3. Description of System Modeling and Simulation Conditions

Two systems modeling and three case scenarios were considered. In the conventional system modeling specified as the case (1) scenario, each test chamber was equipped with a separate air handling unit consisting of a refrigeration unit, electric heating coil, humidifier, and supply fan as schematically shown in Figure 4. The two test chambers were specifically, heat source and heat sink chambers. The air handling unit (AHU, hereafter) in each test chamber was used to control air temperature and humidity in the chamber. During operation, a cooling coil in the AHU absorbed heat from return air in each chamber by means of chilled water provided by the chiller. The chiller operated at constant speed and therefore, the cooling rate of the cooling coil decreased the air temperature below the required supply air temperature to the chamber. Hence, electric heating coil was used to maintain constant air temperature by means of the supply fan. The humidity condition in each test chamber was controlled with the humidifier.
In the schematic of the proposed system modeling shown in Figure 5, the AHU in the source chamber was also equipped with a water heating coil. Therefore during operation, the return water at high temperature from the AHU cooling coil in the sink chamber flowed through the heat recovery unit to exchange heat with the low return water temperature from the water heating coil of the AHU in source test chamber. Hence, the water inlet temperature to the chiller evaporator in the sink chamber decreased and as such, the required cooling capacity decreased. Therefore, the chiller unit for the sink chamber utilized a relatively smaller capacity compared to the capacity used in the conventional system modeling. Two case scenarios specified as case (2) and case (3) were adopted for the proposed system modeling. In case (2), the chiller unit for the sink chamber utilized the same capacity as in the conventional modeling case (1) whereas in case (3), the chiller for the sink chamber utilized a smaller capacity relative to the capacity used in the conventional system.
For simulation conditions, the internal gain for electric equipment was used in modeling the internal load capacities of the indoor and outdoor test units in the test chambers. The study assumed testing in heating operating mode with the same COP (Coefficient of performance) of 4.0 [33]. Hence, considering internal load capacities of 7, 9, and 11 kW in the sink chamber, corresponding values for the source chamber were 5.25, 6.75, and 8.25 kW, respectively as shown in Table 1. The internal gain for lighting equipment was assumed to be 3.3 W/m2 for surface mounted fluorescent [34]. Also, there are no occupants in the test chambers during calorimeter operation and therefore internal load gains due to people were not considered.
During simulation, the system operating schedule was from 10:00 until 21:00 where the air temperature in each test chamber is controlled to a cooling and heating setpoint temperature of 25 °C and 21 °C, respectively [35]. From EnergyPlus weather database [27], weather data of Incheon was selected for the simulation. Figure 6 indicates the annual outdoor air temperature and relative humidity according to the weather data of Incheon city from the International Weather for Energy Calculations (IWEC) database developed by ASHRAE and available in EnergyPlus. The annual average minimum to maximum outdoor air temperatures and relative humidity were about −2 °C to 26 °C and 45% to 88%, respectively.
The coldest temperatures occurred in January, which was regarded as the winter design month for Incheon weather data in EnergyPlus where the average dry bulb temperature was between −5.8 °C and 4.1 °C, whereas the relative humidity was about 26% to 82%. Also, the hottest temperatures occurred in August with average dry bulb temperature of 21 °C to 29 °C and relative humidity of about 65% to 94%. Hence, the summer design month was August according to the Incheon weather data available in EnergyPlus. Based on weather location considered in this study, the performance evaluations of the three studied case scenarios were analyzed using some selected days in both the winter and summer design months. Also, performance analysis using some representative months were carried out. The simulation input conditions are summarized in Table 2.

2.4. Description of Component Modeling

The system modeling for both conventional and proposed systems consisted of a refrigeration unit, an electric coil heater, a humidifier, and a supply fan for each test chamber. In addition, the proposed system modeling contained a water heating coil and a heat recovery unit. Each component was modeled with data from the EnergyPlus engineering database. The EnergyPlus engineering reference for energy calculation document contained the modeling equations for sizing each of the components [27].

2.4.1. Refrigeration Unit Modeling

The electric chiller implemented in the EnergyPlus program was used to model the refrigeration unit in each chamber. For chiller modeling, nominal capacity and COP was user specified. In this study, for internal load capacities of 7, 9, and 11 kW, chiller capacity of 14 kW (4 RT) was adequate for steady state operation. However, to facilitate rapid changes in test conditions, excess capacity was desired. Hence, a nominal chiller capacity of 21 kW (6 RT) was selected for the AHU in each chamber for both case (1) and case (2) scenarios. However, in case (3), nominal capacity of 12 kW (3.5 RT) was specified for the AHU chiller in the sink chamber. For all cases studied, chiller COP of 3.0 was selected [27]. Considering chilled water exit temperature of 8 °C and loop design temperature difference of 5 °C, Equations (1), (2), and (3) were used in the EnergyPlus to size the volumetric water flow rate through the evaporator and condenser of the chiller, respectively.
Q n o m = V l o o p , d e s · c p , w · ρ w · Δ T l o o p , d e s
V e v a p ,     d e s = V l o o p ,     d e s
V c o n d , d e s = Q n o m · 1 + 1 / C O P n o m / Δ T l o o p , d e s · c p , c d , w · ρ w
where Qnom is the nominal cooling capacity of the chiller in kW, Vloop,des is the loop design volumetric flow rate in m3/s, ρw is density of water at standard conditions (5.05 °C) in kg/m3, and cp,w is the specific heat capacity of water at 5 °C in kJ/kg. °C, ∆Tloop,des is chilled water loop design temperature rise in °C, COPnom is the chiller nominal COP, and cp,cd,w is the specific heat of water at condenser inlet temperature in kJ/kg. °C.
The EnergyPlus used empirical model from the Building Loads and System Thermodynamics (BLAST) program to model the chiller. The capacity, power, and full load parameters were each defined by a set of performance curves. These chiller performance curves were generated by fitting catalog data to third order polynomial equations. In this study, the performance curves for the electric chiller used to simulate the refrigeration unit were obtained from the EnergyPlus reference database.
The fluid or dry cooler was used to model the heat extraction unit of the chiller. The design water flow rate was sized to be the same as the loop design volumetric flow rate in Equation (1). Based on the performance input method, the dry cooler fan power was sized. By adopting the design water flow rate and overall conductance method, the nominal fan power at the design air flow rate was determined by the program using Equations (4) and (5).
Q f a n , n o m = 0.0105 · Q d c ,   n o m
Q d c , n o m = V l o o p , d e s · c p , c d w e · ρ w · Δ T c , l o o p , d e s
where Qfan,nom is the nominal fan power of dry cooler in kW, Qdc,nom is the loop design nominal capacity of dry cooler in kW, Vloop,des is the loop design volumetric flow rate in m3/s, ρw is the density of water at standard conditions in kg/m3, cp,cdwe is the specific heat of water at condenser exit temperature in kJ/kg. °C, and ∆Tc,loop,des is the condenser water loop design temperature rise in °C.
The refrigeration unit provided the chilled water to the water cooling coil located in the air handling unit for each test chamber. The heat transfer through the coil was modelled by using the NTU–effectiveness approach and cross-flow arrangement in the EnergyPlus program to determine the design water flow rate, design air flow rate, and humidity ratio at inlet and outlet of the cooling coil.

2.4.2. Heater Modeling

The electric heating coil model in EnergyPlus was used to simulate the electric air heaters in the air loop in each chamber. The electric coil modeling was simple as the system connection required only air nodes. The coil can be temperature or capacity controlled depending on how it is used. In study, since the coil was utilized in the air loop simulation, the control parameter was a specified temperature scheduled from the setpoint manager. To model the electric heating coil, nominal capacity has to be specified. For internal load capacities of 7, 9, and 11 kW, a nominal capacity of 20 kW was selected since total heating required at steady-state operating conditions cannot exceed the specified value.
In the proposed system modeling, an additional water heating coil was included. Unlike an electric heating coil that utilized only air nodes, the sizing of the water design loop was also required for water heating coil modeling. The water heating coil object in the EnergyPlus also utilized the effectiveness–NTU algorithm by assuming a cross-flow heat exchanger. The overall conductance and water flow rate were specified with the autosize function in EnergyPlus program to estimate heat transfer rate in the water heating coil using Equation (6).
Q w , a = U A · T w , a v g T a , a v g
where Qw,a is the heat transferred from water to air in W, UA is the overall thermal conductance in W/°C, Tw,avg is the average water temperature in °C, and Ta,avg is the average air temperature in °C.

2.4.3. Heat Recovery Unit Modeling

The heat recovery modeling was a water-to-water heat exchanger to permit heat transfer between the water at high temperature from cooling coil in the sink chamber and the low water temperature from the water heating coil in the source chamber. The water flow rate was specified in the EnergyPlus program using Equation (7). The average water temperature in the water heating coil was based on the heat exchange rate in the heat recovery unit.
V h r u = V l o o p , d e s · f c , s
where Vhru is the volumetric water flow rate through heat recovery in m3/s, Vloop,des is the loop design volumetric flow rate in m3/s, and fc,s is the component sizing factor.

2.4.4. Humidifier Modeling

The electric steam humidifier in the EnergyPlus program was used in modeling the humidifier in each chamber. The component utilized electrical energy to generate steam from tap water and injects into the supply air stream by means of a blower fan. The humidifier modeling contained local control of the humidifier unit to meet the humidity ratio setpoint on its air outlet node. The program utilized Equation (8) to evaluate the rated electric power input of the humidifier.
P r a t e d = V r a t e d · ρ w · h f g + c p , w a v g · Δ T w
where Prated is the rated power of the humidifier in W, Vrated is the rated capacity of humidifier in volumetric flow rate in m3/s, cp,wavg is the specific heat of water at average temperature of 60.0 °C in J/kg. °C, ∆Tw is the sensible temperature rise of water in °C, and hfg is the latent enthalpy of vaporization of water at 100 °C in J/kg.

2.4.5. Pump Modeling

The pumps were utilized for circulating water through the refrigeration and heat recovery heat unit loops. In the EnergyPlus program, the variable speed pump was used in modeling the system pumps. The designed water flow rate through the pumps was estimated to be relatively equal to design loop flow rate. The program used Equation (9) to determine the design power consumption of the pump. The default pressure head value of 179,352 Pa in the EnergyPlus was used.
P p u m p = H n o m · V n o m · F s / η m o t o r
where Ppump is the design power consumption of the pump in W, Hnom is the nominal head or pressure rise across the pump in Pa, Vnom is the nominal design volumetric flow rate in m3/s, Fs is the scaling factor with a default value of 1.282051 J/Pa∙m3, and ηmotor is motor efficiency, often the default value of 0.9.

2.4.6. Fan Modeling

The fan modeling was that of constant volume fan which was intended to operate continuously based on a time schedule. This fan does not cycle on and off based on cooling and heating load or other control signals. The maximum flow rate through the fan was modeled using the air volumetric flow rate in m3/s at standard temperature of dry air at 20 °C dry bulb.
The program utilized local barometric pressure to account for altitude using Equation (10) for standard atmospheric pressure based on the ASHRAE handbook of fundamentals (ASHRAE, 1997) to initialize the air systems being simulated. The study assumed pressure rise of 600 Pa and utilized the default values of 0.9 and 0.7 for the motor efficiency and fan total efficiency respectively.
p = 101325 · 1 2.25577 × 10 5 · Z 5.2559
where p is the pressure in Pa, and Z is the altitude in m.

3. Analysis of Simulation Results

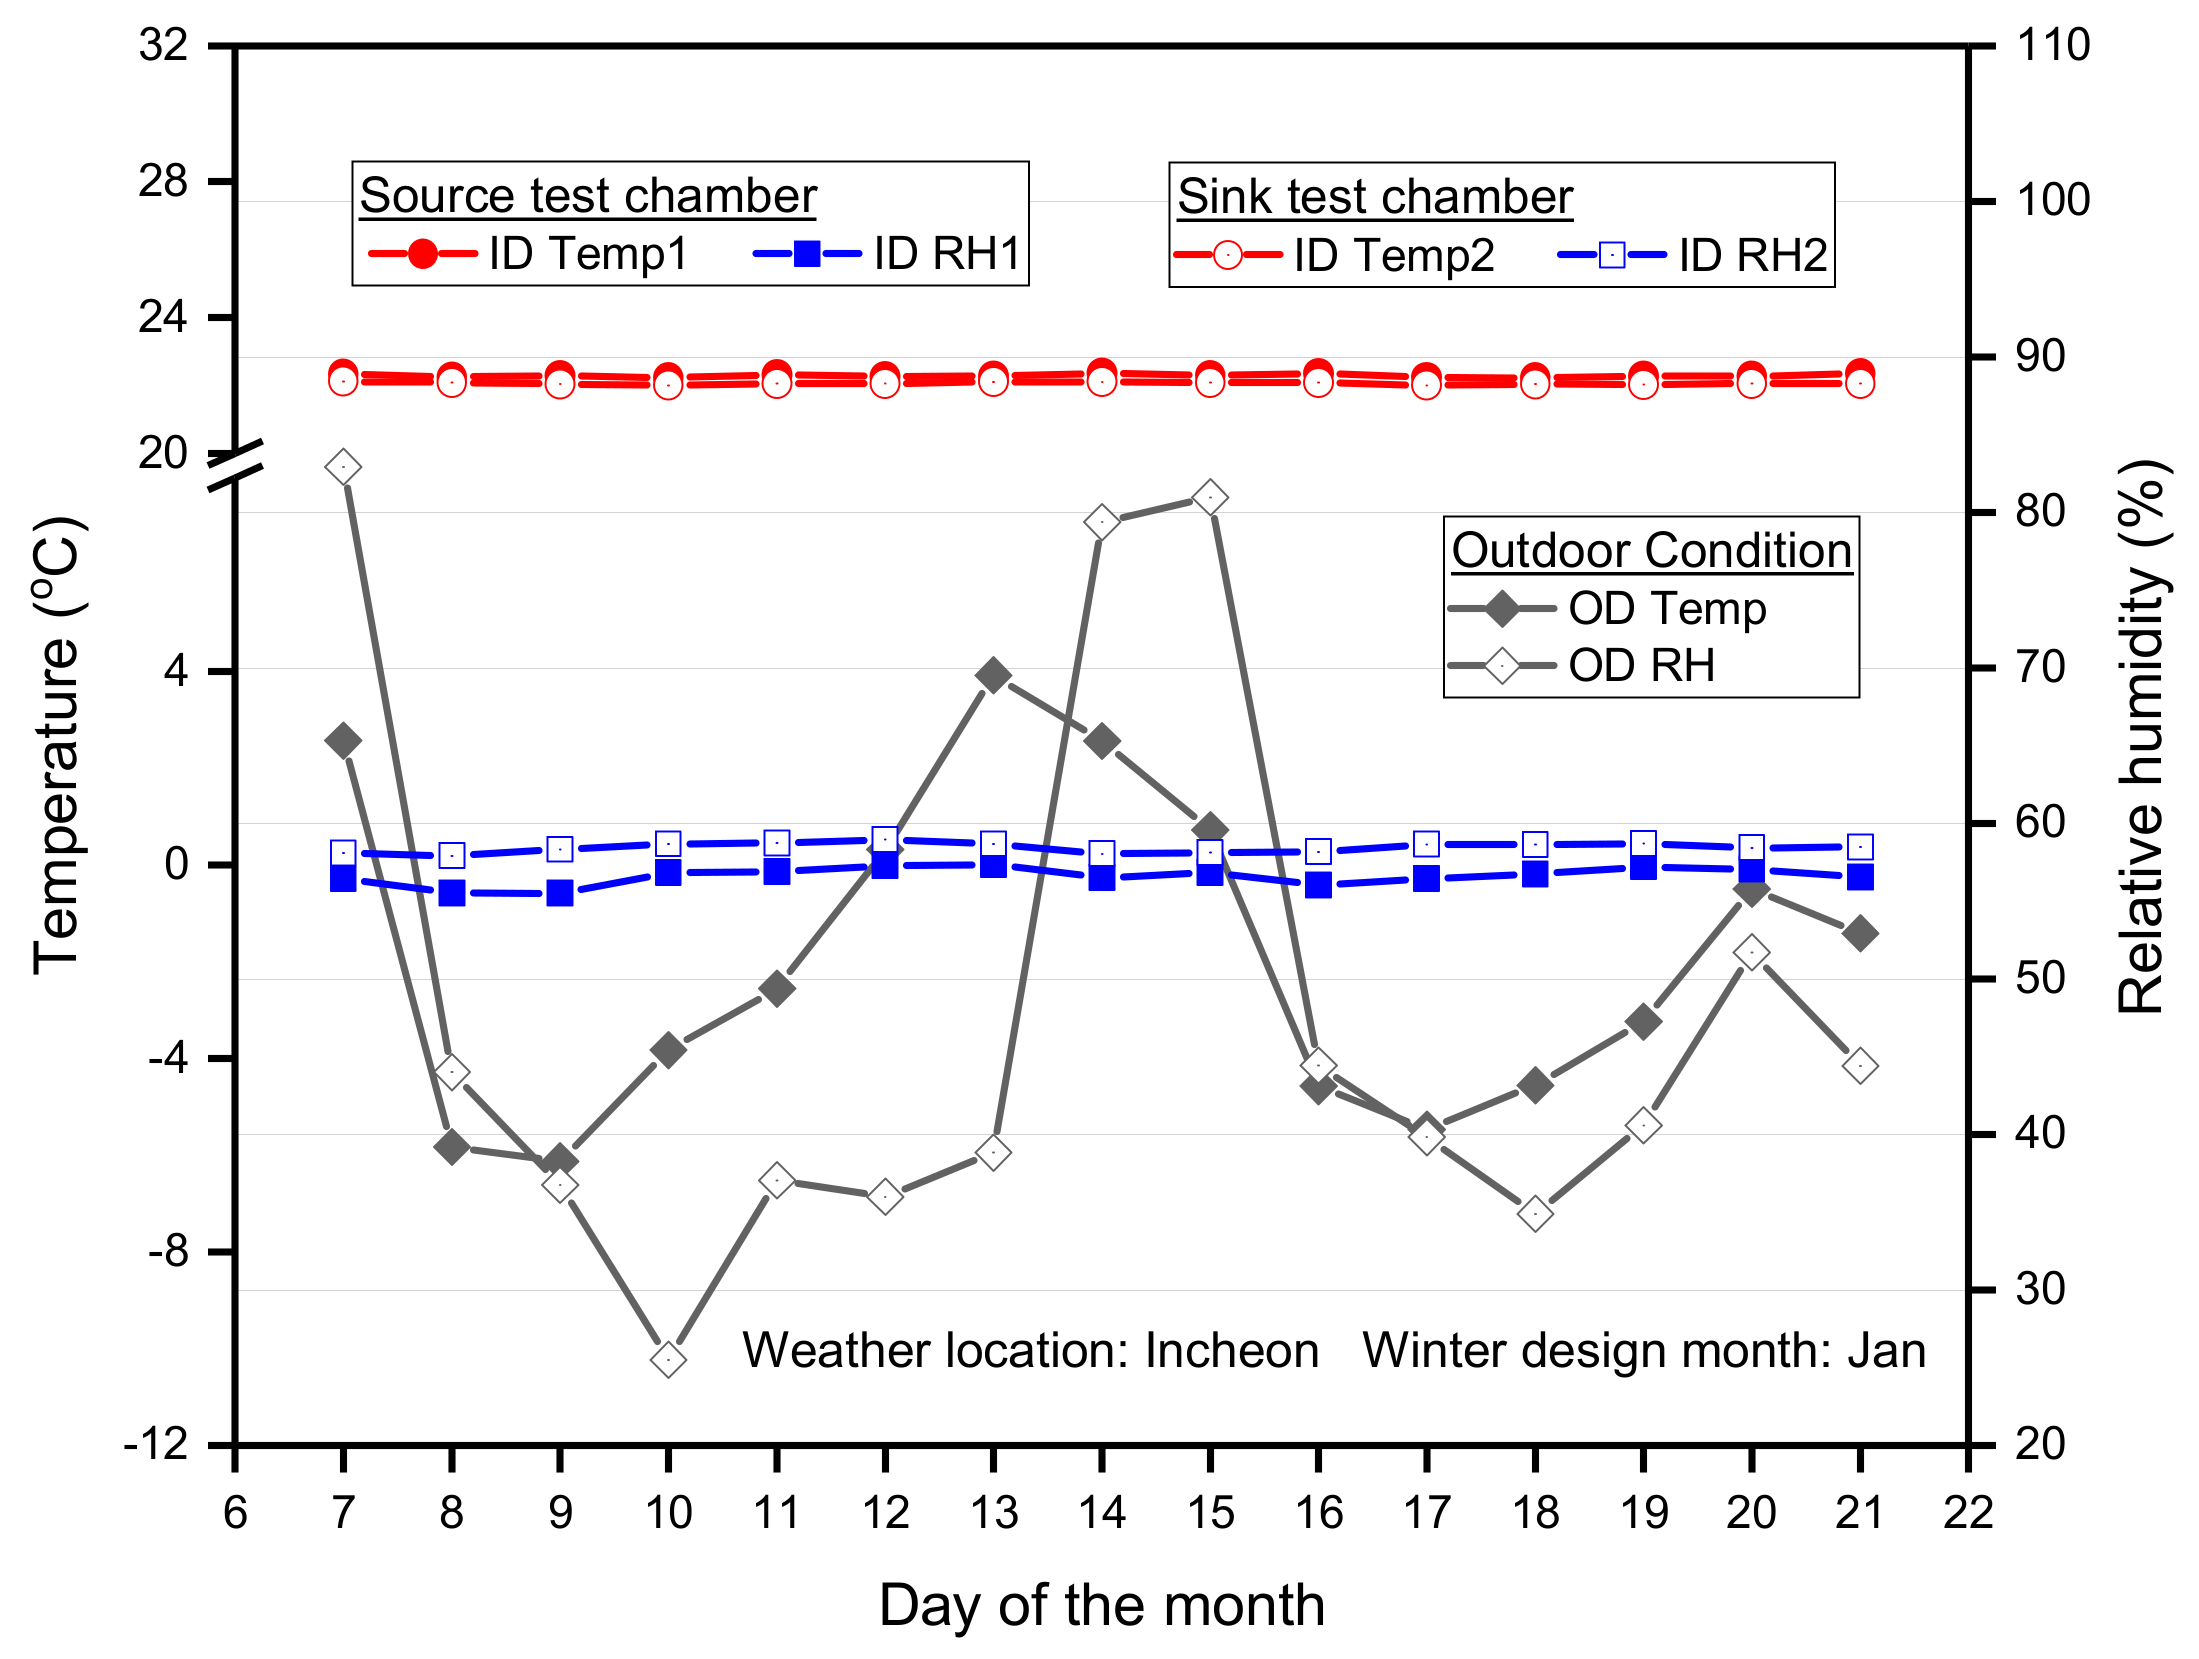
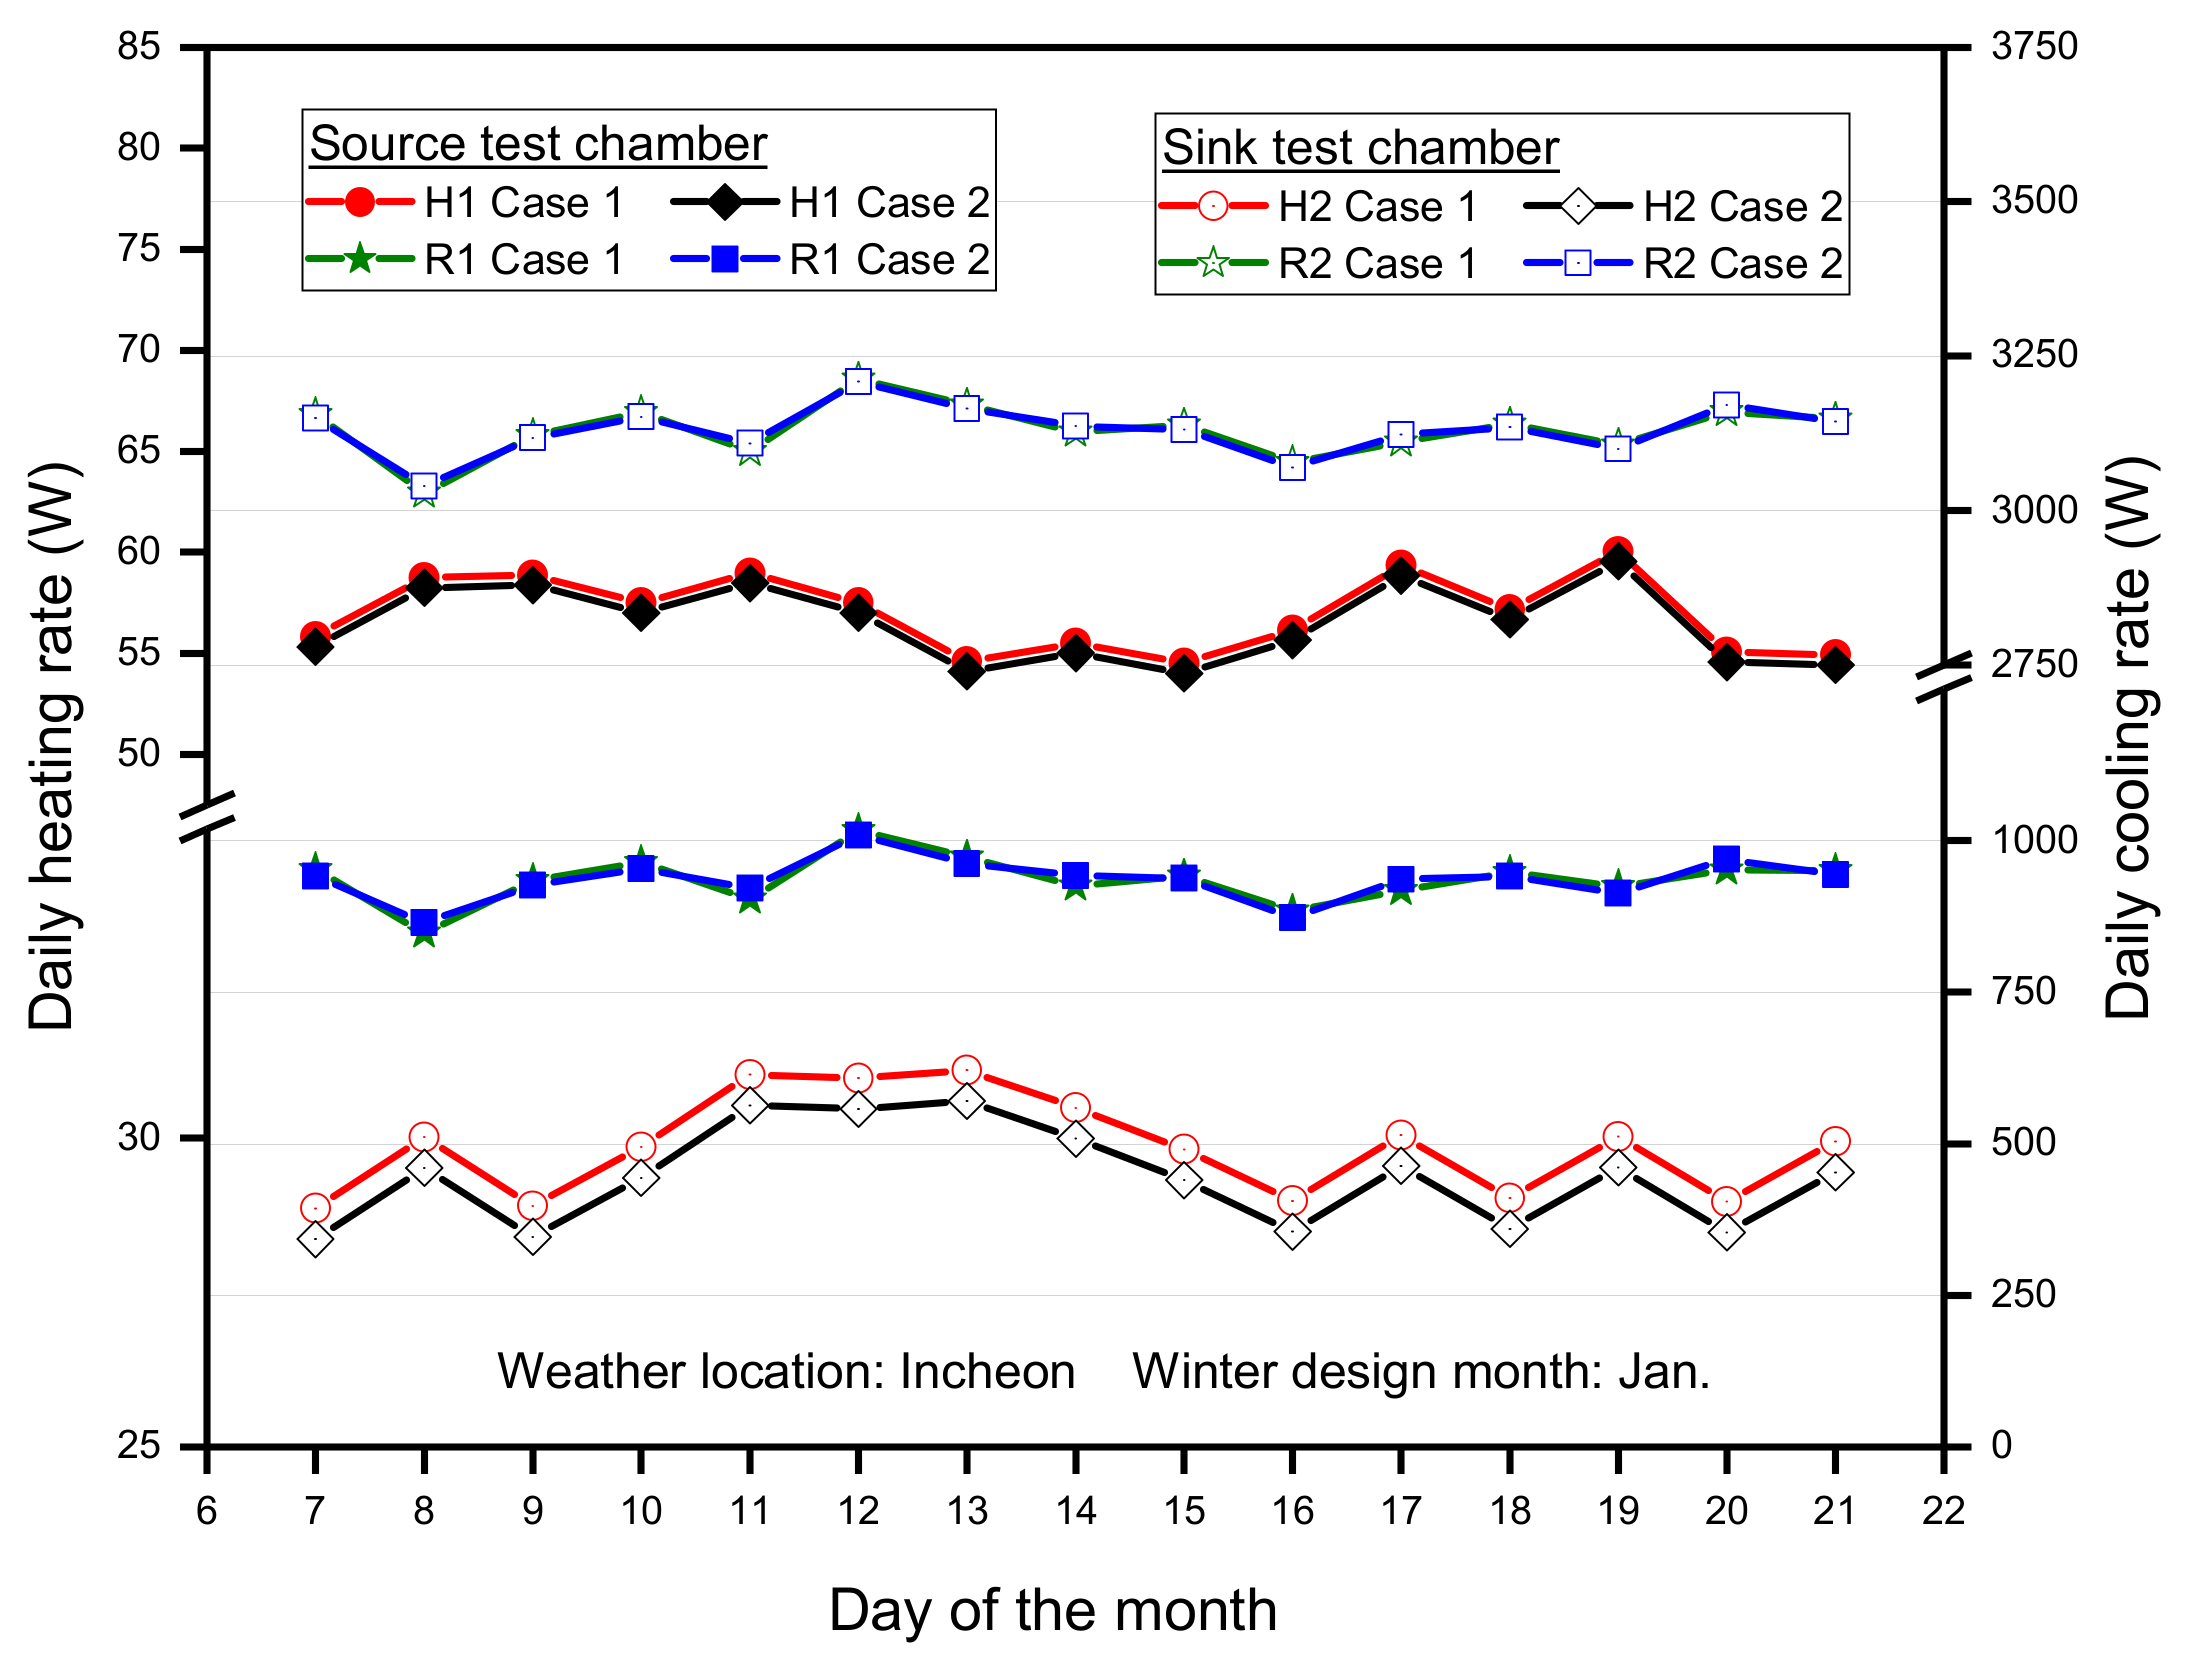
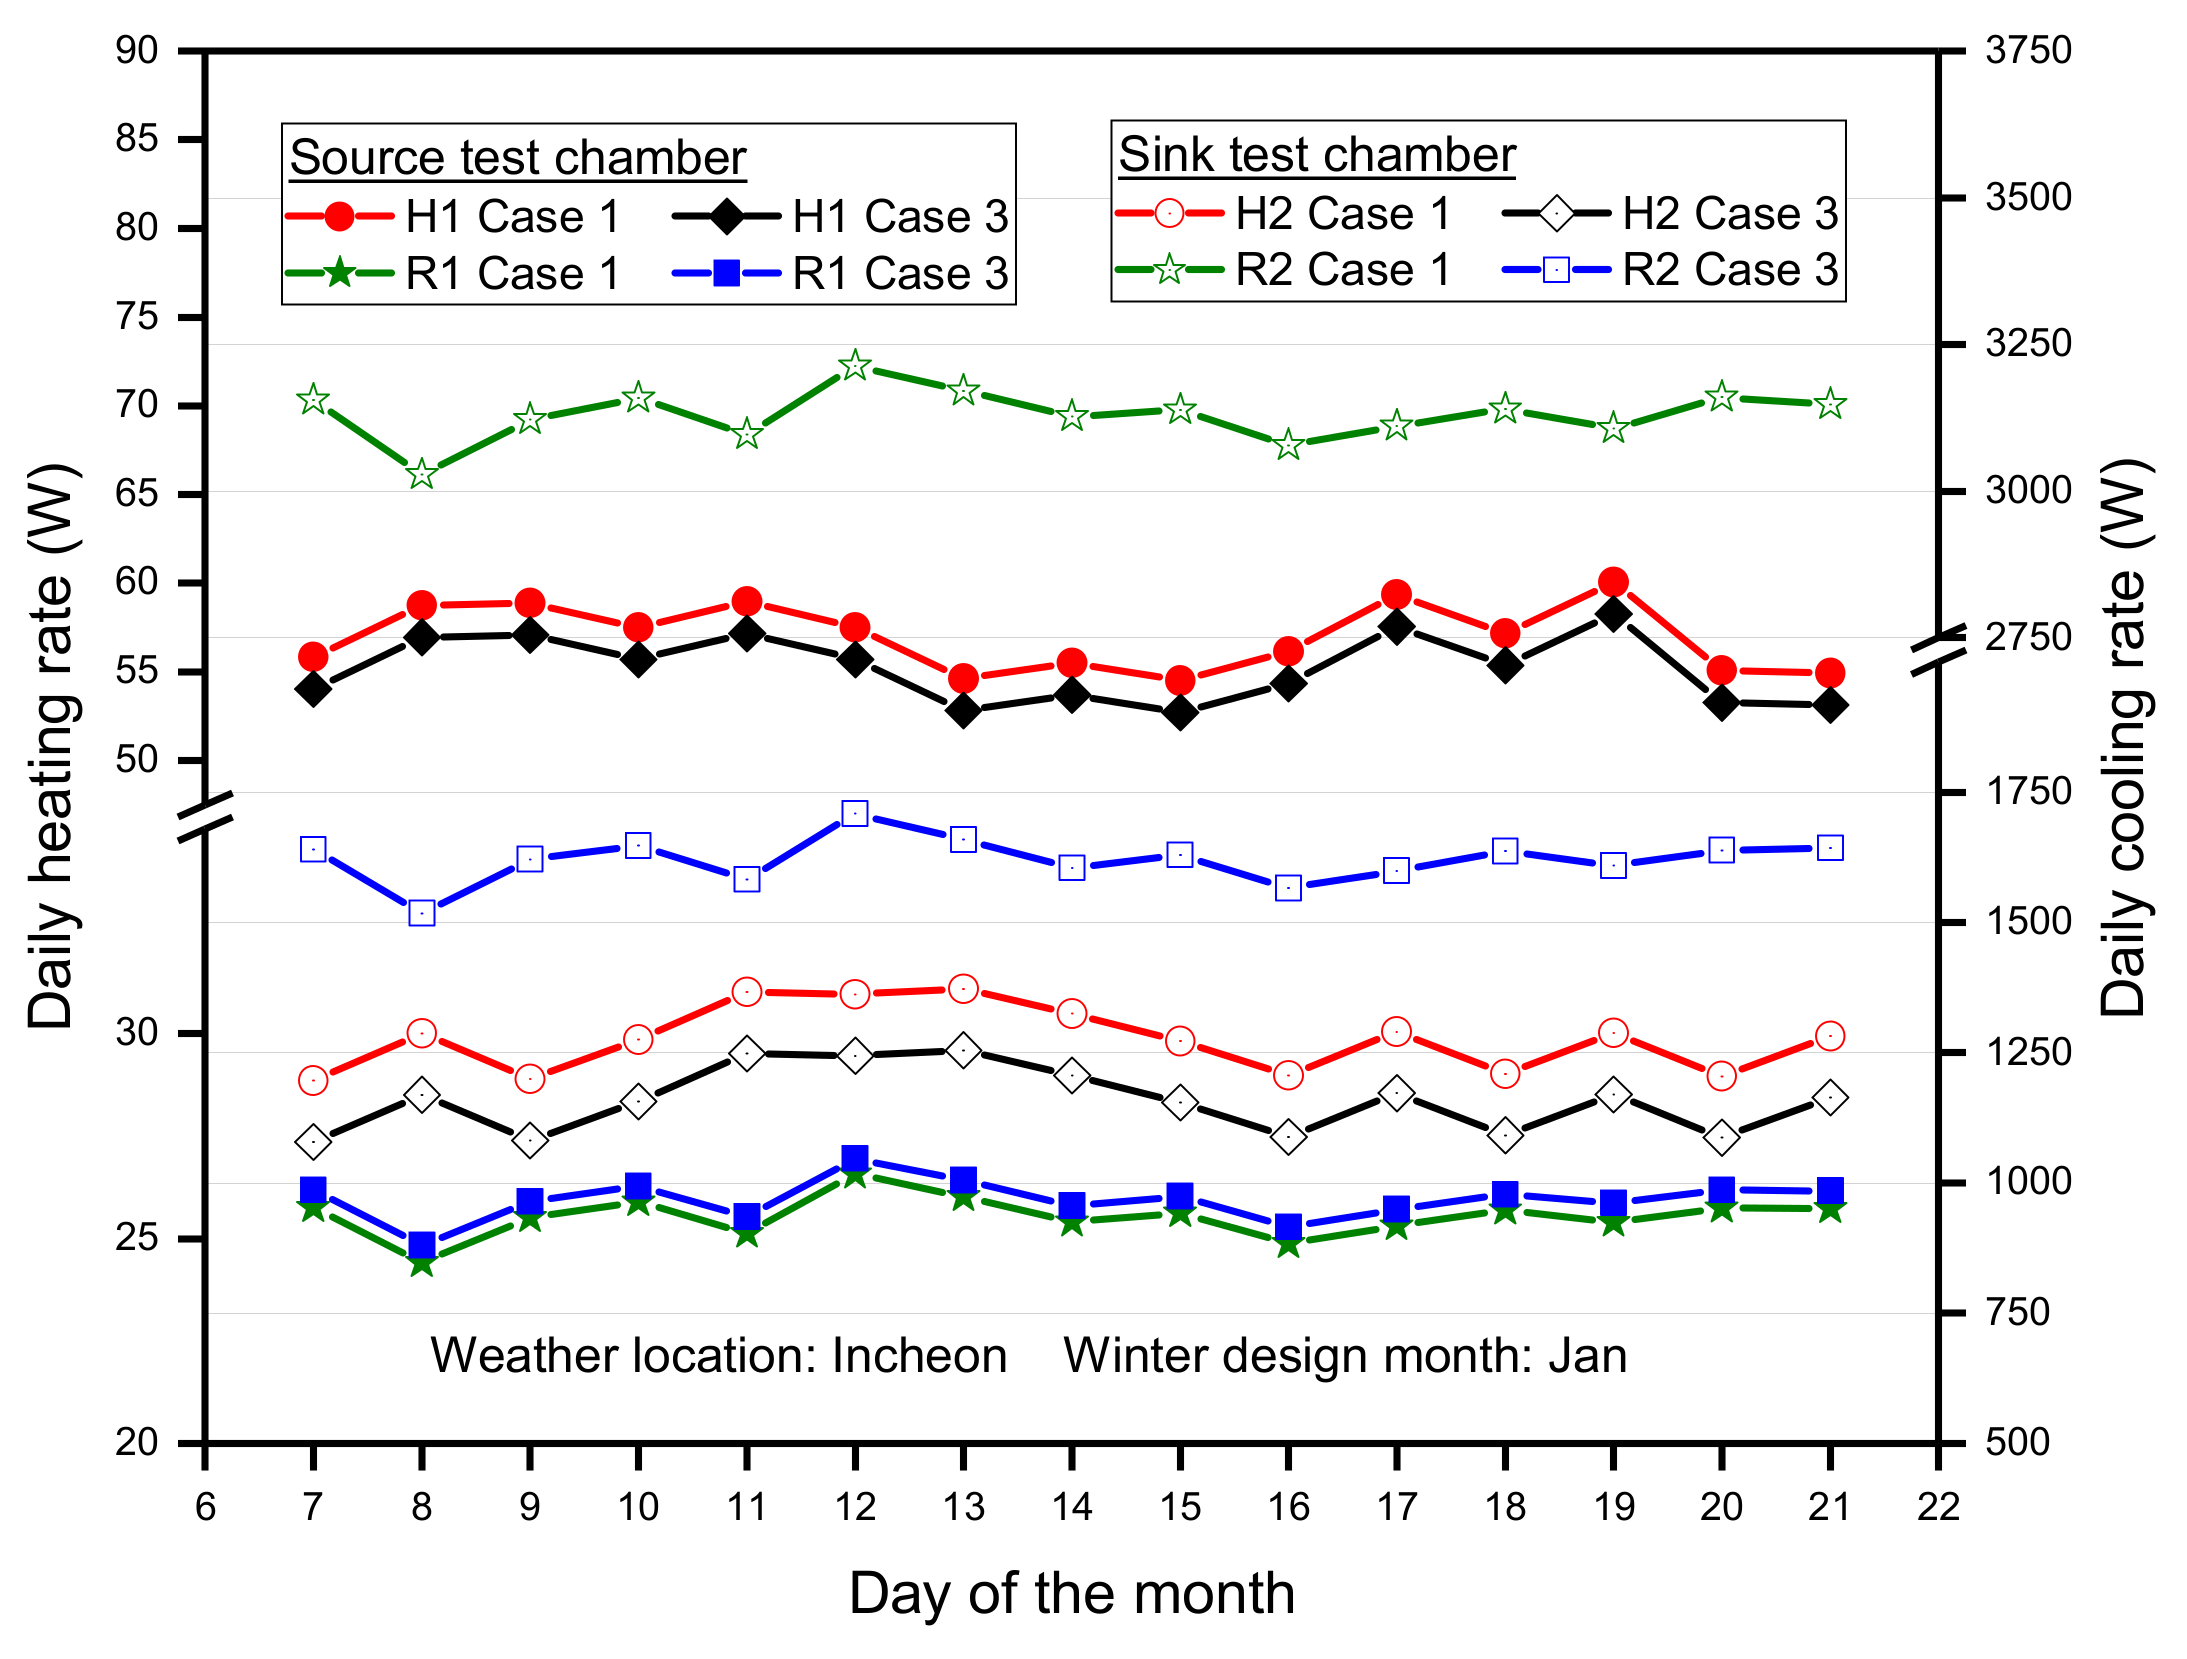
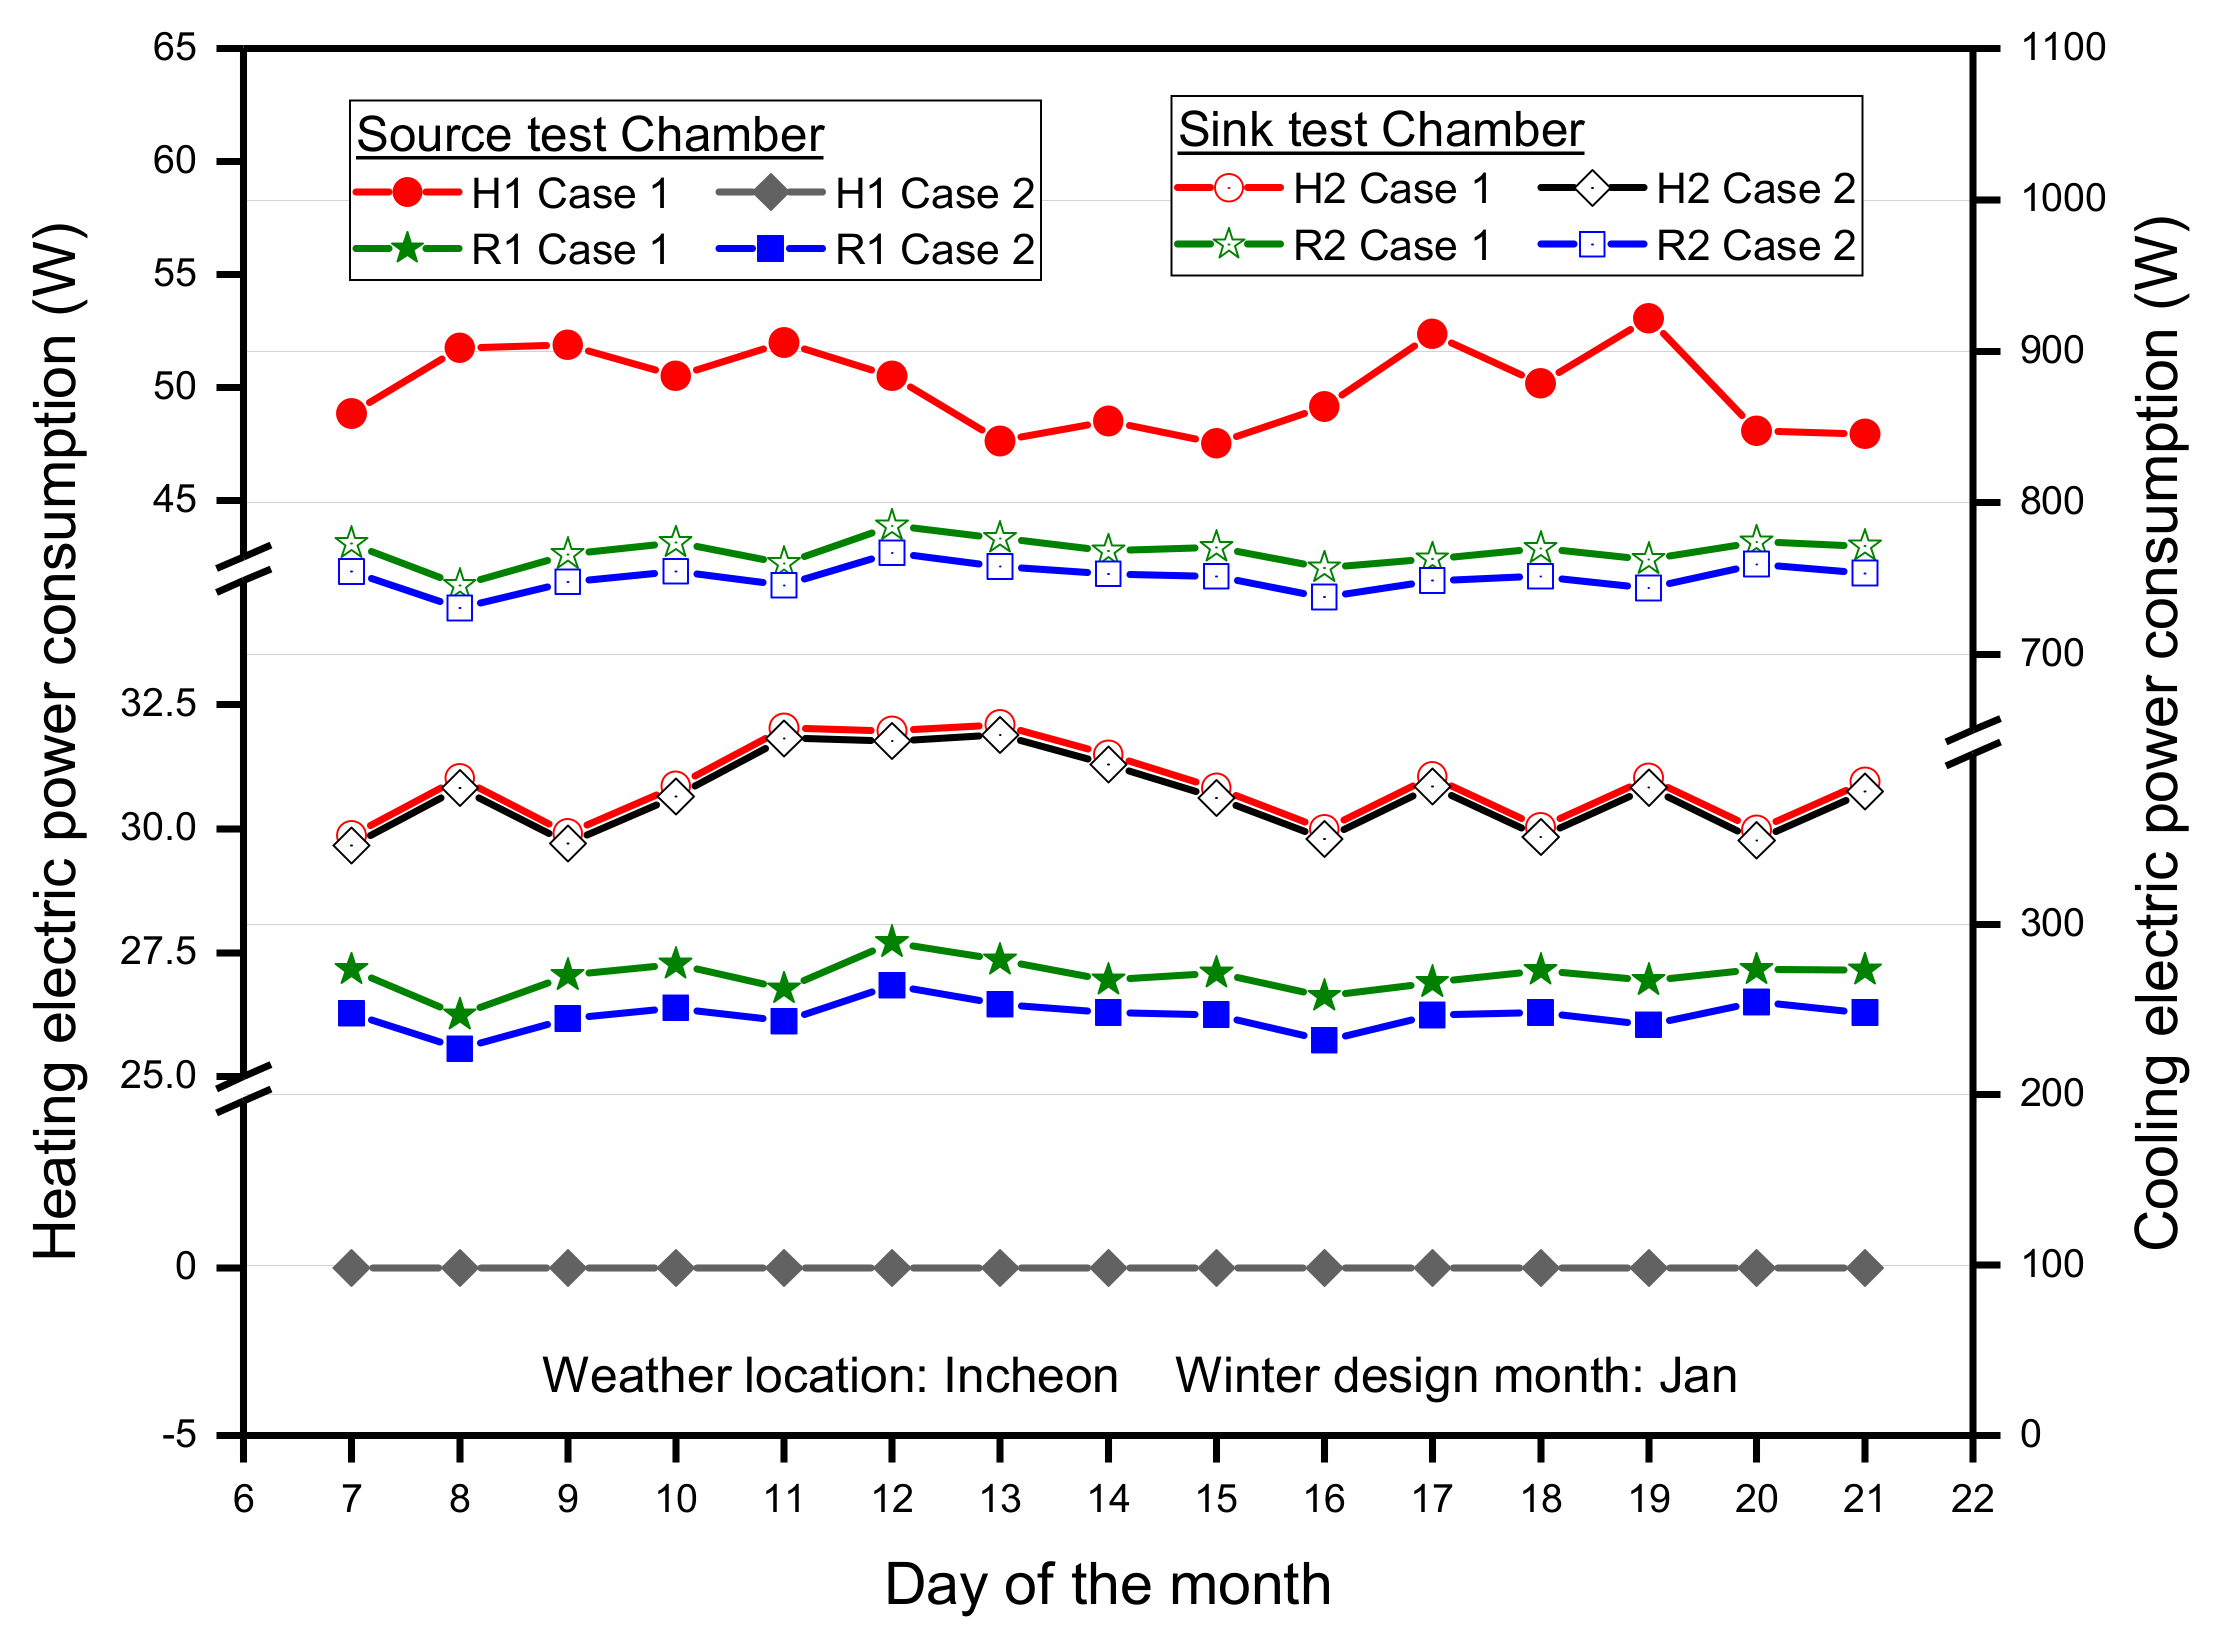
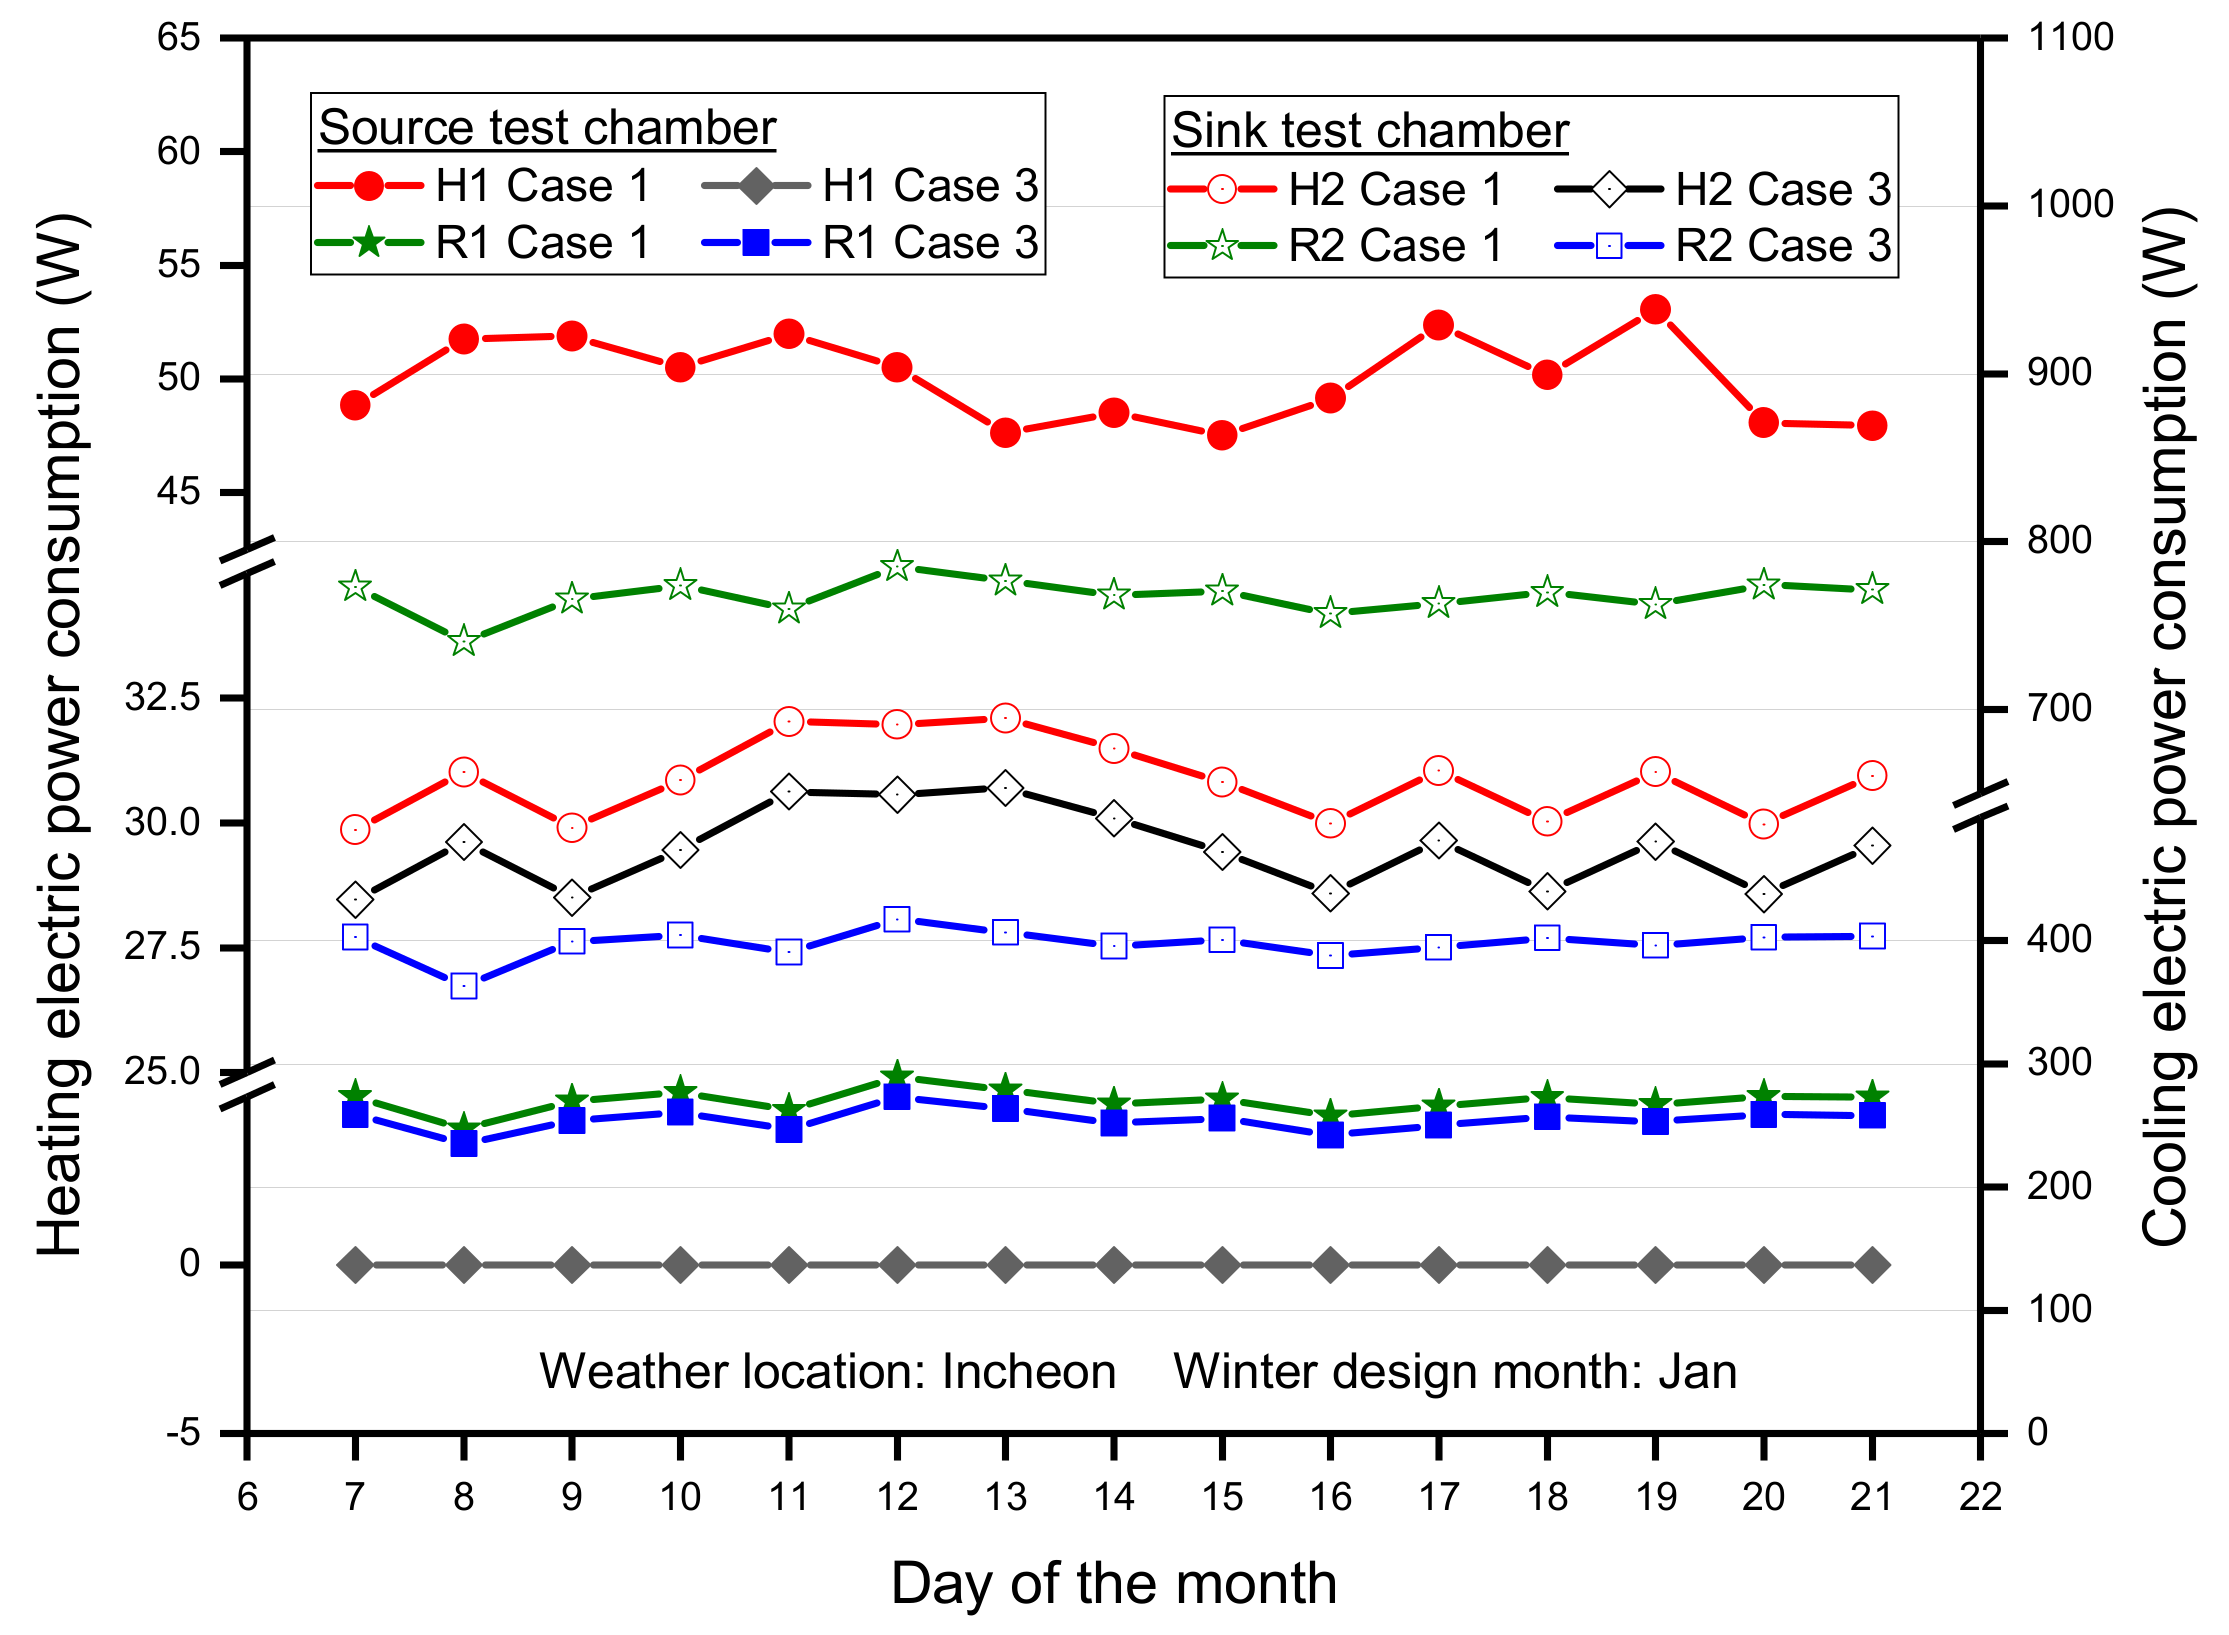
3.1. Performance Analysis of Modeling Cases in Winter Condition

The performance of the three case scenarios according to simulation test results in the winter design month were evaluated considering equipment with the same internal load capacity in each test chamber. Figure 7 represents the variation of air temperature and relative humidity conditions in both the source and sink test chambers as well as outdoor dry bulb and humidity according to representative days in January. The outdoor air temperature varied from −6.1 °C to 3.9 °C whereas outdoor relative humidity was 26% to 83%. However, for all case scenarios, the indoor temperature in each test chamber was controlled to maintain a relatively constant air temperature of about 23 °C. The humidity control varied slightly from 56% to 57% in the source chamber and from 58% to 59% in the sink chamber.
For analysis in terms of variations in the heating and cooling rates, Figure 8 and Figure 9 show the performance comparison of case (1) modeling to that of case (2) and case (3), respectively. In both case (1) and case (2) as indicated in Figure 8, the cooling rate in the sink chamber was higher than the source chamber because the heat extraction rate due to equipment internal load capacity was higher in the sink chamber than in the source chamber. As such, the exit water temperature from the cooling coil in the sink test chamber was higher than the source chamber. However, due to the constant flow mode of the chiller, the exit air temperature from the cooling coil decreased in the source chamber as compared to the sink chamber. Therefore the required heating rate to maintain constant air temperature was higher in the source chamber compared to the sink chamber. However, the average heating and cooling rates required in each chamber were similar for both case (1) and case (2) scenarios because both systems simulations were performed under the same conditions.
Figure 9 indicates analysis of heating and cooling rates between case (1) and case (3). Similarly, for both cases, the cooling rate in the sink chamber was higher than in the source chamber as a result of higher heat extraction rate was in the sink chamber as compared to heat extraction in the source chamber. Hence, the exit water temperature from the sink chamber cooling coil was higher than the source chamber. The cooling rate in the source test chamber was equivalent for both case (1) and case (3) since the heat extraction rate was constant as the cooling capacity of the chiller utilized in the source chamber were the same for both case scenarios. However, the corresponding cooling rate in the sink test chamber was higher for case (1) as compared to case (3) because the chiller capacity used for heat extraction in the sink chamber was smaller in the case (3) scenario than in case (1). As a result of constant heat extraction rate of the chiller, the air exit temperature from the cooling coil decreased in the source chamber as compared to the sink chamber.
Therefore, for both case (1) and case (3), the heating rate to maintain air temperature in each test chamber increased in the source chamber as compared to the sink chamber. The heating rate in the source chamber was relatively the same in both case (1) and case (3) because the heat extraction rate was relatively the same as the chiller capacity in the source chamber, which was the same for both case scenarios. However, in the sink chamber, the heating rate was higher in case (1) than in case (3) because the case (3) modeling utilized a smaller refrigeration capacity and therefore, the air temperature at inlet to the heating coil increased in case (3) as compared to case (1).
For performance evaluation in terms of energy consumption, Figure 10 and Figure 11 represent the energy analysis of case (1) to that of case (2) and case (3), accordingly. As shown in Figure 10 for comparison of case (1) and case (2), the variation in heating electric consumption for case (1) was lower in the sink test chamber than in the source chamber as a result of the higher heating rate required in the source chamber to maintain inlet air temperature. However, in case (2), the heating energy utilized in the sink chamber was higher compared to the source chamber because the exit water temperature from the cooling coil in the sink chamber was utilized in the heat recovery unit to provide the heat requirement in the source chamber through the water heating coil. Hence, no energy was utilized in the air handling unit electric heater in the source test chamber. The heating electric consumption in sink chamber was relatively the same for both case (1) and case (2) as the exit air temperature from the cooling coil in both cases were fairly the same.
Moreover, for both cases, cooling electric consumption in the sink chamber was higher compared to the source chamber since the cooling rate due to internal load capacity was much lower in the source chamber than in the sink chamber. Also, in each test chamber, the cooling energy utilized in both cases were relatively the same because the refrigeration capacities of the chiller used for heat extraction in each chamber were the same.
Figure 11 shows analysis of energy consumption comparison of both cases (1) and case (3) scenarios. The heating electric consumption in case (1) was higher in the source chamber than in the sink chamber since the heating rate required to maintain the air temperature in the sink chamber was lower than in the source chamber, whereas in case (3), the heater energy consumption in the source test chamber was lower than in the sink chamber because the exit water temperature from the cooling coil in the sink chamber was used in the heat recovery unit to provide the heating rate required in the source chamber through the water heating coil. Therefore, in case (3), electric heating energy consumption in the source test chamber was zero. Also, the heating energy consumption in the source chamber was lower in case (3) compared to case (1) as the heating rate due to inlet air temperature to the heating coil increased in case (1) relative to case (3).
Moreover, in both case (1) and case (3), the cooling electric consumption in sink test chamber was higher as compared to source chamber since the cooling rate was lower in the source chamber than in the sink chamber. Also, in the source chamber, the cooling electricity utilized in both cases was fairly the same since the refrigeration capacities of the chiller used for heat extraction in the chamber were the same. However, the cooling electric consumption in the sink chamber was lower in case (3) as compared to case (1) because the cooling rate in case (1) was higher than case (3) since the refrigeration capacity utilized for heat extraction in sink chamber was relatively smaller in case (3) as compared to the case (1) scenario.
In Figure 12, the variation in the total heating energy consumption for case (1) was about 62% higher than case (2) and case (3) as a result of the heat recovery unit. Hence, in both case (2) and case (3), the total heater consumption was nearly the same. Also, the total cooling consumption was almost the same for both case (1) and case (2) because the same cooling capacity was utilized in the chiller to discharge heat in each test chamber. However, the total cooling energy consumption for case (3) was about 58% lower as compared to the total cooling energy used in case (1) and case (2) scenarios. This was due to the relatively smaller chiller capacity utilized in case (3) for heat extraction in the sink chamber. The overall energy consumption analysis showed that case (1) was about 3.5% and 48% higher than case (2) and case (3) respectively. Therefore, the proposed calorimeter modeling resulted in high energy savings when the small refrigeration capacity was used for heat extraction in the sink test chamber instead of the same capacity as utilized in the conventional system modeling.

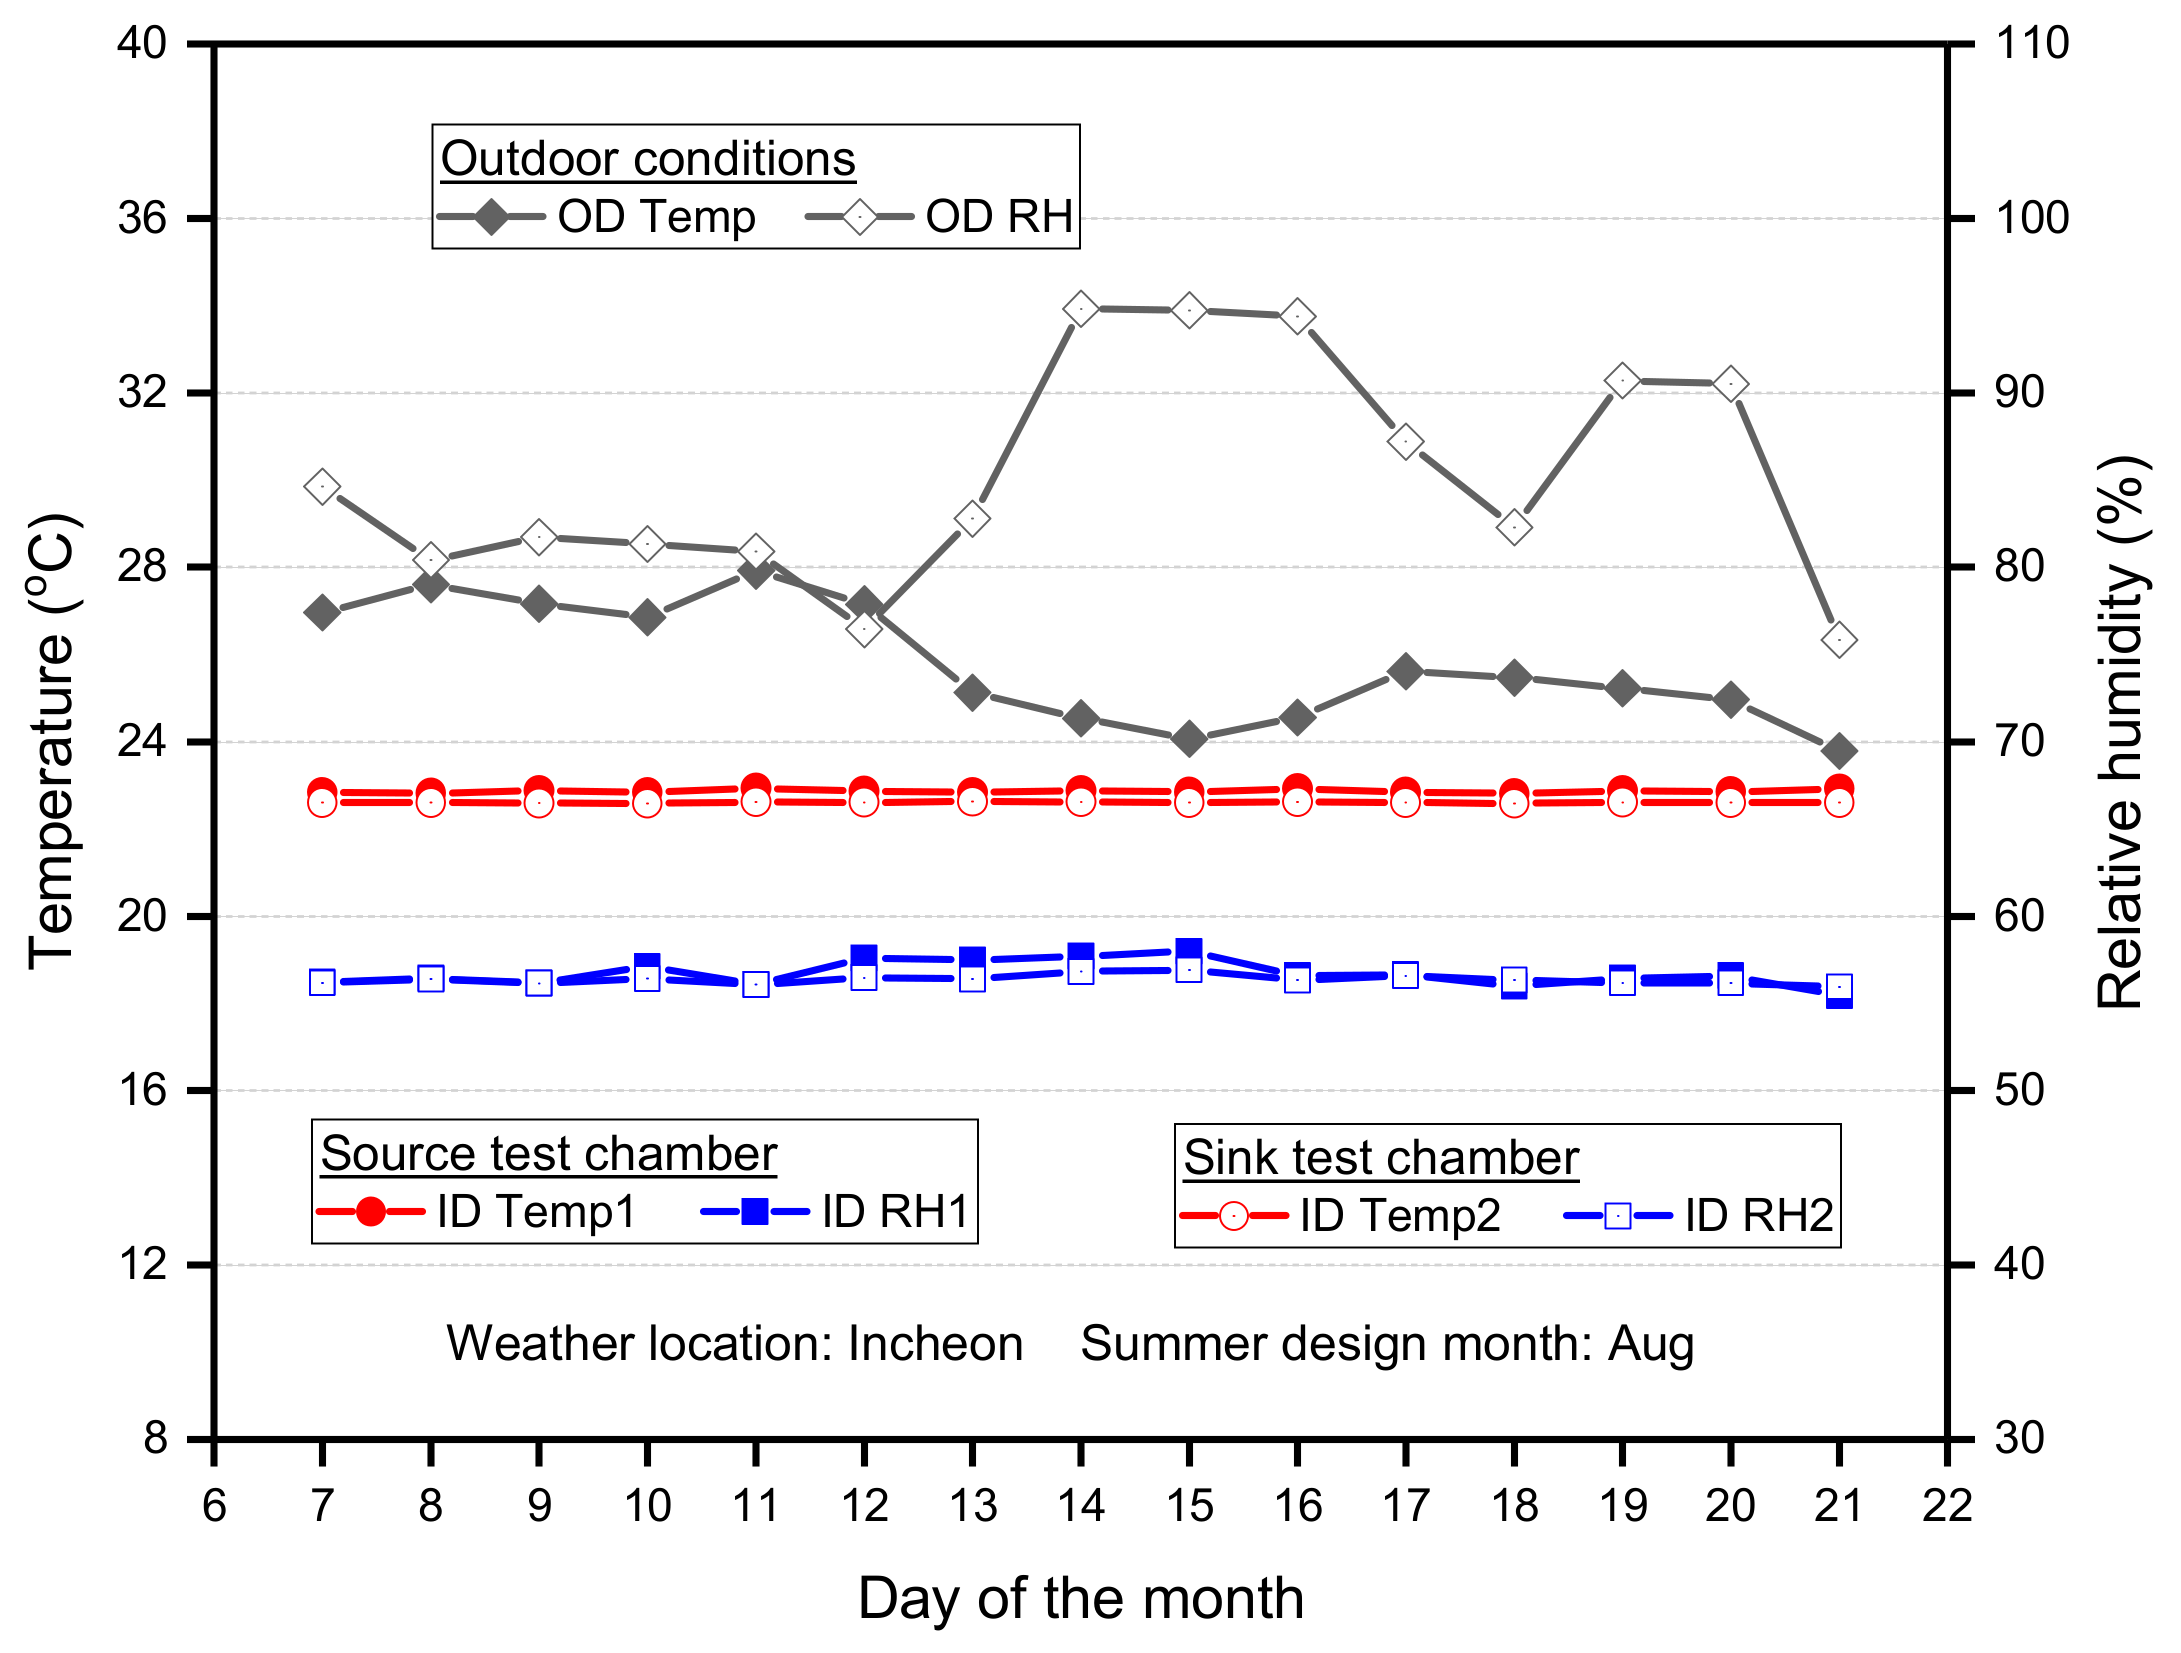
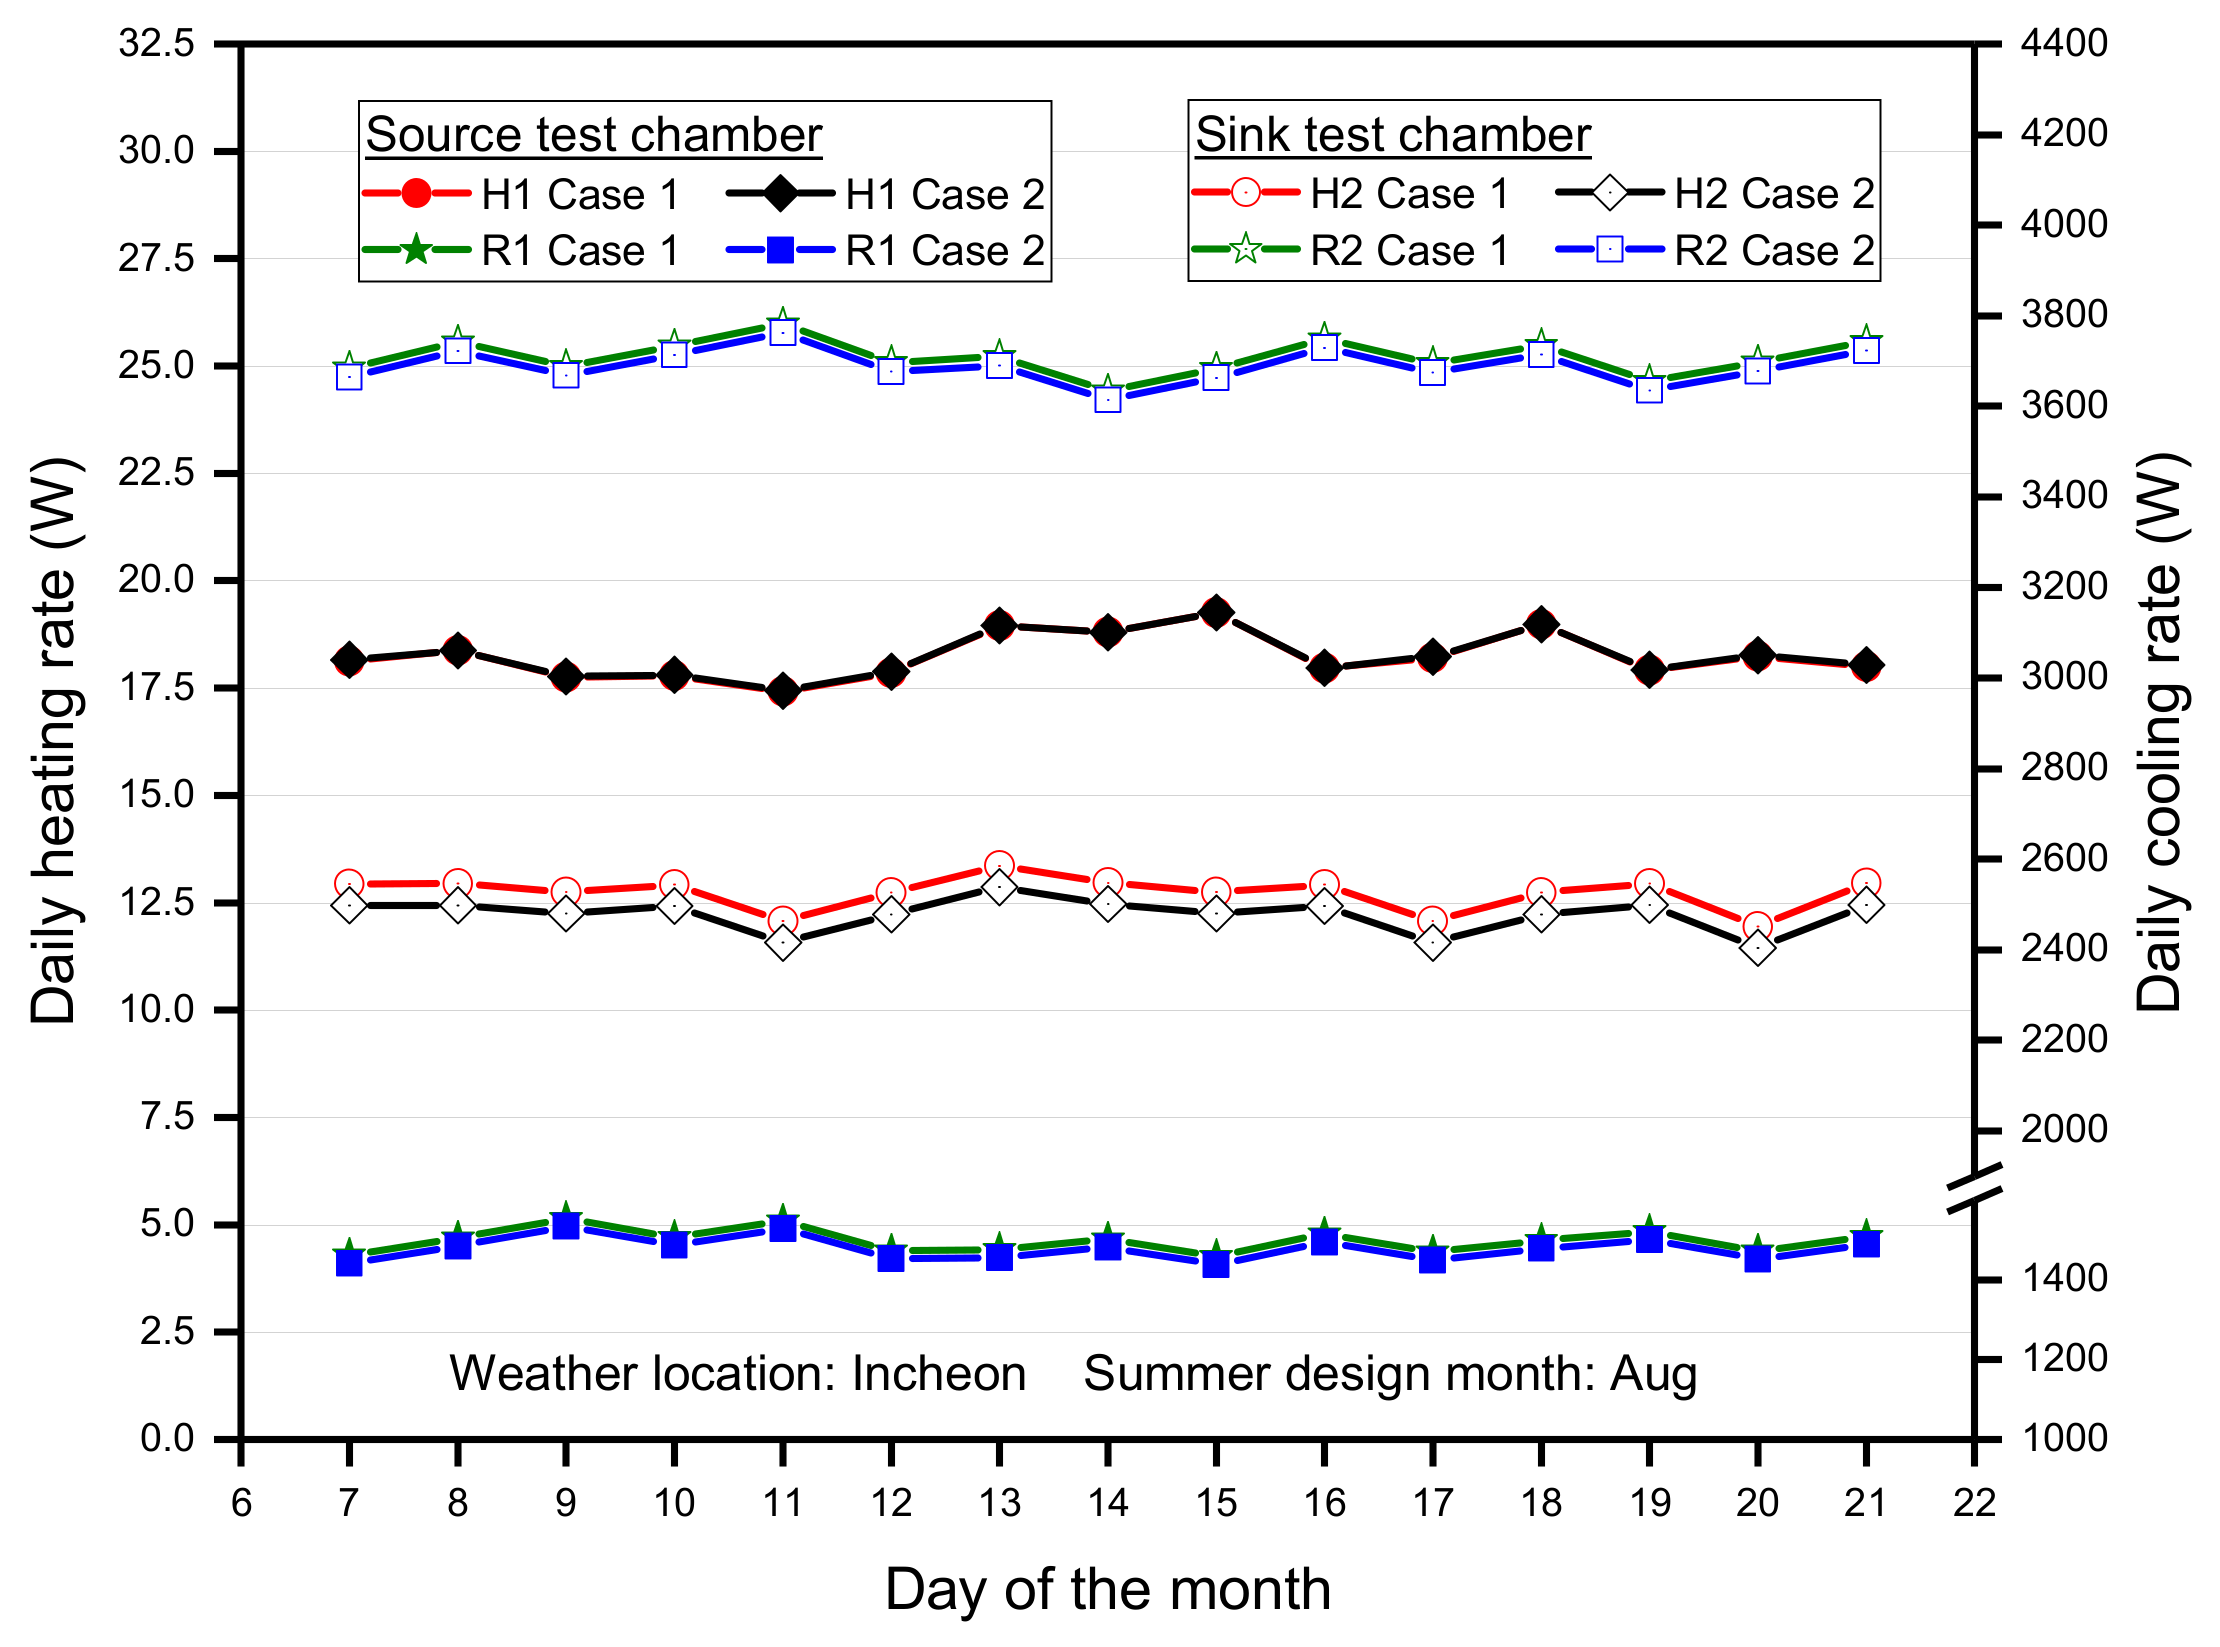
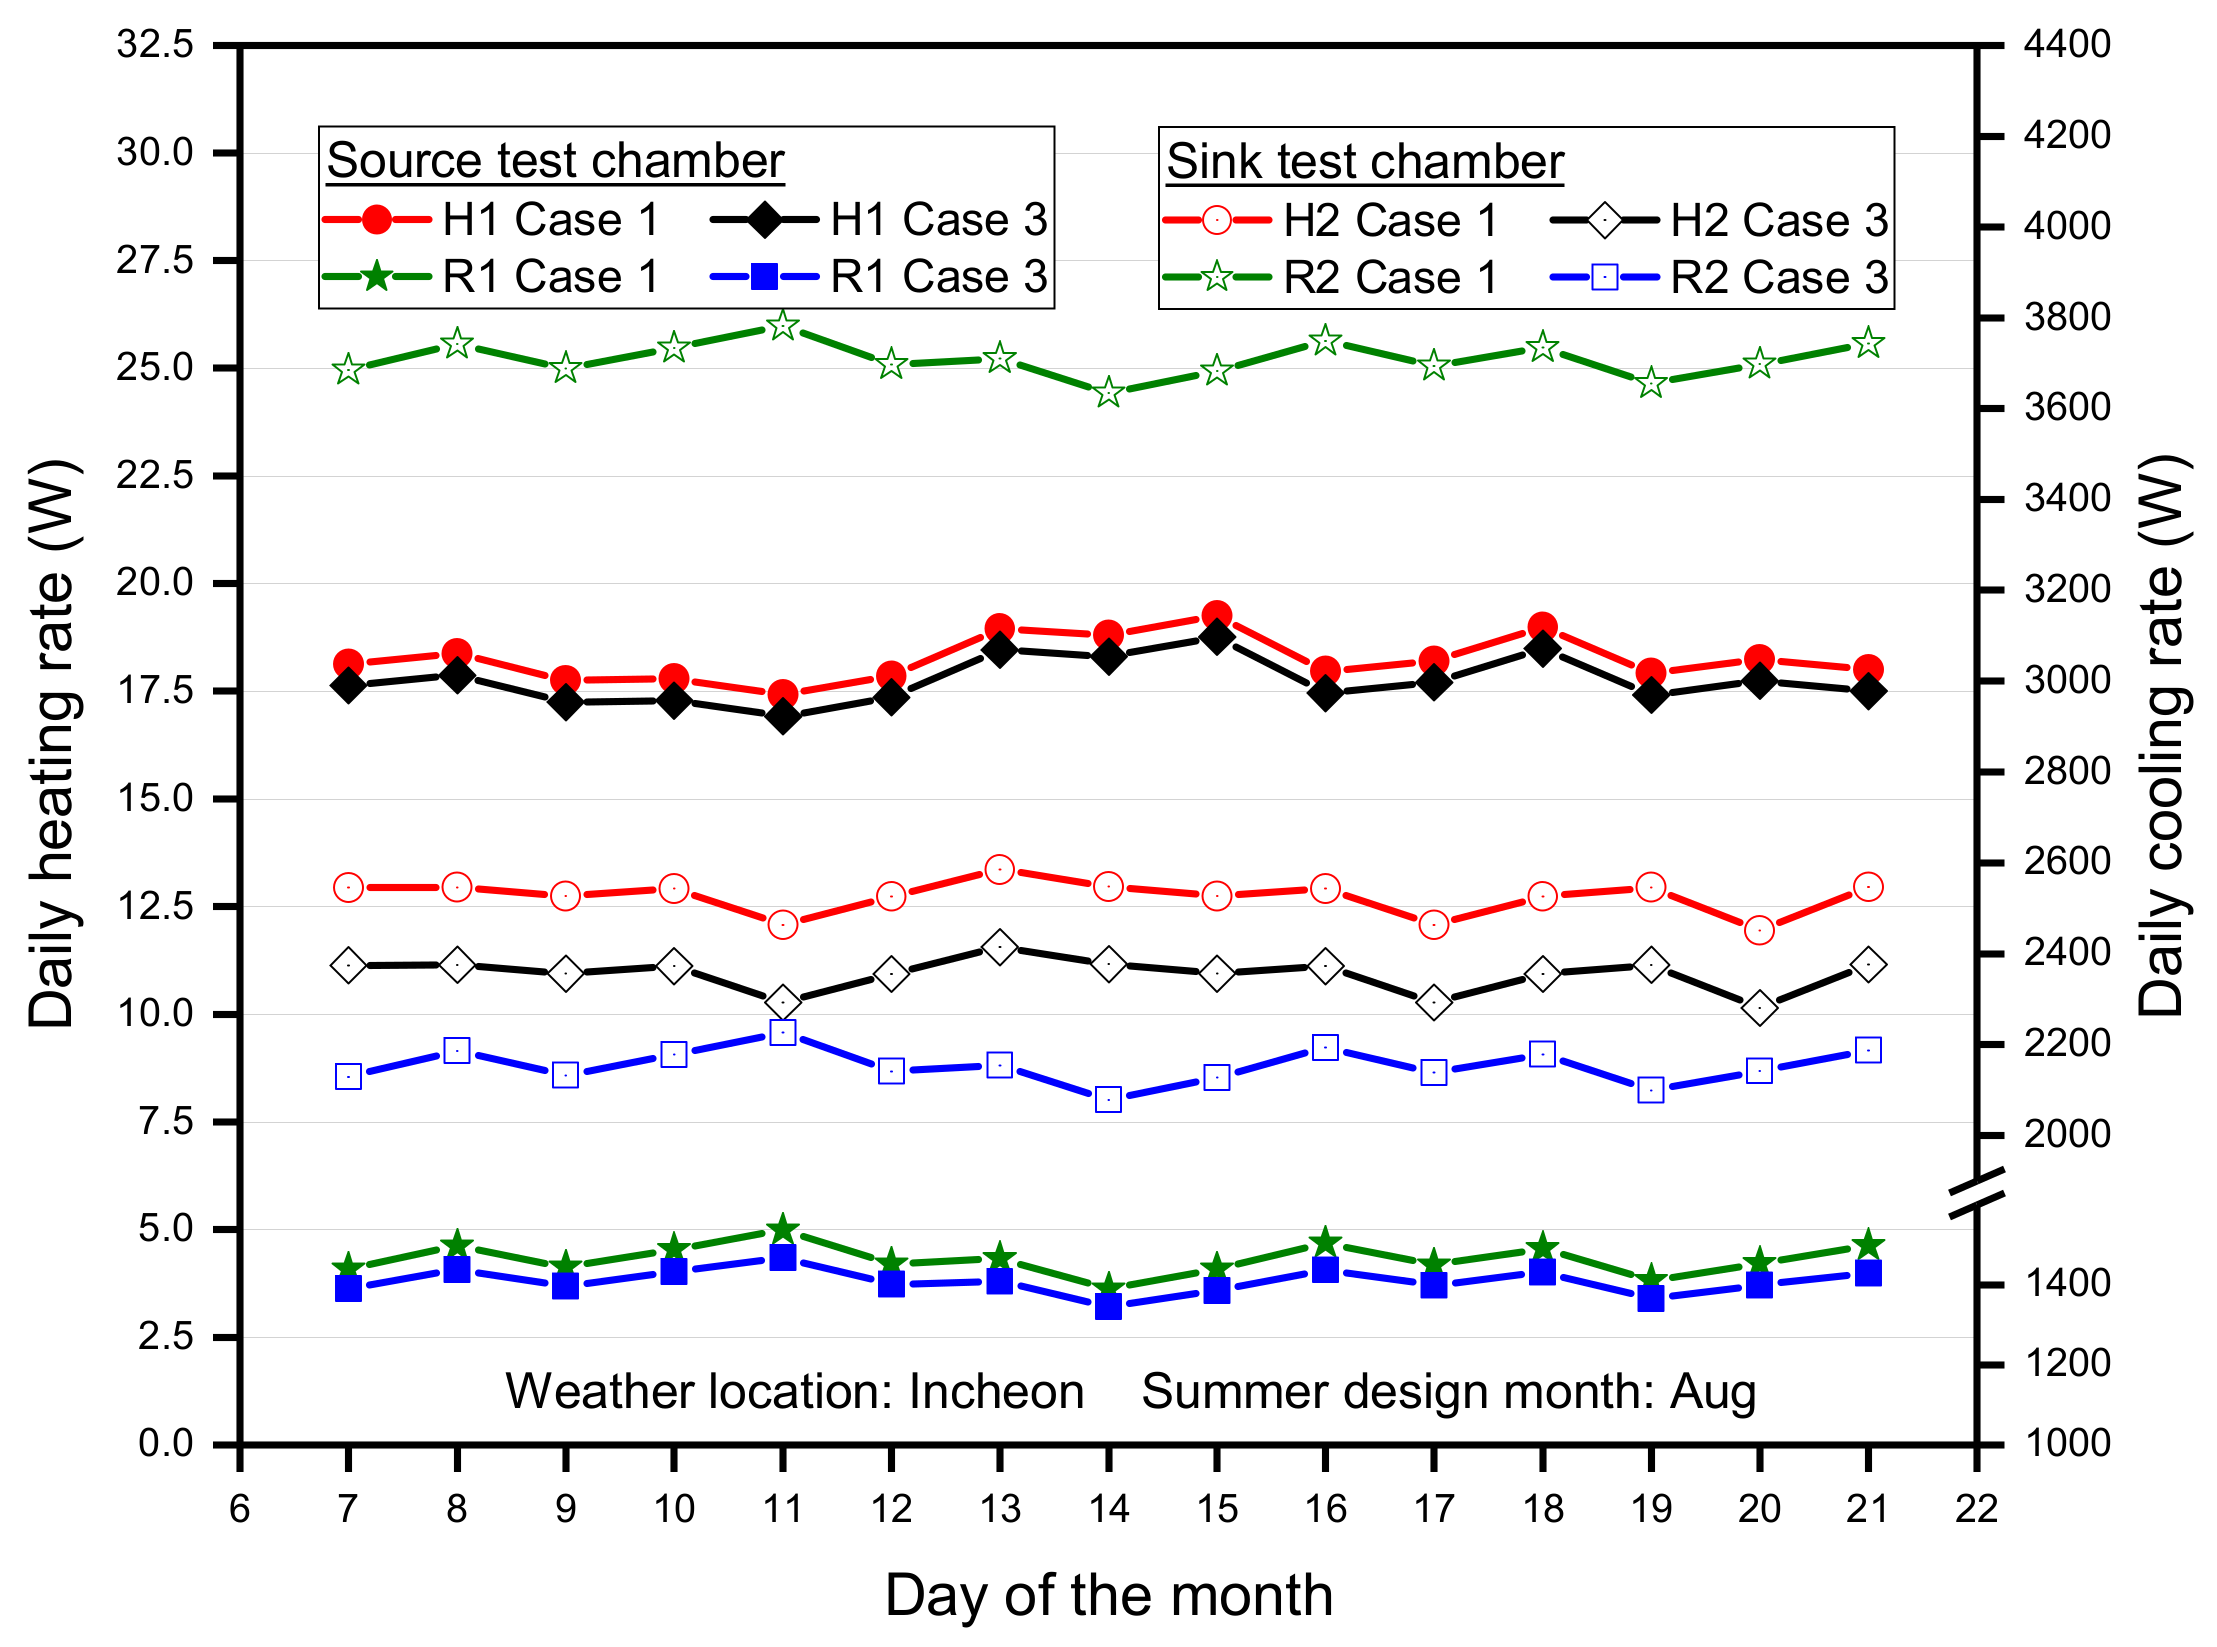
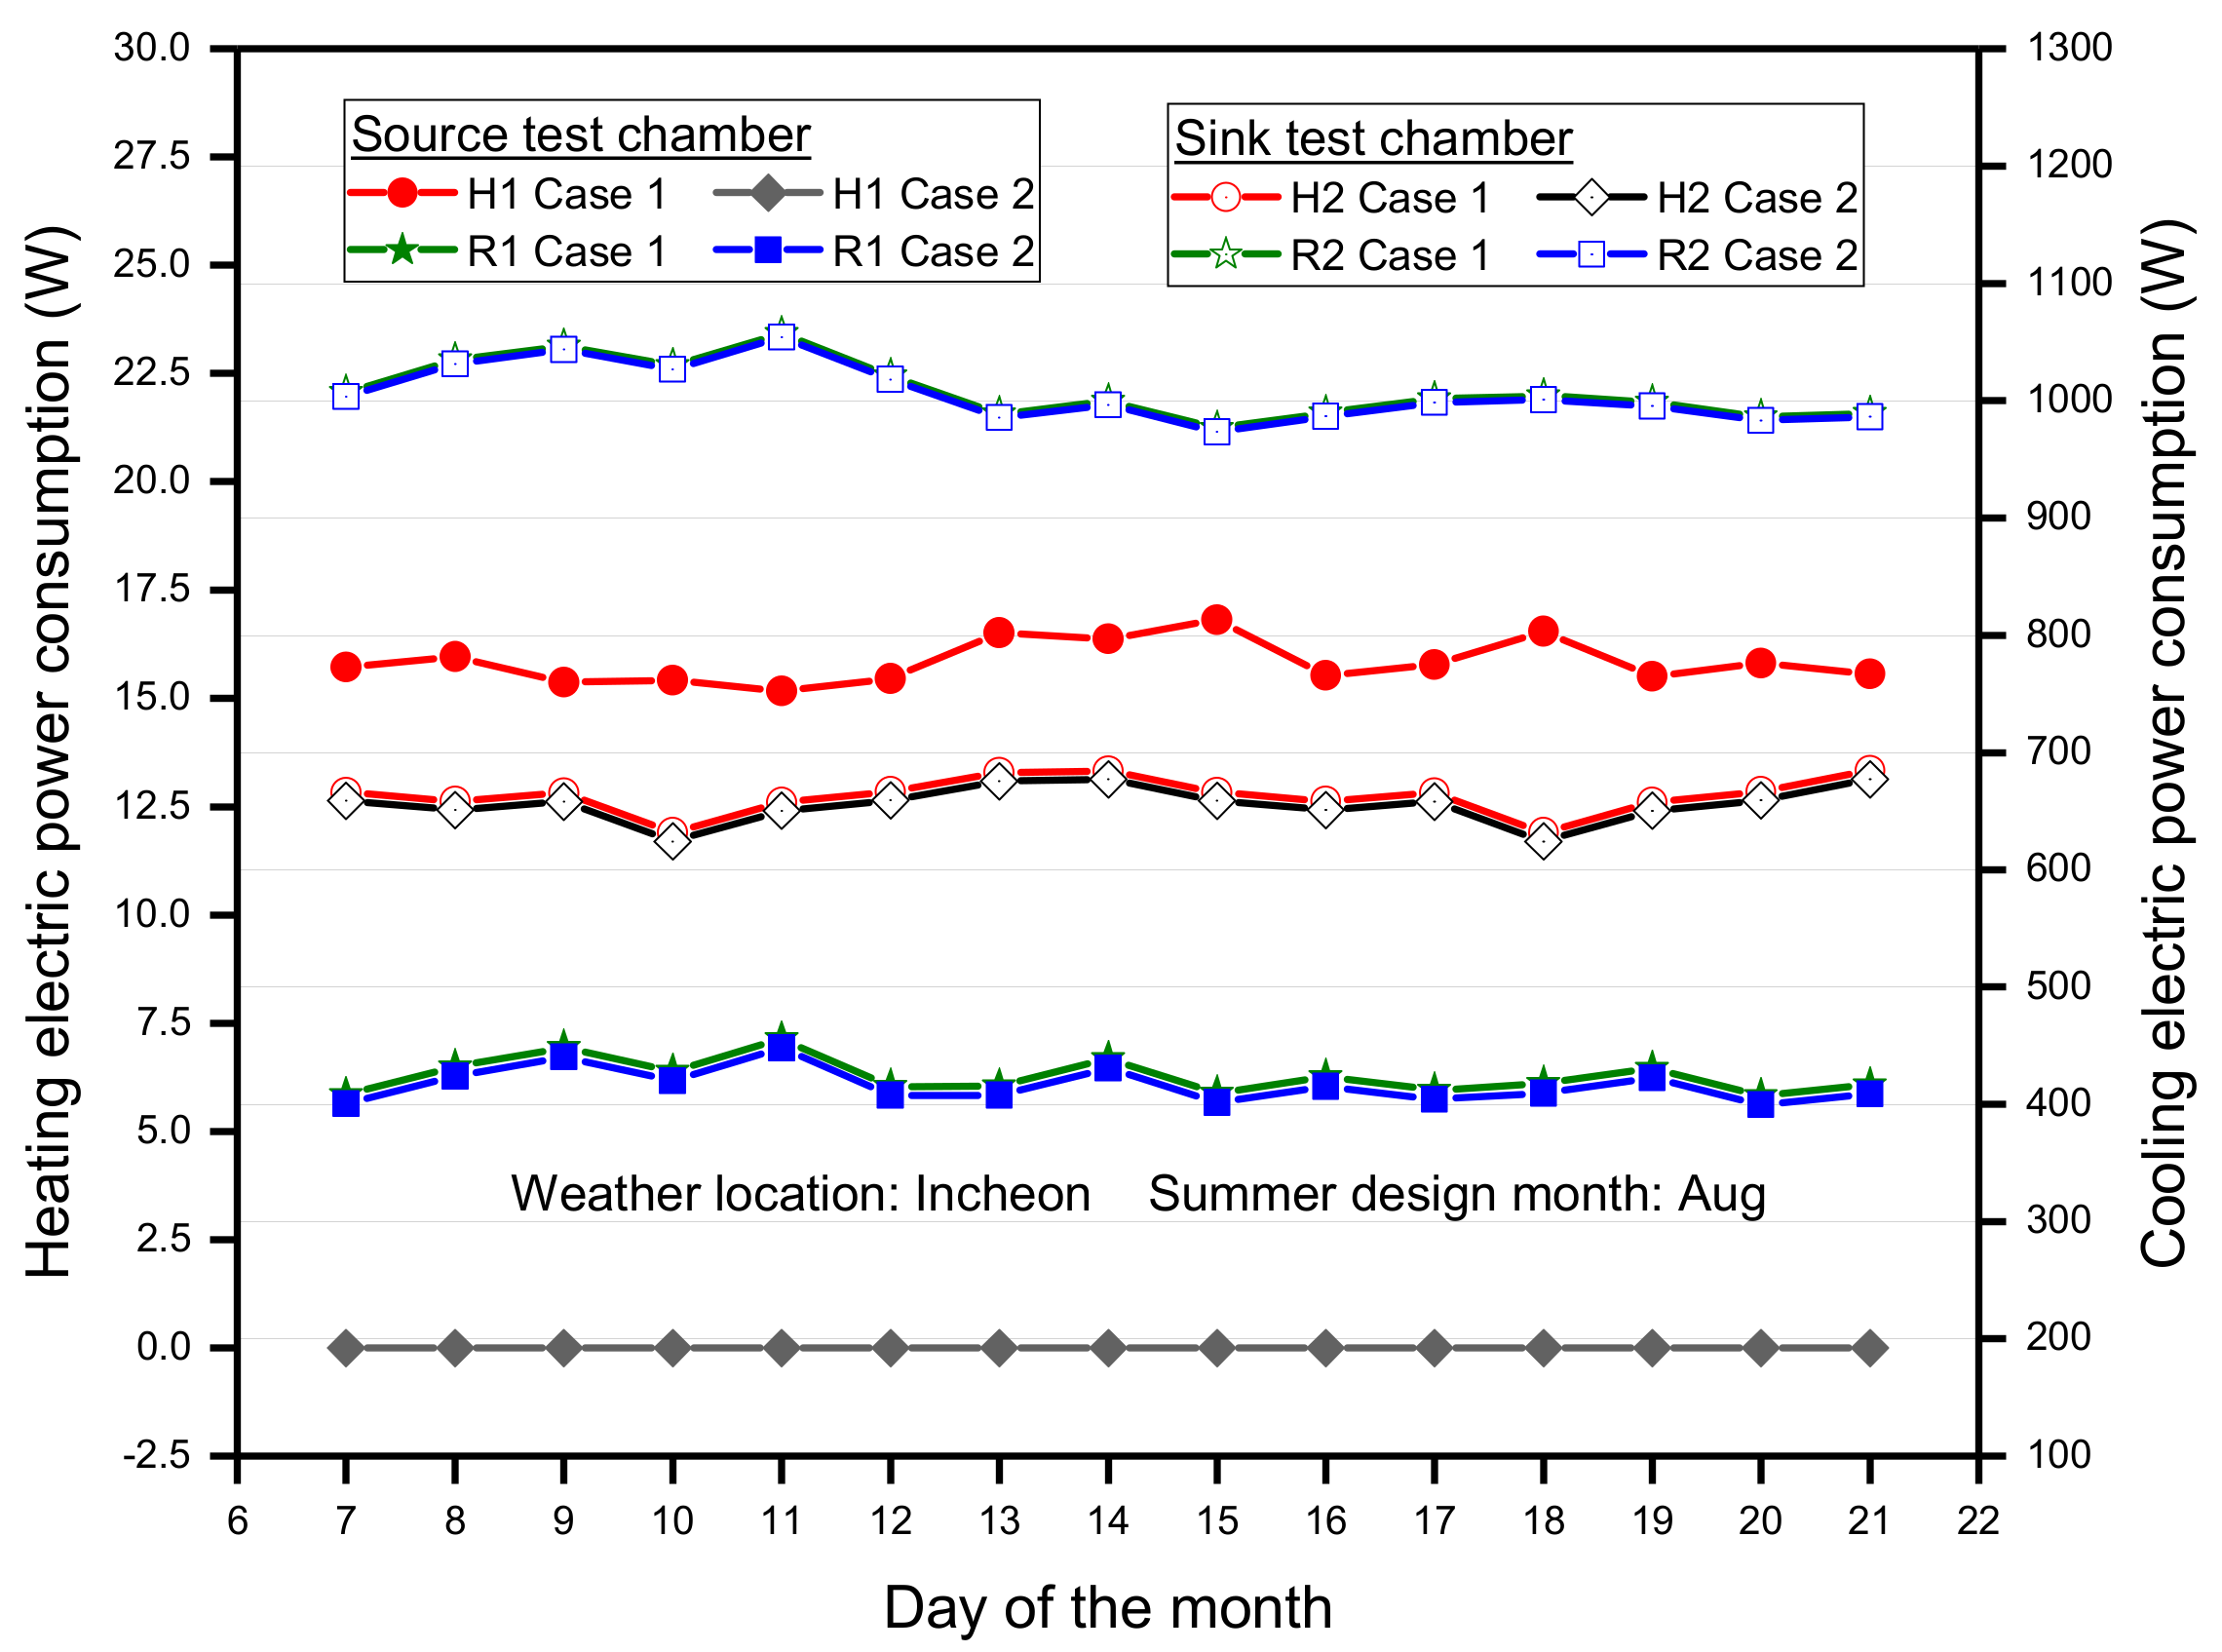
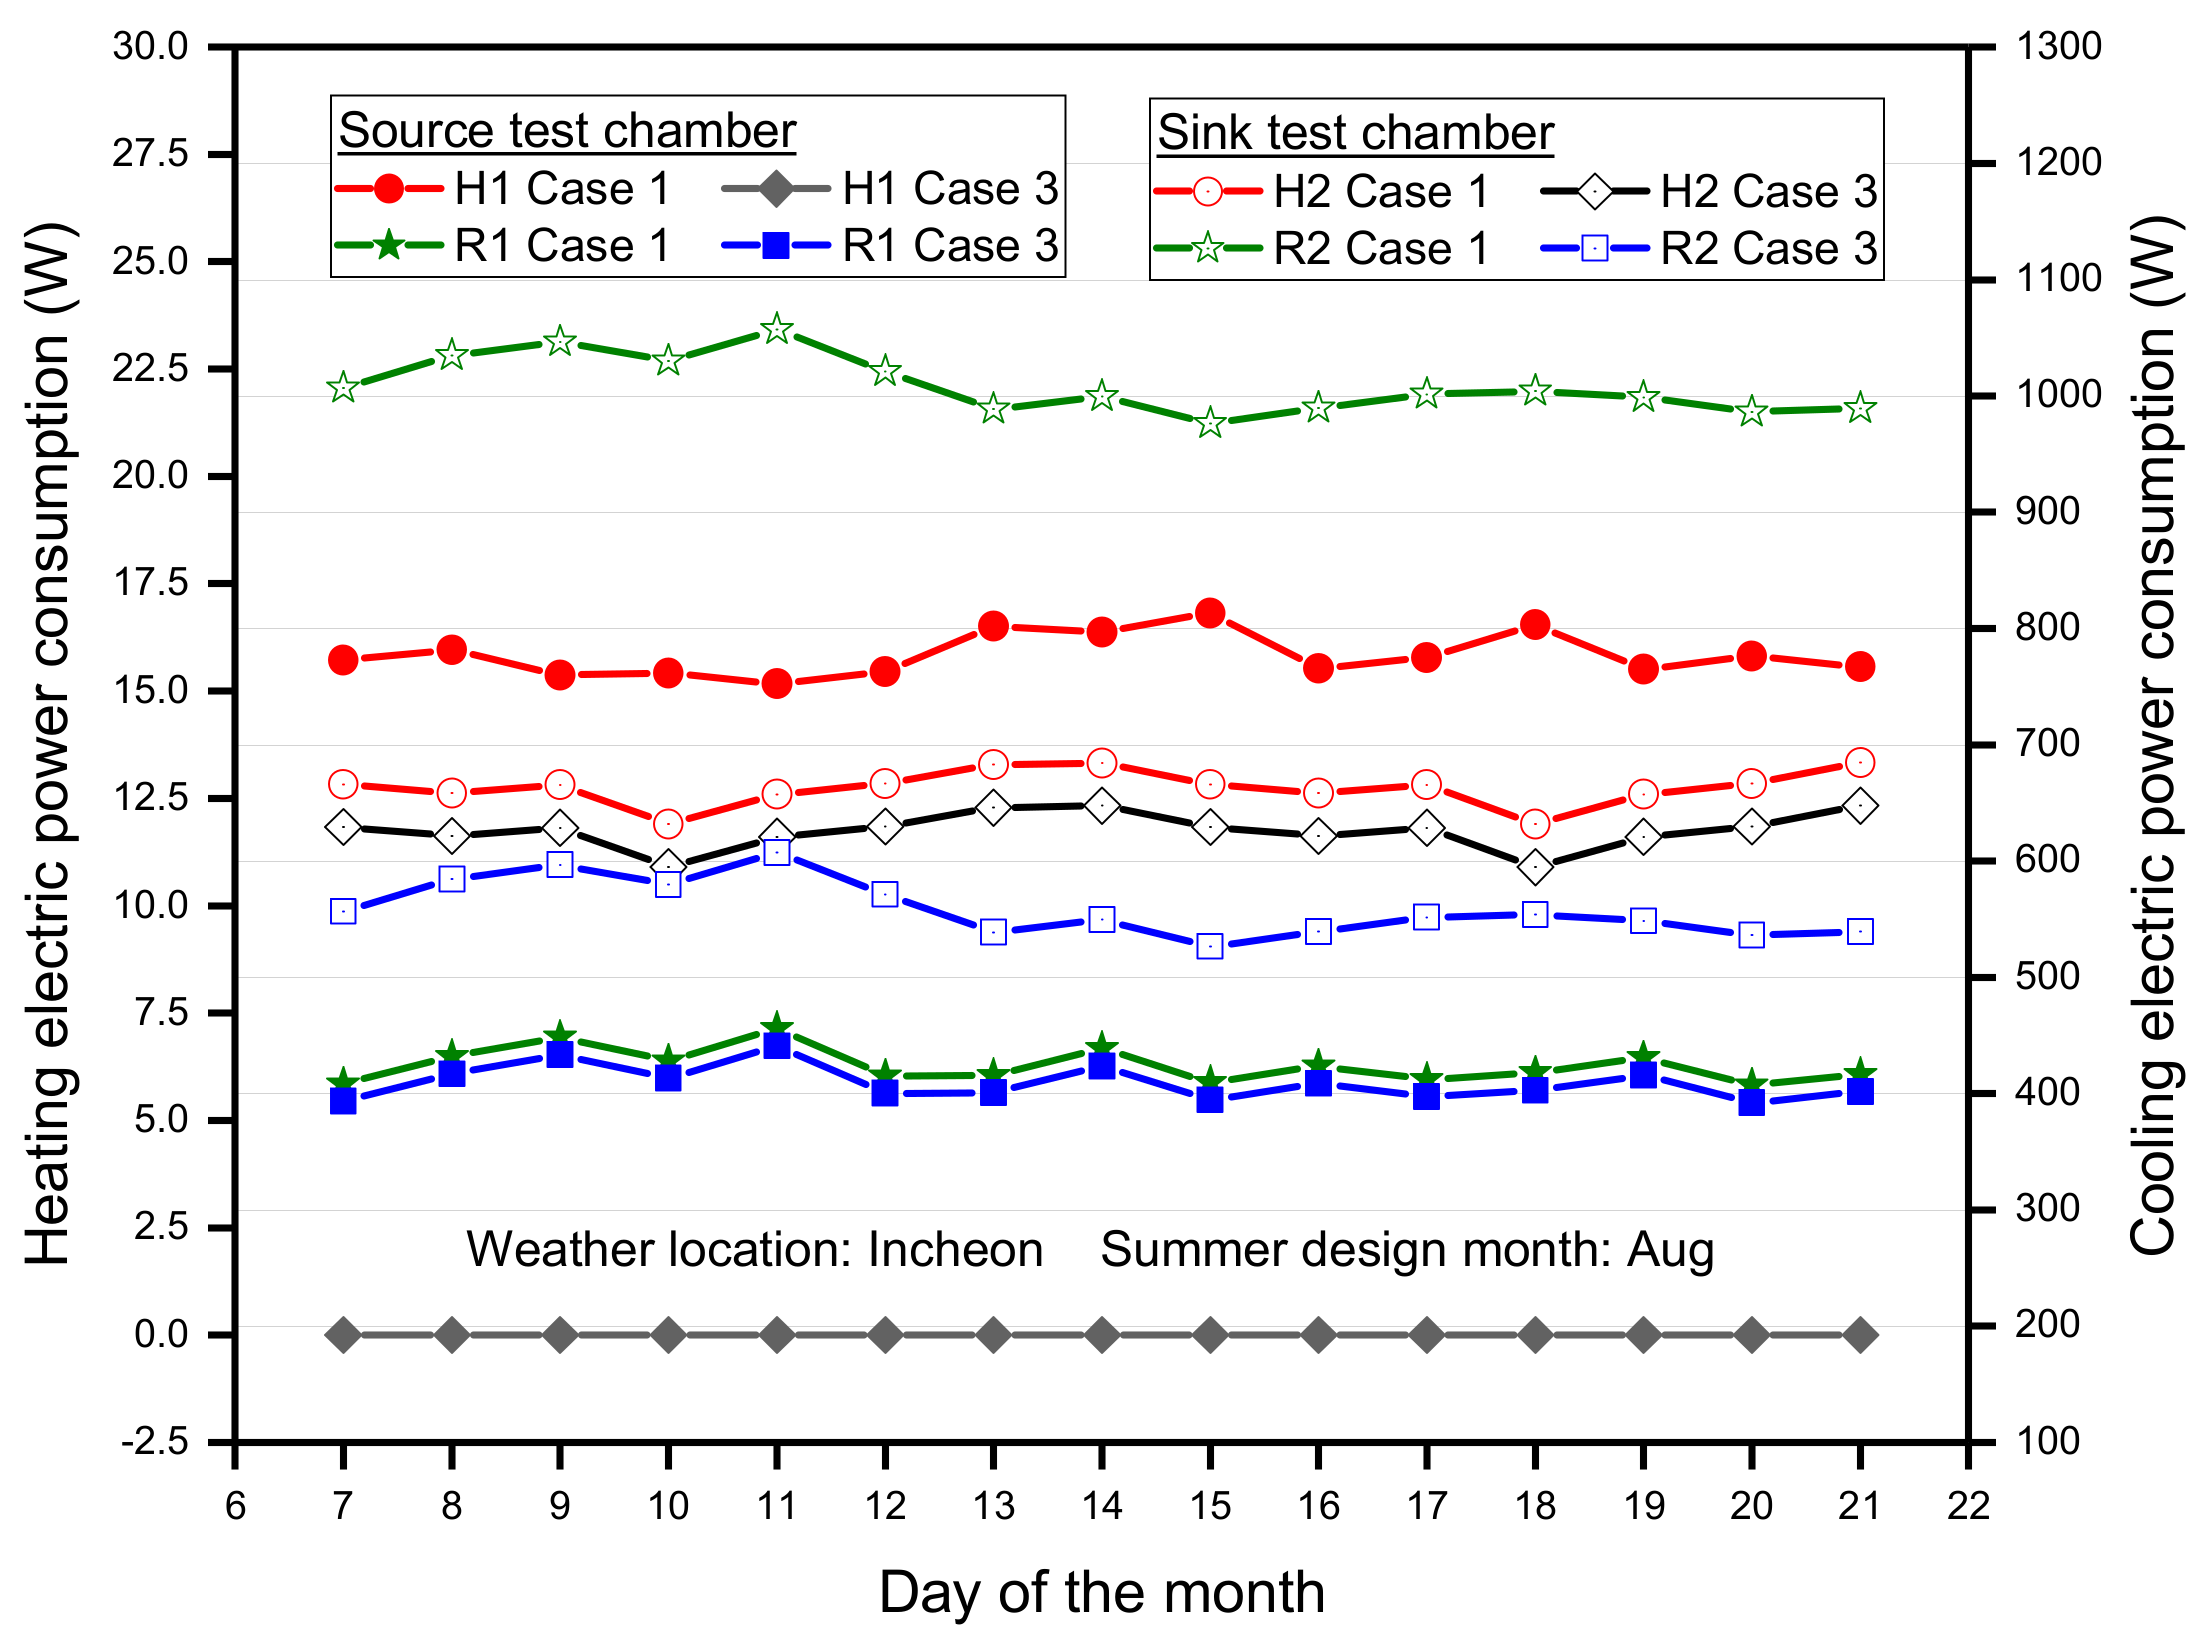
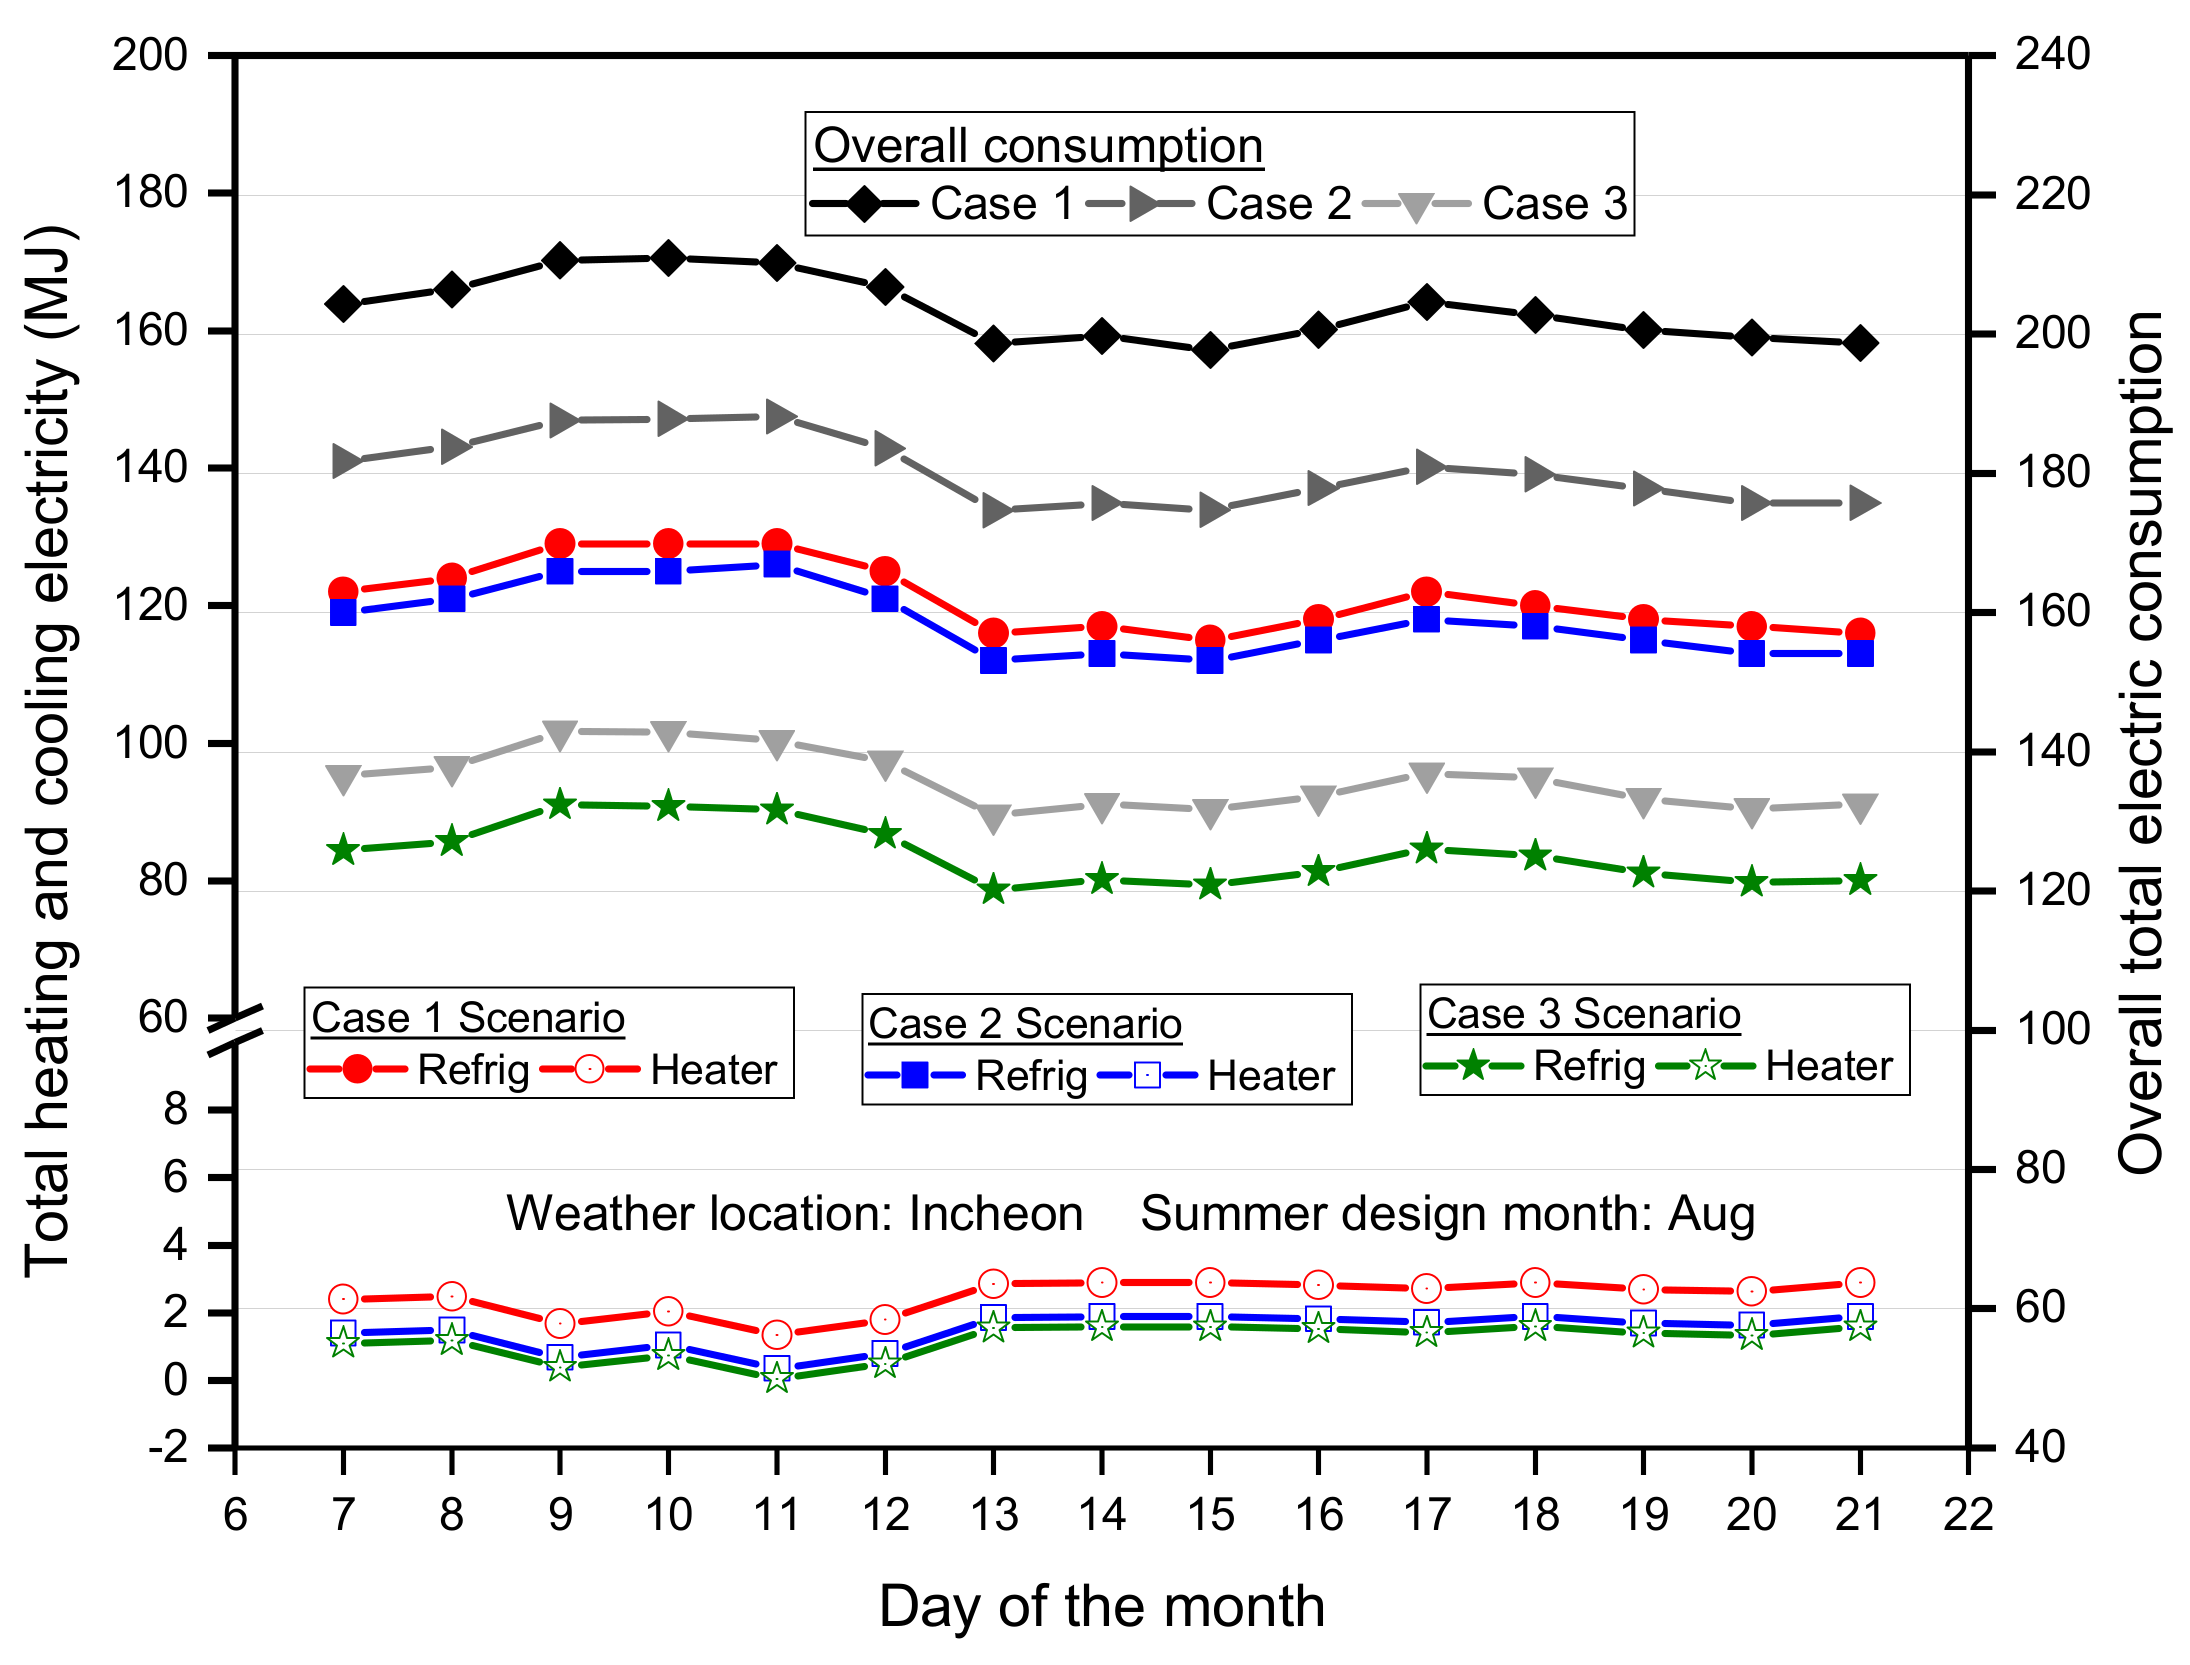
3.2. Performance Analysis of Modeling Cases in Summer Condition

The performance of the three case scenarios according to simulation test results in the summer design month were evaluated considering equipment with the same internal load capacity in each test chamber. Figure 13 shows the variation of air temperature and relative humidity conditions in the source and sink test chambers as well as outdoor dry bulb and humidity based on representative days in August. The outdoor air temperature varied from 24 °C to 28 °C whereas outdoor relative humidity was about 76% to 95%. However, for all case scenarios, the indoor temperature in each test chamber was controlled to maintain a relatively constant air temperature of about 23 °C. The humidity control varied from 56% to 58% in both test chambers.
For evaluation in terms of variations in heating and cooling rates, Figure 14 and Figure 15 represent comparison of case (1) modeling to case (2) and case (3), accordingly. In both case (1) and case (2) as indicated in Figure 14, the cooling rate in the source chamber was lower than in the sink chamber as the heat extraction rate due to the internal load capacity was higher in the sink chamber than in the the source test chamber. Therefore, the exit water temperature from the cooling coil in the source chamber was lower than in the sink chamber. Hence, due to the constant flow mode of the chiller, the exit air temperature from the cooling coil increased in the sink test chamber as compared to the source chamber. As a result, the required heating rate to maintain constant air temperature was lower in the sink chamber as compared to the source chamber. However, in both case (1) and case (2) scenarios, the average heating and cooling rates required in each chamber were similar.
Figure 15 shows the heating and cooling rate analysis between case (1) and case (3). Likewise, for both cases, the cooling rate in the source chamber was lower than the sink chamber due to the lower heat extraction rate in the source chamber as compared to the heat extraction in the sink chamber. As a result, the exit water temperature from the sink chamber cooling coil was higher than the source chamber. In both cases, the cooling rate in the source test chamber was almost similar since the heat extraction rate was constant as the cooling capacities of the chiller used in the source chamber were the same. However, the corresponding cooling rate in the sink test chamber was lower for case (3) as compared to case (1) because the chiller capacity used for heat extraction in the source chamber was larger in case (1) than in case (3). Due to the constant heat extraction rate of the chiller, the air exit temperature from the cooling coil increased in the sink chamber as compared to the source test chamber.
Therefore, for both case (1) and case (3) scenarios, the heating rate to control and maintain air temperature decreased in the sink test chamber as compared to the sink chamber. The heating rate in the source chamber was fairly the same in both case (1) and case (3) because the heat extraction rate was almost the same as the chiller capacity in the source chamber and was the same for both case scenarios. Moreover, in the sink chamber, the heating rate was lower in case (3) than case (1) since the case (3) modeling utilized a smaller refrigeration capacity and hence, the air temperature at inlet to the heating coil decreased in case (1) as compared to case (3).
For energy consumption evaluation, Figure 16 and Figure 17 represent the energy analysis of case (1) to that of case (2) and case (3), respectively. As indicated in Figure 16 for energy comparison of case (1) and case (2), the variation in heating energy consumption for case (1) was higher in the source test chamber than in the sink chamber as a result of the lower heating rate required in the sink chamber to maintain the inlet air temperature. Moreover, in case (2), the heating energy consumption in the source chamber was lower compared to the sink chamber because water temperature at exit from the cooling coil in the sink chamber was used in the heat recovery unit to provide the heat requirement in the source chamber through the water heating coil. Hence, no energy was consumed in the electric heating unit in the source test chamber. The heating consumption in the sink chamber was relatively the same for both case (1) and case (2) as the exit air temperature from the cooling coil in both cases were fairly the same.
Moreover, in both cases (1) and (2) scenarios, the cooling electric consumption in the source chamber was lower compared to the sink chamber as the cooling rate was much higher in the sink chamber compared to the source chamber. Also, in each chamber, the cooling energy consumption was fairly the same in both cases because the chiller cooling capacity used for heat extraction was the same.
Figure 17 shows the analysis of the energy consumption comparison of case (1) and case (3) scenarios. The heating energy consumption in case (1) was higher in the source chamber than in the sink chamber since the heating rate required to maintain the air temperature in the sink chamber was lower than the source chamber whereas in case (3), the heater energy used in the source test chamber was lower than the sink chamber because the water temperature from the cooling coil in the sink chamber was used in the heat recovery unit to provide the heating rate required in the water heating coil in the source chamber. Hence, for case (3), the heating energy consumption in the source test chamber was zero. Also, the heating energy consumption in the source chamber was higher in case (1) compared to case (3).
Moreover, in both cases (1) and (3), the cooling electric consumption in the source chamber was lower compared to the sink chamber since the cooling rate was higher in the sink chamber than the source chamber. Also, in the source test chamber, cooling energy consumption in both cases was almost the same because the chiller capacities used for heat extraction were the same. However, the cooling energy consumption in the sink chamber was higher in case (1) than case (3) because the cooling rate in case (1) was higher than case (3) due to the larger refrigeration capacity utilized in case (1) relative to case (3).
In Figure 18, the total heating energy consumption for case (1) was about 57% higher than case (2) and case (3) due to the heat recovery unit in the proposed modeling. Therefore, in both cases (2) and (3), total heater consumption was nearly the same. Also, total cooling consumption was almost the same for both case (1) and case (2) as the same cooling capacity was used in the chiller to discharge heat in each test chamber. However, the total cooling energy consumption for case (3) was about 51% lower as compared to the total cooling energy utilized in case (1) and case (2) scenarios. This was due to the relatively smaller chiller capacity utilized in case (3) for heat extraction in the sink chamber. The overall energy consumption analysis indicated that case (1) was about 2% and 55% higher than case (2) and case (3) accordingly. Hence, the proposed calorimeter modeling resulted in high energy savings when the chiller capacity used for heat extraction in the sink test chamber was smaller instead of utilizing the same capacity in the conventional system modeling.

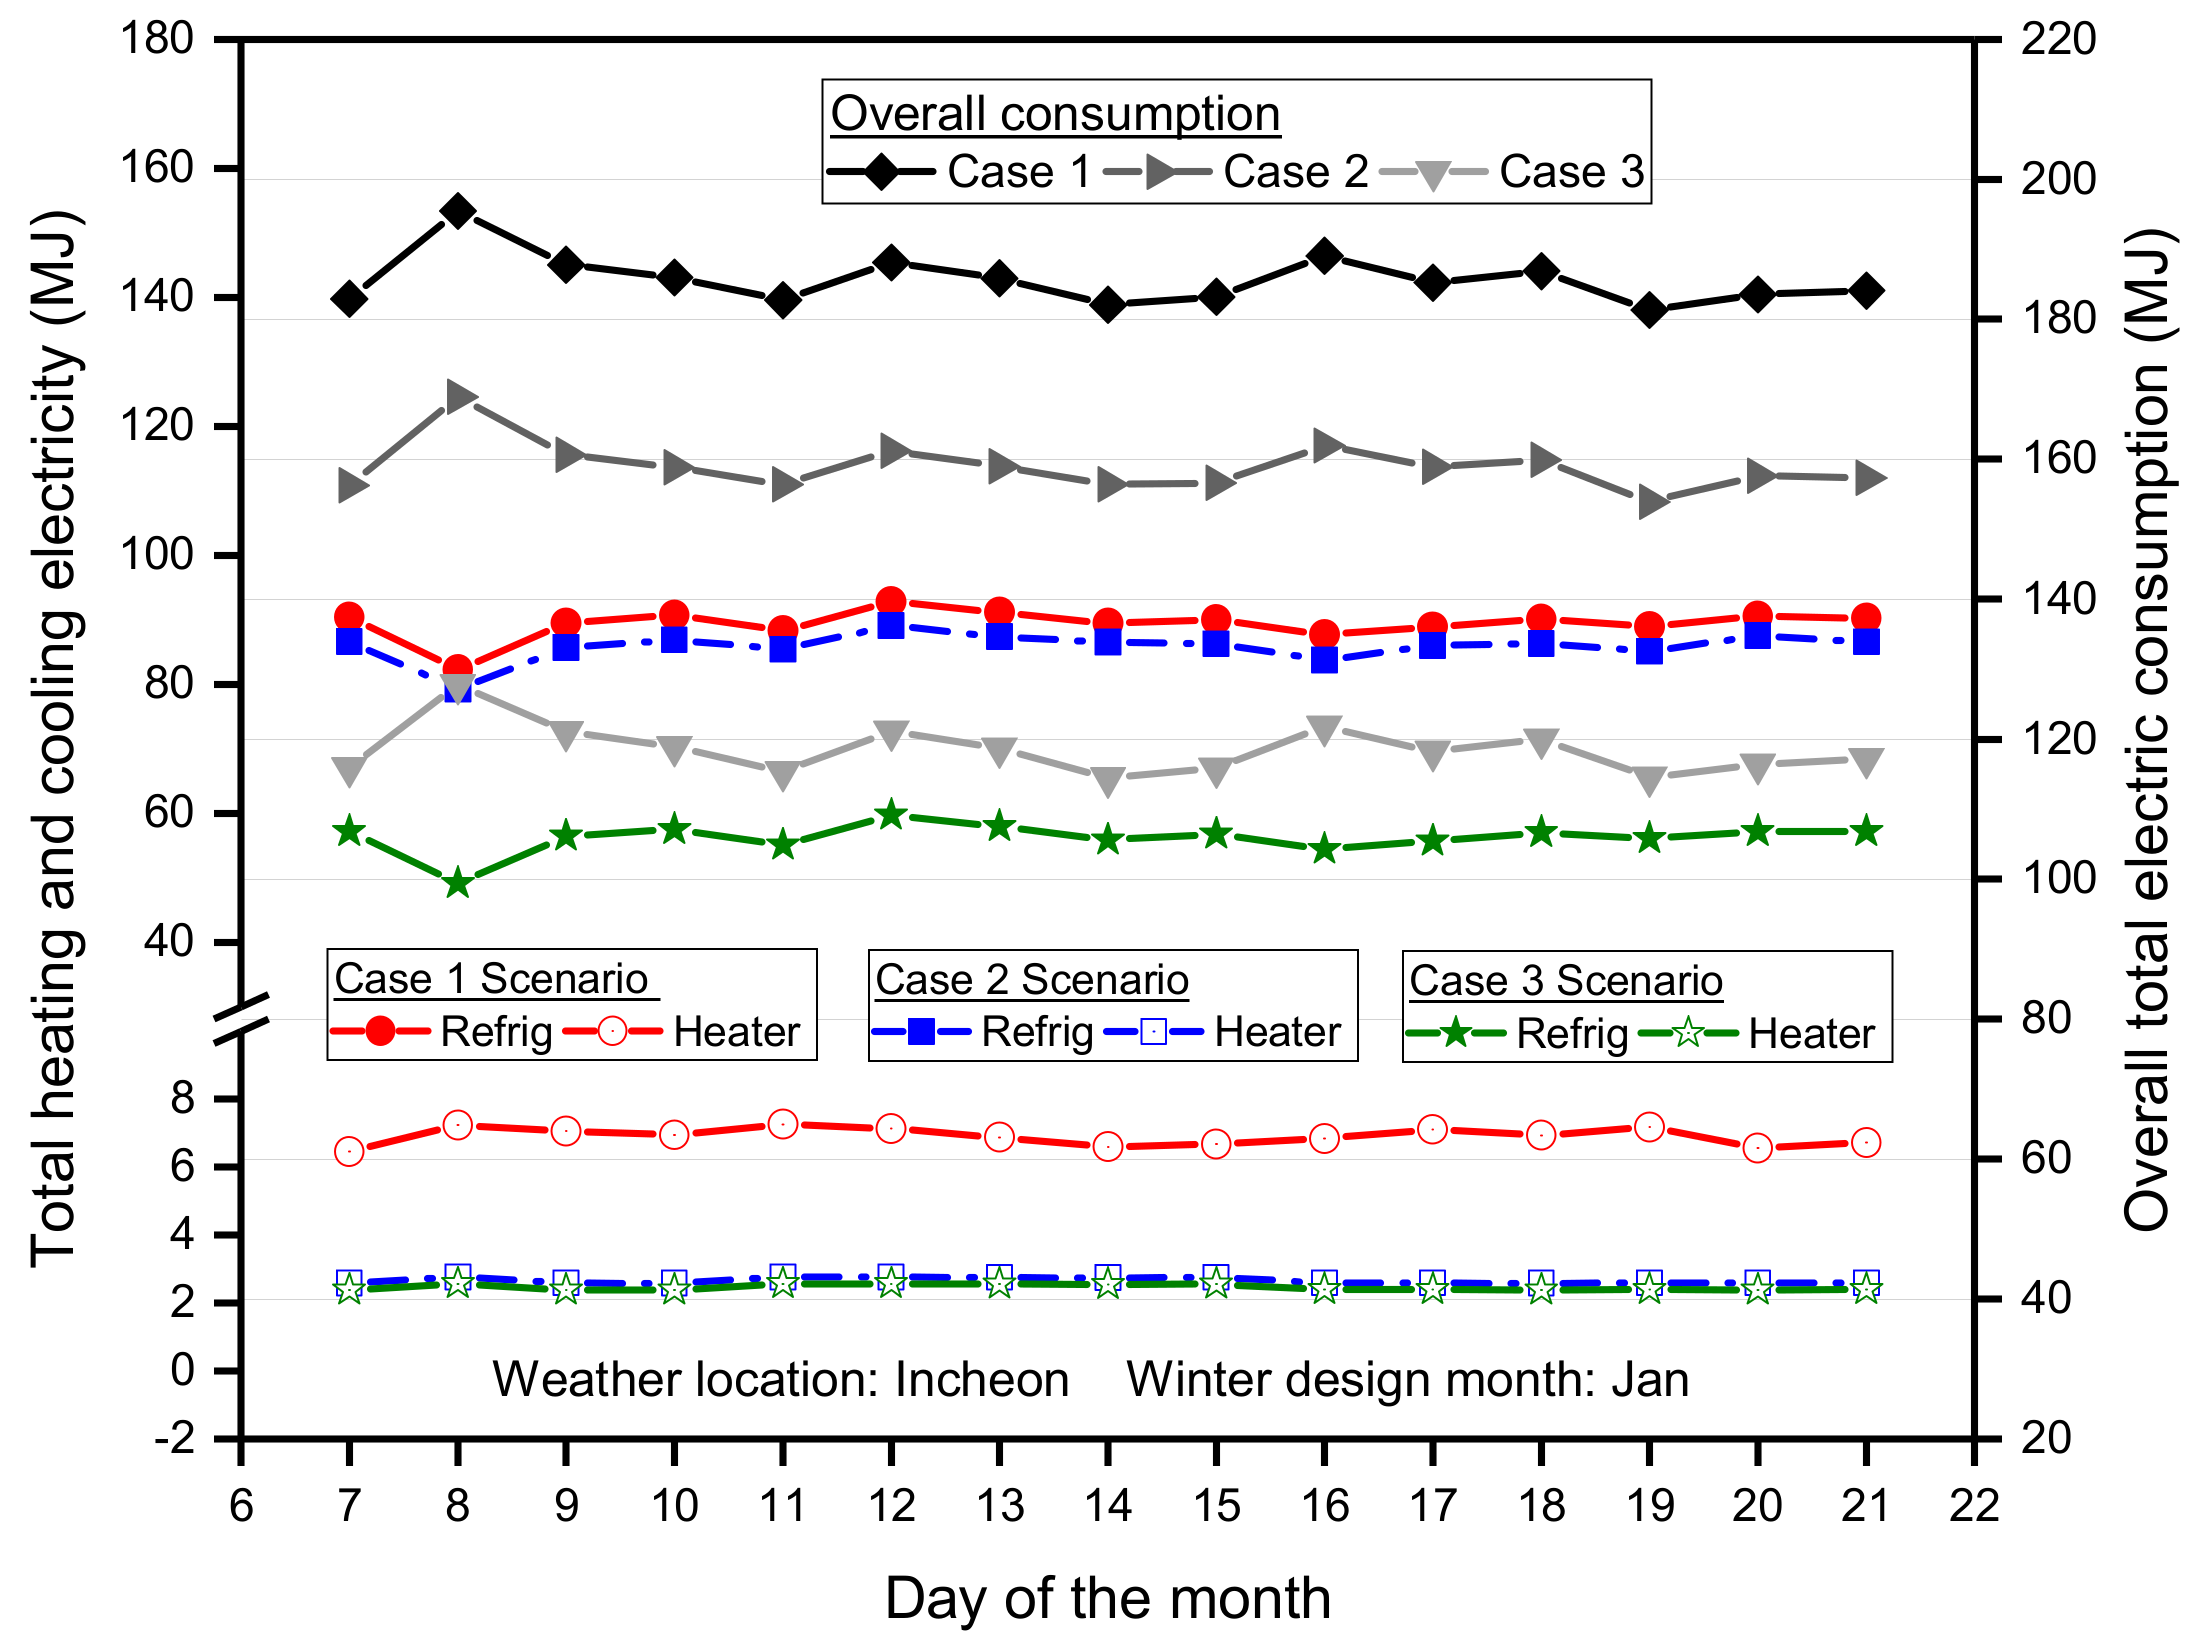
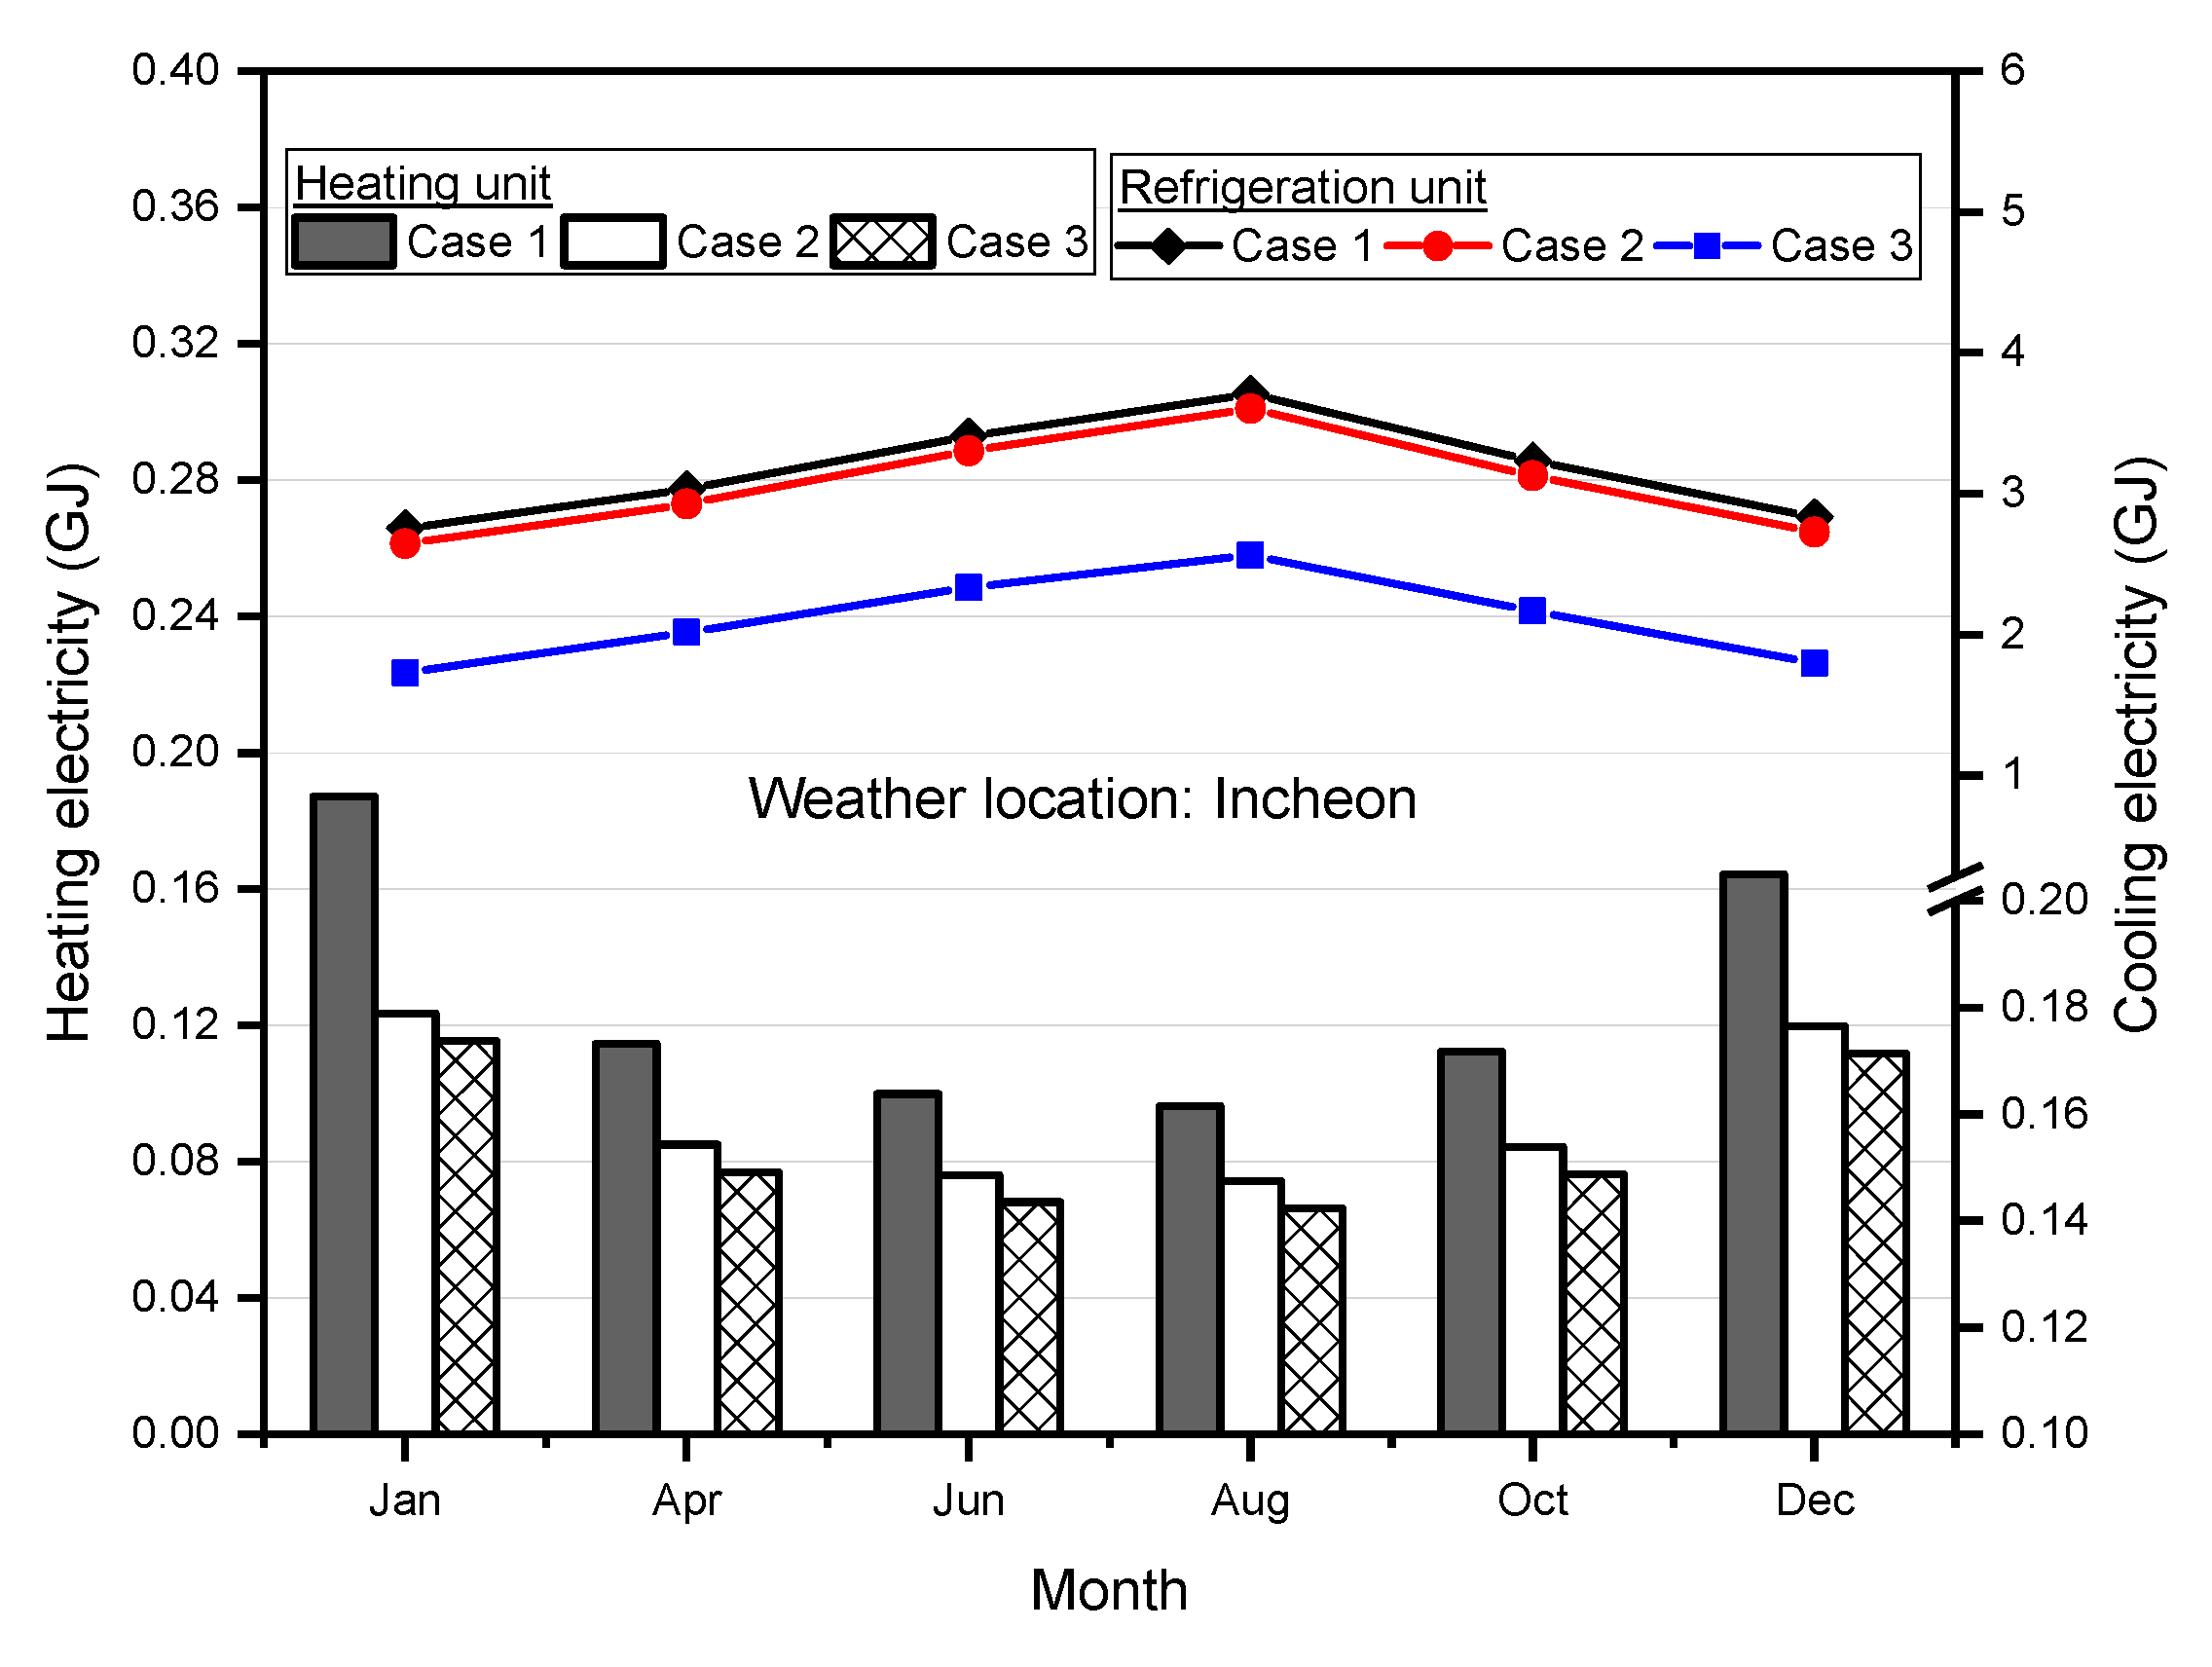
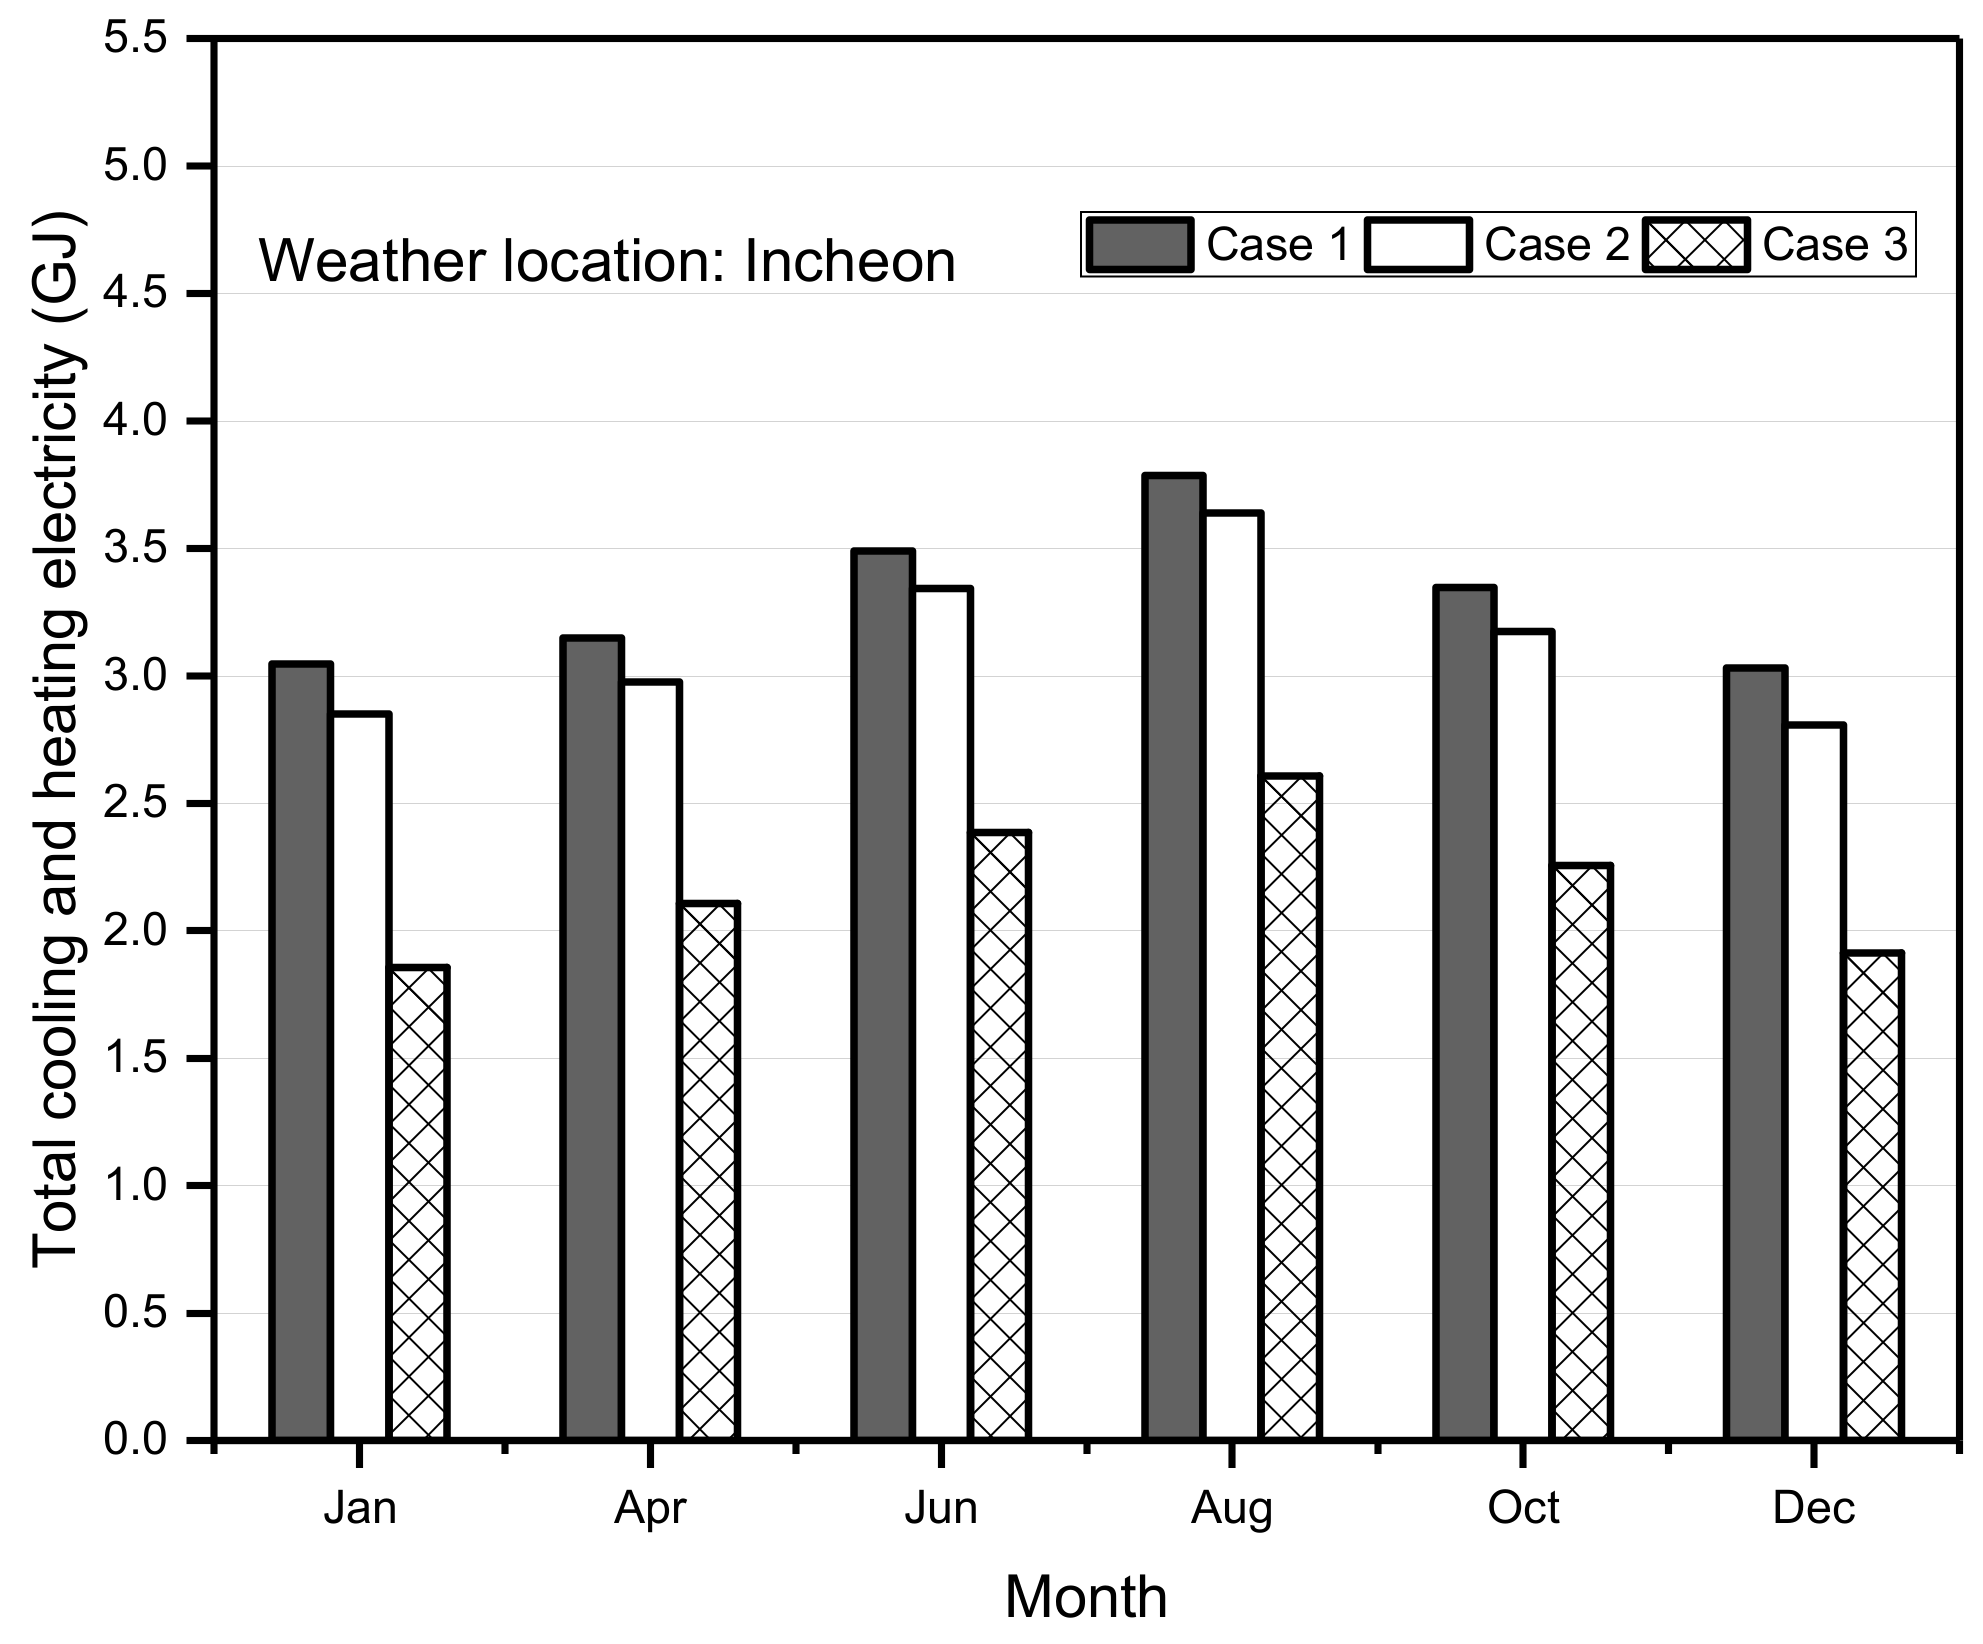
3.3. Monthly Energy Performance Evaluation of Case Scenarios

The performance of modeling case scenarios were analyzed according to some selected monthly periods. As shown in Figure 19, for each month, the average heating electricity for case (1) was higher than both case (2) and case (3) because the case (1) system was without a heat recovery unit. Moreover, in all cases, the heating electric consumption was relatively higher for winter months such as January and December since outdoor air temperatures in those periods were very low. However, for each month, the cooling electric consumption was relatively the same for case (1) and case (2) as the chiller in both cases utilized a large refrigerator capacity in sink test chamber whereas the cooling energy in case (3) decreased as a result of small refrigerator capacity for heat extraction in the sink chamber relative to cases (1) and (2). Also, the maximum cooling energy occurred in the summer month of August where the average outdoor air temperature was very high.
In Figure 20, the total average heating and cooling electric consumption was higher in August compared to other months. Moreover, for each month, total heating and cooling electricity for case (1) was only about 3.5% higher than case (2) as a result of the same refrigerator capacity in both cases, although the case (2) scenario utilized a heat recovery unit to provide the heat requirement in the source chamber. However, the average total electric consumption for case (1) was about 56% more than total consumption for case (3) due to the small refrigerator capacity in the system modeling to extract heat in the sink chamber relative to the capacity utilized in the case (1) scenario.

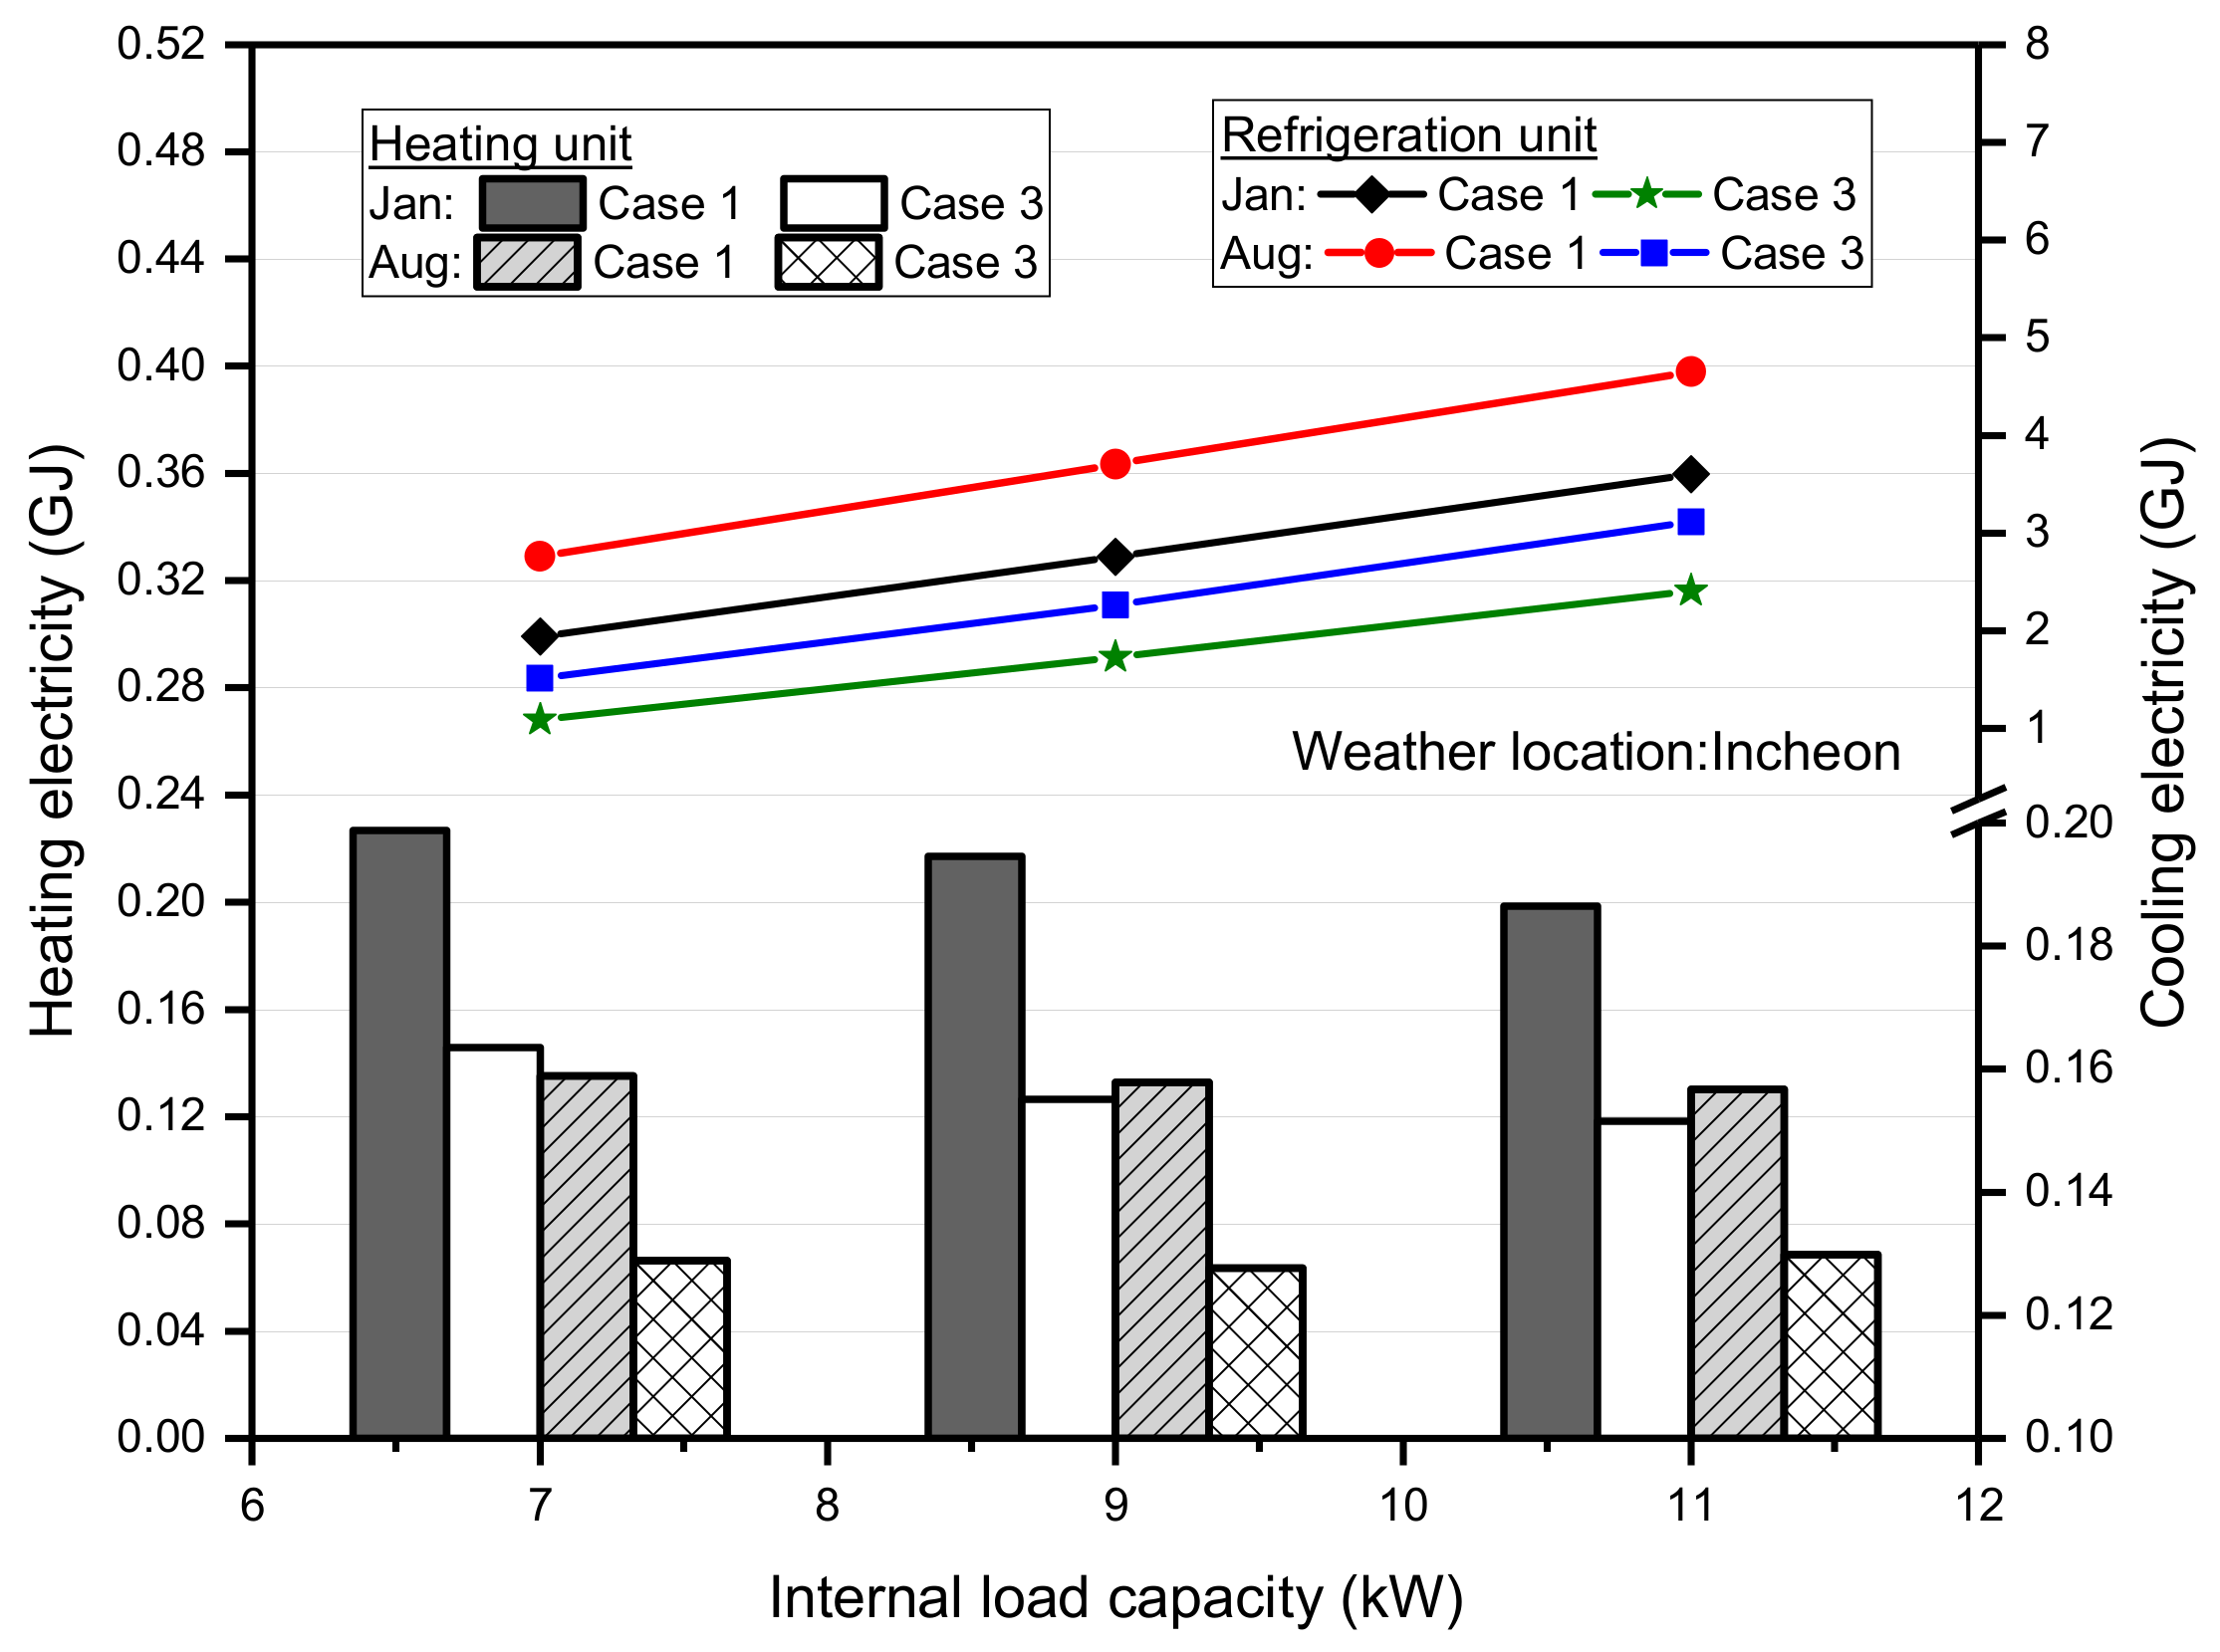
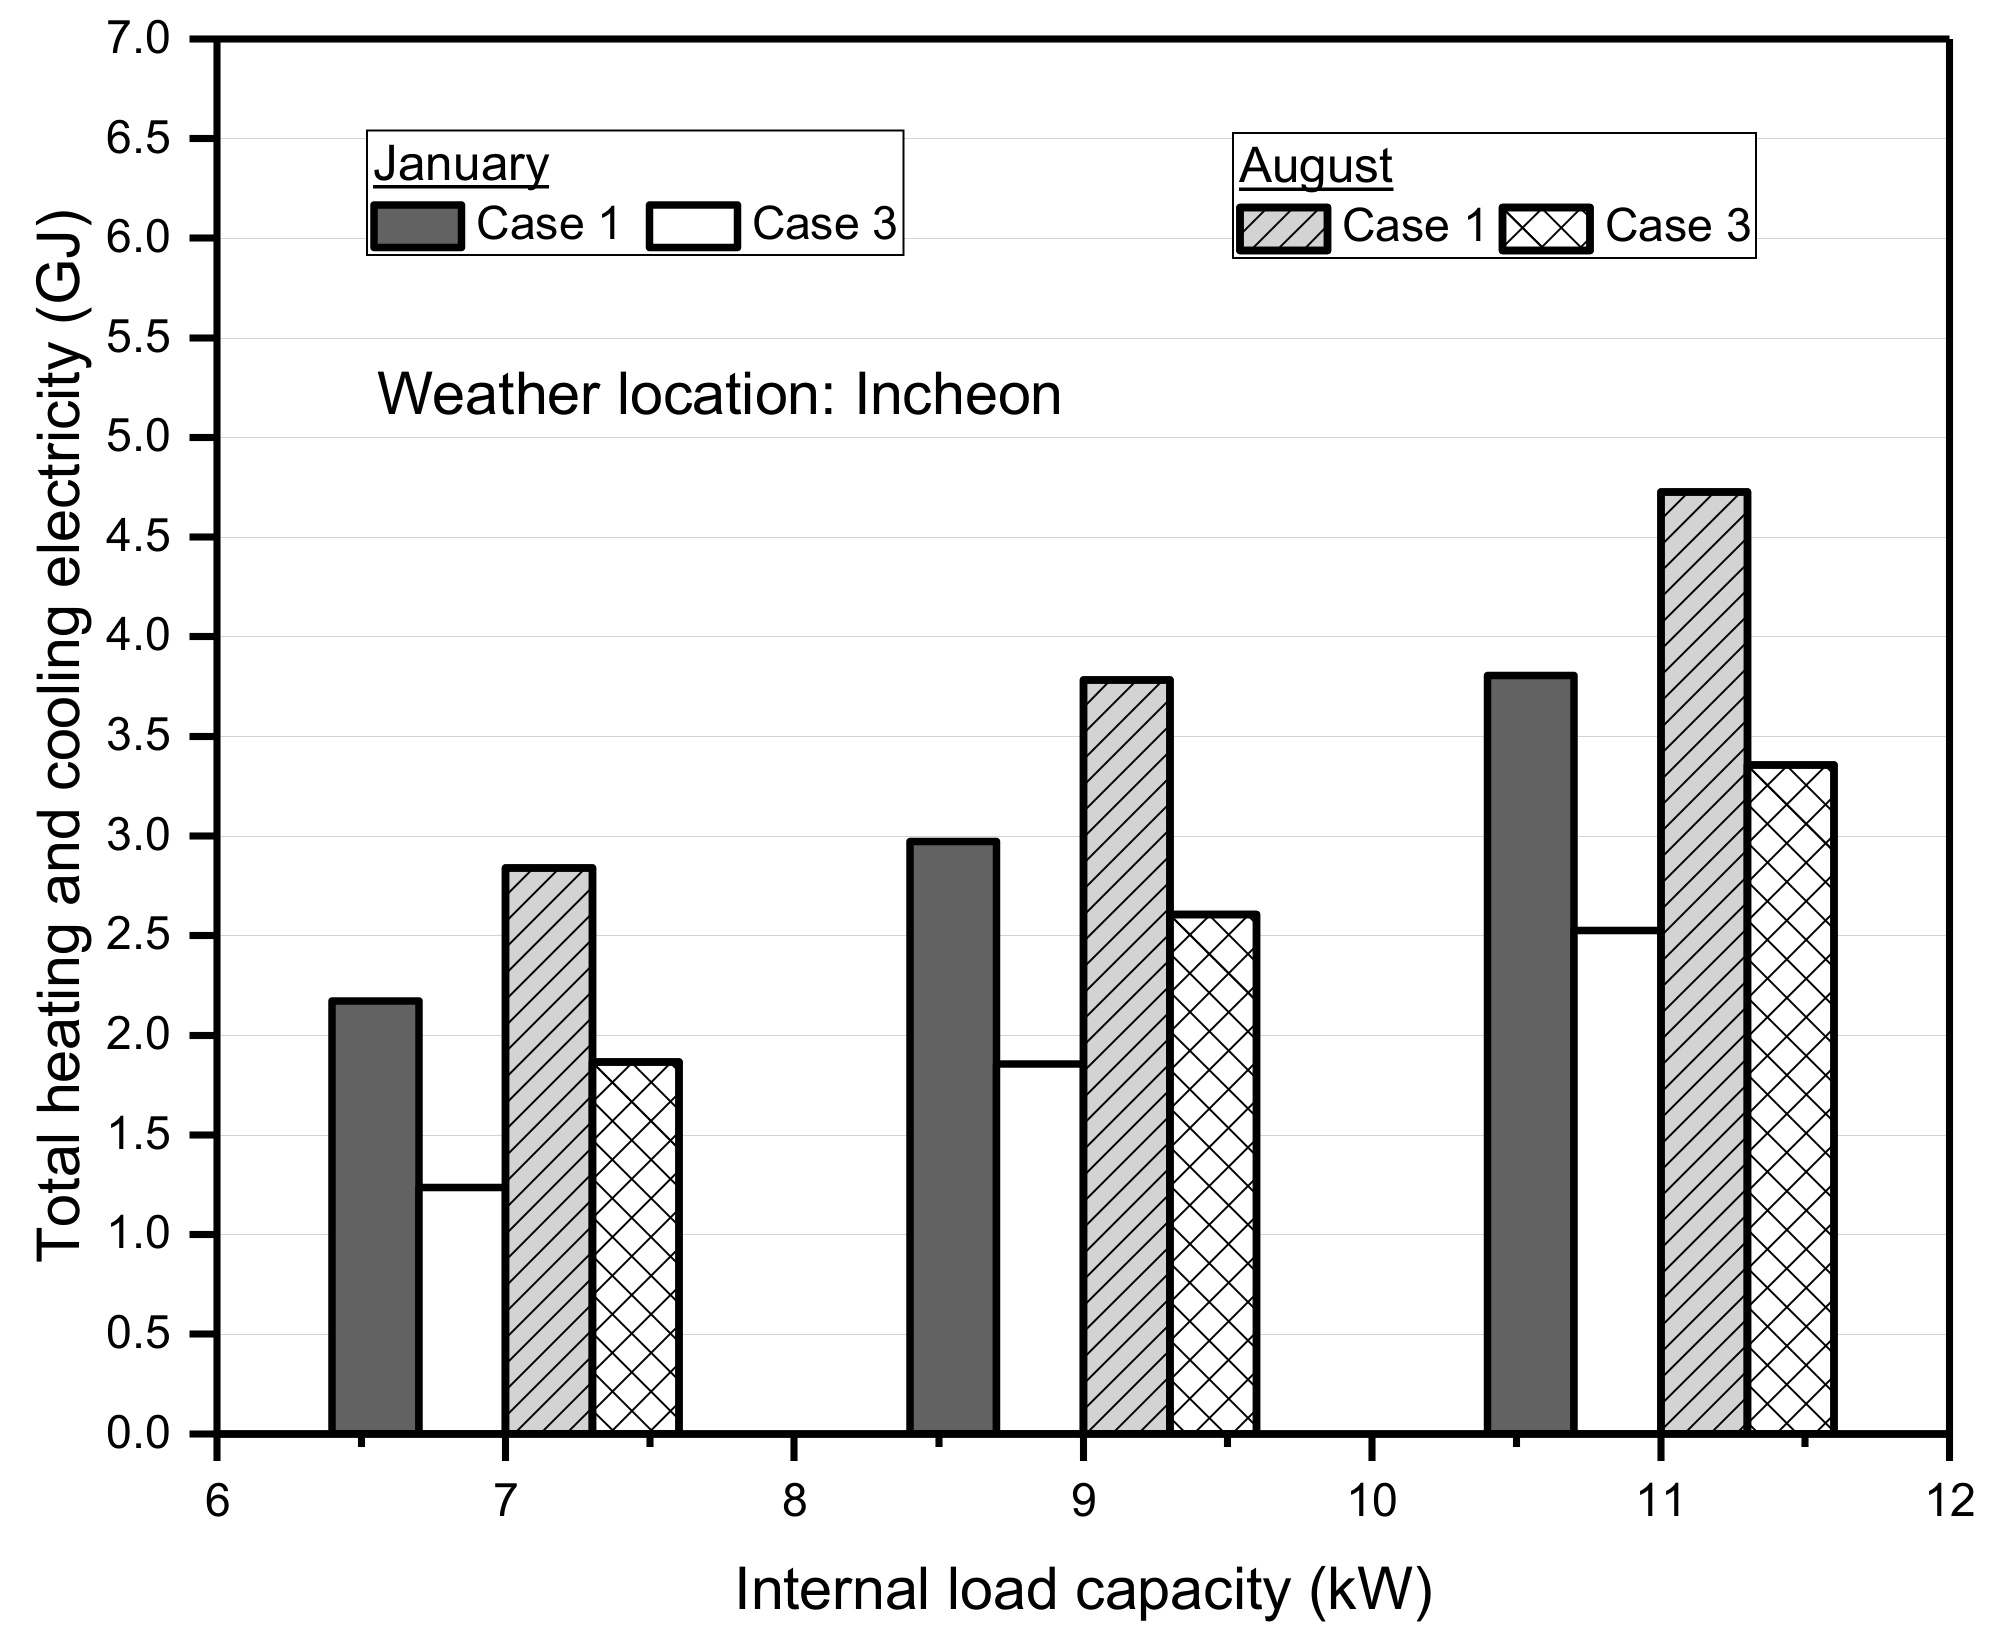
3.4. Energy Performance Analysis with Variation in Test Chamber Load Capacity

The simulation results for conventional case (1) modeling and proposed case (3) modeling based on variation in the internal load capacity were investigated with January and August as the representative months. The heating and cooling energy according to the winter and summer conditions are shown in Figure 21. As capacity increased, heating electricity decreased for each case though reduction was higher in January compared to August. Also, at each capacity, the heating electric consumption was about 49% and 64% lower in August for both cases, respectively, due to low outdoor dry bulb temperatures in January.
Moreover, for both months, the heating electricity was higher in case (1) than in case (3) as a result of the heat recovery unit utilized in the case (3) scenario. However, in both cases, cooling energy increased continuously as capacity increased because the heat extraction rate in each test chamber also increased accordingly. For a particular load capacity, the cooling electricity was about 25% and 38% lower in January for both case (1) and case (3), respectively due to high average outdoor air temperatures in August. Again, the cooling energy in each month was lower in case (3) than in case (1) as a result of the small chiller capacity for heat extraction from the sink test chamber in case (3) system modeling.
Figure 22 shows the total heating and cooling energy consumption. For both cases, the total energy increased as the capacity increased. Also, the total energy consumption was higher in August as compared to January because the increase in heating energy in January was lower than the increase in cooling energy in August. However, for internal load capacities of 7, 9, and 11 kW in the sink test chamber, total energy consumption in case (1) was about 68%, 56%, and 50% higher than case (3), accordingly in January, whereas for August, total energy consumption in case (1) was about 54%, 45%, and 43% higher compared to case (3) scenario, respectively.

4. Conclusions

To test a heat pump system, the air surrounding the indoor and outdoor test units was controlled using an air handling unit in each chamber consisting of a refrigerator, heater, humidifier, and supply fan. There exist two test chambers, specifically the source and sink test chambers to simulate the indoor and outdoor test units. In the conventional mode, each air handling unit operates separately to control the air in each chamber resulting in high energy consumption.
In this study, a new calorimeter was proposed for controlling the air conditions in each test chamber. By using dynamic modeling and simulation, energy performance of the newly proposed calorimeter was investigated and compared to the conventional calorimeter. This was to evaluate and predict the energy saving potential of the proposed system.
Two systems, the conventional and the proposed calorimeter were developed using the EnergyPlus simulation software. In modeling the conventional calorimeter, there was no heat recovery unit and water heating coil as compared to the proposed calorimeter modeling.
Three studied case scenarios were considered during performance prediction. The base case scenario was the conventional calorimeter, specified as case (1) where the chiller capacities in each test chamber were the same. Two case scenarios, specified as case (2) and case (3) were adopted for the proposed calorimeter modeling. In case (2), the simulation considered the same chiller capacity in the sink chamber for heat extraction as used in case (1) whereas in case (3), a smaller chiller capacity was used. For a COP of 4.0 and heating operating mode, internal load capacities of 7, 9, and 11 kW were considered in the sink chamber for the analysis with corresponding capacities of 5.25, 6.75, and 8.25 in the source chamber. During simulation, the system operating schedule was from 10:00 until 21:00 where the indoor air condition in each chamber was controlled to a setpoint temperature of about 23 °C. The simulation performance analyses were carried out considering Incheon weather condition with representative days and months.
Performance evaluation of the case scenarios under the same simulation test conditions showed that, for winter operating conditions, case (1) energy consumption was about 3.5% and 48% higher than case (2) and case (3), respectively whereas in the summer operating conditions, case (1) was about 2% and 55% higher compared to case (2) and case (3), accordingly. For system performance on an average monthly period, energy savings of the proposed modeling cases (2) and (3) were about 4% and 56% respectively as compared to the conventional modeling, case (1). Although a heat recovery unit was used in both cases (2) and (3), the energy savings of the proposed calorimeter under case (2) was very small compared to case (3). This was because, the chiller capacity used in case (3) for heat extraction in the sink test chamber was small as compared to case (2). Therefore, by using a heat recovery unit, it is not necessary to utilize a large chiller capacity as used in case (1) for conventional calorimeter. Lastly, performance analysis was conducted with variation in internal load capacity. Results showed that as the capacity increased, the energy consumption also increased. However, for all load capacities that were investigated, the proposed calorimeter with small chiller capacity resulted in at least 43% of energy savings.

Author Contributions

K.O.A. executed the simulation and wrote original draft preparation, K.H.L. analyzed simulation results, and J.M.C. conceptualized a research, reviewed the whole manuscript.

Funding

This research was funded by the National Research Fund of the Korea government (MSIT) in 2019.

Acknowledgments

This work was supported by the National Research Foundation of Korea (NRF) grant funded by the Korea government (MSIT) (No. 2019R1A2C2087157).

Conflicts of Interest

The authors declare no conflict of interest.

Nomenclature

AHUair handling unit
COPcoefficient of performance
COPnomnominal COP of the chiller
cp,cd,wspecific heat of water at condenser inlet temperature, kJ/kg. °C
cp,cdwespecific heat of water at condenser exit temperature, kJ/kg. °C
cp,wspecific heat capacity of water at 5 °C, kJ/kg. °C
cp,wavgspecific heat of water at average temperature of 60.0 °C, J/kg. °C
DBdry bulb temperature. °C
∆Tc,loop,des condenser water loop design temperature rise, °C
∆Tloop,deschilled water loop design temperature rise, °C
∆Tw sensible temperature rise of water, °C
fc,s component sizing factor
Fsscaling factor, W/ m3/s-Pa
Hheater
hfglatent heat of vaporization of water at 100 °C, J/kg
Hnomnominal head or pressure rise across the pump, Pa
ID indoor
ODoutdoor
ηmotormotor efficiency
p pressure, Pa
Ppumpdesign power consumption of the pump, W
Pratedrated power of the humidifier, W
ρwdensity of water at standard conditions (5.05 °C), kg/m3
Qdc,nomloop design nominal capacity of dry cooler, kW
Qfan,nom nominal fan power of the dry cooler, kW;
Qnomnominal cooling capacity of the chiller, kW
Qw,aheat transferred from water to the air, W
Rrefrigerator
RHrelative humidity. %
Ta,avgaverage air temperature, °C
Tw,avgaverage water temperature, °C
UAoverall thermal conductance, W/°C
Vhru volumetric water flow rate through heat recovery unit, m3/s
Vloop,desloop design volumetric flow rate, m3/s
Vnomnominal design volumetric flow rate, m3/s
Vratedrated capacity of humidifier in volumetric flow rate, m3/s
Z altitude, m

References

  1. Pérez-Lombard, L.; Ortiz, J.; Pout, C. A review on buildings energy consumption information. Energy Build. 2008, 40, 394–398. [Google Scholar] [CrossRef]
  2. Mardiana-Idayua, A.; Riffat, S.B.; Zhang, S. Review of heat recovery technologies for building applications. Renew. Sustain. Energy Rev. 2012, 16, 1241–1255. [Google Scholar] [CrossRef]
  3. Arteconi, A.; Brandoni, C.; Rossi, G.; Polonara, F. Experimental evaluation and dynamic simulation of a ground coupled heat pump for a commercial building. Int. J. Energy Res. 2013, 37, 1971–1980. [Google Scholar] [CrossRef]
  4. Self, S.J.; Reddy, B.V.; Rosen, M.A. Geothermal heat pump systems: Status review and comparison with other heating options. Appl. Energy 2013, 101, 341–348. [Google Scholar] [CrossRef]
  5. ASHRAE. Standard 37: Methods of Testing for Rating Electrically Driven Unitary Air Conditioners and Heat Pumps; American Society of Heating, Refrigeration and Air-Conditioning Engineers (ASHRAE): Atlanta, GA, USA, 2009. [Google Scholar]
  6. ISO. Standard 5151: Non-Ducted Air Conditioners and Heat Pumps-Testing and Rating for Performance; International Standard Organization (ISO): Geneva, Switzerland, 2010. [Google Scholar]
  7. ASHRAE. Standard 116: Testing Methods for Seasonal Efficiency of Unit Air Conditioners and Heat Pumps; American Society of Heating, Refrigerating and Air Conditioning Engineers (ASHRAE): Atlanta, GA, USA, 1983. [Google Scholar]
  8. Byuna, J.S.; Lee, J.; Jeon, C.D. Frost retardation of an air-source heat pump by the hot gas bypass method. Int. J. Refrig. 2008, 31, 328–334. [Google Scholar] [CrossRef]
  9. Jang, J.Y.; Bae, H.H.; Lee, S.J.; Ha, M.Y. Continuous heating of an air-source heat pump during defrosting and improvement of energy efficiency. Appl. Energy 2013, 110, 9–16. [Google Scholar] [CrossRef]
  10. Ko, Y.; Park, S.; Jin, S.; Kim, B.; Jeong, J.H. The selection of volume ratio of two-stage rotary compressor and its effects on air-to-water heat pump with flash tank cycle. Appl. Energy 2013, 104, 187–196. [Google Scholar] [CrossRef]
  11. Xu, B.; Zhang, C.; Wang, Y.; Chen, J.; Xu, K.; Li, F.; Wang, N. Experimental investigation of the performance of microchannel heat exchangers with a new type of fin under wet and frosting conditions. Appl. Therm. Eng. 2015, 89, 444–458. [Google Scholar] [CrossRef]
  12. Choi, H.J.; Kim, B.S.; Kang, D.; Kim, K.C. Defrosting method adopting dual hot gas bypass for an air-to-air heat pump. Appl. Energy 2011, 88, 4544–4555. [Google Scholar] [CrossRef]
  13. Park, Y.S.; Jeong, J.H.; Ahn, B.H. Heat pump control method based on direct measurement of evaporation pressure to improve energy efficiency and indoor air temperature stability at a low cooling load condition. Appl. Energy 2014, 132, 99–107. [Google Scholar] [CrossRef]
  14. Fan, H.; Shao, S.; Tian, C. Performance investigation on a multi-unit heat pump for simultaneous temperature and humidity control. Appl. Energy 2014, 113, 883–890. [Google Scholar] [CrossRef]
  15. Amoabeng, O.K.; Choi, J.M.; Lee, K.H. A study on the performance characteristics of a testing facility for a water-to-water heat pump. Int. J. Refrig. 2018, 86, 113–126. [Google Scholar] [CrossRef]
  16. Xu, Q.; Riffat, S.; Zhang, S. Review of heat recovery technologies for building applications. Energies 2019, 12, 22. [Google Scholar] [CrossRef]
  17. Cuce, P.M.; Riffat, S.B. A comprehensive review of heat recovery systems for building applications. Renew. Sustain. Energy Rev. 2015, 47, 665–682. [Google Scholar] [CrossRef]
  18. Yau, Y.H.; Ahmadzadehtalatapeh, M.A. Review on the application of horizontal heat pipe heat exchangers in air conditioning systems in the tropics. Appl. Therm. Eng. 2010, 30, 77–84. [Google Scholar] [CrossRef]
  19. Mardiana-Idayu, A.; Riffat, S.B. An experimental study on the performance of enthalpy recovery system for building applications. Energy Build. 2011, 43, 2533–2538. [Google Scholar] [CrossRef]
  20. Nguyen, A.; Kim, Y.; Shin, Y. Experimental study of sensible heat recovery of heat pump during heating and ventilation. Int. J. Refrig. 2005, 28, 242–252. [Google Scholar] [CrossRef]
  21. Nasif, M.; Al-Waked, R.; Morrison, G.; Behnia, M. Membrane heat exchanger in HVAC energy recovery systems, systems energy analysis. Energy Build. 2010, 42, 1833–1840. [Google Scholar] [CrossRef]
  22. Riffat, S.B.; Gillott, M.C. Performance of a novel mechanical ventilation heat recovery heat pump system. Appl. Therm. Eng. 2002, 22, 839–845. [Google Scholar] [CrossRef]
  23. Gong, G.; Zeng, W.; Wang, L.; Wu, C. A new heat recovery technique for air conditioning/heat pump system. Appl. Therm. Eng. 2008, 28, 2360–2370. [Google Scholar] [CrossRef]
  24. Gu, Z.; Liu, H.; Li, Y. Thermal energy recovery of air conditioning system and heat recovery system calculation and phase change materials development. Appl. Therm. Eng. 2004, 24, 2511–2526. [Google Scholar] [CrossRef]
  25. Sukamongkol, Y.; Chungpaibulpatana, S.; Limmeechokchai, B.; Sripadungtham, P. Condenser heat recovery with a PV/T air heating collector to regenerate desiccant for reducing energy use of air conditioning room. Energy Build. 2010, 42, 315–325. [Google Scholar] [CrossRef]
  26. U.S. Department of Energy. EnergyPlus Building Technologies Program, Energy Efficiency and Renewable Energy; Trimble Inc.: Sunnyvale, CA, USA, 2017. [Google Scholar]
  27. U.S. Department of Energy. EnergyPlus Simulation Software Version 8.4. In The Encyclopedic Reference to EnergyPlus Input and Output; U.S. Department of Energy: Washington, DC, USA, 2016; Available online: https://energyplus.net/downloads (accessed on 2 December 2019).
  28. Crawley, D.B.; Lawrie, L.K.; Winkelmann, F.C.; Buhl, W.F.; Huang, H.J.; Pedersen, C.O.; Strand, R.K.; Liesen, R.J.; Fisher, D.E.; Witte, M.J.; et al. EnergyPlus: Creating a new-generation building energy simulation program. Energy Build. 2001, 33, 319–331. [Google Scholar] [CrossRef]
  29. ASHRAE. The Handbook of Heating, Ventilation and Air Conditioning (HVAC); Applications, SI Edition; American Society of Heating, Refrigerating and Air-Conditioning Engineers: Atlanta, GA, USA, 2011. [Google Scholar]
  30. Harmathy, N.; Murgul, V. Heat pump system simulation towards energy performance estimation in office buildings. Procedia Eng. 2016, 165, 1845–1852. [Google Scholar] [CrossRef]
  31. Kim, S.U. Technology of Energy Simulation. Int. J. Air-Cond Refrig. 2014, 43, 23–38. [Google Scholar]
  32. Parsons, R. Handbook of Fundamentals: SI Edition; American Society of Heating, Refrigerating and Air-Conditioning Engineers (ASHRAE): Atlanta, GA, USA, 2005. [Google Scholar]
  33. Duan, Z.; Zhao, X.; Liu, J.; Zhang, Q. Dynamic simulation of a hybrid dew point evaporative cooler and vapour compression refrigerated system for a building using EnergyPlus. J. Build. Eng. 2019, 21, 287–301. [Google Scholar] [CrossRef]
  34. Aikins, K.A.; Choi, J.M. Current status of the performance of ground source heat pump (GSHP) units in the Republic of Korea. Energy 2012, 47, 77–82. [Google Scholar] [CrossRef]
  35. Boyanoa, A.; Hernandez, P.; Wolfa, O. Energy demands and potential savings in European office buildings: Case studies based on EnergyPlus simulations. Energy Build. 2013, 65, 19–28. [Google Scholar] [CrossRef]
Figure 1. Schematic of standard psychrometric calorimeter test chamber [8].
Energies 12 04589 g001
Figure 2. Simulation methodology flow chart.
Energies 12 04589 g002
Figure 3. Building geometry in SketchUp.
Energies 12 04589 g003
Figure 4. Schematic of conventional calorimeter modeling.
Energies 12 04589 g004
Figure 5. Schematic of proposed calorimeter modeling.
Energies 12 04589 g005
Figure 6. Outdoor air temperature and relative humidity of Incheon city.
Energies 12 04589 g006
Figure 7. Variation of air temperature and relative humidity based on winter conditions.
Energies 12 04589 g007
Figure 8. Analysis of heating and cooling rates of case (1) and case (2) based on winter conditions.
Energies 12 04589 g008
Figure 9. Analysis of heating and cooling rates of case (1) and case (3) based on winter conditions.
Energies 12 04589 g009
Figure 10. Energy consumption of case (1) and case (2) based on winter conditions.
Energies 12 04589 g010
Figure 11. Energy consumption of case (1) and case (3) based on winter conditions.
Energies 12 04589 g011
Figure 12. Total consumption analysis of case scenarios based on winter conditions.
Energies 12 04589 g012
Figure 13. Variation of air temperature and relative humidity based on summer conditions.
Energies 12 04589 g013
Figure 14. Analysis of heating and cooling rates of case (1) and case (2) based on summer conditions.
Energies 12 04589 g014
Figure 15. Analysis of heating and cooling rates of case (1) and case (3) based on summer conditions.
Energies 12 04589 g015
Figure 16. Energy analysis of case (1) and case (2) based on summer conditions.
Energies 12 04589 g016
Figure 17. Energy analysis of case (1) and case (3) based on summer conditions.
Energies 12 04589 g017
Figure 18. Total energy consumption of case scenarios based on summer conditions.
Energies 12 04589 g018
Figure 19. Analysis of heating and cooling energy based on representative months.
Energies 12 04589 g019
Figure 20. Total energy consumption of case scenarios based on representative months.
Energies 12 04589 g020
Figure 21. Analysis of heating and cooling energy with respect to capacity.
Energies 12 04589 g021
Figure 22. Total energy analysis with respect to capacity.
Energies 12 04589 g022
Table 1. Equipment internal heat gain.
ItemUnitInternal Heat Load Capacity
Sink ChamberSource Chamber
Equipment
(test unit)
kW75.25
96.75
118.25
Table 2. Simulation input conditions.
ItemSpecification
Software programEnergyPlus v8.4
City/weather locationIncheon (South Korea)
System operating scheduleFrom 10:00 Until 21:00
Indoor heating/cooling setpoint21 °C/25 °C
Monthly analysis periodJan., Apr., Jun., Aug., Oct., Dec.
Representative days7th to 21st (Jan. and Aug.)
Lighting internal heat gain 3.3 W/m2
Equipment (test unit) COP4.0
Test operating modeHeating

