Numerical Investigation on Heat-Transfer and Hydromechanical Performance inside Contaminant-Insensitive Sublimators under a Vacuum Environment for Spacecraft Applications


Abstract
1. Introduction
2. Function, Layout, Mathematic Model and Simulation Parameters of CIS
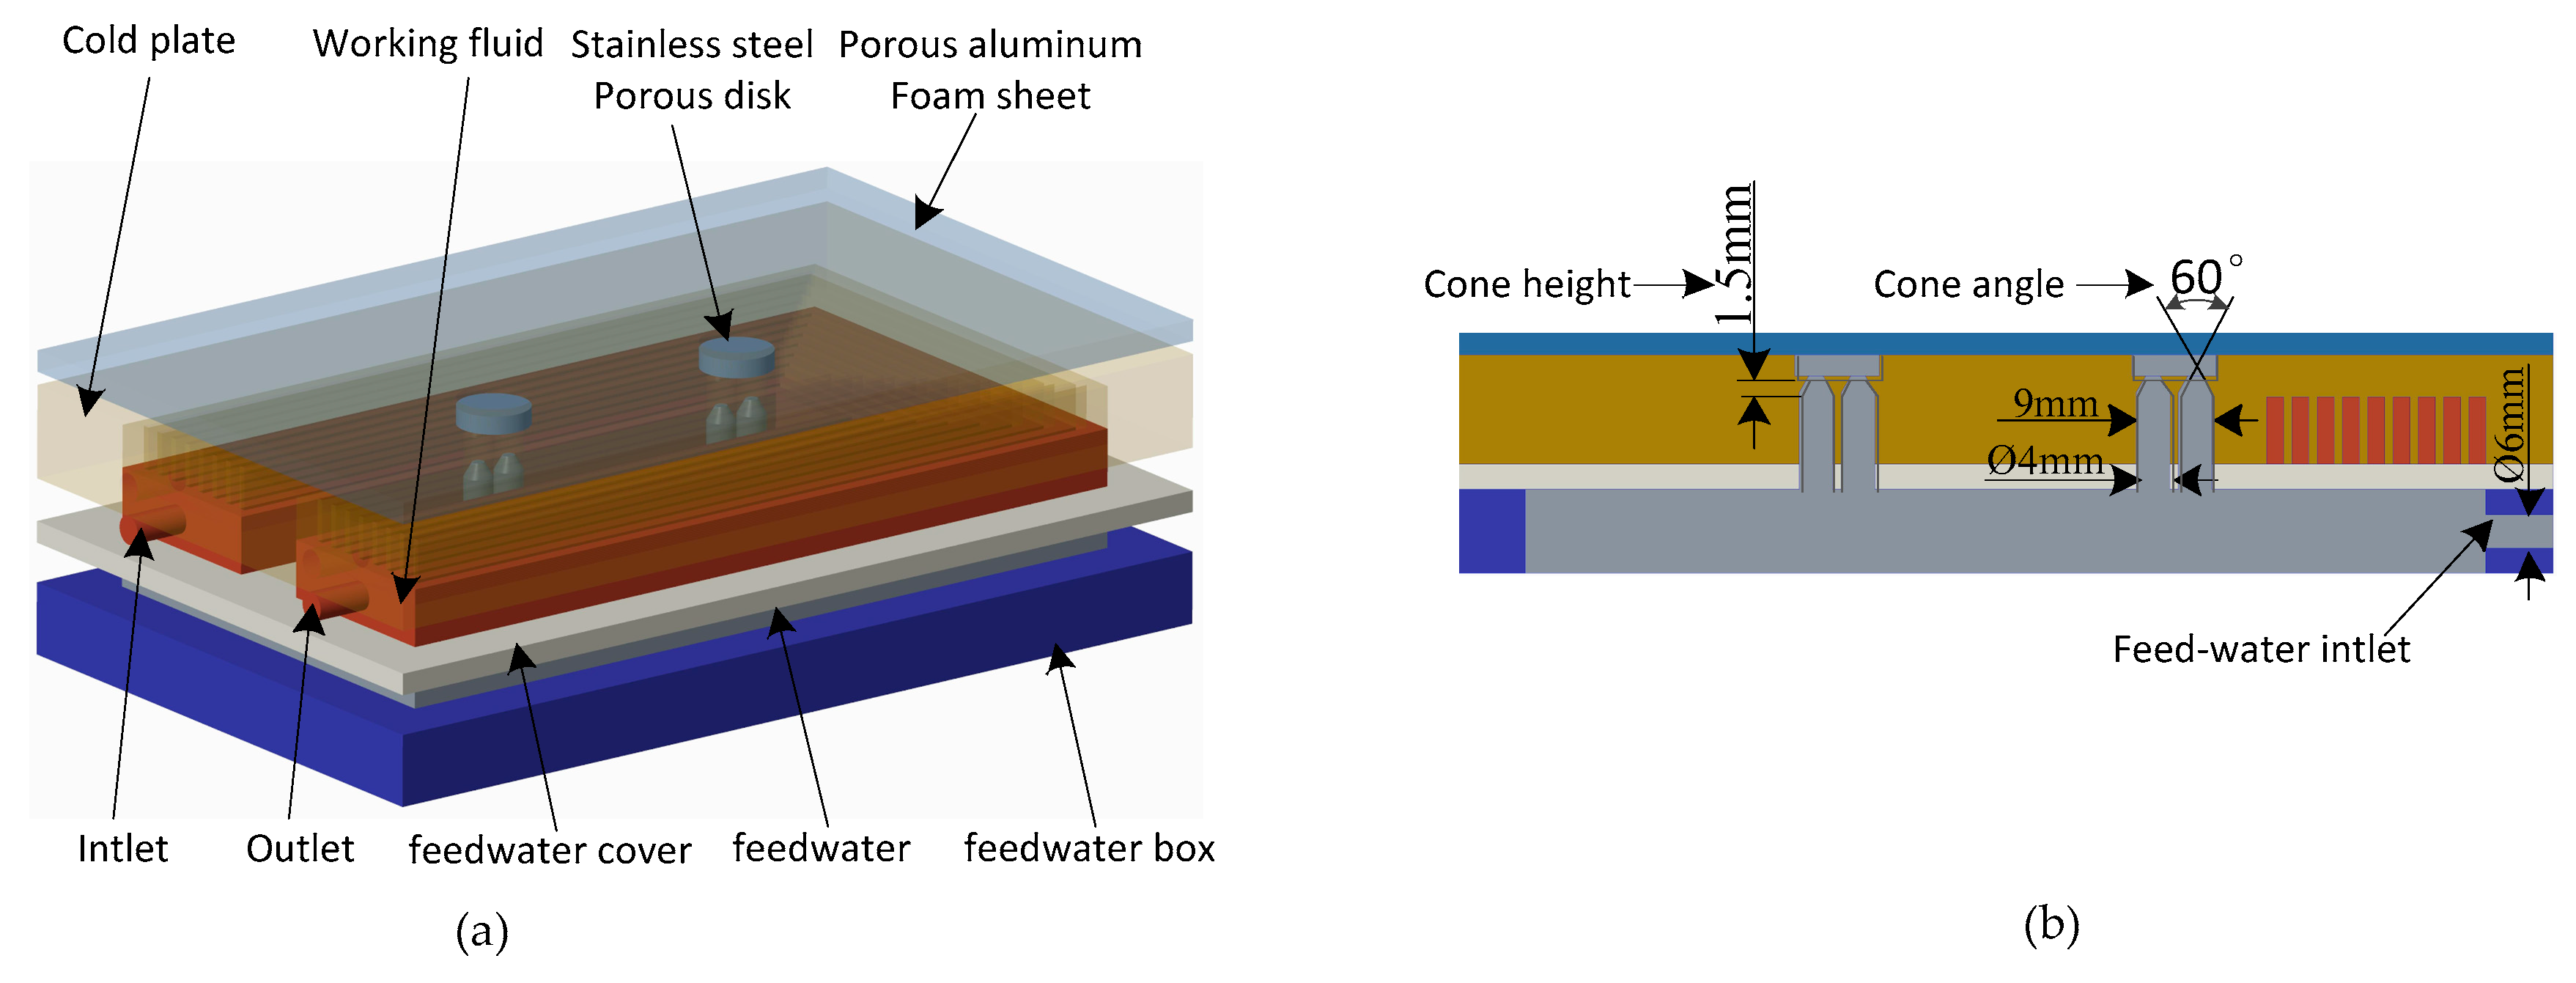
2.1. Function and Physical Model of CIS
2.1.1. Operating Mechanism
2.1.2. The Development Unit of the CIS
2.2. Mathmatic Model of CIS
2.2.1. Assumption
- 1)
- It is considered that the FW in the micron pores of the large pore plate can freeze quickly once the vacuum environment decreases to the triple point of water.
- 2)
- Assume that the water sublimation phase transition occurs only in the large pore substrate.
- 3)
- Neglect the convective heat transfer between FW and the other components of the sublimator, especially when flowing in porous substrate.
- 4)
- Suppose that the micron pores of the large pore substrate and the small pore substrate are filled with the FW.
2.2.2. Heat and Mass Transfer Model in Fluid Domain
- 1)
- Governing equations of the fluid domain
- 2)
- Heat Equilibrium
2.2.3. Heat Transfer Model in Solid Domain
2.2.4. Heat and Mass Transfer Model in Porous Substrate
2.2.5. Temperature Uniformity and Pressure Uniformity Evaluation Models
2.2.6. Compensatory Coefficient Evaluation Model
2.3. Simulation Parameters for CIS
2.3.1. Boundary Condition Setting
2.3.2. Thermo-Physical Properties
2.3.3. Factors Affecting CIS’s Performance
- 1)
- Physical parameters of porous substrates
- 2)
- Flow characteristics and fluid properties
- 3)
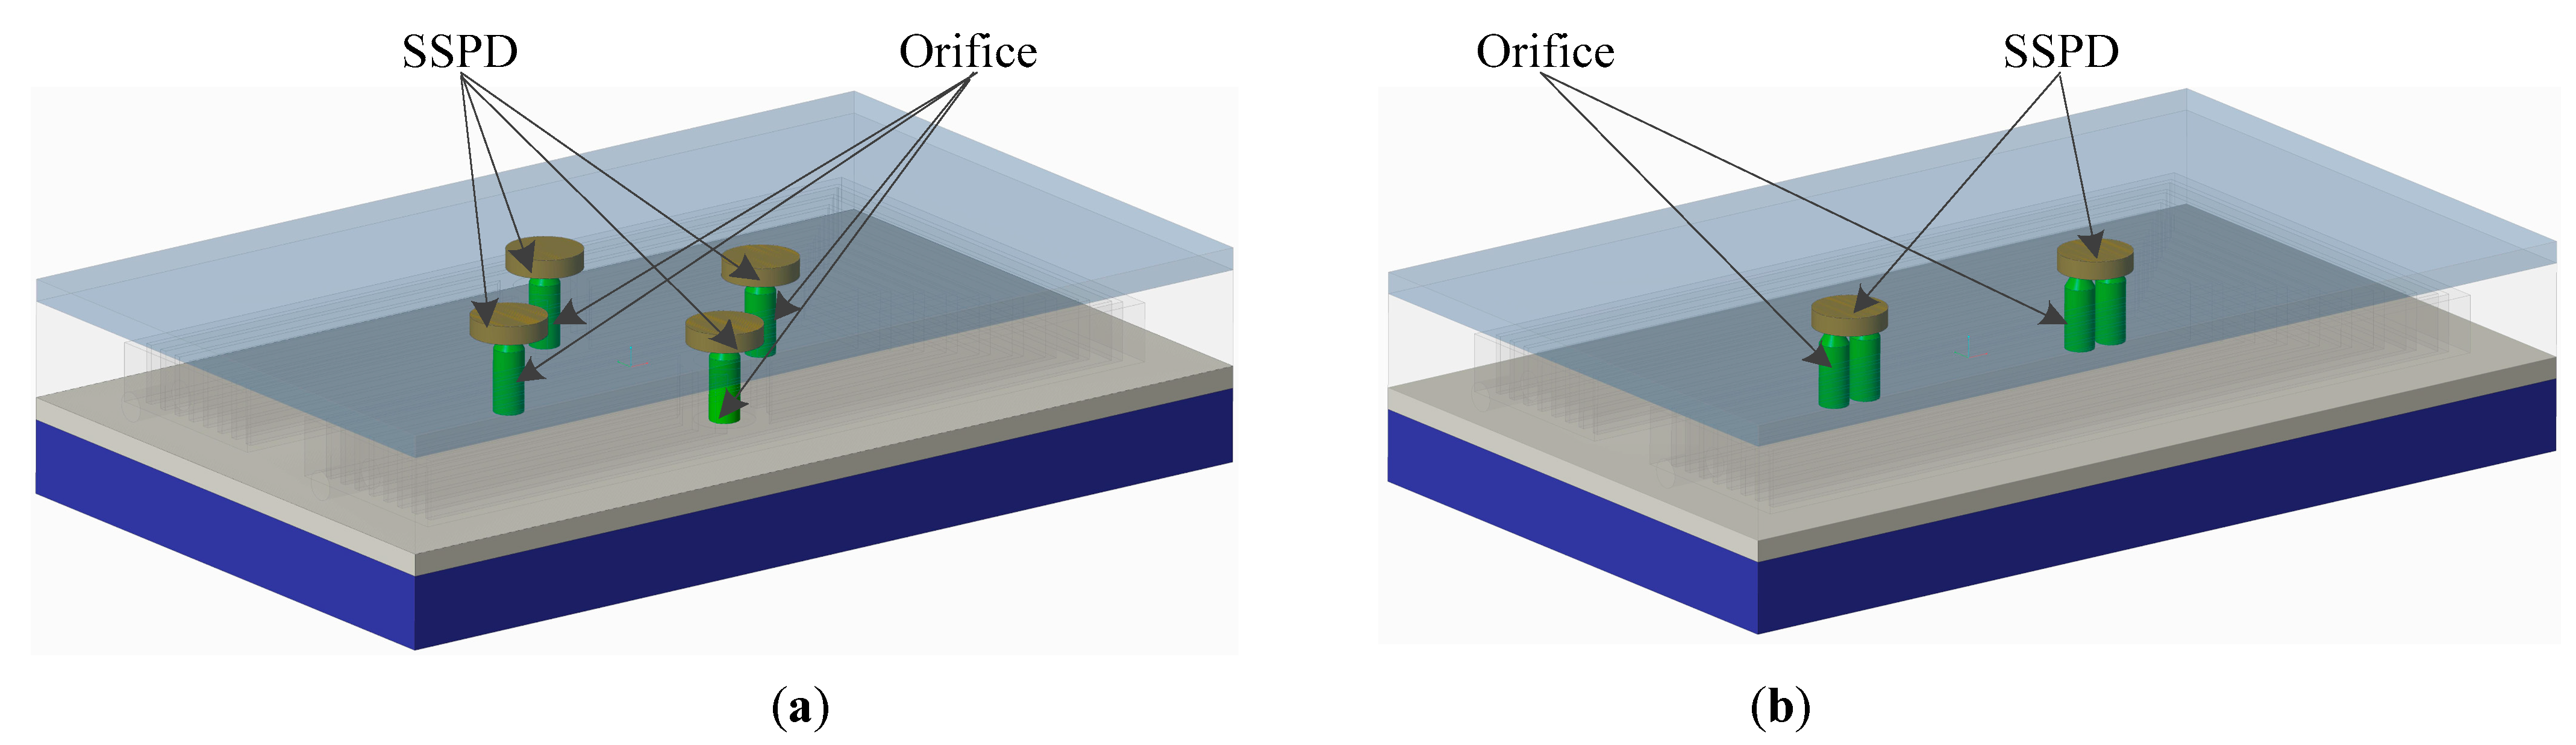
- Layout of the orifice
- 4)
- Structure parameters of orifice
3. Research Results and Discussion
3.1. Impact of Physical Parameters of Porous Substrates on the CIS
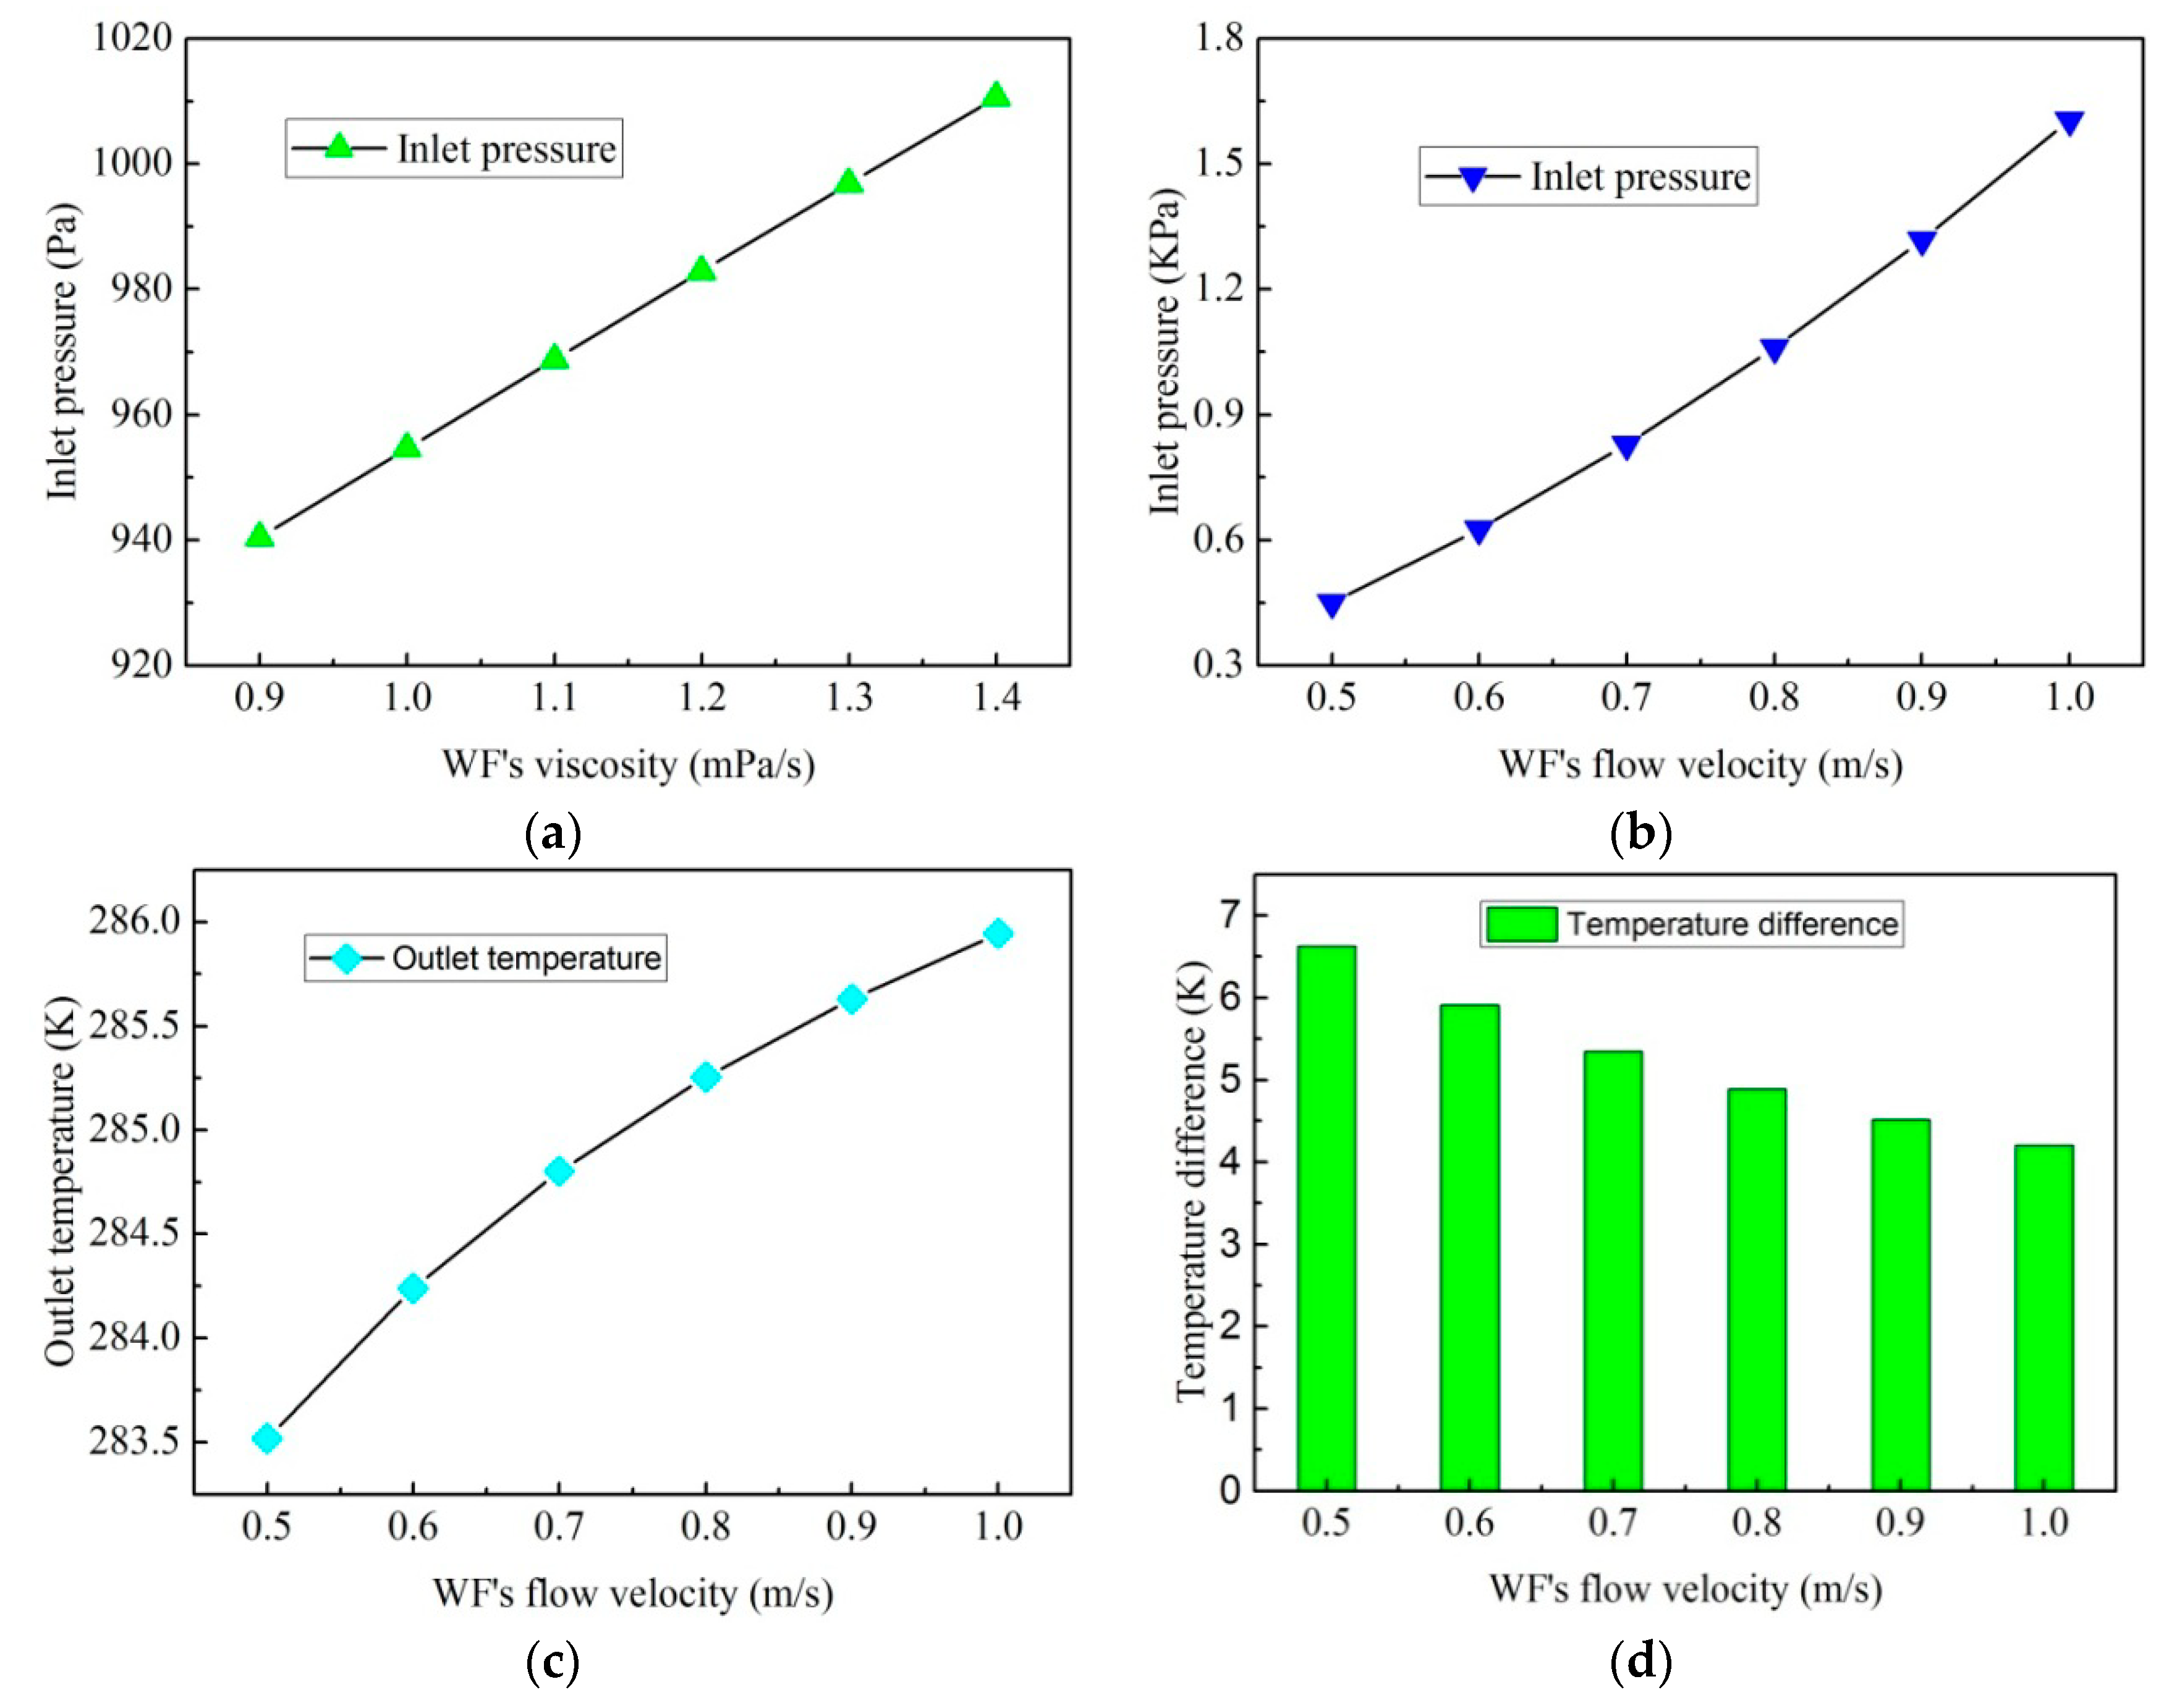
3.2. Impact of the Flow Characteristics and Fluid Properties on the CIS
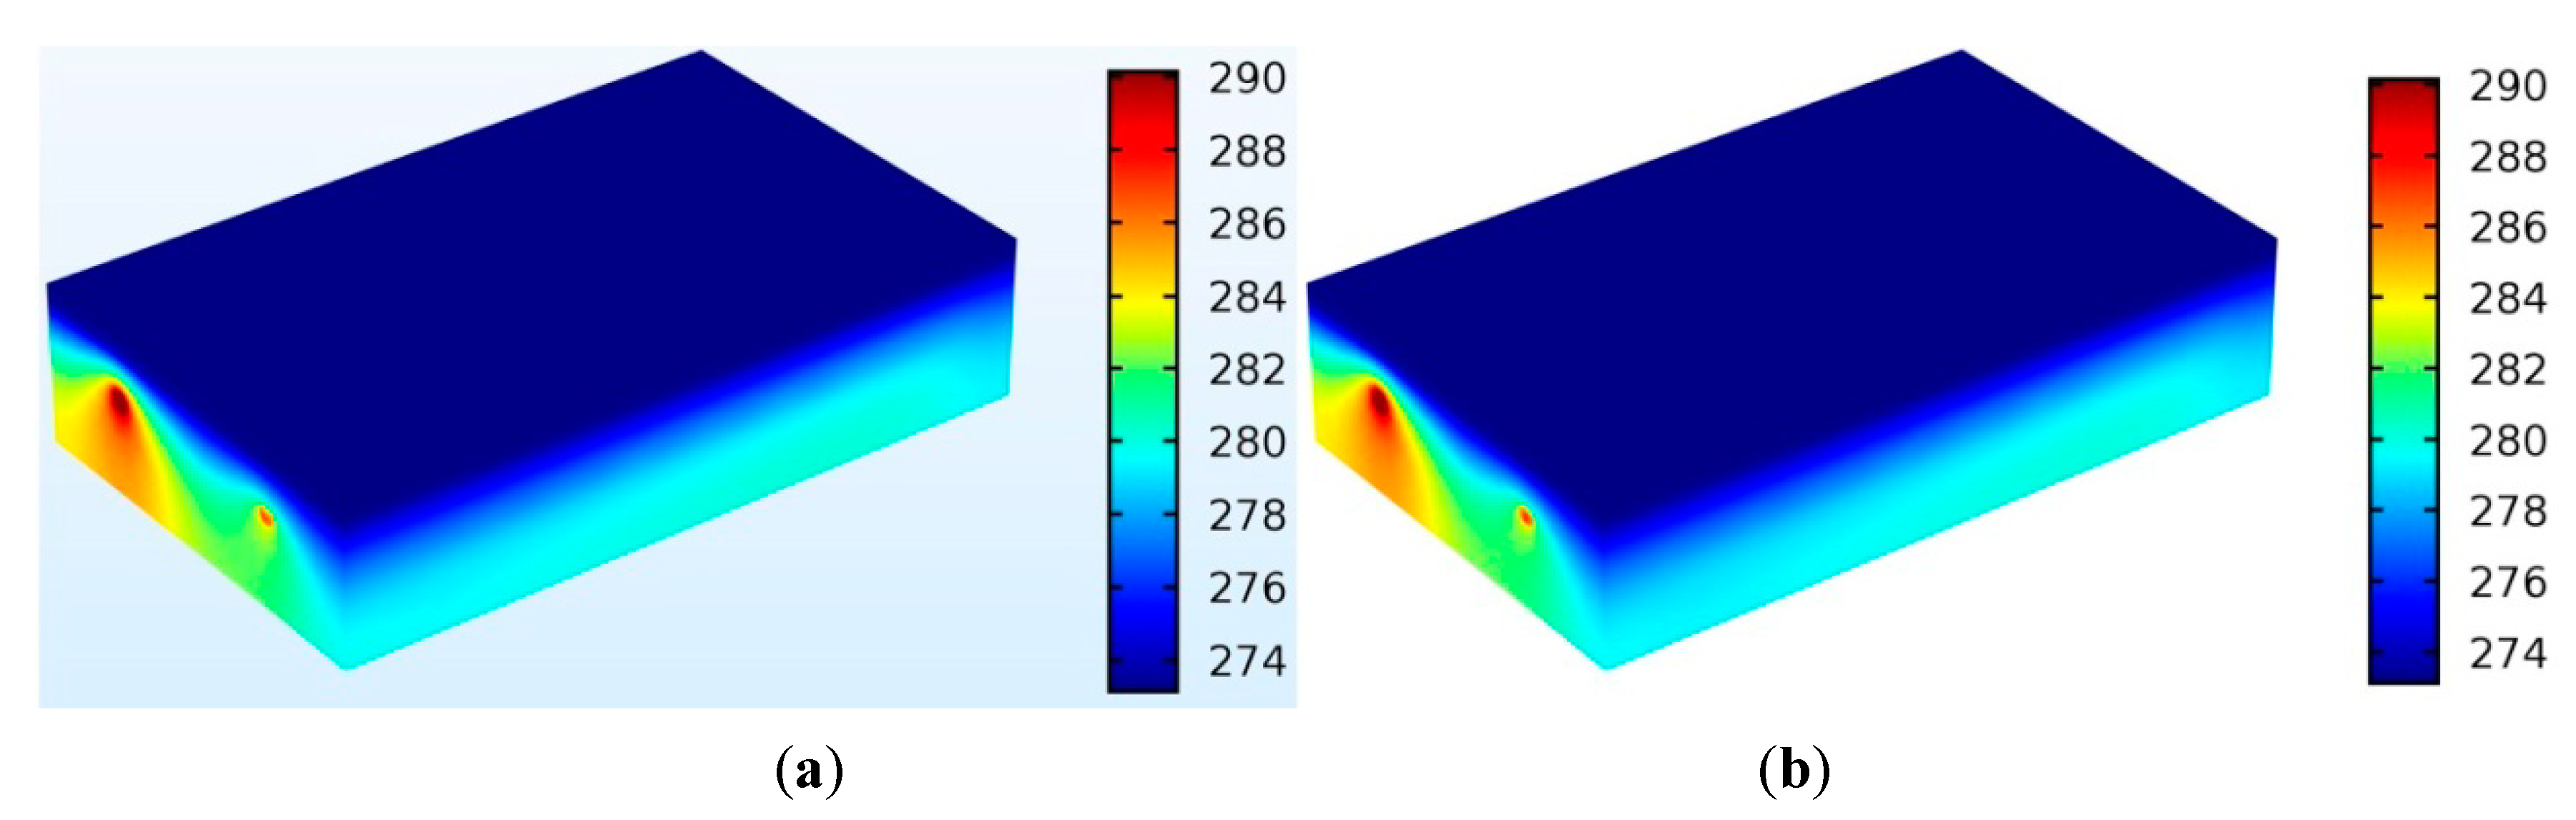
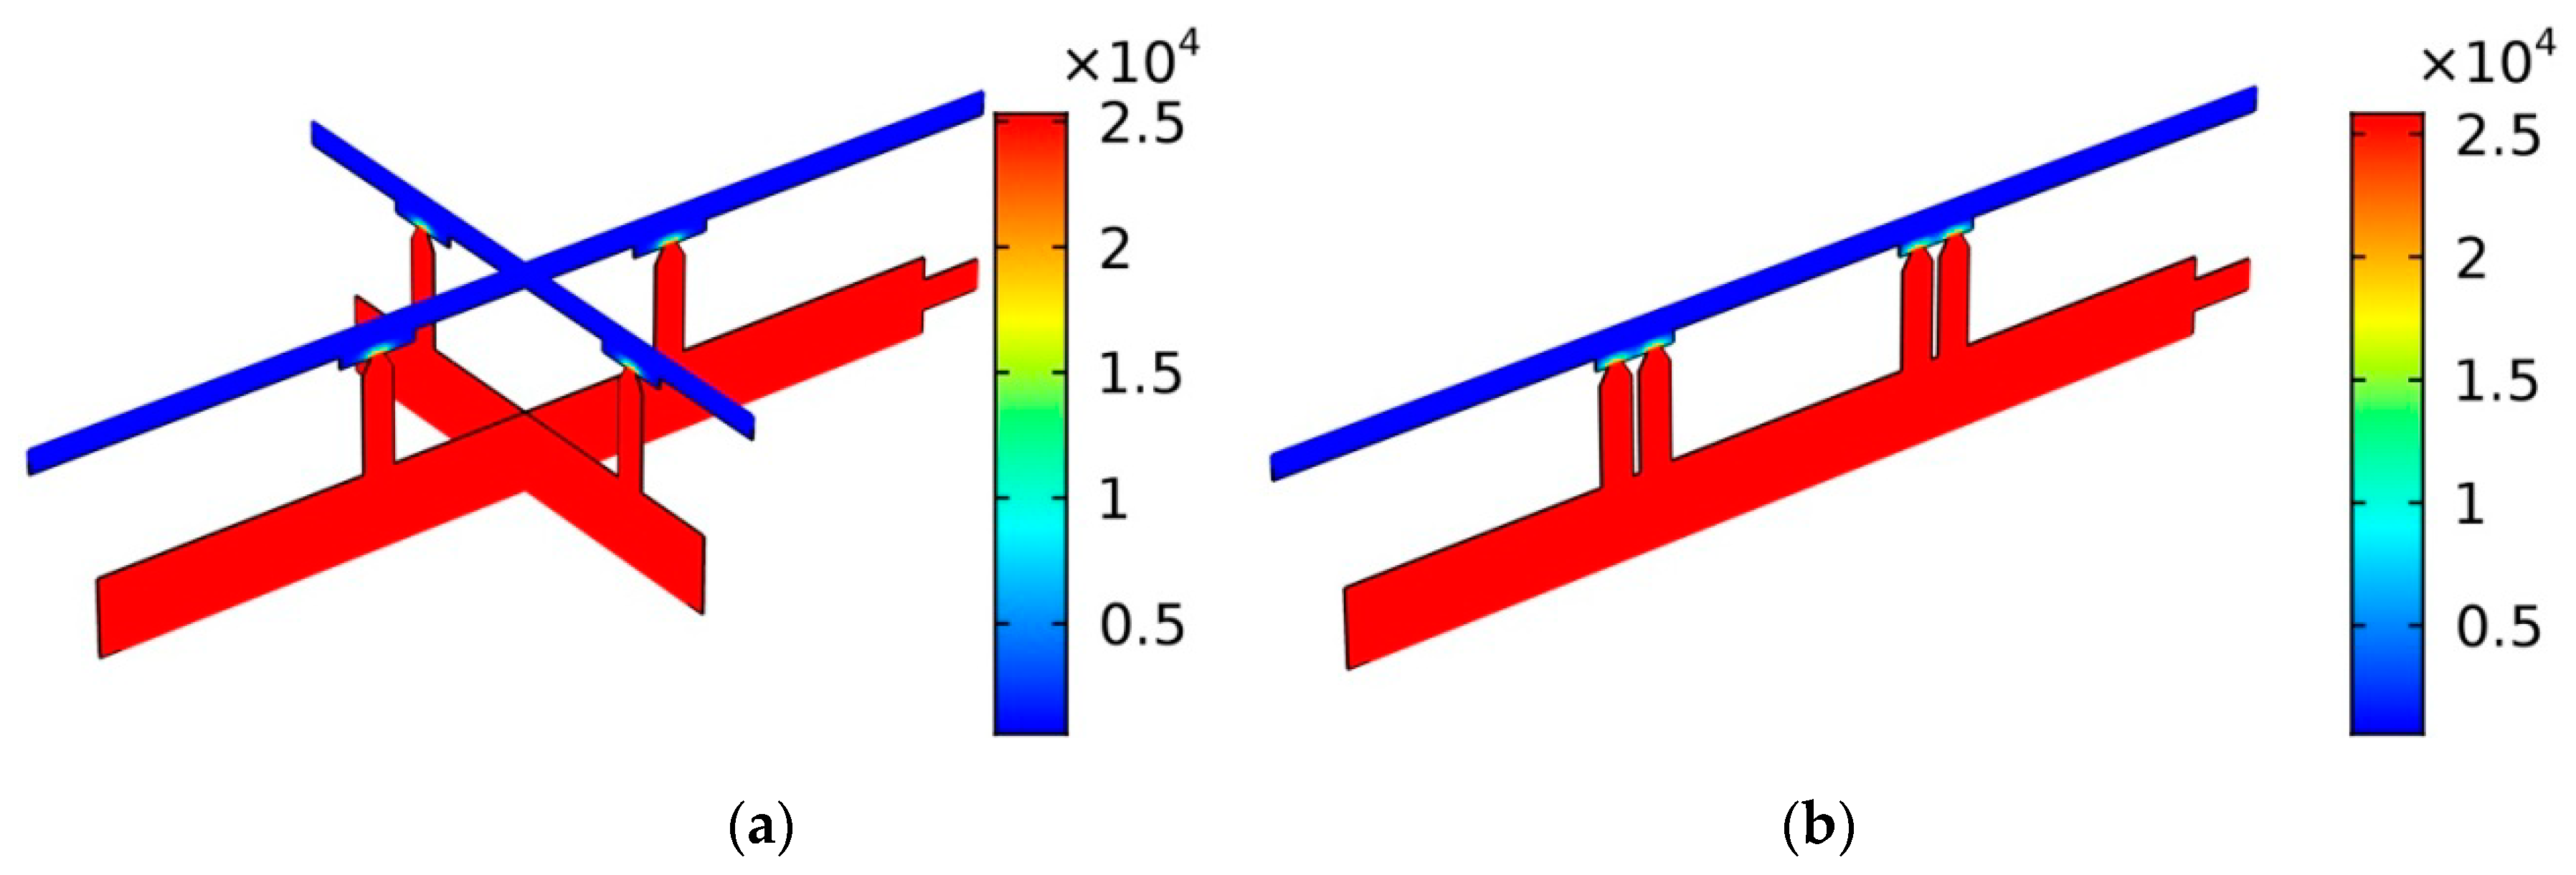
3.3. Impact of the Layout of the Orifice on the CIS
3.4. Impact of the Structure Parameters of the Orifice on the CIS
3.5. Data Validity
4. Conclusions
- 1)
- There are turning points in the influence curve of the porous-substrate physical parameters on the FW pressure. The SSPD’s pore diameter and porosity should be below the value of the turning point in order to control the FD’s pressure. On the contrary, the value of the PAFS’s pore diameter and porosity should be larger than that of the turning point, so as to reduce the influence on pressure, increase the pore size and improve the contaminant insensitivity of CIS.
- 2)
- The variation of the FW’s dynamic viscosity has a significant influence on the FW’s pressure, which should be considered when the CIS is designed and used. For example, we can choose an appropriate control strategy to control the flow rate to compensate for the change in viscosity.
- 3)
- The pressure drop of the FD loop mainly occurs in the SSPD, which fully demonstrate the SSPD’s control effect on the FW’s pressure. The pressure uniformity coefficients on the AFPS’s bottom surfaces are 0.853612673 and 0.842104398 in the two CIS’s layout respectively. At the same time, the temperature uniformity coefficients on the same sections are 0.997669 and 0.997571. These results show that CIS have excellent temperature uniformity and pressure uniformity, but the effect of pressure on the ice breakthrough needs to be noted.
- 4)
- The cone height of the orifice has a great influence on the FW pressure and the compensation coefficient. The selection of cone height should ensure that sublimation occurs in PAFS, and take into account the running power of the FW loop.
Author Contributions
Funding
Conflicts of Interest
References
- Singer, J.; Pelfrey, J.; Norris, G. Enabling Science and Deep Space Exploration Through Space Launch System Secondary Payload Opportunities. In Proceedings of the SpaceOps 2016 Conference, Kaejeon, Korea, 16–20 May 2016. [Google Scholar] [CrossRef]
- Lapointe, M.R.; Mikellides, P.G.; Reddy, D. High Power MPD Thruster Development at the NASA Glenn Research Center. In AIAA 2001-3499, 37th Joint Propulsion Conference and Exhibit, Salt Lake City, UT, USA; AIAA: Reston, VA, USA. [CrossRef]
- Tang, D.; Xiao, H.; Kong, F.; Deng, Z.; Jiang, S.; Quan, Q. Thermal Analysis of the Driving Component Based on the Thermal Network Method in a Lunar Drilling System and Experimental Verification. Energies 2017, 10, 355. [Google Scholar] [CrossRef]
- Tian, Y.; Deng, Z.-Q.; Tang, D.-W.; Chen, J.-K. Drilling Power Consumption Analysis of Coring Bit in Lunar Sample Mission. J. Aerosp. Eng. 2017, 30, 04017055. [Google Scholar] [CrossRef]
- Kobrick, R.L.; Agui, J.H. Preparing for planetary surface exploration by measuring habitat dust intrusion with filter tests during an analogue Mars mission. Acta Astronaut. 2019, 160, 297–309. [Google Scholar] [CrossRef]
- Xu, H.; Wang, J.; Li, Y.; Bi, Y.; Gao, L. A Thermoelectric-Heat-Pump Employed Active Control Strategy for the Dynamic Cooling Ability Distribution of Liquid Cooling System for the Space Station’s Main Power-Cell-Arrays. Entropy 2019, 21, 578. [Google Scholar] [CrossRef]
- Piedra, S.; Torres, M.; Ledesma, S. Thermal Numerical Analysis of the Primary Composite Structure of a CubeSat. Aerospace 2019, 6, 97. [Google Scholar] [CrossRef]
- Gadalla, M.; Ghommem, M.; Bourantas, G.; Miller, K. Modeling and Thermal Analysis of a Moving Spacecraft Subject to Solar Radiation Effect. Processes 2019, 7, 807. [Google Scholar] [CrossRef]
- Skoog, A.I.; Abramov, I.P.; Stoklitsky, A.Y.; Doodnik, M.N. The Soviet-Russian space suits a historical overview of the 1960’s. Acta Astronaut. 2002, 51, 113–131. [Google Scholar] [CrossRef]
- Bagiorgas, H.S.; Mihalakakou, G. Experimental and theoretical investigation of a nocturnal radiator for space cooling. Renew. Energy 2008, 33, 1220–1227. [Google Scholar] [CrossRef]
- Roy, S.K.; Avanic, B.L. Optimization of a space radiator with energy storage. Int. Commun. Heat Mass Transf. 2006, 33, 544–551. [Google Scholar] [CrossRef]
- Cuco, A.P.C.; de Sousa, F.L.; Vlassov, V.V.; da Silva Neto, A.J. Multi-objective design optimization of a new space radiator. Optim. Eng. 2011, 12, 393–406. [Google Scholar] [CrossRef]
- Zhong, M.-L.; Li, Y.-Z.; Guo, W.; Wang, S.-N.; Mao, Y.-F. Dynamic in-loop performance investigation and efficiency-cost analysis of dual heat sink thermal control system (DHS-TCS) with a sublimator for aerospace vehicles. Appl. Therm. Eng. 2017, 121, 562–575. [Google Scholar] [CrossRef]
- Metts, J.G.; Klaus, D.M. First-order feasibility analysis of a space suit radiator concept based on estimation of water mass sublimation using Apollo mission data. Adv. Space Res. 2012, 49, 204–212. [Google Scholar] [CrossRef]
- Moller, P.; Loewens, R.; Abramov, I.P.; Albats, E.A. EVA Suit 2000: A joint European/Russian space suit design. Acta Astronaut. 1995, 36, 53–63. [Google Scholar] [CrossRef]
- Skoog, A.I.; Abramov, I.P. EVA 2000: A European/Russian space suit concept. Acta Astronaut. 1995, 36, 35–51. [Google Scholar] [CrossRef]
- Planert, C.; Kremer, P.; Witt, J. Development of Sublimator Technology for the European EVA Space Suit. In Proceedings of the 21st International Conference on Environmental Systems, San Francisco, CA, USA, 15–18 July 1991; Technical Paper 911577. SAE: Warrendale, PA, USA, 1991. [Google Scholar] [CrossRef]
- Tongue, S.; Swartley, V.; Dingell, C. The Porous Plate Sublimator as the X-38/CRV(Crew Return Vehicle) Orbital Heat Sink. In Proceedings of the 27th International Conference on Environmental Systems, Lake Tahoe, NV, USA, 14–17 July 1997; SAE Technical Paper 972411. SAE: Warrendale, PA, USA, 1997. [Google Scholar] [CrossRef]
- Tongue, S.; Dingell, C. The Porous Plate Sublimator as the X-38/CRV (Crew Return Vehicle) Orbital Heat Sink. In Proceedings of the 27th International Conference on Environmental Systems, Denver, CO, USA, 12–15 July 1999; SAE Technical Paper 1999-01-2004. SAE: Warrendale, PA, USA, 1999. [Google Scholar] [CrossRef]
- Leimkuehler, T.; Anderson, M.; Westheimer, D. Development of a Contaminant Insensitive Sublimator. In Proceedings of the 36th International Conference on Environmental Systems, Norfolk, VA, USA, 17–20 July 2006; SAE Technical Paper 2006-01-2217. SAE: Warrendale, PA, USA, 2006. [Google Scholar] [CrossRef]
- Leimkuehler, T.; Stephan, R. Development and Testing of the Contaminant Insensitive Sublimator. In Proceedings of the 37th International Conference on Environmental Systems, Chicago, IL, USA, 9–12 July 2006; SAE Technical Paper 2007-01-3203. SAE: Warrendale, PA, USA, 2006. [Google Scholar] [CrossRef]
- Leimkuehler, T.; Abounasr, O.; Stephan, R. Design of a Sublimator Driven Coldplate Development Unit. SAE Int. J. Aerosp. 2009, 1, 532–536. [Google Scholar] [CrossRef]
- Sheth, R.; Stephan, R.; Leimkuehler, T. Testing and Model Correlation of Sublimator Driven Coldplate Coupons and EDU; SAE Technical Paper 2009-01-2479; SAE: Warrendale, PA, USA, 2009. [Google Scholar] [CrossRef]
- Leimkuehler, T.; Sheth, R.; Stephan, R. Investigation of Transient Sublimator Performance. In Proceedings of the 39th International Conference on Environmental Systems, Savannah, GA, USA, 12–16 July 2009; SAE Technical Paper 2009-01-2480. SAE: Warrendale, PA, USA, 2009. [Google Scholar] [CrossRef]
- Sheth, R.; Stephan, R.; Leimkuehler, T. Experimental Investigation of Sublimator Performance at Transient Heat Loads. In Proceedings of the 42nd International Conference on Environmental Systems, San Diego, CA, USA, 15–19 July 2012. [Google Scholar] [CrossRef]
- Sheth, R.B.; Stephan, R.A.; Leimkuehler, T.O. Sublimator Driven Coldplate Engineering Development Unit Test Results. In Proceedings of the 40th International Conference on Environmental Systems, Barcelona, Spain, 11–15 July 2010. [Google Scholar] [CrossRef]
- Sheth, R.B.; Stephan, R.A.; Leimkuehler, T.O. Investigation of Transient Performance for a Sublimator. In Proceedings of the 40th International Conference on Environmental Systems, Barcelona, Spain, 11–15 July 2010. [Google Scholar] [CrossRef][Green Version]
- Leimkuehler, T.; Kennedy, S. An Integrated Sublimator Driven Coldplate. In Proceedings of the 41st International Conference on Environmental Systems, Portland, OR, USA, 17–21 July 2011. [Google Scholar] [CrossRef]
- Wang, Y.Y.; Zhong, Q.; Li, J.D.; Ning, X.W. Numerical and experimental study on the heat and mass transfer of porous plate water sublimator with constant heat flux boundary condition. Appl. Therm. Eng. 2014, 67, 469–479. [Google Scholar] [CrossRef]
- Tan, X.; Chen, W.; Wu, G.; Yang, J. Numerical simulations of heat transfer with ice–water phase change occurring in porous media and application to a cold-region tunnel. Tunn. Undergr. Space Technol. 2013, 38, 170–179. [Google Scholar] [CrossRef]
- Huang, P.C.; Yang, C.F.; Chang, S.-Y. Mixed Convection Cooling of Heat Sources Mounted with Porous Blocks. J. Thermophys. Heat Transf. 2004, 18, 464–475. [Google Scholar] [CrossRef]
- Kolunin, V.S. Heat and mass transfer in porous media with ice inclusions near the freezing-point. Int. J. Heat Mass Transf. 2005, 48, 1175–1185. [Google Scholar] [CrossRef]
- Tan, X.; Chen, W.; Tian, H.; Cao, J. Water flow and heat transport including ice/water phase change in porous media: Numerical simulation and application. Cold Reg. Sci. Technol. 2011, 68, 74–84. [Google Scholar] [CrossRef]
- Wang, W.; Yang, J.; Hu, D.; Pan, Y.; Wang, S.; Chen, G. Experimental and numerical investigations on freeze-drying of porous media with prebuilt porosity. Chem. Phys. Lett. 2018, 700, 80–87. [Google Scholar] [CrossRef]
- Ganguly, S. Exact Solution of Heat Transport Equation for a Heterogeneous Geothermal Reservoir. Energies 2018, 11, 2935. [Google Scholar] [CrossRef]
- Deng, Z.; Liu, X.; Huang, Y.; Zhang, C.; Chen, Y. Heat Conduction in Porous Media Characterized by Fractal Geometry. Energies 2017, 10, 1230. [Google Scholar] [CrossRef]
- Hanlon, M.; Ma, H. Evaporation Heat Transfer in Sintered Porous Media. In Proceedings of the 8th AIAA/ASME Joint Thermophysics and Heat Transfer Conference, St. Louis, MI, USA, 24–26 June 2002. [Google Scholar] [CrossRef]
- Siahpush, A.; O’Brien, J. Heat Transfer Performance of a Porous Metal Foam/Phase Change Material System, Part 2: Melting. In Proceedings of the 9th AIAA/ASME Joint Thermophysics and Heat Transfer Conference, San Francisco, CA, USA, 5–8 June 2006. [Google Scholar] [CrossRef]
- Wang, Z.H.; Shi, M.H. Numerical study on sublimation–condensation phenomena during microwave freeze drying. Chem. Eng. Sci. 1998, 53, 3189–3197. [Google Scholar] [CrossRef]
- Wu, D.; Lai, Y.; Zhang, M. Heat and mass transfer effects of ice growth mechanisms in a fully saturated soil. Int. J. Heat Mass Transf. 2015, 86, 699–709. [Google Scholar] [CrossRef]
- Rattanadecho, P. Simulation of melting of ice in a porous media under multiple constant temperature heat sources using a combined transfinite interpolation and PDE methods. Chem. Eng. Sci. 2006, 61, 4571–4581. [Google Scholar] [CrossRef]
- Wu, H.; Tao, Z.; Chen, G.; Deng, H.; Xu, G.; Ding, S. Conjugate heat and mass transfer process within porous media with dielectric cores in microwave freeze drying. Chem. Eng. Sci. 2004, 59, 2921–2928. [Google Scholar] [CrossRef]
- Lei, G.; Cao, N.; Liu, D.; Wang, H. A Non-Linear Flow Model for Porous Media Based on Conformable Derivative Approach. Energies 2018, 11, 2986. [Google Scholar] [CrossRef]
- Yu, S.; Cui, Y.; Shao, Y.; Han, F. Simulation Research on the Effect of Coupled Heat and Moisture Transfer on the Energy Consumption and Indoor Environment of Public Buildings. Energies 2019, 12, 141. [Google Scholar] [CrossRef]
- Cai, J.; Sun, S.; Habibi, A.; Zhang, Z. Emerging Advances in Petrophysics: Porous Media Characterization and Modeling of Multiphase Flow. Energies 2019, 12, 282. [Google Scholar] [CrossRef]
- Warning, A.D.; Arquiza, J.M.R.; Datta, A.K. A multiphase porous medium transport model with distributed sublimation front to simulate vacuum freeze drying. Food Bioprod. Process. 2015, 94, 637–648. [Google Scholar] [CrossRef]
- Farid, M. The moving boundary problems from melting and freezing to drying and frying of food. Chem. Eng. Process. 2002, 41, 1–10. [Google Scholar] [CrossRef]
- Leung, M.; Ching, W.H.; Leung, D.Y.C.; Lam, G.C.K. Theoretical study of heat transfer with moving phase-change interface in thawing of frozen food. J. Phys. D Appl. Phys. 2005, 38, 477–482. [Google Scholar] [CrossRef]
- Rattanadecho, P.; Wongwises, S. Simulation of freezing of water-saturated porous media in a rectangular cavity under multiple heat sources with different temperature using a combined transfinite interpolation and PDE methods. Comput. Chem. Eng. 2007, 31, 318–333. [Google Scholar] [CrossRef]
- Nakagawa, K.; Ochiai, T. A mathematical model of multi-dimensional freeze-drying for food products. J. Food Eng. 2015, 161, 55–67. [Google Scholar] [CrossRef]
- Machrafi, H.; Lebon, G. Fluid flow through porous and nanoporous media within the prisme of extended thermodynamics: Emphasis on the notion of permeability. Microfluid. Nanofluid. 2018, 22, 65. [Google Scholar] [CrossRef]
- Wu, K.; Chen, Z.; Li, J.; Li, X.; Xu, J.; Dong, X. Wettability effect on nanoconfined water flow. Proc. Natl. Acad. Sci. USA 2017, 114, 3358–3363. [Google Scholar] [CrossRef]
- Tenpierik, M.; Wattez, Y.; Turrin, M.; Cosmatu, T.; Tsafou, S. Temperature Control in (Translucent) Phase Change Materials Applied in Facades: A Numerical Study. Energies 2019, 12, 3286. [Google Scholar] [CrossRef]
- Lei, X.; Zheng, X.; Duan, C.; Ye, J.; Liu, K. Three-Dimensional Numerical Simulation of Geothermal Field of Buried Pipe Group Coupled with Heat and Permeable Groundwater. Energies 2019, 12, 3698. [Google Scholar] [CrossRef]
- Nyallang Nyamsi, S.; Tolj, I.; Lototskyy, M. Metal Hydride Beds-Phase Change Materials: Dual Mode Thermal Energy Storage for Medium-High Temperature Industrial Waste Heat Recovery. Energies 2019, 12, 3949. [Google Scholar] [CrossRef]
- Zhu, P.; Peng, H.; Yang, J. Analyses of the Temperature Field of a Piezoelectric Micro Actuator in the Endoscopic Biopsy Channel. Appl. Sci. 2019, 9, 4499. [Google Scholar] [CrossRef]
- Ebrahimi, A.; Kleijn, C.; Richardson, I. Sensitivity of Numerical Predictions to the Permeability Coefficient in Simulations of Melting and Solidification Using the Enthalpy-Porosity Method. Energies 2019, 12, 4360. [Google Scholar] [CrossRef]


| - | Density (kg/m3) | Specific Heat (J/kg K) | Thermal Conductivity (W/m K) | Component |
|---|---|---|---|---|
| Stainless steel | 7930 | 500 | 17 | CP, FW cover, FW box, SSPD |
| Aluminum foam | 2700 | 896 | 180 | PAFS |
| Water | 1000 | 4212 | 0.551 | FW, WF |
| SSPD’s Porosity | SSPD’s Pore Size (µm) | PAFS’s Porosity | PAFS’s Pore Size (µm) |
|---|---|---|---|
| 0.1–0.8 | 15 | 0.3 | 200 |
| 0.3 | 5–40 | 0.3 | 200 |
| 0.3 | 15 | 0.1–0.8 | 200 |
| 0.3 | 15 | 0.3 | 50–350 |
| WF’s Viscosity (mPa/s) | WF’s Flow Rate (m/s) | FW Viscosity (mPa/s) | FW Inlet Pressure (KPa) |
|---|---|---|---|
| 0.9–1.4 | 0.761 | 1.0828 | 26 |
| 1.3077 | 0.6–0.9 | 1.0828 | 26 |
| 1.3077 | 0.761 | 0.8–1.3 | 26 |
| 1.3077 | 0.761 | 1.0828 | 24–28 |
| Cone Height (mm) | Cone Angle (°) | FW Inlet Flow Velocity (m/s) |
|---|---|---|
| 1.5-2-2.5-3 | 60 | 0.00283 |
| 2 | 20-30-40-50-60 | 0.00283 |
| Sections | Maximum Temperature (K) | Minimum Temperature (K) | Average Temperature (K) | Temperature Uniformity Coefficient |
|---|---|---|---|---|
| Section A1 | 273.9806398 | 273.3429304 | 273.5334432 | 0.997669 |
| Section A2 | 278.1846081 | 274.0394413 | 274.9725135 | 0.984925 |
| Section A3 | 288.7247784 | 275.5876286 | 278.3014317 | 0.952795 |
| Section B1 | 274.0029072 | 273.3385126 | 273.5240334 | 0.997571 |
| Section B2 | 277.4333061 | 274.0194208 | 274.9176216 | 0.987582 |
| Section B3 | 288.7316393 | 275.5344049 | 278.1660873 | 0.952556 |
| Sections | Maximum Temperature (K) | Minimum Temperature (K) | Average Temperature (K) | Pressure Uniformity Coefficient |
|---|---|---|---|---|
| Section A1 | 700.58955 | 610.9999994 | 612.0034769 | 0.853612673 |
| Section A2 | 25,328.703 | 862.8228082 | 25,094.28682 | 0.025041801 |
| Section B1 | 707.63275 | 611 | 612.0040322 | 0.842104398 |
| Section B2 | 25,866.459 | 927.8483014 | 25,357.44003 | 0.016517032 |
© 2019 by the authors. Licensee MDPI, Basel, Switzerland. This article is an open access article distributed under the terms and conditions of the Creative Commons Attribution (CC BY) license (http://creativecommons.org/licenses/by/4.0/).
Share and Cite
Gao, L.; Li, Y.; Xu, H.; Zhang, X.; Yuan, M.; Ning, X. Numerical Investigation on Heat-Transfer and Hydromechanical Performance inside Contaminant-Insensitive Sublimators under a Vacuum Environment for Spacecraft Applications. Energies 2019, 12, 4562. https://doi.org/10.3390/en12234562
Gao L, Li Y, Xu H, Zhang X, Yuan M, Ning X. Numerical Investigation on Heat-Transfer and Hydromechanical Performance inside Contaminant-Insensitive Sublimators under a Vacuum Environment for Spacecraft Applications. Energies. 2019; 12(23):4562. https://doi.org/10.3390/en12234562
Chicago/Turabian StyleGao, Lijun, Yunze Li, Huijuan Xu, Xin Zhang, Man Yuan, and Xianwen Ning. 2019. "Numerical Investigation on Heat-Transfer and Hydromechanical Performance inside Contaminant-Insensitive Sublimators under a Vacuum Environment for Spacecraft Applications" Energies 12, no. 23: 4562. https://doi.org/10.3390/en12234562
APA StyleGao, L., Li, Y., Xu, H., Zhang, X., Yuan, M., & Ning, X. (2019). Numerical Investigation on Heat-Transfer and Hydromechanical Performance inside Contaminant-Insensitive Sublimators under a Vacuum Environment for Spacecraft Applications. Energies, 12(23), 4562. https://doi.org/10.3390/en12234562