Novel Proposal for Prediction of CO2 Course and Occupancy Recognition in Intelligent Buildings within IoT


Abstract
:
1. Introduction
2. Materials and Methods
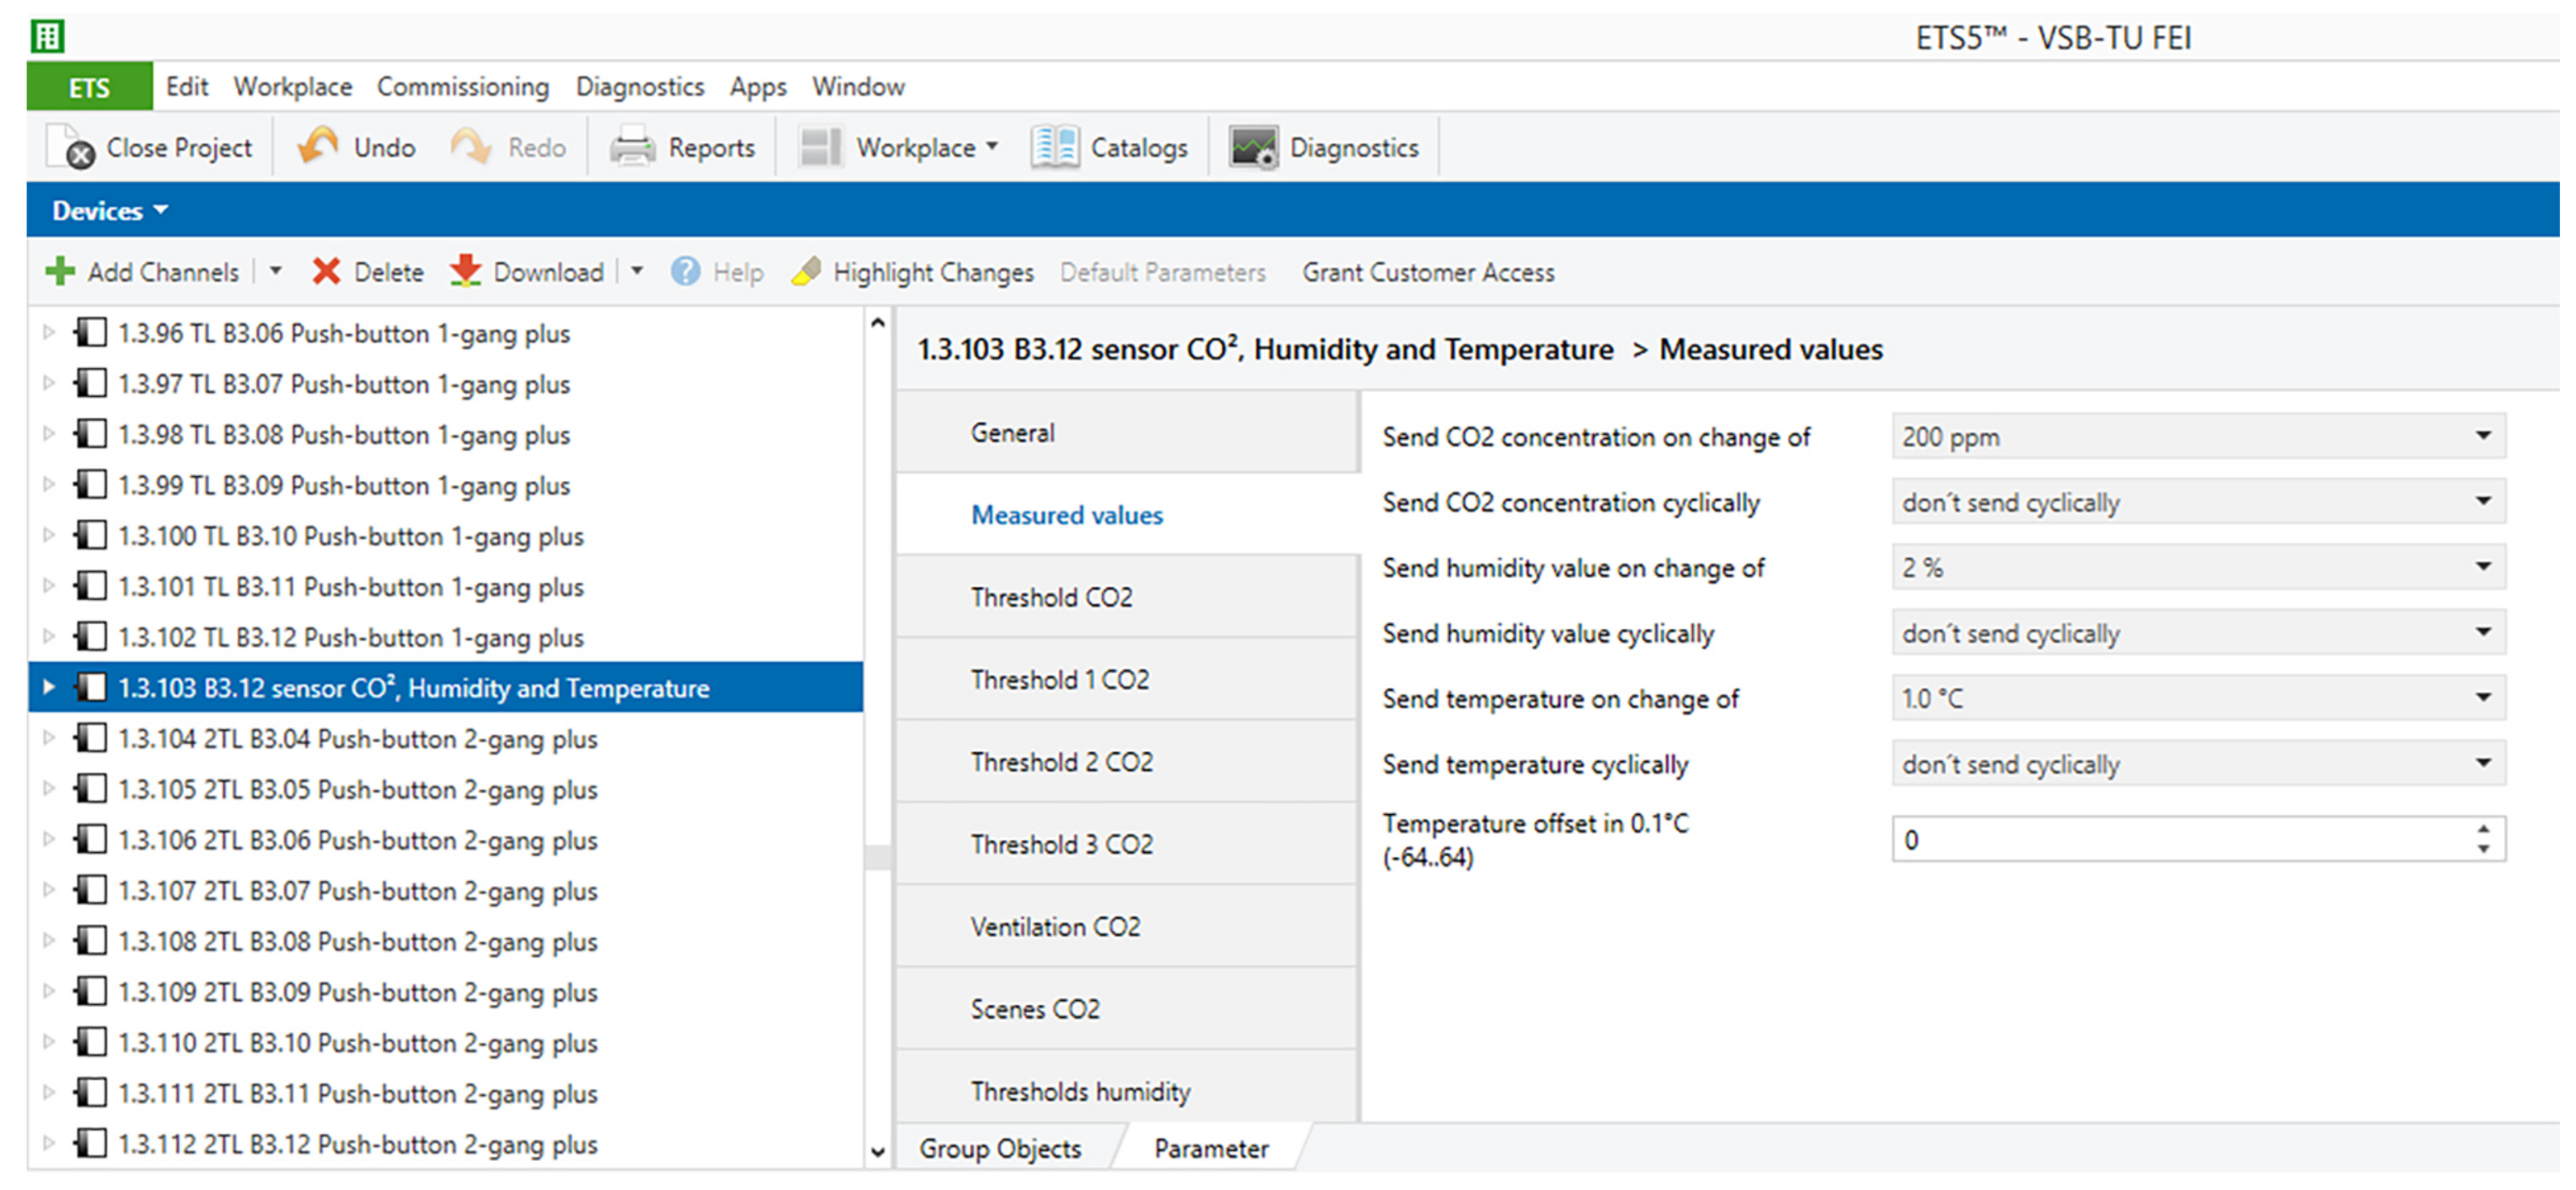
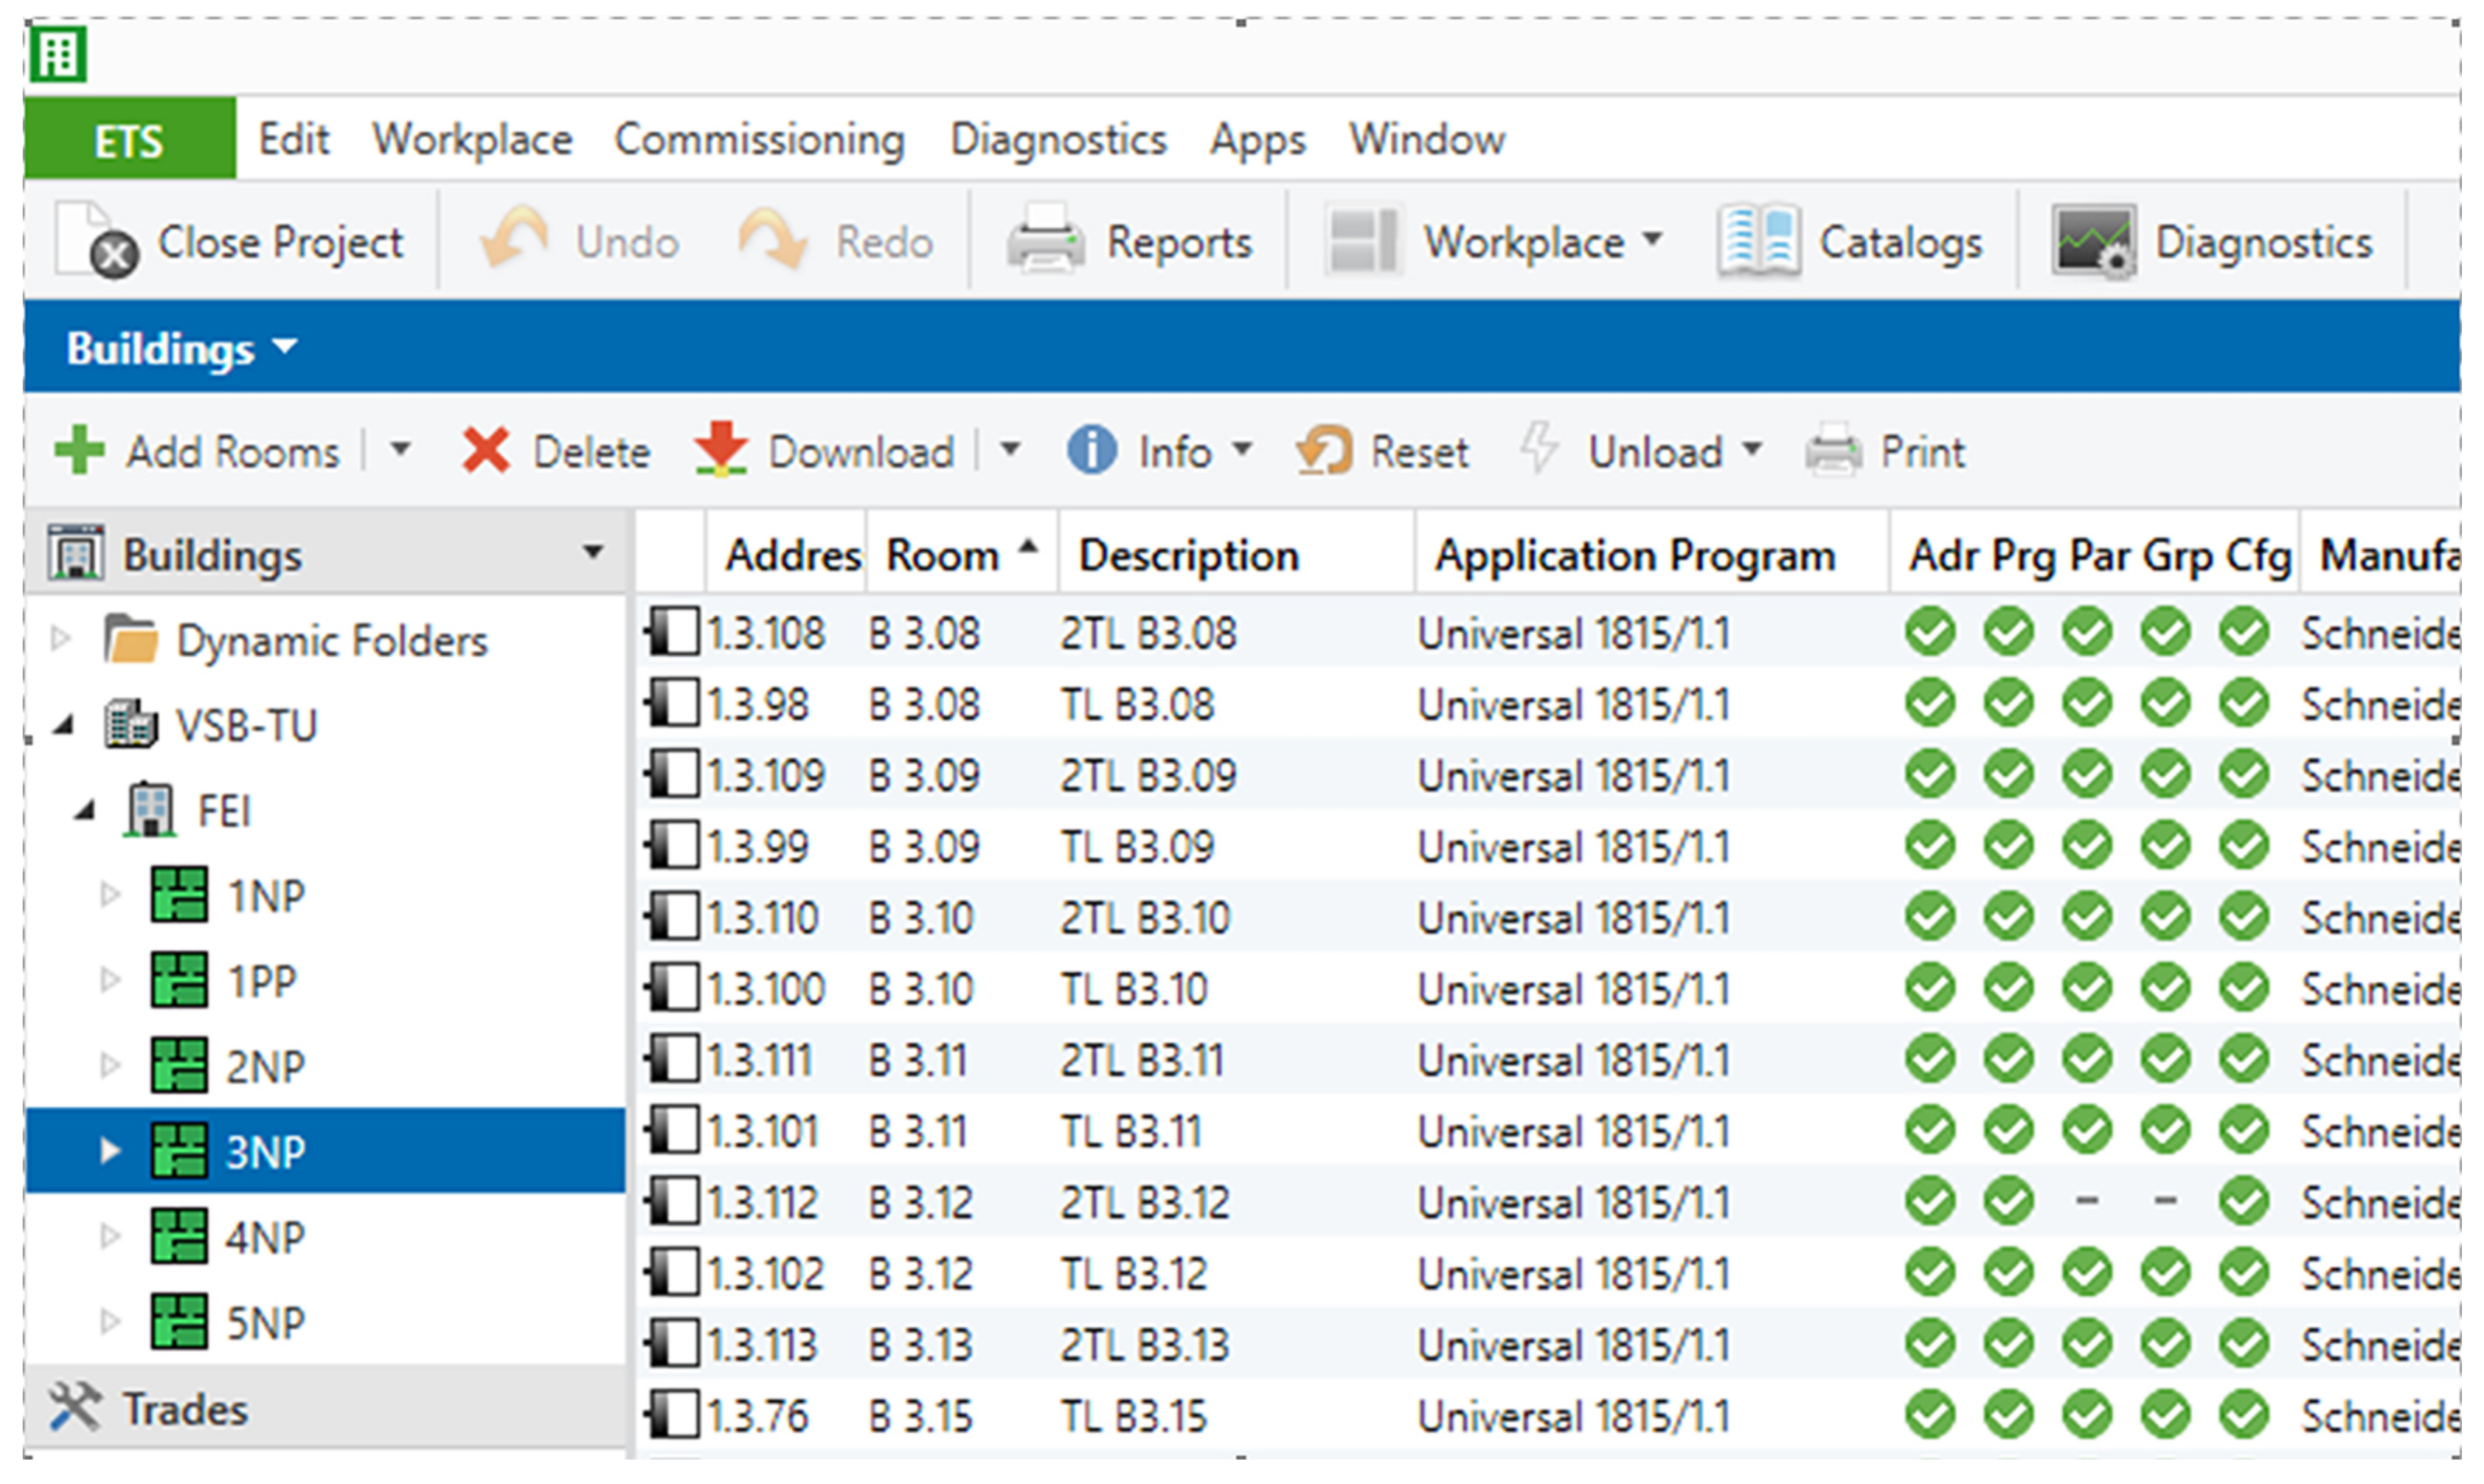
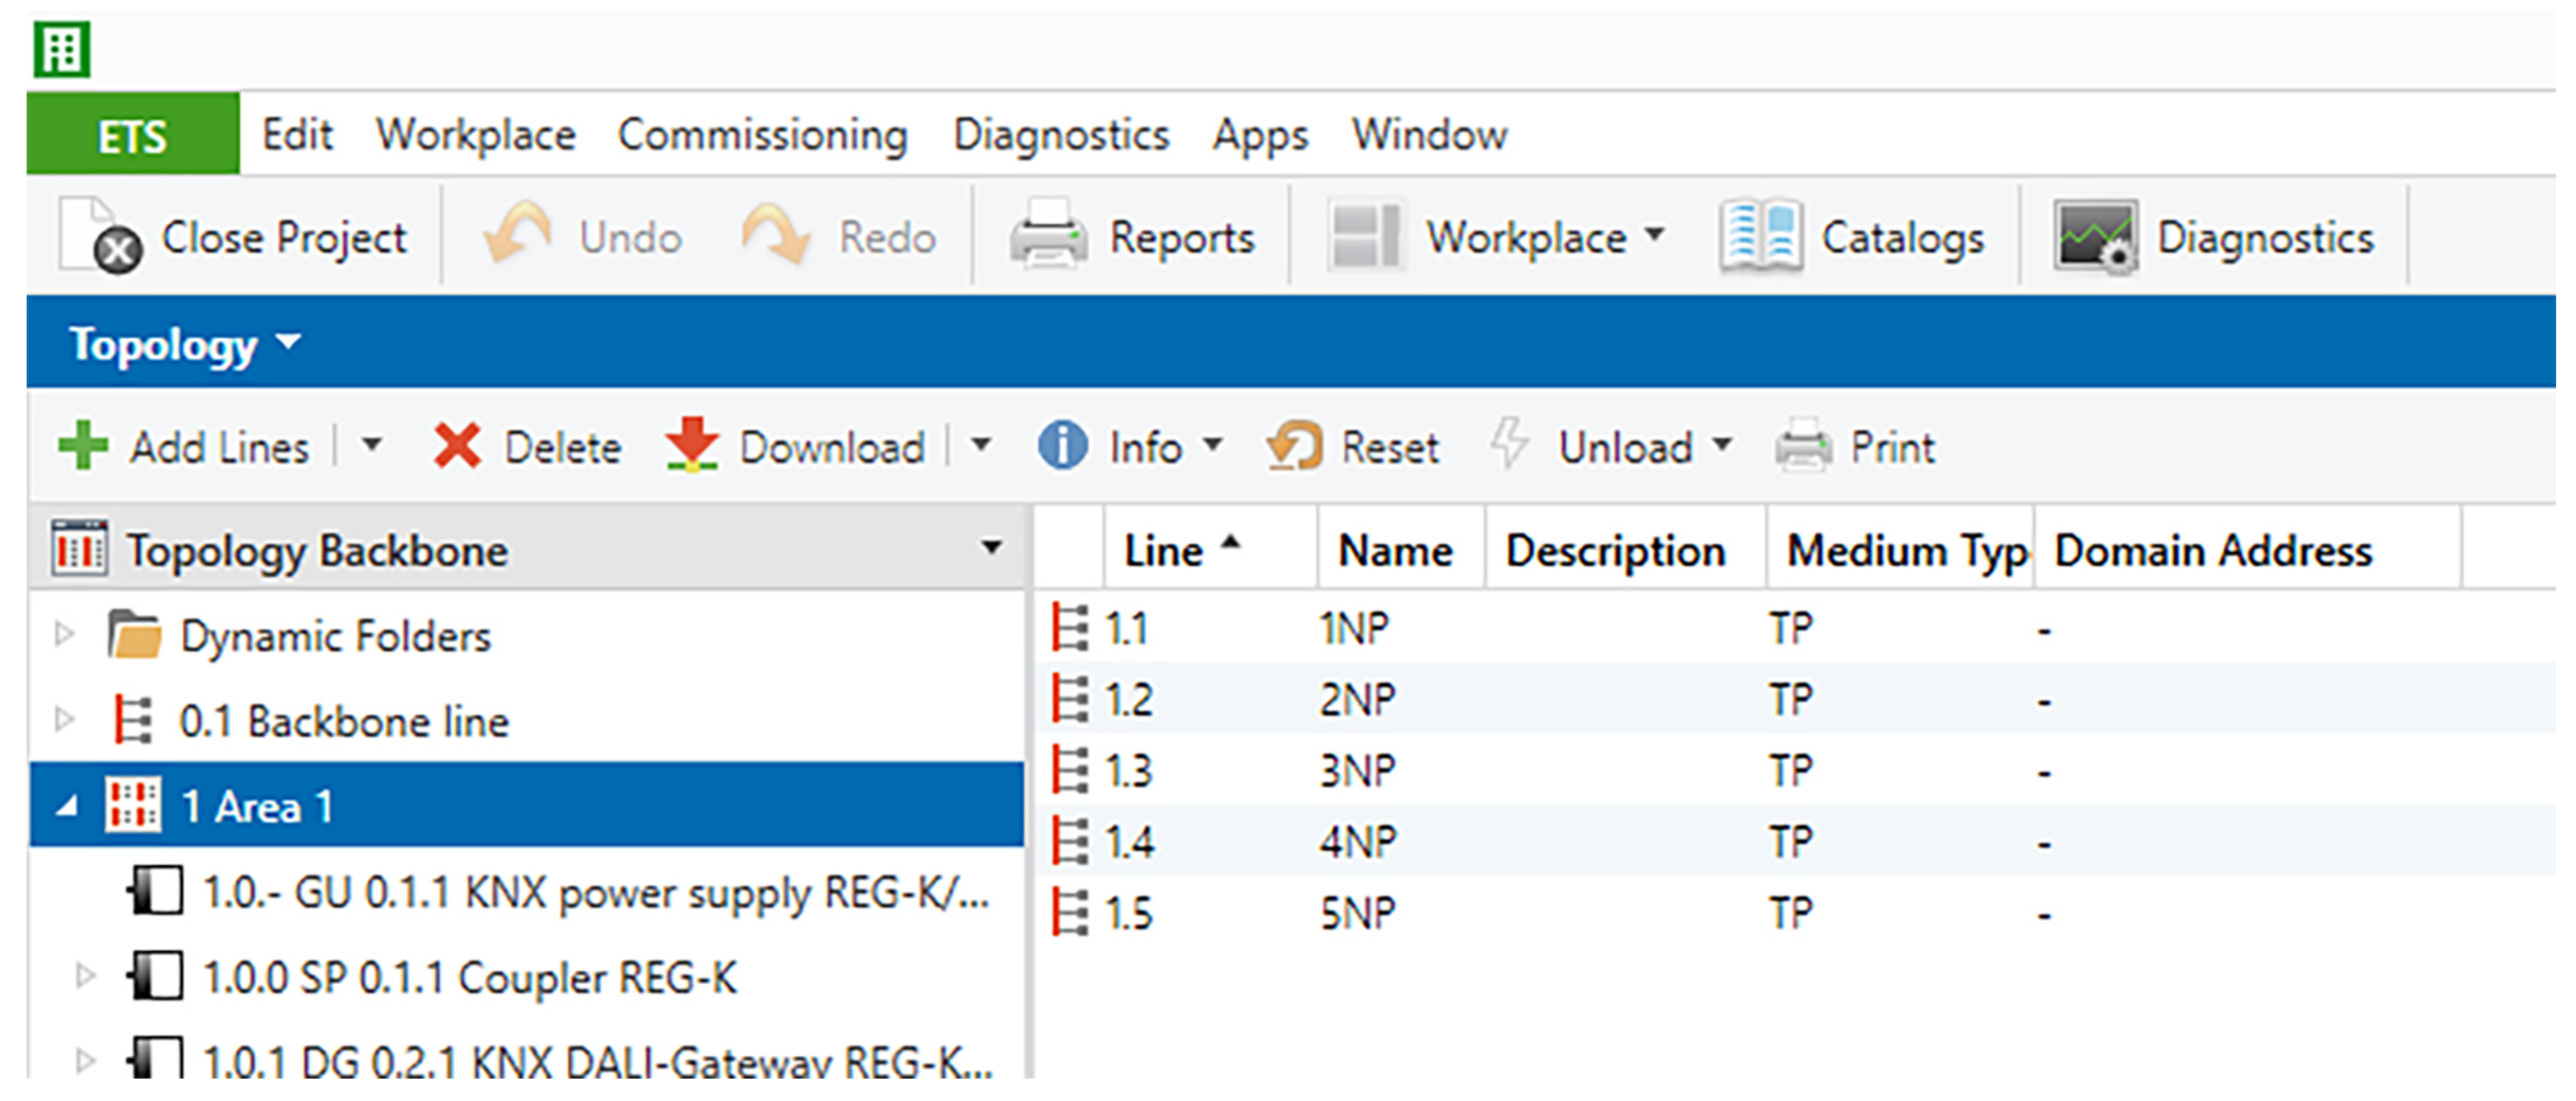
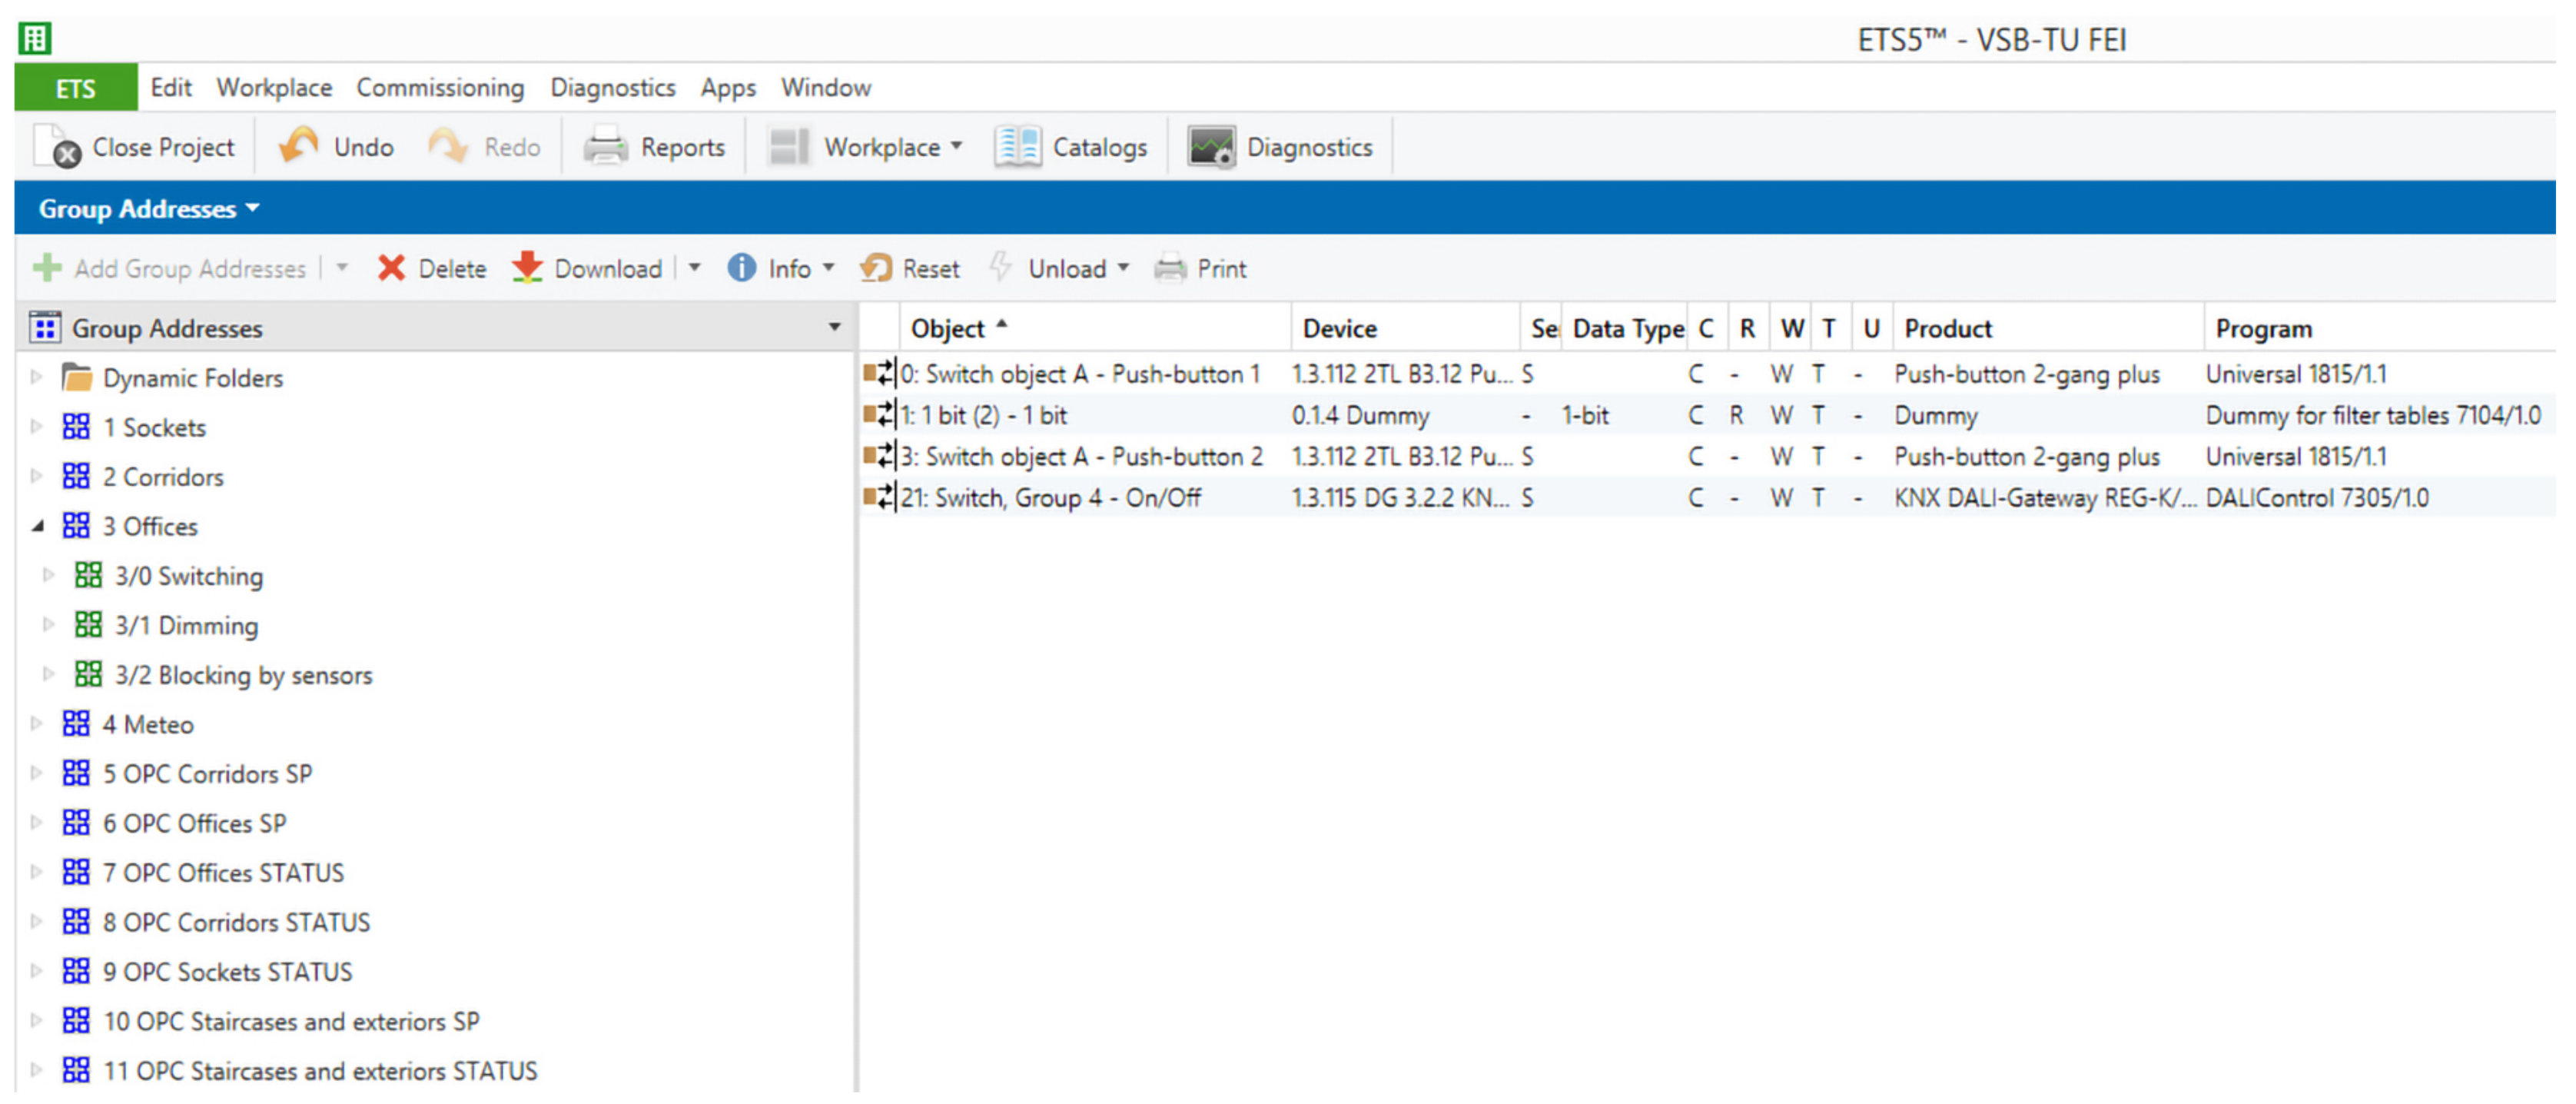
2.1. Building Automation—KNX Technology
2.2. Predictive Analysis
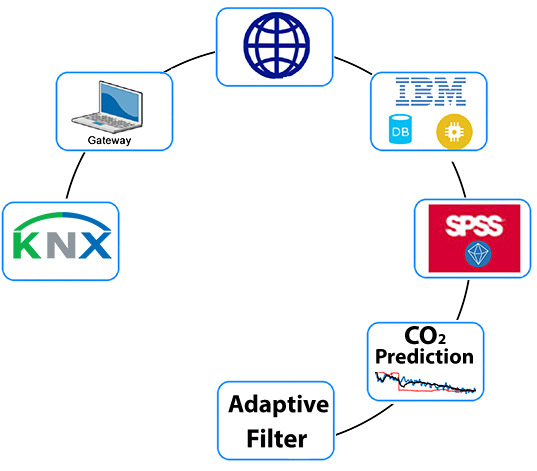
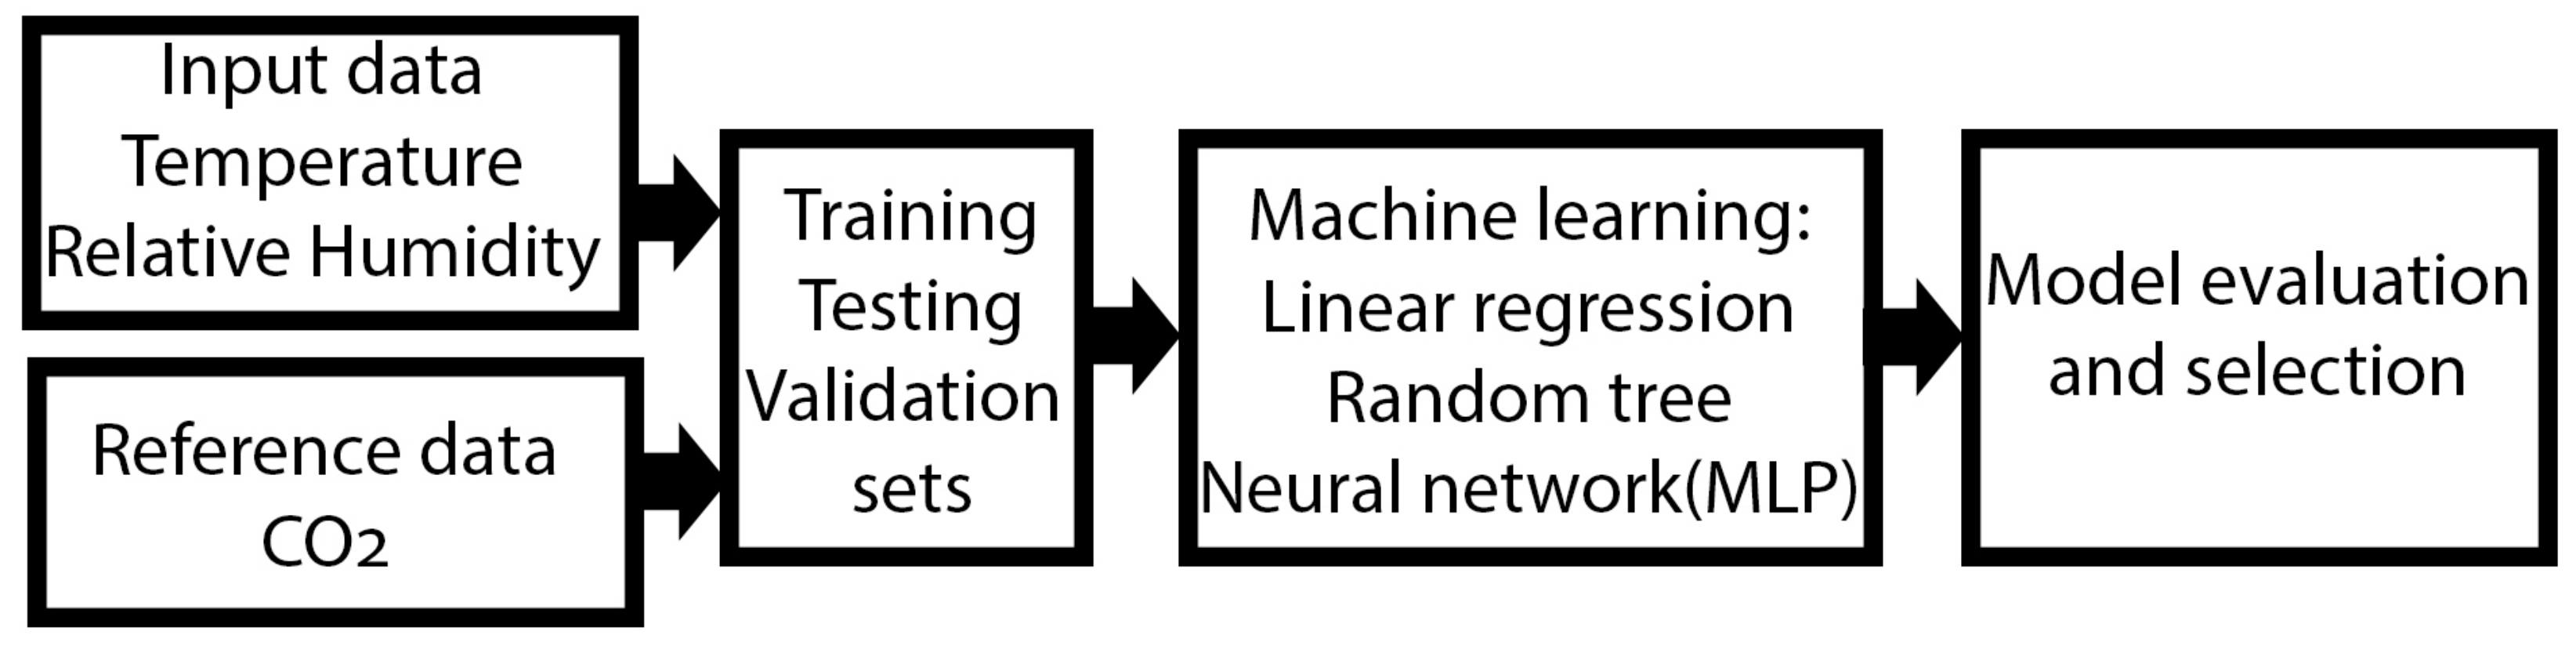
- Data collection
- Pre-processing of the collected data
- Predictions using IBM SPSS
- Evaluation and comparison of the obtained results
2.2.1. Linear Regression (LR)
2.2.2. Random Tree (RT)
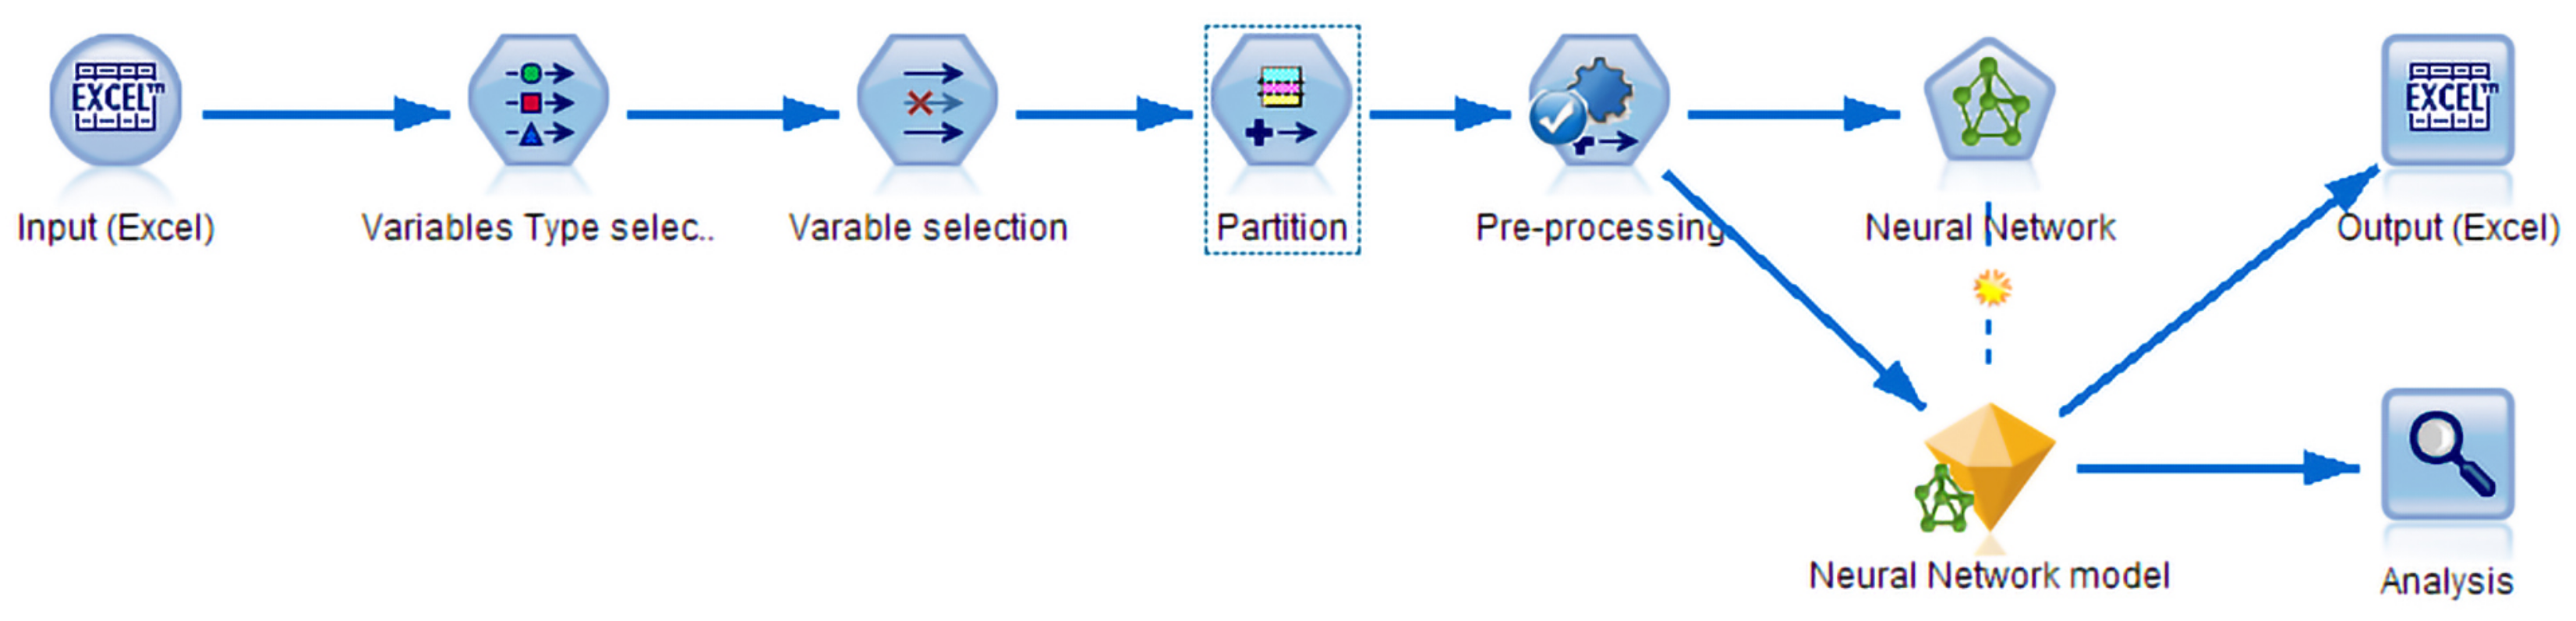
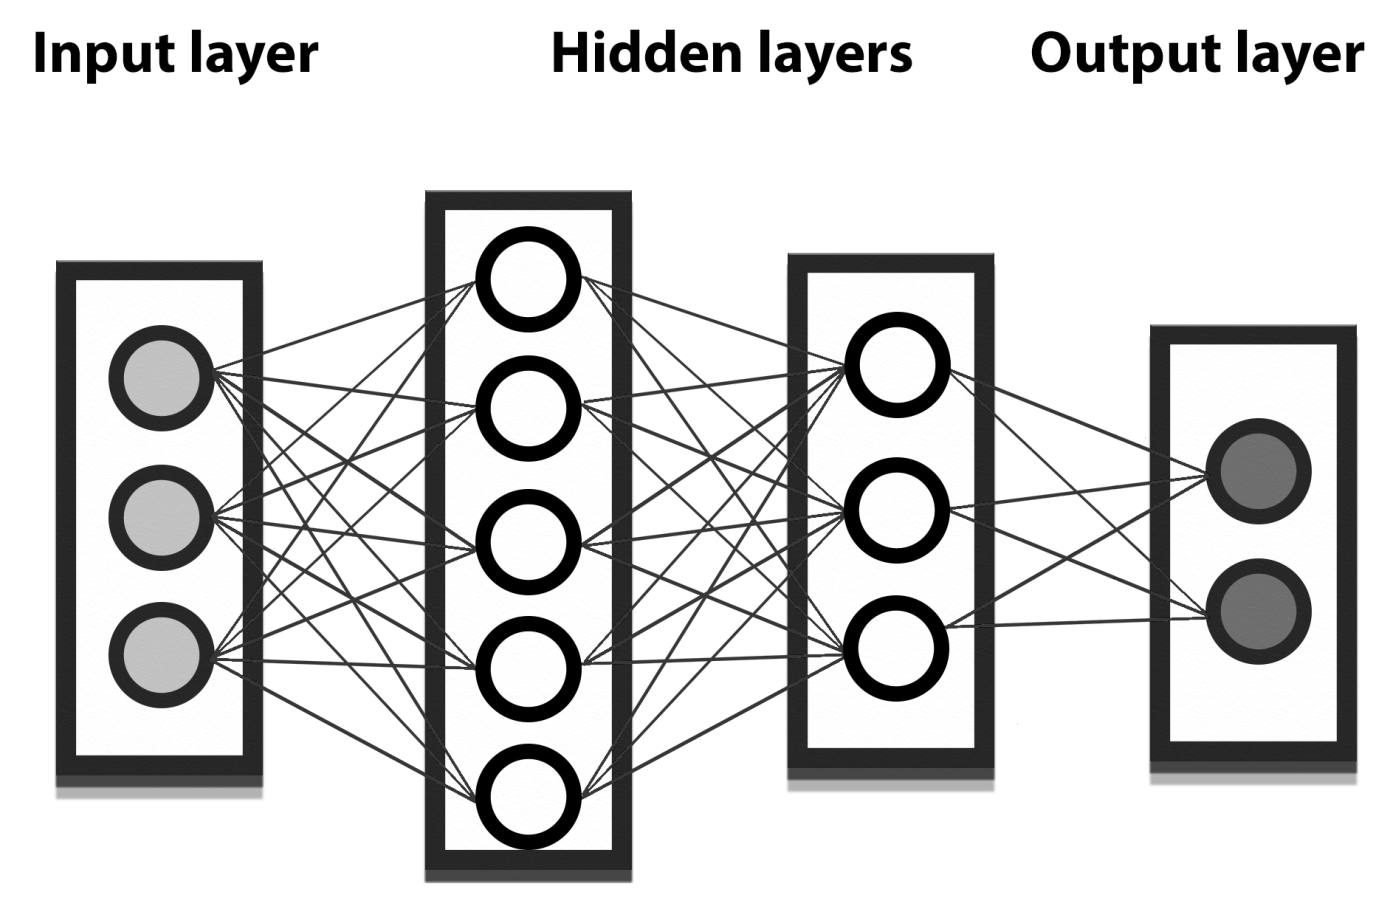
2.2.3. Multilayer Perceptron (MLP) Neural Network (NN)
2.2.4. Evaluation Methods
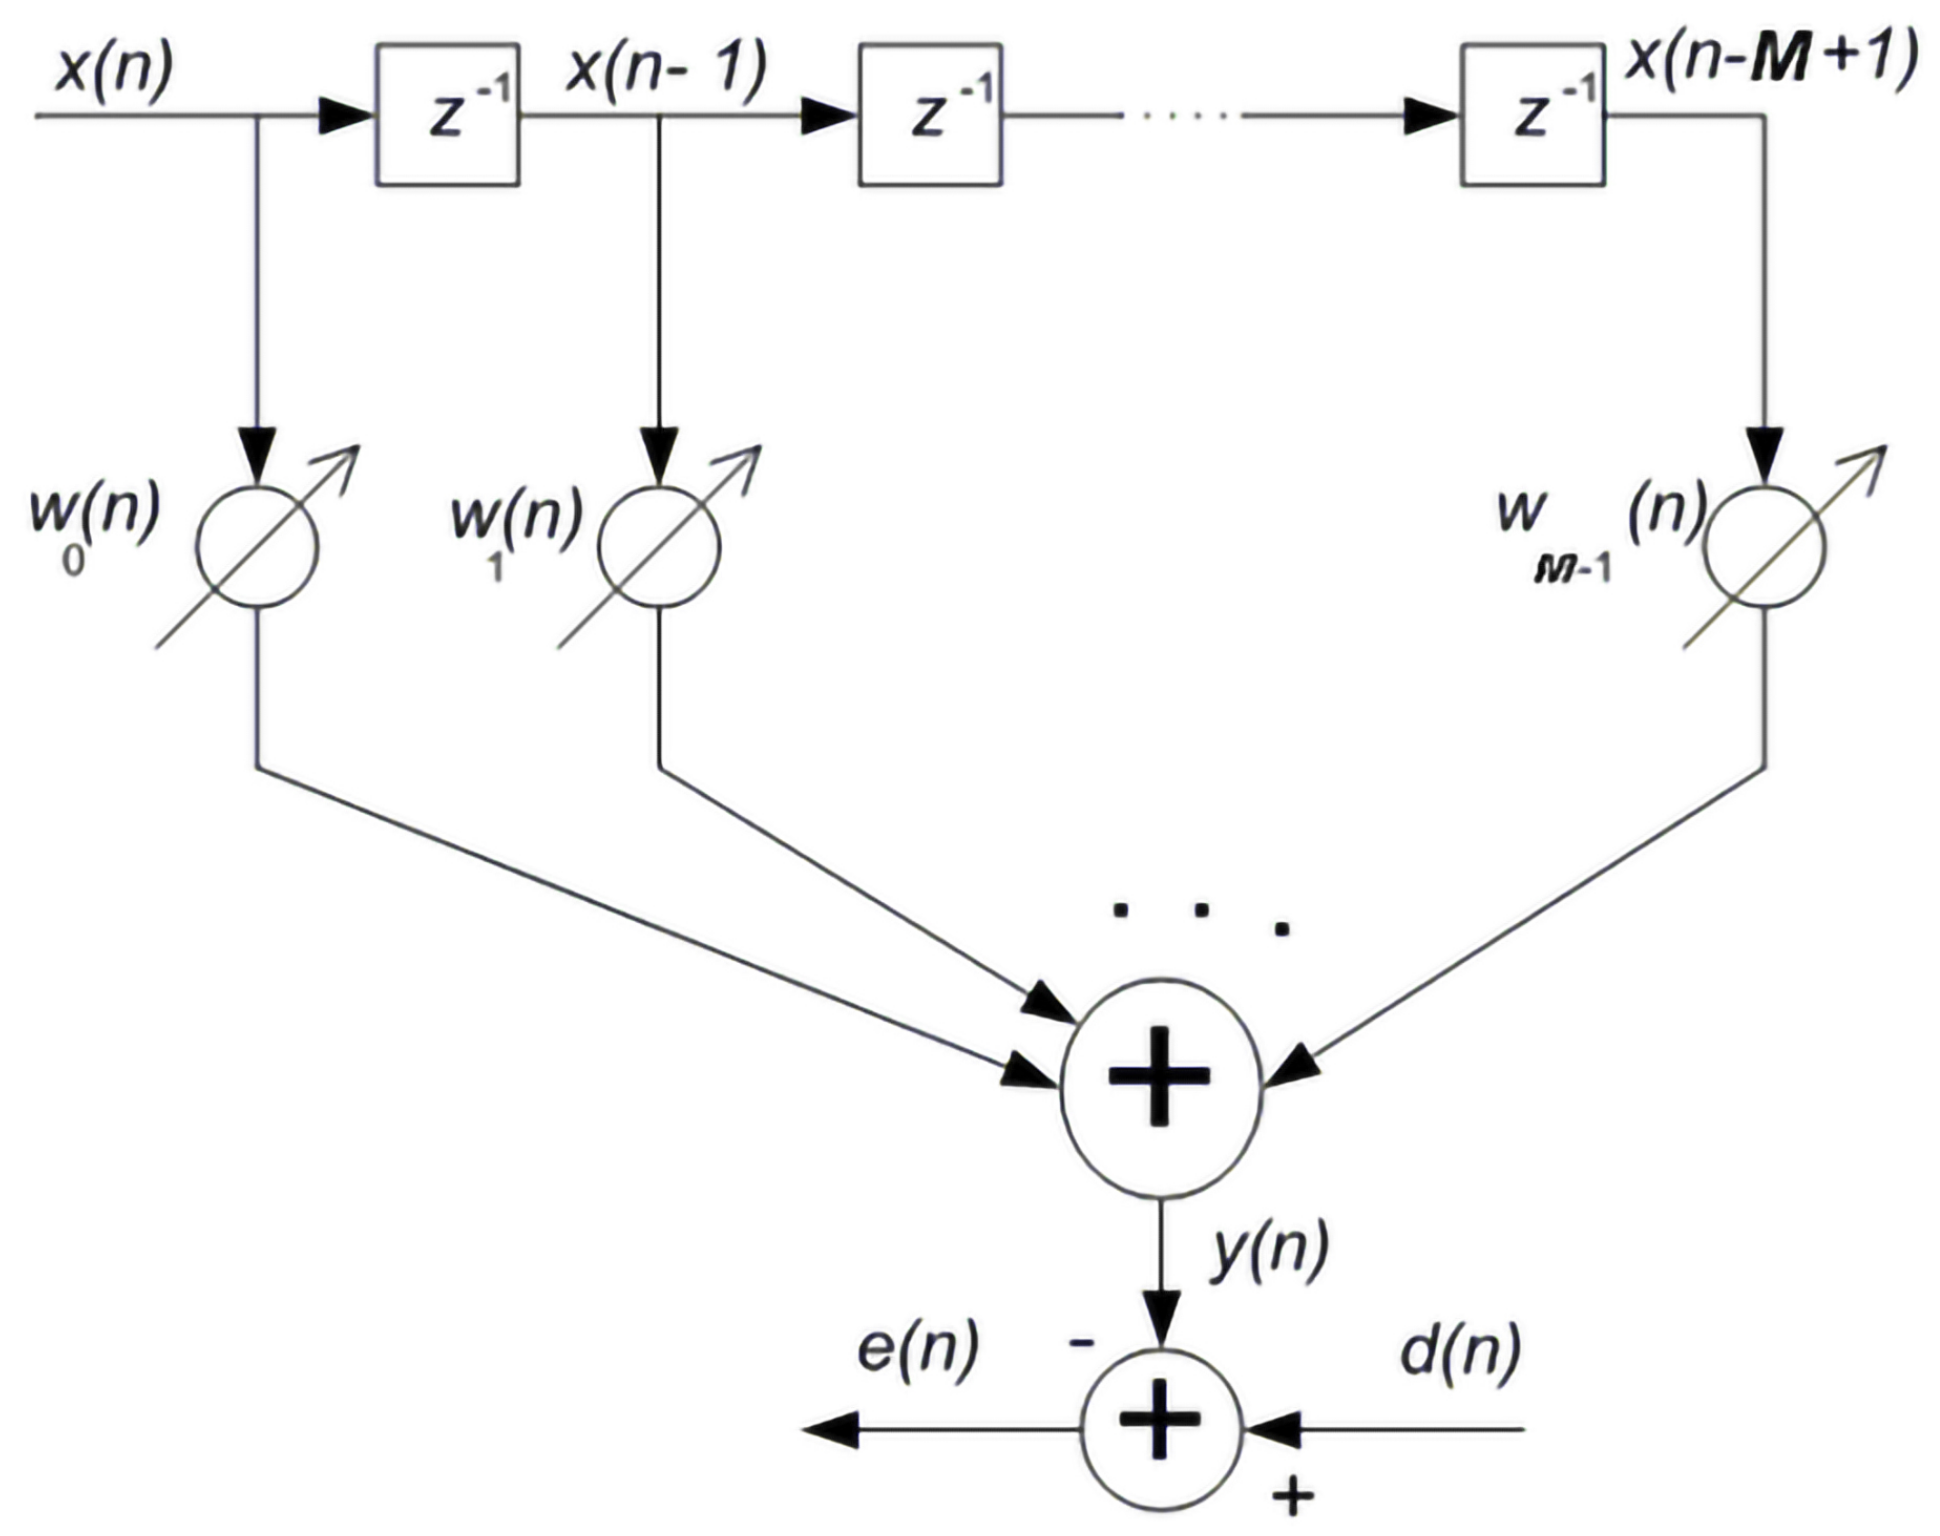
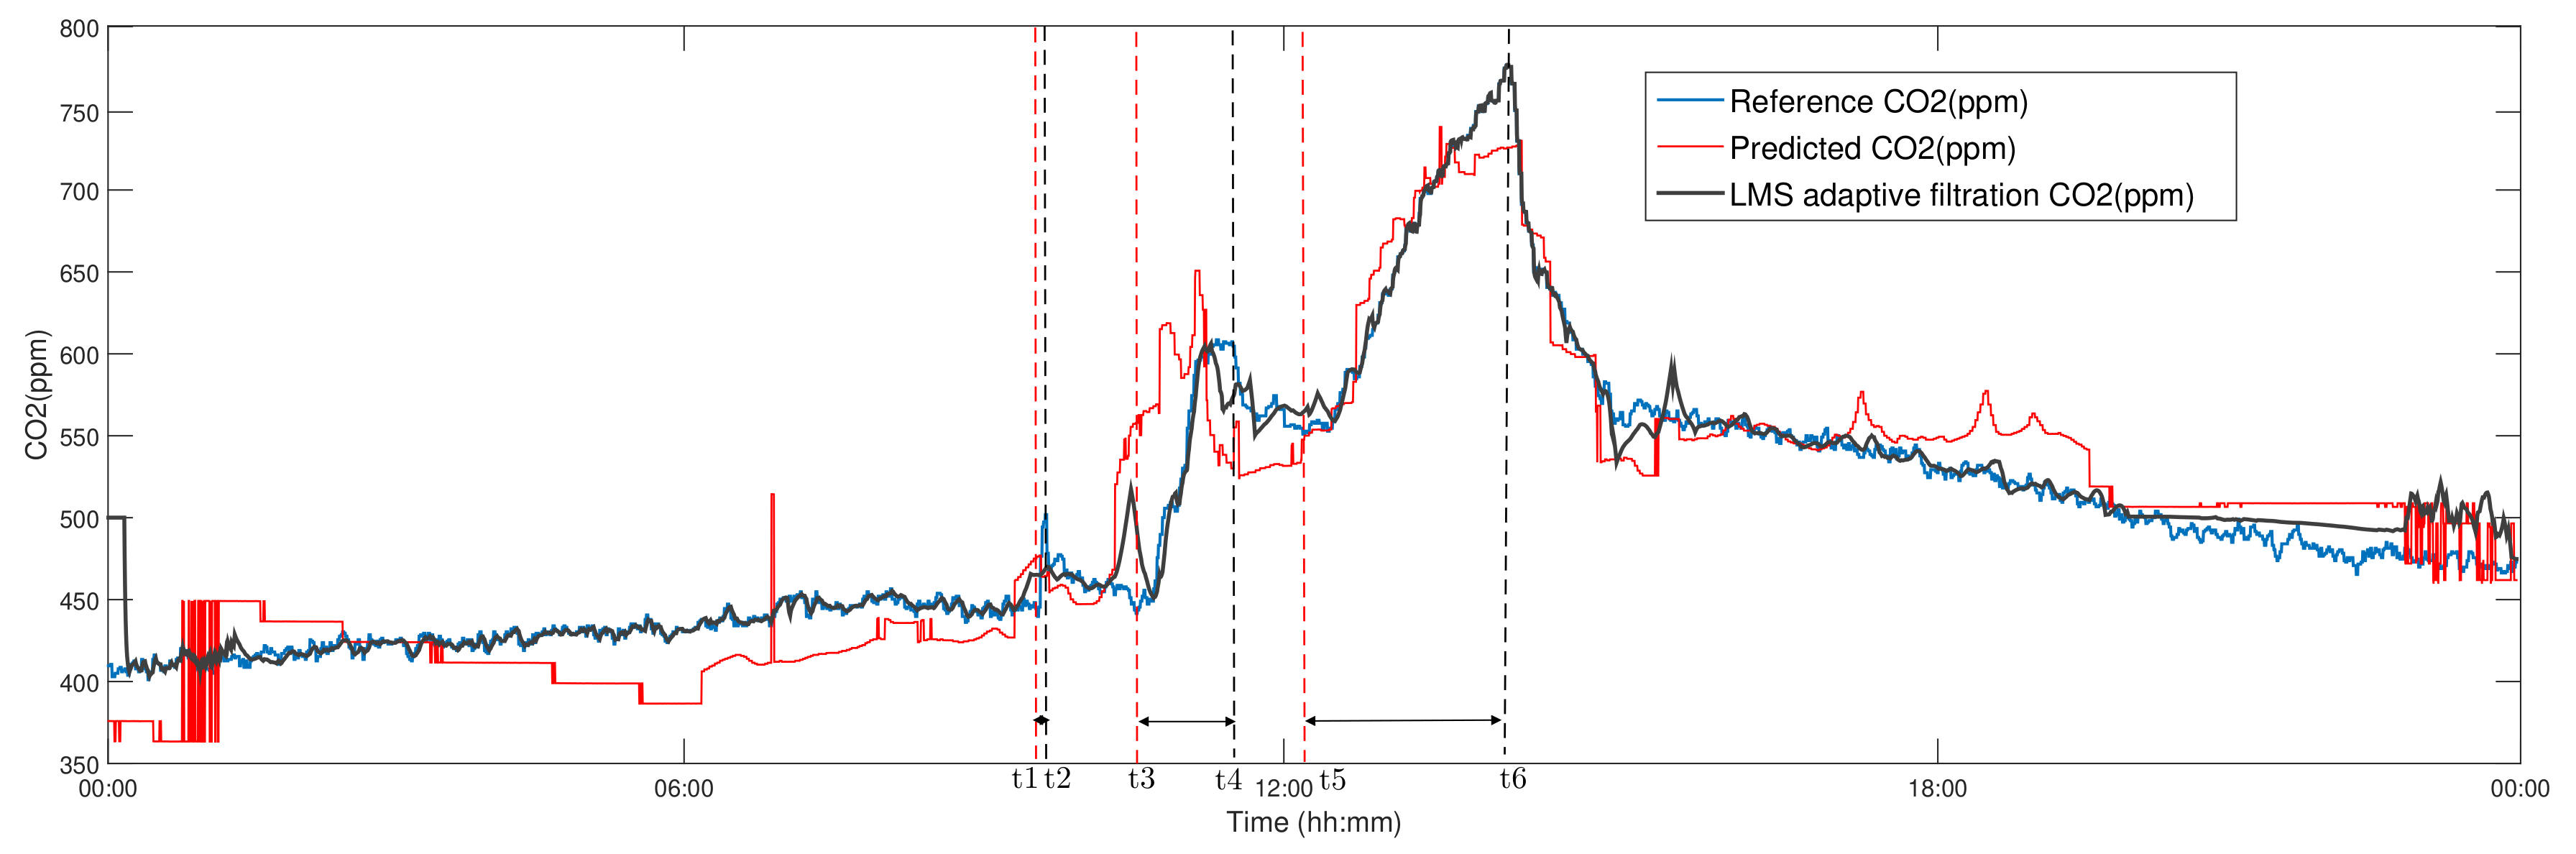
2.3. AF Theory for Smoothing the Predicted Signal
Algorithms Description
- multiplication;
- M multiplication for calculating the output signal ;
- one multiplication for calculating ;
- M multiplication for calculating the product ; and
- addition.
3. Experiments and Results
3.1. LR Prediction
3.2. RT Prediction
3.3. NN (MLP) Prediction
4. Discussion
5. Conclusions
Author Contributions
Funding
Acknowledgments
Conflicts of Interest
Abbreviations
| NN | Neural Network |
| MLP | Multilayer Perceptron |
| RT | Random Tree |
| LR | Linear Regression |
| CC | Cloud Computing |
| IoT | Internet of Things |
| LMS | Least Mean Squares |
| AF | Adaptive filter |
| IB | Intelligent Buildings |
| SH | Smart Home |
| SHC | Smart Home Care |
| VLC | Visible Light Communication |
| LED | Light-Emitting Diode |
| KNX | Konnex (standard EN 50090, ISO/IEC 14543) |
| DNS | Device Name System |
| MQTT | Message Queuing Telemetry Transport |
| ETS | Engineering Tool Software |
| SW | Software |
| CO2 | Carbon dioxide |
| SC | Smart Cities |
| SG | Smart Grids |
| CoAP | Constrained Application Protocol |
| XMPP | Extensible Messaging and Presence Protocol |
| IBM SPSS | Statistical Package for the Social Sciences from the company IBM |
References
- Asensio, J.A.; Criado, J.; Padilla, N.; Iribarne, L. Emulating home automation installations through component-based web technology. Future Gener. Comput. Syst. 2017, 93, 777–791. [Google Scholar] [CrossRef]
- Aggarwal, M.; Madhukar, M. IBM’s Watson Analytics for Health Care: A Miracle Made True. In Cloud Computing Systems and Applications in Healthcare; IGI Global: Hershey, PA, USA, 2017; pp. 117–134. [Google Scholar]
- Petnik, J.; Vanus, J. Design of smart home implementation within IoT with natural language interface. IFAC-PapersOnLine 2018, 51, 174–179. [Google Scholar] [CrossRef]
- Lekić, M.; Gardašević, G. IoT sensor integration to Node-RED platform. In Proceedings of the 2018 IEEE 17th International Symposium INFOTEH-JAHORINA (INFOTEH), East Sarajevo, Bosnia-Herzegovina, 21–23 March 2018; pp. 1–5. [Google Scholar]
- Martinez, A.C. Connecting Small Form-Factor Devices to the Internet of Things. In Advances in Human Factors and System Interactions; Springer: Cham, Switzerland, 2017; pp. 313–322. [Google Scholar]
- Akinsiku, A.; Jadav, D. BeaSmart: A beacon enabled smarter workplace. In Proceedings of the NOMS 2016—2016 IEEE/IFIP Network Operations and Management Symposium, Istanbul, Turkey, 25–29 April 2016; pp. 1269–1272. [Google Scholar]
- Nandi, S. Cloud-based cognitive premise security system using ibm watson and IBM internet of things (IoT). In Advances in Electronics, Communication and Computing; Springer: Singapore, 2018; pp. 723–731. [Google Scholar]
- Marksteiner, S.; Jiménez, V.J.E.; Valiant, H.; Zeiner, H. An overview of wireless IoT protocol security in the smart home domain. In Proceedings of the 2017 Internet of Things Business Models, Users, and Networks, Copenhagen, Denmark, 23–24 November 2017; pp. 1–8. [Google Scholar]
- Tanwar, S.; Patel, P.; Patel, K.; Tyagi, S.; Kumar, N.; Obaidat, M.S. An advanced Internet of Thing based security alert system for smart home. In Proceedings of the 2017 International Conference on Computer, Information and Telecommunication Systems (CITS), Dalian, China, 21–23 July 2017; pp. 25–29. [Google Scholar]
- Perera, C.; Liu, C.H.; Jayawardena, S. The emerging internet of things marketplace from an industrial perspective: A survey. IEEE Trans. Emerg. Top. Comput. 2015, 3, 585–598. [Google Scholar] [CrossRef]
- Bastos, D.; Shackleton, M.; El-Moussa, F. Internet of things: A survey of technologies and security risks in smart home and city environments. In Proceedings of the Living in the Internet of Things: Cybersecurity of the IoT, London, UK, 28–29 March 2018. [Google Scholar]
- Vanus, J.; Belesova, J.; Martinek, R.; Nedoma, J.; Fajkus, M.; Bilik, P.; Zidek, J. Monitoring of the daily living activities in smart home care. Hum.-Centric Comput. Inf. Sci. 2017, 7, 30. [Google Scholar] [CrossRef]
- Holỳ, R.; Kalika, M.; Havlík, J.; Makarov, A. HVAC system—Communication platform. In Proceedings of the 2018 3rd International Conference on Intelligent Green Building and Smart Grid (IGBSG), Yi-Lan, Taiwan, 22–25 April 2018; pp. 1–4. [Google Scholar]
- Chen, M.; Wan, J.; Li, F. Machine-to-machine communications: Architectures, standards and applications. Ksii Trans. Internet Inf. Syst. 2012, 6. [Google Scholar] [CrossRef]
- Ilieva, S.; Penchev, A.; Petrova-Antonova, D. Internet of Things Framework for Smart Home Building. In Proceedings of the International Conference on Digital Transformation and Global Society, St. Petersburg, Russia, 23–24 June 2016; Springer: Cham, Switzerland, 2016; pp. 450–462. [Google Scholar]
- Mainetti, L.; Mighali, V.; Patrono, L. An android multi-protocol application for heterogeneous building automation systems. In Proceedings of the 2014 22nd International Conference on Software, Telecommunications and Computer Networks (SoftCOM), Split, Croatia, 17–19 September 2014; pp. 121–127. [Google Scholar]
- Bajer, M. IoT for smart buildings-long awaited revolution or lean evolution. In Proceedings of the 2018 IEEE 6th International Conference on Future Internet of Things and Cloud (FiCloud), Barcelona, Spain, 6–8 August 2018; pp. 149–154. [Google Scholar]
- Vanus, J.; Machac, J.; Martinek, R.; Bilik, P.; Zidek, J.; Nedoma, J.; Fajkus, M. The design of an indirect method for the human presence monitoring in the intelligent building. Hum.-Centric Comput. Inf. Sci. 2018, 8, 28. [Google Scholar] [CrossRef]
- Jung, M.; Weidinger, J.; Kastner, W.; Olivieri, A. Building automation and smart cities: An integration approach based on a service-oriented architecture. In Proceedings of the 2013 27th International Conference on Advanced Information Networking and Applications Workshops, Barcelona, Spain, 25–28 March 2013; pp. 1361–1367. [Google Scholar]
- Vanus, J.; Stratil, T.; Martinek, R.; Bilik, P.; Zidek, J. The possibility of using VLC data transfer in the smart home. IFAC-PapersOnLine 2016, 49, 176–181. [Google Scholar] [CrossRef]
- Díaz, M.; Martín, C.; Rubio, B. State-of-the-art, challenges, and open issues in the integration of Internet of things and cloud computing. J. Netw. Comput. Appl. 2016, 67, 99–117. [Google Scholar] [CrossRef]
- Kelly, S.D.T.; Suryadevara, N.K.; Mukhopadhyay, S.C. Towards the implementation of IoT for environmental condition monitoring in homes. IEEE Sens. J. 2013, 13, 3846–3853. [Google Scholar] [CrossRef]
- Koo, J.; Kim, Y.G. Interoperability of device identification in heterogeneous IoT platforms. In Proceedings of the 2017 13th International Computer Engineering Conference (ICENCO), Cairo, Egypt, 27–28 December 2017; pp. 26–29. [Google Scholar]
- Tolentino, M. 1950s Smart Homes: Future in the Past. 2014. Available online: https://siliconangle.com/2014/02/05/1950ssmart-homes-future-in-the-past/ (accessed on 20 January 2019).
- Pohanka, P. Internet věcí. In: i2ot.eu 2019. Available online: http://i2ot.eu/internet-of-things/ (accessed on 9 April 2019).
- Vojacek, A. Zakladní uvod do oblasti internetu veci (IoT). 2016. Available online: https://automatizace.hw.cz/zakladni-uvod-dooblasti-internetu-veci-iot.html (accessed on 21 January 2019).
- Bouhaï, N.; Saleh, I. Internet of Things: Evolutions and Innovations; Wiley-ISTE: London, UK, 2017. [Google Scholar]
- KNX asociace. knxcz.cz. Available online: https://knxcz.cz/images/clanky/KNX-IoT_en.pdf (accessed on 31 January 2019).
- Hagen, S. IPv6 essentials; O’Reilly Media, Inc.: Sebastopol, CA, USA, 2006. [Google Scholar]
- Nilsoon, R. Bluetooth Low Energy není jen nová verze standard Bluetooth. 2013. Available online: https://www.automa.cz/cz/casopis-clanky/bluetoothlow-energy-neni-jen-nova-verze-standardu-bluetooth-2013_12_0_10907/ (accessed on 31 January 2019).
- LoRa Alliance. LoRaWAN: What Is It? 2015. Available online: https://lora-alliance.org/sites/default/files/2018-04/what-is-lorawan.pdf (accessed on 21 January 2019).
- Farahani, S. ZigBee Wireless Networks and Transceivers; Newnes: Oxford, UK, 2011. [Google Scholar]
- Paetz, C. Z-Wave Essentials; Createspace Independent Publishing Platform: Zwickau, Germany, 2017. [Google Scholar]
- MALÝ, M. Protokol MQTT: komunikační standart pro IoT. 2016. Available online: https://www.root.cz/clanky/protokol-mqttkomunikacni-standard-pro-iot/ (accessed on 21 January 2019).
- Ranjan, R.; Wang, L.; Chen, J.; Benatallah, B. Cloud Computing: Methodology, Systems, and Applications; CRC Press: Boca Raton, FL, USA, 2011. [Google Scholar]
- Intesis Software, S.L.U. houseinhand.com. 2016. Available online: https://www.houseinhand.com/ (accessed on 31 January 2019).
- Vanus, J.; Kubicek, J.; Gorjani, O.M.; Koziorek, J. Using the IBM SPSS SW Tool with Wavelet Transformation for CO2 Prediction within IoT in Smart Home Care. Sensors 2019, 19, 1407. [Google Scholar] [CrossRef]
- Vanus, J.; Martinek, R.; Bilik, P.; Zidek, J.; Dohnalek, P.; Gajdos, P.; IEEE. New Method for Accurate Prediction of CO2 in the Smart Home. In Proceedings of the 2016 Ieee International Instrumentation and Measurement Technology Conference Proceedings, Taipei, Taiwan, 23–26 May 2016; IEEE: New York, NY, USA, 2016; pp. 1333–1337.
- Khazaei, B.; Shiehbeigi, A.; Kani, A. Modeling indoor air carbon dioxide concentration using artificial neural network. Int. J. Environ. Sci. Technol. 2019, 16, 729–736. [Google Scholar] [CrossRef]
- Wang, H.K.; Li, L.; Wu, Y.; Meng, F.J.; Wang, H.H.; Sigrimis, N.A. Recurrent Neural Network Model for Prediction of Microclimate in Solar Greenhouse. Ifac PapersOnline 2018, 51, 790–795. [Google Scholar] [CrossRef]
- Szczurek, A.; Maciejewska, M.; Pietrucha, T. Occupancy determination based on time series of CO2 concentration, temperature and relative humidity. Energy Build. 2017, 147, 142–154. [Google Scholar] [CrossRef]
- Galda, Z.; Sipkova, V.; Labudek, J.; Gergela, P.; SGEM. Experimental Measurements of CO2 in the Summer Months in the Passive House. In Proceedings of the 15th International Multidisciplinary Scientific Geoconference (SGEM), Albena, Bulgaria, 18–24 June 2015; International Multidisciplinary Scientific GeoConference-SGEM. Stef92 Technology Ltd.: Sofia, Bulgaria, 2015; pp. 127–132. [Google Scholar]
- Aazam, M.; Khan, I.; Alsaffar, A.A.; Huh, E.N. Cloud of Things: Integrating Internet of Things and cloud computing and the issues involved. In Proceedings of the 2014 11th International Bhurban Conference on Applied Sciences & Technology (IBCAST), Islamabad, Pakistan, 14–18 January 2014; pp. 414–419. [Google Scholar]
- Asociace, K. Knx-Specifications. 2014. Available online: https://my.knx.org/en/downloads/knx-specifications (accessed on 31 January 2019).
- Asociace, K. sti.uniurb.it. Available online: http://www.sti.uniurb.it/romanell/Domotica_e_Edifici_Intelligenti/110504-Lez10a-KNX-Datapoint%20Types%20v1.5.00%20AS.pdf (accessed on 31 January 2019).
- Michalec, L. Komunikace v KNX. 2014. Available online: https://vyvoj.hw.cz/automatizace/komunikace-v-knx.html (accessed on 31 January 2019).
- Intesis Software S.L.U. (Application). Available online: https://play.google.com/store/apps/details?id=com.intesis.houseinhand (accessed on 31 January 2019).
- DELIOT. Pascal. Available online: https://www.microsoft.com/cs-cz/p/knxdashboard/9wzdncrdm06f?activetab=pivot:overviewtab# (accessed on 31 January 2019).
- Rouse, M. Predictive modeling. Available online: https://searchenterpriseai.techtarget.com/definition/predictive-modeling (accessed on 31 May 2019).
- Ahmad, M.W.; Reynolds, J.; Rezgui, Y. Predictive modelling for solar thermal energy systems: A comparison of support vector regression, random forest, extra trees and regression trees. J. Clean. Prod. 2018, 203, 810–821. [Google Scholar] [CrossRef]
- Han, J.; Pei, J.; Kamber, M. Data Mining: Concepts and Techniques; Elsevier: Waltham, MA, USA, 2011. [Google Scholar]
- Kachalsky, I.; Zakirzyanov, I.; Ulyantsev, V. Applying reinforcement learning and supervised learning techniques to play Hearthstone. In Proceedings of the 2017 16th IEEE International Conference on Machine Learning and Applications (ICMLA), Cancun, Mexico, 18–21 December 2017; pp. 1145–1148. [Google Scholar]
- Nijhawan, R.; Srivastava, I.; Shukla, P. Land cover classification using super-vised and unsupervised learning techniques. In Proceedings of the 2017 International Conference on Computational Intelligence in Data Science (ICCIDS), Chennai, India, 2–3 June 2017; pp. 1–6. [Google Scholar]
- Liu, Q.; Liao, X.; Carin, L. Semi-Supervised Life-Long Learning with Application to Sensing. In Proceedings of the 2007 2nd IEEE International Workshop on Computational Advances in Multi-Sensor Adaptive Processing, St. Thomas, VI, USA, 12–14 December 2007; pp. 1–4. [Google Scholar]
- IBM. IBM SPSS Modeler 18.0 User’s Guide; IBM. Available online: https://searchenterpriseai.techtarget.com/definition/predictive-modeling (accessed on 31 May 2019).
- Yan, X.; Su, X. Linear Regression Analysis: Theory and Computing; World Scientific: Singapore, 2009. [Google Scholar]
- Rencher, A.C.; Christensen, W.F. Chapter 10, Multivariate regression–Section 10.1, Introduction. In Methods of Multivariate Analysis; Wiley Series in Probability and Statistics; John Wiley & Sons Inc.: New York, NY, USA, 2012; Volume 709, p. 19. [Google Scholar]
- Ralston, A.; Wilf, H.S. Mathematical Methods for Digital Computers; Technical Report; John Wiley and Sons Ltd.: New York, NY, USA, 1960. [Google Scholar]
- Hocking, R.R. A Biometrics invited paper. The analysis and selection of variables in linear regression. Biometrics 1976, 32, 1–49. [Google Scholar] [CrossRef]
- Draper, N.; Smith, H. Applied Regression Analysis, 2nd ed.; John Wiley & Sons: New York, NY, USA, 1981. [Google Scholar]
- SAS Institute Inc. SAS/STAT User’s Guide Version 6, 4th ed.; SAS Institute Inc.: Cary, NC, USA, 1989. [Google Scholar]
- Knecht, W.R. Pilot Willingness to Take Off Into Marginal Weather. Part 2. Antecedent Overfitting with Forward Stepwise Logistic Regression; Technical Report; Federal Aviation Administration Oklahoma City Ok Civil Aeromedical Institute: Oklahoma City, OK, USA, 2005. [Google Scholar]
- Flom, P.L.; Cassell, D.L. Stopping Stepwise: Why Stepwise and Similar Selection Methods Are Bad, and What You Should Use. In Proceedings of the NorthEast SAS Users Group (NESUG) 2007: Statistics and Data Analysis, Baltimore, MD, USA, 11–14 November 2007. [Google Scholar]
- Myers, R.H.; Myers, R.H. Classical and Modern Regression with Applications; Duxbury press: Belmont, CA, USA, 1990; Volume 2. [Google Scholar]
- Bendel, R.B.; Afifi, A.A. Comparison of stopping rules in forward “stepwise” regression. J. Am. Stat. Assoc. 1977, 72, 46–53. [Google Scholar]
- Kubinyi, H. Evolutionary variable selection in regression and PLS analyses. J. Chemom. 1996, 10, 119–133. [Google Scholar] [CrossRef]
- Quinlan, J.R. Simplifying decision trees. Int. J. Man-Mach. Stud. 1987, 27, 221–234. [Google Scholar] [CrossRef]
- Liaw, A.; Wiener, M. Classification and regression by randomForest. R News 2002, 2, 18–22. [Google Scholar]
- Breiman, L. Classification and Regression Trees; Routledge: Boca Raton, FL, USA, 2017. [Google Scholar]
- Meir, A.; Moon, J.W. On the altitude of nodes in random trees. Can. J. Math. 1978, 30, 997–1015. [Google Scholar] [CrossRef]
- Duquesne, T.; Le Gall, J.F. Random Trees, Lévy Processes and Spatial Branching Processes; Société mathématique de France: Paris, France, 2002; Volume 281. [Google Scholar]
- Le Gall, J.F. Random trees and applications. Probab. Surv. 2005, 2, 245–311. [Google Scholar] [CrossRef]
- Pittel, B. Note on the heights of random recursive trees and random m-ary search trees. Random Struct. Algorithms 1994, 5, 337–347. [Google Scholar] [CrossRef]
- Ripley, B.D.; Hjort, N. Pattern Recognition and Neural Networks; Cambridge University Press: Cambridge, UK, 1996. [Google Scholar]
- Haykin, S. Neural Networks: A Comprehensive Foundation; Prentice Hall PTR: Upper Saddle River, NJ, USA, 1994. [Google Scholar]
- Zarei, T.; Behyad, R. Predicting the water production of a solar seawater greenhouse desalination unit using multi-layer perceptron model. Sol. Energy 2019, 177, 595–603. [Google Scholar] [CrossRef]
- Moosavi, S.R.; Wood, D.A.; Ahmadi, M.A.; Choubineh, A. ANN-Based Prediction of Laboratory-Scale Performance of CO2-Foam Flooding for Improving Oil Recovery. Nat. Resour. Res. 2019, 28, 1619–1637. [Google Scholar] [CrossRef]
- IBM. IBM SPSS Modeler 18 Algorithms Guide; IBM. Available online: ftp://public.dhe.ibm.com/software/analytics/spss/documentation/modeler/18.0/en/AlgorithmsGuide.pdf (accessed on 31 January 2019).
- Willmott, C.J.; Matsuura, K. Advantages of the mean absolute error (MAE) over the root mean square error (RMSE) in assessing average model performance. Clim. Res. 2005, 30, 79–82. [Google Scholar] [CrossRef]
- Lehmann, E.L.; Casella, G. Theory of Point Estimation; Springer Science & Business Media: New York, NY, USA, 2006. [Google Scholar]
- Ijiri, Y. The linear aggregation coefficient as the dual of the linear correlation coefficient. Econom. J. Econom. Soc. 1968, 36, 252–259. [Google Scholar] [CrossRef]
- Jan, J. Cislicova Filtrace, Analyza a Restaurace Signalu; Vutium: Brno, Czech Republic, 2002. [Google Scholar]
- Boroujeny, B.F. Adaptive Filters: Theory and Applications; John Wiley & Sons: New York, NY, USA, 2013. [Google Scholar]
- Poularikas, A.D.; Ramadan, Z.M. Adaptive Filtering Primer with MATLAB; CRC Press: Boca Raton, FL, USA, 2017. [Google Scholar]
- Haykin, S.S. Modern Filters; Macmillan Coll Division: Upper Saddle River, NJ, USA, 1989. [Google Scholar]
- Haykin, S.S.; Widrow, B. Least-Mean-Square Adaptive Filters; Wiley Online Library: New York, NY, USA, 2003; Volume 31. [Google Scholar]
- Haykin, S.S. Adaptive Filter Theory; Pearson Education India: Bengaluru, India, 2005. [Google Scholar]
- Kodali, R.K.; Jain, V.; Bose, S.; Boppana, L. IoT based smart security and home automation system. In Proceedings of the 2016 International Conference on Computing, Communication and Automation (ICCCA), Noida, India, 29–30 April 2016; pp. 1286–1289. [Google Scholar]
- Pirbhulal, S.; Zhang, H.; E Alahi, M.; Ghayvat, H.; Mukhopadhyay, S.; Zhang, Y.T.; Wu, W. A novel secure IoT-based smart home automation system using a wireless sensor network. Sensors 2017, 17, 69. [Google Scholar] [CrossRef]
- Pavithra, D.; Balakrishnan, R. IoT based monitoring and control system for home automation. In Proceedings of the 2015 Global Conference on Communication Technologies (GCCT), Thuckalay, India, 23–24 April 2015; pp. 169–173. [Google Scholar]
- Wang, M.; Zhang, G.; Zhang, C.; Zhang, J.; Li, C. An IoT-based appliance control system for smart homes. In Proceedings of the 2013 Fourth International Conference on Intelligent Control and Information Processing (ICICIP), Beijing, China, 9–11 June 2013; pp. 744–747. [Google Scholar]
- Lee, W.S.; Hong, S.H. Implementation of a KNX-ZigBee gateway for home automation. In Proceedings of the 2009 IEEE 13th International Symposium on Consumer Electronics, Kyoto, Japan, 25–28 May 2009; pp. 545–549. [Google Scholar]
- Skön, J.; Johansson, M.; Raatikainen, M.; Leiviskä, K.; Kolehmainen, M. Modelling indoor air carbon dioxide (CO2) concentration using neural network. Methods 2012, 14, 16. [Google Scholar]

| Method | LC | MAE | MSE |
|---|---|---|---|
| Enter | 0.826 | 35.359 | |
| Stepwise | 0.826 | 35.360 | |
| Backward | 0.826 | 35.360 | |
| Forward | 0.826 | 35.360 |
| Interval | LC | MAE | MSE |
|---|---|---|---|
| 3 May | 0.929 | 22.413 | |
| 6 May | 0.952 | 22.413 | |
| 7 May | 0.884 | 39.969 | |
| 9 May | 0.905 | 32.859 | |
| 2–10 May | 0.459 | 62.573 |
| Number of Trees | LC | MAE | MSE |
|---|---|---|---|
| 1 | 0.7822 | 37.655 | |
| 3 | 0.8138 | 29.083 | |
| 5 | 0.8464 | 31.453 | |
| 8 | 0.8646 | 31.453 | |
| 10 | 0.8672 | 28.016 | |
| 11 | 0.8674 | 22.062 | |
| 13 | 0.8676 | 27.944 | |
| 16 | 0.8676 | 27.944 | |
| 18 | 0.8676 | 27.944 | |
| 20 | 0.8486 | 31.596 |
| Interval | LC | MAE | MSE |
|---|---|---|---|
| 3 May | 0.975 | 11.356 | |
| 6 May | 0.699 | 43.181 | |
| 7 May | 0.879 | 28.543 | |
| 9 May | 0.895 | 37.9874 | |
| 2–10 May | −17.5829 | 26.1345 |
| Number of Neurons Layer1-Layer2 | LC | MAE | MSE |
|---|---|---|---|
| Number of Neurons | LC | MAE | MSE |
| 10–10 | 0.988 | 9.7558 | |
| 25–50 | 0.989 | 9.315 | |
| 50–25 | 0.990 | 8.6476 | |
| 50–100 | 0.989 | 9.0496 | |
| 100–50 | 0.990 | 8.9098 | |
| 500–20 | 0.991 | 8.2812 | |
| 20–500 | 0.984 | 10.839 |
| Interval | LC | MAE | MSE |
|---|---|---|---|
| 3 May | 0.990 | 8.658 | |
| 6 May | 0.996 | 5.024 | |
| 7 May | 0.993 | 8.818 | |
| 9 May | 0.989 | 10.442 | |
| 2–10 May | 0.972 | 14.600 |
© 2019 by the authors. Licensee MDPI, Basel, Switzerland. This article is an open access article distributed under the terms and conditions of the Creative Commons Attribution (CC BY) license (http://creativecommons.org/licenses/by/4.0/).
Share and Cite
Vanus, J.; M. Gorjani, O.; Bilik, P. Novel Proposal for Prediction of CO2 Course and Occupancy Recognition in Intelligent Buildings within IoT. Energies 2019, 12, 4541. https://doi.org/10.3390/en12234541
Vanus J, M. Gorjani O, Bilik P. Novel Proposal for Prediction of CO2 Course and Occupancy Recognition in Intelligent Buildings within IoT. Energies. 2019; 12(23):4541. https://doi.org/10.3390/en12234541
Chicago/Turabian StyleVanus, Jan, Ojan M. Gorjani, and Petr Bilik. 2019. "Novel Proposal for Prediction of CO2 Course and Occupancy Recognition in Intelligent Buildings within IoT" Energies 12, no. 23: 4541. https://doi.org/10.3390/en12234541
APA StyleVanus, J., M. Gorjani, O., & Bilik, P. (2019). Novel Proposal for Prediction of CO2 Course and Occupancy Recognition in Intelligent Buildings within IoT. Energies, 12(23), 4541. https://doi.org/10.3390/en12234541