Experimental and Simulation Studies of Energized Fracturing Fluid Efficiency in Tight Gas Formations

Abstract
:1. Introduction
2. Materials and Methods
2.1. Sample Preparation
2.2. Rheology
2.3. Filtration Measurements
2.4. Simulation of Fracturing Treatment and Fracture Propagation
3. Results and Discussion
3.1. The Results of Rheological Tests of Non-Foamed and Foamed Fluids
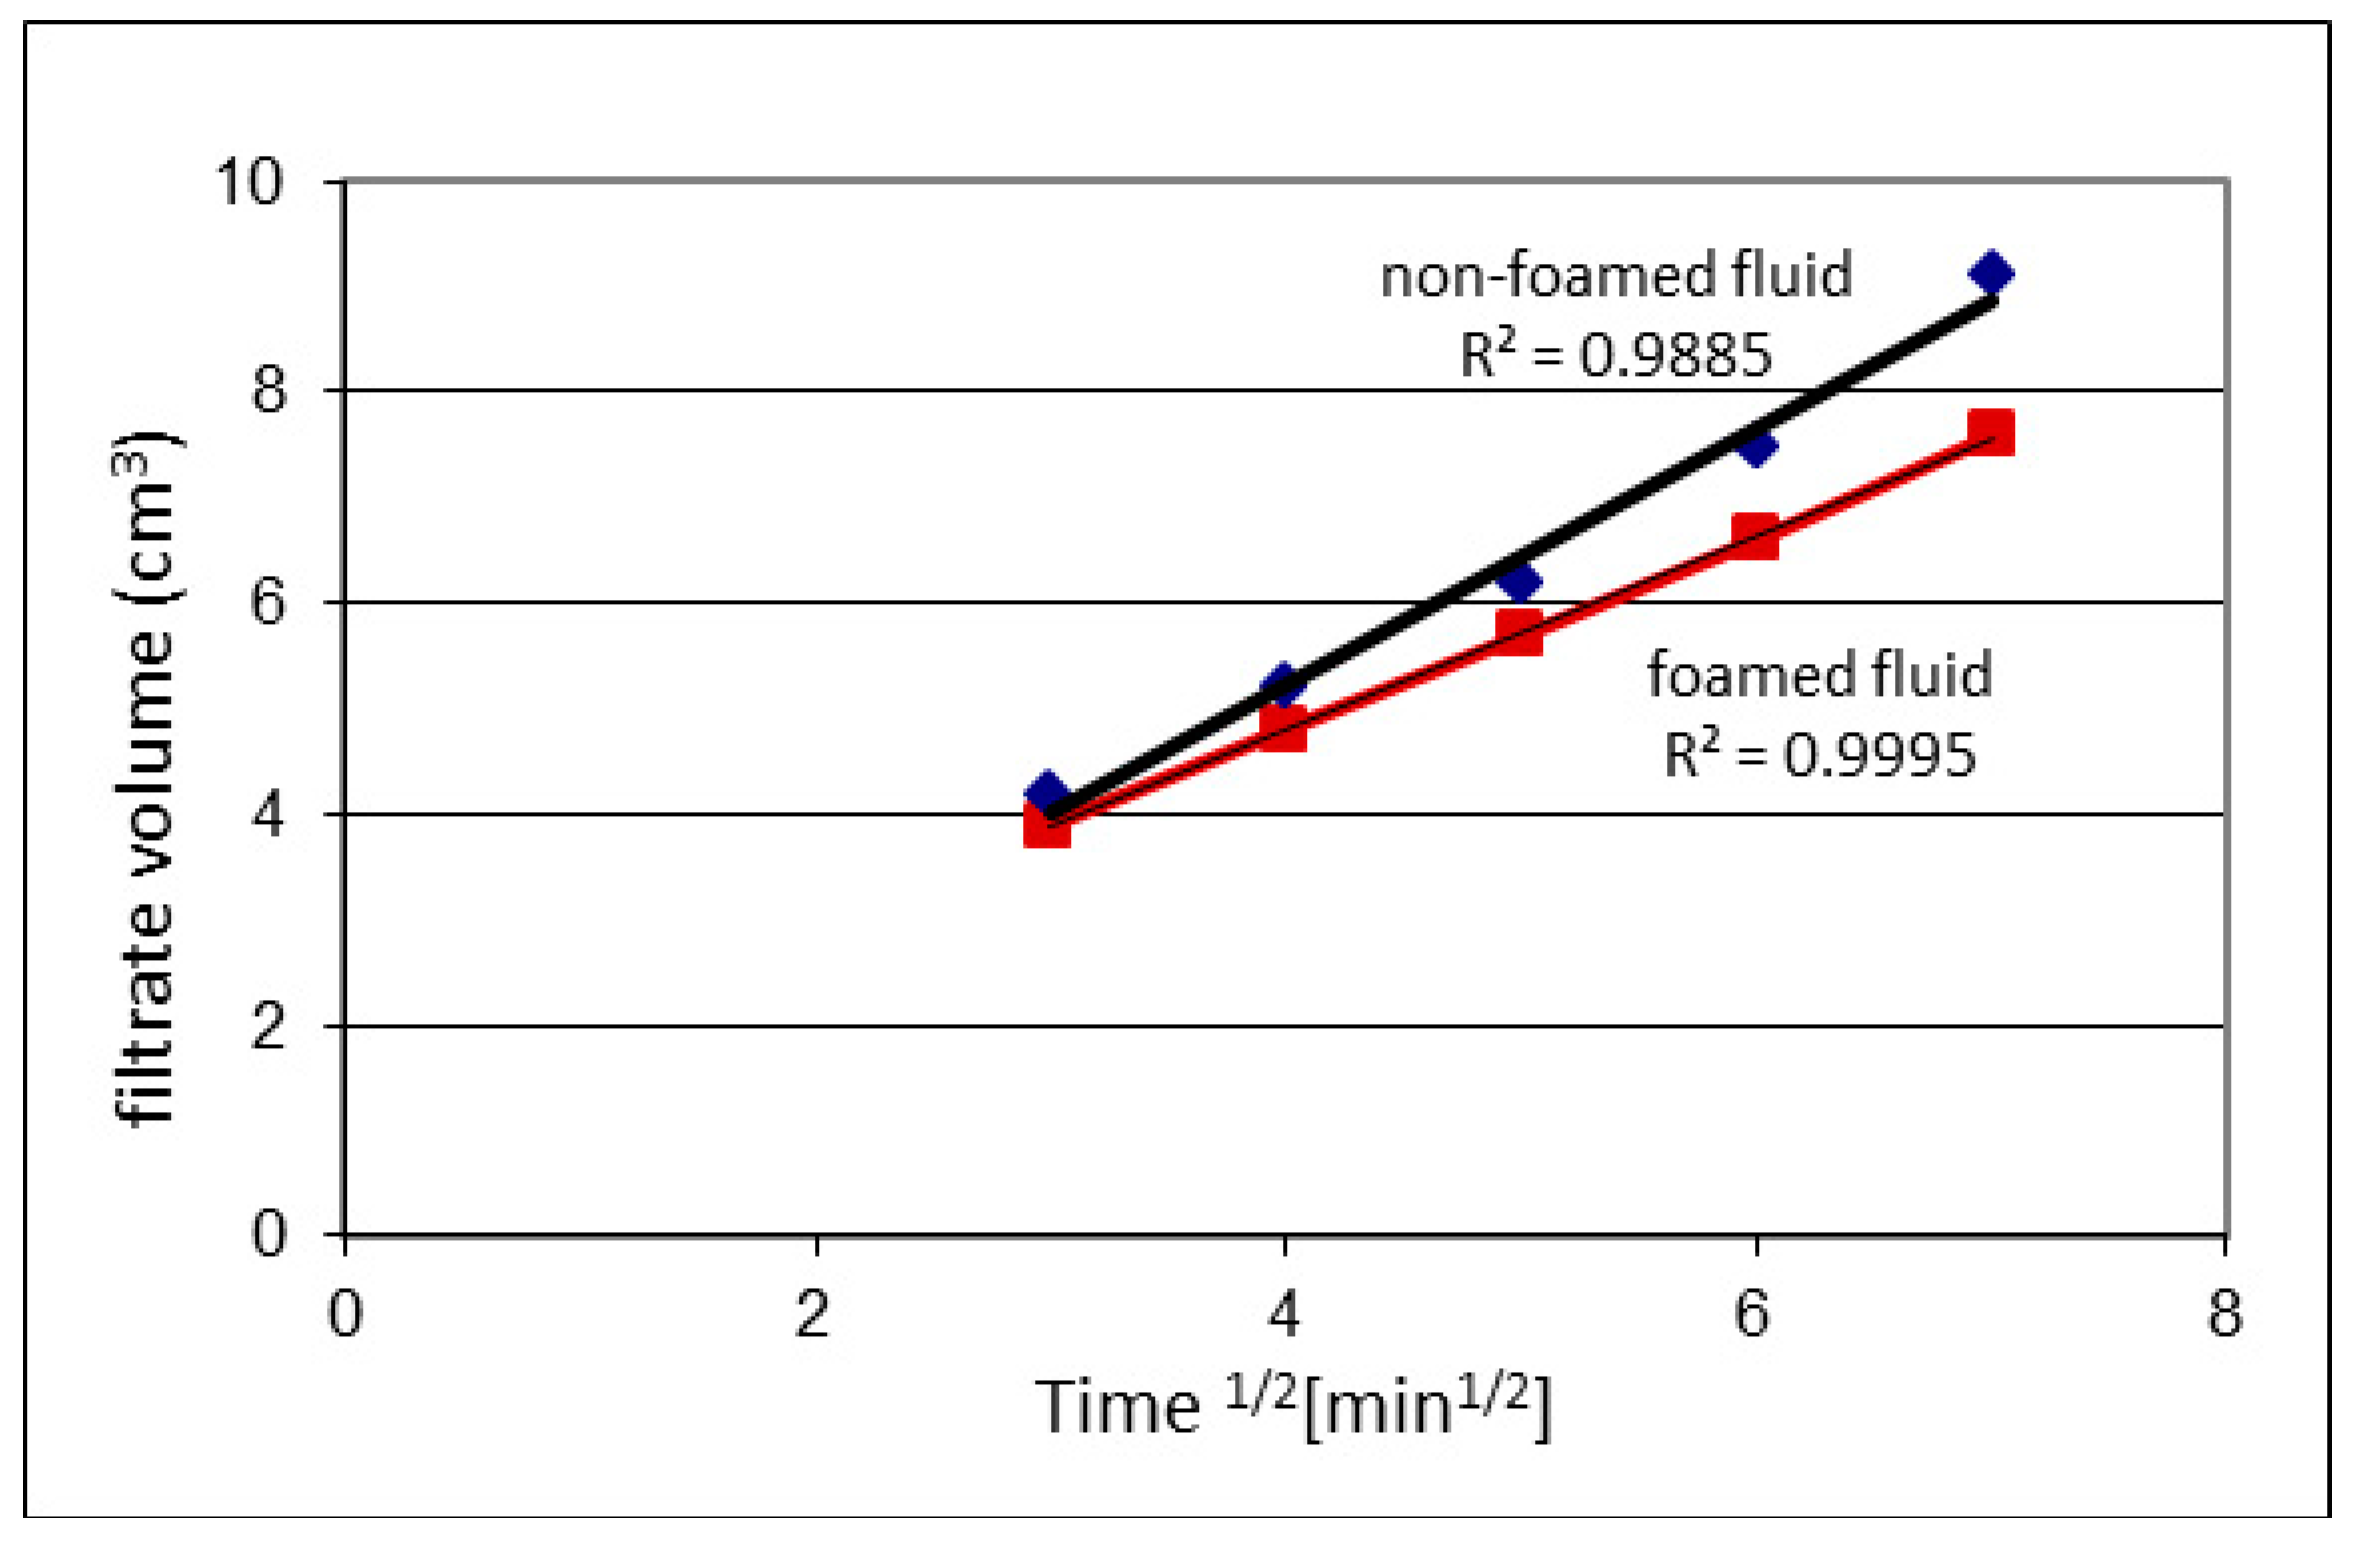
3.2. Filtration Test Results
3.3. 3D Simulation Results
4. Conclusions
- Based on laboratory tests and simulations, it can be concluded that foamed fluids exhibit good rheological parameters and capability of opening a fracture (Figure 5 and Figure 6; Table 8) and proppant-carrying capacity, which is crucial during fracturing treatment. In general: similar geometries of the fracture and proppant concentrations are obtained for the non-foamed as well as for 50% quality nitrogen foamed fluids. At the same time, when using a fluid with a gas additive, the water content in fracturing fluid is reduced, up to 50%, which means the minimization of the negative results of the clay minerals swelling.
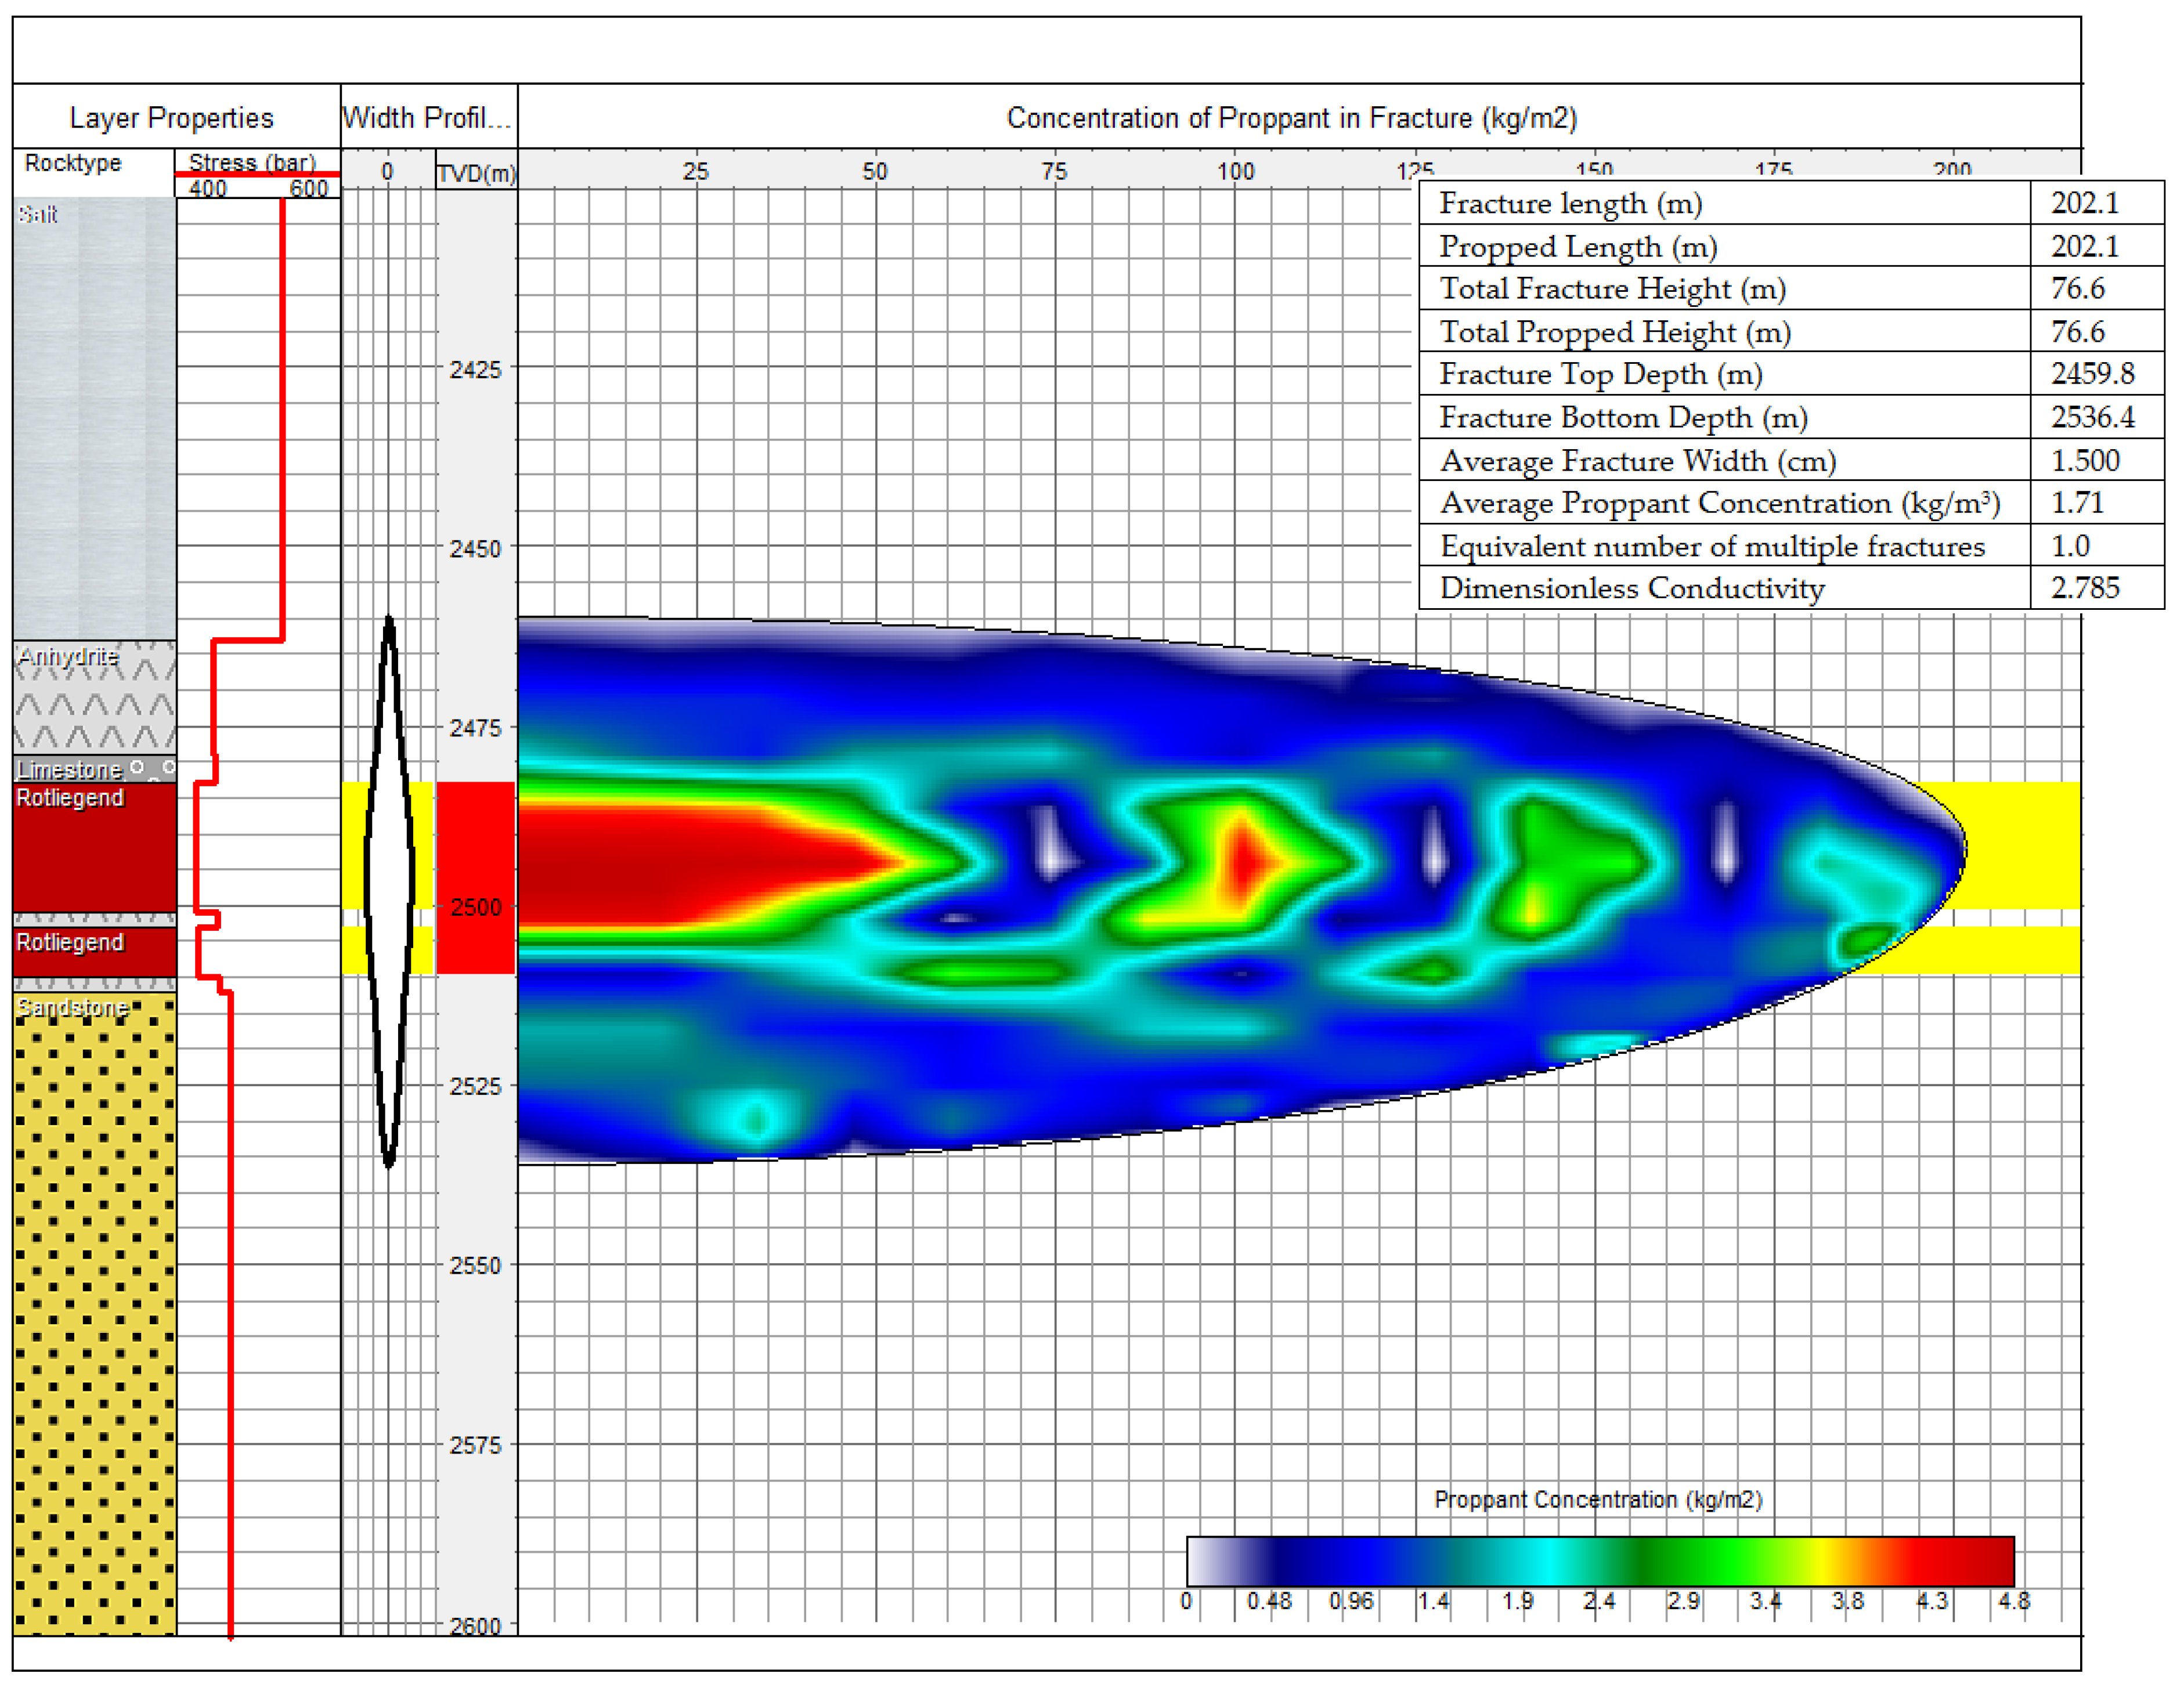
- When using non-foamed fluid, the fracture is slightly longer (4.7 m) and higher (6.4 m) compared to foamed fluid, while its width is smaller (0.3 cm less). When fracturing with the foam, the placement of the proppant in the productive horizon is much more beneficial in terms of the fracturing treatment performance. High concentration of the proppant, in the case of using a non-foamed fluid, is obtained only in the top part of the Rotliegend productive horizon, causing an irregular proppant distribution in the fracture (Figure 6 and Figure 7).
- The analysis of laboratory data (Table 8), and the performed simulations indicated that fracturing fluids foamed by nitrogen are a good alternative to conventional fluids (non-foamed), especially for the low-pressure reservoirs and with high sensitivity to contact with water.
Funding
Conflicts of Interest
References
- Sorrell, S.; Speirs, J.; Bentley, R.; Brandt, A.; Miller, R. Global oil depletion: A review of the evidence. Energy Policy 2010, 38, 5290–5295. [Google Scholar] [CrossRef]
- Bentley, R.W. Global oil & gas depletion: An overview. Energy Policy 2002, 30, 189–205. [Google Scholar]
- Wu, Y.; Li, X. Numerical Simulation of the Propagation of Hydraulic and Natural Fracture Using Dijkstra’s Algorithm. Energies 2016, 9, 519. [Google Scholar] [CrossRef]
- Shonkoff, S.B.; Hays, J.; Finkel, M.L. Environmental Public Health Dimensions of Shale and Tight Gas Development. Environ. Health Perspect. 2014, 122, 787–795. [Google Scholar] [CrossRef] [PubMed]
- Al-Muntasheri, G. A Critical Review of Hydraulic Fracturing Fluids for Moderate-to-Ultralow-Permeability Formations over the Last Decade, SPE-169552-PA. SPE Prod. Oper. 2014, 29. [Google Scholar] [CrossRef]
- Rozell, D.J.; Reaven, S.J. Water pollution risk associated with natural gas extraction from the Marcellus Shale. Risk Anal. 2012, 32, 1382–1393. [Google Scholar] [CrossRef] [PubMed]
- Wilk, K.; Kasza, P.; Labus, K. Analysis of the applicability of foamed fracturing fluids. Nafta Gaz 2015, 6, 425–433. [Google Scholar]
- Hutchins, R.D.; Miller, M.J. A Circulating Foam Loop for Evaluating Foam at Conditions of Use. SPE Prod. Facil. 2005, 20. [Google Scholar] [CrossRef]
- Gidley, J.L.; Holditch, S.A.; Nierode, D.E.; Veatch, R.W. Recent Advances In Hydraulic Fracturing; SPE Monograph Series; Society of Petroleum Engineers of AIME: Richardson, TX, USA, 1990; Volume 12, p. 464. [Google Scholar]
- Wanniarachchi, W.A.M.; Ranjith, P.G.; Perera, M.S.A. Shale gas fracturing using foam-based fracturing fluid: A review. Environ. Earth Sci. 2017, 76, 1–15. [Google Scholar] [CrossRef]
- Wanniarachchi, W.A.M.; Ranjith, P.G.; Perera, M.S.A.; Lashin, A.; Al Arifi, N.; Li, J.C. Current opinions on foam-based hydro-fracturing in deep geological reservoirs. Geomech. Geophys. Geo-Energy Geo-Resour. 2015, 1, 121–134. [Google Scholar] [CrossRef]
- Small, X.T. Water Use and Recycling in Hydraulic Fracturing: Creating a Regulatory Pilot for Smarter Water Use in the West. Nat. Resour. J. 2015, 55, 409–440. [Google Scholar]
- Freeman, B. Engineers improve recycling system used in fracking to save water and energy. Membr. Technol. 2013, 2013, 7. [Google Scholar] [CrossRef]
- McAndrew, J.J.; Fan, R.; Sharma, M.; Ribeiro, L. Extending the application of foam hydraulic fracturing fluids. In Proceedings of the SPE/AAPG/SEG Unconventional Resources Technology Conference, Denver, CO, USA, 25–27 August 2014. [Google Scholar] [CrossRef]
- Labus, K. Potential environmental problems connected with the exploitation of unconventional natural gas deposits. Przegląd Górniczy 2011, 67, 12–16. [Google Scholar]
- Tulissi, M.G.; May, R.E. A Comparison of Results of Three Different CO2 Energized Frac Fluids: A Case History. SPE-75681-MS. In Proceedings of the SPE Gas Technology Symposium, Calgary, AB, Canada, 30 April–2 May 2002. [Google Scholar]
- Faroughiab, S.A.; Pruvota, A.J.-C.J.; McAndrewa, J. The rheological behavior of energized fluids and foams with application to hydraulic fracturing: Review. J. Pet. Sci. Eng. 2018, 163, 243–263. [Google Scholar] [CrossRef]
- Turek, M.; Labus, K.; Dydo, P.; Mitko, K.; Laskowska, E.; Jakóbik-Kolon, A. A concept of hydraulic fracturing flowback treatment using electrodialysis reversal. Desalin. Water Treat. 2017, 64, 228–232. [Google Scholar] [CrossRef]
- Torabzadeh, J.; Langnes, G.L.; Robertson, J.O., Jr.; Yen, T.F.; Donaldson, E.C.; Chilingarian, G.V.; Yen, T.F. Enhanced Oil Recovery, II: Processes and Operations; Elsevier Science Publishers B. V.: Amsterdam, The Netherlands, 1989; pp. 91–106. [Google Scholar]
- Harris, P.C. High-Quality Foam Fracturing Fluids. In Proceedings of the SPE Gas Technology Symposium, Calgary, AB, Canada, 28 April–1 May 1996. [Google Scholar] [CrossRef]
- Blauer, R.E.; Kohlhaas, C.A. Formation Fracturing with Foam. SPE-5003-MS. In Proceedings of the Fall Meeting of the Society of Petroleum Engineers of AIME, Houston, TX, USA, 6–9 October 1974. [Google Scholar] [CrossRef]
- Cawiezel, K.E.; Niles, T.D. Rheological Properties of Foam Fracturing Fluids Under Downhole Conditions. SPE-16191-MS. In Proceedings of the SPE Production Operations Symposium, Oklahoma, OK, USA, 8–10 March 1987. [Google Scholar]
- Temizel, C.; Energy, A.; Betancourt, D.; Aktas, S.; Susuz, O.; Zhu, Y.; Suhag, A.; Ranjith, R.; Wang, A. Optimization of Hydraulic Fractures in Tight-Oil Reservoirs Using Different Numerical Fracture Models. In Proceedings of the SPE Asia Pacific Hydraulic Fracturing Conference, Beijing, China, 24–26 August 2016; SPE-181824-MS. pp. 1–58. [Google Scholar]
- Acharya, R. Hydraulic-Fracture-Treatment Design Simulation. J. Pet. Technol. 1988, 40, 139–142. [Google Scholar] [CrossRef]
- Shahkarami, A.; Wang, G.; Belyadi, H. Horizontal Well Spacing and Hydraulic Fracturing Design Optimization: A Case Study on Utica-Point Pleasant Shale Play. In Proceedings of the Unconventional Resources Technology Conference, San Antonio, TX, USA, 1–3 August 2016; pp. 1–12. [Google Scholar]
- Shah, K.; Shelley, R.F.; Gusain, D.; Lehman, L.V.; Mohammadnejad, A.; Conway, M.T. Development of the Brittle Shale Fracture Network Model. SPE-163829-MS. In Proceedings of the SPE Hydraulic Fracturing Technology Conference, The Woodlands, TX, USA, 4–6 February 2013. [Google Scholar]
- Zhang, S.-C.; Lei, X.; Zhou, Y.-S.; Xu, G.-Q. Numerical simulation of hydraulic fracture propagation in tight oil reservoirs by volumetric fracturing. Pet. Sci. 2015, 12, 674. [Google Scholar] [CrossRef]
- Zhou, L.; Guo, J. 3D Modeling of Hydraulic Fracturing in Tight Gas Reservoirs by Using of FLAC3D and Validation through Comparison with FracPro. Adv. Mater. Res. 2012, 524–527, 1293–1299. [Google Scholar] [CrossRef]
- McAndrew, J.; Fan, R.; Barba, R. Energized and foam fracturing fluids for liquids-rich organic shale reservoirs. In Proceedings of the AAPG 2014 Annual Convention & Exhibition, Houston, TX, USA, 6–9 April 2014. [Google Scholar]
- Fei, Y.; Gonzalez Perdomo, M.E.; Pokalai, K.; Haghighi, M. 3D Simulation of Hydraulic Fracturing by Foam Based Fluids Using a Fracture Propagation Model Coupled with Geomechanics in an Unconventional Reservoir the Cooper Basin, South Australia. In Proceedings of the International Conference on Geomechanics, Geo-energy and Geo-resources, Chengdu, China, 21–24 September 2018. [Google Scholar]
- Gu, M.; Mohanty, K. Rheology of polymer-free foam fracturing fluids. J. Pet. Sci. Eng. 2015, 134, 87–96. [Google Scholar] [CrossRef]
- Gu, M. Shale fracturing enhancement by using polymer-free foams and ultra-light weight proppants. Ph.D. Thesis, The University of Texas at Austin, Austin, TX, USA, 2013. [Google Scholar]
- Wright, C.A.; Weijers, L.; Davis, E.J.; Mayerhofer, M. Understanding Hydraulic Fracture Growth: Tricky but Not Hopeless. SPE 56724. In Proceedings of the SPE Annual Technical Conference and Exhibition, Houston, TX, USA, 3–6 October 1999. [Google Scholar] [CrossRef]
- Wilk, K.; Kasza, P.; Czupski, M. Dodatki do spienionych płynów szczelinujących. Przemysł Chem. 2018, 92, 1000–1005. [Google Scholar] [CrossRef]
- Wilk, K.; Kasza, P.; Czupski, M. Dobór dodatków do energetyzowanych płynów szczelinujących. Nafta Gaz 2016, 12, 1092–1100. [Google Scholar] [CrossRef]
- Wilk, K.; Kasza, P.; Labus, K. Impact of nitrogen foamed stimulation fluids stabilized by nanoadditives on reservoir rocks of hydrocarbon deposits. Nanomaterials 2019, 9, 766. [Google Scholar] [CrossRef]
- Recommended Practice for Standard Procedure for evaluation of Hydraulic Fracturing Fluids; American Petroleum Institute: Washington, DC, USA, 1983.
- Kasza, P. Zabiegi hydraulicznego szczelinowania w formacjach łupkowych. Nafta Gaz 2011, 12, 874–883. [Google Scholar]
- Belyadi, H.; Fathi, E.; Belyadi, F. Fracture Pressure Analysis and Perforation Design. In Hydraulic Fracturing in Unconventional Reservoirs Theories, Operations, and Economic Analysis; Gulf Professional Publishing: Houston, TX, USA, 2017; pp. 121–141. [Google Scholar] [CrossRef]
- Guo, B.; Liu, X.; Tan, X. Chapter 14—Hydraulic Fracturing. In Petroleum Production Engineering, 2nd ed.; Gulf Professional Publishing: Houston, TX, USA, 2017; pp. 389–501. ISBN 9780128096123. [Google Scholar]
- Kasza, P. Zabiegi hydraulicznego szczelinowania złóż niekonwencjonalnych i metody ich analizy. Pr. Nauk. Inst. Naft. i Gazu 2019, 226, 1–147. [Google Scholar]
- Andrade, J.; Civan, F.; Devegowda, D.; Sigal, R. Accurate Simulation of Shale Gas Reservoirs. SPE-135564-MS. In Proceedings of the SPE Annual Technical Conference and Exhibition, Florence, Italy, 19–22 September 2010. [Google Scholar] [CrossRef]
- Jia, B.; Tsau, J.-S.; Barati, R. Investigation of Shale-Gas-Production Behavior: Evaluation of the Effects of Multiple Physics on the Matrix; SPE-197069-PA; Society of Petroleum Engineers: Houston, TX, USA, 2019. [Google Scholar] [CrossRef]


| Non-Foamed Fluid | Fluid 50% N2 | ||
|---|---|---|---|
| Cw (m/min1/2) | Spurt (m3/m2) | Cw (m/min1/2) | Spurt (m3/m2) |
| 5.373·10−4 | 3.473·10−4 | 4.057·10−4 | 9.904·10−4 |
| Fluid Type | Time (min) | n’ (-) | K’ (Pa·sn’) | Dynamic Viscosity at a Given Shear Rate (mPa·s) | ||
|---|---|---|---|---|---|---|
| 40 s−1 | 100 s−1 | 170 s−1 | ||||
| Non-foamed | 9 | 0.6000 | 0.2154 | 49.2 | 34.1 | 27.6 |
| 18 | 0.6006 | 0.2172 | 49.8 | 34.5 | 27.9 | |
| 27 | 0.5982 | 0.2224 | 50.5 | 34.9 | 28.2 | |
| 50% N2 | 9 | 0.4043 | 1.4727 | 163.6 | 94.8 | 69.1 |
| 18 | 0.4038 | 1.4840 | 164.5 | 95.2 | 69.4 | |
| 27 | 0.3964 | 1.5414 | 166.2 | 95.6 | 69.4 | |
| Fluid Type | Time (min) | n’ (-) | K’ (Pa·sn’) | Dynamic Viscosity at a Given Shear Rate (mPa·s) | ||
|---|---|---|---|---|---|---|
| 40 s−1 | 100 s−1 | 170 s−1 | ||||
| Non-foamed | 9 | 0.7674 | 0.0436 | 18.5 | 14.9 | 13.2 |
| 18 | 0.7496 | 0.0475 | 18.9 | 15.0 | 13.1 | |
| 27 | 0.7620 | 0.0445 | 18.5 | 14.9 | 13.1 | |
| 50% N2 | 9 | 0.5801 | 0.4111 | 87.3 | 59.4 | 47.6 |
| 18 | 0.5630 | 0.4618 | 92.1 | 61.7 | 48.9 | |
| 27 | 0.5652 | 0.4613 | 92.8 | 62.3 | 49.4 | |
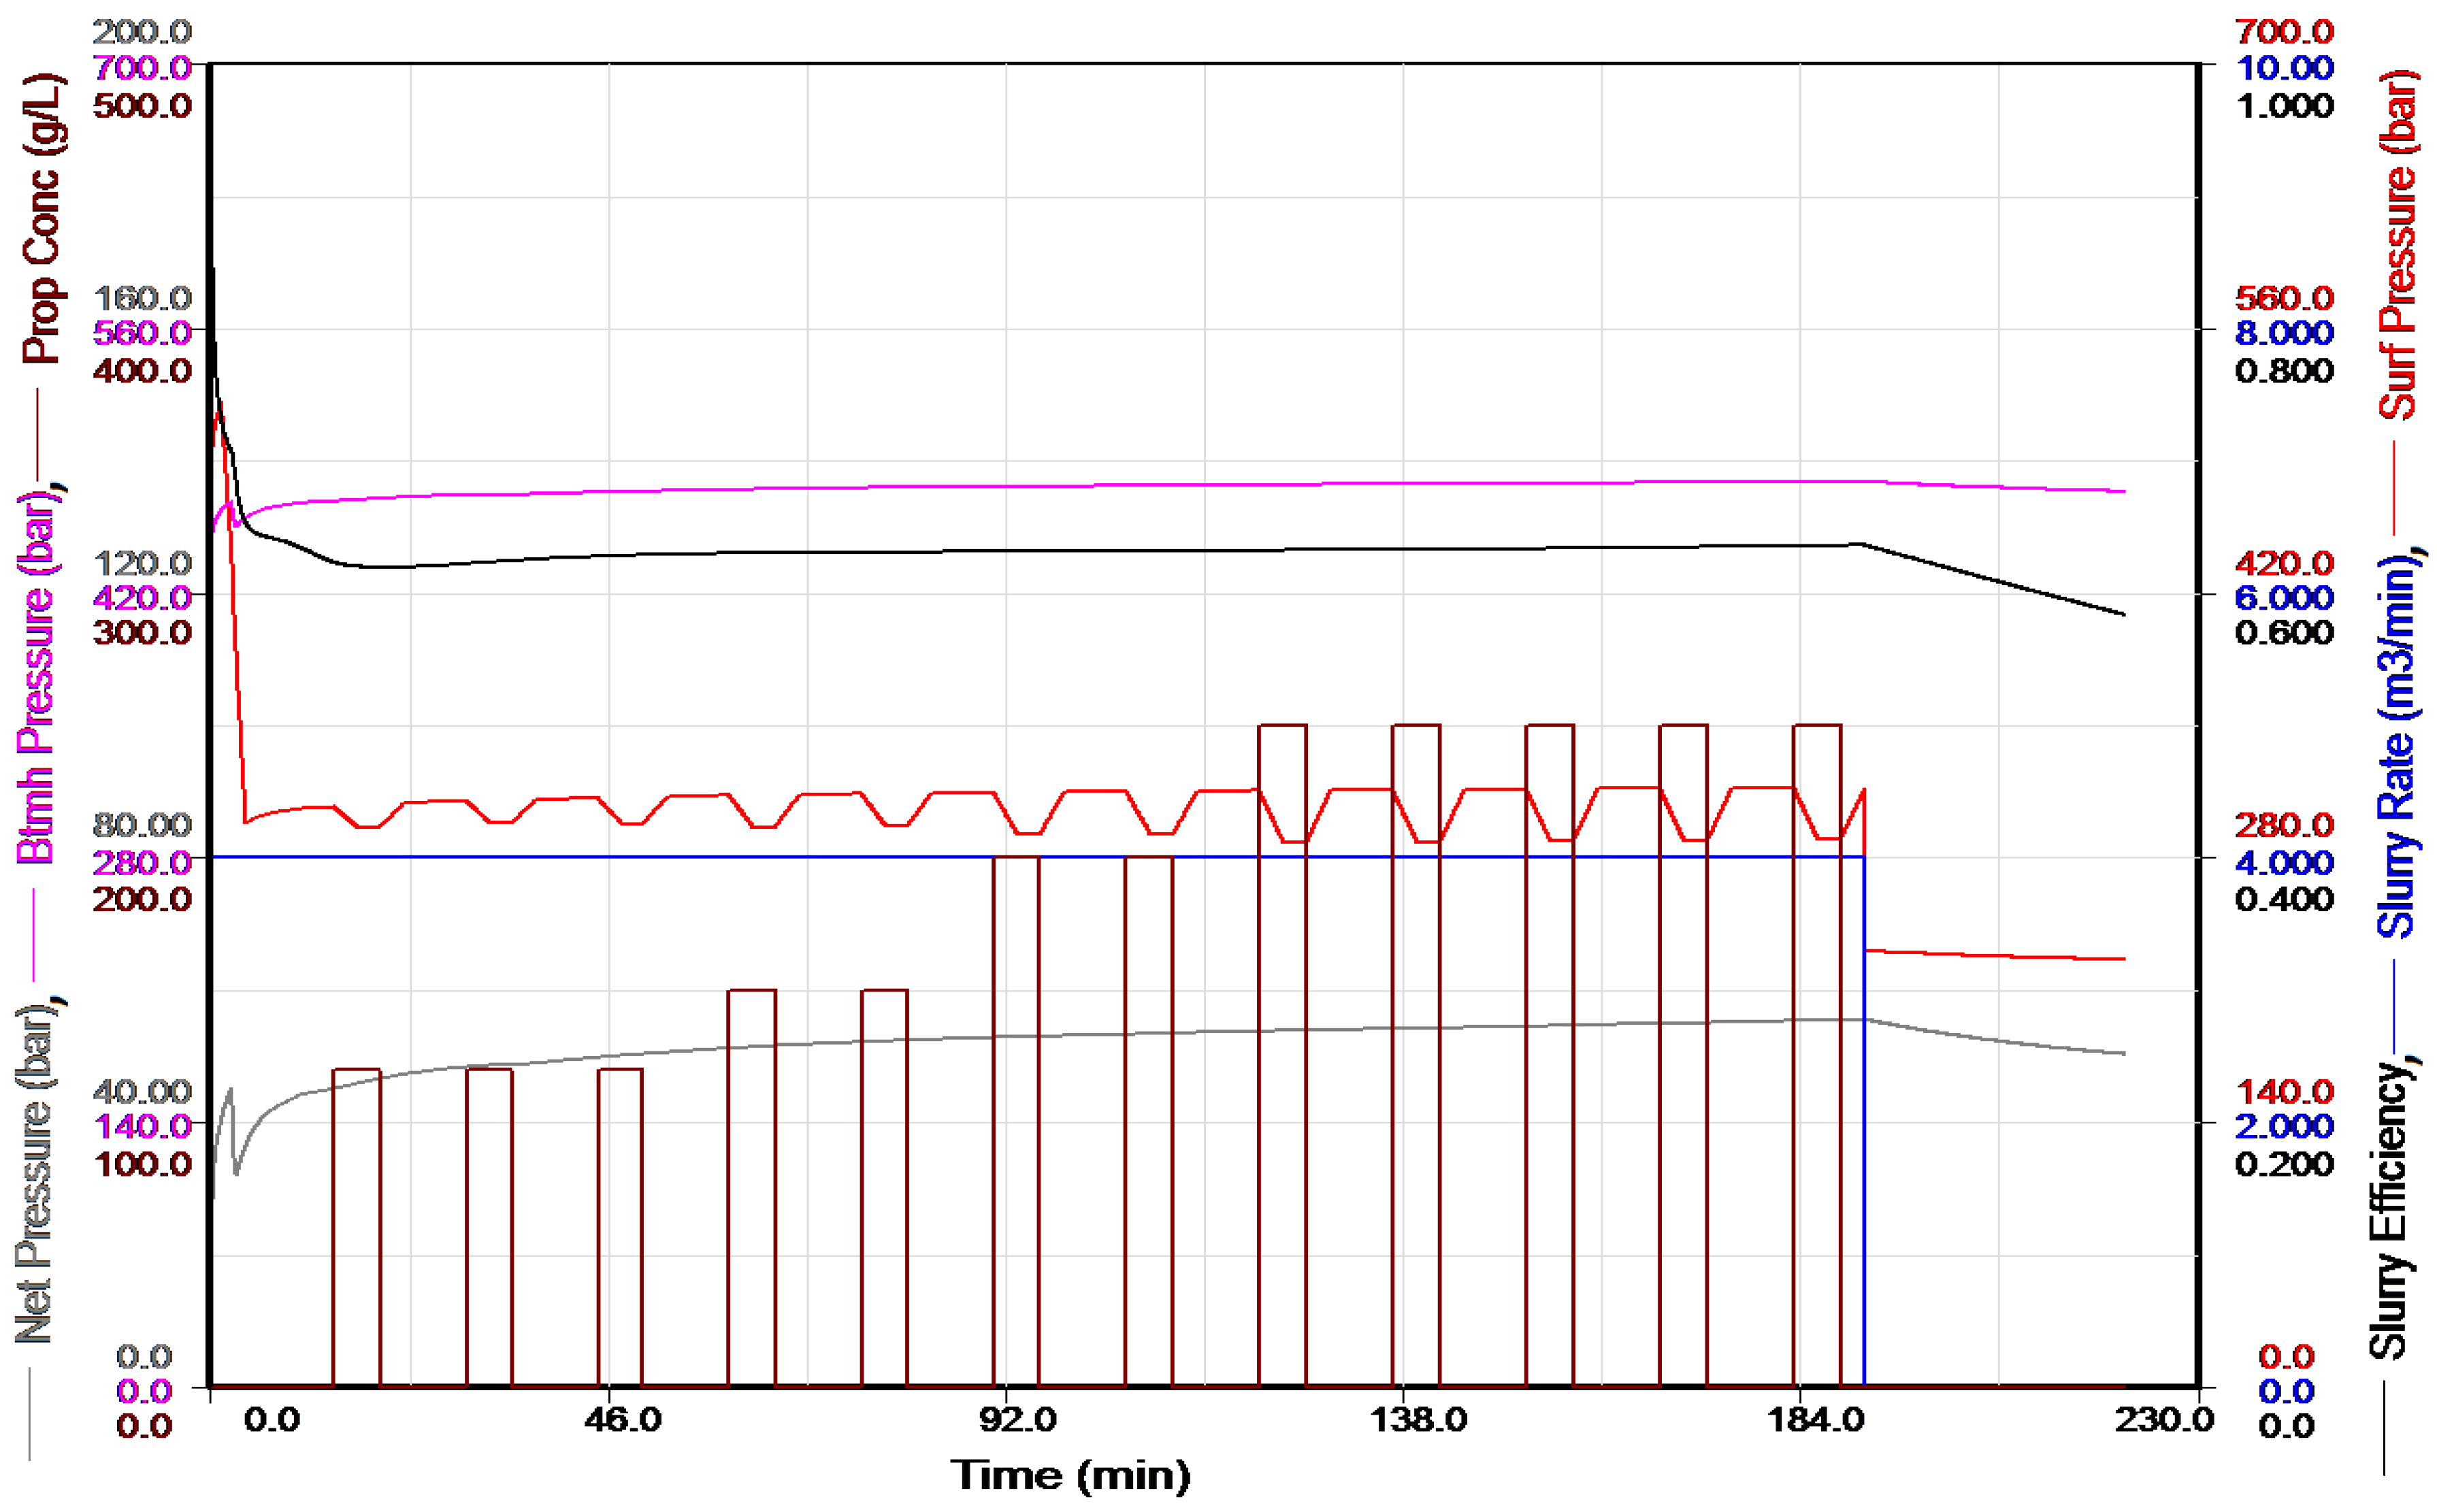
| Stage No. | Treatment Stage Type | Elapsed Time (min) | Fluid Type | Volume of Liquid without Proppant (m3) | Proppant Concentration (g/L) | Proppant per Stage (kg) | Slurry Rate (m3/min) | Proppant Type |
|---|---|---|---|---|---|---|---|---|
| - | Wellbore Fluid | 2% KCL | 11.26 | - | - | - | ||
| 1 | Main frac acid | 1 | 15%HCl | 5.00 | 0 | 0 | 4.0 | - |
| 2 | Main frac flush | 4 | Non-foamed | 12.00 | 0 | 0 | 4.0 | - |
| 3 | Main frac pad | 14 | Non-foamed | 40.00 | 0 | 0 | 4.0 | - |
| 4 | Prop slug | 19 | Non-foamed | 20.00 | 120 | 2400 | 4.0 | 100 mesh |
| 5 | Main frac pad | 29 | Non-foamed | 40.00 | 0 | 0 | 4.0 | - |
| 6 | Prop slug | 34 | Non-foamed | 20.00 | 120 | 2400 | 4.0 | 100 mesh |
| 7 | Main frac pad | 44 | Non-foamed | 40.00 | 0 | 0 | 4.0 | - |
| 8 | Main frac slurry | 49 | Non-foamed | 20.00 | 120 | 2400 | 4.0 | 30/50 |
| 9 | Main frac pad | 59 | Non-foamed | 40.00 | 0 | 0 | 4.0 | - |
| 10 | Main frac slurry | 65 | Non-foamed | 20.00 | 150 | 3000 | 4.0 | 30/50 |
| 11 | Main frac pad | 75 | Non-foamed | 40.00 | 0 | 0 | 4.0 | - |
| 12 | Main frac slurry | 80 | Non-foamed | 20.00 | 150 | 3000 | 4.0 | 30/50 |
| 13 | Main frac pad | 90 | Non-foamed | 40.00 | 0 | 0 | 4.0 | - |
| 14 | Main frac slurry | 95 | Non-foamed | 20.00 | 200 | 4000 | 4.0 | 30/50 |
| 15 | Main frac pad | 105 | Non-foamed | 40.00 | 0 | 0 | 4.0 | - |
| 16 | Main frac slurry | 111 | Non-foamed | 20.00 | 200 | 4000 | 4.0 | 30/50 |
| 17 | Main frac pad | 121 | Non-foamed | 40.00 | 0 | 0 | 4.0 | - |
| 18 | Main frac slurry | 126 | Non-foamed | 20.00 | 250 | 5000 | 4.0 | 30/50 |
| 19 | Main frac pad | 136 | Non-foamed | 40.00 | 0 | 0 | 4.0 | - |
| 20 | Main frac slurry | 142 | Non-foamed | 20.00 | 250 | 5000 | 4.0 | 30/50 |
| 21 | Main frac pad | 152 | Non-foamed | 40.00 | 0 | 0 | 4.0 | - |
| 22 | Main frac slurry | 157 | Non-foamed | 20.00 | 250 | 5000 | 4.0 | 30/50 |
| 23 | Main frac pad | 167 | Non-foamed | 40.00 | 0 | 0 | 4.0 | - |
| 24 | Main frac slurry | 173 | Non-foamed | 20.00 | 250 | 5000 | 4.0 | 30/50 |
| 25 | Main frac pad | 183 | Non-foamed | 40.00 | 0 | 0 | 4.0 | - |
| 26 | Main frac slurry | 188 | Non-foamed | 20.00 | 250 | 5000 | 4.0 | 30/50 |
| 27 | Main frac flush | 191 | Non-foamed | 11.00 | 0 | 0 | 4.0 | - |
| 28 | Shut-in | 221 | SHUT-IN | 0 | 0 | 0 | 0.0 | - |
| Treatment Stage Type | Elapsed Time (min) | Fluid Type | Bottom N2 Quality (%) | Bottom Clean Foam vol (m3) | Bottom Proppant Concentration (g/L) | Proppant per Stage (kg) | Bottom Slurry Foam Rate (m3/min) | Proppant Type |
|---|---|---|---|---|---|---|---|---|
| 1 | 1 | 15% HCl | 0 | 5.00 | 0 | 0 | 4.00 | - |
| 2 | 4 | Non-foamed | 0 | 12.00 | 0 | 0 | 4.00 | - |
| 3 | 6 | Non-foamed | 0 | 10.00 | 0 | 0 | 4.00 | - |
| 4 | 12 | Non-foamed | 0 | 20.00 | 120 | 2400 | 4.00 | 100 mesh |
| 5 | 22 | Non-foamed | 0 | 40.00 | 0 | 0 | 4.00 | - |
| 6 | 27 | Non-foamed | 0 | 20.00 | 120 | 2400 | 4.00 | 100 mesh |
| 7 | 37 | Non-foamed | 0 | 40.00 | 0 | 0 | 4.00 | - |
| 8 | 42 | Non-foamed | 0 | 20.00 | 120 | 2400 | 4.00 | 30/50 |
| 9 | 62 | Non-foamed | 0 | 40.00 | 0 | 0 | 2.00 | - |
| 10 | 73 | N2 50% | 50.7 | 40.56 | 74 | 3000 | 3.95 | 30/50 |
| 11 | 93 | N2 50% | 49.3 | 78.94 | 0 | 0 | 3.95 | - |
| 12 | 103 | N2 50% | 51.6 | 41.28 | 121 | 5000 | 3.95 | 30/50 |
| 13 | 118 | N2 50% | 49.3 | 59.20 | 0 | 0 | 3.95 | - |
| 14 | 135 | N2 50% | 52.3 | 62.90 | 162 | 10,200 | 3.95 | 30/50 |
| 15 | 150 | N2 50% | 49.3 | 59.20 | 0 | 0 | 3.95 | - |
| 16 | 167 | N2 50% | 52.4 | 63.01 | 167 | 10,500 | 3.95 | 30/50 |
| 17 | 182 | N2 50% | 49.3 | 59.20 | 0 | 0 | 3.95 | - |
| 18 | 199 | N2 50% | 52.4 | 63.01 | 167 | 10,500 | 3.95 | 30/50 |
| 19 | 205 | Non-foamed | 0 | 11.00 | 0 | 0 | 2.00 | - |
| 20 | 220 | SHUT-IN | 0 | 0 | 0 | 0 | 0 | - |
| Layer Number | Top of Zone Measured depth (m) | Lithostratigraphy | Fracture Toughness (kPa·cm1/2) | Young’s Modulus (bar) | Poisson’s Ratio | Stress Gradient (bar/m) |
|---|---|---|---|---|---|---|
| 1 | 0 | Overburden | 21,976.9 | 4.14 × 10⁵ | 0.250 | 0.190 |
| 2 | 2343 | Salt | 10,988.4 | 2.40 × 10⁵ | 0.440 | 0.190 |
| 3 | 2463 | Anhydrite | 16,482.7 | 5.20 × 10⁵ | 0.300 | 0.180 |
| 4 | 2479 | Limestone | 5494.2 | 1.00 × 10⁵ | 0.300 | 0.180 |
| 5 * | 2483 | Rotliegend | 10,988.4 | 2.00 × 10⁵ | 0.245 | 0.170 |
| 6 | 2501 | Anhydrite | 16,482.7 | 5.20 × 10⁵ | 0.300 | 0.180 |
| 7 * | 2503 | Rotliegend | 10,988.4 | 2.00 × 10⁵ | 0.245 | 0.170 |
| 8 | 2510 | Anhydrite | 16,482.7 | 5.20 × 10⁵ | 0.300 | 0.180 |
| 9 | 2512 | Sandstone | 10,988.4 | 3.45 × 10⁵ | 0.200 | 0.180 |
| 10 | 2660 | Underlying rocks | 21,976.9 | 4.14 × 10⁵ | 0.250 | 0.190 |
| 11 | 3000 | Underlying rocks | 21,976.9 | 4.14 × 10⁵ | 0.250 | 0.190 |
| Non-Foamed Fluid | Foamed Fluid | |
|---|---|---|
| Quantity | ||
| 15% HCl | 5.0 m3 | 5.0 m3 |
| Linear gel 3.6 g/L | 743.0 m3 | 473.0 m3 |
| N2 | - | 89,244.7 sm3 |
| Proppant 100 mesh | 4800.0 kg | 4800.0 kg |
| Proppant 30/50 mesh | 41,399.9 kg | 41,600.0 kg |
| Average pumping rate | 4 m3/min | 4 m3/min |
| Reservoir temperature in the perforation interval | 60 °C | |
| Reservoir pressure in the perforation interval | 250 bar | |
| Parameters | Non-Foamed Fluid | Fluid 50% N2 |
|---|---|---|
| Fracture Length (m) | 206.8 | 202.1 |
| Propped Length (m) | 206.8 | 202.1 |
| Total Fracture Height (m) | 83.0 | 76.6 |
| Total Propped Height (m) | 83.0 | 76.6 |
| Fracture Top Depth (m) | 2453.1 | 2459.8 |
| Fracture Bottom Depth (m) | 2536.1 | 2536.4 |
| Average Fracture Width (cm) | 1.2 | 1.5 |
| Average Proppant Concentration (kg/m2) | 1.5 | 1.7 |
| Dimensionless Conductivity | 2.699 | 2.785 |
| Total Clean Fluid Pumped (without proppant) (m3) | 750.8 | 750.1 |
| Total Slurry Pumped (with proppant) (m3) | 766.2 | 765.5 |
| Design proppant pumped (kg) | 46,200 | 46,400 |
© 2019 by the author. Licensee MDPI, Basel, Switzerland. This article is an open access article distributed under the terms and conditions of the Creative Commons Attribution (CC BY) license (http://creativecommons.org/licenses/by/4.0/).
Share and Cite
Wilk, K. Experimental and Simulation Studies of Energized Fracturing Fluid Efficiency in Tight Gas Formations. Energies 2019, 12, 4465. https://doi.org/10.3390/en12234465
Wilk K. Experimental and Simulation Studies of Energized Fracturing Fluid Efficiency in Tight Gas Formations. Energies. 2019; 12(23):4465. https://doi.org/10.3390/en12234465
Chicago/Turabian StyleWilk, Klaudia. 2019. "Experimental and Simulation Studies of Energized Fracturing Fluid Efficiency in Tight Gas Formations" Energies 12, no. 23: 4465. https://doi.org/10.3390/en12234465
APA StyleWilk, K. (2019). Experimental and Simulation Studies of Energized Fracturing Fluid Efficiency in Tight Gas Formations. Energies, 12(23), 4465. https://doi.org/10.3390/en12234465