Carbon Handprint: Potential Climate Benefits of a Novel Liquid-Cooled Base Station with Waste Heat Reuse

 , ,
, ,
Abstract
:
1. Introduction
2. Materials and Methods
2.1. Description of the Proposed Handprint Solution Liquid-Cooled Base Station Technology
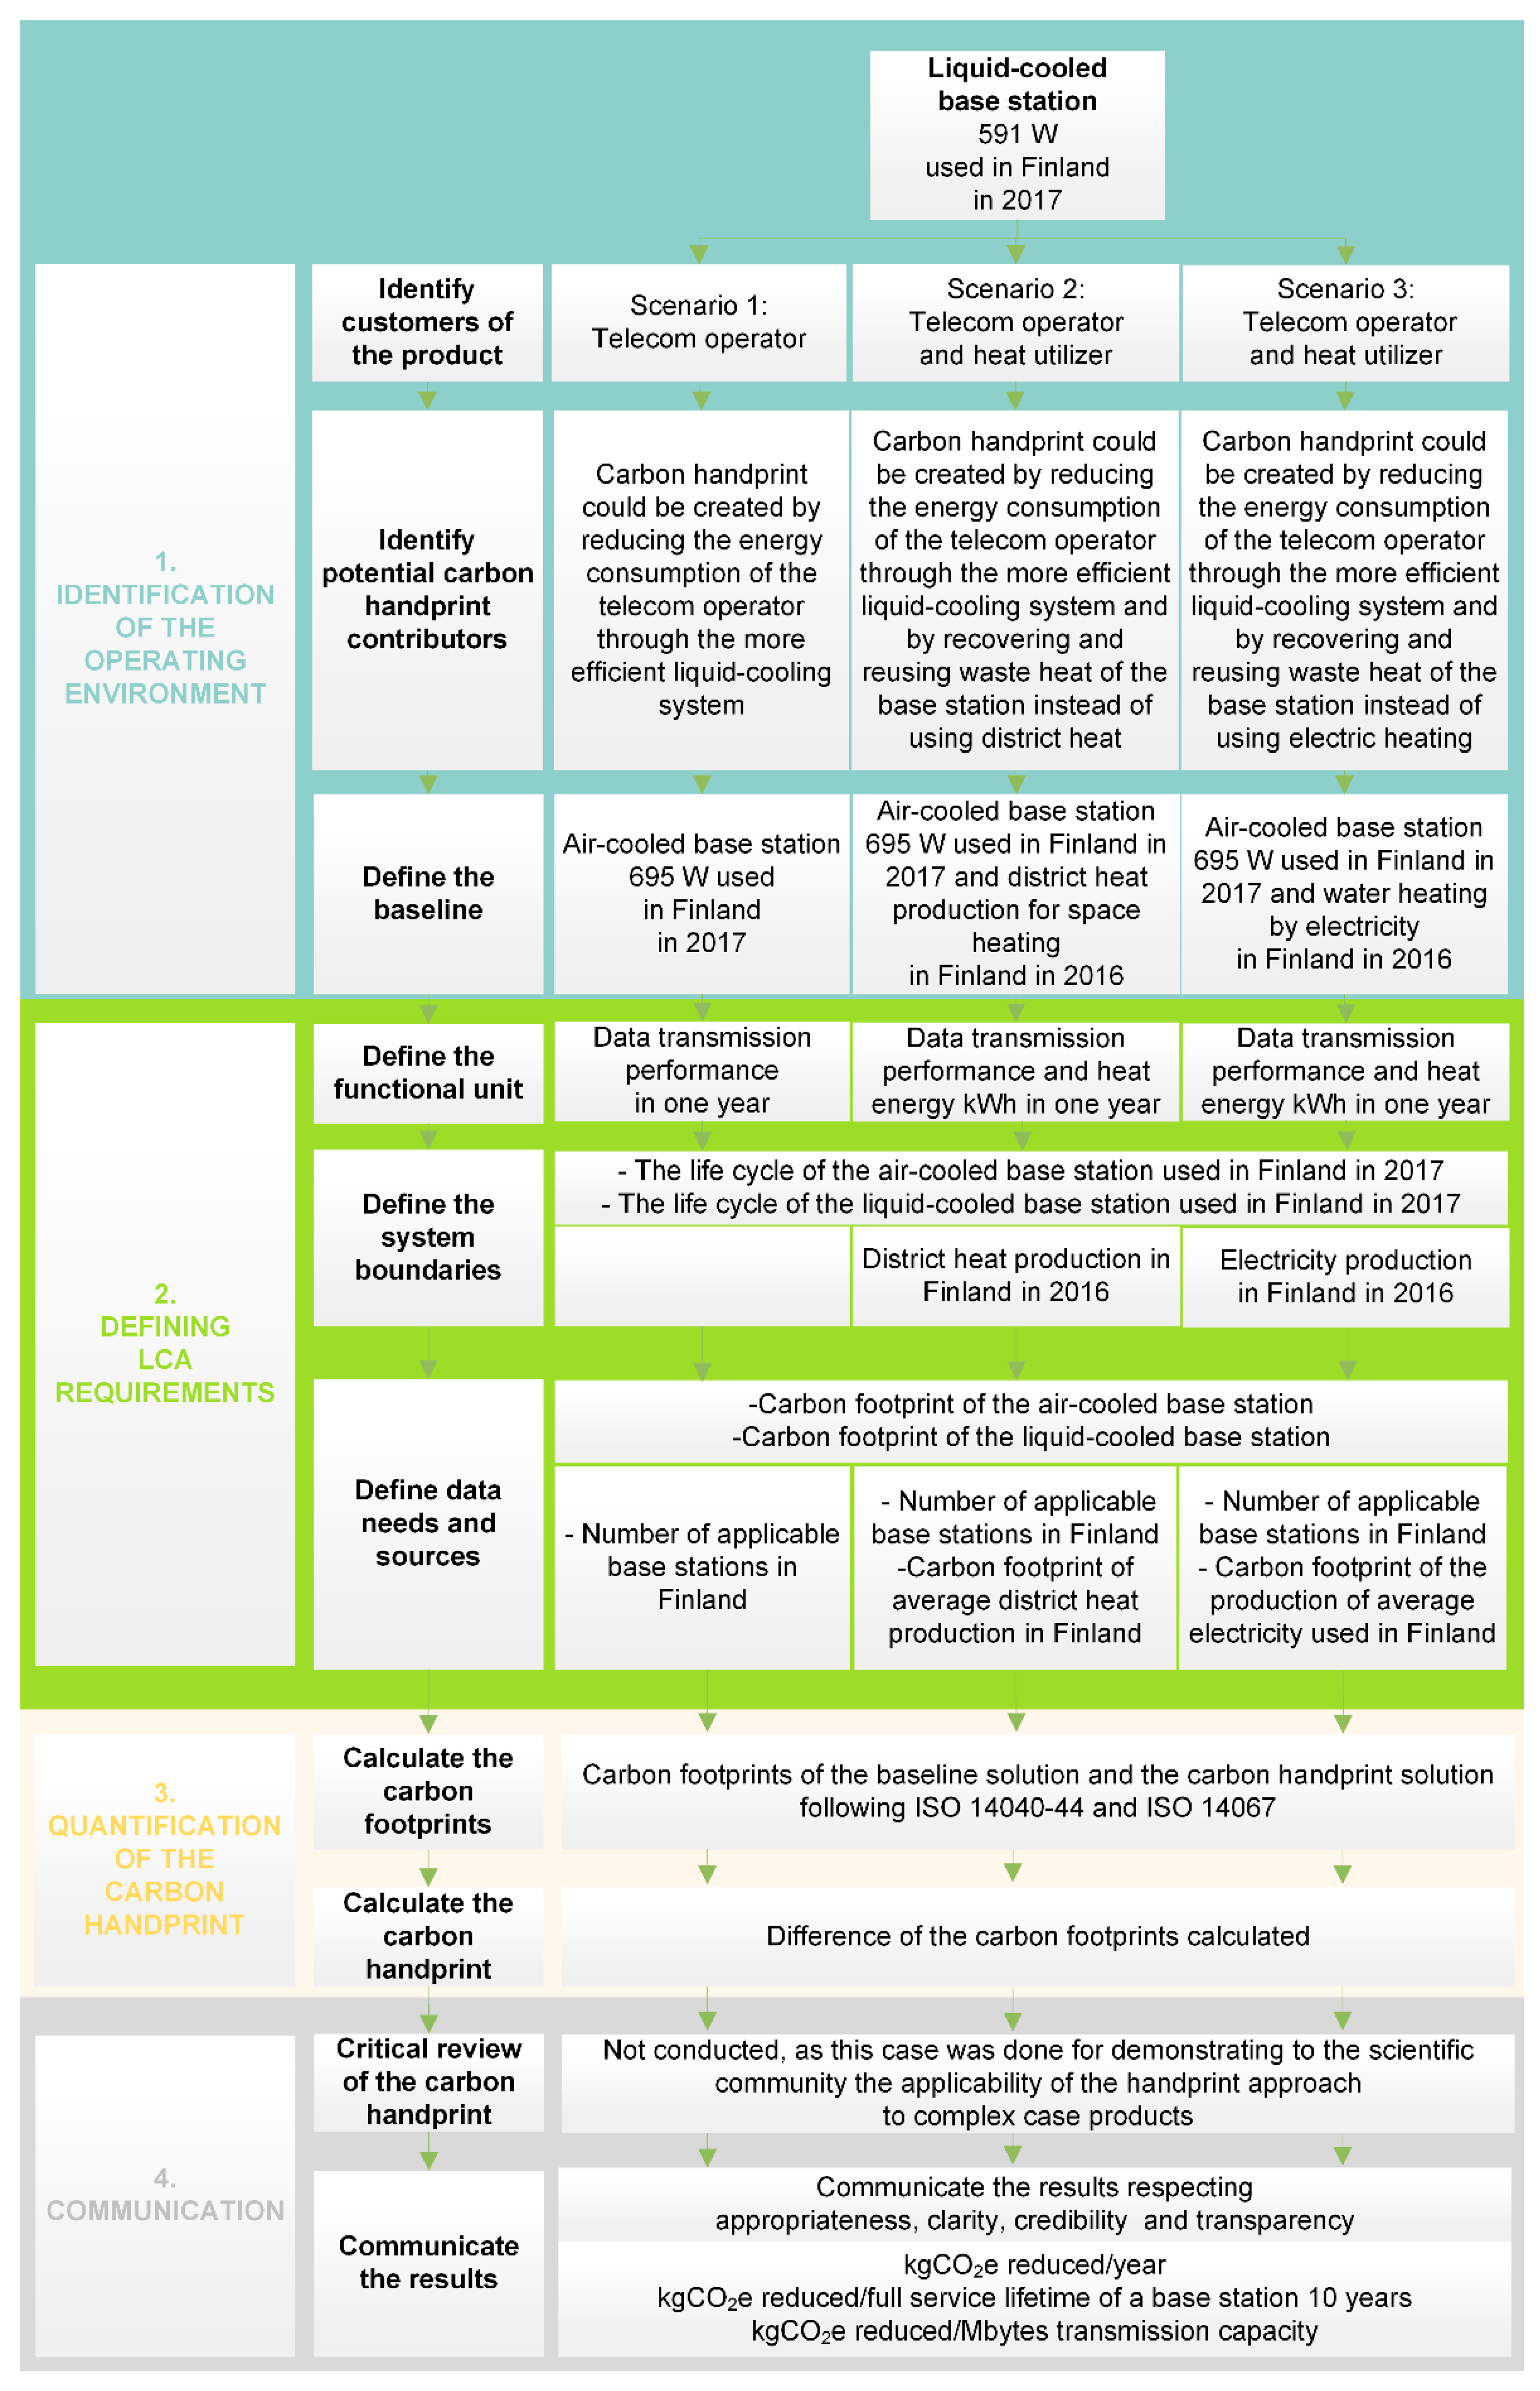
2.2. Identification of the Operating Environment
2.2.1. Identification of Potential Customers and Contributors to Reduced GHG Emissions
2.2.2. Defining the Baseline Situations
2.3. Defining LCA Requirements
2.3.1. Defining the Functional Units
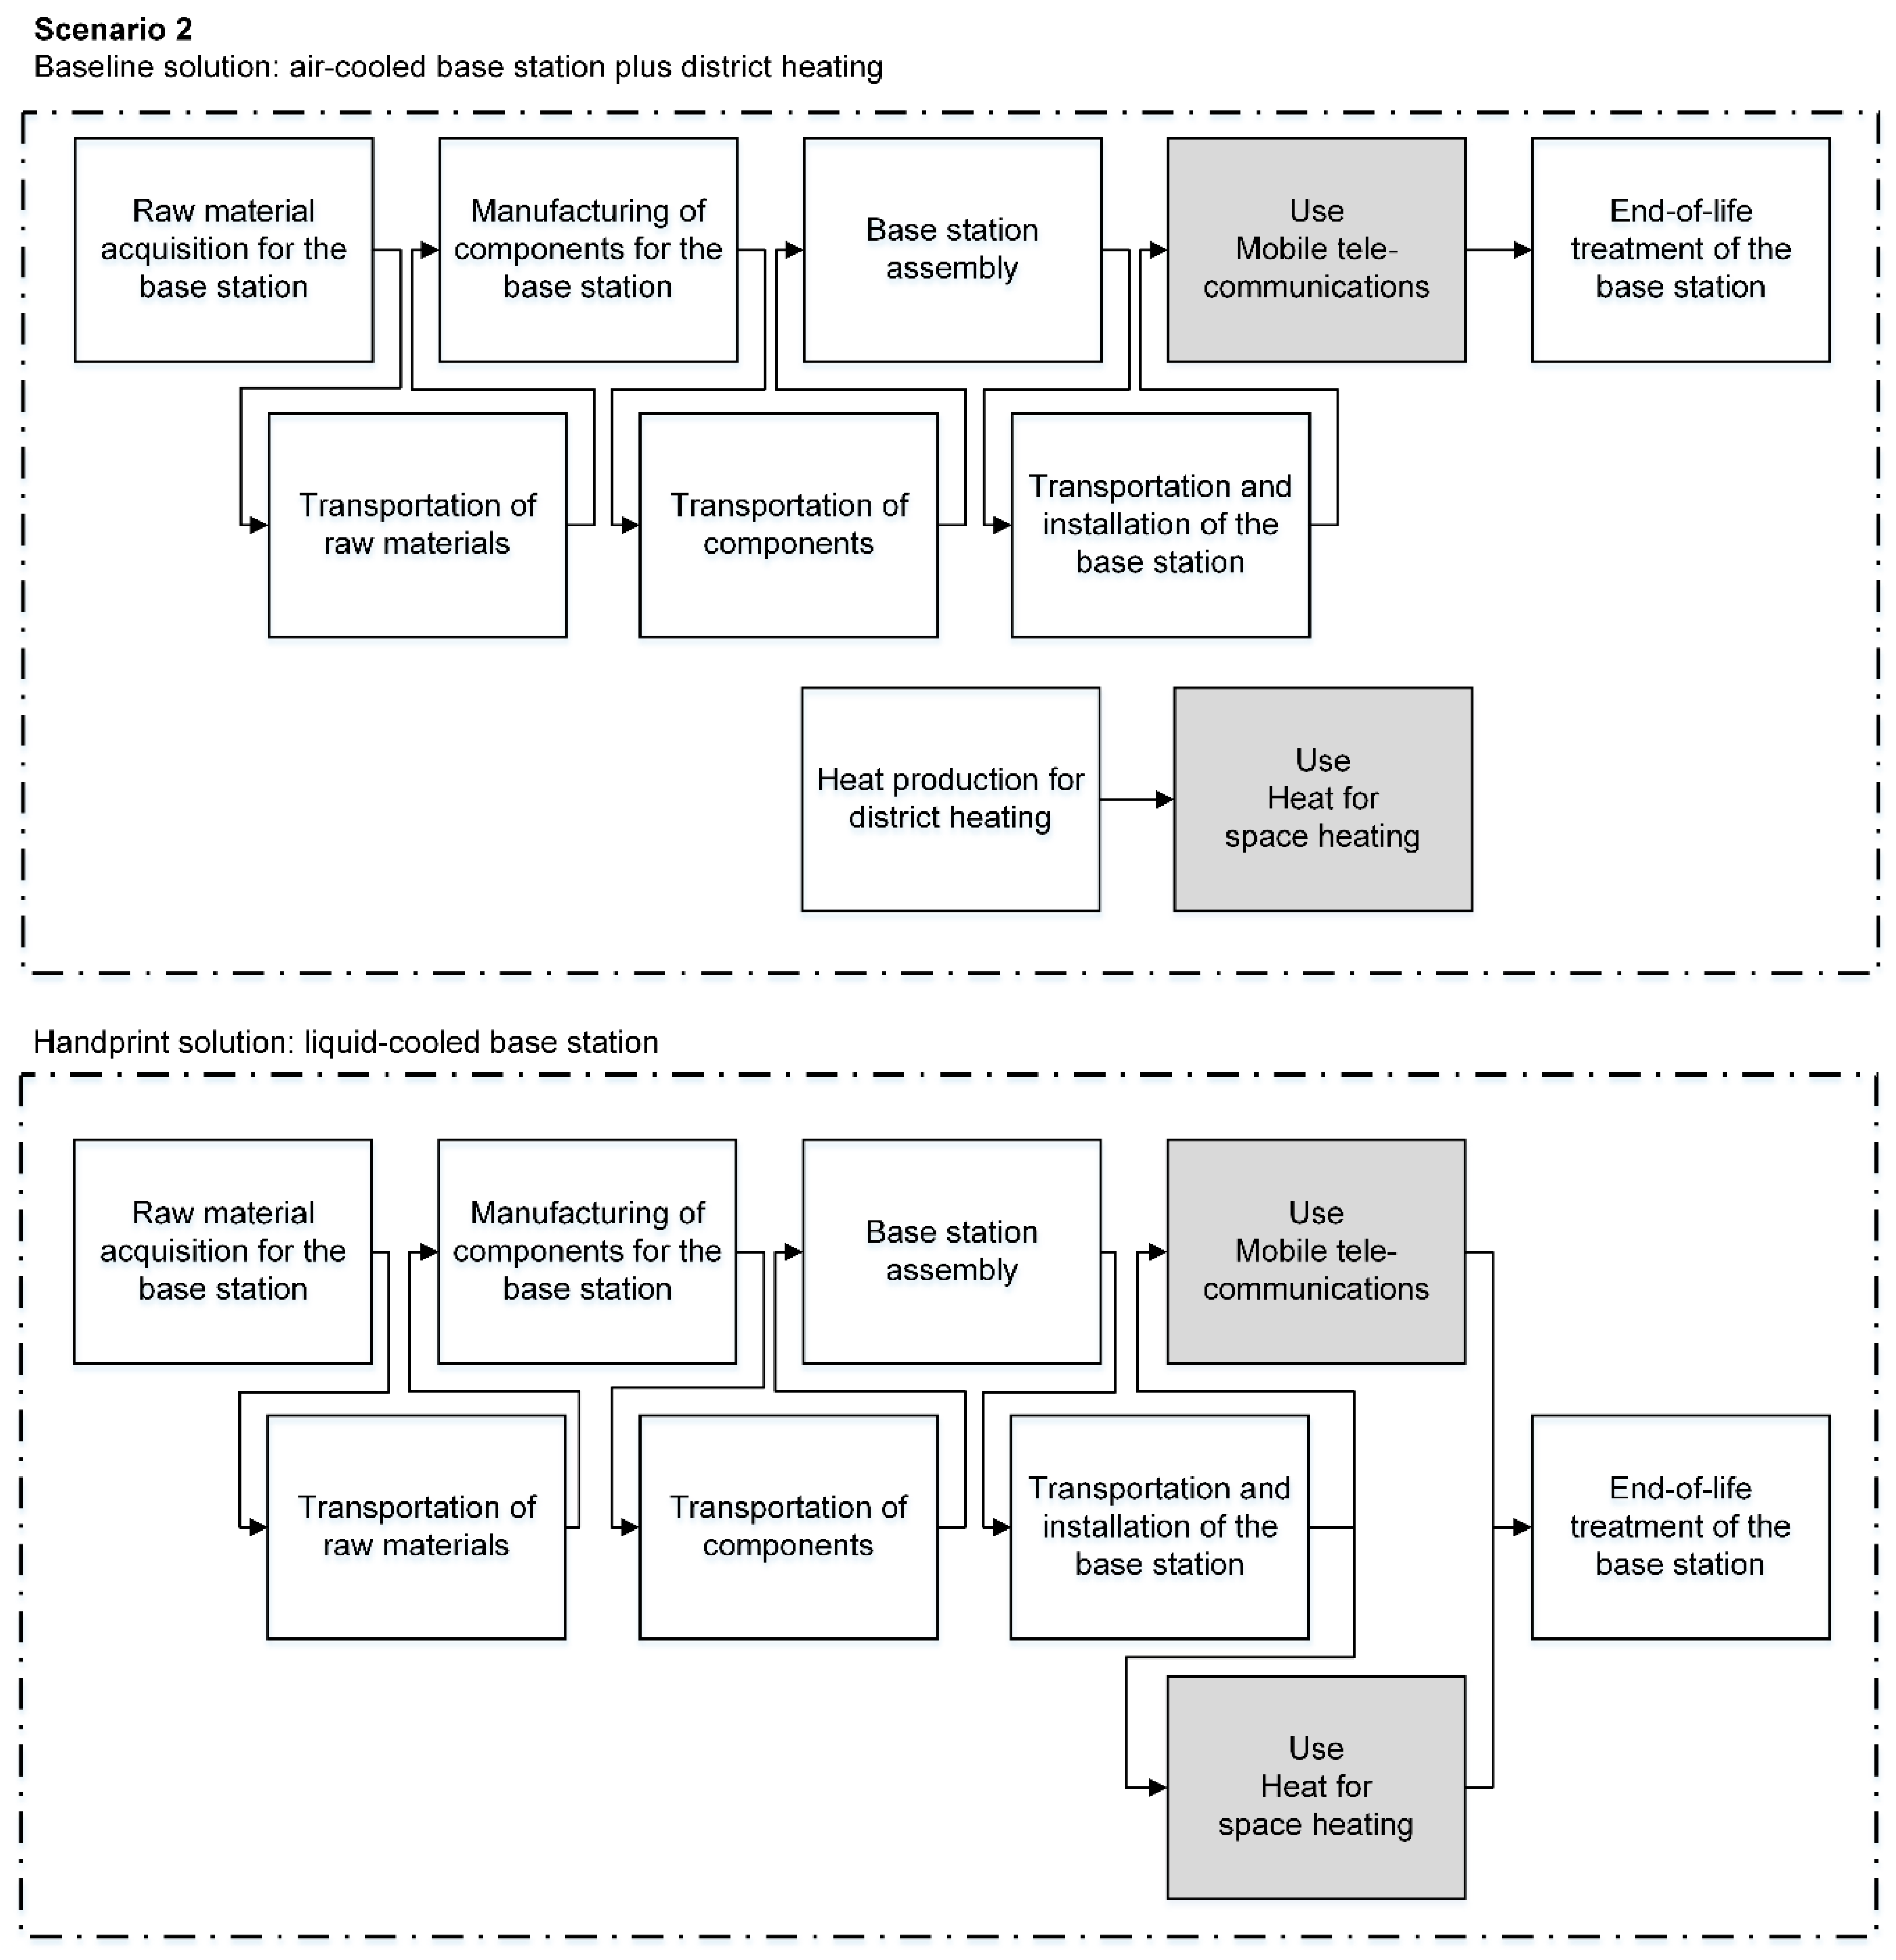
2.3.2. Defining the System Boundaries
2.3.3. Defining Data Needs and Sources
2.4. Quantification of the Carbon Handprint
2.5. Communication
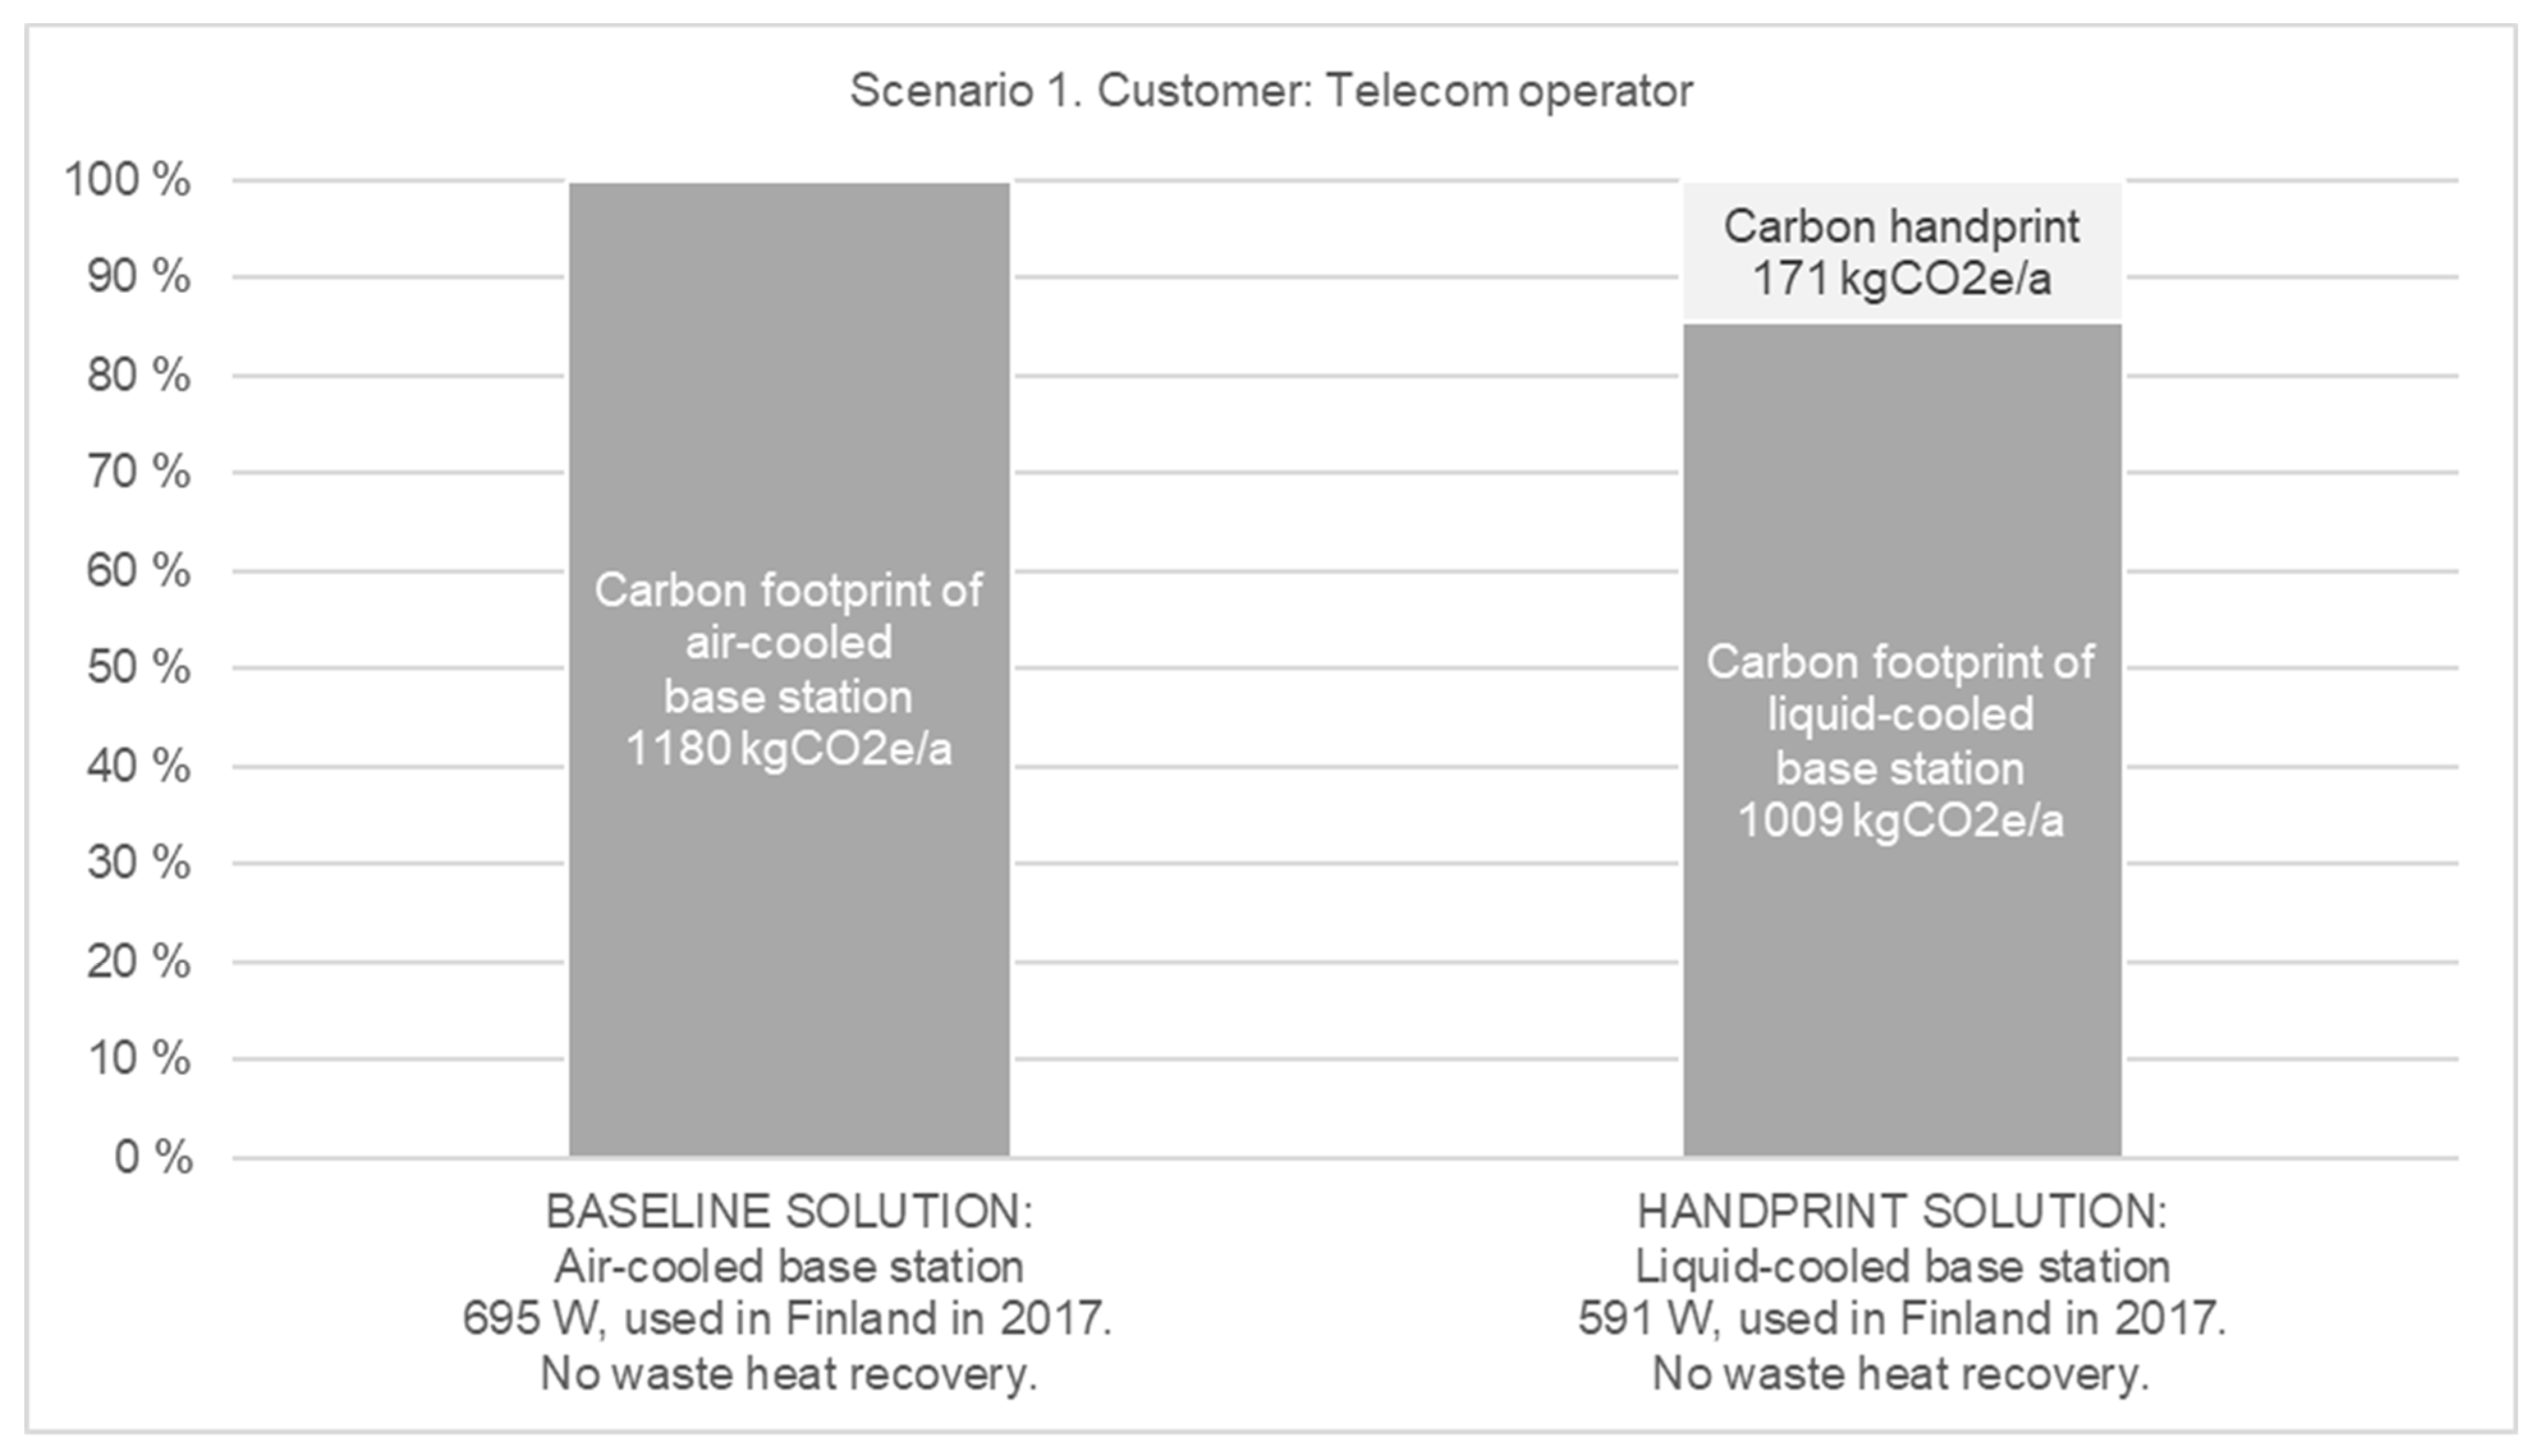
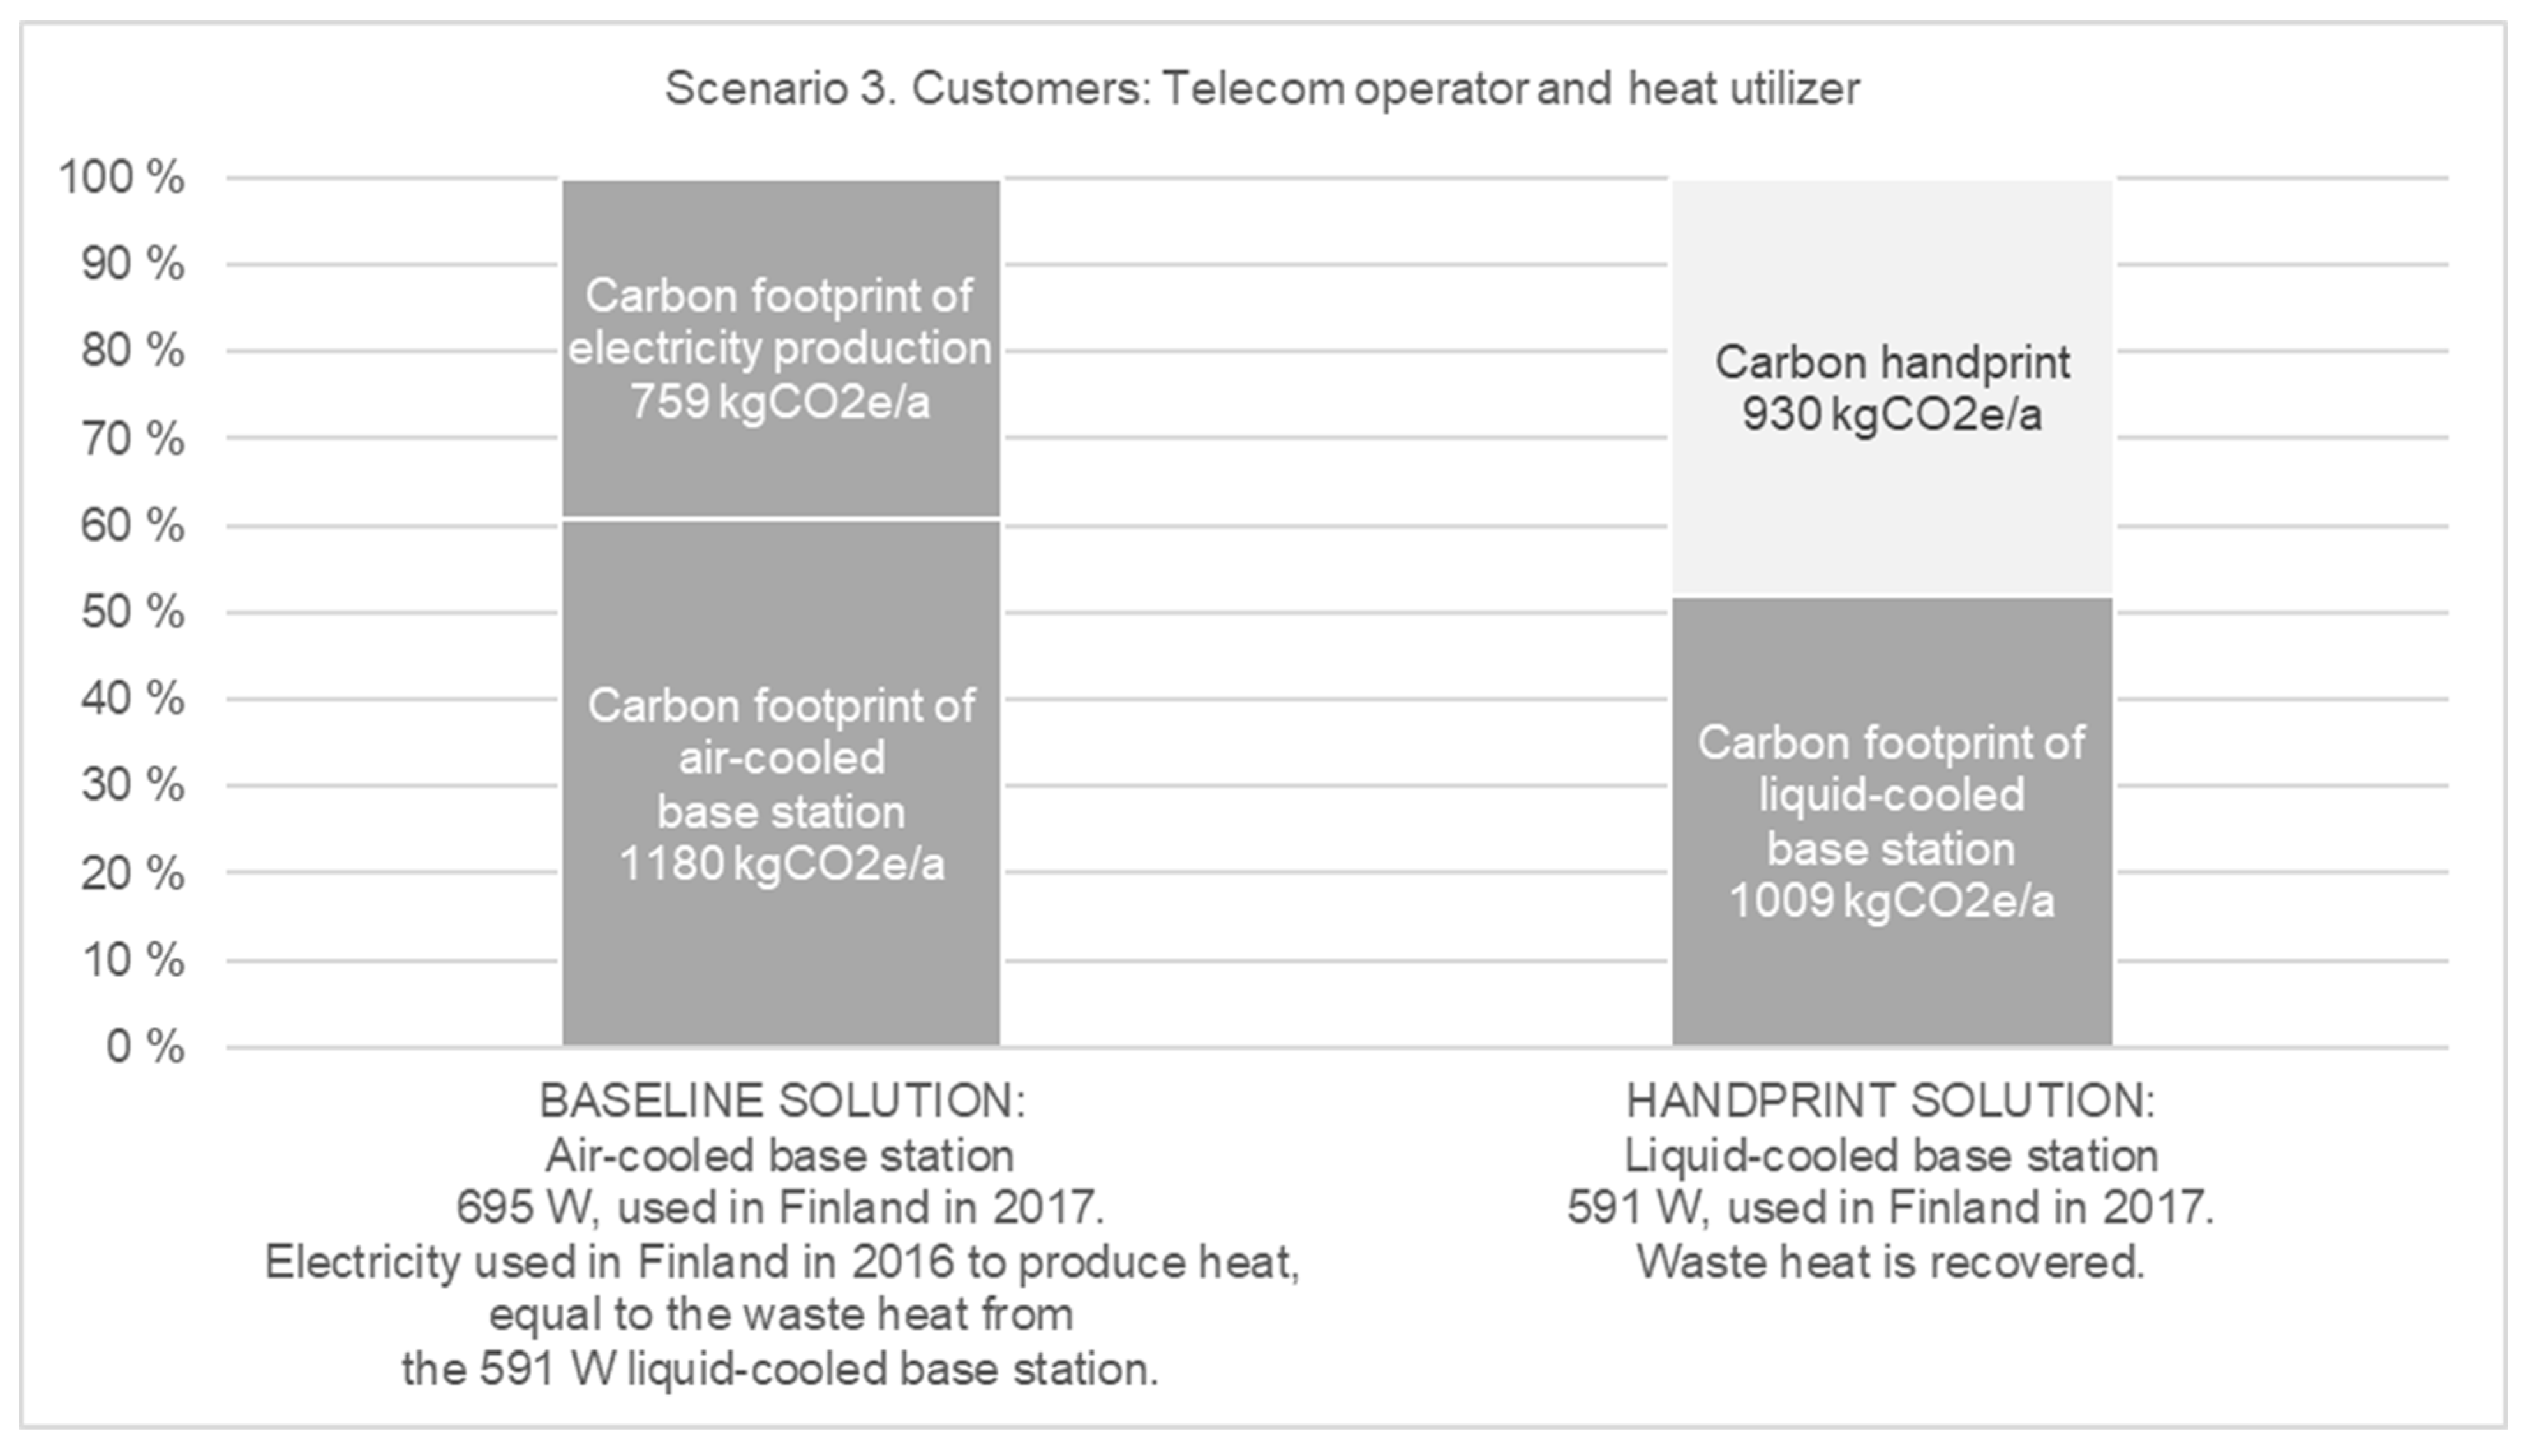
3. Results
4. Discussion
Author Contributions
Funding
Conflicts of Interest
References
- IPCC. Global Warming of 1.5 °C. Summary for Policymakers. Available online: http://report.ipcc.ch/sr15/pdf/sr15_spm_final.pdf (accessed on 11 January 2019).
- UNGC; CDP; WWF; WRI. Companies Taking Action. Available online: https://sciencebasedtargets.org/companies-taking-action/ (accessed on 29 October 2018).
- Dyllick, T.; Rost, Z. Towards true product sustainability. J. Clean. Prod. 2017, 162, 346–360. [Google Scholar] [CrossRef]
- Grönman, K.; Pajula, T.; Sillman, J.; Leino, M.; Vatanen, S.; Kasurinen, H.; Soininen, A.; Soukka, R. Carbon handprint—An approach to assess the positive climate impacts of products demonstrated via renewable diesel case. J. Clean. Prod. 2019, 206, 1059–1072. [Google Scholar] [CrossRef]
- Nörtershauser, D.; Le Masson, S.; Volkov, T.; Galkin, T.; Amper, O.; Huttunen, J. Experimental liquid cooled base station. INTELEC Int. Telecommun. Energy Conf. 2016. [Google Scholar] [CrossRef]
- A World-first: Nokia, Elisa and Efore Commercially Deploy a Liquid-Cooled Base Station that Can Reduce CO2 Emissions by Up to 80 Percent. Available online: https://www.nokia.com/about-us/news/releases/2018/12/10/a-world-first-nokia-elisa-and-efore-commercially-deploy-a-liquid-cooled-base-station-that-can-reduce-co2-emissions-by-up-to-80-percent/ (accessed on 10 December 2018).
- Water—the Cool New Way to Take the Heat out of Hase Station Site Energy Costs. Available online: https://www.nokia.com/blog/water-cool-new-way-take-heat-base-station-site-energy-costs/ (accessed on 30 October 2019).
- Liu, J.; Goraczko, M.; James, S.; Belady, C.; Lu, J.; Whitehouse, K. The Data Furnace: Heating Up with Cloud Computing. Available online: https://www.usenix.org/legacy/event/hotcloud11/tech/final_files/LiuGoraczko.pdf (accessed on 14 December 2018).
- Woodruff, Z.J.; Brenner, P.; Buccellato, A.P.C.; Go, D.B. Environmentally opportunistic computing: A distributed waste heat reutilization approach to energy-efficient buildings and data centers. Energy Build. 2014, 69, 41–50. [Google Scholar] [CrossRef]
- Han, C.; Harrold, T.; Armour, S.; Krikidis, I.; Videv, S.; Grant, P.M.; Haas, H.; Thompson, J.S.; Ku, I.; Wang, C.-X.; et al. Green radio: Radio techniques to enable energy-efficient wireless networks. IEEE Commun. Mag. 2011, 49, 46–54. [Google Scholar] [CrossRef]
- Belkhir, L.; Elmeligi, A. Assessing ICT global emissions footprint: Trends to 2040 & recommendations. J. Clean. Prod. 2018, 177, 448–463. [Google Scholar] [CrossRef]
- Capone, A.; D’Elia, S.; Filippini, I.; Redondi, A.E.C.; Zangani, M. Modeling Energy Consumption of Mobile Radio Networks: An Operator Perspective. IEEE Wirel. Commun. 2017, 24, 120–126. [Google Scholar] [CrossRef]
- Pihkola, H.; Hongisto, M.; Apilo, O.; Lasanen, M. Evaluating the energy consumption of mobile data transfer—From technology development to consumer behaviour and life cycle thinking. Sustainability 2018, 10, 2494. [Google Scholar] [CrossRef]
- Vodafone Minimising Our Carbon Footprint—Our Approach. Available online: https://www-origin2-vp.vodafone.com/content/dam/sustainability/2015/pdf/environment/minimising-our-carbon-footprint.pdf (accessed on 20 December 2018).
- European Commission COM (2016) 773 Final Communication from the Commission: Ecodesign Working Plan 2016–2019. 2016. Available online: https://eur-lex.europa.eu/legal-content/EN/TXT/PDF/?uri=CELEX:52016DC0773&rid=1 (accessed on 21 November 2019).
- Pajula, T.; Vatanen, S.; Pihkola, H.; Grönman, K.; Kasurinen, H.; Soukka, R. Carbon Handprint Guide. Available online: https://www.vtt.fi/sites/handprint/PublishingImages/Carbon_Handprint_Guide.pdf (accessed on 11 December 2018).
- Vatanen, S.; Grönman, K.; Pajula, T.; Pihkola, H.; Soukka, R.; Kasurinen, H.; Behm, K.; Hohenthal, C.; Sillman, J.; Leino, M. The Carbon Handprint Approach to Assessing and Communicating the Positive Climate Impact of Products. Available online: https://www.vtt.fi/inf/pdf/technology/2018/T346.pdf (accessed on 20 December 2018).
- Davies, G.F.; Maidment, G.G.; Tozer, R.M. Using data centres for combined heating and cooling: An investigation for London. Appl. Therm. Eng. 2016, 94, 296–304. [Google Scholar] [CrossRef]
- Wahlroos, M.; Pärssinen, M.; Manner, J.; Syri, S. Utilizing data center waste heat in district heating—Impacts on energy efficiency and prospects for low-temperature district heating networks. Energy 2017, 140, 1228–1238. [Google Scholar] [CrossRef]
- Palvelinkeskusten Hukkalämpö Kaukolämmöksi (“Waste Heat of Data Centers to District Heat”). Available online: https://www.fortum.fi/palvelinkeskusten-hukkalampo-kaukolammoksi (accessed on 11 December 2018).
- Ebrahimi, K.; Jones, G.F.; Fleischer, A.S. A review of data center cooling technology, operating conditions and the corresponding low-grade waste heat recovery opportunities. Renew. Sustain. Energy Rev. 2014, 31, 622–638. [Google Scholar] [CrossRef]
- Zimmermann, S.; Meijer, I.; Tiwari, M.K.; Paredes, S.; Michel, B.; Poulikakos, D. Aquasar: A hot water cooled data center with direct energy reuse. Energy 2012, 43, 237–245. [Google Scholar] [CrossRef]
- Data Viihtyy Viileässä (“Data likes It Cool”). Available online: http://www.e-julkaisu.fi/skll/ke1801/ (accessed on 6 June 2019).
- Tukiasema-Antennien Asentaminen (“Installation of Base Station Antennas”). Available online: https://www.julkari.fi/bitstream/handle/10024/126619/STUK_opastaa_Huhtikuu_2014.pdf?sequence=1 (accessed on 31 October 2018).
- Energiavuosi 2017 Kaukolämpö (“Energy in 2017 District Heat”). Available online: https://energia.fi/files/2342/Kaukolampovuosi2017_mediakalvot_paivitetty20180202.pptx (accessed on 11 December 2018).
- District Heating Warms Your Home Reliably. Available online: https://www.fortum.com/products-and-services/heating-cooling/district-heating-warms-your-home-reliably (accessed on 11 December 2018).
- Myy Hukkalämpö Avoimeen Kaukolämpöverkkoomme (“Sell Your Waste Heat to Our Open District Heating Network”). Available online: https://www.vantaanenergia.fi/lampo/myy-hukkalampo-eteenpain-avoimeen-kaukolampoverkkoomme/ (accessed on 11 December 2018).
- Yandexin Datakeskuksen Lämmön Kierrättäminen Kaukolämpöverkkoon Toi Meille Voiton Vuoden Ilmastoteko 2016—Kilpailussa (“Recycling Heat from the Yandex Data Center to District Heating Network Won Climate Action of the Year 2016 Competition”). Available online: https://www.nivos.fi/voitimme-vuoden-ilmastoteko-2016-palkinnon (accessed on 11 December 2018).
- Almost 15,000 km of District Heating Networks. Available online: https://energia.fi/en/energy_sector_in_finland/energy_networks/district_heating_networks (accessed on 14 December 2018).
- District Heat is Produced Close to the Customer. Available online: https://energia.fi/en/energy_sector_in_finland/energy_production/district_heating (accessed on 29 October 2018).
- Asumisen Energiankulutus Energialähteittäin (“Energy Consumption in Households”). Available online: https://pxhopea2.stat.fi/sahkoiset_julkaisut/energia2017/html/suom0007.htm (accessed on 31 October 2018).
- Asuin- ja Palvelurakennusten Lämmityksen Energialähteet (“Energy Sources for Heating Residential, Commercial and Public Buildings”). Available online: https://pxhopea2.stat.fi/sahkoiset_julkaisut/energia2017/html/suom0006.htm (accessed on 29 October 2018).
- Kaukolämmön ja Kaukolämmön Tuotantoon Liittyvän Sähkön Polttoainekulutus (“Fuel Consumption in Production of District Heat”). Available online: https://pxhopea2.stat.fi/sahkoiset_julkaisut/energia2017/html/suom0003.htm (accessed on 29 October 2018).
- Combined Heat and Power Generation is Energy-Efficient. Available online: https://energia.fi/en/energy_sector_in_finland/energy_production/combined_heat_and_power_generation (accessed on 29 October 2018).
- ISO. 14040 Environmental Management. Life Cycle Assessment. Principles and Framework. 2006. Available online: https://www.iso.org/standard/37456.html (accessed on 21 November 2019).
- ISO. 14044 Environmental Management. Life Cycle Assessment. Requirements and Guidelines. 2006. Available online: https://www.iso.org/standard/38498.html (accessed on 21 November 2019).
- ISO. 14067 Greenhouse Gases. Carbon Footprint of Products. Requirements and Guidelines for Quantification. 2018. Available online: https://www.iso.org/standard/71206.html (accessed on 21 November 2019).
- CO2-päästökertoimet (“CO2 Emission Coefficients”). Available online: https://www.motiva.fi/ratkaisut/energiankaytto_suomessa/co2-laskentaohje_energiankulutuksen_hiilidioksidipaastojen_laskentaan/co2-paastokertoimet (accessed on 7 February 2019).
- Hippinen, I. Email about Motiva’s CO2 Emission Coefficients on 21 February 2019.
- Kaukolämmön Tuotanto, GWh (“Production of District Heating, GWh”). Available online: http://pxnet2.stat.fi/PXWeb/pxweb/fi/StatFin/StatFin__ene__salatuo/statfin_salatuo_pxt_004.px/?rxid=0aa15ab8-3844-418b-911d-41de01962a72 (accessed on 28 February 2019).
- Hyödynjakomenetelmä (“Method for Determining the Theoretical Fuel Consumptions of Heat and Electricity Production in CHP Production”). Available online: https://www.motiva.fi/files/6820/Kuvaus_hyodynjakomenetelmasta.pdf (accessed on 27 February 2019).
- Sähkön Tuotanto ja Kokonaiskulutus, GWh (“Electricity Production and Total Consumption, GWh”). Available online: http://pxnet2.stat.fi/PXWeb/pxweb/fi/StatFin/StatFin__ene__salatuo/statfin_salatuo_pxt_004.px/?rxid=0aa15ab8-3844-418b-911d-41de01962a72 (accessed on 4 March 2019).
- JRC. ILCD Handbook—General Guide for Life Cycle Assessment—Detailed Guidance. 2010. Available online: https://eplca.jrc.ec.europa.eu/uploads/ILCD-Handbook-General-guide-for-LCA-DETAILED-GUIDANCE-12March2010-ISBN-fin-v1.0-EN.pdf (accessed on 21 November 2019).
- ISO. 14026 Environmental Labels and Declarations—Principles, Requirements and Guidelines for Communication of Footprint Information. 2017. Available online: https://www.iso.org/standard/67401.html (accessed on 21 November 2019).
- ICCA. WBCSD Addressing the Avoided Emissions Challenge. Guidelines from the Chemical Industry for Accounting for and Reporting Greenhouse Gas (GHG) Emissions Avoided along the Value Chain Based on Comparative Studies. Available online: https://www.icca-chem.org/wp-content/uploads/2015/08/Addressing-the-Avoided-Emissions-Challenge.pdf (accessed on 13 March 2018).
- Two-way District Heating. Available online: https://www.fortum.com/media/2018/06/two-way-district-heating (accessed on 20 February 2019).
- Matkapuhelinverkon Toiminta ja Tukiasemat (“Operation of Mobile Phone Network and Base Stations”). Available online: https://www.stuk.fi/aiheet/matkapuhelimet-ja-tukiasemat/matkapuhelinverkko/matkapuhelinverkon-toiminta-ja-tukiasemat (accessed on 25 February 2019).
- Balcombe, P.; Rigby, D.; Azapagic, A. Environmental impacts of microgeneration: Integrating solar PV, Stirling engine CHP and battery storage. Appl. Energy 2015, 139, 245–259. [Google Scholar] [CrossRef]
- Uusitalo, A.; Uusitalo, V.; Grönman, A.; Luoranen, M.; Jaatinen-Värri, A. Greenhouse gas reduction potential by producing electricity from biogas engine waste heat using organic Rankine cycle. J. Clean. Prod. 2016, 127, 399–405. [Google Scholar] [CrossRef]
- Wang, J.; Liu, S.; Li, L. Experiments and modeling on thermoelectric power generators used for waste heat recovery from hot water pipes. Energy Procedia 2019, 158, 1052–1058. [Google Scholar] [CrossRef]


© 2019 by the authors. Licensee MDPI, Basel, Switzerland. This article is an open access article distributed under the terms and conditions of the Creative Commons Attribution (CC BY) license (http://creativecommons.org/licenses/by/4.0/).
Share and Cite
Kasurinen, H.; Vatanen, S.; Grönman, K.; Pajula, T.; Lakanen, L.; Salmela, O.; Soukka, R. Carbon Handprint: Potential Climate Benefits of a Novel Liquid-Cooled Base Station with Waste Heat Reuse. Energies 2019, 12, 4452. https://doi.org/10.3390/en12234452
Kasurinen H, Vatanen S, Grönman K, Pajula T, Lakanen L, Salmela O, Soukka R. Carbon Handprint: Potential Climate Benefits of a Novel Liquid-Cooled Base Station with Waste Heat Reuse. Energies. 2019; 12(23):4452. https://doi.org/10.3390/en12234452
Chicago/Turabian StyleKasurinen, Heli, Saija Vatanen, Kaisa Grönman, Tiina Pajula, Laura Lakanen, Olli Salmela, and Risto Soukka. 2019. "Carbon Handprint: Potential Climate Benefits of a Novel Liquid-Cooled Base Station with Waste Heat Reuse" Energies 12, no. 23: 4452. https://doi.org/10.3390/en12234452
APA StyleKasurinen, H., Vatanen, S., Grönman, K., Pajula, T., Lakanen, L., Salmela, O., & Soukka, R. (2019). Carbon Handprint: Potential Climate Benefits of a Novel Liquid-Cooled Base Station with Waste Heat Reuse. Energies, 12(23), 4452. https://doi.org/10.3390/en12234452