Article

A Novel Dual Fuel Reaction Mechanism for Ignition in Natural Gas–Diesel Combustion

1
Institute of Chemical, Environmental and Bioscience Engineering, TU Wien, Getreidemarkt 9/166, 1060 Vienna, Austria
2
Institute for Powertrains and Automotive Technology, TU Wien, Getreidemarkt 9/315, 1060 Vienna, Austria
*
Author to whom correspondence should be addressed.
Energies 2019, 12(22), 4396; https://doi.org/10.3390/en12224396
Submission received: 24 October 2019 / Revised: 15 November 2019 / Accepted: 17 November 2019 / Published: 19 November 2019
(This article belongs to the Section B: Energy and Environment)

Abstract

:
In this study, a reaction mechanism is presented that is optimized for the simulation of the dual fuel combustion process using n-heptane and a mixture of methane/propane as surrogate fuels for diesel and natural gas, respectively. By comparing the measured and calculated ignition delay times (IDTs) of different homogeneous methane–propane–n-heptane mixtures, six different n-heptane mechanisms were investigated and evaluated. The selected mechanism was used for computational fluid dynamics (CFD) simulations to calculate the ignition of a diesel spray injected into air and a natural gas–air mixture. The observed deviations between the simulation results and the measurements performed with a rapid compression expansion machine (RCEM) and a combustion vessel motivated the adaptation of the mechanism by adjusting the Arrhenius parameters of individual reactions. For the identification of the reactions suitable for the mechanism adaption, sensitivity and flow analyzes were performed. The adjusted mechanism is able to describe ignition phenomena in the context of natural gas–diesel, i.e., dual fuel combustion.

1. Introduction

Future emission legislations require new technologies and technological improvements in the field of internal combustion engines in terms of engine concepts and alternative fuels like e-fuels [1], biofuels [2] and fuel blends [3]. The favorable availability of gaseous fuels will increase the importance of so-called dual fuel combustion processes. This is especially true for road freight traffic, off-road applications and marine propulsion. In this combustion process, a homogeneous, lean fuel gas mixture is introduced into the combustion chamber and ignited with a diesel jet. Thus, two fuels contribute to the overall energy conversion, but for cost and emission reasons, the combustion process should be operated with the maximum gas content. In comparison to pure diesel operation, the emission of CO2, NOx, SOx and particulate matter can be in part reduced significantly by the operation in dual fuel mode [4]. Due to the use of local gas deposits, the demand is increasing to be able to operate the combustion process with fuel gases of different methane number and high inert gas content, e.g., in the form of bio and lean gases. However, the feasible gas content is subject to combustion process-specific limits. The processes in dual fuel combustion are very complex and not yet understood in detail: On the one hand, the jet preparation and ignition of the diesel fuel in the fuel gas, and on the other hand the flame propagation in the fuel gas, the extinction of the flame and the knocking combustion must be taken into account.
The target of the presented study was to investigate the kinetically controlled ignition and combustion processes in dual fuel operation. For the calculation of the auto ignition of the unburned mixture, models are required, which can reflect the interaction of the different fuels in the mixture correctly. Based on published reaction mechanisms, the aim was to develop a reaction mechanism capable of reproducing the auto ignition of the diesel pilot fuel as well as the flammability of the gas–air mixture influenced by it. For the validation of the reaction mechanism, experimentally determined ignition delay times (IDTs) of homogeneous fuel mixtures for the investigation of basic ignition properties, as well as inhomogeneous fuel mixtures for mapping the engine combustion process were used. The IDT simulations of homogeneous mixtures were performed with the software LOGEresearch (Version LSv1.09, LOGE AB, Lund, Sweden) [5]. The data needed for the evaluation were measured with a rapid compression machine (RCM) and a shock tube (ST) [6,7]. The IDT calculation of inhomogeneous mixtures was performed with the software AVL FIRETM (Version 2018.1, AVL List GmbH, Graz, Austria), whereby the experimental comparative data were measured with a rapid compression expansion machine (RCEM) and a combustion vessel [8].

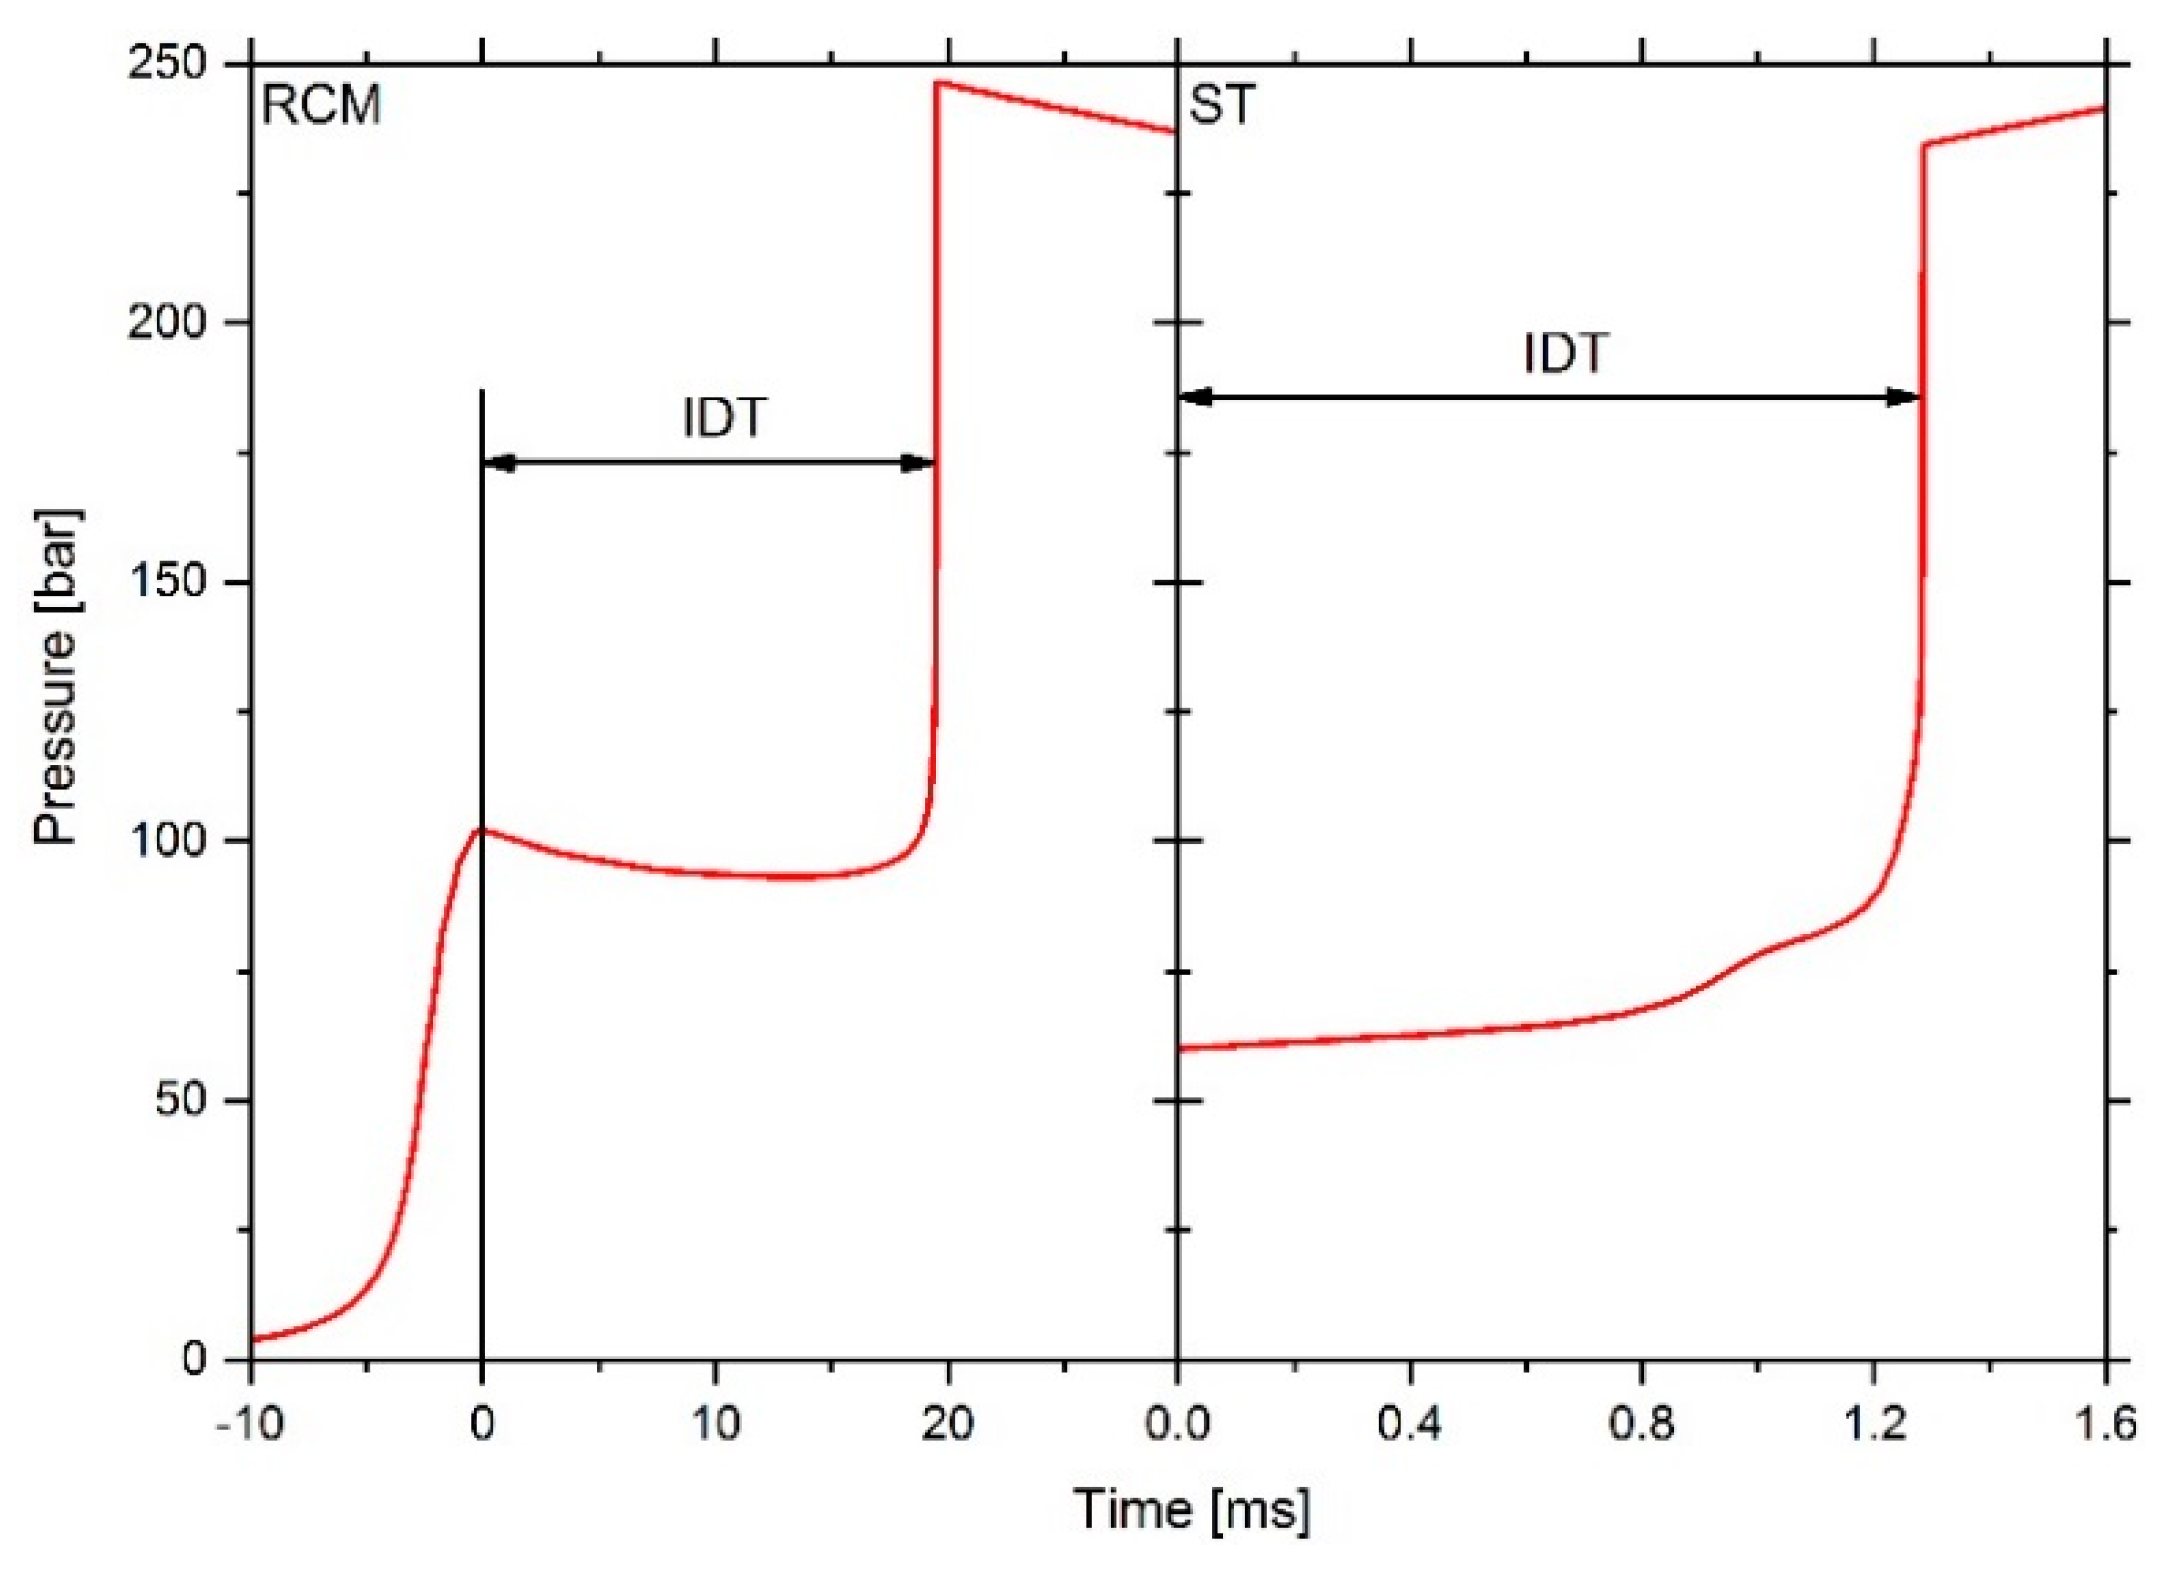
2. Materials and Methods

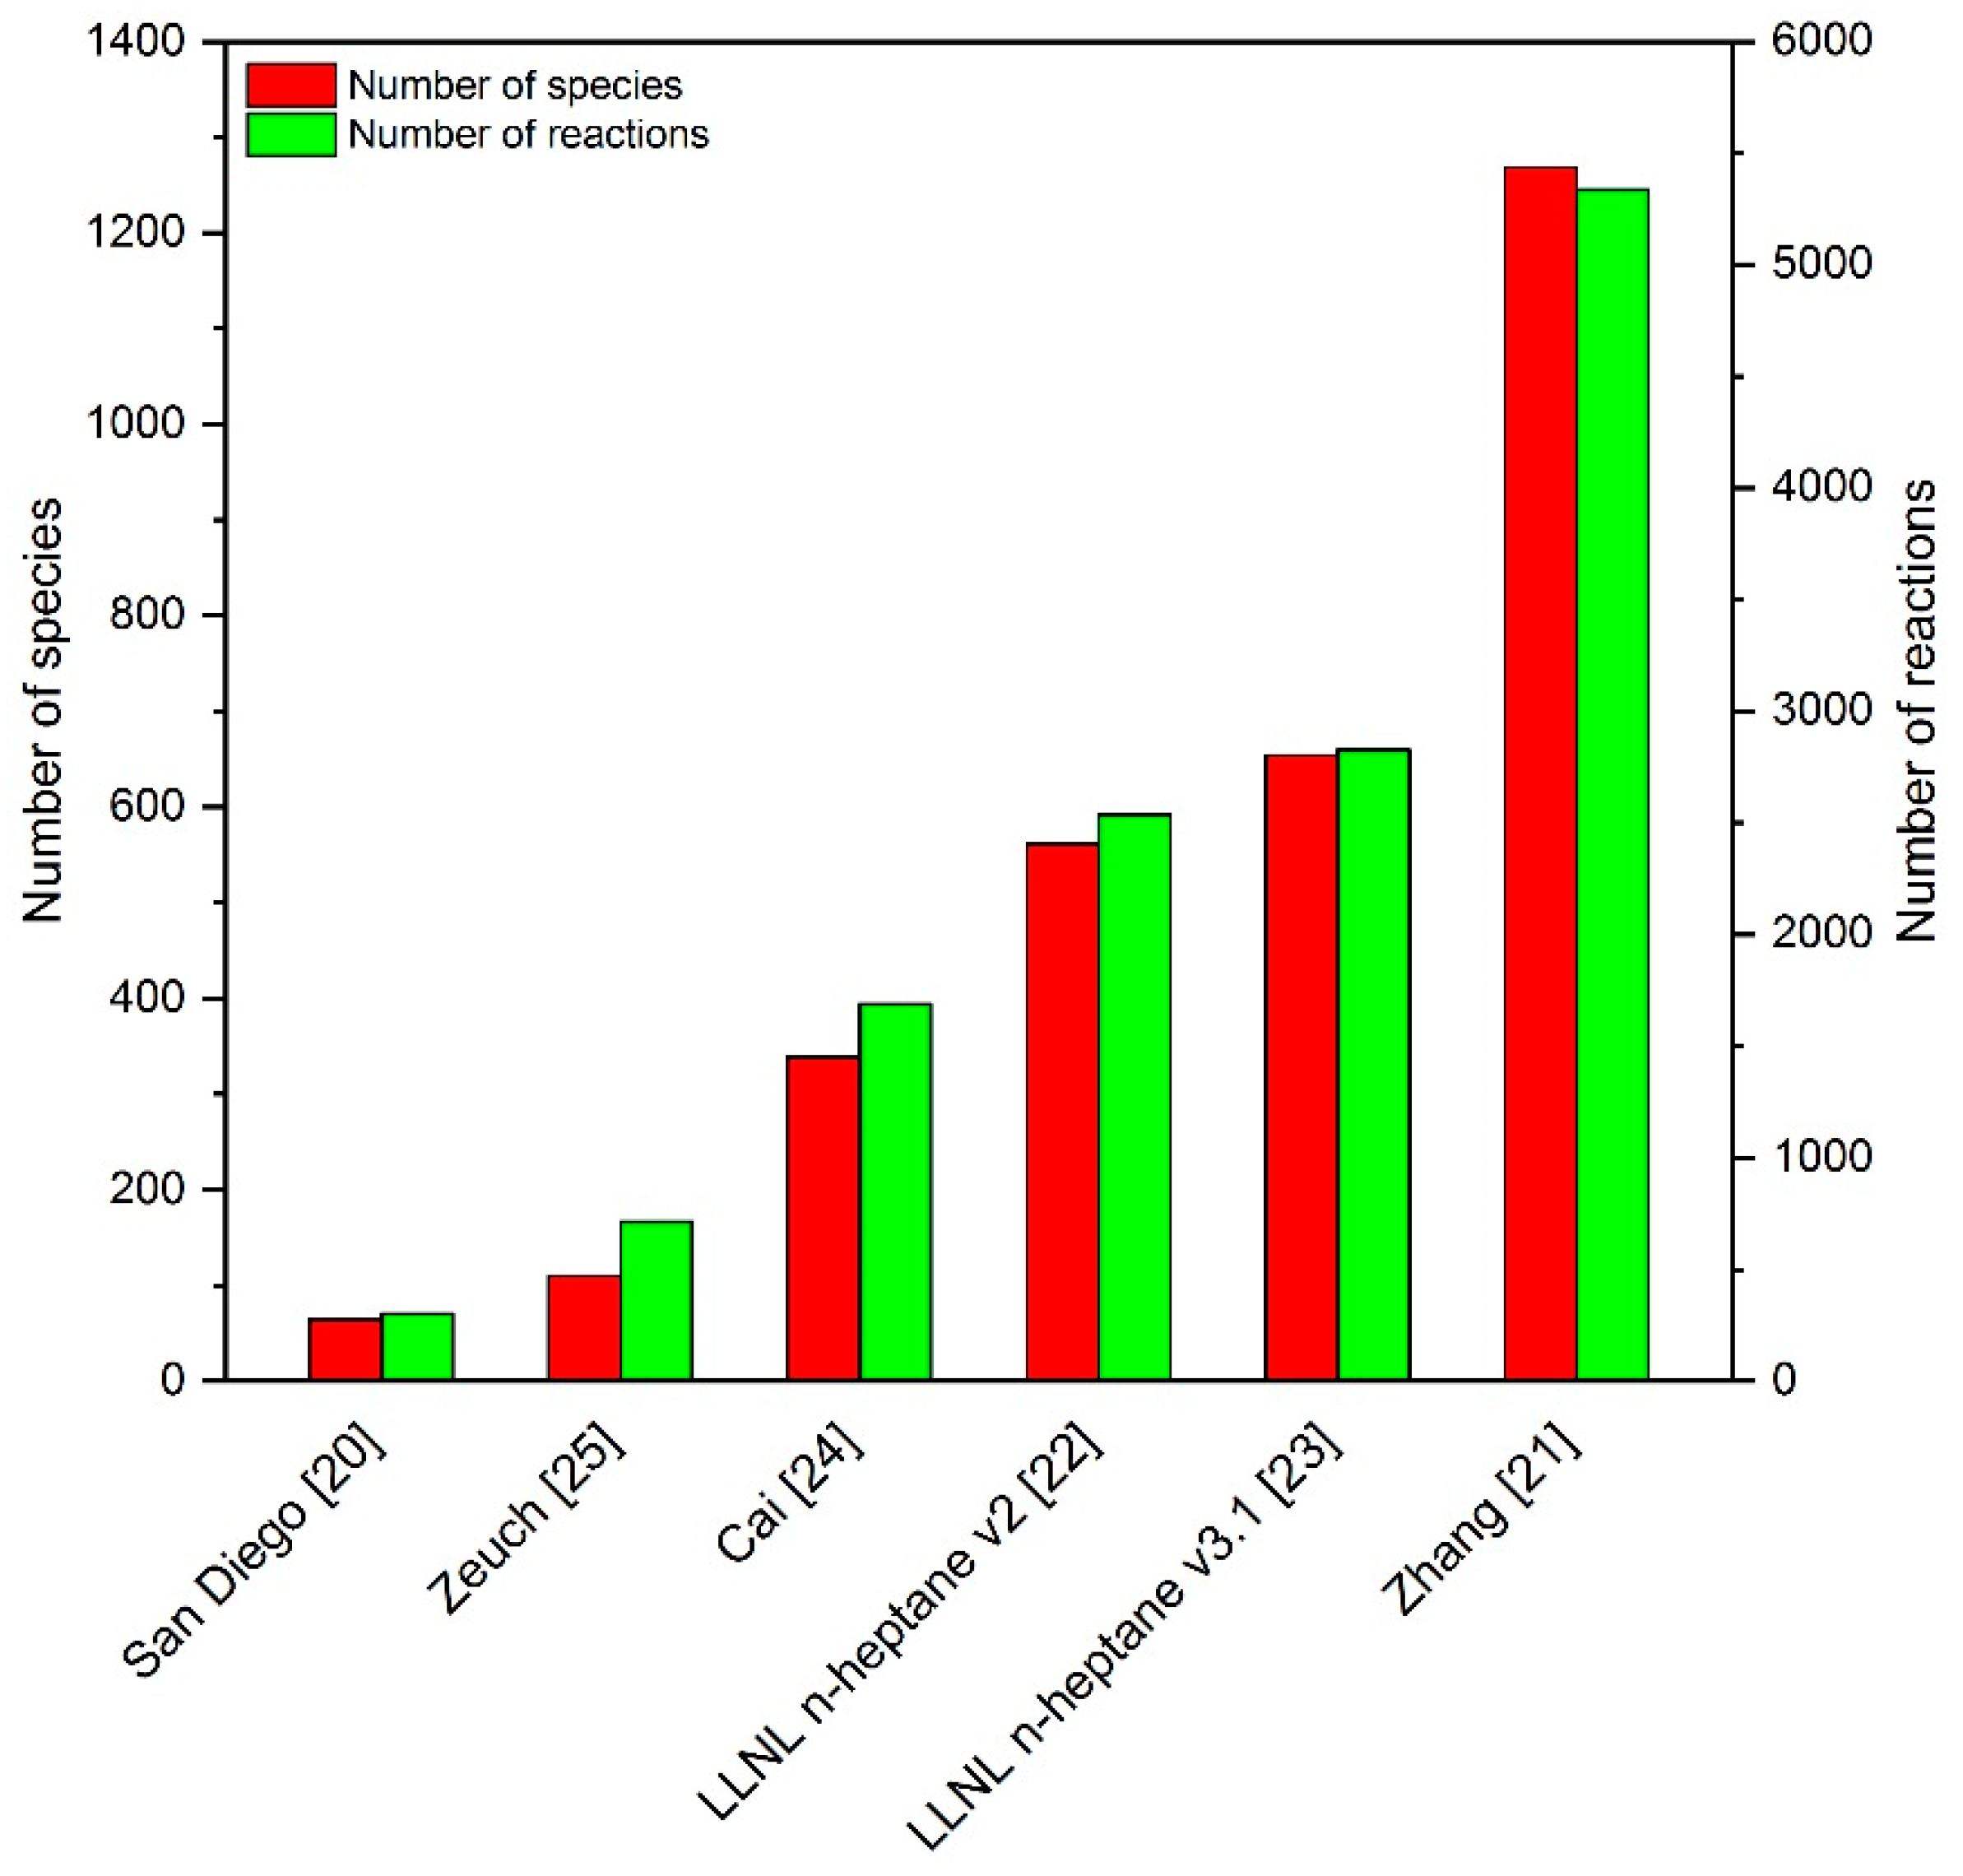
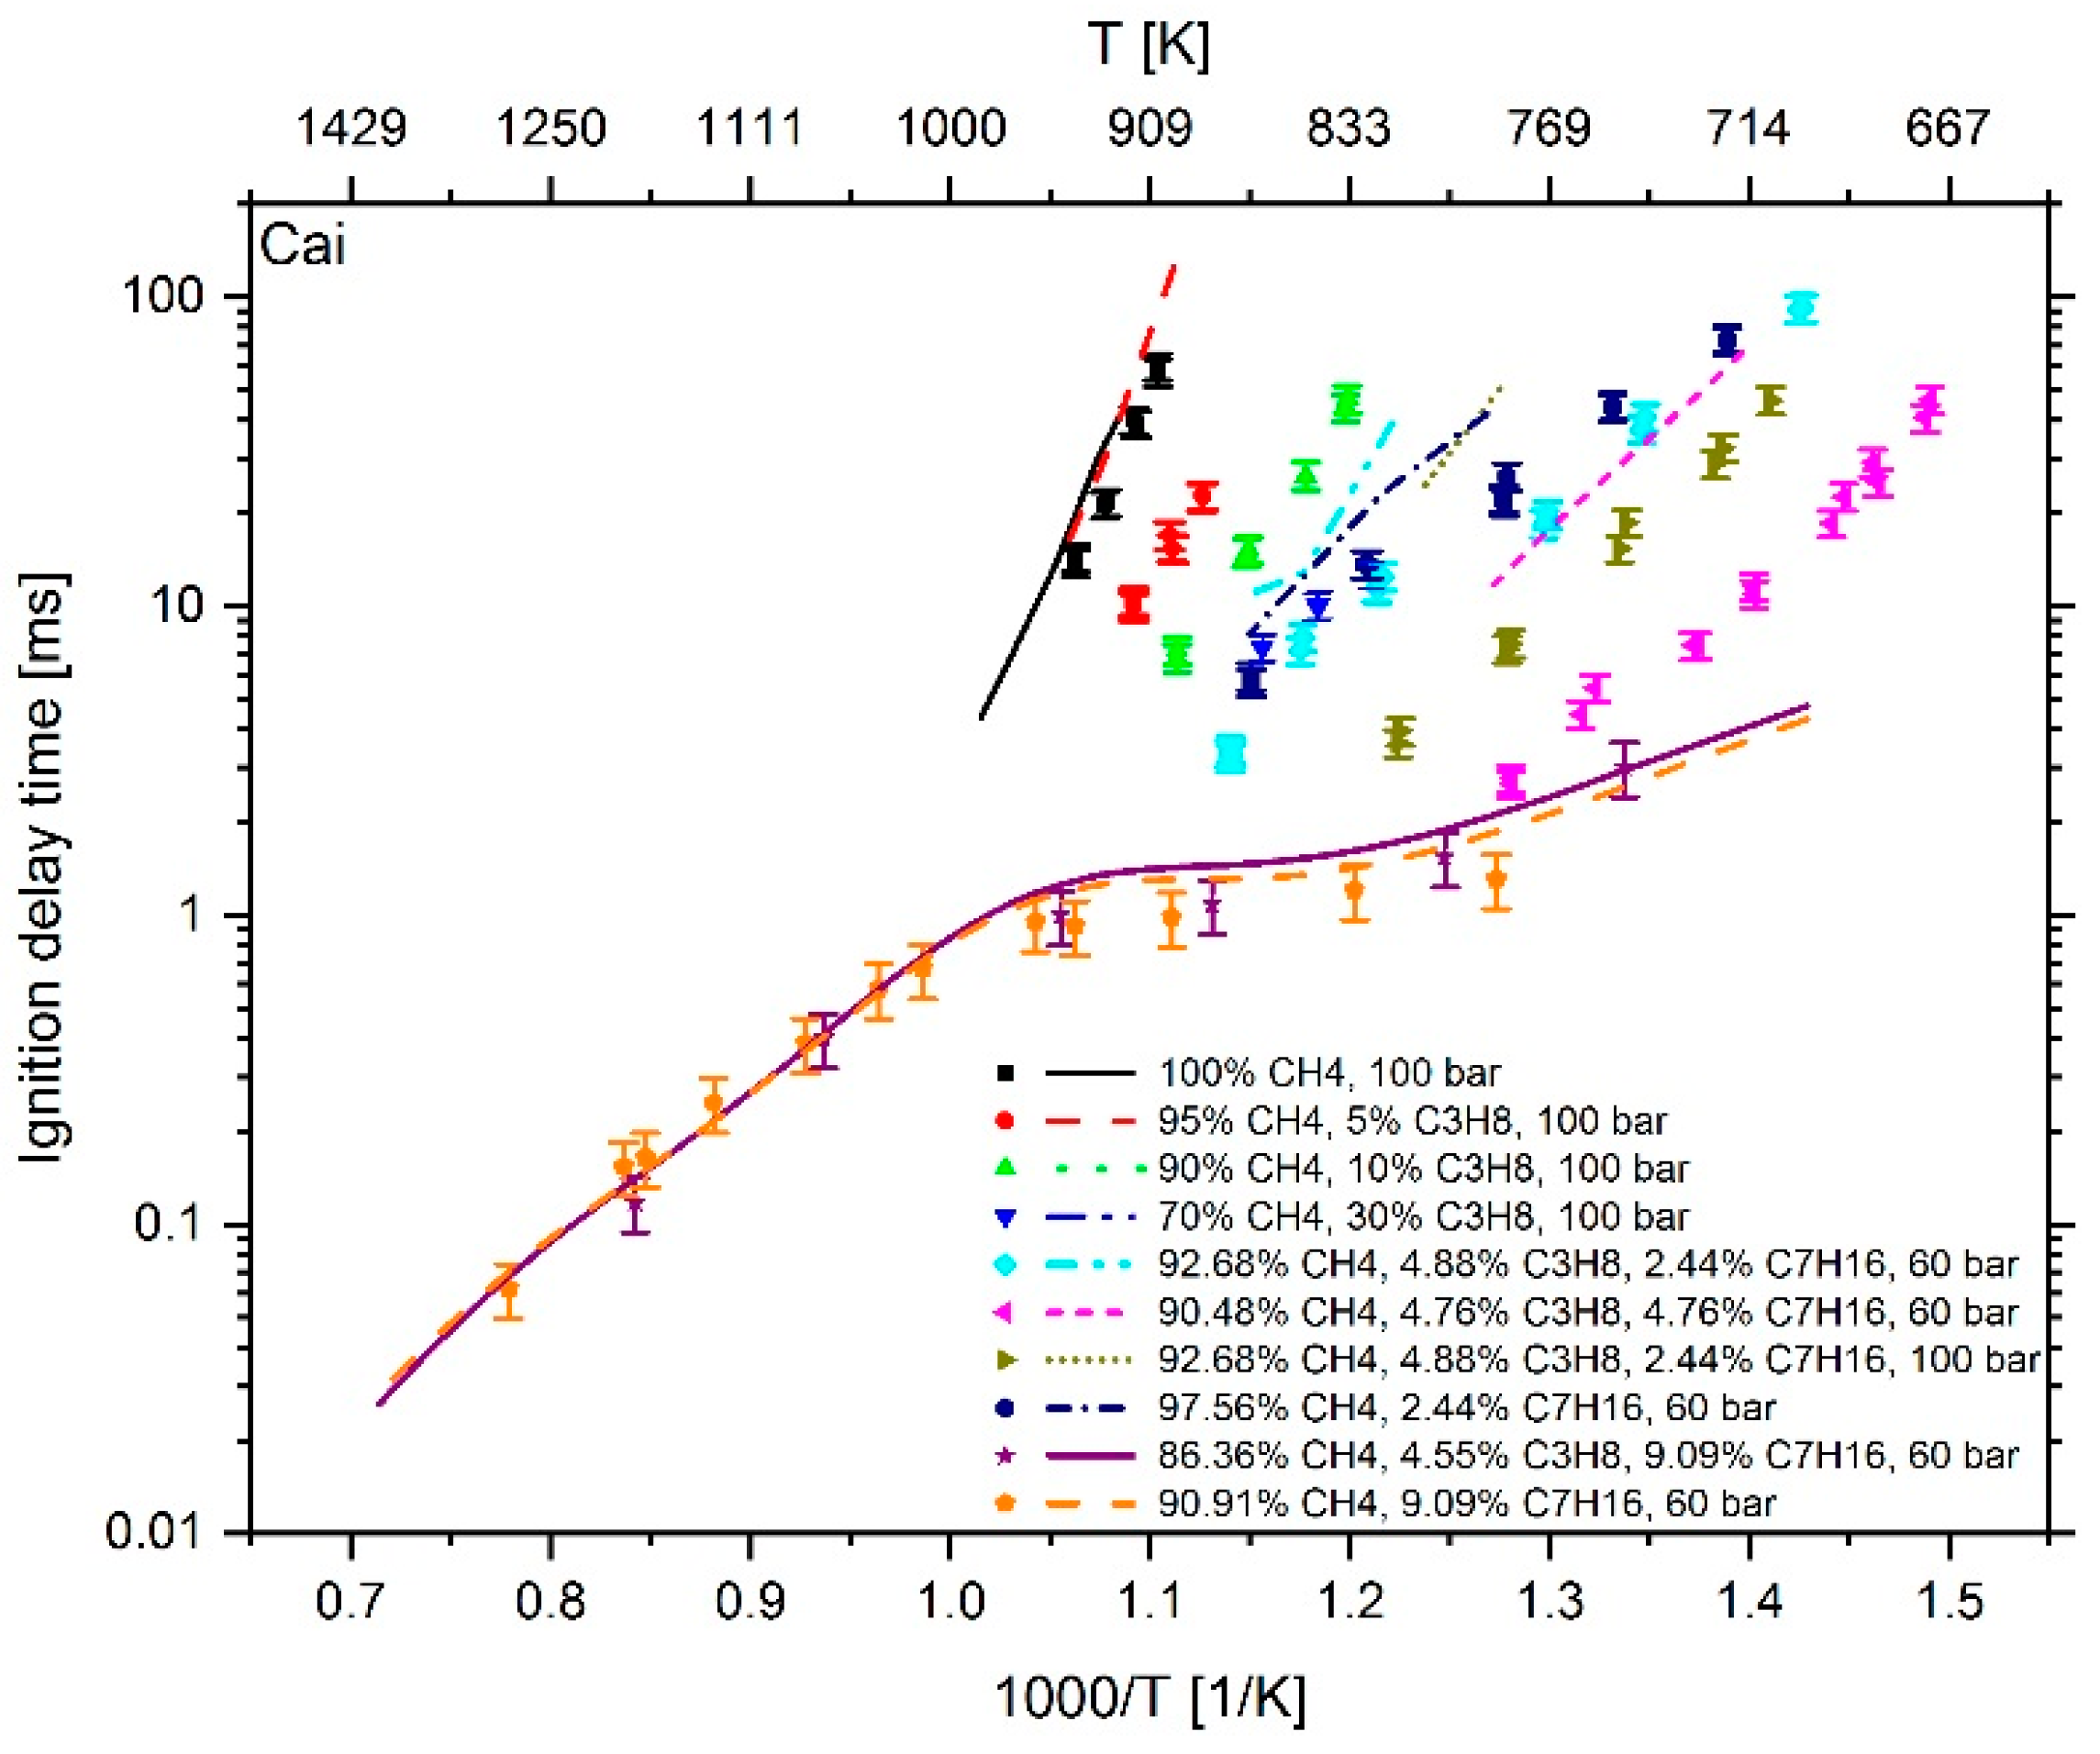
2.1. Reaction Mechanism Selection

Diesel fuel is a complex mixture of thousands of hydrocarbon compounds with carbon numbers between 6 and 28 [9]. Detailed kinetic models containing all relevant species are often not available. Furthermore, the consideration of a large number of species would lead to an enormous computational effort. Therefore, it is convenient to define a substitute fuel that can represent the overall combustion behavior of diesel fuel. For dual fuel investigations, n-heptane is a common diesel substitute [10,11,12,13,14] and was used as a surrogate in this investigation. With a cetane number (describing the ignitability of the fuel) of 56 [15], n-heptane is well suited as surrogate fuel, since, according to the DIN EN590 standard from October 2009, diesel has to show a minimum cetane number of 51 [16]. As with diesel fuel, it is also necessary for natural gas to define a substitute fuel. A commonly used substitute is methane [17,18,19]. However, in order to better map the methane number (measure of knock resistance) of natural gas, a mixture of methane and propane as substitute fuel was defined in the present study. Since n-heptane was used as a diesel substitute, various n-heptane mechanisms have been investigated concerning their suitability for calculating the ignition properties of fuel blends used in dual fuel studies. The selection process was carried out by comparing measured and simulated IDTs of various homogeneous methane–propane–n-heptane mixtures in the pressure range 60 to 100 bar, temperature range 701 to 1284 K and an air–fuel equivalence ratio between 1.226 and 1.9. The IDTs were determined with the help of the RCM and ST at PCFC (Physico Chemical Fundamentals of Combustion), RWTH Aachen University. A detailed description of the experimental procedure and the measured values is available in [6,7]. The mechanism search ranged from the very compact Complete San Diego mechanism (version 2016-12-14) with n-heptane extension (version 2015-03-01) [20], which takes into account a total of 301 reactions, to the very large mechanism of Zhang et al. [21] with more than 5000 reactions. Before the San Diego mechanism could be used, the Complete San Diego mechanism and the n-heptane sub-mechanism had to be merged together. This overall mechanism was then read in with LOGEresearch and a new mechanism, transport and thermal file was exported. This process ensured that, on the one hand, there was no double definition of species, and on the other hand, that the transport and thermodynamic files were shortened to those species that were actually used by the mechanism. Further investigated mechanisms on the shortlist were the n-heptane mechanisms version 2 and 3.1 of the Lawrence Livermore National Laboratory (LLNL) [22,23], the n-heptane mechanism of Cai et al. [24] and the n-heptane skeleton mechanism of Zeuch et al. [25]. Figure 1 shows an overview of the number of considered species, as well as the number of reactions of the respective mechanisms.
The evaluation of the reaction mechanisms was carried out with a total of 10 different homogeneous fuel mixtures and the comparison of measured and simulated IDTs. An overview of the mixtures considered, the corresponding temperature range, pressure value and air–fuel equivalence ratio are given in Table 1. The study, in which the presented mechanism was developed, also included the experimental investigation of the dual fuel combustion using an experimental engine. Results of the engine tests are not part of this publication; however, the operating conditions of the engine were considered in choosing the composition and test conditions of the homogeneous mixtures to be investigated. Due to the spray injection, the diesel concentration shows a large spatial inhomogeneity in the combustion chamber. To account for this variation in the study of homogeneous fuel mixtures, mixtures with different n-heptane contents between 0 and 9 mol % were studied. In the case of the investigation of inhomogeneous mixtures with the RCEM and by computational fluid dynamics (CFD) simulations, which will be shown in the next section, the test conductions were also related to the working conditions of the experimental engine.
In the case of methane–propane–n-heptane mixtures, a mixture of 95 mol % methane and 5 mol % propane served as the surrogate base mixture to which n-heptane was added. The comparison with the methane numbers (MNs) of natural gas from different extraction areas [26,27,28,29] in Figure 2 shows that the MN of the natural gas surrogate base mixture lies in the middle between very knock-resistant and easy-knocking natural gases. The MNs were determined with the Cummins Westport Fuel Quality Calculator [30].
For the simulation of the RCM measurements, in LOGEresearch the module “rapid compression machine” at a specific fuel composition, fuel–air equivalence ratio, starting temperature and starting pressure of the not yet compressed mixture was used. The RCM facility effects, which describe the non-ideal behavior of the test facility and the machine-specific compression of the mixture is taken into account by reading in the effective volume profile derived from the pressure profile of the associated non-reactive RCM measurement. Details on determining the effective volume curve are available in [6,31]. As shown on the left side of Figure 3, the time span between the point of complete compression of the mixture and the maximum pressure rise due to ignition defines the IDT. For the simulation of ST measurements, the “rapid compression machine” module was used too. However, in this case, the temperature and pressure values that were reached in the ST after the shockwave reflection were used as starting values for the simulation. The IDT is thus defined as a time difference between the simulation start and the achievement of the maximum pressure increase due to the ignition as shown on the right side of Figure 3. The measurement of the pressure in the ST after the shock wave reflection shows a machine-specific increase of 8%/ms, resulting from the boundary layers and the non-ideal opening of the diaphragms [32,33] and is taken into account in the simulation, otherwise a significant deviation of the IDT would result if the IDT is in range of 1 ms or larger. The constant volume (CV) simulations were performed with the CV module of LOGEresearch at specified initial conditions, like pressure, temperature and simulation time. The IDT definition is identical to that of the ST simulations.
In the following, Figure 4, Figure 5, Figure 6, Figure 7, Figure 8 and Figure 9 show the comparison between the experimentally determined IDTs represented with symbols and the calculated IDTs shown with lines. Since facility effects were taken into account in the simulations of the RCM data using a non-reactive pressure profile, the simulation time was limited to the pressure time history. In the case that the calculated IDT is above the time length of the non-reactive pressure profile, a value cannot be specified.
At a temperature higher than 1000 K and an n-heptane addition of about 9 mol %, the mechanism of Cai et al. shows an excellent reproduction of the experimental values. However, at T < 1000 K and an n-heptane admixture of < 5 mol %, the comparison between measured and calculated data shows large deviations. Furthermore, the IDT-reducing effect of propane addition to methane cannot be reproduced. This originates from the fact, as explained in [6], that the mechanism of Cai et al. does not include subsequent pathways of the 2nd O2 addition and therefore no low temperature chain branching, which promotes the reactivity in this regime. In the case of Zeuch’s mechanism, the calculated values at temperatures of less than 1000 K also show large deviations from the measured data, which is why this mechanism was not considered for further investigation. Thus, the most promising candidates were the LLNL n-heptane v3.1 mechanism (since version 2 showed a larger deviation than version 3.1), the Complete San Diego mechanism with n-heptane extension and the mechanism of Zhang et al. In the next step, the deviation between simulation and measurement result was examined more closely. For this purpose, the percentage deviation between simulated and measured values was calculated. The temperature at the end of compression in the RCM simulation was calculated using the reaction mechanism and shows slightly different values when using different mechanisms. Thus, the simulation results and measured values are mostly not available at the exact same temperatures. Due to this fact, an interpolation of the experimental data was performed and the relative distance between measurement and simulation results was determined. Since an interpolation and no extrapolation was performed, only the temperature range in which both the simulation and the experimental values are available was included in the analysis. The results are shown in Figure 10. In the evaluation of all fuel mixtures investigated, the Complete San Diego mechanism with n-heptane extension shows the smallest maximal deviation. In addition, it is the smallest of all mechanisms investigated with a number of 301 reactions and a consideration of 64 species so that the mechanism can directly be used in CFD simulations without causing unmanageable computing times. For these reasons, this mechanism was selected for further consideration.

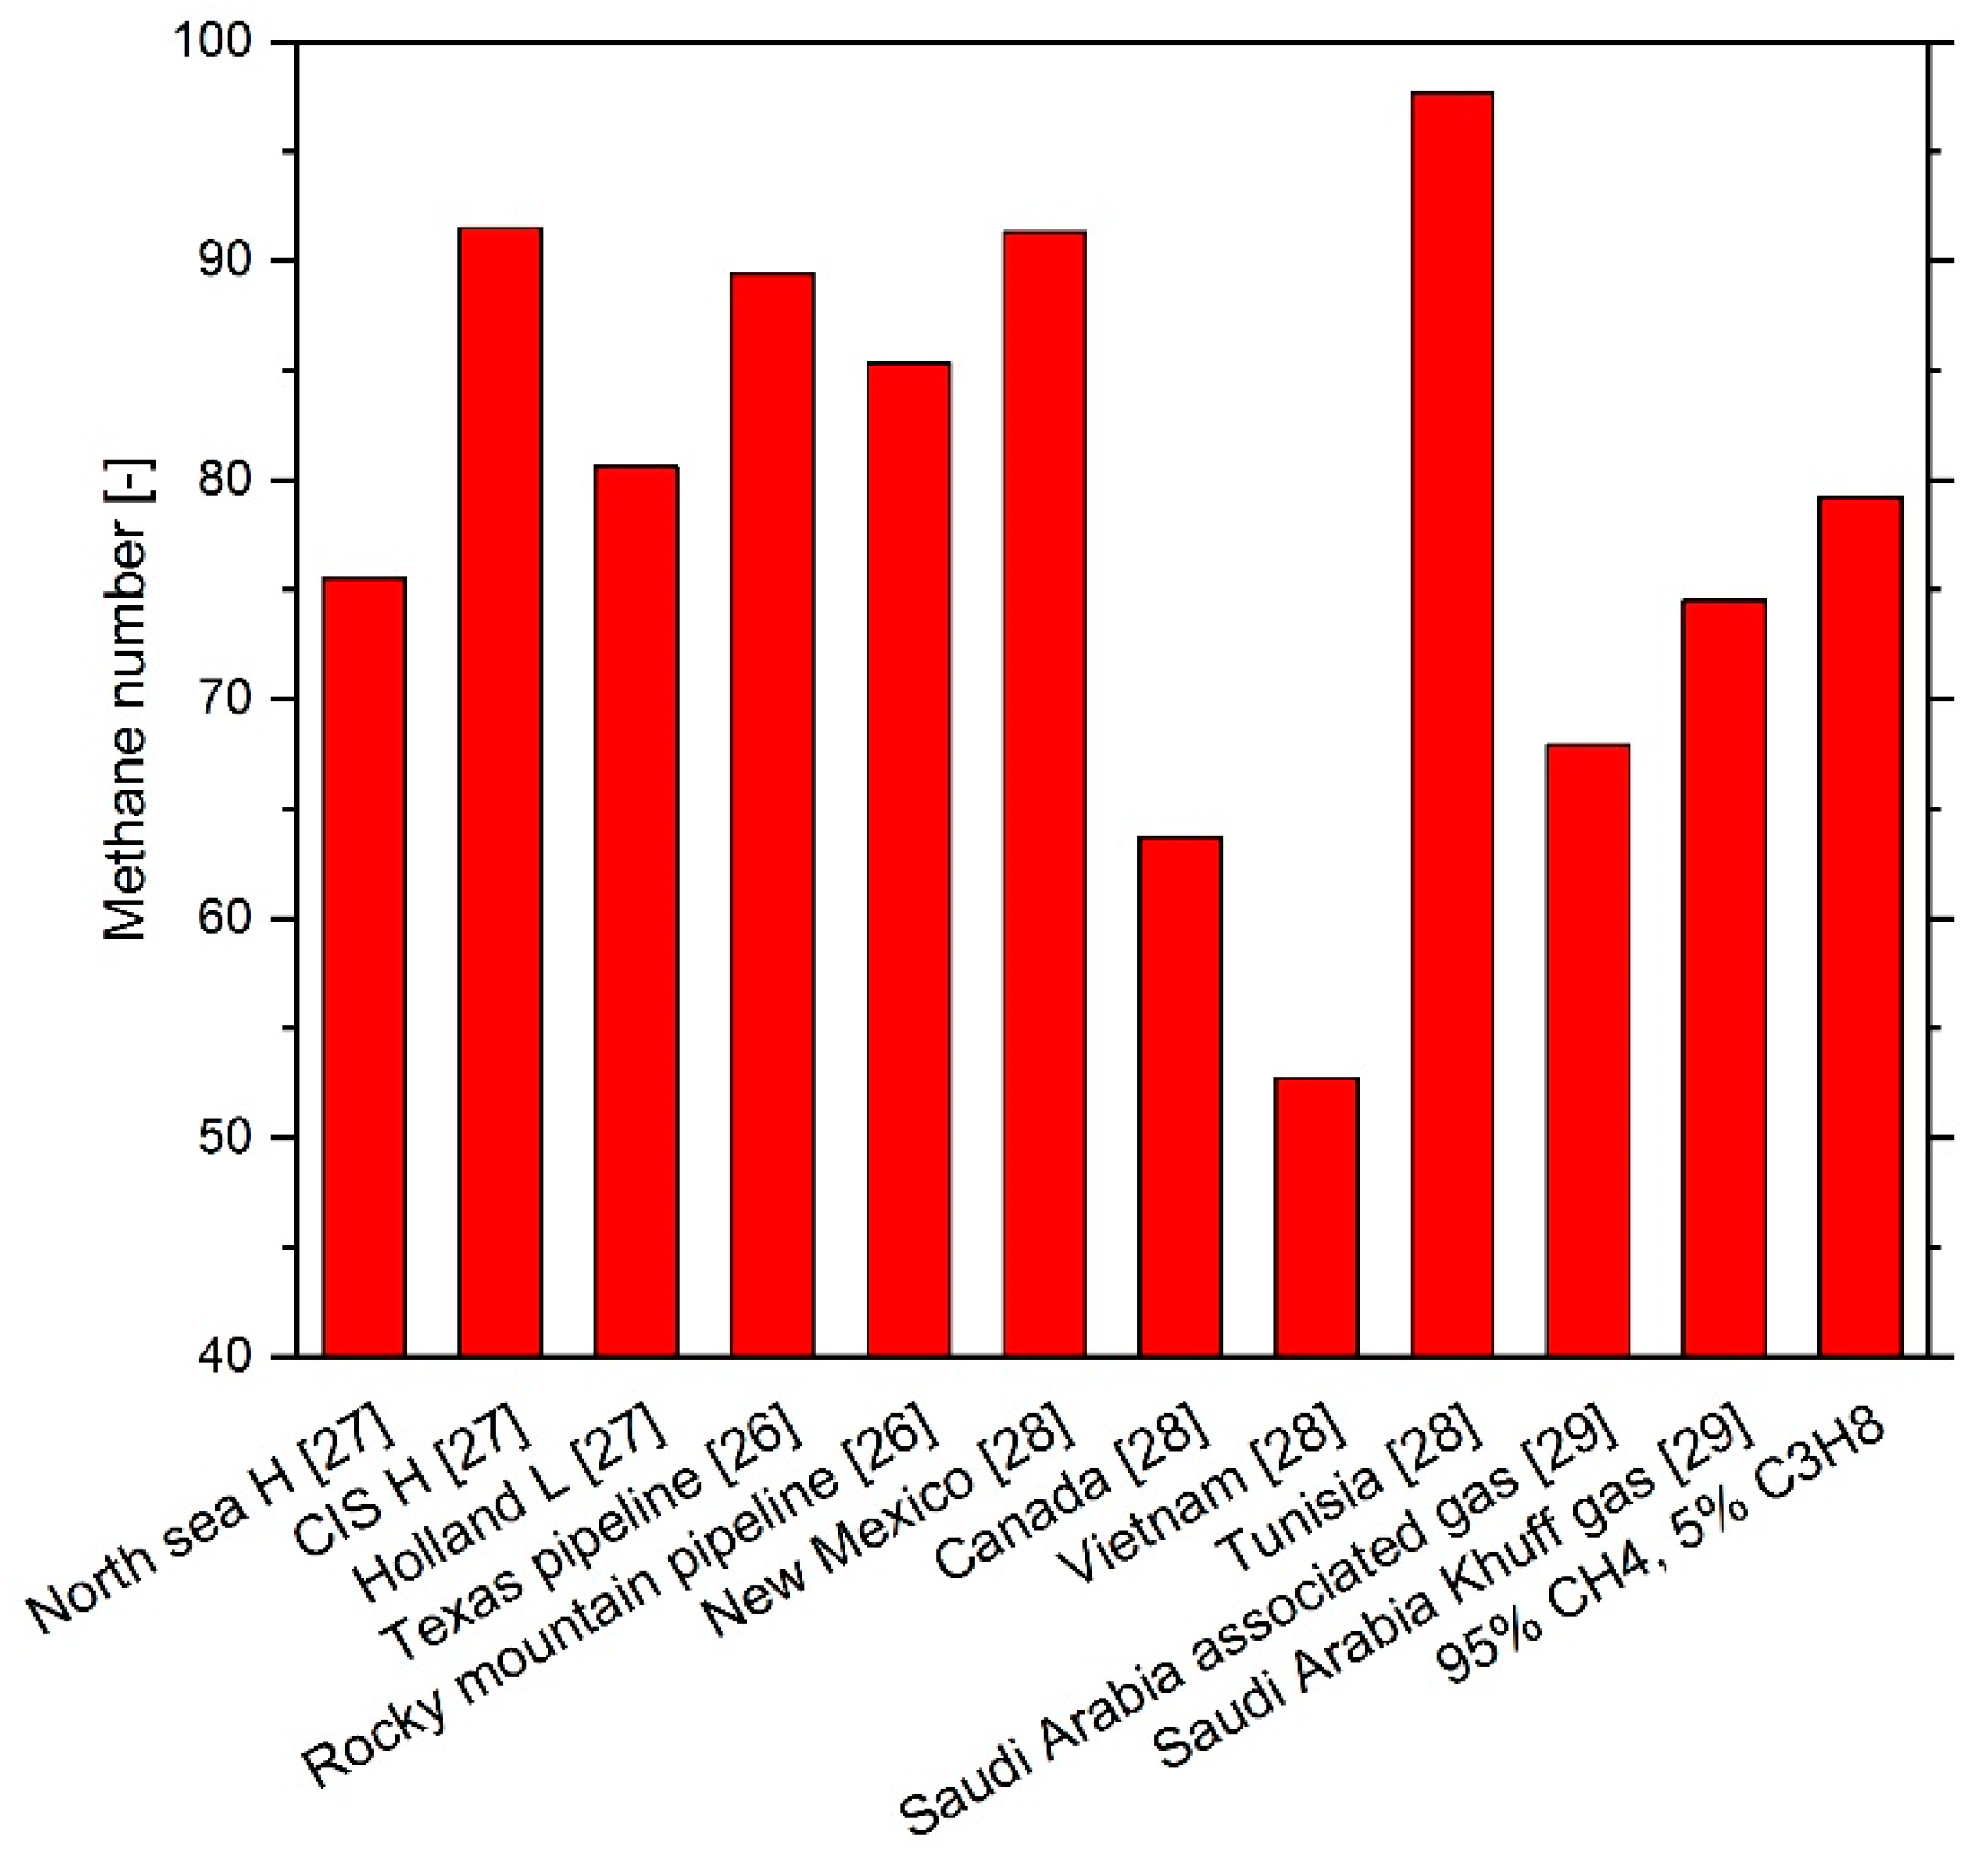
2.2. Investigation of Inhomogeneous Fuel Mixtures

In dual fuel operation, the fuel components are not homogeneously distributed in the combustion chamber. After sucking in and compressing a gas–air mixture, a diesel jet is injected into the combustion chamber. When the conditions for auto ignition are reached, the pilot fuel is rapidly converted followed by a flame front propagating into the entire combustion chamber. In order to theoretically investigate this process, the use of CFD simulations is necessary. In the context of this work, CFD simulations of the pilot injection were carried out in AVL FIRETM to investigate the ignition behavior of the spray plume in pure air and a lean natural gas–air mixture. The pilot fuel is modeled by a discrete droplet approach that describes the spray with a statistically sufficient number of parcels consisting of physically identical droplets. The start velocity of the droplets was derived from Schlieren measurements in a constant volume vessel applying an approach of constant momentum along the spray axis. This was necessary to depict the experimentally observed spray propagation in the ballistic working regime of the injector, which is common for dual fuel operation with small diesel amounts. For further details concerning the experimental setup and the spray modeling refer to Reference [8]. The ignition of the pilot fuel is simulated using the general gas phase reactions module available in AVL FIRETM. Thereby, the detailed chemistry is solved in the gas phase in each computational cell at every time step. The turbulent flow field is modeled using the k-ζ-f turbulence model implemented in AVL FIRETM. Turbulence chemistry interaction is for simplification reasons not taken into account. Due to the fact that n-heptane was chosen as a surrogate for diesel, the gaseous pilot fuel is defined as n-heptane, while the liquid fuel is physically treated as diesel. This is necessary to depict the penetration of the liquid phase and the evaporation of the fuel droplets correctly. The direct integration of the reaction chemistry provides a suitable method to describe the influence of the natural gas on the decomposition of n-heptane during the ignition delay.
At first, the ignition in pure air was investigated on a simplified cylindrical spray box mesh. The mesh is designed for a single jet and contains spatial refinements in the spray area. The computational mesh includes cells from 1 mm to 125 µm close to the nozzle. The ignition delay in the simulation is defined by the duration from the start of injection (SOI) and the maximum temperature gradient in the simulation domain. It was compared with experimental data from the combustion vessel. The ignition delay in the experiment was evaluated using OH-signal measurements. Thereby, the detectability of OH signal in half of the conducted injections determines the IDT. Figure 11 depicts the measured and the simulated IDTs over temperature for a constant chamber pressure of 60 bar. The simulations using the Complete San Diego mechanism with n-heptane-extension tend to underestimate the IDT for a temperature of 823 K, while they show an overestimation for temperatures higher than 900 K.
The ignition of diesel in a gas–air atmosphere was investigated using a RCEM. The test rig is equipped with a pneumatically driven connecting rod, which follows the kinematics of a real engine crank drive around the top dead center. During the test procedure, the combustion chamber is charged with a natural gas–air mixture, which is compressed by the piston during the compression stroke. Close to the top dead center the pilot fuel is injected and ignites the mixture. The cylinder pressure is thereby recorded by a pressure transducer mounted in the cylinder head. For the CFD simulations, a moving mesh is generated that depicts the geometry of the RCEM combustion chamber. The refinements in the spray area are transferred from the spray box investigations, to ensure a comparable mixture preparation. For further information on the experimental setup and the computational method refer to Reference [8]. The simulations of the dual fuel combustion were carried out with an energetic diesel share of 5%, 20% and 40%, whereby, for illustration, in the following consideration results with 20% share are discussed in detail. Figure 12 illustrates the measured and simulated pressure traces for diesel and dual fuel combustion. The injected amount of diesel and the injection timing is kept constant. While the ignition delay for pure diesel, defined as duration from start of injection to the first pressure rise, can be predicted quite well by the Complete San Diego mechanism with n-heptane-extension, a larger deviation can be seen for the dual fuel case. The IDT-increasing effect of the natural gas addition is overestimated compared to the experimental results.

2.3. Mechanism Adjustment

Adapted from the comparison of the combustion vessel measurements with the CFD spray box results shown in Figure 11, it can be supposed, based on the data available and the assumption of a linear progression of the curve between the measuring points, that the mechanism calculates the IDT correctly at a gas temperature of around 880 K. At 823 K the IDT is underestimated, at 923 K and higher an overestimation is apparent. In order to determine which reactions can be used to improve the mechanism, the oxidation pathway of n-heptane was considered in more detail.
Assessing the results of the RCEM simulations in Figure 12, the experimentally determined ignition time is reproduced well for injecting diesel into the compressed air. At the time point of starting the diesel injection the gas temperature is 847 K, as shown in the diagram in the top left corner of Figure 12. Due to the progressive compression of the gas, the temperature continues to rise to 863 K. From this point on, a further increase in temperature can be seen, which is above the value achievable by the compression of the gas. This is an indication of the onset of the diesel reaction. After this steeper temperature rise and the achievement of 873 K, it comes to ignition, which is characterized by a strong increase of the temperature. The considered temperature values in the RCEM simulation are close to those values in the spray box simulation at which the difference between the measured and calculated IDT is small, which is an indication that that the RCEM and spray box simulations are in line with each other.
When natural gas is added, the RCEM simulation shows a strong overestimation of the ignition delay. Due to the presence of methane, reaction paths leading to a reduction of the overall reactivity are likely to become more pronounced, resulting in an increase of the IDT. This reactivity-reducing effect seems to be overestimated by the mechanism. Therefore, reactions which gain importance in the admixture of methane are examined in more detail in the following section.

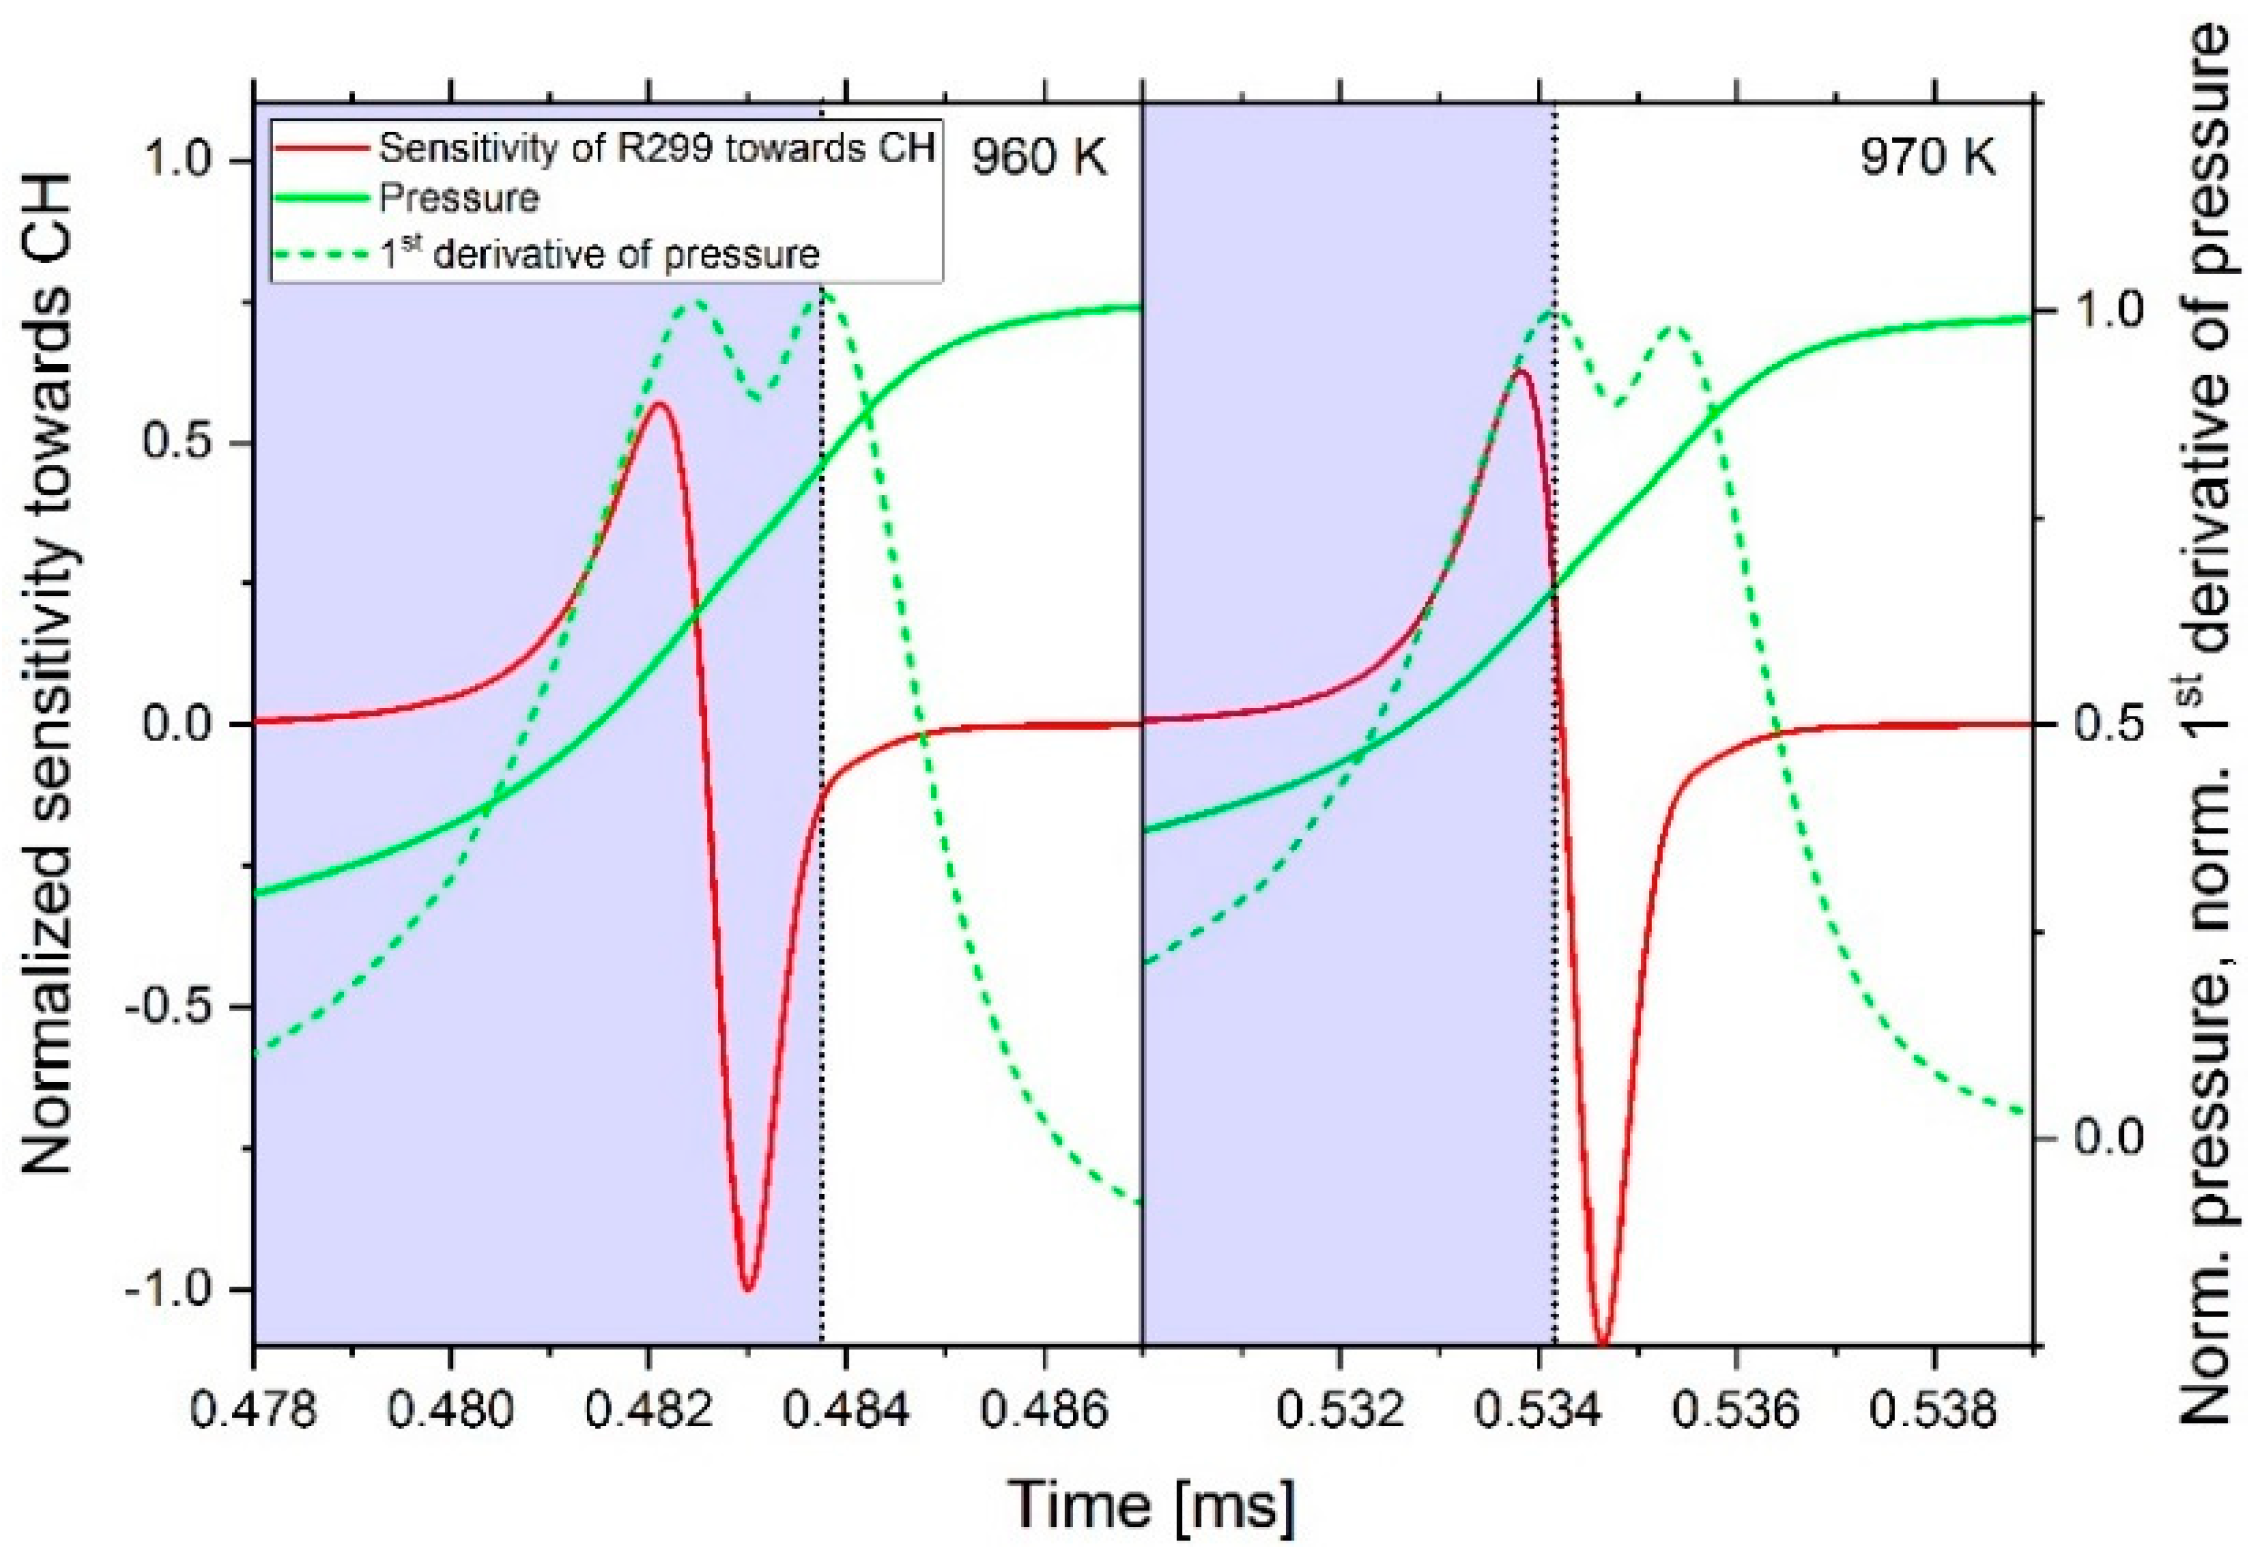
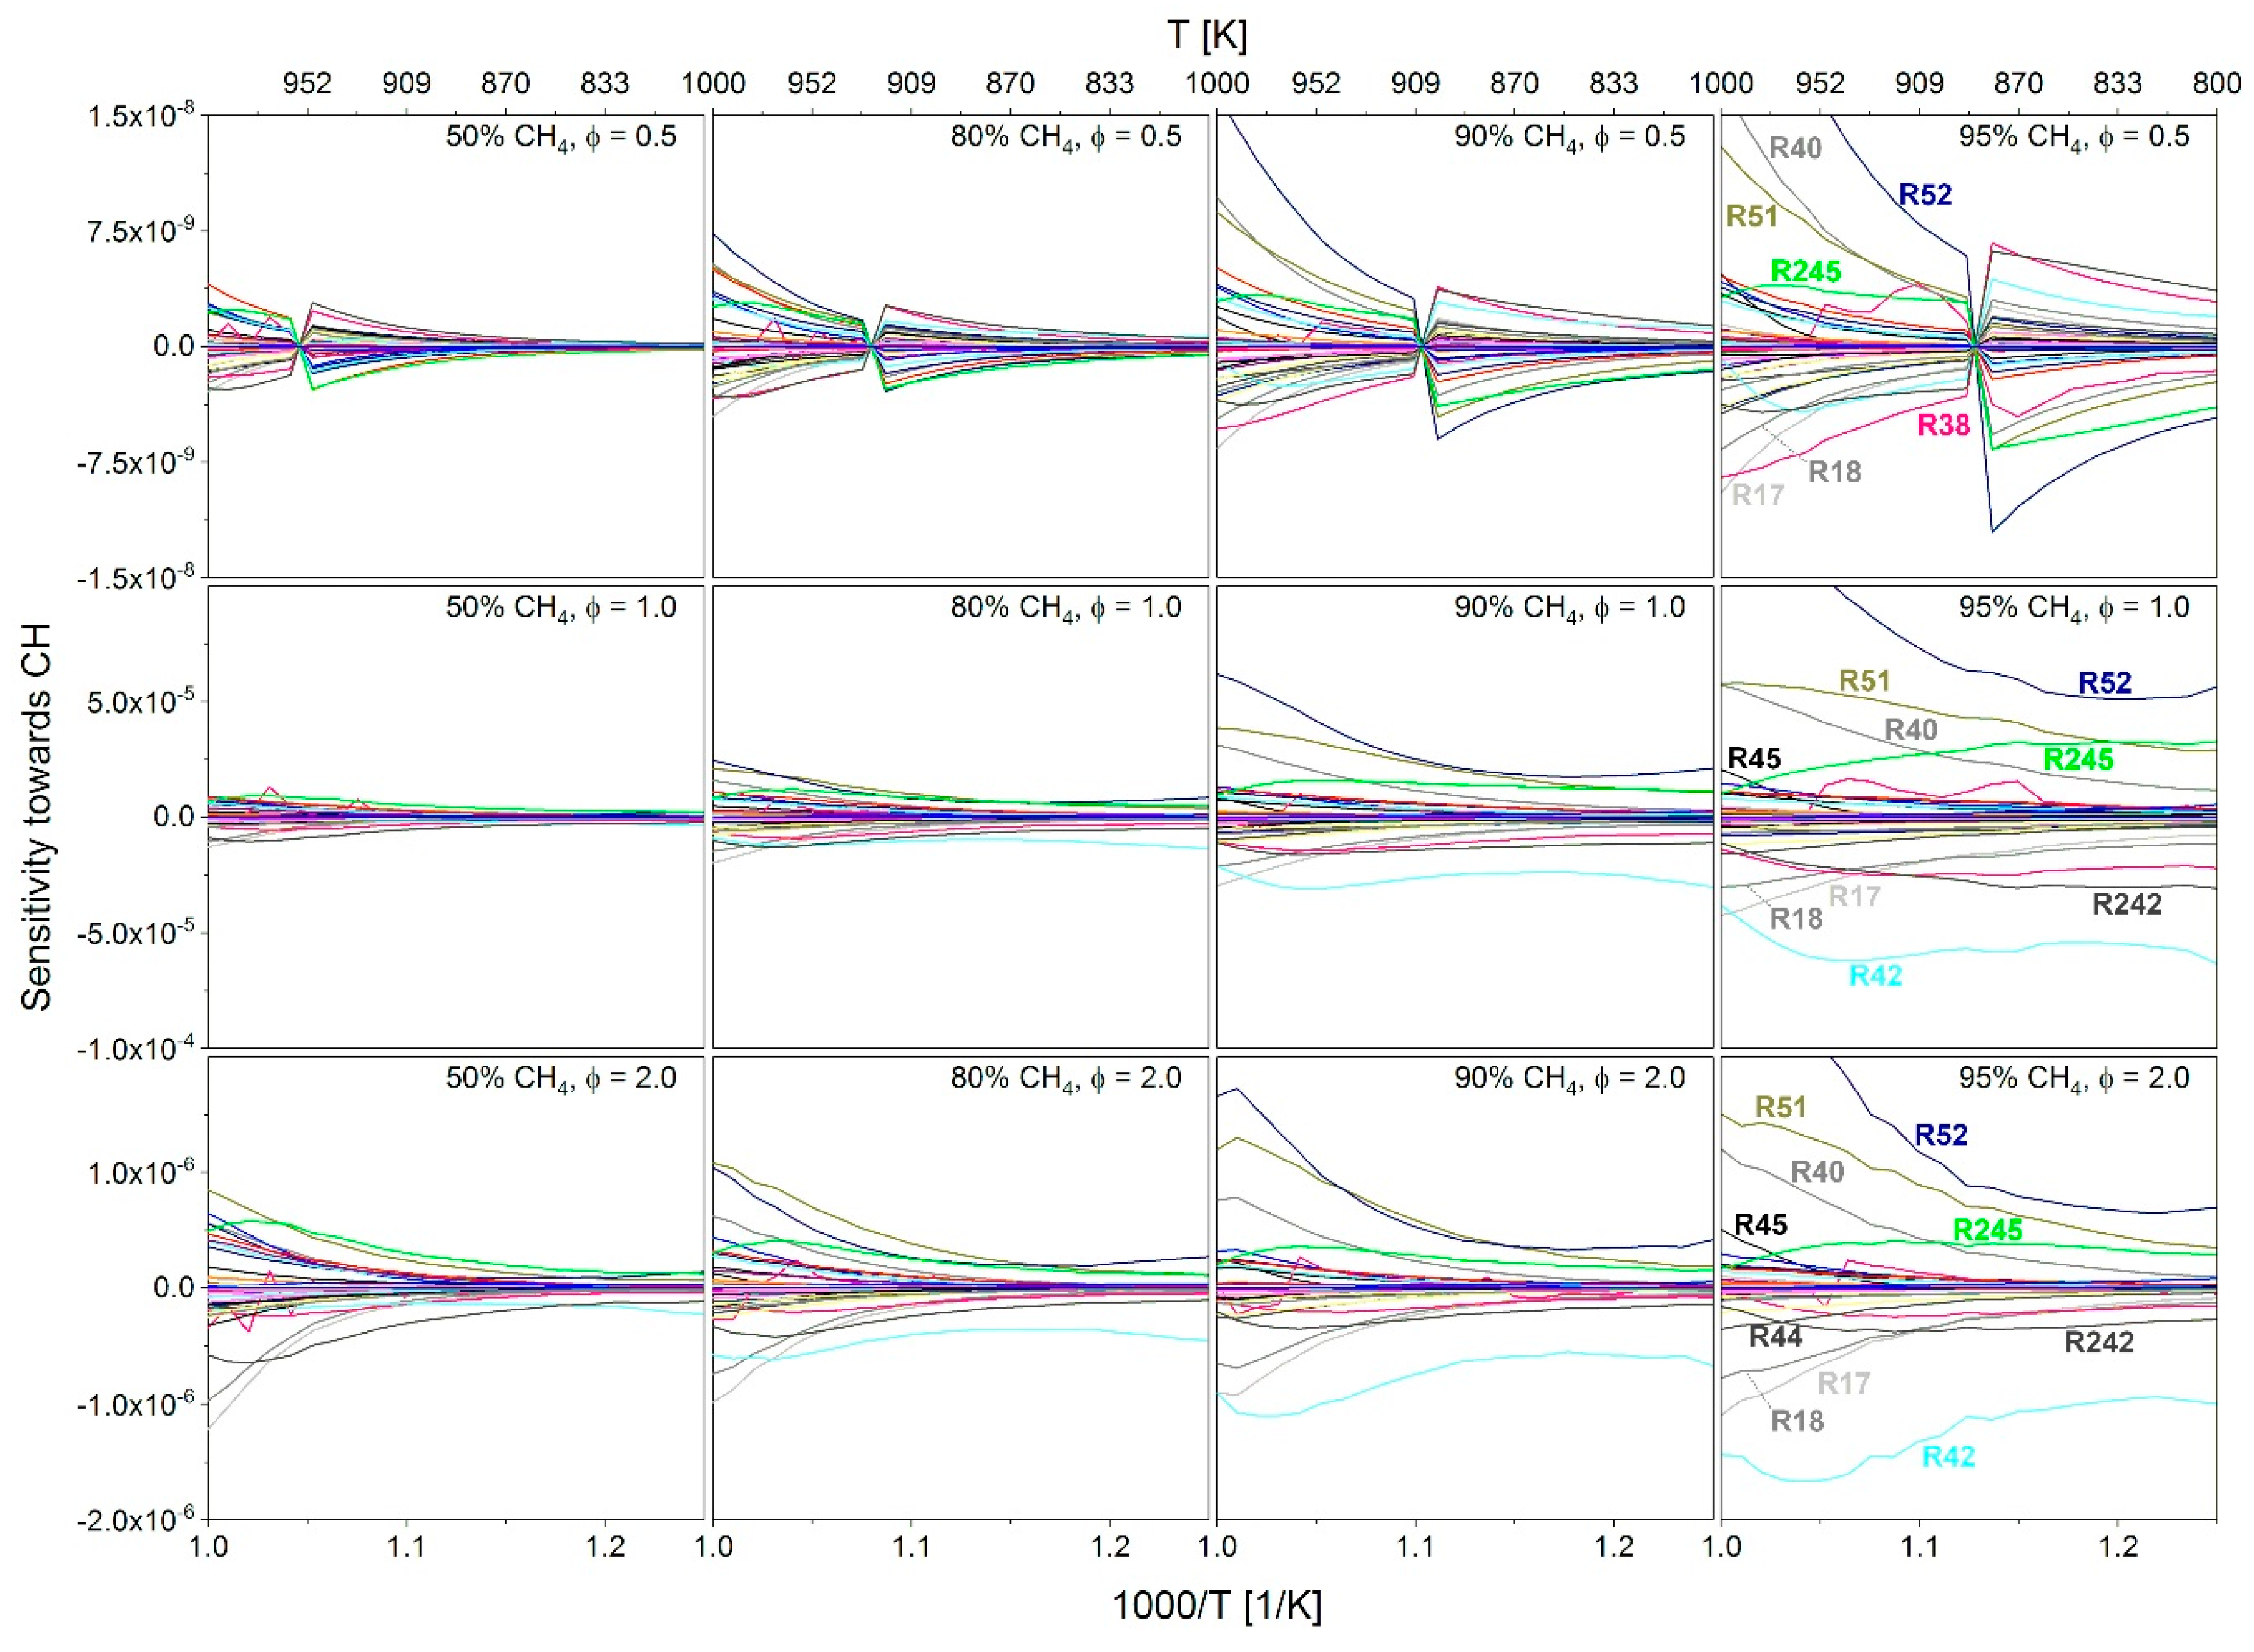
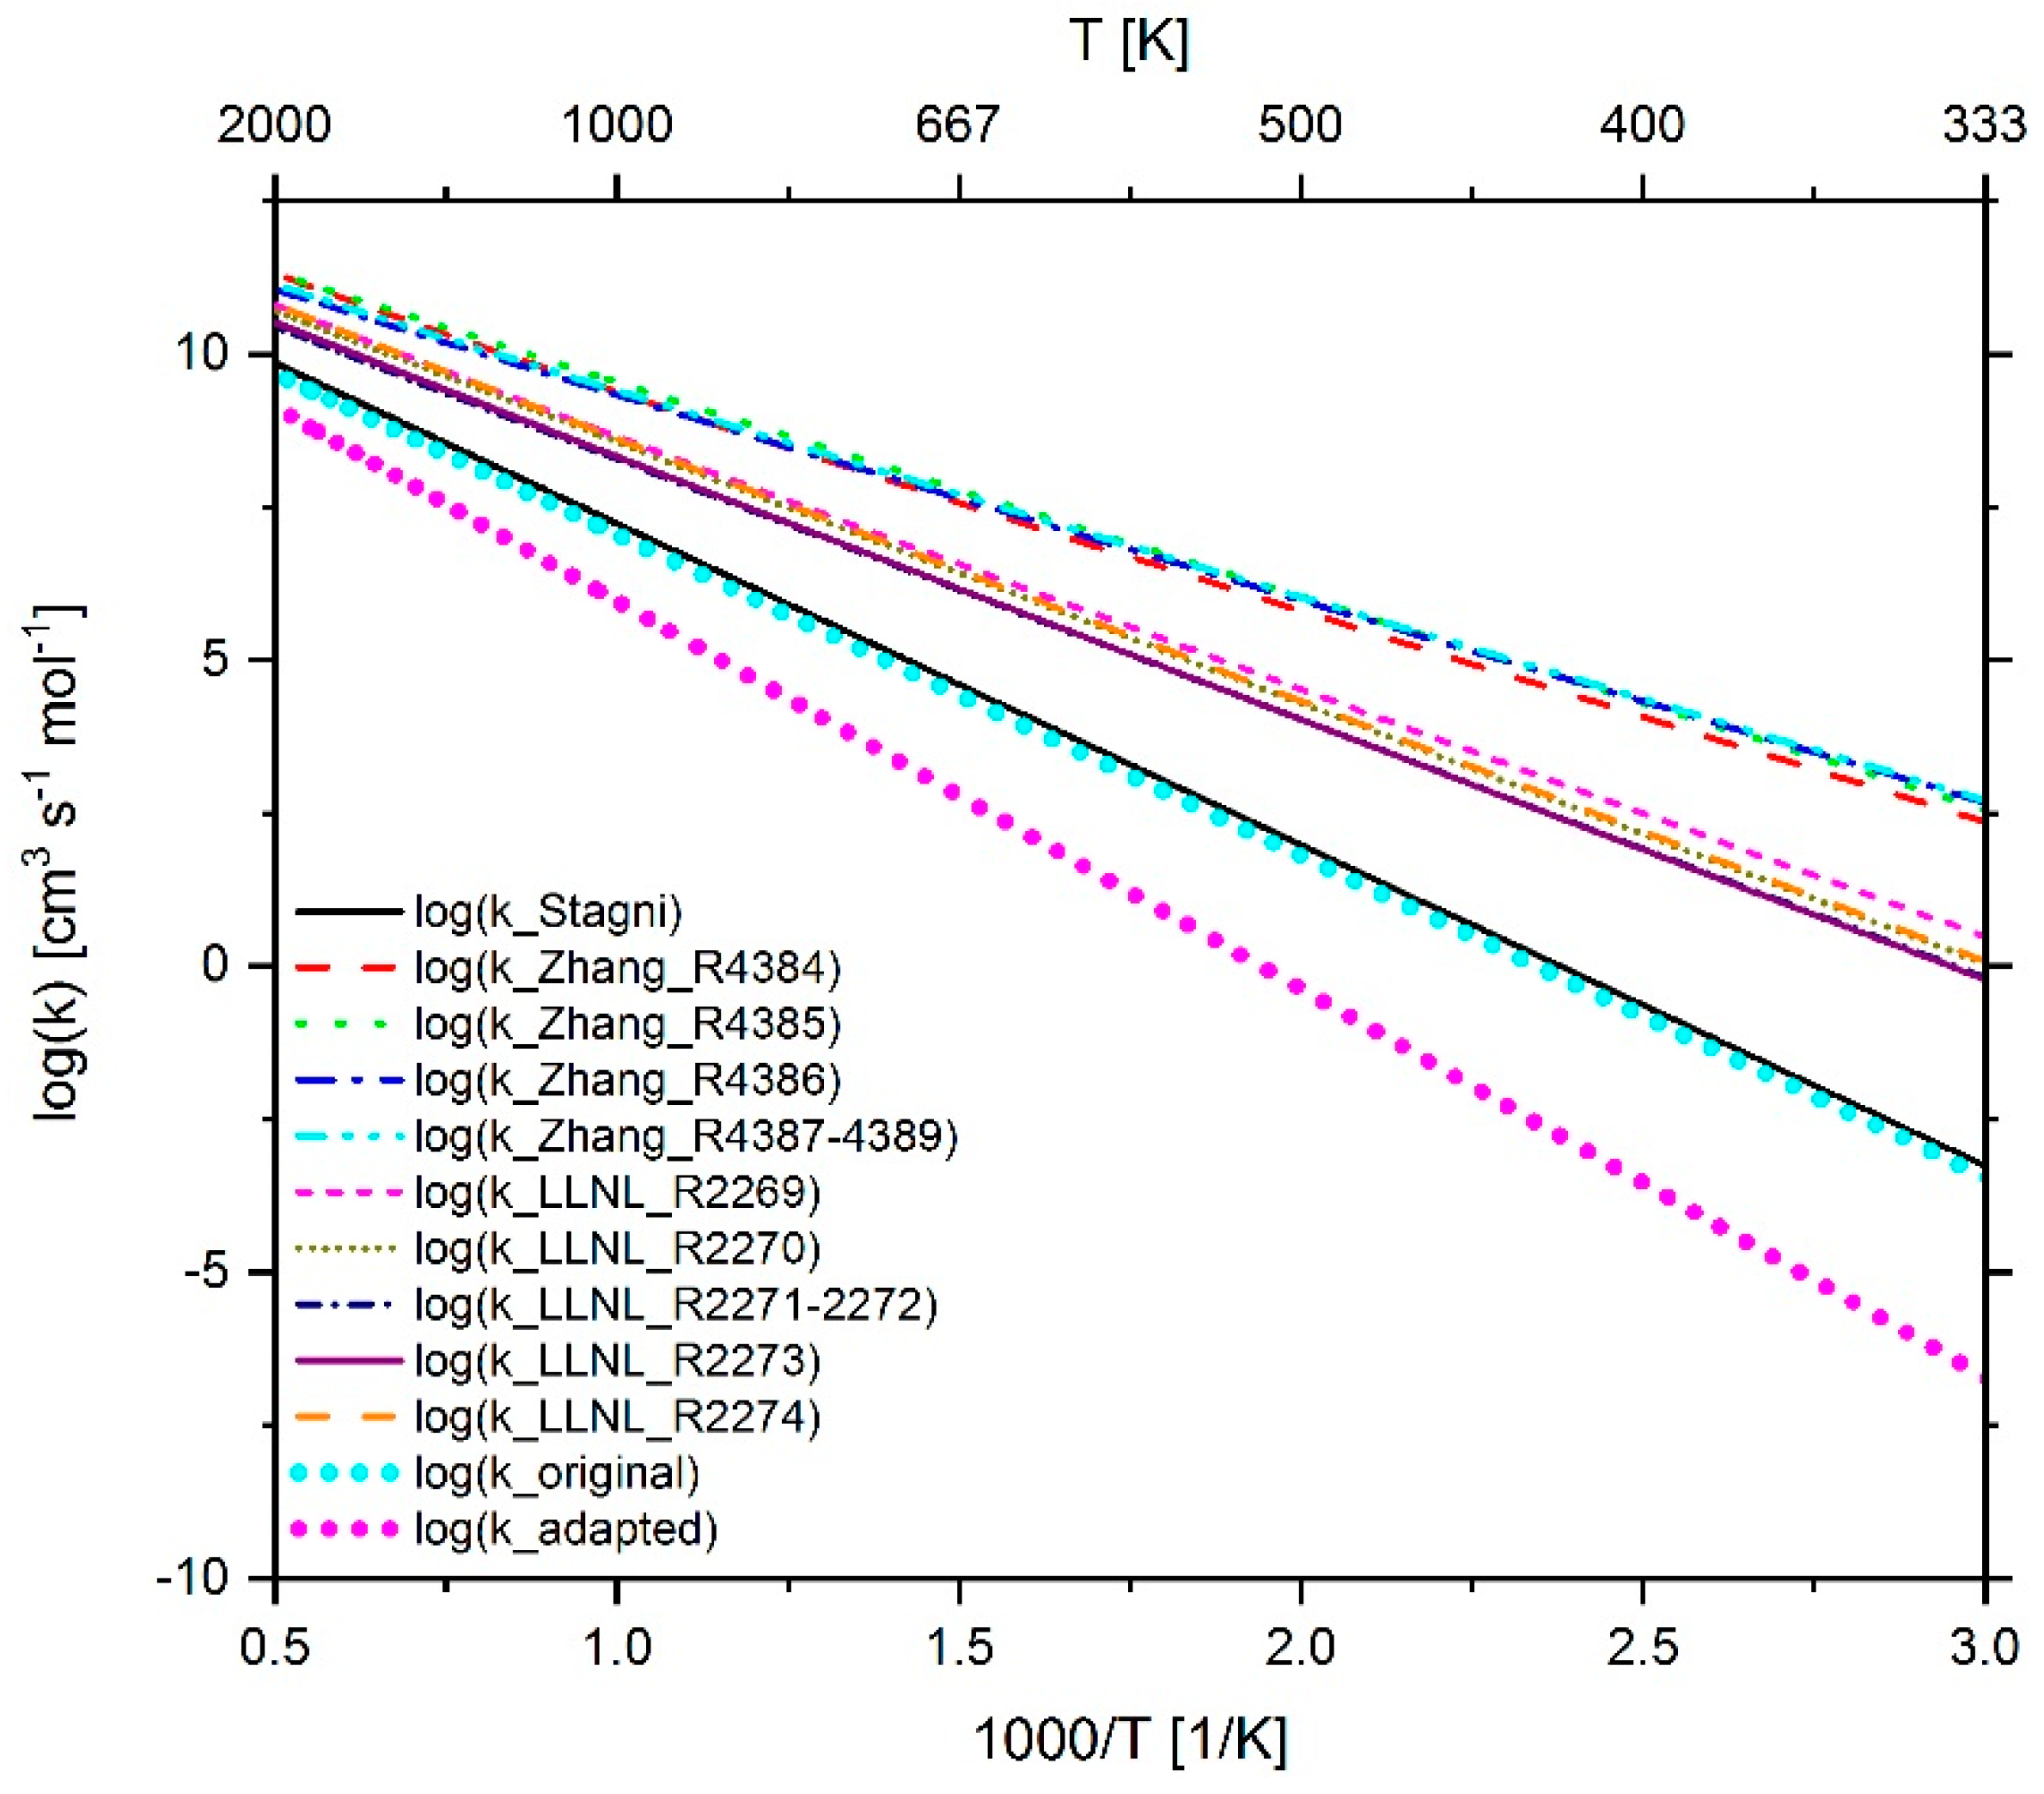
2.3.1. Determination of the Most Important Reactions

The Complete San Diego mechanism with n-heptane extension consists of 301 elementary and lumped reactions. In order to determine which reactions at a certain fuel composition and defined ambient conditions (pressure, temperature, fuel–air equivalence ratio) have a high influence on the total reaction speed and are thus decisive for the IDT, the performance of sensitivity analyzes is expedient. Since LOGEresearch was used for the sensitivity analysis, the temperature or a species considered by the reaction mechanism were available as analysis target [34]. Figure 13 shows the pressure curve in the time range of ignition of an n-heptane–air mixture with a fuel–air equivalence ratio of 1 at 750 K and 60 bar and a methane–air mixture with a fuel–air equivalence ratio of 1 at 950 K and 60 bar, both simulated with a CV reactor. Furthermore, the molar fraction profiles of the species O, H, OH, CH and HO2 are presented, which represent reactive intermediates during the combustion process. Assessing the course of the CH mole fraction when igniting the n-heptane–air mixture and the methane–air mixture, the formation rate of this radical shows a strong increase shortly before the point of ignition (steepest rise in the pressure curve). Due to the assumption of adiabatic conditions in the constant volume reactor, the temperature after ignition remains constant at about 3000 K. At these conditions, the CH-radical is the only one of the investigated species whose concentration drops by more than three orders of magnitude shortly after ignition. Thus, this radical occurs only in the ignition area in significant quantities. In the following sensitivity analysis, it has been assumed that increasing the reaction rate coefficients of those reactions which favor the formation of CH radicals results in a faster initiation of ignition, leading to a reduction of the IDT. Therefore, the species CH was chosen as analysis target.
As an example, Figure 14 shows the simulated time-dependent sensitivity profile of reaction 297 (n-C7H15 + O2n-C7-QOOH) towards the species CH for an n-heptane–air mixture at ϕ = 1, T = 750 K and p = 60 bar. In addition, the pressure curve can be seen, where, by definition, the ignition point is located at the point of fastest pressure increase. Shortly before the ignition (i.e., in the period in which CH is significantly formed), the sensitivity increases sharply and falls afterwards into the negative range momentary. Since only the sensitivity values up to the point of ignition are of interest for the determination of the maximal positive or negative sensitivity value, only results in the period up to ignition were considered. In the diagram, this area is highlighted blue. It has to be mentioned that all sensitivity values shown in this study take into account both the forward and the reverse direction of the reactions.
Another way to determine the influence of the reactions on the IDT is to perform a sensitivity analysis towards the temperature. Ji et al. [35] showed that there is a direct correlation between temperature sensitivity and IDT sensitivity. As an example, Figure 15 shows a comparison of the sensitivity towards the species CH and the temperature, simulated with an n-heptane-air mixture at 60 bar and ϕ = 1. It can be seen that the temperature-dependent sensitivity curves of both analyzes show a qualitatively similar course and thus both methods are suited for further mechanism analyzes. However, to avoid confusion, all further sensitivity analyzes shown in this study have been performed consistently towards the species CH.

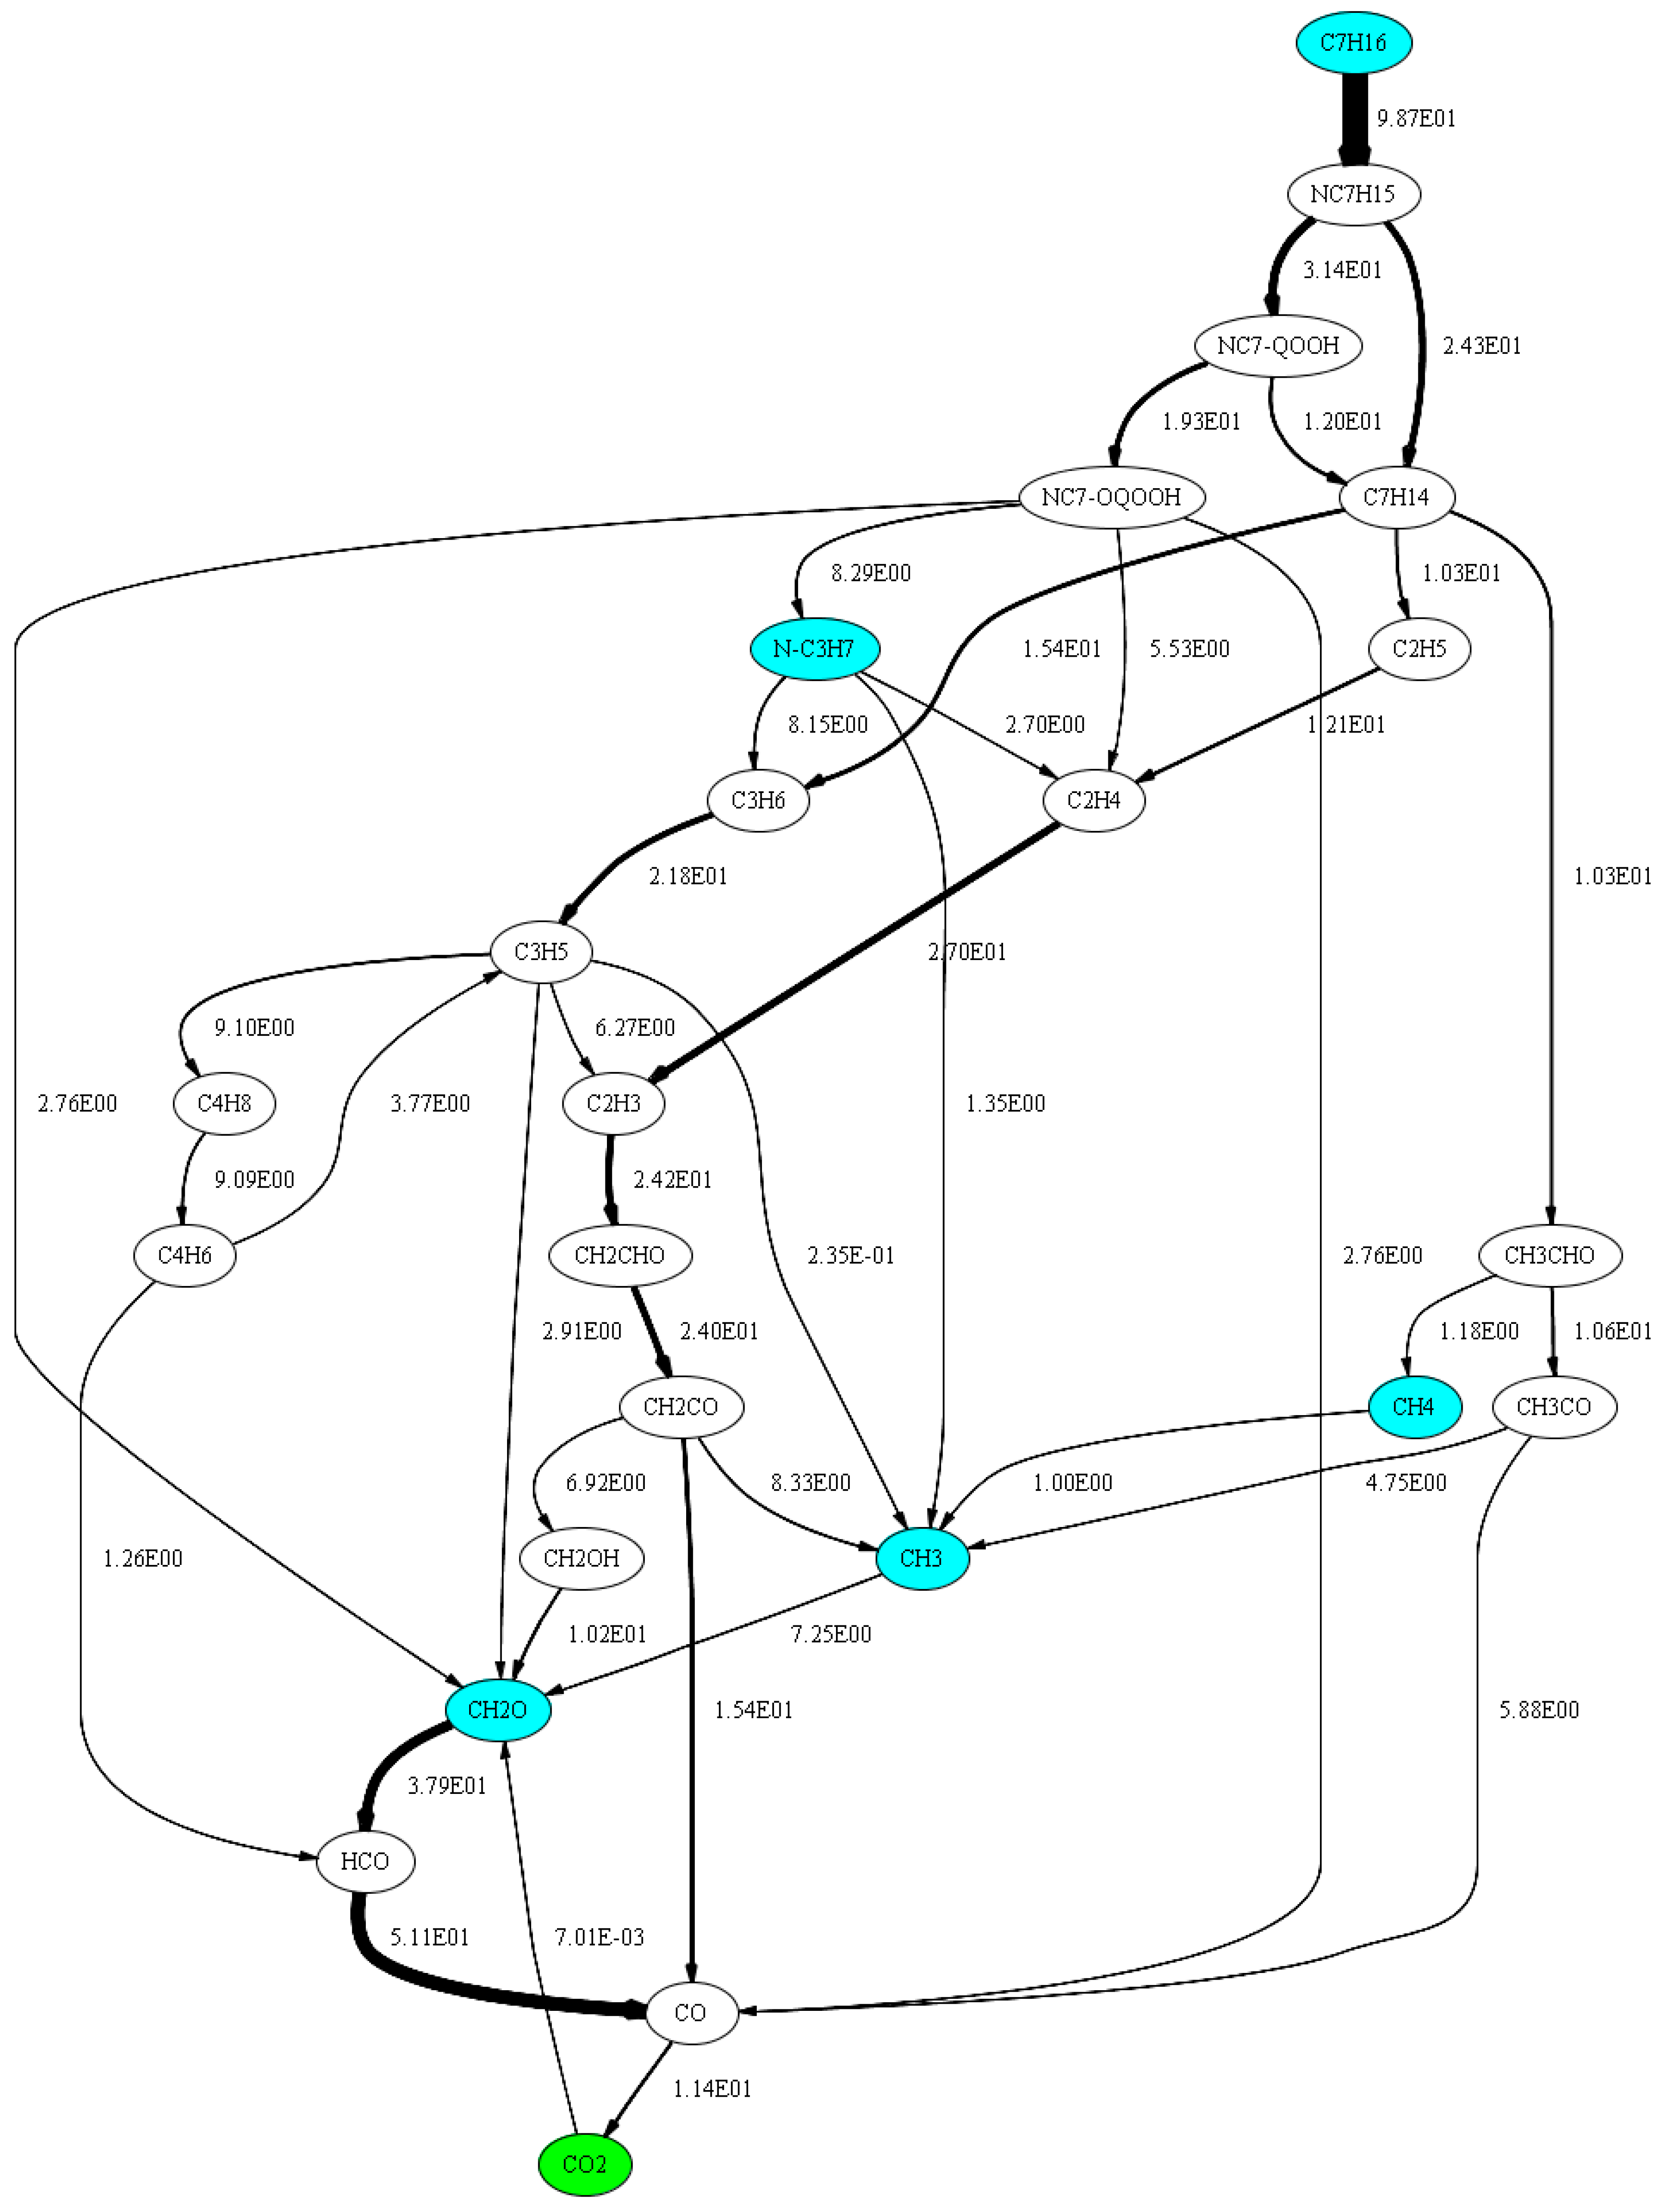
2.3.2. Investigation of n-Heptane Oxidation

As previously stated, the diesel spray ignition calculated via CFD simulation results on the one hand in a small IDT at 823 K, and on the other hand at 923 K and higher, and the IDT is overrated as shown in Figure 11. To determine the most influential reactions, a sensitivity analysis towards CH was performed with an n-heptane–air mixture in the temperature range 700 to 1000 K at a pressure of 60 bar and a fuel–air equivalence ratio of 0.5, 1.0 and 2.0 to assess the influence of a fuel-lean, stoichiometric and fuel-rich mixture on sensitivity. The course of the sensitivities is shown in Figure 16.
At a fuel–air equivalence ratio of 0.5, a sign change of the sensitivity values can be determined between 960 and 970 K. This can be explained by the fact that the pressure curve in the area of the ignition shows two steep rises. As shown in Figure 17, up to 960 K, the second rise has the highest slope, which defines the point of ignition at this position. From 970 K, the slopes of the two rises change so that now the first rise shows the largest slope. By shifting the position of the largest pressure increase, the point of ignition also changes by definition. As a result, when searching for the maximum positive or negative sensitivity value, value ranges of different sizes are scanned; thus, the maximum value can vary and even change the sign. In Figure 17, the scan range is highlighted in blue. However, with the results of the sensitivity analysis, reactions with high positive or negative sensitivity values in the considered temperature range were determined and are listed in Table 2.

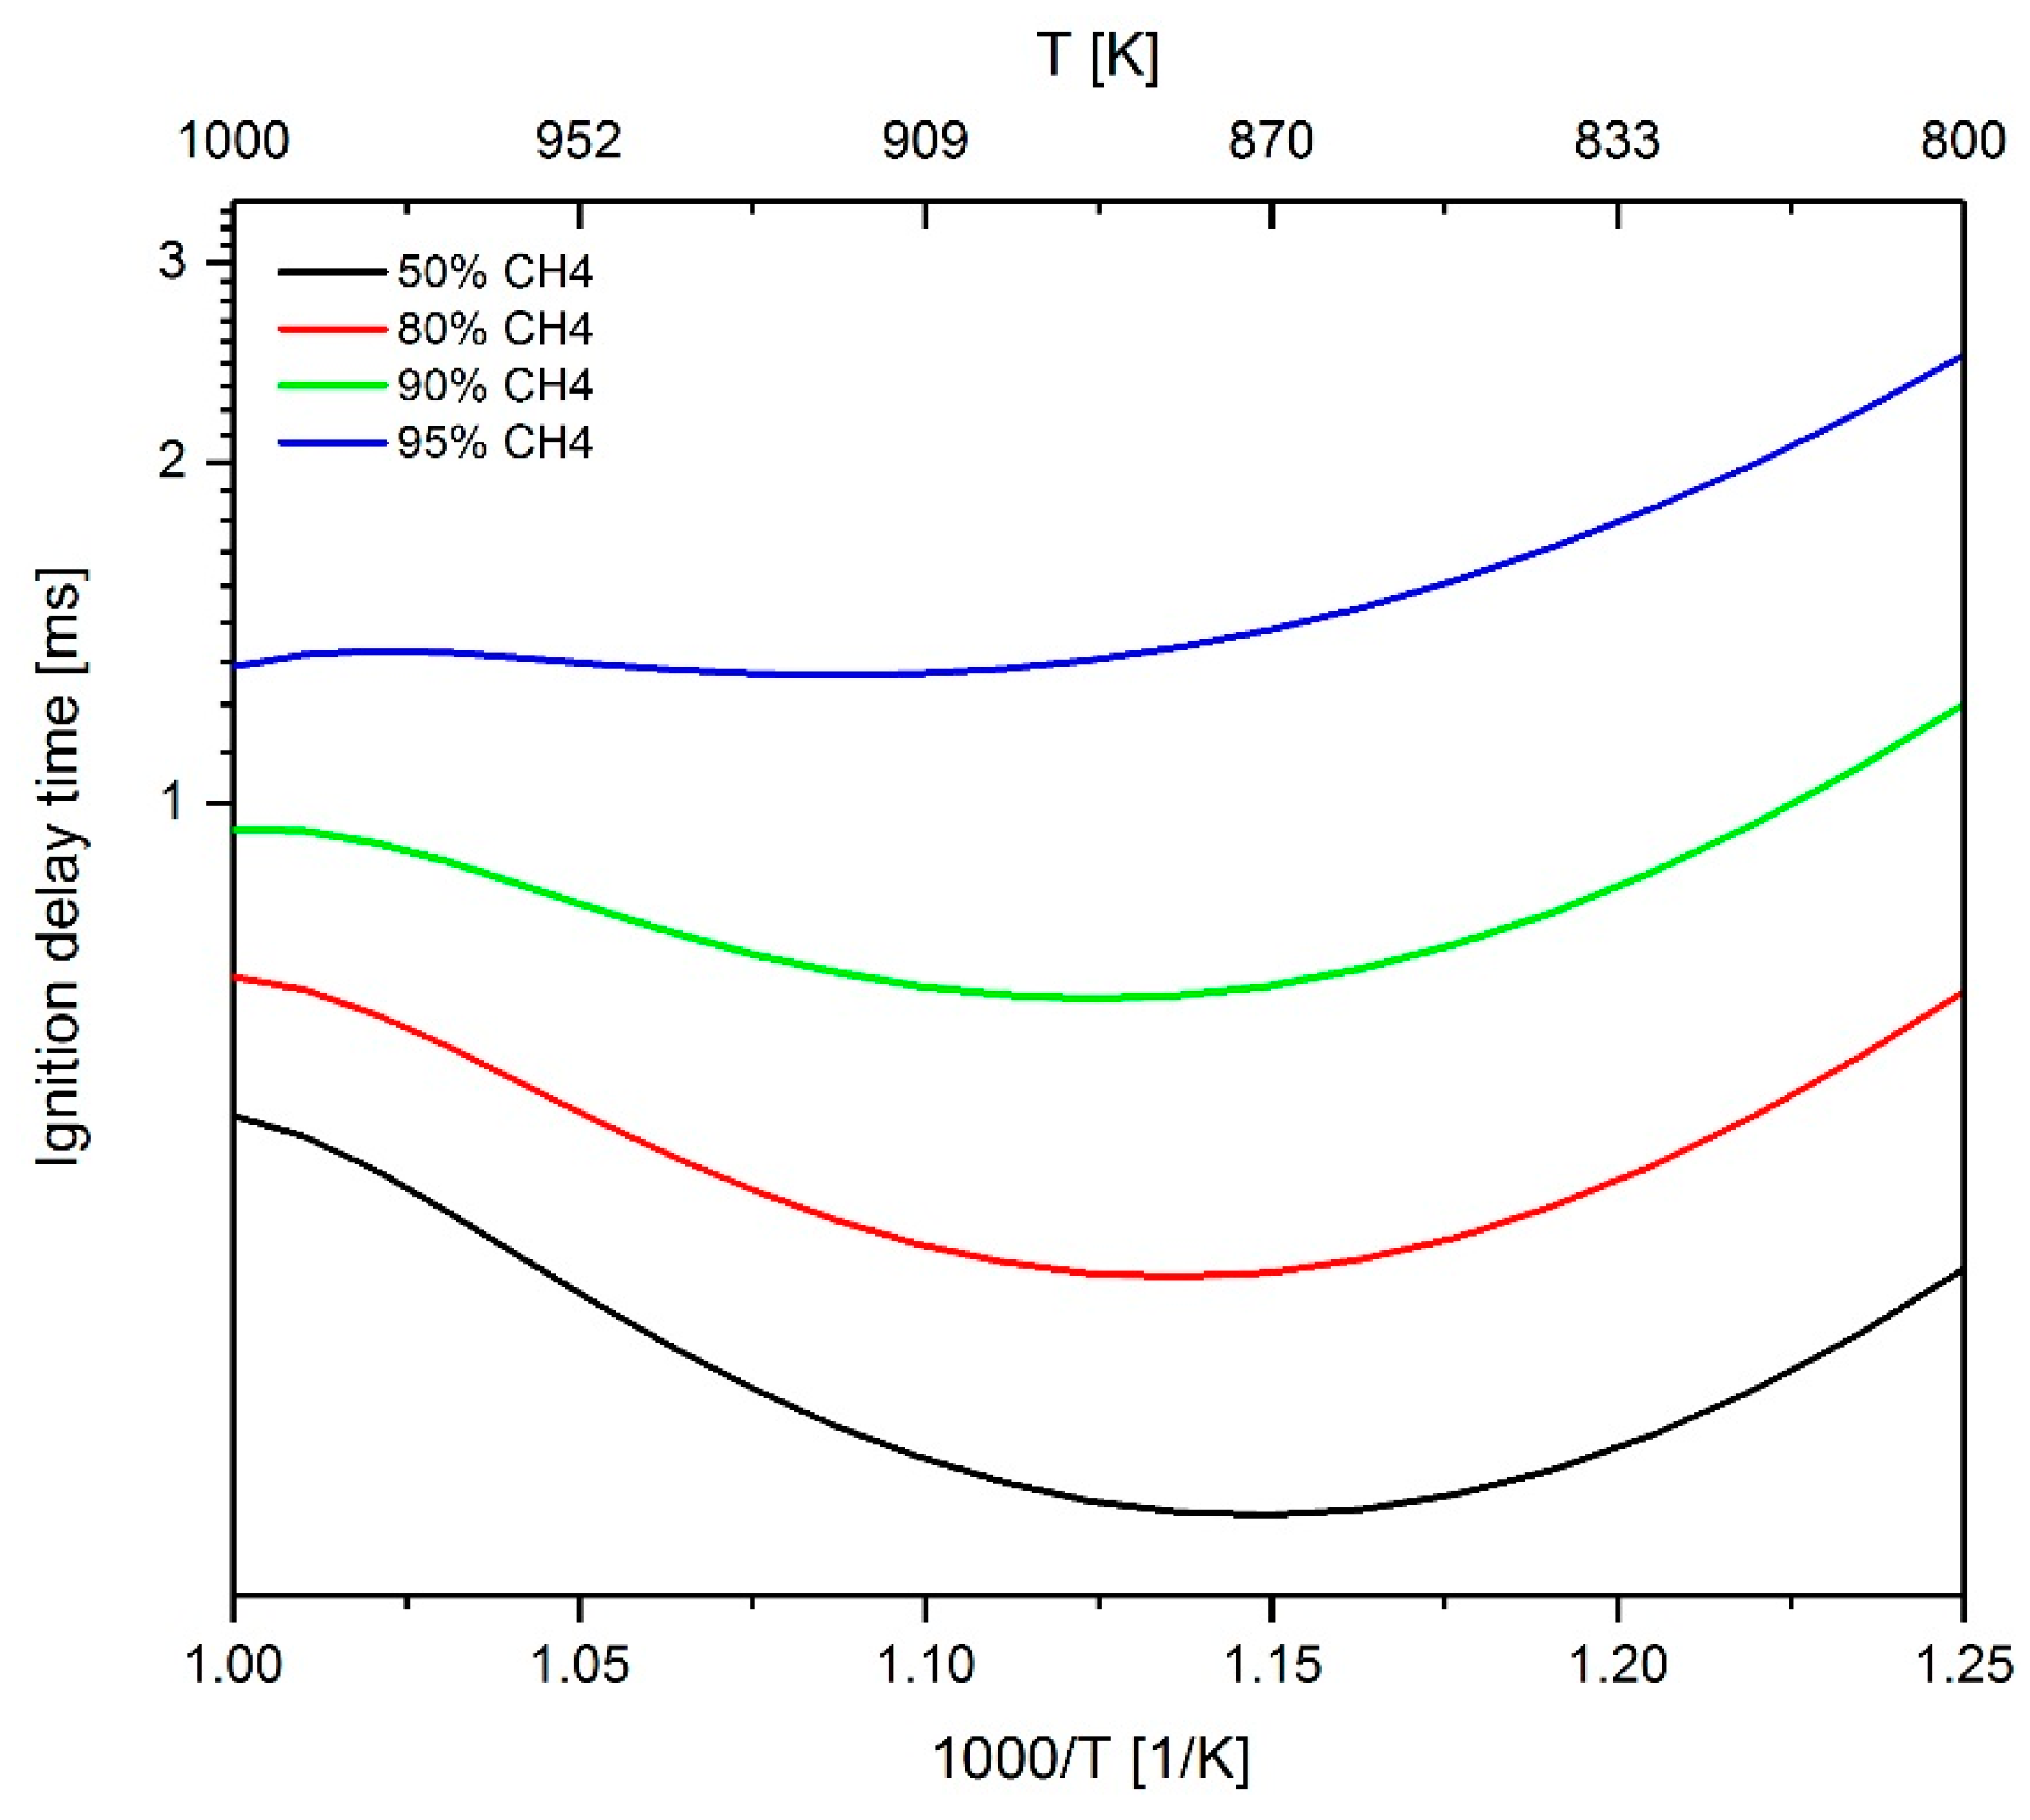
2.3.3. Investigation of the Influence of Methane on the IDT

In order to determine the influence of the admixture of methane the total reactivity, starting from a methane-n-heptane–air mixture with 50 mol % methane and 50 mol % n-heptane, the methane content was increased gradually and the effect on the sensitivity values examined. As shown in Figure 18, the addition of methane leads to an increase of the IDT. The reactions of the n-heptane sub-mechanism (reactions 269 to 301) were not considered in this analysis since only reactions should be identified that could be used to change the calculation of the ignition behavior for a methane admixture without influencing n-heptane reactions directly to allow an individual adaptation of the sub-mechanisms later. Figure 19 shows the sensitivity towards CH of reactions 1 to 268 with increasing the admixture of methane. The analysis was carried out at a fuel–air equivalence ratio of 0.5, 1.0 and 2.0, again to assess the impact of methane addition at fuel-rich, stochiometric and fuel-lean conditions. At a fuel–air equivalence ratio of 0.5, a sign change of the sensitivity values can be seen, which, as already discussed in Section 2.3.2., can be explained by a shift in the scanned value range. Furthermore, it can be stated that the absolute sensitivity values increase with increasing CH4 content. For the sake of clarity, the display of a legend has been omitted in Figure 19. Instead, in the diagram column with a 95 mol % methane admixture, the reactions with the highest sensitivity values are directly labeled and are summarized in Table 3.
In order to determine which of the reactions listed in Table 3 are most suitable for the mechanism adaptation without affecting the n-heptane oxidation, a flow analysis [34] has been performed with an n-heptane–air mixture at 950 K, 60 bar and ϕ = 1. The result is shown graphically in Figure 20. The values given in Figure 20 represent the netto flux in mol/m3 from one species to the next in the time period from the start of the simulation to the point of ignition. For the sake of clarity, only those flows are shown which correspond to 99% of the maximum flow rate or which are necessary in order to be able to display the species CH3, CH4, CH2O and n-C3H7 and to avoid dead ends in the diagram. It can be seen that the fluxes to and from the species CH3, CH2O and n-C3H7 are up to 20 times larger compared to the flux to and from the species CH4. Based on this observation, it can be stated that CH4 plays quantitatively only a minor role in the oxidation of n-heptane using the Complete San Diego mechanism with the n-heptane extension. Since reactions 17 and 18 are important in both the oxidation of methane and n-heptane, the approach for the mechanism adaptation was to use the reactions 42, 44, and 45 to have an as small as possible effect on the n-heptane oxidation.

2.4. Adaption of Arrhenius Parameter

The optimization of the reaction mechanism was performed via manual tuning of Arrhenius parameters of individual reactions where they have been iteratively adjusted in several development loops under constant balancing of 0D-simulations performed with LOGEresearch and CFD simulations done with AVL FIRETM with the corresponding experimental data. Both the thermodynamic data and the transport data remained untouched throughout the whole optimization process. An example of the effect of changing the frequency factor A of reaction 299 shown in Table 2 by ±10% on the reaction rate coefficient and the IDT is presented in Figure 21. It can clearly be seen that the change of the frequency factor A only leads to a significant change of the IDT at a temperature of more than 840 K. As shown in Figure 16, this temperature corresponds to the value at which the sensitivity of reaction 299 increases noticeably.

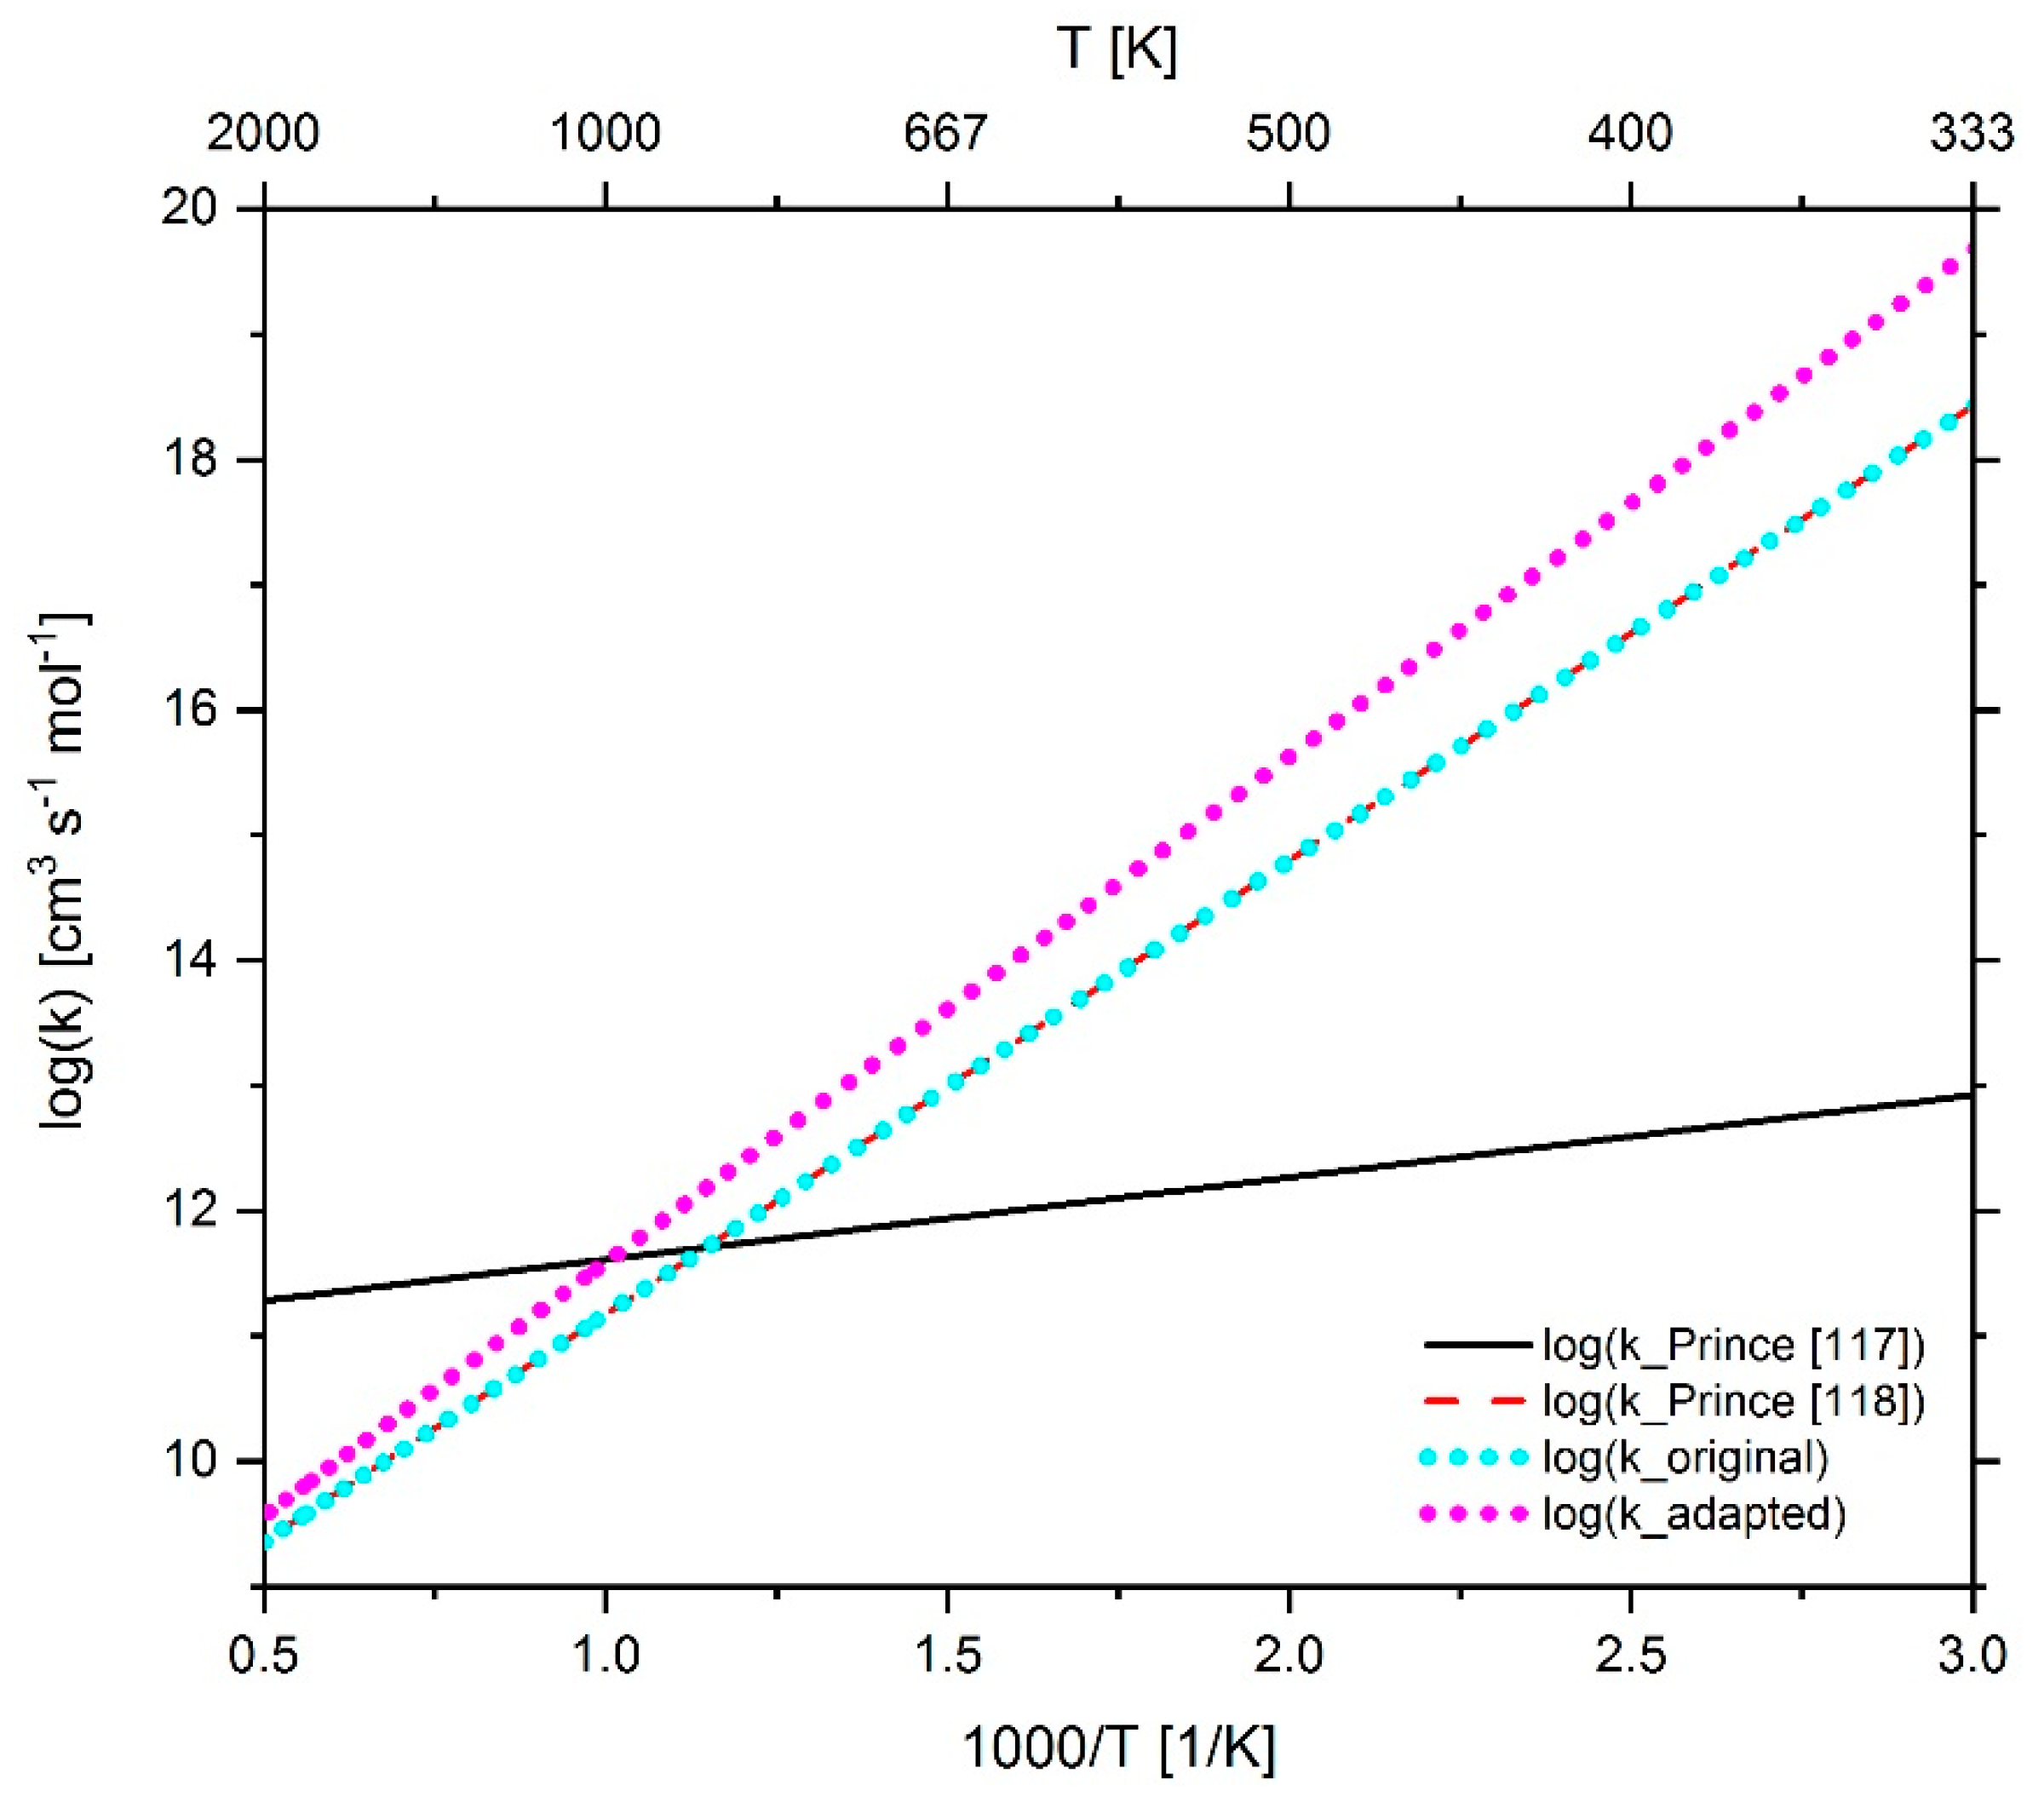
2.4.1. Adaption of Methane Chemistry

In order to allow a comparison of the reaction rate coefficients before and after the adaptation with an as large as possible number of reference data from literature, data from the NIST (National Institute of Standards and Technology) database [36] were included in the optimization process. In the case of reaction 42, a total of 88 data sets [37,38,39,40,41,42,43,44,45,46,47,48,49,50,51,52,53,54,55,56,57,58,59,60,61,62,63,64,65,66,67,68,69,70,71,72,73,74,75,76,77,78,79,80,81,82,83,84,85,86,87,88,89,90,91,92,93,94,95,96,97,98,99,100,101,102,103,104,105,106,107,108,109] over the temperature range 178 to 3000 K were used for comparison. For reaction 44 and 45, six [42,45,108,110,111,112] and three [42,45,113] data sets in the temperature range 300 to 2500 K were available. For the reaction 42, 44 and 45, the adaption was performed by changing the activation energy of the respective elementary reactions. The largest adjustment was made in reaction 42, which shows, as exhibited in Figure 19, the highest sensitivity in the temperature range considered compared to reaction 44 and 45 and thus a correspondingly large impact on the overall reactivity. Furthermore, in the publication of Fu et al. [114] it is shown that reaction 42 contributes significantly to the increase in IDT when methane is added to an n-heptane–air mixture through the depletion of OH radicals. Therefore, to curb the consumption of OH radicals by reaction 42, the activation energy was increased leading to a reduction of the reaction speed. As can be seen in Figure 19, the reactions 42, 44 and 45 show different courses of the temperature-dependent sensitivity. Based on this, the reactions 44 and 45 were utilized to fine-tune the mechanism adaptation by analyzing which reaction in which temperature range could be used for increasing or decreasing the IDT so that through the interaction of the adjustment of all three reactions a maximum reduction of the deviation between the simulations and experiments in the respective temperature range could be achieved.
In the following Figure 22, Figure 23 and Figure 24, the temperature-dependent reaction rate coefficients before (original parameter) and after the mechanism adaptation (adapted parameter), as well as the fitted reaction rate coefficient determined using the NIST database are shown. Using the extended Arrhenius approach (1),
k = A · T β · e ( E A R · T ) ,
(with the frequency factor A , the temperature exponent β , the activation energy E A , the temperature T and the universal gas constant R ) and the values given in the NIST database for the Arrhenius parameters, the reaction rate coefficients for each data set in the specified temperature interval were calculated with a temperature resolution of 1 K. All these calculated data points were used to compute a fit function. The fit was performed with the software Origin (OriginPro 2017, OriginLab Corporation, Northampton, MA, USA) [115], where the extended Arrhenius approach served as basis for the nonlinear fitting procedure. The green shaded area in the diagrams represents the 95% prediction band of the fit function. The small diagram in the upper right corner shows a closer look to the progression of the reaction rate coefficient in the temperature range of 800 to 1000 K. At this point it is important to mention that the authors are aware that for example in the case of the well-studied reaction 42, the change in the activation energy is large. It should be noted, however, that it was not the target to develop a mechanism that could be generally used for a variety of problems, but to develop a mechanism specifically optimized to get the best possible agreement between the experiment and simulation results for the given parameter range in this study.

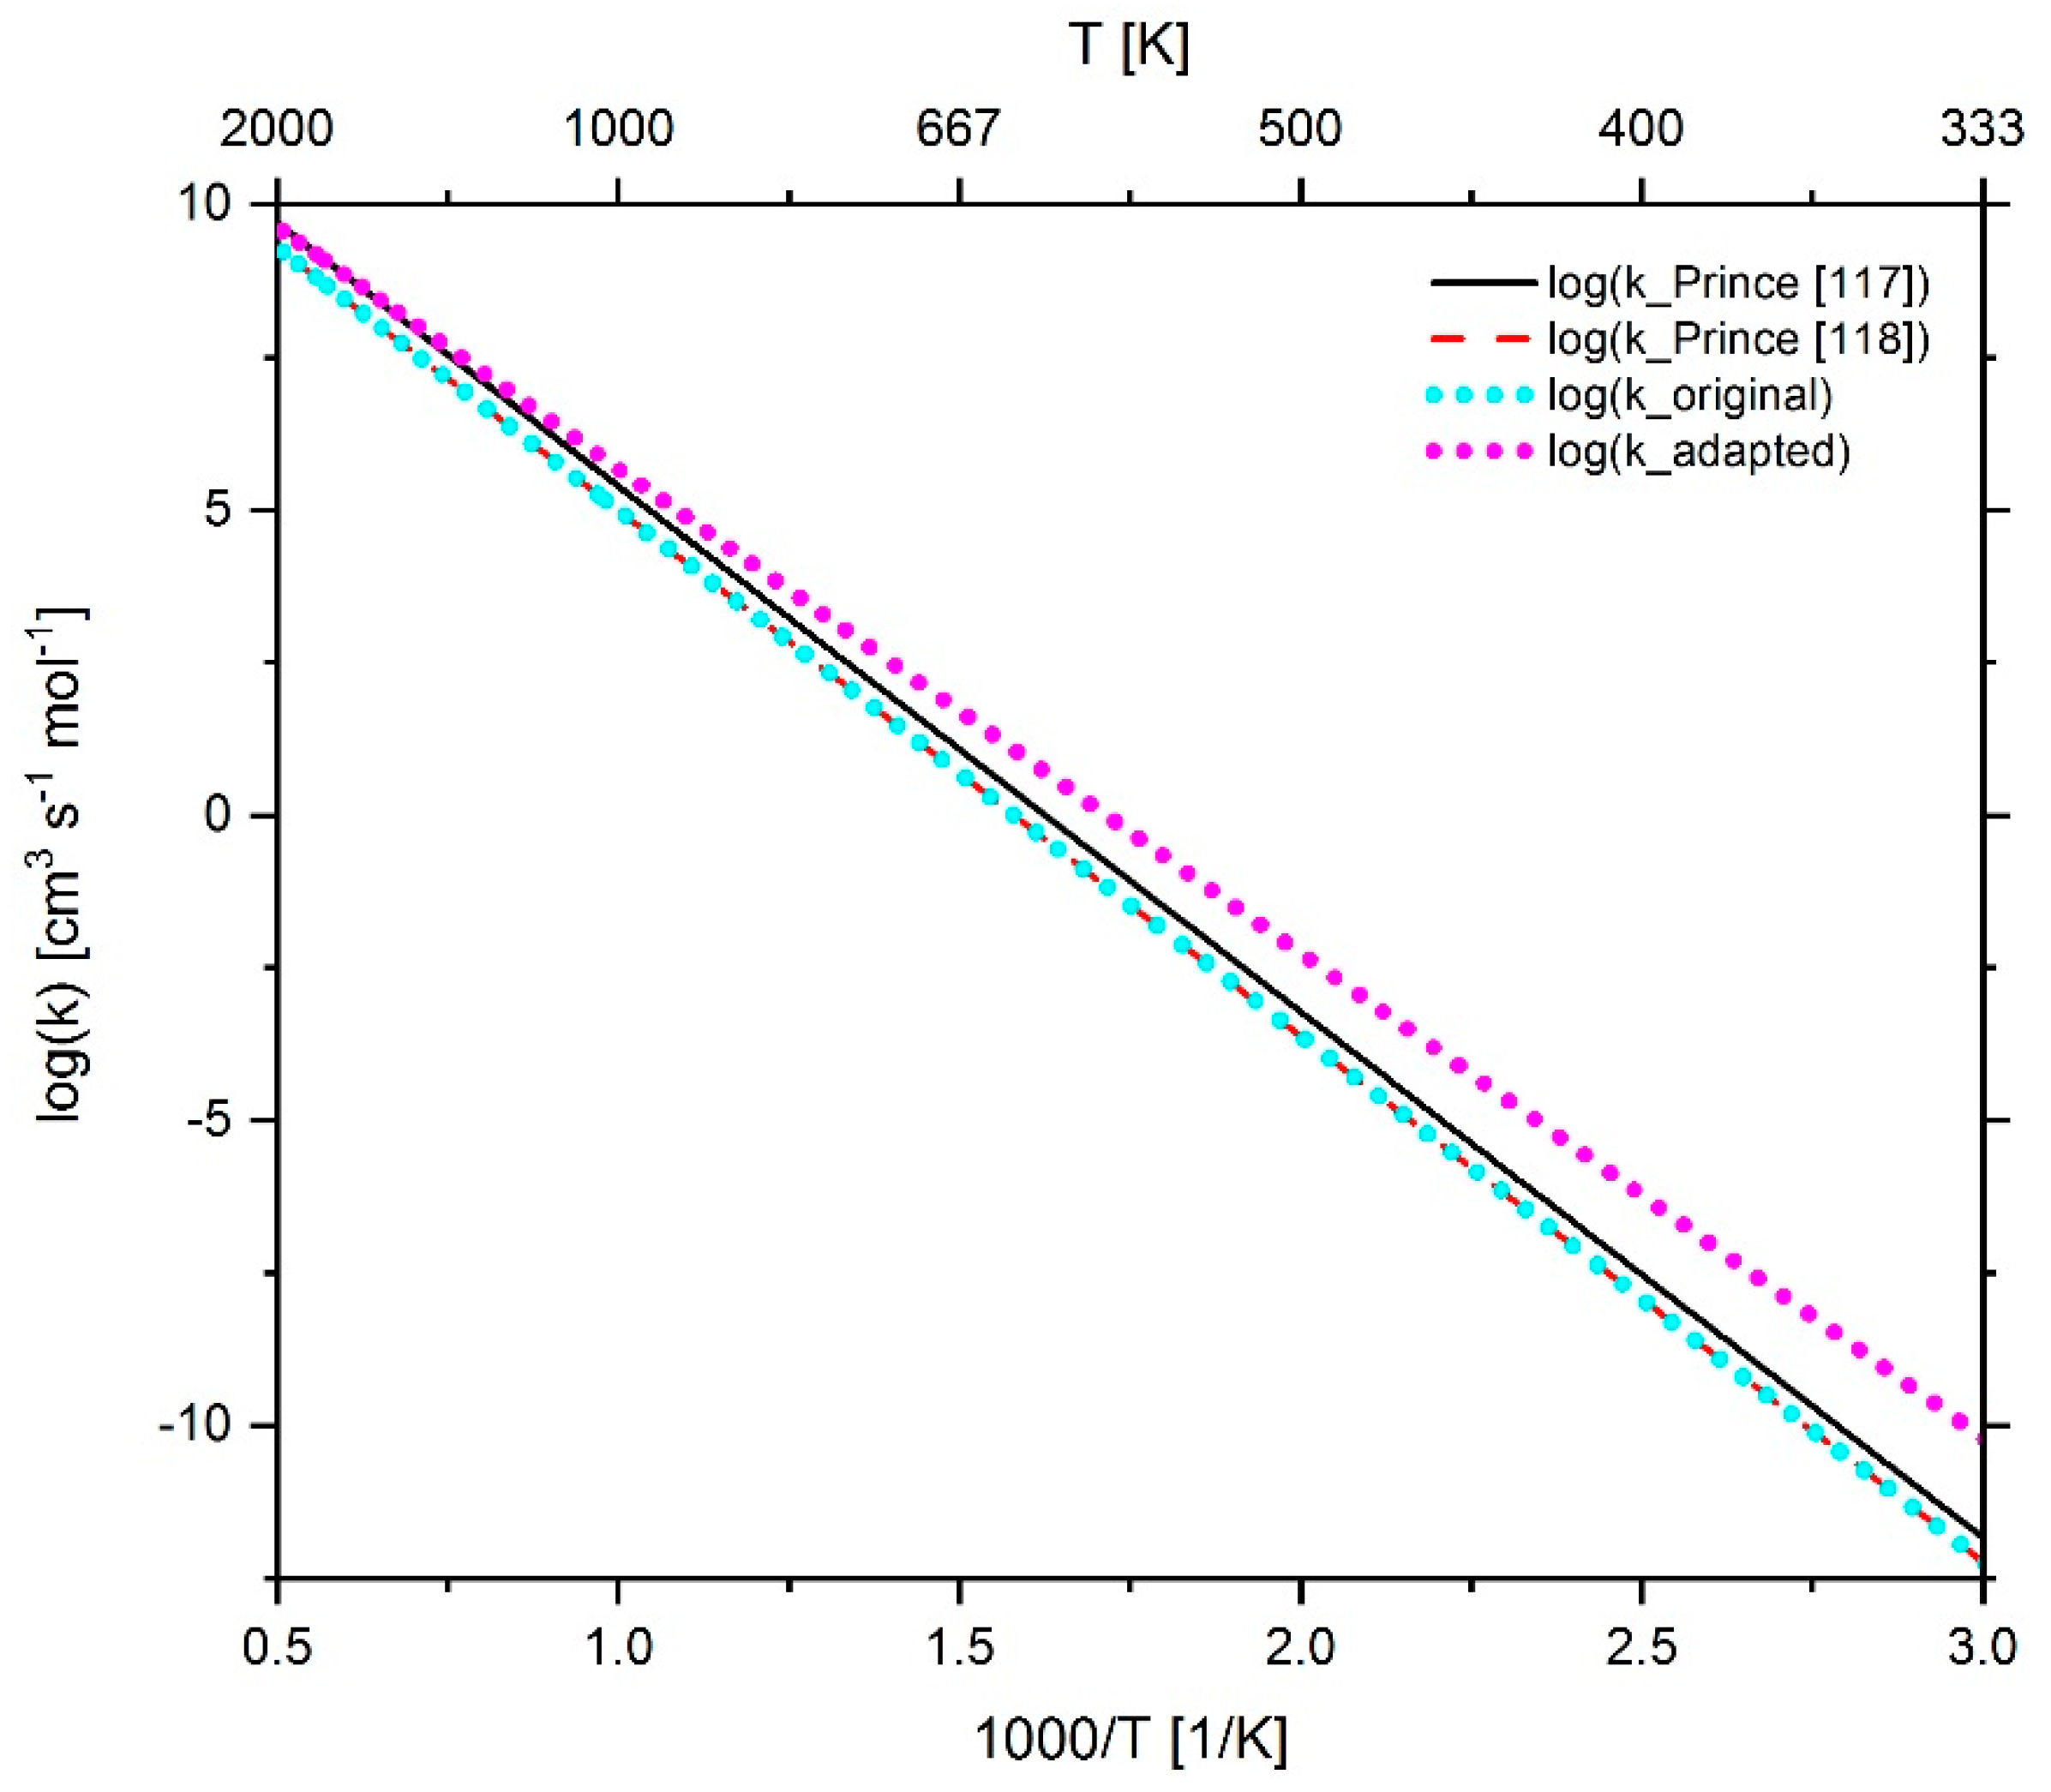
2.4.2. Adaption of n-heptane Chemistry
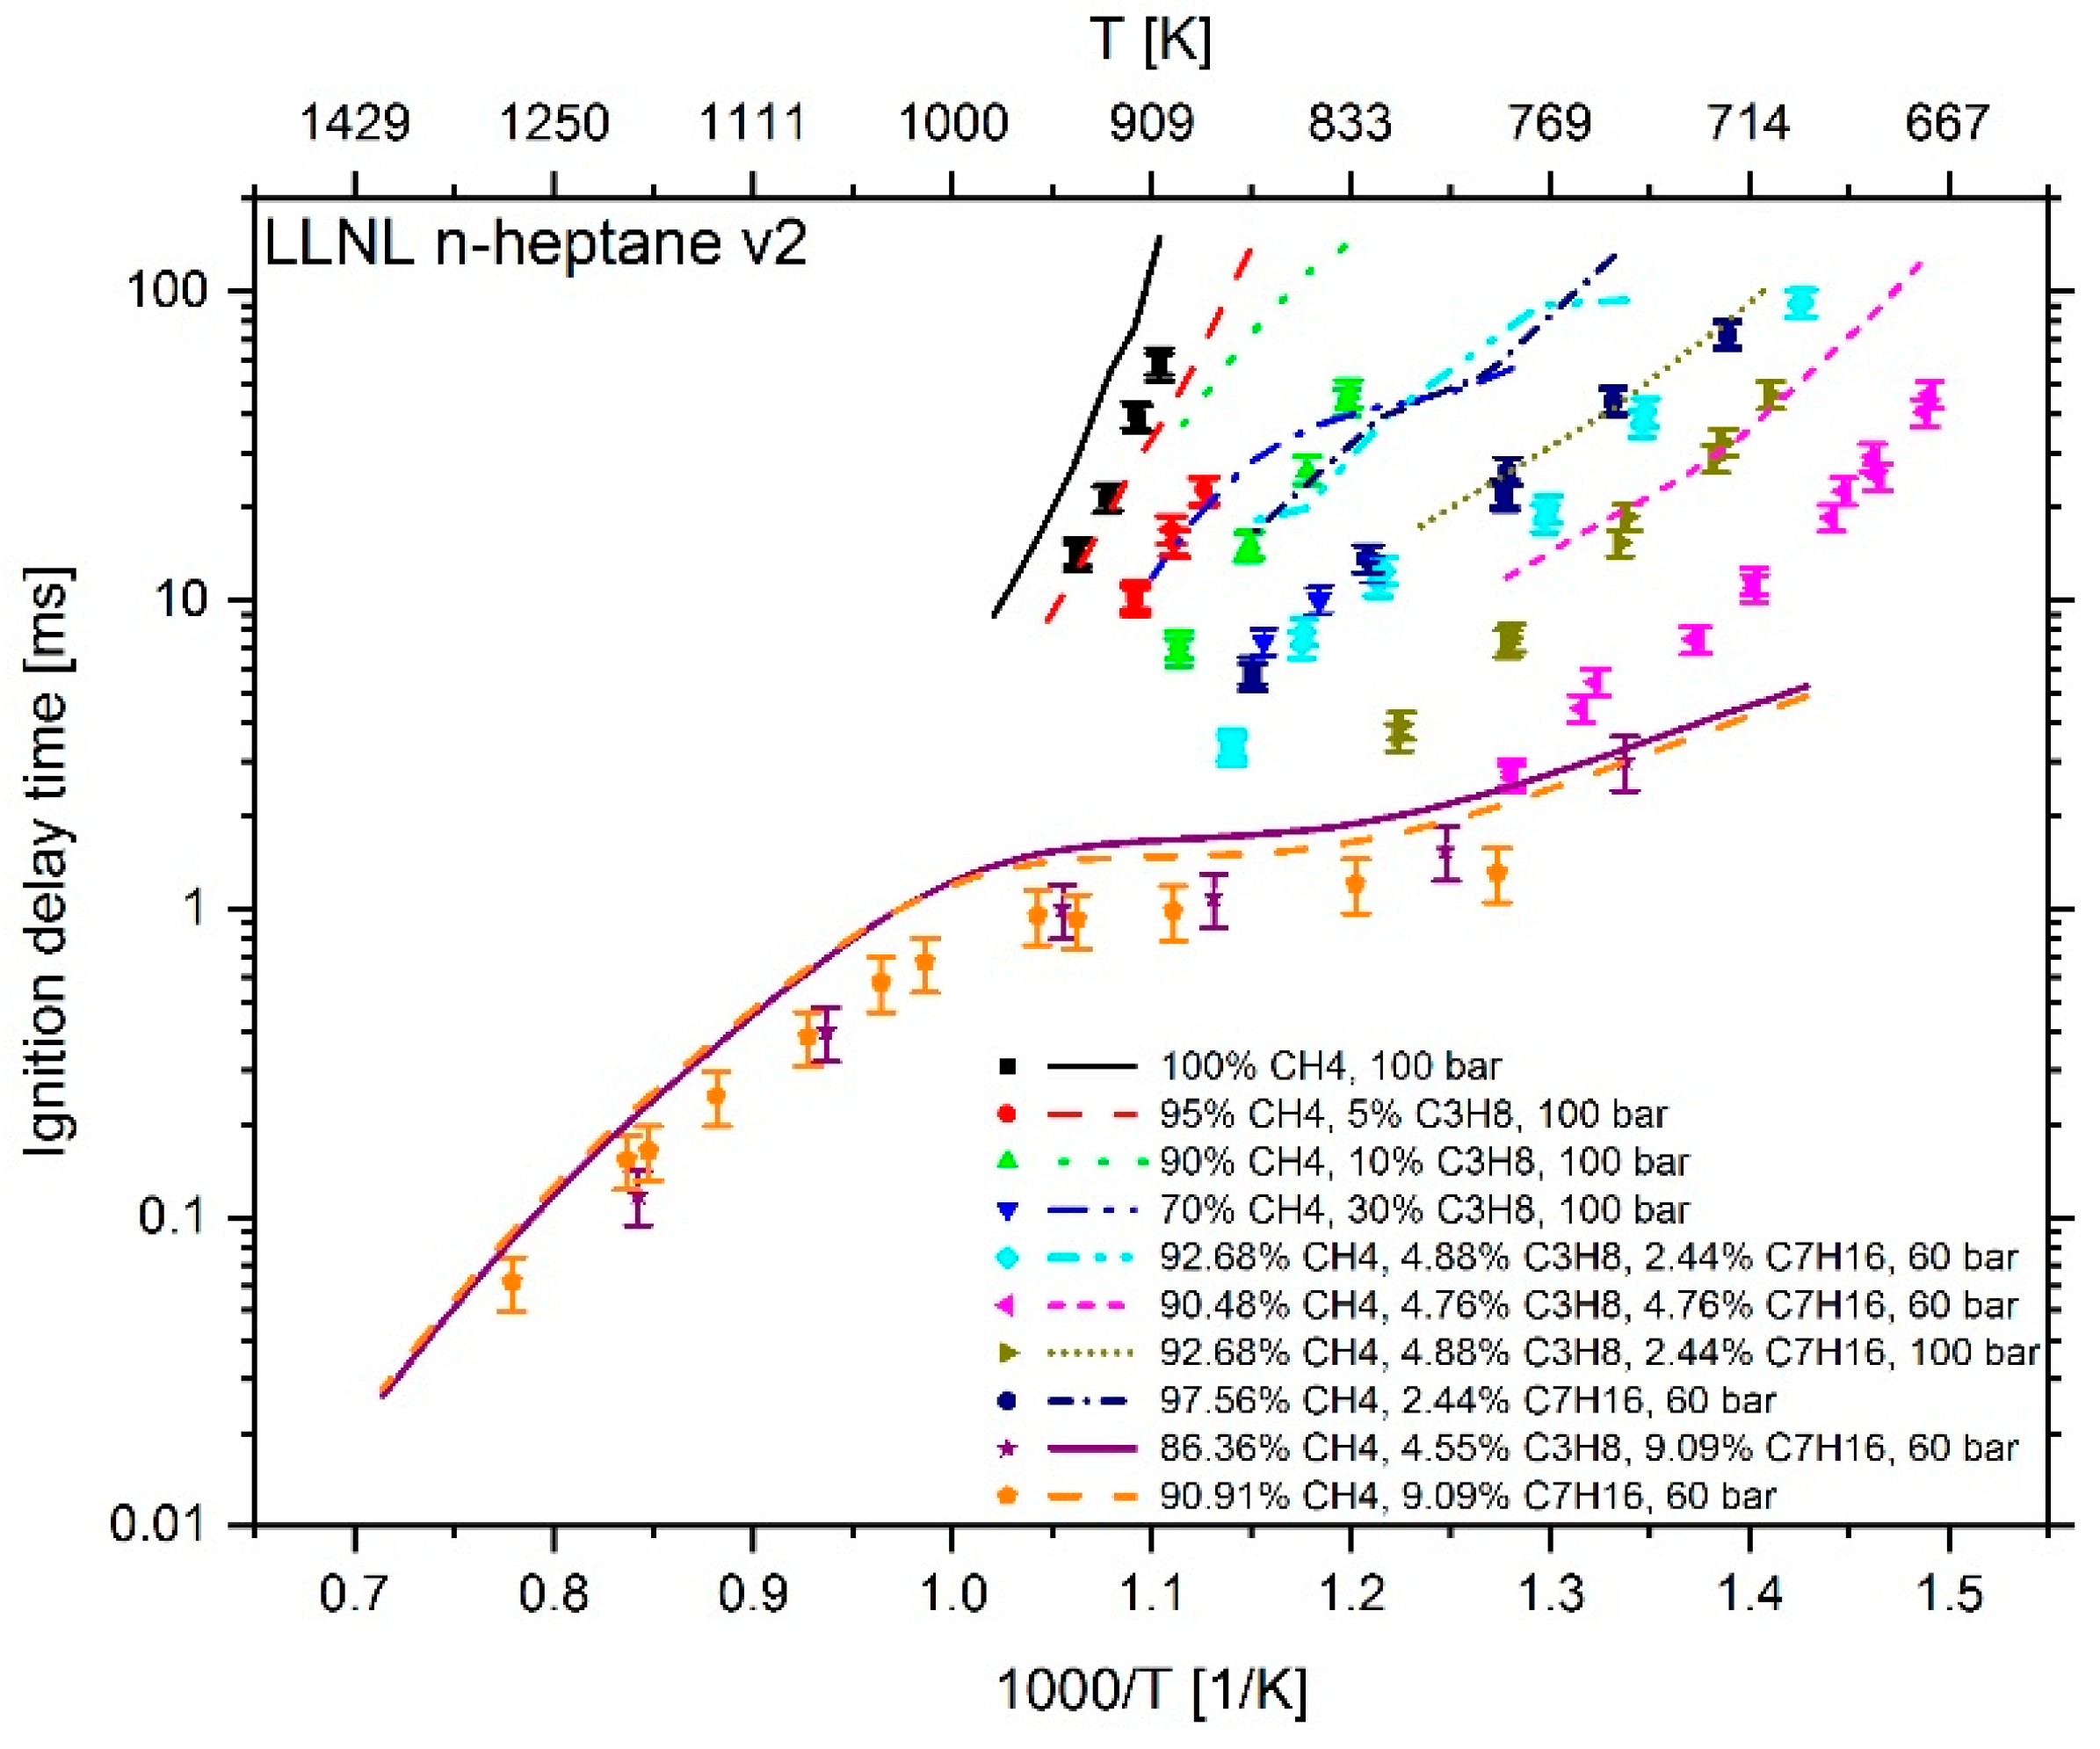
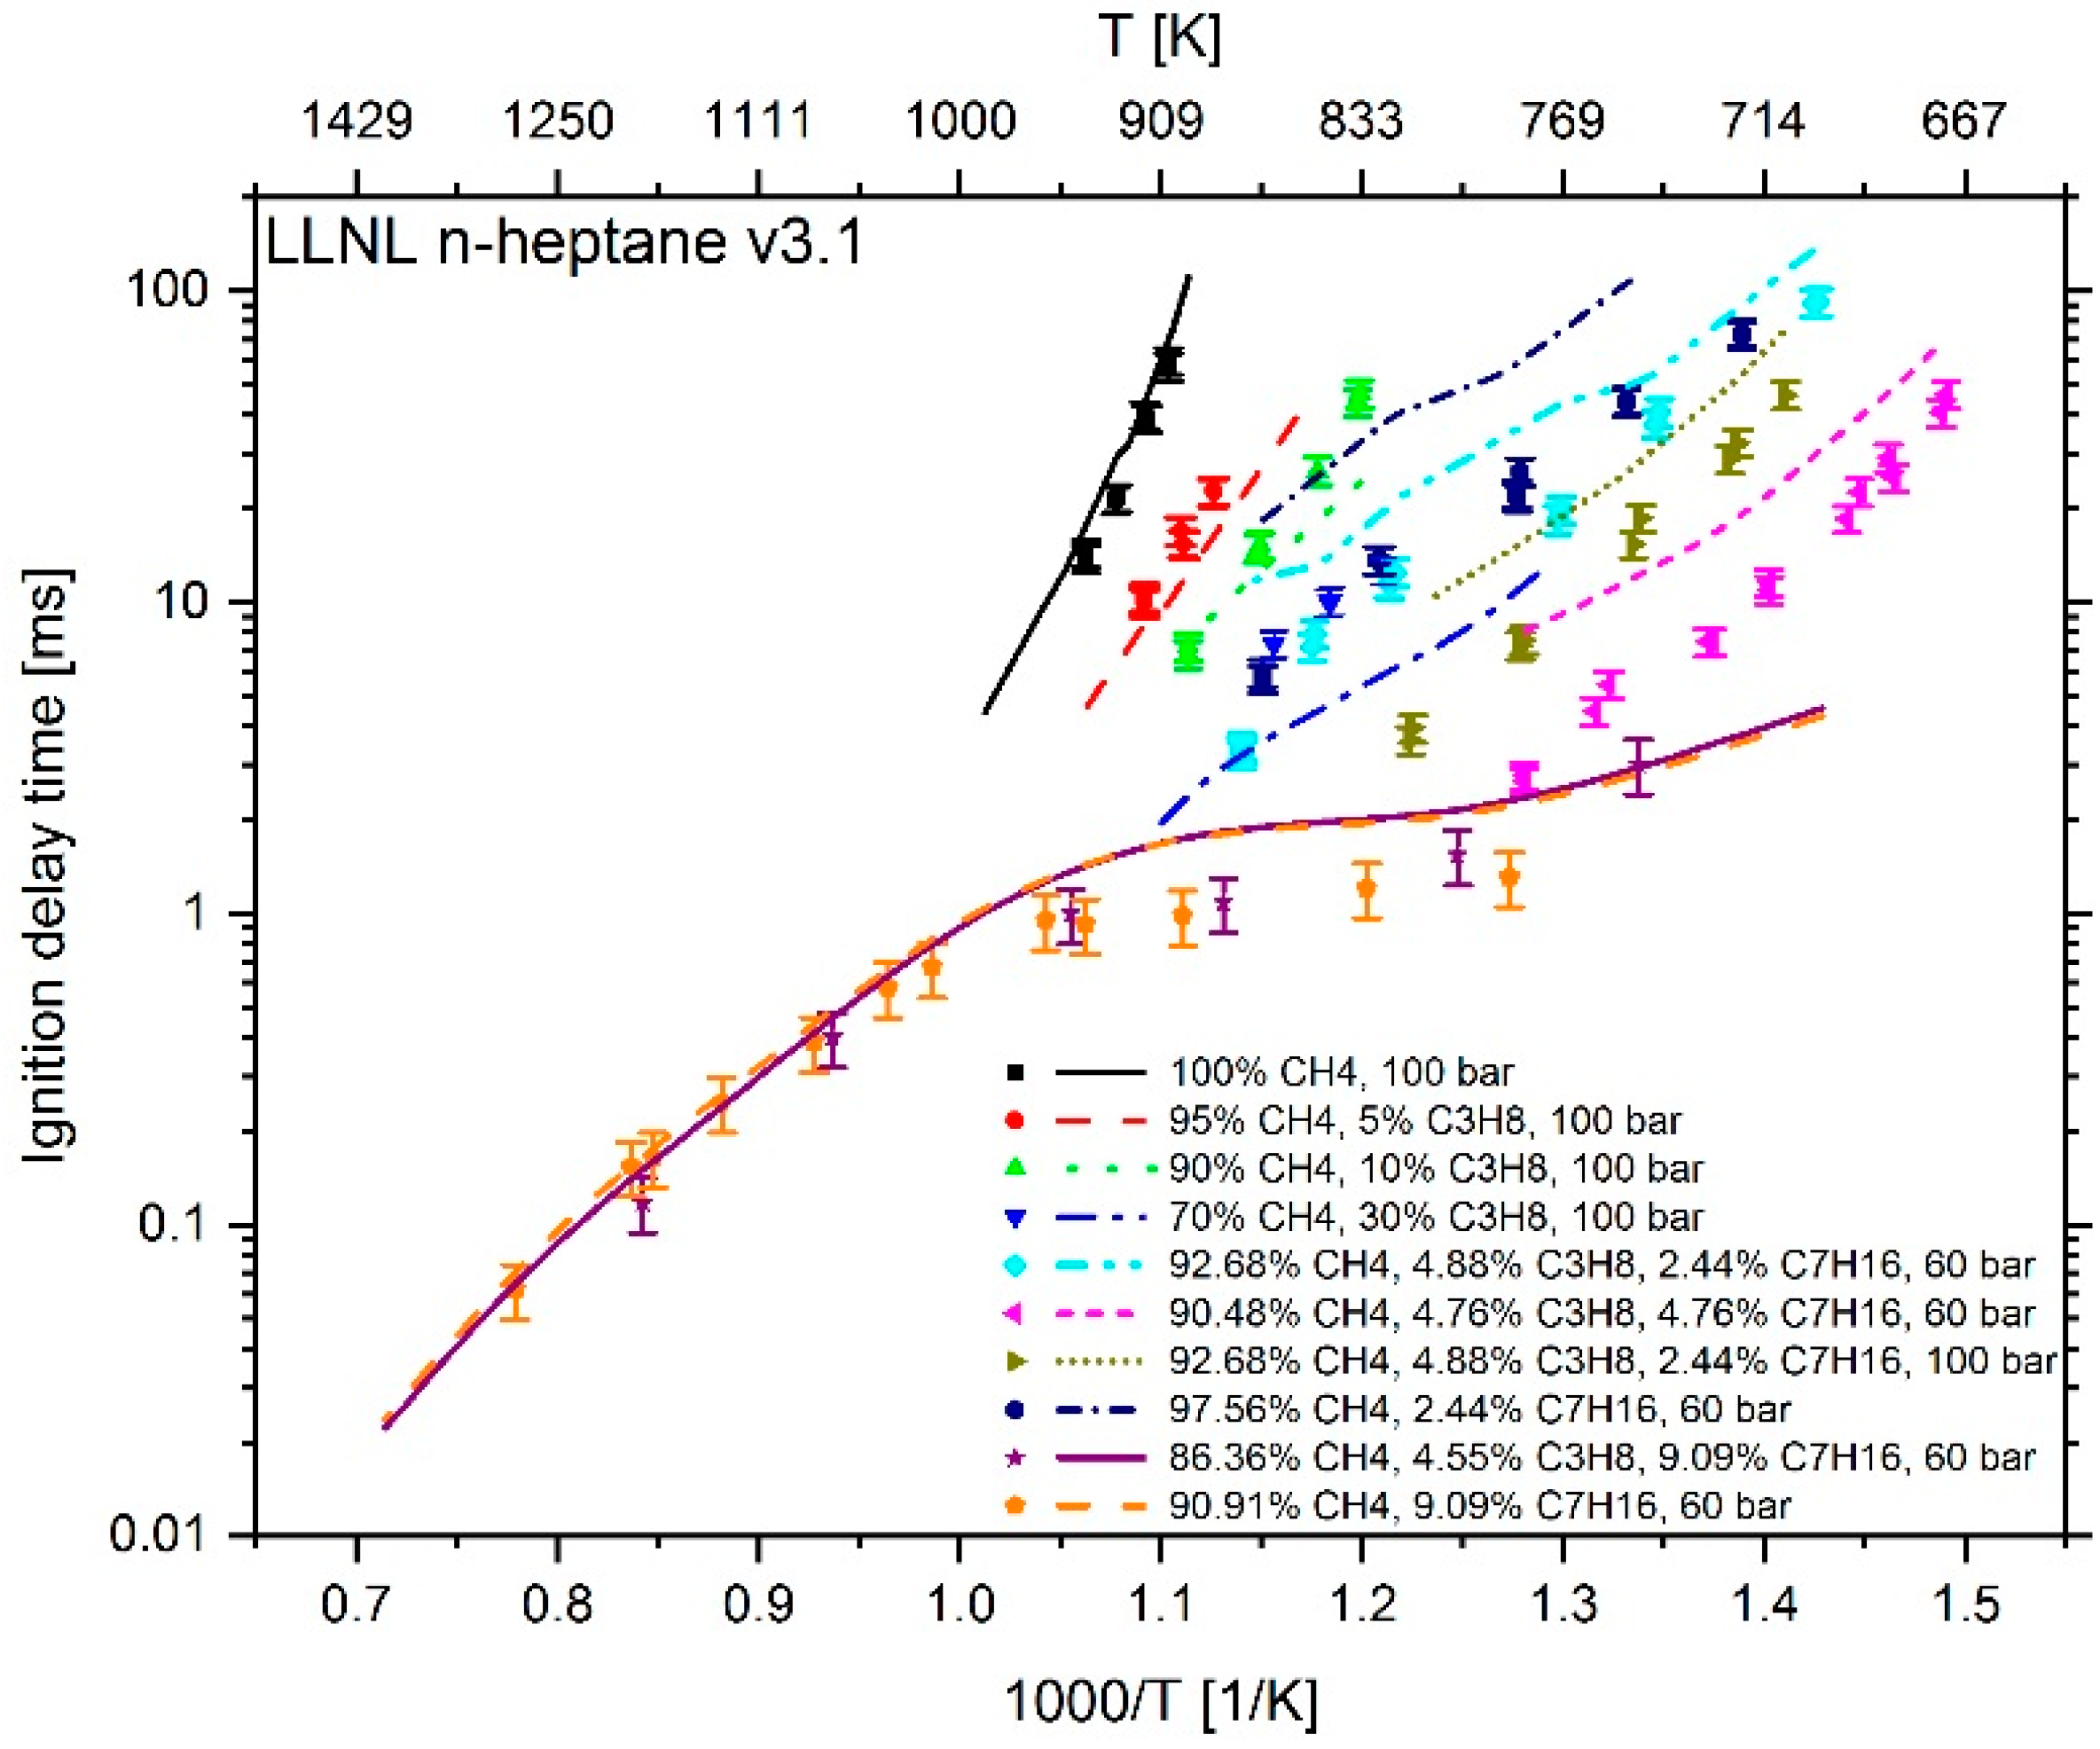
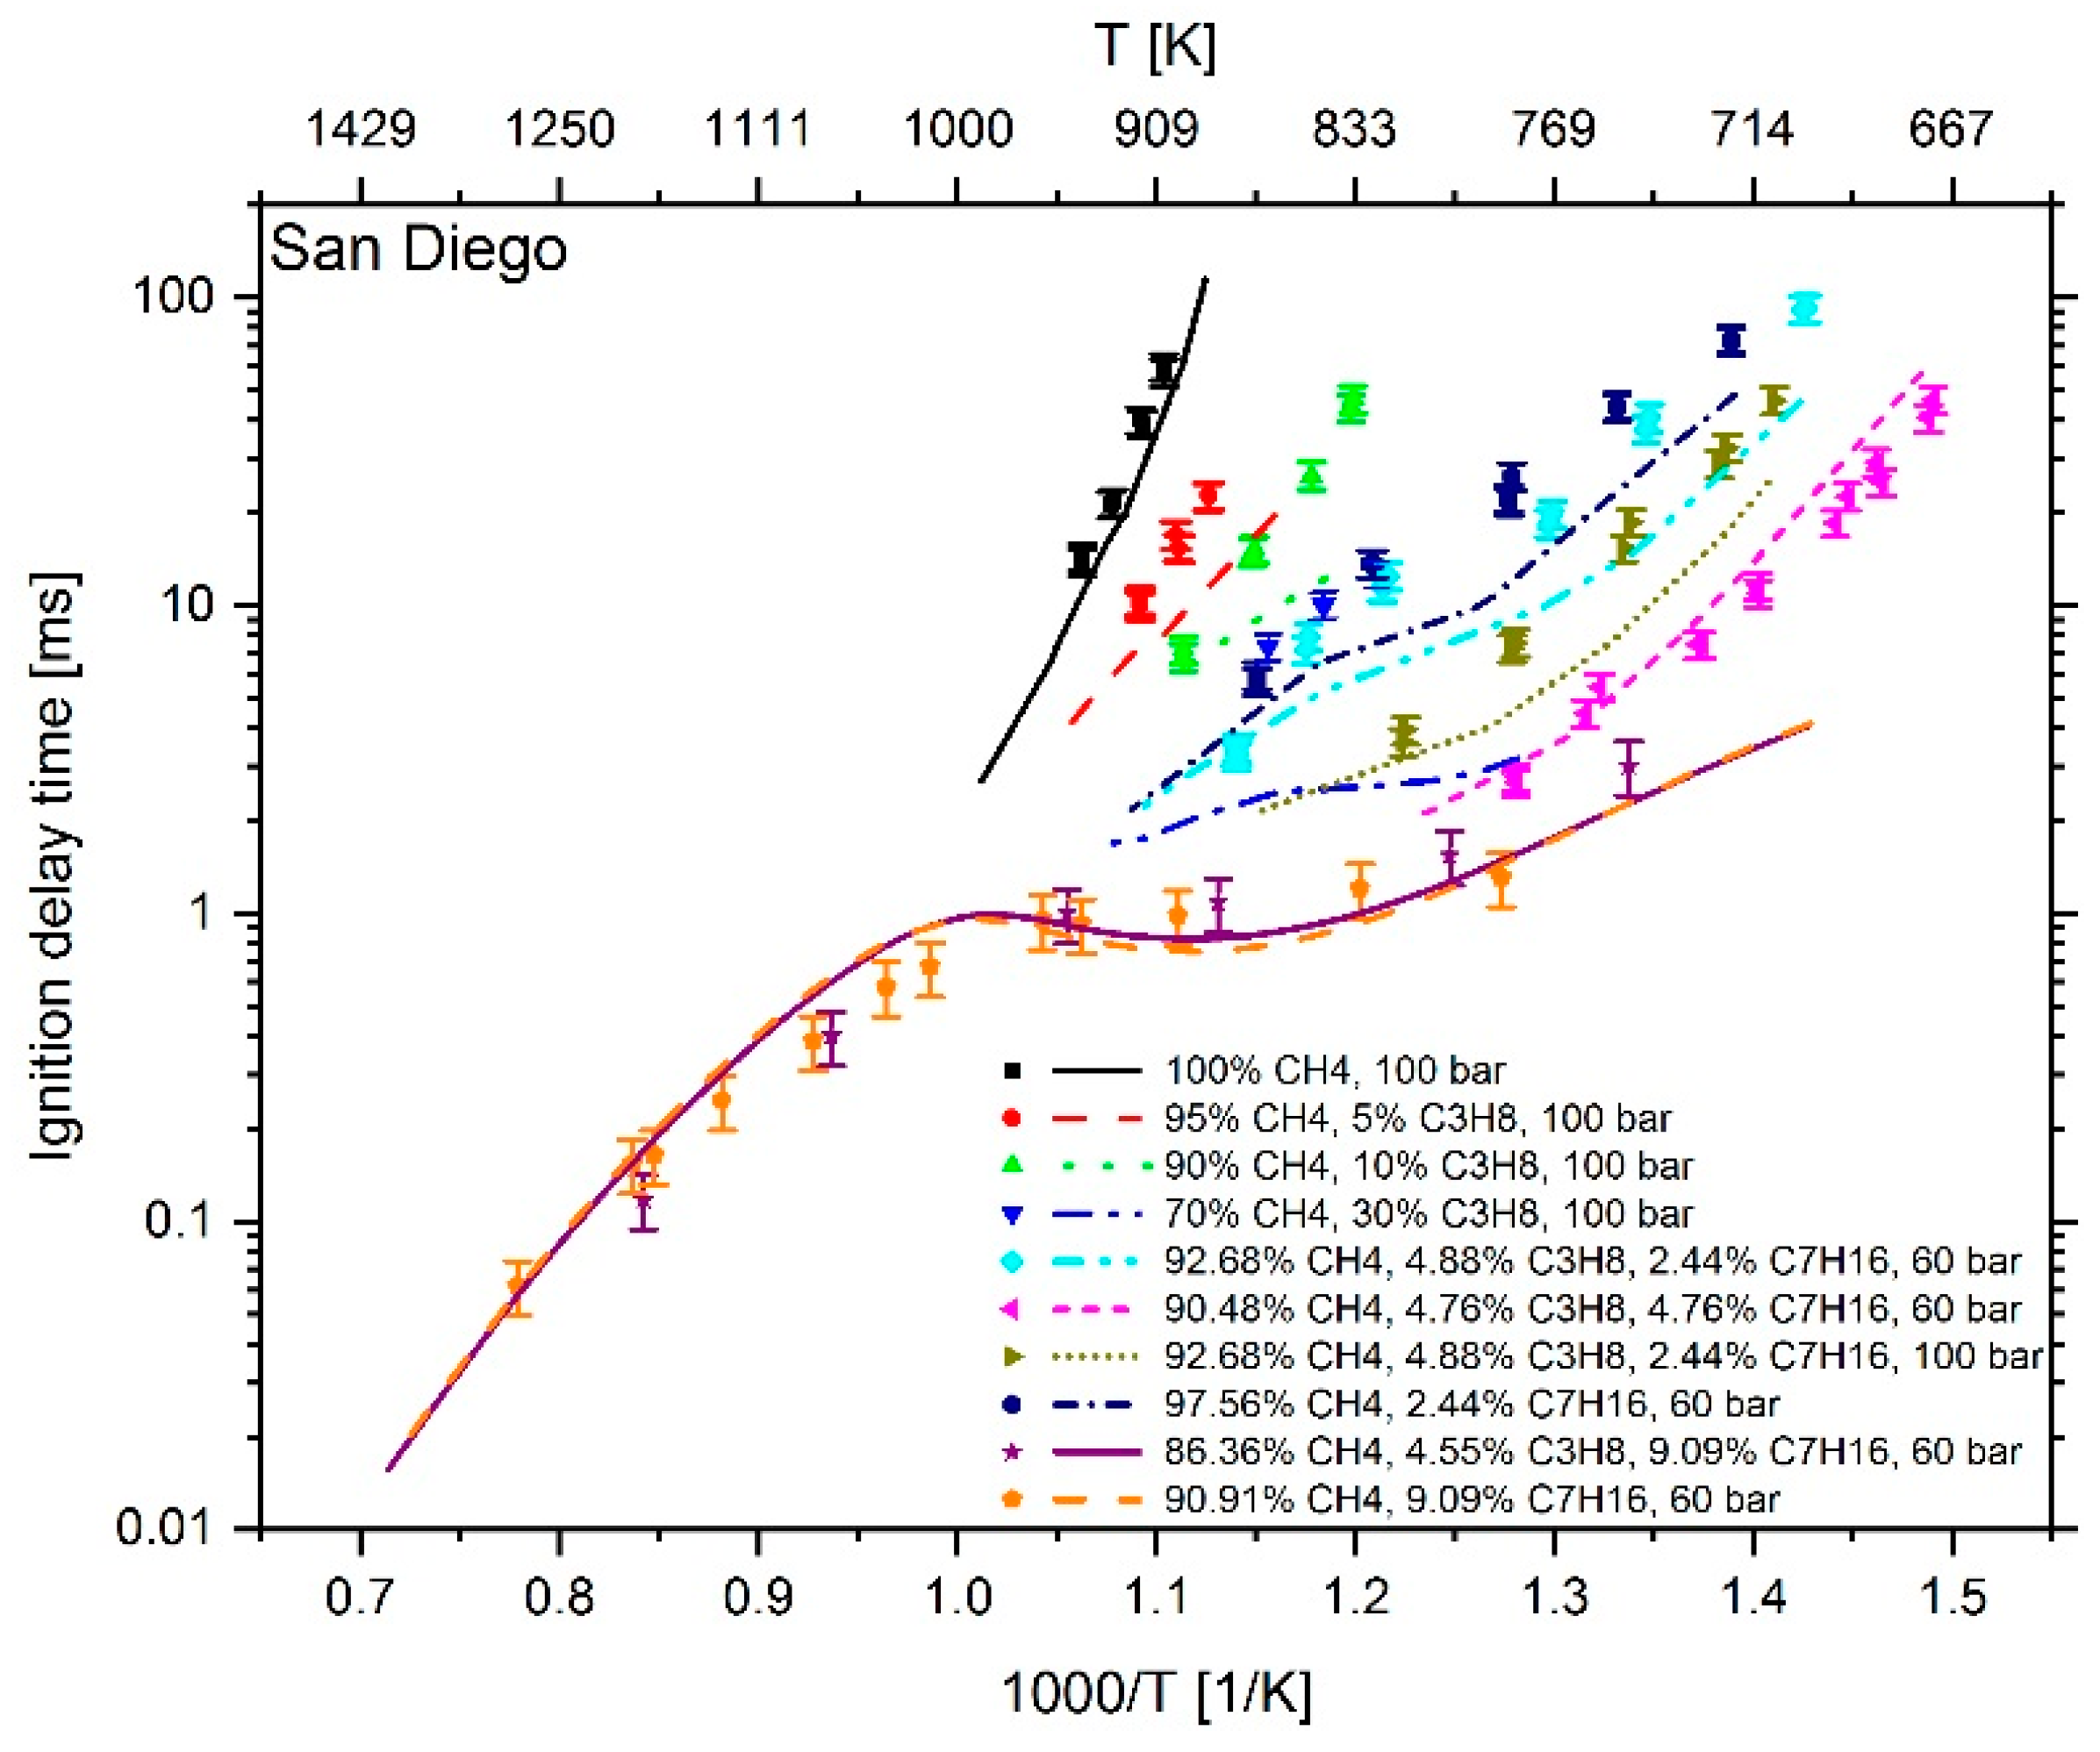
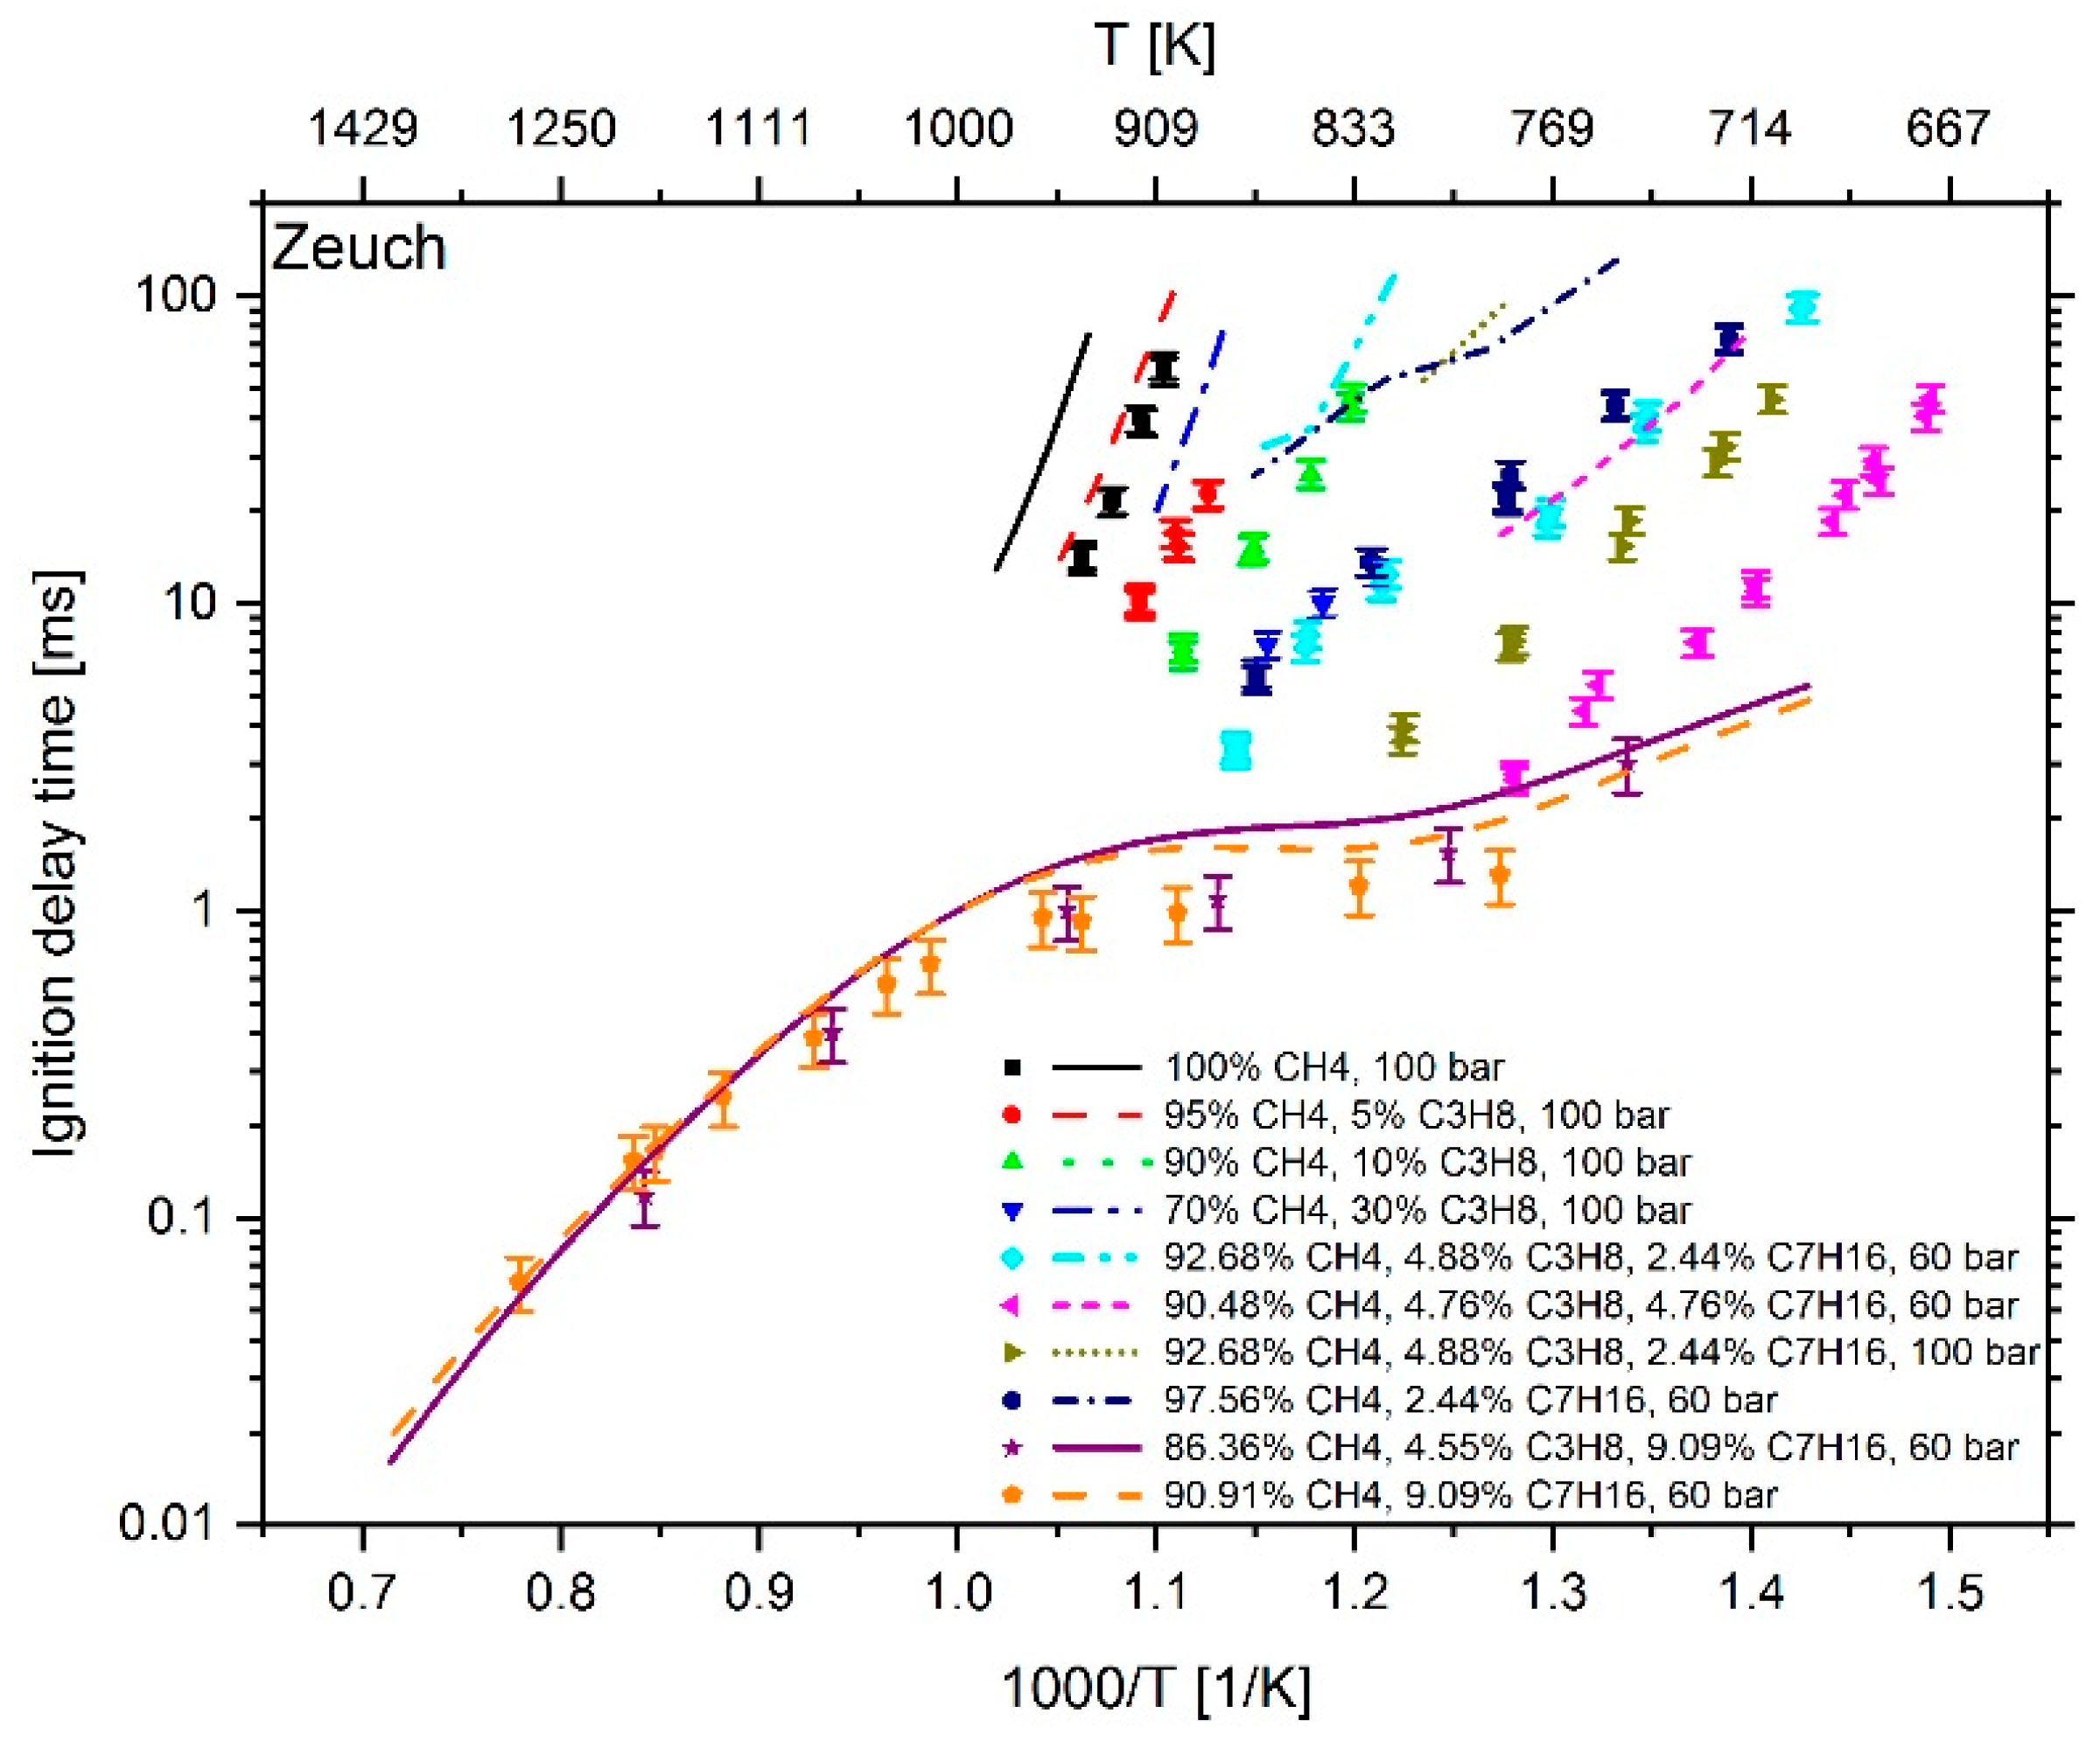
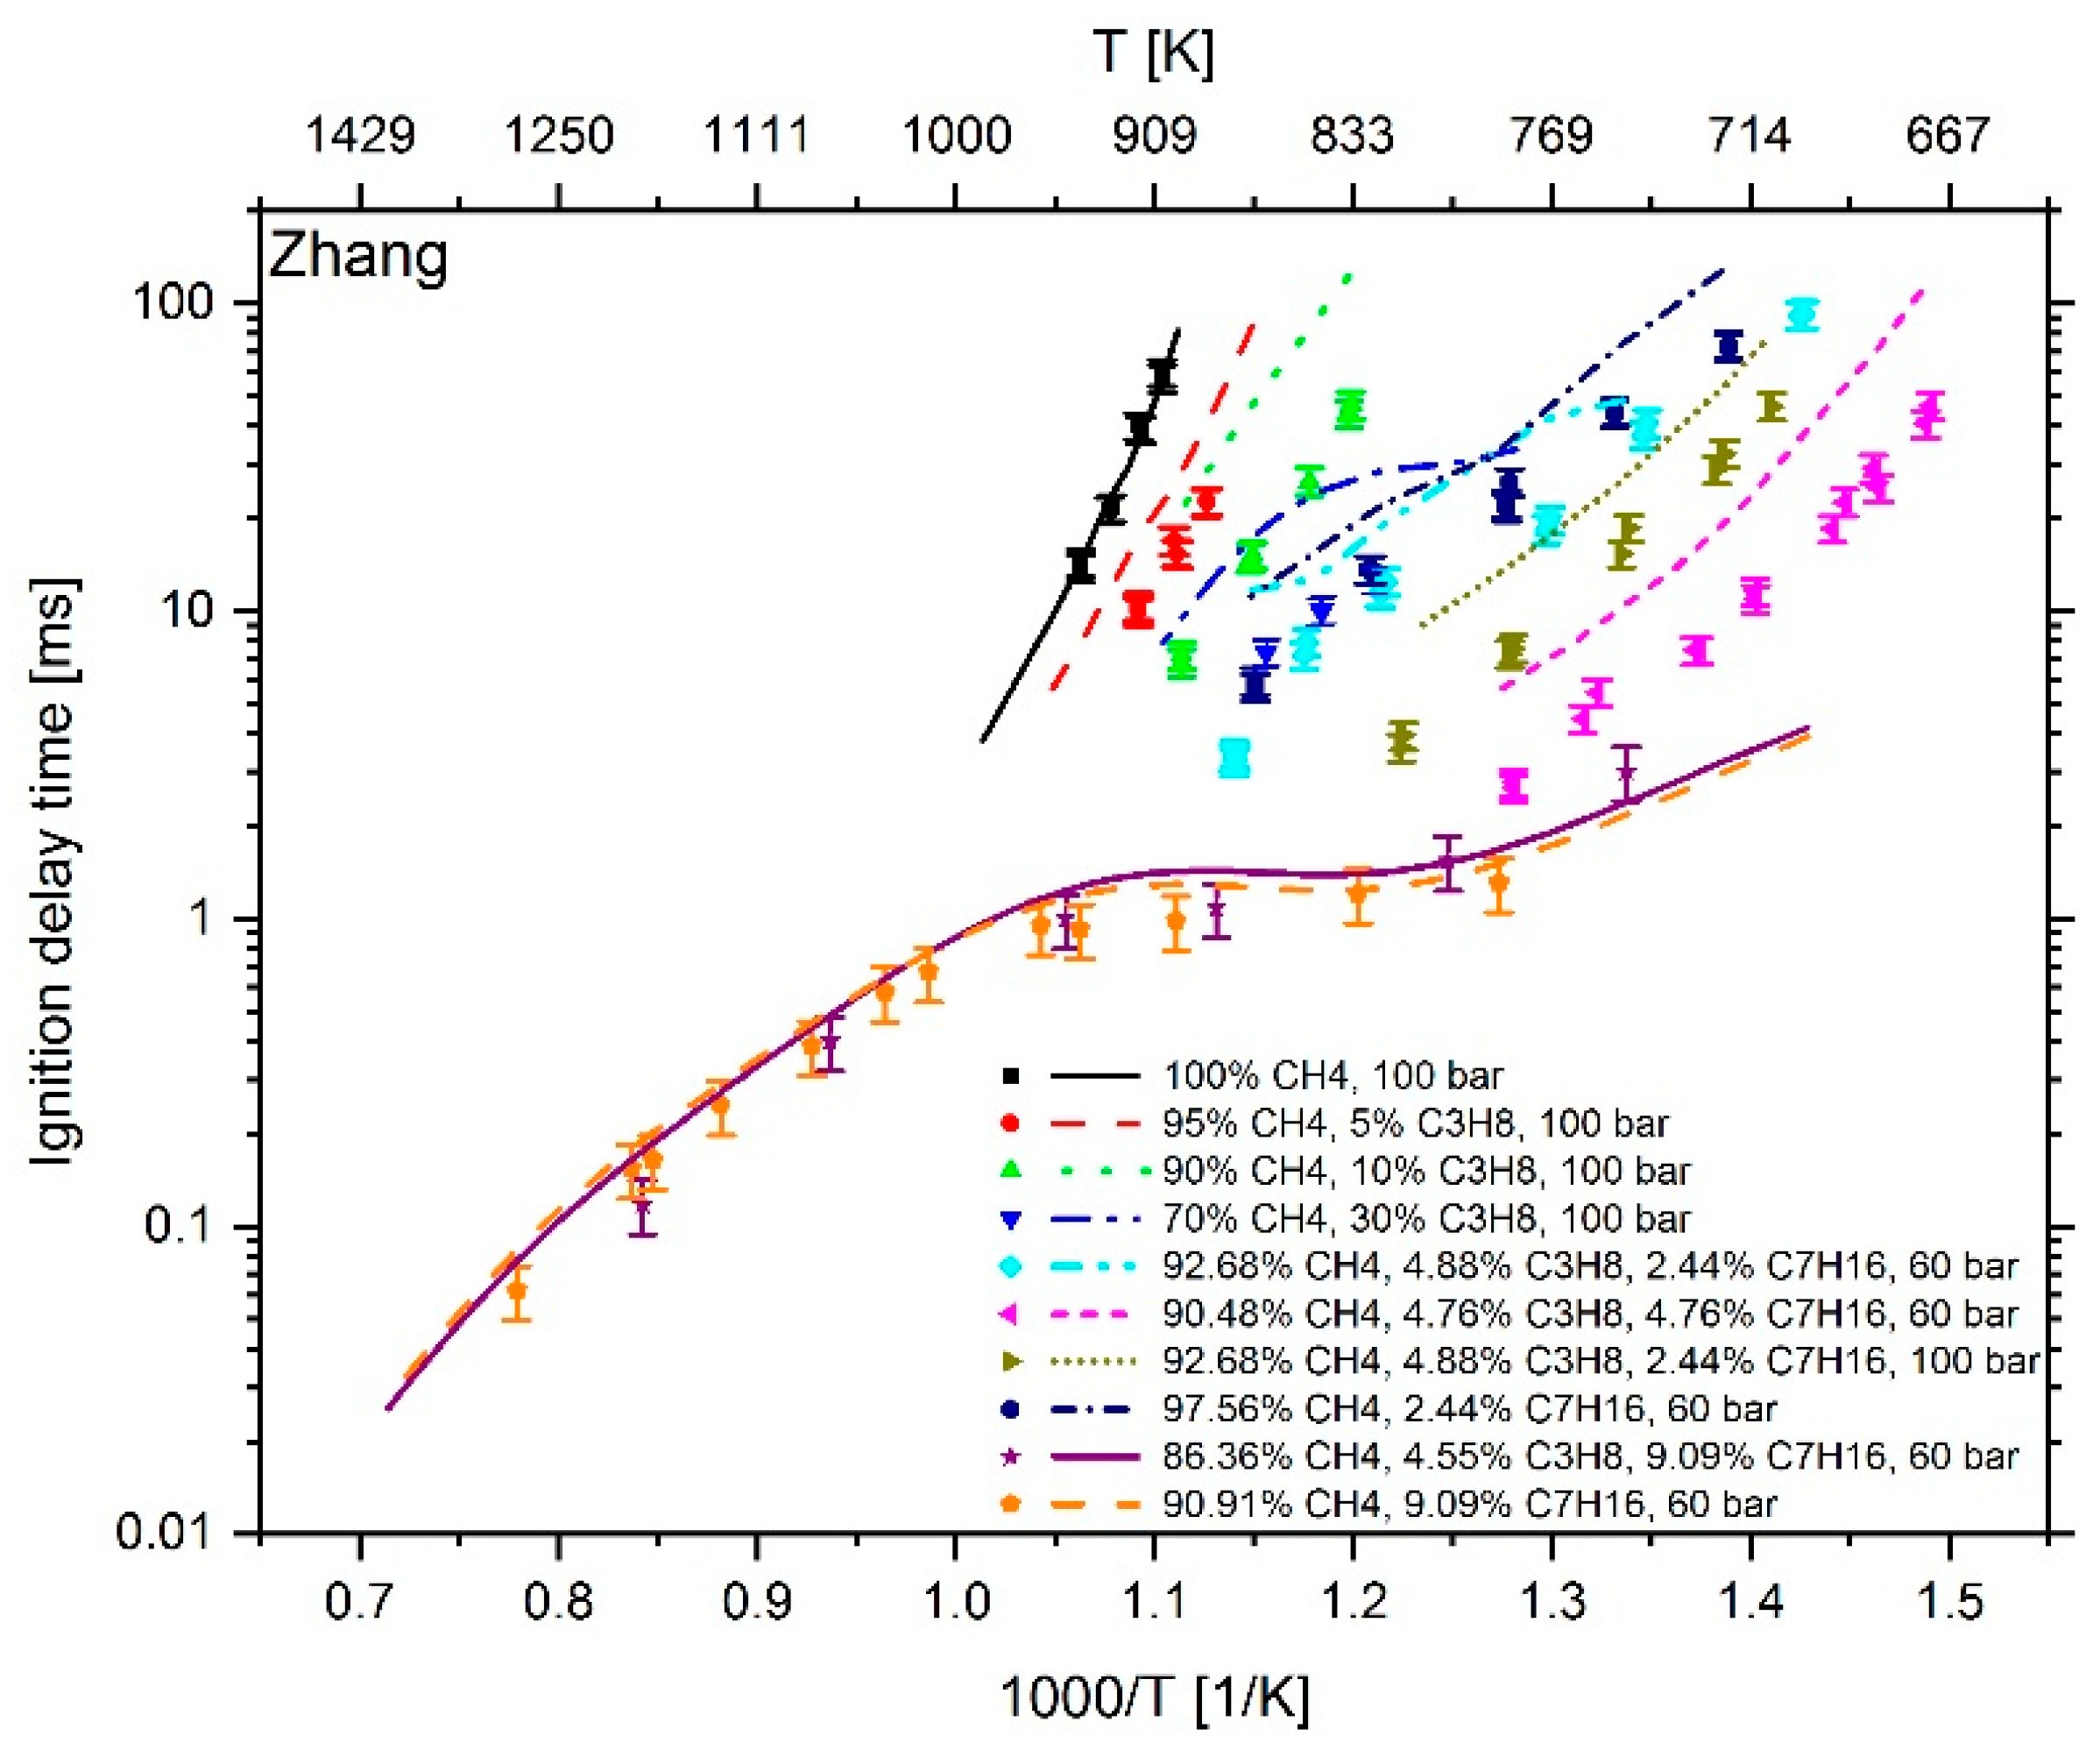
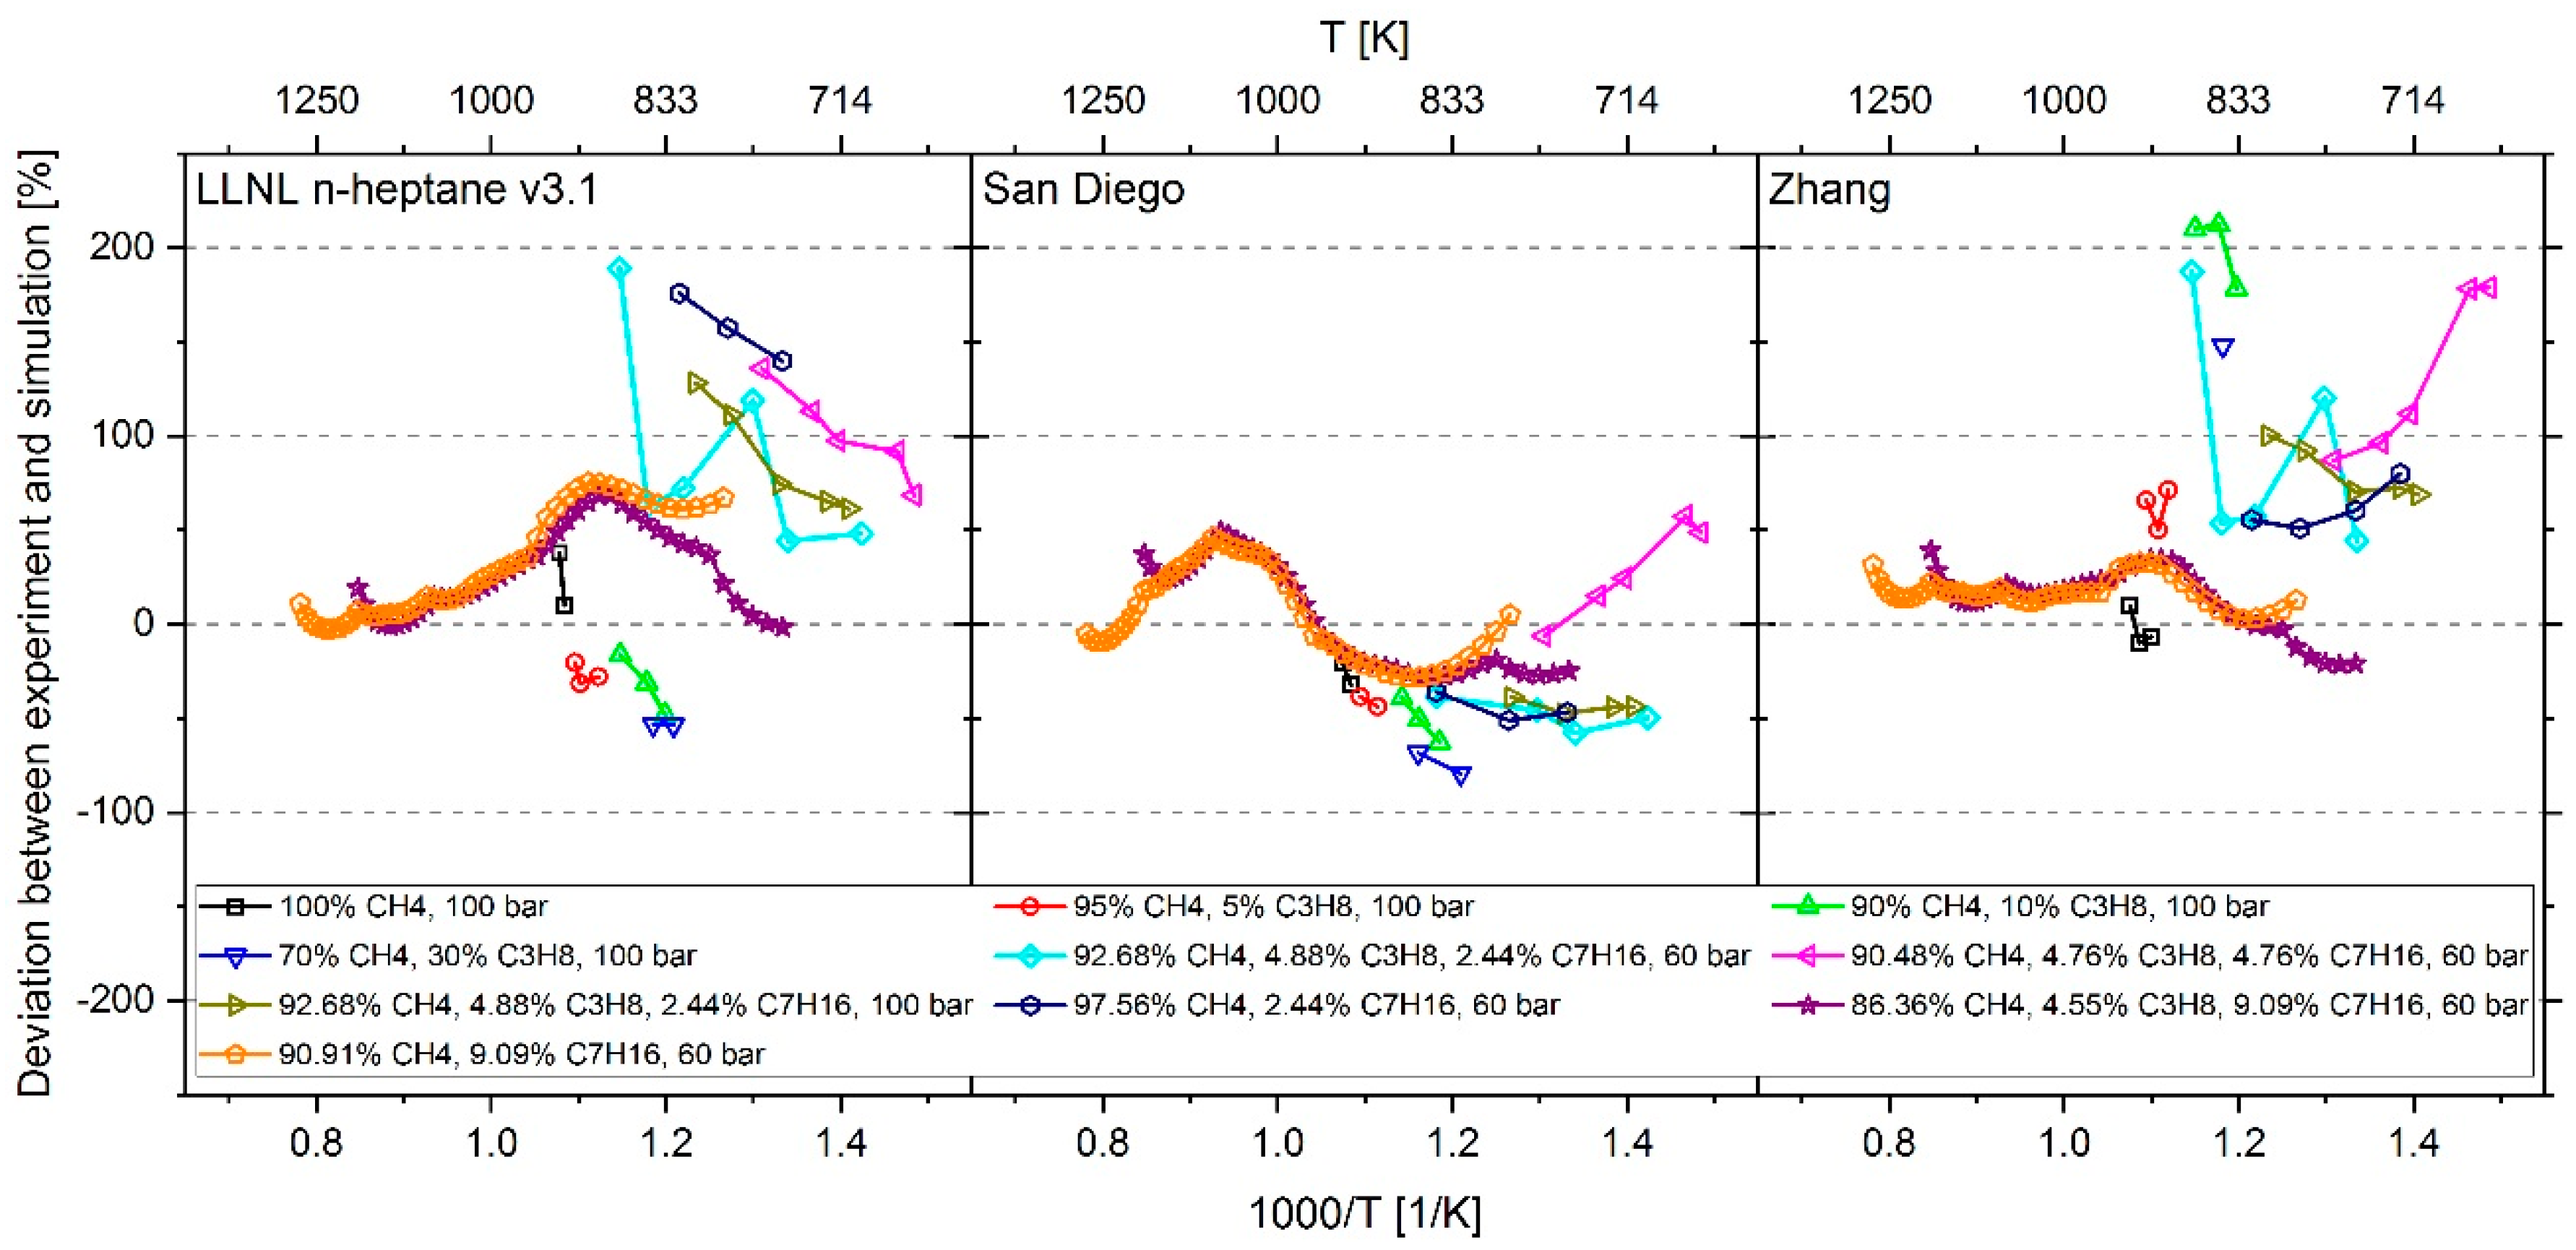
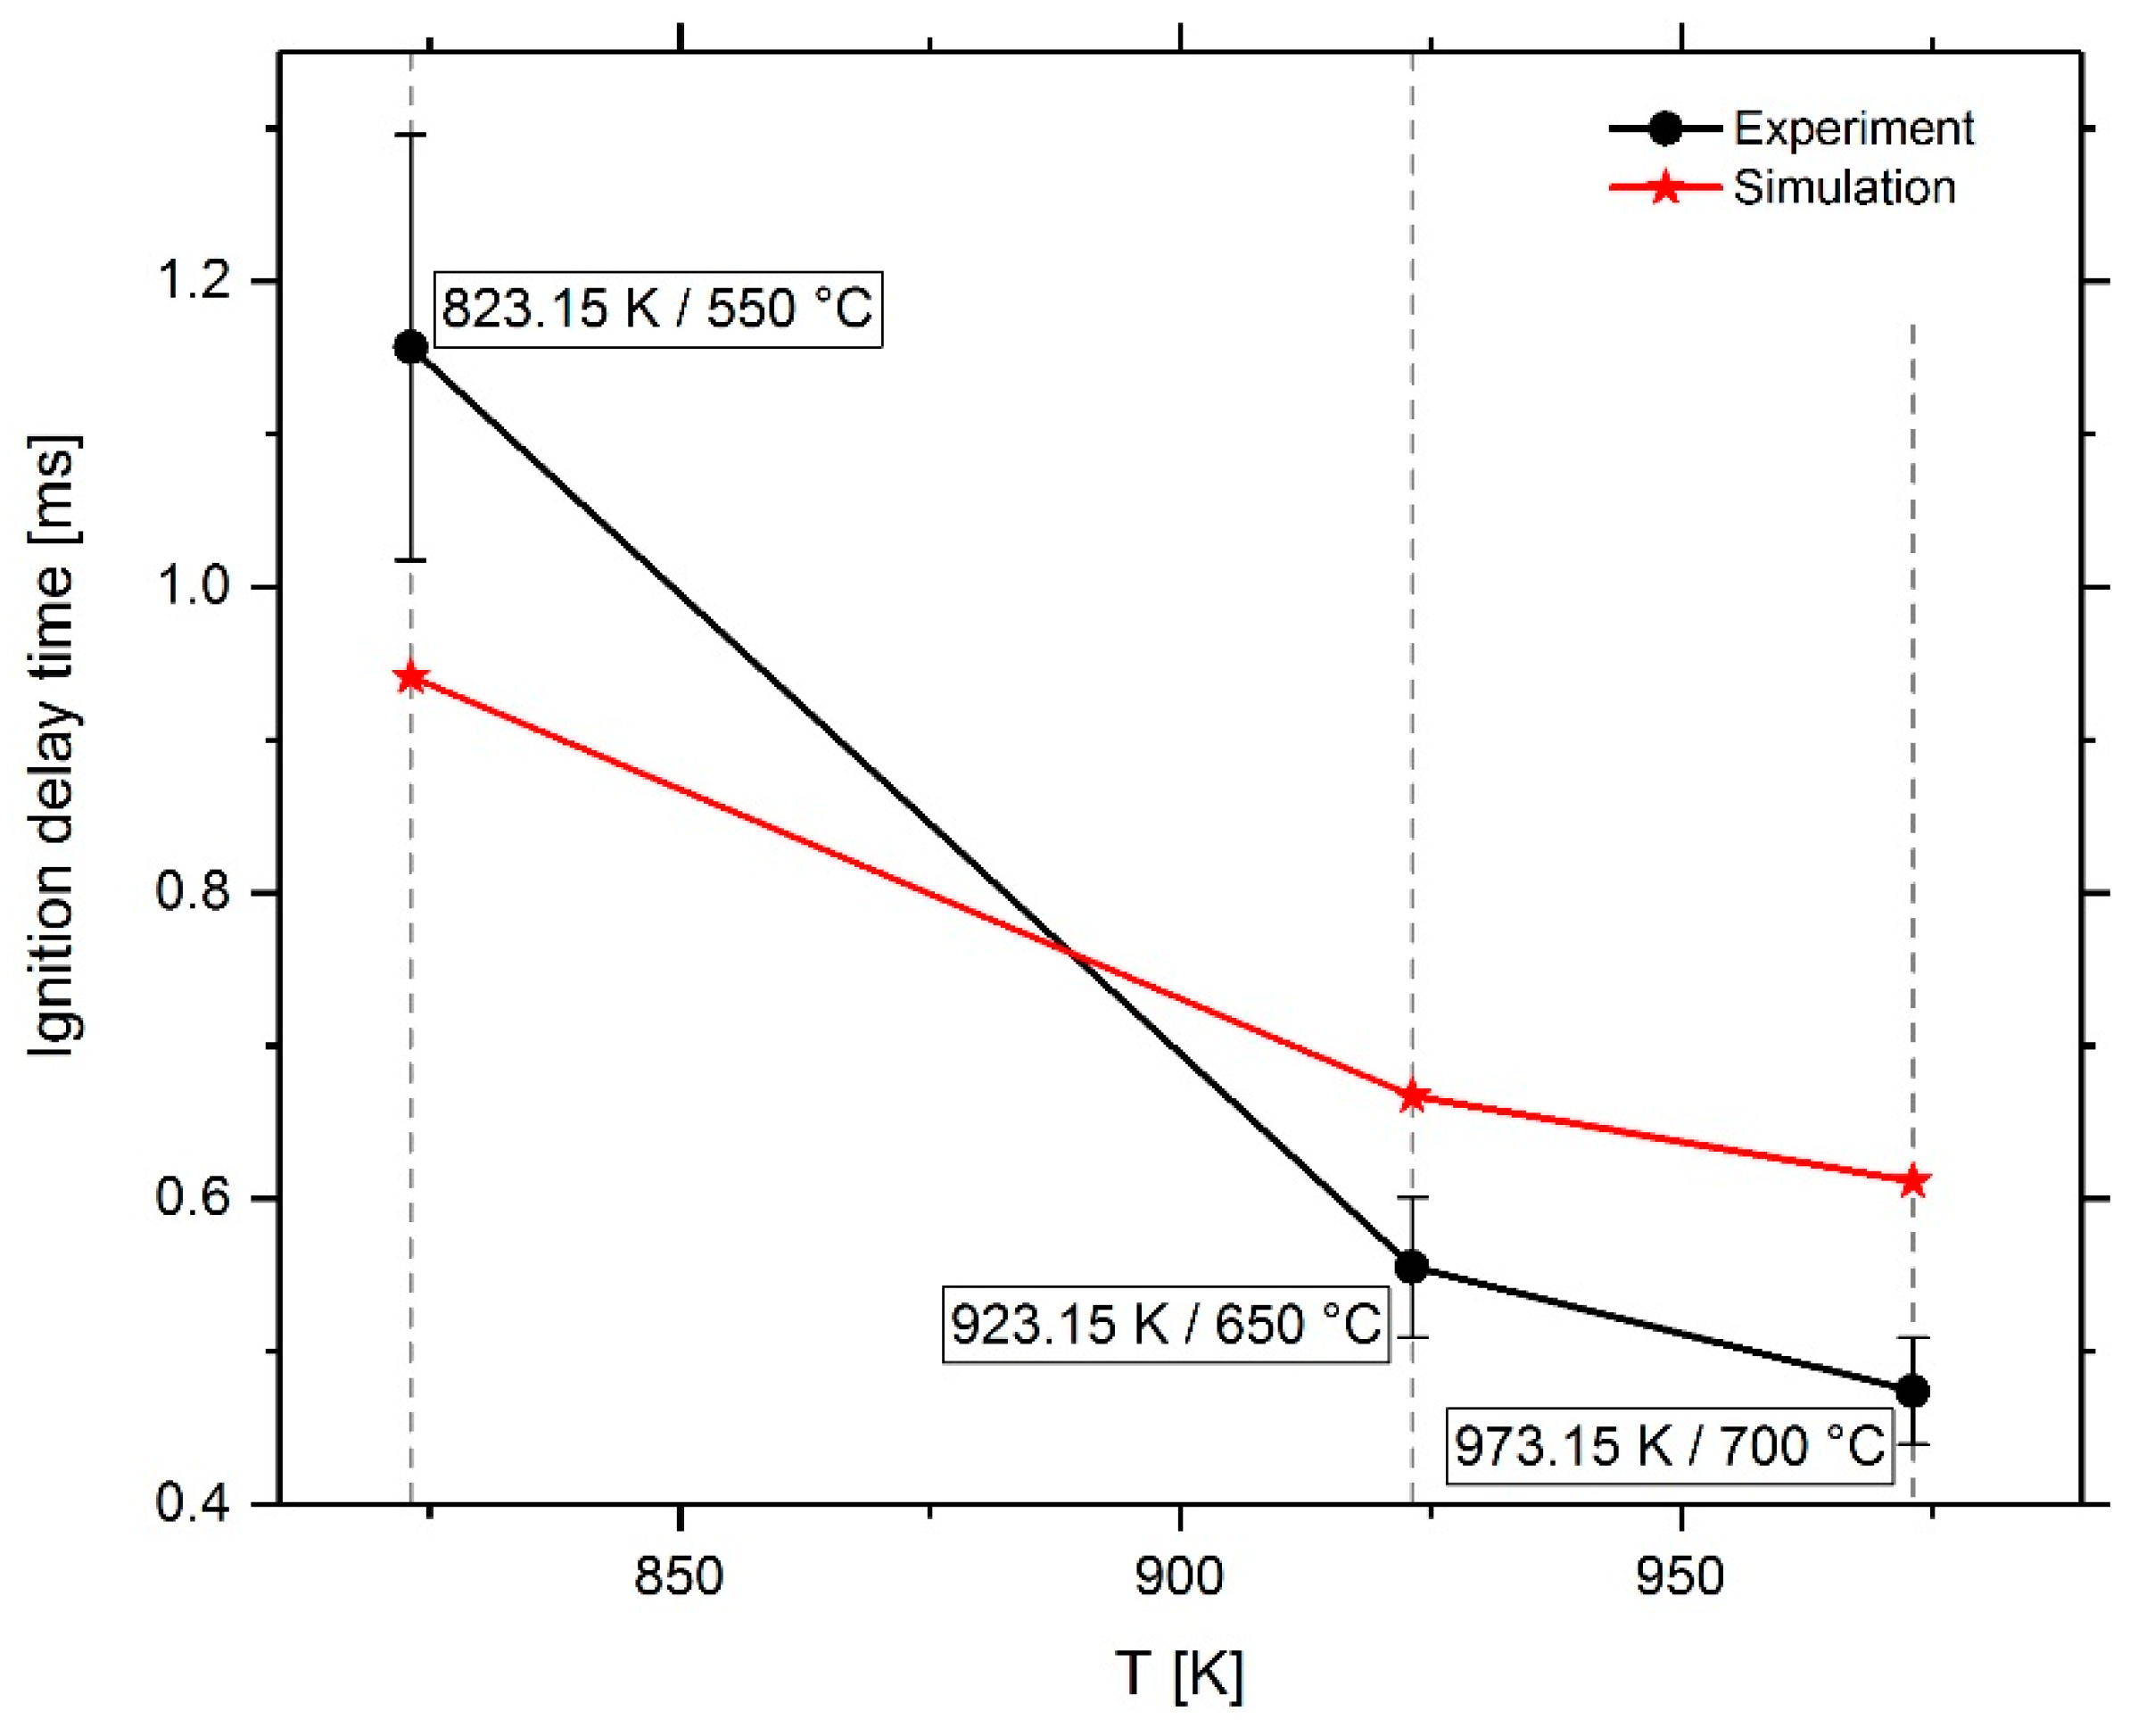
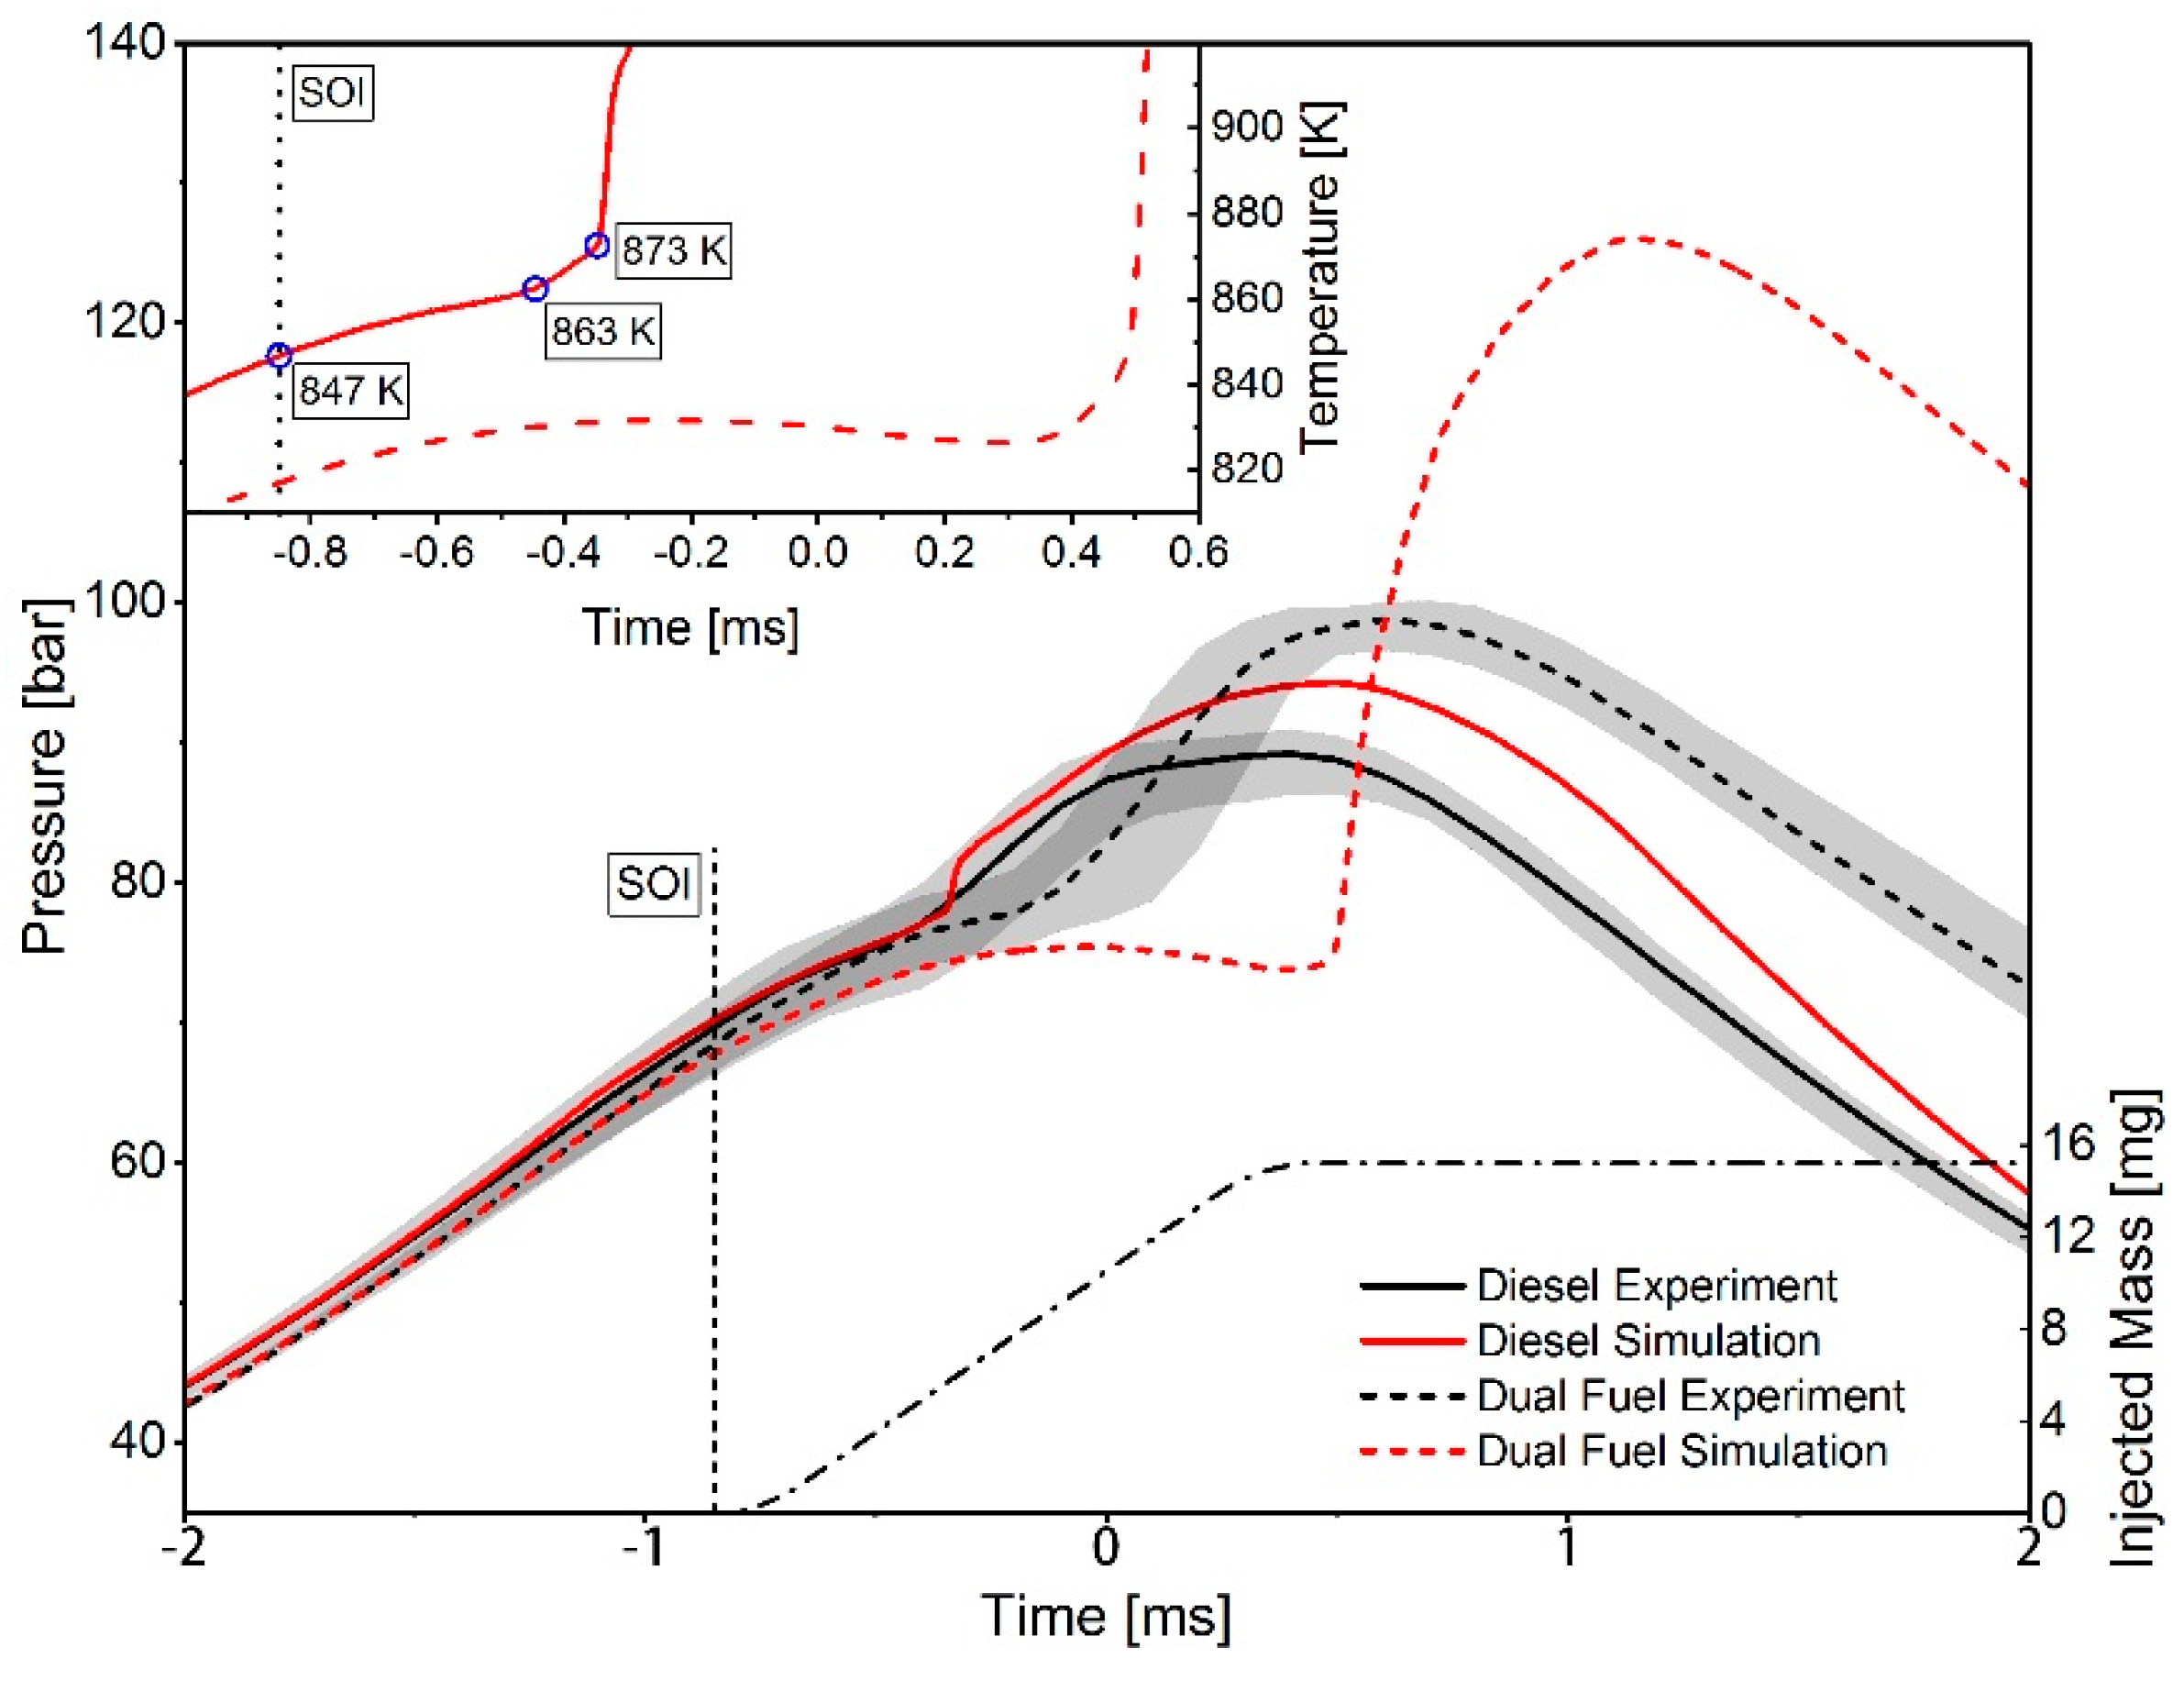
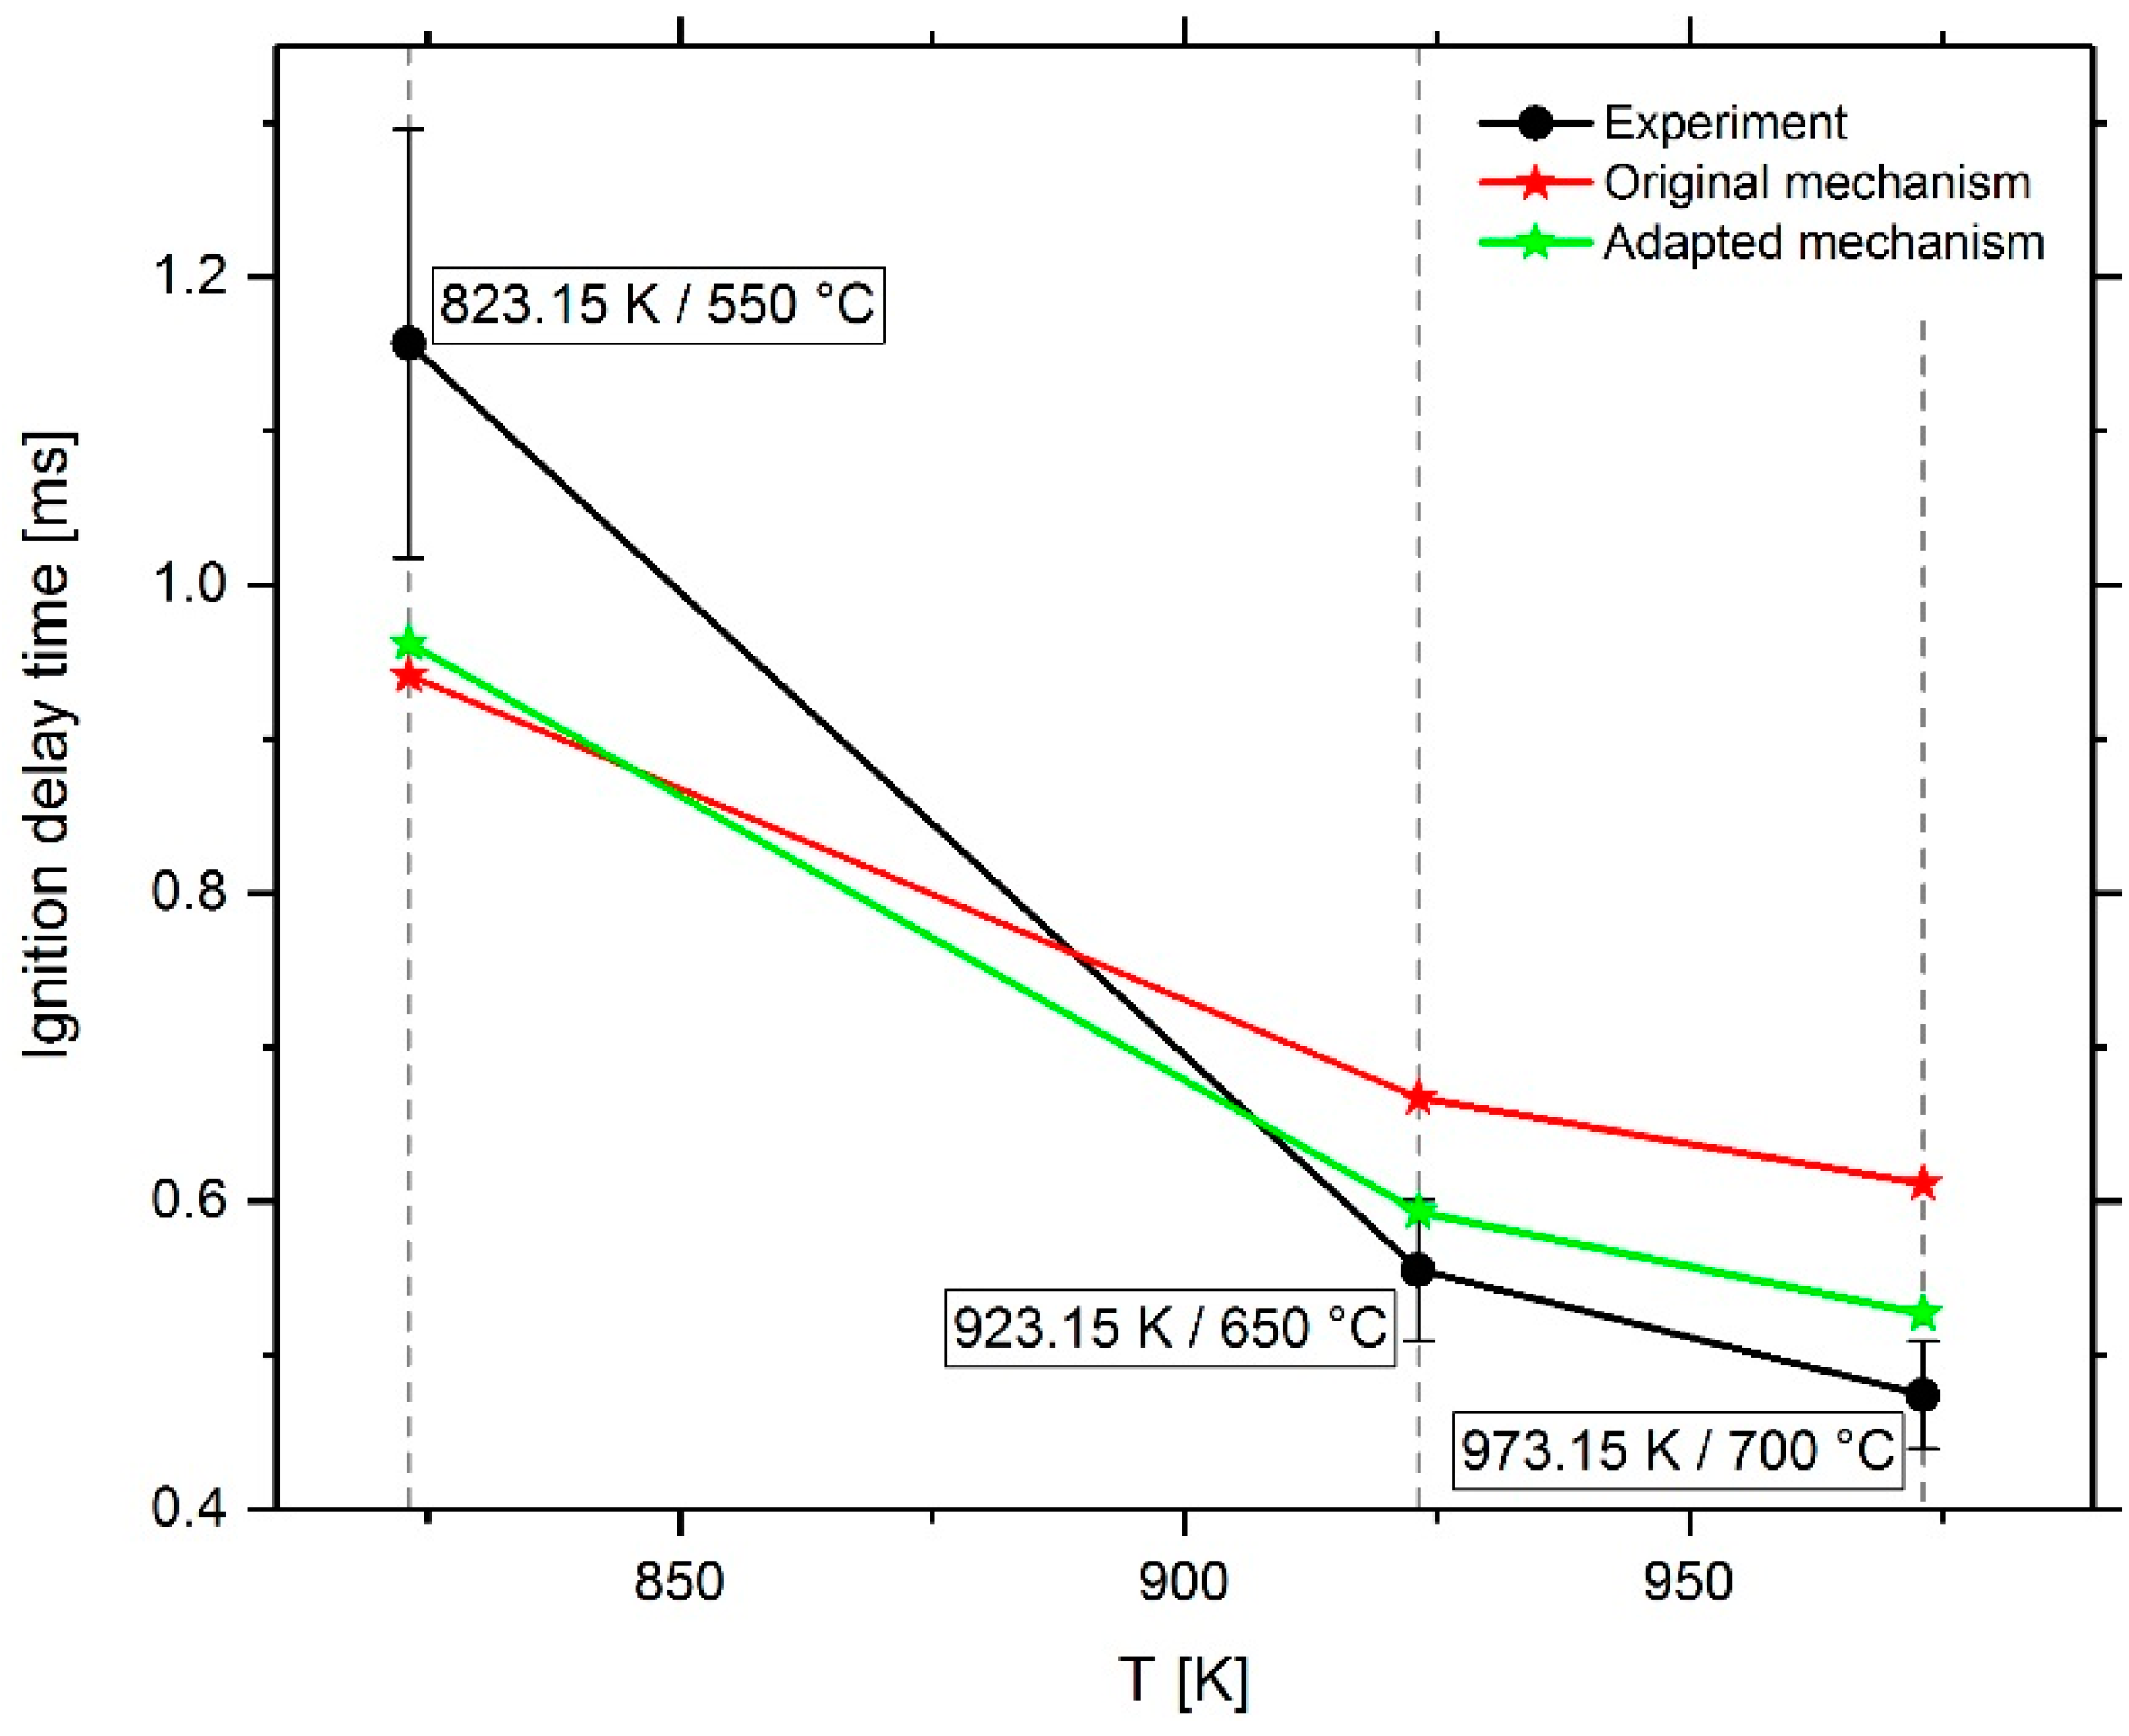
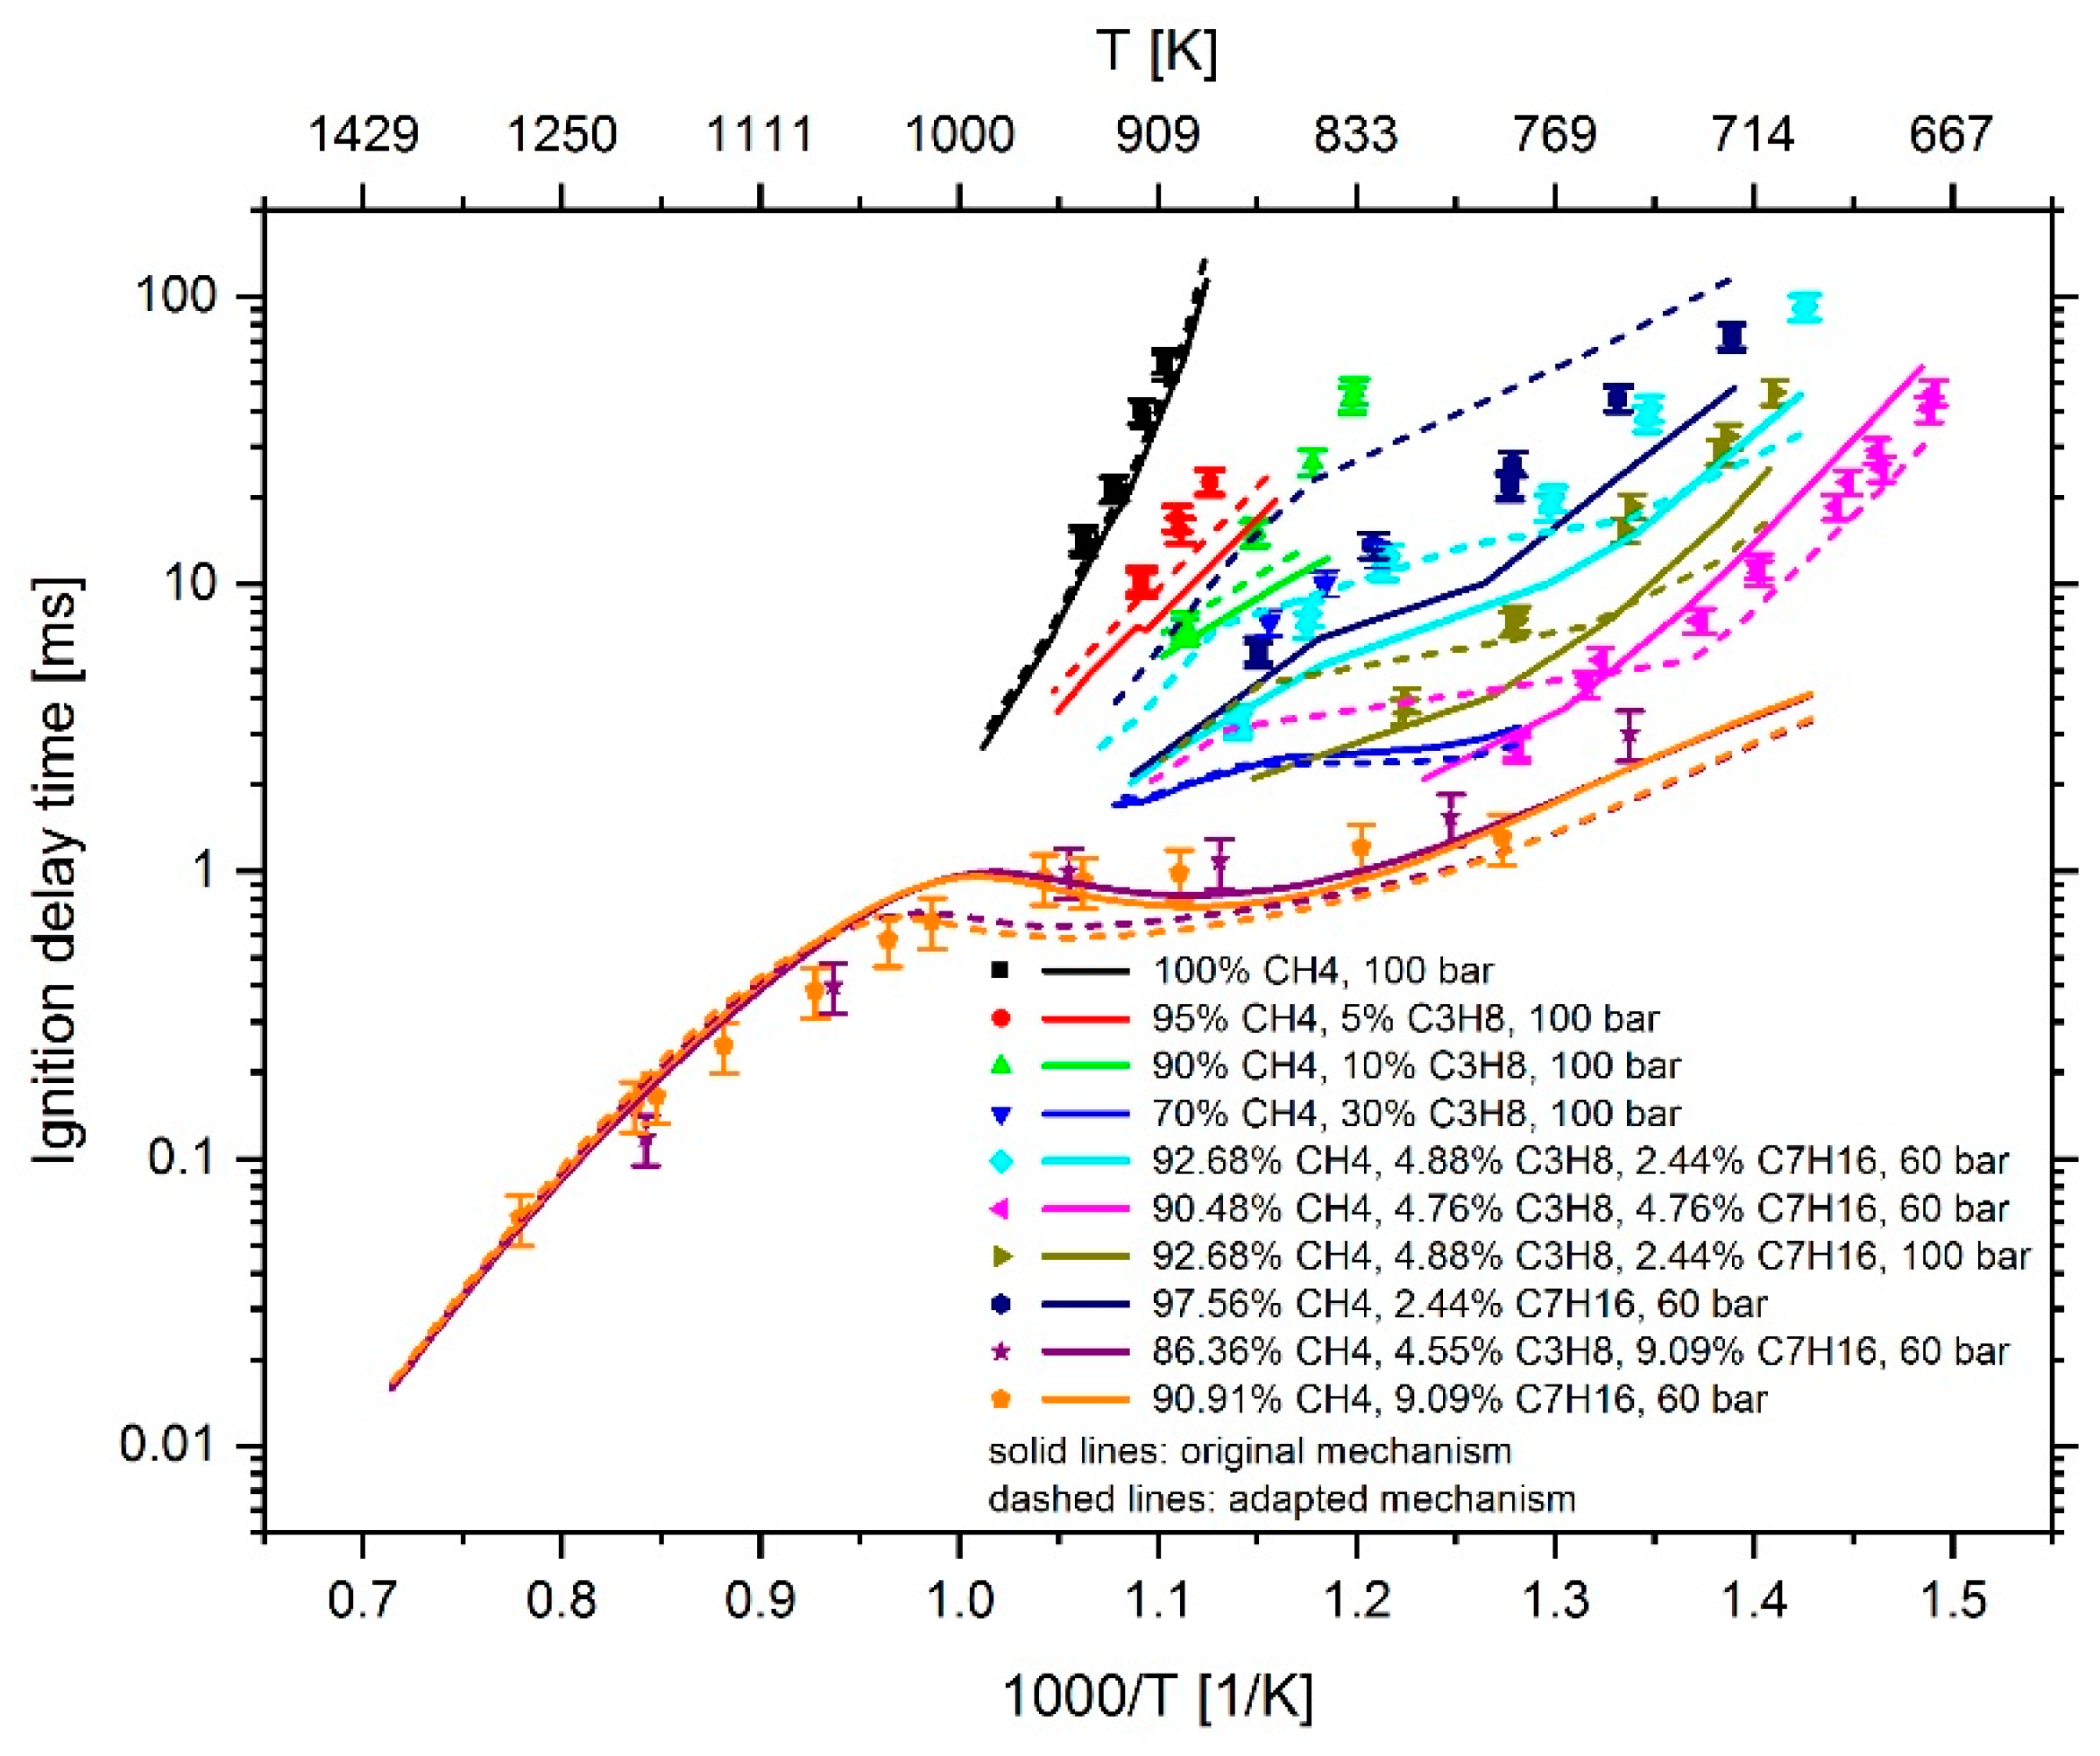
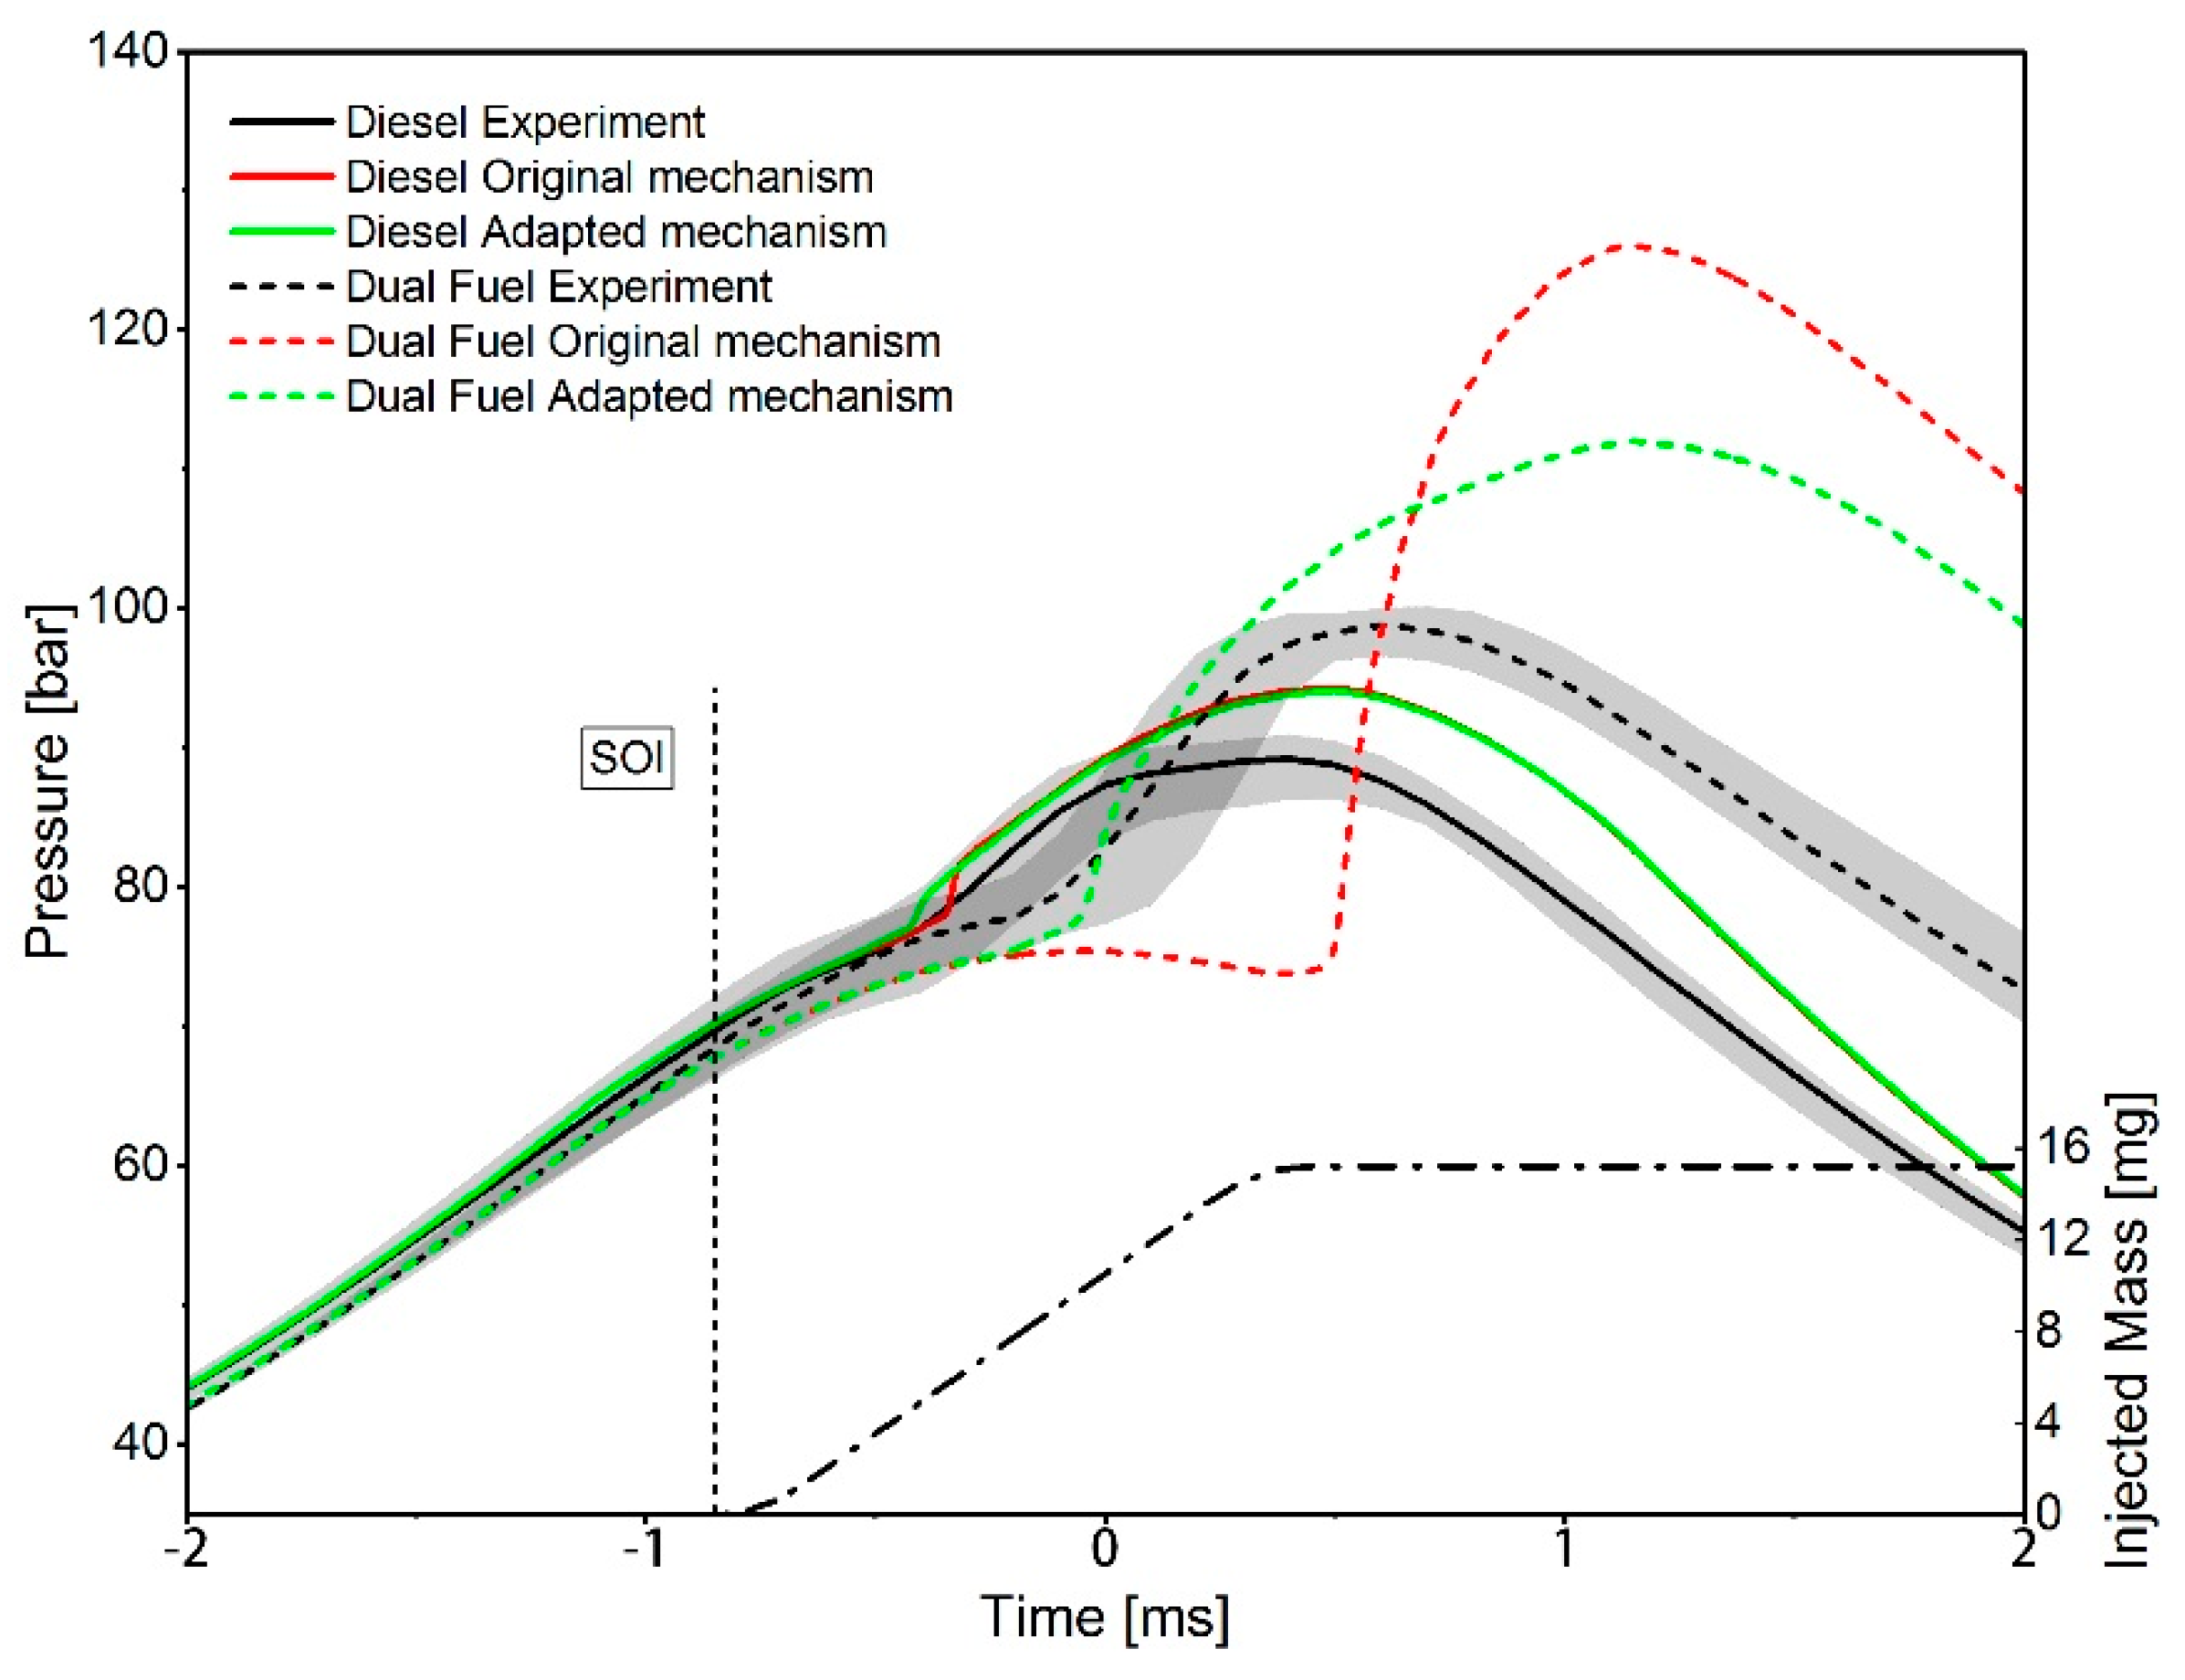
For the optimization of the n-heptane chemistry, an adaption of the reactions 296 to 300 shown in Table 2 was performed, all of which belong to the low-temperature n-heptane sub-mechanism. In the selection of the reactions, the deviation between simulation and measurement result in homogeneous and inhomogeneous mixtures were analyzed and with the help of the temperature-dependent sensitivities of the respective reactions as shown in Figure 16, the reactions most suitable for an adjustment of the ignition properties were determined. In contrast to the adaption of the methane reactions, the considered n-heptane reactions are mostly lumped and are not included in the NIST database. Therefore, a comparison as shown in Section 2.4.1. was not feasible. The reaction rates of the San Diego n-heptane sub-mechanism are based on the work of Ranzi et al. [116] and were published by Prince et al. [117] and updated shortly thereafter [118]. In order to obtain clues about an arguable shift of the reaction rate coefficients when changing the Arrhenius parameters of the respective reactions, reaction mechanisms related to the work of Ranzi and/or based on it were examined regarding the parameters used there. One of the considered mechanisms containing lumped reaction was published by Stagni et al. [119], where Ranzi was involved. In the publication of Prince et al. [118], a comparison between the simulation results using the San Diego mechanism and the n-heptane mechanism developed by LLNL is shown. This detailed mechanism differentiates between different isomeric structures of the reactants and products. The reaction rate coefficients of the individual reactions were used for comparison purposes. Furthermore, the detailed mechanism of Zhang et al. [21], which is based on the LLNL n-heptane mechanism, was considered. It should be noted, that a direct comparison of the reaction rate coefficients cannot be made, since the overall reaction rate coefficient must first be calculated considering the isomer concentrations occurring [120]. In this study, the reactions of the detailed mechanism were mainly used for assessing the order of magnitude of the reaction rate coefficients in the case of reaction 296 to 298 in Table 2. In the San Diego mechanism, the reaction sequence n-C7H15 + O2 ↔ C7H15O2n-C7-QOOH is summarized by the reaction n-C7H15 + O2n-C7-QOOH. Prince et al. [117] justified this by the assumption that the isomerization to the hydroperoxyalkyl radical n-C7-QOOH is fast enough so that its rate need not be considered. Based on this, in the case of the mechanisms of LLNL and Zhang et al., the reaction rate coefficients of the reaction C7H15 + O2 ↔ C7H15O2 (considering various isomers of C7H15 and C7H15O2) were used for the comparison of the coefficients. In the LLNL mechanism, not the parameters for the reaction C7H15 + O2 ↔ C7H15O2, but for C7H15O2 ↔ C7H15 + O2 are given. Since the reverse rate parameters for this reaction are not defined in the mechanism, the corresponding reverse rate parameters were calculated with LOGEresearch. In the case of the lumped reactions 299 and 300, due to the lack of further data, only comparisons were made with the data published by Prince et al. [117,118], where the latest data correspond to those of the San Diego mechanism. In Figure 25, Figure 26, Figure 27, Figure 28 and Figure 29, the reaction rates coefficients before and after the adaptation, as well as the comparison with reference data are shown. Since the detailed mechanisms of LLNL and Zhang et al. consider different isomers, the numbers of the respective reactions in the mechanism are given in the legends of Figure 25, Figure 26 and Figure 27.

3. Results

In the course of the iterative mechanism optimization process, the simulation results of the original mechanism were continuously compared with the adapted mechanism for homogeneous and inhomogeneous mixtures and the measurement results, deriving the next adaptation steps therefrom with the focus on minimizing the deviation between CFD simulation results and the measured values. As shown in Figure 11, the simulation results of the pilot fuel in air as a function of temperature show an overestimation of the IDT at a temperature of 923 and 973 K, and an underestimation at 823 K. By adapting the reactions of the low-temperature n-heptane chemistry, it was possible to significantly reduce the ignition delay time at 923 and 973 K, as shown in Figure 30. The IDT at 823 K could be slightly increased. The difficulty in adapting the mechanism to correctly reproduce the ignition of the diesel jet in air was to achieve an IDT increase as well as a decrease in a fairly narrow temperature window between 823 and 923 K. As can be seen in Figure 16, only two reactions show a considerable sensitivity change in this temperature range. It should be noted that in the course of the mechanism optimization process, versions of the mechanism were developed which were able to reproduce all spray box IDTs well; however, the RCEM simulations with these versions showed unacceptable large deviations from the measured values. In the final version of the mechanism, the reactions were adjusted so that the deviations between measured and simulated spray box IDTs were reduced as much as possible without negatively influencing the RCEM simulation results.
As the comparison between the simulation results of homogeneous mixtures before and after the mechanism adaptation in Figure 31 shows, the adaption process leads to an increase of the IDT in methane–air and methane–propane–air mixtures for a propane addition of up to 10 mol %, and thus to an approximation of the experimental data. In the case of adding 30 mol % propane, the IDT-reducing effect is still overestimated and requires further analysis in future studies. For mixtures with an n-heptane-admixture between 2 and 5 mol %, a decrease of the IDT is detectable for temperatures below 755 to 730 K (depending on the mixture composition and pressure). As the temperature rises, an increasing overestimation of IDT is evident. Only for the methane-n-heptane mixture without any propane addition, a continuous increase in IDT is detectable. In the simulation of the IDT of mixtures with about 9 mol % n-heptane content, a continuous reduction of the IDT can be observed for temperatures lower than 1050 K. At higher temperature, the high-temperature chemistry gets dominating and only a minimal difference between the simulation results using the mechanism before and after the adaptation can be determined. Compared to the experimental data, the IDT reduction for the mixtures with 9 mol % n-heptane does not represent an improvement, but is a consequence of the compromise that was made, since, as previously mentioned, the main target was to reduce the deviations between CFD simulations and measurements results. This becomes clear when considering the effect of the mechanism adaption on the RCEM simulation results shown in Figure 32. By the adaption of the mechanism, the time of the ignition, which was massively overestimated in the case of injecting diesel into the natural gas–air mixture, can now be reproduced well. In addition, a reduction of the pressure increase, and thus an approximation to the measured values, can be determined. The still too large pressure increase can be attributed to a too fast flame propagation in the premixed natural gas–air mixture, which needs further consideration in future studies. Nevertheless, the mechanism optimization provides a reaction mechanism that is able to describe ignition phenomena in the context of natural-gas diesel dual fuel combustion. When simulating the injection of diesel into air, a slight reduction of the IDT by a bit less than 80 µs can be determined. After ignition, however, the pressure curve remains almost identical. The adapted mechanism and the associated thermodynamic- and transport data are available online at Supplementary Materials.

4. Conclusions

The dual fuel combustion process, which is very complex and not fully understood yet, was investigated in detail. The aim was to investigate the kinetically controlled combustion process with the fuels diesel and natural gas, experimentally as well as theoretically. In order to simulate the combustion process, the availability of a suitable reaction mechanism is indispensable. In the presented study, n-heptane was used as a diesel surrogate and natural gas was substituted by a mixture of methane and propane. Based on this surrogate fuel definition, various n-heptane mechanisms available in the literature were investigated regarding their suitability for describing the dual fuel combustion process. By the comparison of the measured and calculated IDTs of several homogeneous methane–propane–n-heptane mixtures, the Complete San Diego mechanism with n-heptane extension [20] turned out to be the most promising candidate in terms of IDT variance and mechanism size. In addition to the comparison of the ignition properties of homogeneous mixtures, inhomogeneous mixtures were studied experimentally with an RCEM and a combustion vessel and theoretical by CFD-simulations. When injecting diesel into compressed air, an underestimation of the IDT by the simulation at temperatures of about 800 K was detectable; increasing the temperature above 900 K showed an overestimating behavior. RCEM-investigations showed that the addition of methane to air led to a strong overestimation of the IDT by the CFD-simulation. With the target to reduce the determined deviations between the CFD-simulation and the experiment, an adaptation of the mechanism was performed. This was done by adjusting the Arrhenius parameters of corresponding elementary and lumped reactions. Reactions suitable for the mechanism adaptation were determined by means of sensitivity and flow analyzes. In total, eight reactions of the 301 reactions comprising mechanisms were adapted: three methane reactions and five reactions of the low temperature n-heptane sub-mechanism. With the adjustment, it was possible to reduce the deviation between measured and calculated IDT for the injection of diesel into compressed air. Likewise, the strong overestimation of the IDT when admixing methane to the compressed air could be reduced, so that the adapted mechanism is able to describe ignition phenomena in the context of natural gas–diesel dual fuel combustion. However, it should be noted that the adapted mechanism is a version specially optimized for the requirements defined in this study. Some changes made to the Arrhenius parameters were large, so caution is advised when using the adapted mechanism for simulation at different conditions. For future investigations, the target is to further optimize the adjustments carried out and to take into account more reactions in order to minimize the individual alteration of the elementary and lumped reactions and thus to obtain a universally applicable reaction mechanism with comparable good results, as provided by the mechanism presented here.

Supplementary Materials

The following are available online at https://www.mdpi.com/1996-1073/12/22/4396/s1. Adapted reaction mechanism and associated thermodynamic- and transport data (ZIP).

Author Contributions

Conceptualization, S.S., J.F., F.W. and T.L.; methodology, S.S. and J.F.; software, S.S. and J.F.; validation, S.S. and J.F.; formal analysis, S.S. and J.F.; investigation, S.S. and J.F.; resources, S.S. and J.F.; data curation, S.S., J.F. and F.W.; writing—original draft preparation, S.S. and J.F.; writing—review and editing, S.S., J.F. and F.W.; visualization, S.S. and J.F.; supervision, F.W. and T.L.; project administration, F.W. and T.L.; funding acquisition, F.W. and T.L.

Funding

This research was funded by the Austrian Research Promotion Agency (FFG), grant number 850690.

Acknowledgments

We would like to show our gratitude to LOGE AB for providing the simulation software LOGEresearch. Open Access Funding by TU Wien.

Conflicts of Interest

The authors declare no conflict of interest.

References

  1. Heinemann, C.; Kasten, P.; Bauknecht, D.; Bracker, J.F.; Bürger, V.; Emele, L.; Hesse, T.; Kühnel, S.; Seebach, D.; Timpe, C. Die Bedeutung Strombasierter Stoffe für den Klimaschutz in Deutschland; Institute of Applied Ecology: Freiburg, Germany, 7 November 2019. [Google Scholar]
  2. Anto, S.; Mukherjee, S.S.; Muthappa, R.; Mathimani, T.; Deviram, G.; Kumar, S.S.; Verma, T.N.; Pugazhendhi, A. Algae as green energy reserve: Technological outlook on biofuel production. Chemosphere 2019, 242, 125079. [Google Scholar] [CrossRef] [PubMed]
  3. Ge, J.C.; Kim, H.Y.; Yoon, S.K.; Choi, N.J. Reducing volatile organic compound emissions from diesel engines using canola oil biodiesel fuel and blends. Fuel 2018, 218, 266–274. [Google Scholar] [CrossRef]
  4. Schlick, H. Potentials and challenges of gas and dual-fuel engines for marine application. In Proceedings of the 5th CIMAC CASCADES, Busan, Korea, 23 October 2014. [Google Scholar]
  5. LOGEsoft. Available online: http://www.logesoft.com (accessed on 16 May 2019).
  6. Schuh, S.; Ramalingam, A.K.; Minwegen, H.; Heufer, K.A.; Winter, F. Experimental Investigation and Benchmark Study of Oxidation of Methane–Propane–n-Heptane Mixtures at Pressures up to 100 bar. Energies 2019, 12, 3410. [Google Scholar] [CrossRef]
  7. Pachler, R.F.; Ramalingam, A.K.; Heufer, K.A.; Winter, F. Reduction and validation of a chemical kinetic mechanism including necessity analysis and investigation of CH4/C3H8 oxidation at pressures up to 120 bar using a rapid compression machine. Fuel 2016, 172, 139–145. [Google Scholar] [CrossRef]
  8. Frühhaber, J.; Peter, A.; Schuh, S.; Lauer, T.; Wensing, M.; Winter, F.; Priesching, P.; Pachler, K. Modeling the Pilot Injection and the Ignition Process of a Dual Fuel Injector with Experimental Data from a Combustion Chamber Using Detailed Reaction Kinetics. In Proceedings of the International Powertrains, Fuels & Lubricants Meeting, Heidelberg, Germany, 17–19 September 2018. SAE Technical Paper 2018-01-1724. [Google Scholar] [CrossRef]
  9. Fischer, M. Modellierung der Multikomponenten-Verdampfung im Homogenisierten Dieselmotorischen Brennverfahren; Cuvillier Verlag: Göttingen, Germany, 2006; Volume 1. [Google Scholar]
  10. Jing, B.; Wandel, A.P. Numerical investigation into natural gas–diesel dual-fuel engine configuration. In Proceedings of the 11th Asia-Pacific Conference on Combustion, ASPACC 2017, The University of Sydney, Sydney, NSW, Australia, 10–14 December 2017. [Google Scholar]
  11. Li, Y.; Li, H.; Guo, H.; Li, Y.; Yao, M. A numerical investigation on methane combustion and emissions from a natural gas-diesel dual fuel engine using CFD model. Appl. Energy 2017, 205, 153–162. [Google Scholar] [CrossRef]
  12. Zhao, W.; Yang, W.; Fan, L.; Zhou, D.; Ma, X. Development of a skeletal mechanism for heavy-duty engines fuelled by diesel and natural gas. Appl. Therm. Eng. 2017, 123, 1060–1071. [Google Scholar] [CrossRef]
  13. Eder, L.; Ban, M.; Pirker, G.; Vujanovic, M.; Priesching, P.; Wimmer, A. Development and Validation of 3D-CFD Injection and Combustion Models for Dual Fuel Combustion in Diesel Ignited Large Gas Engines. Energies 2018, 11, 643. [Google Scholar] [CrossRef]
  14. Mansor, W.N.W.; Olsen, D.B. Computational modeling of diesel and dual fuel combustion using CONVERGE CFD software. ARPN J. Eng. Appl. Sci. 2016, 11, 13697–13707. [Google Scholar]
  15. Tschöke, H. Diesel- und Benzindirekteinspritzung V: Spraybildung, Simulation, Applikation, Messtechnik: Mit 29 Tabellen; Expert-Verlag: Renningen, Germany, 2009. [Google Scholar]
  16. Reif, K. Dieselmotor-Management: Systeme, Komponenten, Steuerung und Regelung; Vieweg+Teubner Verlag: Wiesbaden, Germany, 2012. [Google Scholar]
  17. Hockett, A.; Hampson, G.; Marchese, A.J. Development and Validation of a Reduced Chemical Kinetic Mechanism for Computational Fluid Dynamics Simulations of Natural Gas/Diesel Dual-Fuel Engines. Energy Fuels 2016, 30, 2414–2427. [Google Scholar] [CrossRef]
  18. Huang, H.; Lv, D.; Zhu, J.; Zhu, Z.; Chen, Y.; Pan, Y.; Pan, M. Development of a new reduced diesel/natural gas mechanism for dual-fuel engine combustion and emission prediction. Fuel 2019, 236, 30–42. [Google Scholar] [CrossRef]
  19. Bierschenk, D.M.; Pillai, M.R.; Lin, Y.; Barnett, S.A. Effect of Ethane and Propane in Simulated Natural Gas on the Operation of Ni-YSZ Anode Supported Solid Oxide Fuel Cells. Fuel Cells 2010, 10, 1129–1134. [Google Scholar] [CrossRef]
  20. Chemical-Kinetic Mechanisms for Combustion Applications; San Diego Mechanism Web Page, Mechanical and Aerospace Engineering (Combustion Research), University of California at San Diego. Available online: http://combustion.ucsd.edu (accessed on 17 March 2017).
  21. Zhang, K.; Banyon, C.; Bugler, J.; Curran, H.J.; Rodriguez, A.; Herbinet, O.; Battin-Leclerc, F.; B’Chir, C.; Heufer, K.A. An updated experimental and kinetic modeling study of n-heptane oxidation. Combust. Flame 2016, 172, 116–135. [Google Scholar] [CrossRef]
  22. Curran, H.J.; Gaffuri, P.; Pitz, W.J.; Westbrook, C.K. A comprehensive modeling study of iso-octane oxidation. Combust. Flame 2002, 129, 253–280. [Google Scholar] [CrossRef]
  23. Mehl, M.; Pitz, W.J.; Westbrook, C.K.; Curran, H.J. Kinetic modeling of gasoline surrogate components and mixtures under engine conditions. Proc. Combust. Inst. 2011, 33, 193–200. [Google Scholar] [CrossRef]
  24. Cai, L.; Pitsch, H. Optimized chemical mechanism for combustion of gasoline surrogate fuels. Combust. Flame 2015, 162, 1623–1637. [Google Scholar] [CrossRef]
  25. Zeuch, T.; Moréac, G.; Ahmed, S.S.; Mauss, F. A comprehensive skeletal mechanism for the oxidation of n-heptane generated by chemistry-guided reduction. Combust. Flame 2008, 155, 651–674. [Google Scholar] [CrossRef]
  26. Karavalakis, G.; Hajbabaei, M.; Durbin, T.D.; Johnson, K.C.; Zheng, Z.; Miller, W.J. The effect of natural gas composition on the regulated emissions, gaseous toxic pollutants, and ultrafine particle number emissions from a refuse hauler vehicle. Energy 2013, 50, 280–291. [Google Scholar] [CrossRef]
  27. Van Basshuysen, R. Erdgas und Erneuerbares Methan für den Fahrzeugantrieb: Wege zur Klimaneutralen Mobilität; Springer Fachmedien Wiesbaden: Wiesbaden, Germany, 2015. [Google Scholar] [CrossRef]
  28. Kidnay, A.J.; Parrish, W.R. Fundamentals of Natural Gas Processing; CRC Press: Boca Raton, FL, USA, 2006. [Google Scholar]
  29. Al-Saleh, M.A.; Duffuaa, S.O.; Al-Marhoun, M.A.; Al-Zayer, J.A. Impact of crude oil production on the petrochemical industry in Saudi Arabia. Energy 1991, 16, 1089–1099. [Google Scholar] [CrossRef]
  30. Cummins Westport Fuel Quality Calculator. Available online: https://www.cumminswestport.com/fuel-quality-calculator (accessed on 12 November 2019).
  31. Sung, C.-J.; Curran, H.J. Using rapid compression machines for chemical kinetics studies. Prog. Energy Combust. Sci. 2014, 44, 1–18. [Google Scholar] [CrossRef]
  32. Petersen, E.L.; Hanson, R.K. Nonideal effects behind reflected shock waves in a high-pressure shock tube. Shock Waves 2001, 10, 405–420. [Google Scholar] [CrossRef]
  33. Heufer, K.A.; Olivier, H. Determination of ignition delay times of different hydrocarbons in a new high pressure shock tube. Shock Waves 2010, 20, 307–316. [Google Scholar] [CrossRef]
  34. LOGEresearch Manual, Book 5; LOGE AB: Lund, Sweden, 2017.
  35. Ji, W.; Ren, Z.; Law, C.K. Evolution of sensitivity directions during autoignition. Proc. Combust. Inst. 2019, 37, 807–815. [Google Scholar] [CrossRef]
  36. Manion, J.A.; Huie, R.E.; Levin, R.D.; Burgess, D.R., Jr.; Orkin, V.L.; Tsang, W.; McGivern, W.S.; Hudgens, J.W.; Knyazev, V.D.; Atkinson, D.B.; et al. NIST Chemical Kinetics Database, NIST Standard Reference Database 17; Version 7.0 (Web Version), Data Version 2015.09; National Institute of Standards and Technology: Gaithersburg, MD, USA, 2019. Available online: https://kinetics.nist.gov/kinetics/citation.jsp (accessed on 2 October 2019).
  37. Srinivasan, N.K.; Su, M.C.; Sutherland, J.W.; Michael, J.V. Reflected Shock Tube Studies of High-Temperature Rate Constants for OH + CH4 → CH3 + H2O and CH3 + NO2 → CH3O + NO. J. Phys. Chem. A 2005, 109, 1857–1863. [Google Scholar] [CrossRef] [PubMed]
  38. Bonard, A.; Daële, V.; Delfau, J.-L.; Vovelle, C. Kinetics of OH Radical Reactions with Methane in the Temperature Range 295−660 K and with Dimethyl Ether and Methyl-tert-butyl Ether in the Temperature Range 295−618 K. J. Phys. Chem. A 2002, 106, 4384–4389. [Google Scholar] [CrossRef]
  39. DeMore, W.B.; Sander, S.P.; Golden, D.M.; Hampson, R.F.; Kurylo, M.J.; Howard, C.J.; Ravishankara, A.R.; Kolb, C.E.; Molina, M.J. Chemical Kinetics and Photochemical Data for Use in Stratospheric Modeling: Evaluation Number 12; JPL Publication 97-4; Jet Propulsion Laboratory, California Institute of Technology: Pasadena, CA, USA, 1997; pp. 1–266. [Google Scholar]
  40. Atkinson, R.; Baulch, D.L.; Cox, R.A.; Hampson, R.F.; Kerr, J.A.; Rossi, M.J.; Troe, J. Evaluated Kinetic, Photochemical and Heterogeneous Data for Atmospheric Chemistry: Supplement V.  IUPAC Subcommittee on Gas Kinetic Data Evaluation for Atmospheric Chemistry. J. Phys. Chem. Ref. Data 1997, 26, 521–1011. [Google Scholar] [CrossRef]
  41. Demore, W.; Sander, S.; Golden, D.; Hampson, R.; Kurylo, M.; Howard, C.; Ravishankara, A.R.; Kolb, C.; Molina, M. Chemical Kinetic and Photochemical Data for Use in Stratospheric Modeling: Evaluation No. 11 of the NASA Panel for Data Evaluation; JPL Publication 94-26; Jet Propulsion Laboratory, California Institute of Technology: Pasadena, CA, USA, 1994; pp. 1–2. [Google Scholar]
  42. Baulch, D.L.; Cobos, C.J.; Cox, R.A.; Esser, C.; Frank, P.; Just, T.; Kerr, J.A.; Pilling, M.J.; Troe, J.; Walker, R.W.; et al. Evaluated Kinetic Data for Combustion Modelling. J. Phys. Chem. Ref. Data 1992, 21, 411–734. [Google Scholar] [CrossRef]
  43. Atkinson, R.; Baulch, D.L.; Cox, R.A.; Hampson, R.F.; Kerr, J.A.; Troe, J. Evaluated Kinetic and Photochemical Data for Atmospheric Chemistry: Supplement IV. IUPAC Subcommittee on Gas Kinetic Data Evaluation for Atmospheric Chemistry. J. Phys. Chem. Ref. Data 1992, 21, 1125–1568. [Google Scholar] [CrossRef]
  44. Atkinson, R.; Baulch, D.L.; Cox, R.A.; Hampson, R.F.; Kerr, J.A.; Troe, J. Evaluated Kinetic and Photochemical Data for Atmospheric Chemistry: Supplement III. IUPAC Subcommittee on Gas Kinetic Data Evaluation for Atmospheric Chemistry. J. Phys. Chem. Ref. Data 1989, 18, 881–1097. [Google Scholar] [CrossRef]
  45. Tsang, W.; Hampson, R.F. Chemical Kinetic Data Base for Combustion Chemistry. Part I. Methane and Related Compounds. J. Phys. Chem. Ref. Data 1986, 15, 1087–1279. [Google Scholar] [CrossRef]
  46. Felder, W.; Madronich, S. High Temperature Photochemistry (HTP): Kinetics and Mechanism Studies of Elementary Combustion Reactions over 300-1700 K. Combust. Sci. Technol. 1986, 50, 135–150. [Google Scholar] [CrossRef]
  47. Baulch, D.L.; Bowers, M.; Malcolm, D.G.; Tuckerman, R.T. Evaluated Kinetic Data for High-Temperature Reactions. Volume 5. Part 1. Homogeneous Gas Phase Reactions of the Hydroxyl Radical with Alkanes. J. Phys. Chem. Ref. Data 1986, 15, 465–592. [Google Scholar] [CrossRef]
  48. Atkinson, R. Kinetics and mechanisms of the gas-phase reactions of the hydroxyl radical with organic compounds under atmospheric conditions. Chem. Rev. 1986, 86, 69–201. [Google Scholar] [CrossRef]
  49. Warnatz, J. Rate Coefficients in the C/H/O System. In Combustion Chemistry; Gardiner, W.C., Ed.; Springer: New York, NY, USA, 1984; pp. 197–360. [Google Scholar] [CrossRef]
  50. Cohen, N.; Westberg, K.R. Chemical Kinetic Data Sheets for High-Temperature Chemical Reactions. J. Phys. Chem. Ref. Data 1983, 12, 531–590. [Google Scholar] [CrossRef] [Green Version]
  51. Zellner, R. Non-Arrhenius behavior in bimolecular reactions of the hydroxyl radical. J. Phys. Chem. 1979, 83, 18–23. [Google Scholar] [CrossRef]
  52. Ernst, J.; Wagner, H.G.; Zellner, R. A Combined Flash Photolysis/Shock-Tube Study of the Absolute Rate Constants for Reactions of the Hydroxyl Radical with CH4 and CF3H around 1300 K. Ber. Der Bunsenges. Für Phys. Chem. 1978, 82, 409–414. [Google Scholar] [CrossRef]
  53. Wilson, W.E. A Critical Review of the Gas-Phase Reaction Kinetics of the Hydroxyl Radical. J. Phys. Chem. Ref. Data 1972, 1, 535–573. [Google Scholar] [CrossRef] [Green Version]
  54. Wilson, W.E.; Westenberg, A.A. Study of the reaction of hydroxyl radical with methane by quantitative ESR. Symp. (Int.) Combust. 1967, 11, 1143–1150. [Google Scholar] [CrossRef]
  55. Dixon-Lewis, G.; Williams, A. Some observations on the combustion of methane in premixed flames. Symp. (Int.) Combust. 1967, 11, 951–958. [Google Scholar] [CrossRef]
  56. Westenberg, A.A.; Fristrom, R.M. METHANE-OXYGEN FLAME STRUCTURE. IV. CHEMICAL KINETIC CONSIDERATIONS. J. Phys. Chem. 1961, 65, 591–601. [Google Scholar] [CrossRef]
  57. Hong, Z.; Davidson, D.F.; Lam, K.-Y.; Hanson, R.K. A shock tube study of the rate constants of HO2 and CH3 reactions. Combust. Flame 2012, 159, 3007–3013. [Google Scholar] [CrossRef]
  58. Bryukov, M.G.; Knyazev, V.D.; Lomnicki, S.M.; McFerrin, C.A.; Dellinger, B. Temperature-Dependent Kinetics of the Gas-Phase Reactions of OH with Cl2, CH4, and C3H8. J. Phys. Chem. A 2004, 108, 10464–10472. [Google Scholar] [CrossRef]
  59. Calpini, B.; Jeanneret, F.; Bourqui, M.; Clappier, A.; Vajtai, R.; van den Bergh, H. Direct measurement of the total reaction rate of OH in the atmosphere. Analusis 1999, 27, 328–336. [Google Scholar] [CrossRef] [Green Version]
  60. Gierczak, T.; Talukdar, R.K.; Herndon, S.C.; Vaghjiani, G.L.; Ravishankara, A.R. Rate Coefficients for the Reactions of Hydroxyl Radicals with Methane and Deuterated Methanes. J. Phys. Chem. A 1997, 101, 3125–3134. [Google Scholar] [CrossRef]
  61. Mellouki, A.; Teton, S.; Laverdet, G.; Quilgars, A.; Le Bras, G. Kinetic studies of OH reactions with H2O, C3H8 and CH4 using the pulsed laser photolysis - laser induced fluorescence method. J. Chim. Phys. 1994, 91, 473–487. [Google Scholar] [CrossRef]
  62. Sharkey, P.; Smith, I.W.M. Kinetics of elementary reactions at low temperatures: Rate constants for the reactions of OH with HCl (298 ≥ T/K ≥ 138), CH4(298 ≥ T/K ≥ 178) and C2H6(298 ≥ T/K ≥ 138). J. Chem. Soc. Faraday Trans. 1993, 89, 631–637. [Google Scholar] [CrossRef]
  63. Dunlop, J.R.; Tully, F.P. A kinetic study of hydroxyl radical reactions with methane and perdeuterated methane. J. Phys. Chem. 1993, 97, 11148–11150. [Google Scholar] [CrossRef]
  64. Yetter, R.A.; Dryer, F.L. Inhibition of moist carbon monoxide oxidation by trace amounts of hydrocarbons. Symp. (Int.) Combust. 1992, 24, 757–767. [Google Scholar] [CrossRef] [Green Version]
  65. Lancar, I.T.; LeBras, G.; Poulet, G. Redetermination de la constante de vitesse de la reaction CH4 + OH et son implication atmospherique. C. R. Acad. Sci. Paris 1992, 315, 1487–1492. [Google Scholar]
  66. Finlayson-Pitts, B.J.; Ezell, M.J.; Jayaweera, T.M.; Berko, H.N.; Lai, C.C. Kinetics of the reactions of OH with methyl chloroform and methane: Implications for global tropospheric OH and the methane budget. Geophys. Res. Lett. 1992, 19, 1371–1374. [Google Scholar] [CrossRef] [Green Version]
  67. Vaghjiani, G.L.; Ravishankara, A.R. New measurement of the rate coefficient for the reaction of OH with methane. Nature 1991, 350, 406–409. [Google Scholar] [CrossRef]
  68. Bott, J.F.; Cohen, N. A shock tube study of the reaction of the hydroxyl radical with H2, CH4, c-C5H10, and i-C4H10. Int. J. Chem. Kinet. 1989, 21, 485–498. [Google Scholar] [CrossRef]
  69. Smith, G.P.; Fairchild, P.W.; Jeffries, J.B.; Crosley, D.R. Laser pyrolysis/laser fluorescence studies of high-temperature reaction rates: Description of the method and results for OH + CH4, C3H8, and C3H6. J. Phys. Chem. 1985, 89, 1269–1278. [Google Scholar] [CrossRef]
  70. Madronich, S.; Felder, W. Direct measurements of the rate coefficient for the reaction OH + CH4 → CH3 + H2O over 300–1500 K. Symp. (Int.) Combust. 1985, 20, 703–713. [Google Scholar] [CrossRef]
  71. Jonah, C.D.; Mulac, W.A.; Zeglinski, P. Rate Constants for the Reaction of OH + CO, OD + CO, and OH + Methane as a Function of Temperature. J. Phys. Chem. 1984, 88, 4100–4104. [Google Scholar] [CrossRef]
  72. Baulch, D.L.; Craven, R.J.B.; Din, M.; Drysdale, D.D.; Grant, S.; Richardson, D.J.; Walker, A.; Watling, G. Rates of hydroxy radical reactions with methane, ethane and propane over the temperature range 403–696 K. J. Chem. Soc. Faraday Trans. 1 Phys. Chem. Condens. Phases 1983, 79, 689–698. [Google Scholar] [CrossRef]
  73. Jeong, K.M.; Kaufman, F. Kinetics of the reaction of hydroxyl radical with methane and with nine chlorine- and fluorine-substituted methanes. 1. Experimental results, comparisons, and applications. J. Phys. Chem. 1982, 86, 1808–1815. [Google Scholar] [CrossRef]
  74. Fairchild, P.W.; Smith, G.P.; Crosley, D.R. A laser pyrolysis/laser fluorescence technique for combustion chemical kinetics. Symp. (Int.) Combust. 1982, 19, 107–115. [Google Scholar] [CrossRef]
  75. Husain, D.; Plane, J.M.; Slater, N.K.H. Kinetic investigation of the reactions of OH(X2π) with the hydrogen halides, HCl, DCl, HBr and DBr by time-resolved resonance fluorescence (A2Σ+-X2π). J. Chem. Soc. Faraday Trans. 2 1981, 77, 1949–1962. [Google Scholar] [CrossRef]
  76. Tully, F.P.; Ravishankara, A.R. Flash photolysis-resonance fluorescence kinetic study of the reactions hydroxyl + molecular hydrogen → water + atomic hydrogen and hydroxyl + methane → water + methyl from 298 to 1020 K. J. Phys. Chem. 1980, 84, 3126–3130. [Google Scholar] [CrossRef]
  77. Sworski, T.J.; Hochanadel, C.J.; Ogren, P.J. Flash photolysis of water vapor in methane. Hydrogen and hydroxyl yields and rate constants for methyl reactions with hydrogen and hydroxyl. J. Phys. Chem. 1980, 84, 129–134. [Google Scholar] [CrossRef]
  78. Zellner, R.; Steinert, W. A flash photolysis study of the rate of the reaction OH + CH4 → CH3 + H2O over an extended temperature range. Int. J. Chem. Kinet. 1976, 8, 397–409. [Google Scholar] [CrossRef]
  79. Howard, C.J.; Evenson, K.M. Rate constants for the reactions of OH with CH4 and fluorine, chlorine, and bromine substituted methanes at 296 K. J. Chem. Phys. 1976, 64, 197–202. [Google Scholar] [CrossRef]
  80. Cox, R.A.; Derwent, R.G.; Holt, P.M. Relative rate constants for the reactions of OH radicals with H2, CH4, CO, NO and HONO at atmospheric pressure and 296 K. J. Chem. Soc. Faraday Trans. 1 Phys. Chem. Condens. Phases 1976, 72, 2031–2043. [Google Scholar] [CrossRef]
  81. Cox, R.A.; Derwent, R.G.; Eggleton, A.E.J.; Lovelock, J.E. Photochemical oxidation of halocarbons in the troposphere. Atmos. Environ. (1967) 1976, 10, 305–308. [Google Scholar] [CrossRef]
  82. Zellner, R. Rate Measurements of Some Bimolecular Reactions of the Hydroxyl Radical over an Extended Temperature Range. Mol. Rate Process. Pap. Symp. 1975, 7. [Google Scholar]
  83. Steinert, W.; Zellner, R. Rates of Reaction of OH with CO and CH4 over an Extended Temperature Range. Deuxiene Symp. Eur. Sur La Combust. 1975, 2. [Google Scholar]
  84. Overend, R.P.; Paraskevopoulos, G.; Cvetanović, R.J. Rates of OH Radical Reactions. I. Reactions with H2, CH4, C2H6, and C3H8 at 295 K. Can. J. Chem. 1975, 53, 3374–3382. [Google Scholar] [CrossRef]
  85. Gordon, S.; Mulac, W.A. Reaction of the OH(X2π) Radical Produced by the Pulse Radiolysis of Water Vapor. Proc. Symp. Chem. Kinet. Data Up. Low. Atmos. 1975, 289, 299. [Google Scholar]
  86. Margitan, J.J.; Kaufman, F.; Anderson, J.G. The reaction of OH with CH4. Geophys. Res. Lett. 1974, 1, 80–81. [Google Scholar] [CrossRef]
  87. Davis, D.D.; Fischer, S.; Schiff, R. Flash photolysis-resonance fluorescence kinetics study: Temperature dependence of the reactions OH + CO → CO2 + H and OH + CH4 → H2O + CH3. J. Chem. Phys. 1974, 61, 2213–2219. [Google Scholar] [CrossRef]
  88. Peeters, J.; Mahnen, G. Reaction mechanisms and rate constants ofelementary steps in methane-oxygen flames. Symp. (Int.) Combust. 1973, 14, 133–146. [Google Scholar] [CrossRef]
  89. Baker, R.R.; Baldwin, R.R.; Walker, R.W. The use of the H2+O2 reaction in determining the velocity constants of elementary reaction in hydrocarbon oxidation. Symp. (Int.) Combust. 1971, 13, 291–299. [Google Scholar] [CrossRef]
  90. Greiner, N.R. Hydroxyl Radical Kinetics by Kinetic Spectroscopy. VI. Reactions with Alkanes in the Range 300–500°K. J. Chem. Phys. 1970, 53, 1070–1076. [Google Scholar] [CrossRef]
  91. Greiner, N.R. Hydroxyl Radical Kinetics by Kinetic Spectroscopy. IV. Some Deuterium Isotope Effects. J. Chem. Phys. 1968, 48, 1413. [Google Scholar] [CrossRef]
  92. Horne, D.G.; Norrish, R.G.W. Rate of H-abstraction by OH from Hydrocarbons. Nature 1967, 215, 1373–1374. [Google Scholar] [CrossRef]
  93. Greiner, N.R. Hydroxyl-Radical Kinetics by Kinetic Spectroscopy. I. Reactions with H2, CO, and CH4 at 300°K. J. Chem. Phys. 1967, 46, 2795–2799. [Google Scholar] [CrossRef]
  94. Fristrom, R.M. Radical concentrations and reactions in a methane-oxygen flame. Symp. (Int.) Combust. 1963, 9, 560–575. [Google Scholar] [CrossRef]
  95. Fenimore, C.P.; Jones, G.W. Rate of Reaction of Methane with H Atoms and Oh Radicals in Flames. J. Phys. Chem. 1961, 65, 2200–2203. [Google Scholar] [CrossRef]
  96. Bravo-Pérez, G.; Alvarez-Idaboy, J.R.; Jiménez, A.G.; Cruz-Torres, A. Quantum chemical and conventional TST calculations of rate constants for the OH+alkane reaction. Chem. Phys. 2005, 310, 213–223. [Google Scholar] [CrossRef]
  97. Masgrau, L.; González-Lafont, À.; Lluch, J.M. The reactions CHnD4−n+OH→P and CH4+OD→CH3+HOD as a test of current direct dynamics computational methods to determine variational transition-state rate constants. I. J. Chem. Phys. 2001, 114, 2154–2165. [Google Scholar] [CrossRef]
  98. Masgrau, L.; González-Lafont, À.; Lluch, J.M. The reactions CHnD4−n+OH→P and CH4+OD→CH3+HOD as a test of current direct dynamics multicoefficient methods to determine variational transition state rate constants. II. J. Chem. Phys. 2001, 115, 4515–4526. [Google Scholar] [CrossRef]
  99. Schwartz, M.; Marshall, P.; Berry, R.J.; Ehlers, C.J.; Petersson, G.A. Computational Study of the Kinetics of Hydrogen Abstraction from Fluoromethanes by the Hydroxyl Radical. J. Phys. Chem. A 1998, 102, 10074–10081. [Google Scholar] [CrossRef] [Green Version]
  100. Melissas, V.S.; Truhlar, D.G. Interpolated variational transition state theory and tunneling calculations of the rate constant of the reaction OH+CH4 at 223–2400 K. J. Chem. Phys. 1993, 99, 1013–1027. [Google Scholar] [CrossRef]
  101. Dobbs, K.D.; Dixon, D.A.; Komornicki, A. Ab initio prediction of the barrier height for abstraction of H from CH4 by OH. J. Chem. Phys. 1993, 98, 8852–8858. [Google Scholar] [CrossRef]
  102. Cohen, N. Are reaction rate coefficients additive? Revised transition state theory calculations for OH + alkane reactions. Int. J. Chem. Kinet. 1991, 23, 397–417. [Google Scholar] [CrossRef]
  103. Truong, T.N.; Truhlar, D.G. Ab initio transition state theory calculations of the reaction rate for OH+CH4→H2O+CH3. Ber. Bunsenges. Phys. Chem. 1990, 93, 1761–1769. [Google Scholar] [CrossRef]
  104. Gonzalez, C.; McDouall, J.J.W.; Schlegel, H.B. Ab initio study of the reactions between methane and hydroxyl, hydrogen atom, and triplet oxygen atom. J. Phys. Chem. 1990, 94, 7467–7471. [Google Scholar] [CrossRef]
  105. Cohen, N.; Benson, S.W. Transition-state-theory calculations for reactions of hydroxyl radicals with haloalkanes. J. Phys. Chem. 1987, 91, 162–170. [Google Scholar] [CrossRef]
  106. Leroy, G.; Sana, M.; Tinant, A. Etude theorique des reactions d’abstraction d’hydrogene RH + X = R + HX, avec R, X≡H, CH3, NH2, OH et F. Can. J. Chem. 1985, 63, 1447–1456. [Google Scholar] [CrossRef]
  107. Cohen, N. The use of transition-state theory to extrapolate rate coefficients for reactions of oh with alkanes. Int. J. Chem. Kinet. 1982, 14, 1339–1362. [Google Scholar] [CrossRef]
  108. Shaw, R. Semi-empirical extrapolation and estimation of rate constants for abstraction of H from methane by H, O, HO, and O2. J. Phys. Chem. Ref. Data 1978, 7, 1179–1190. [Google Scholar] [CrossRef] [Green Version]
  109. Gaillard-Cusin, F.; James, H.; Rouan, J.-P. No. 105. - Le phenomene d’inhibition-promotion par le methane de la combustion de hautes pressions de l’oxyde de carbone. J. Chim. Phys. 1969, 66, 751–756. [Google Scholar] [CrossRef]
  110. Yamaguchi, Y.; Teng, Y.; Shimomura, S.; Tabata, K.; Suzuki, E. Ab Initio Study for Selective Oxidation of Methane with NOx (x = 1, 2). J. Phys. Chem. A 1999, 103, 8272–8278. [Google Scholar] [CrossRef]
  111. Skinner, G.B.; Lifshitz, A.; Scheller, K.; Burcat, A. Kinetics of Methane Oxidation. J. Chem. Phys. 1972, 56, 3853–3861. [Google Scholar] [CrossRef]
  112. Mayer, S.W.; Schieler, L. Activation energies and rate constants computed for reactions of oxygen with hydrocarbons. J. Phys. Chem. 1968, 72, 2628–2631. [Google Scholar] [CrossRef]
  113. Baldwin, R.R.; Jones, P.N.; Walker, R.W. Determination of the rate constant for HO2 + CH4 →H2O2 → H2O2 + CH3 at 443 °C. J. Chem. Soc. Faraday Trans. 2 1988, 84, 199–207. [Google Scholar] [CrossRef]
  114. Fu, X.; Aggarwal, S.K. Two-stage ignition and NTC phenomenon in diesel engines. Fuel 2015, 144, 188–196. [Google Scholar] [CrossRef]
  115. OriginPro; Version 2017; OriginLab Corporation: Northampton, MA, USA, 2017.
  116. Ranzi, E.; Frassoldati, A.; Grana, R.; Cuoci, A.; Faravelli, T.; Kelley, A.P.; Law, C.K. Hierarchical and comparative kinetic modeling of laminar flame speeds of hydrocarbon and oxygenated fuels. Prog. Energy Combust. Sci. 2012, 38, 468–501. [Google Scholar] [CrossRef]
  117. Prince, J.C.; Williams, F.A.; Ovando, G.E. A short mechanism for the low-temperature ignition of n-heptane at high pressures. Fuel 2015, 149, 138–142. [Google Scholar] [CrossRef]
  118. Prince, J.C.; Williams, F.A. Revised short mechanism for the low-temperature ignition of n-heptane for a wider pressure range. Fuel 2015, 150, 730–731. [Google Scholar] [CrossRef]
  119. Stagni, A.; Cuoci, A.; Frassoldati, A.; Faravelli, T.; Ranzi, E. Lumping and Reduction of Detailed Kinetic Schemes: An Effective Coupling. Ind. Eng. Chem. Res. 2013, 53, 9004–9016. [Google Scholar] [CrossRef]
  120. Turányi, T.; Tomlin, A.S. Analysis of Kinetic Reaction Mechanisms; Springer: Berlin/Heidelberg, Germany, 2014. [Google Scholar]
Figure 1. Number of species and reactions of the investigated reaction mechanisms.
Energies 12 04396 g001
Figure 2. Methane numbers of various natural gases from different extraction areas.
Energies 12 04396 g002
Figure 3. Simulated pressure history and ignition delay time (IDT) definition for rapid compression machine (RCM, left) and shock tube (ST, right) simulations.
Energies 12 04396 g003
Figure 4. Experimental data (symbols) [6,7] versus model prediction (lines) using the mechanism of Cai et al. [24].
Energies 12 04396 g004
Figure 5. Experimental data (symbols) [6,7] versus model prediction (lines) using the Lawrence Livermore National Laboratory (LLNL) n-heptane v2 mechanism [22].
Energies 12 04396 g005
Figure 6. Experimental data (symbols) [6,7] versus model prediction (lines) using the mechanism LLNL n-heptane v3.1 [23].
Energies 12 04396 g006
Figure 7. Experimental data (symbols) [6,7] versus model prediction (lines) using the Complete San Diego mechanism with n-heptane extension [20].
Energies 12 04396 g007
Figure 8. Experimental data (symbols) [6,7] versus model prediction (lines) using the n-heptane skeleton mechanism of Zeuch et al. [25].
Energies 12 04396 g008
Figure 9. Experimental data (symbols) [6,7] versus model prediction (lines) using the mechanism of Zhang et al. [21].
Energies 12 04396 g009
Figure 10. Percentage deviation between measurement data and simulation results using the mechanism LLNL n-heptane v3.1 [23] (left), Complete San Diego mechanism with n-heptane extension [20] (middle) and the mechanisms of Zhang et al. [21] (right).
Energies 12 04396 g010
Figure 11. Measured and simulated IDT of pilot fuel in air as a function of temperature.
Energies 12 04396 g011
Figure 12. Pressure traces from the computational fluid dynamics (CFD) simulation and measured values from a rapid compression expansion machine (RCEM) for diesel and dual fuel combustion with 20% energetic diesel share. The diagram in the top left corner shows the corresponding simulated temperature traces.
Energies 12 04396 g012
Figure 13. Simulated chronological mole fraction sequence of the species O, H, OH, CH and HO2 as well as the pressure curve in the range of ignition of an n-heptane–air mixture at ϕ = 1, T = 750 K and p = 60 bar (left) and a methane–air mixture at ϕ = 1, T = 950 K and p = 60 bar (right) using a CV reactor.
Energies 12 04396 g013
Figure 14. Simulated time-dependent sensitivity sequence of the reaction 297 (n-C7H15 + O2n-C7-QOOH) towards CH in the area of ignition for an n-heptane–air mixture at ϕ = 1, T = 750 K and p = 60 bar.
Energies 12 04396 g014
Figure 15. Comparison of sensitivity towards species CH (left) and sensitivity toward temperature (right) simulated with an n-heptane–air mixture at ϕ = 1 and p = 60 bar.
Energies 12 04396 g015
Figure 16. Temperature-dependent sensitivity towards CH of the most sensitive reactions using an n-heptane–air mixture at 60 bar and a fuel–air equivalence ratio of 0.5, 1.0 and 2.0 for the simulation.
Energies 12 04396 g016
Figure 17. Time-dependent sensitivity towards CH of reaction 299 from Table 2 and the pressure curve simulated with an n-heptane–air mixture at ϕ = 0.5, start pressure of 60 bar and a start temperature of 960 K (left) and 970 K (right).
Energies 12 04396 g017
Figure 18. Increase of the IDT by adding methane to the n-heptane–air mixture simulated at ϕ = 1 and 60 bar.
Energies 12 04396 g018
Figure 19. Sensitivity towards CH for methane-n-heptane–air mixtures with a methane content between 50 and 95 mol % in the temperature range of 800 to 1000 K, pressure of 60 bar and a fuel–air equivalence ratio of 0.5, 1.0 and 2.0.
Energies 12 04396 g019
Figure 20. Flow analysis for carbonaceous species performed with an n-heptane-air mixture at ϕ = 1, T = 950 K and p = 60 bar.
Energies 12 04396 g020
Figure 21. Effect of adjusting the frequency factor A of reaction 299 by ±10% on the reaction rate constant k and the IDT simulated with an n-heptane–air mixture at 60 bar and a fuel–air equivalence ratio of 0.5, 1.0 and 2.0.
Energies 12 04396 g021
Figure 22. Comparison of the reaction rate coefficient of reaction 42 (CH4 + OH ↔ H2O + CH3) before and after adaptation as well as the fitted rate coefficient using reference data from the NIST database.
Energies 12 04396 g022
Figure 23. Comparison of the reaction rate coefficient of reaction 44 (CH4 + O2 ↔ CH3 + HO2) before and after adaptation as well as the fitted rate coefficient using reference data from the NIST database.
Energies 12 04396 g023
Figure 24. Comparison of the reaction rate coefficient of reaction 45 (CH4 + HO2 ↔ CH3 + H2O2) before and after adaptation as well as the fitted rate coefficient using reference data from the NIST database.
Energies 12 04396 g024
Figure 25. Comparison of the reaction rate coefficient of reaction 296 (n-C7H15 + O2 ↔ C7H14 + HO2) before and after adaptation as well as the rate coefficients used in the mechanism of Ranzi et al. [116], Stagni et al. [119], LLNL [23] and Zhang et. al. [21].
Energies 12 04396 g025
Figure 26. Comparison of the reaction rate coefficient of reaction 297 (n-C7H15 + O2n-C7-QOOH) before and after adaptation as well as the rate coefficients of the reaction C7H15 + O2 ↔ C7H15O2 in the mechanism of LLNL [23] and Zhang et. al. [21].
Energies 12 04396 g026
Figure 27. Comparison of the reaction rate coefficient of reaction 298 (n-C7-QOOH ↔ HO2 + C7H14) before and after adaptation as well as the rate coefficient used in the mechanism of Stagni et al. [119], LLNL [23] and Zhang et. al. [21].
Energies 12 04396 g027
Figure 28. Comparison of the reaction rate coefficient of reaction 299 (n-C7-QOOH + O2n-C7-OQOOH + OH) before and after adaptation as well as the rate coefficients published by Prince et al. [117,118].
Energies 12 04396 g028
Figure 29. Comparison of the reaction rate coefficient of reaction 300 (n-C7-OQOOH ↔ OH + CH2O + CO + C2H4 + n-C3H7) before and after adaptation as well as the rate coefficients published by Prince et al. [117,118].
Energies 12 04396 g029
Figure 30. Comparison of measurement and CFD-simulation results using the mechanism before and after the optimization process.
Energies 12 04396 g030
Figure 31. Experimental data (symbols) [6,7] versus model prediction (lines) using the Complete San Diego mechanism with n-heptane extension [20] before and after the mechanism adaption.
Energies 12 04396 g031
Figure 32. Comparison of measured and CFD-simulated pressure traces from an RCEM for diesel and dual fuel combustion with 20% energetic diesel share using the mechanism before and after the optimization process.
Energies 12 04396 g032
Table 1. Overview of the considered homogeneous mixtures for the evaluation of the investigated n-heptane mechanisms.
Test
Facility
Fuel CompositionPressureTemp.Ref.
CH4
(mol %)
C3H8 (mol %)C7H16 (mol %)λ
(−)
(bar)(K)
Rapid compression
machine
100001.9100906–941[7]
95501.9100888–916[7]
901001.9100803–898[6]
703001.9100826–865[7]
92.684.882.441.68560701–877[6]
90.484.764.761.51360671–781[6]
92.684.882.441.685100709–817[6]
97.5602.441.6760720–869[6]
Shock tube86.364.559.091.25760748–1187[6]
90.9109.091.22660785–1284[6]
Table 2. Overview of the reactions with a high sensitivity value derived from the results shown in Figure 16.
Reaction NumberReaction Equation
273C7H16 + HO2 ↔ H2O2 + n-C7H15
296n-C7H15 + O2 ↔ C7H14 + HO2
297n-C7H15 + O2n-C7-QOOH
298n-C7-QOOH ↔ HO2 + C7H14
299n-C7-QOOH + O2n-C7-OQOOH + OH
300n-C7-OQOOH ↔ OH + CH2O + CO + C2H4 + n-C3H7
Table 3. Overview of the most sensitive reactions shown in Figure 19.
Reaction Number Reaction Equation
172 HO2 ↔ H2O2 + O2#
182 HO2 ↔ H2O2 + O2##
38CH2O + OH ↔ HCO + H2O
40CH2O + HO2 ↔ HCO + H2O2
42CH4 + OH ↔ H2O + CH3
44CH4 + O2 ↔ CH3 + HO2
45CH4 + HO2 ↔ CH3 + H2O2
51CH3 + HO2 ↔ CH3O + OH
52CH3 + O2 ↔ CH2O + OH
242n-C3H7 + O2 ↔ C3H6 + HO2

