Abstract
In the production of plant chemical alcohol, a large amount of salty high-concentration organic waste liquid is by-produced, in which a large amount of high-value sodium tungstate and chemical heat energy are contained. Through the design of the pilot water-cooled incinerator, the operating parameters and the characteristics of alkali ash deposition of the waste incinerator were tested. The pilot incinerator is a natural-cycle steam boiler, has a full water-cooled II-type structure, with liquid slag discharge, and the furnace design has selected reasonable volumetric heat load and flue gas residence time. Combustion distribution is the core parameter affecting the combustion of waste liquid. Studies have shown that increasing the primary air rate and the excess air coefficient are beneficial to improve the combustion performance of waste liquid, increase steam production, and reduce CO and SO2 emissions in flue gas, but also increase the concentration of NO. When the excess air ratio was 1.2, and the primary air ratio was 0.65, the NO concentration in the tail flue gas was less than 10 ppm, and the SO2 concentration was zero. The TG-DTA method measured that when the alkali ash melting temperature was less than 587 °C, the alkali ash had strong adhesion in the high temperature zone of the incinerator and less deposition in the low temperature region of the tail. The alkali ash deposition rate and relative deposition rate were used to quantitatively study the characteristic of alkali ash deposition.
1. Introduction
Biomass is a very important category in renewable resource, which can be used to produce chemical products and replace petroleum refinery products. To get energy, resources, and material from biomass has become the focus of current research [1,2,3,4].
Among the many biomass resources, corn is one of the main food crops that is widely planted and large scale. In addition to being eaten, corn is also used to process feed and industrial processing. A lot of research has gone into using corn and corn straw for the biorefinery of polyols to be used for industrial applications. The development of plant chemical polyol technology has positive practical and social significance for the current shortage of oil resources, environmental pollution and other problems, which has a more profound impact on substainable economic development and ecological environment construction [5,6].
During the process of producing chemical polyol through biorefinery of corn and corn straw, the raw material is sent into the production equipment, which chemically reacts with sodium alkali and other chemical reagents under a certain pressure, temperature, and the action of catalytic media. Diversified chemical polyols (ethanediol, propylenen glycol, butyl glycol, etc.) are separated by a special process [7,8]. Figure 1 illustrates the process of petroleum refining and biorefinery to produce polyols.
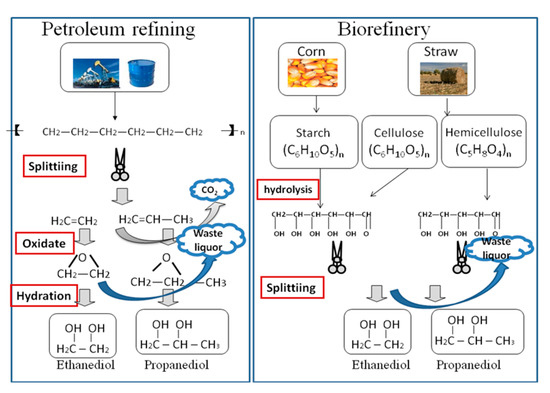
Figure 1.
Petroleum refining and biorefinery to produce polyols [9].
The treatment methods of high-concentration organic waste liquid include physical methods, chemical methods, and biological methods. It is very important to select the suitable treatment technology, which requires full consideration of the physical and chemical properties of the waste liquid [10]. The incineration method has the advantages of large scale and low cost in the treatment of high concentration organic waste liquid [11]. The authors of [12] made a preliminary study and analysis on the single droplet expansion, pyrolysis, and ignition characteristics of plant chemical alcohol waste liquid, indicating that the combustion method is feasible. Plant chemical alcohol waste liquid has a certain similarity with pulping black liquor, and its research can fully draw on the mature research methods and latest scientific research results of pulping black liquor.
Before the black liquor is burned, it is first scattered into small droplets by the spray gun. The combustion of the droplets is divided into four stages: drying, pyrolysis, char combustion, and inorganic reaction [13,14]. Hupa et al. [15,16] found that the initial dimensions of the drying were basically unchanged. After 1–2 s, a yellow flame appeared, entering the pyrolysis stage, and the droplet volume expanded rapidly. The combustion process is shown in Figure 2. After the black liquid droplets are heated, the volume expands during the evaporation analysis process, and hollow microspheres (macropores or large voids) are formed inside. The obtained coke structure is very uneven, which increases the heat transfer and mass transfer rate of the surface [17,18].
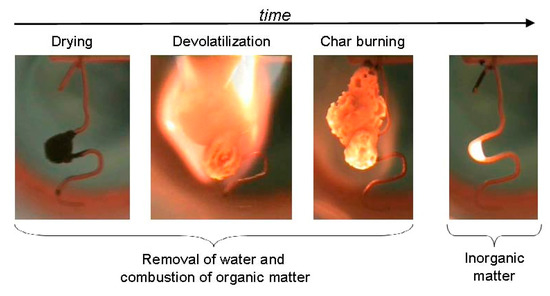
Figure 2.
Black liquor droplet combustion process.
During the combustion of black liquor, a large amount of inorganic particles are formed to form smoke. Dayton [19] believed that the reaction of gaseous NaCl, NaOH, and SO2 to form gaseous Na2SO4 is an important cause of smoke. The results of Saw [20,21] showed that the average surface temperature of the droplets is higher at a low fuel equivalent ratio. The larger the particle size, the less the sodium sublimation is, and the greater the fuel equivalent ratio, the more sodium sublimation occurs. The different sodium sublimation in different combustion stages, especially the sodium sublimation of small particle size droplets in the suspension combustion stage, should be focused on. The increase in the pyrolysis temperature of the black liquor will exacerbate the decomposition of the inorganic salts in the droplets, and increase the amount of alkali metal sublimation [22].
The large amount of smoke generated by the combustion of black liquor caused obvious marks on the fire surface of the alkali recovery boiler, which will reduce the heat transfer efficiency, block the flue, and aggravate the corrosion. The authors of [23] used infrared emission spectroscopy to analyze alkali ash deposits (Na2SO4, K2SO4, Na2CO3, and K2CO3) to determine the composition of sediments, thereby determining the alkali metal vapor concentration and ash accumulation caused by black liquor combustion. The authors of [24] found that when Cl/(Na + K) < 1% (mol) or Cl/(Na + K) > 5% (mol) in fly ash, the potassium content had little effect on the staining; when 1% < Cl/(Na + K) < 5% (mol), the staining increased with the increasing potassium content; when 1% < Cl/(Na + K) < 3% (mol), the staining increased with the increase carbonate content; when 3% < Cl/(Na + K) (mol), the carbonate content had little effect on the staining property.
70–90% of the nitrogen in the pulping raw materials (such as wood) directly enters the black liquor. The thermal NOx is greatly affected by the combustion temperature. Only when the combustion temperature is high, is the fuel type NOx the main form of combustion produces nitrogen oxides [25]. The black liquor forms different transformation routes after combustion, as shown in Figure 3, about 60% of the nitrogen is released during pyrolysis and eventually converted to N2 and NO (about 30% each), with the remaining 40% nitrogen entering the cushion and being converted to cyanate (OCN) [26]. Eventually, about 30% of the cyanate enters the green liquor system, where ammonia (NH3) is produced, and escapes in the subsequent causticization section [27,28,29].
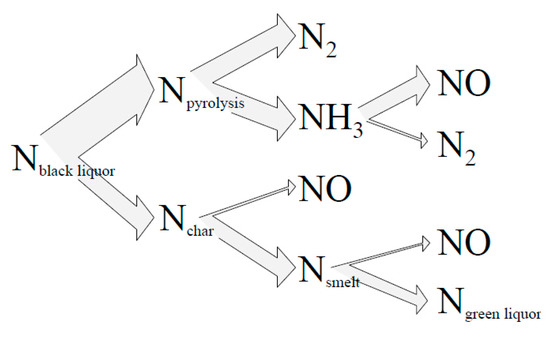
Figure 3.
Thermal conversion pathways of fuel nitrogen [30].
Other researchers [30] studied the conversion of NO and cyanate in black liquor combustion, and found that the amount of NO produced decreased with the decrease of lignin content, the amount of NO produced by fuel was basically unchanged, and the conversion of fuel N to OCN increased first and then reduced. The amount of NO produced by black liquor combustion increases with the increasing proportion of black liquor mixing biomass. The content of cyanate in the mixed fuel cushion after black liquor mixing biomass is higher [31]. The addition of biological sludge to the high-concentration black liquor in the alkali furnace increased the nitrogen content in the black liquor, but the amount of NO in the flue gas generated by combustion did not increase significantly, and the amount of cyanate produced in the smelt increased significantly [32]. At high temperatures, the conversion of elemental nitrogen into NO in the smelt increases first and then decreases with the increase of CO2 concentration in the atmosphere, and the conversion rate is the highest under the condition of 13% CO2 + 87% N2; cyanate in 13% CO2 + 87% N2 atmosphere and at 800 °C is very stable, but gradually decomposes at 900 °C; the atmosphere is essential for the decomposition of cyanate. The decomposition rate of cyanate at 900 °C in different atmospheres is 3% O2 + 97% N2 > 3% O2 +13% CO2 + 84% N2 > 100% N2 > 13% CO2 + 87% N2 > 26% CO2 + 74% N2 [33].
Song [34] performed a pyrolysis test of reed pulping black liquor particles in a fluidized bed, the measured NOx concentration of 30–40 ppm, SO2 concentration of 0–20 ppm, both concentrations are low. Research by Nichols [35] showed that the NOx generated by combustion of black liquor at 950 °C is fuel-type NOx, the temperature increases from 800 °C to 1000 °C, the fuel type NOx production will increase slowly, but the sensitivity to temperature is much lower than the heat type NOx.
The concentration of SO2 varies greatly in different areas of the alkali furnace. The average concentration in the spray gun area is 3200 ppm, the concentration in furnace arch is 2400 ppm, and in the superheater inlet, it is reduced to 30 ppm. This is because the temperature below the furnace arch is above 1000 °C, both carbonate and sulfate are unstable and are a reducing atmosphere. The chemical reaction is slow (NaOH(g) + SO2(g) + 0.5 O2(g) → Na2SO4(g) + H2O(g)), and the temperature in the superheater inlet is lowered, which is an oxidizing atmosphere. The reaction is severe, causing a sharp decrease in the SO2 concentration. In addition, NaCl will undergo sulfation (NaCl(s, l) + ½ SO2 + ¼ O2 + ½ H2O→HCl + ½ Na2SO4(s, l)), the reaction reacts rapidly in the superheater inlet, but under the condition of (0.3–1.1%) SO2, (3–11%) O2, (0.5–20%) H2O, and temperatures of 400–600 °C, the reaction is slow. The reaction rate depends on the partial pressure of SO2, which is related to the SO2 adsorbed on the surface of NaCl. It is independent of the partial pressure of O2 and H2O, and is less affected by temperature. By analyzing the alkali ash component collected by the dust collector, judging the emission of smoke pollutants, the higher the chlorine content in the alkali ash, the lower the SO2 emission [36,37].
2. Experimental
2.1. Analysis of Plant Chemical Polyol Waste Liquor
The waste liquid, that is, a substance that cannot be used as a by-product of the plant chemical alcohol reaction device, consists of various alcohols, heavy components, and water, in which the ethylene glycol content is the largest; the elemental analysis and calorific value are shown in Table 1.

Table 1.
Waste liquor elemental analysis and heat value.
At room temperature, the plant chemical alcohol waste liquid is a tan viscous liquid.
The density is ρ = 1285.6 kg/m3, which is measured by electronic balance and measuring cylinder.
Waste liquid has poor flow ability at room temperature. If the temperature increases, the flow ability increases rapidly. The relationship between viscosity and temperature of chemical polyol waste liquor is shown in Table 2.
Table 2.
Relationship between viscosity and temperature of chemical polyol waster liquor.
2.2. Pilot Water-Cooled Incinerator
After the chemical alcohol waste liquid is sprayed into the high-temperature combustion chamber of the incinerator, it is subjected to drying, pyrolysis, and combustion by high-temperature flue gas radiation. Most of the sodium salt and a small amount of residual carbon will fall to the bottom of the furnace to continue the reaction; thus, the combustion of waste liquid is a combination of suspension combustion and layer combustion. Figure 4 is a diagrammatic sketch of the waste liquid combustion chamber. The waste liquid injected into the combustion chamber has four running trajectories a, b, c, and d, and the comprehensive state of the waste liquid droplet determines its carrying route. The size of a trajectory droplet determines the condition of the ash mechanical carrying in the flue gas, and has a direct relationship with the ash accumulation of the tail heating surface.
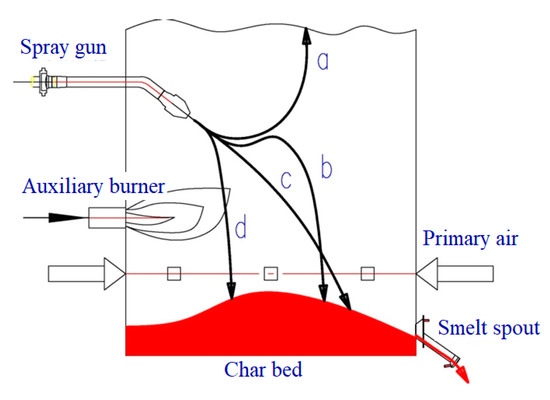
Figure 4.
Diagrammatic sketch of combustion chamber.
The sodium salt and a small amount of residual carbon falling to the bottom of the furnace are continuously accumulated at the bottom of the furnace, and a molten pool is gradually formed. The molten pool has a large heat storage capacity, and the formation of the high-temperature molten pool plays an important role in the stable combustion of the waste liquid. The molten pool provides a large amount of radiant heat for the drying, pyrolysis and combustion of the waste liquid.
Due to the small scale of the pilot incinerator, the molten pool is greatly affected by the cooling effect of the surrounding water-cooled wall. In order to ensure the molten pool is in a molten state and the liquid slag is smooth, a natural gas auxiliary burner is arranged in the upper part of the molten pool to provide stability radiant heat source. The natural gas auxiliary burner is used when the incinerator starts and stops the furnace and the liquid slag is not smooth. The load adjustment range of the natural gas auxiliary burner is 0–30 Nm3/h.
Figure 5 is a three-dimensional diagram of a pilot water-cooled incinerator, consisting of membrane water-cooled furnace, drum, boiling tube screen, economizer, platform and ladder, ash hopper, and insulation panel. The square combustion chamber structure is favorable for obtaining a symmetrical molten pool, the flue gas above the molten pool is easy to distribute, the flue gas flow rising in the lower part of the furnace is more uniform, and the temperature field distribution is good. The dimensions of the incinerator combustion chamber were chosen to be 900 mm × 900 mm × 3600 mm.
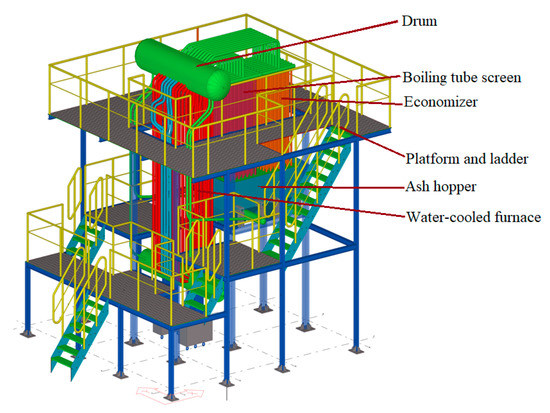
Figure 5.
Water-cooled incinerator.
According to the requirement of operation and test measurement, plant chemical alcohol waste liquid pilot incinerator arranged the airport, auxiliary burner hole, waste liquid spray nozzle hole measuring hole, smelt spout slag opening, and inspection hole. The measurement holes are located at the tail boiling tube screen and economizer outlet. The design parameters of various doors and holes of the incinerator are shown in Table 3.
Table 3.
Incinerators measure hole and doors and other opening sizes and locations.
The smelt spout slag opening is located at the lower part of the rear wall of the combustion chamber, and the slag opening is designed to ensure the outflow of the smelt, while ensuring the proper height of the molten pool. Smelt spout slag opening is also a measuring hole (LZ1), and the temperature of the surface of the molten pool and the temperature of the upper portion of the molten pool are measured by placing a thermocouple through the slag opening.
The phytochemical waste liquid needs to be sprayed and atomized into small droplets for combustion. The evaporation temperature of the water in the waste liquid is 100 °C, and the evaporation temperature of the residual polyol is in the range of 110–499 °C; thus, the small droplets were injected into the combustion chamber. After the radiation of high temperature flue gas, the surface temperature rises rapidly and the evaporation and pyrolysis process is completed very quickly. Since the chemical alcohol waste liquid has a large expansion index, it will turn into fluffy small particles after the completion of the pyrolysis, and the specific surface area in contact with the air is increased, which is favorable for the combustion of the waste liquid. The waste liquid nozzle is arranged on the front wall and is located in the high temperature zone of the combustion chamber between the secondary air and the auxiliary burner, which is beneficial to the evaporation and pyrolysis of the waste liquid. The combustible gas generated by the pyrolysis is convenient for the mixed combustion with the secondary air; the small particles after the solution run along the four trajectories a, b, c, and d under the action of jet inertia and self-gravity, wherein the small particles of b, c, and d are mixed with the primary air to continue combustion and fall onto the molten pool, and small particles of the a track are carried by the flue gas into the upper furnace for combustion reaction.
The combustion chamber is arranged with five measuring holes/fire holes from the bottom up (the measuring holes on the right are RS1-RS4 and FO). By looking at the fire hole, the combustion condition in the combustion chamber can be observed, and the combustion chamber temperature, flue gas composition, etc., is measured through the measuring hole. Measuring holes are arrange at the boiling tube screen at the tail of the incinerator and at the economizer outlet to measure the temperature of the flue gas and the composition of the flue gas.
In order to facilitate the furnace maintenance, an inspection hole is arranged in the upper part of the combustion chamber. After the furnace is cooled, the test personnel can enter the furnace to measure the relevant data.
2.3. Pilot Plant for Waste Liquor Combustion
The pilot plant for plant chemical alcohol waste liquid combustion covers an area of about 120 m2 and has a total height of 5.5 m. The main equipment includes: water-cooled incinerator, flue gas system (blower, heater, induced draft fan, regulating damper), auxiliary combustion device, waste liquid pump, waste liquid combustion spray gun, steam condenser, slag removal device, bag filter, various measuring points, temperature, flow, pressure, and other data acquisition systems. The pilot test device system flow is shown in Figure 6. The pilot plant is designed for plant chemical alcohol waste incineration experiments, taking into account the integrity of the process and the reproducibility of process flows in large-scale industrial applications in the future. The pilot test device mainly tests the following items: (1) temperature data of various areas in the incinerator; (2) data of NOx, SOx and CO in the incinerator; (3) in molten alkali ash, bonded ash, and fly ash S/Cl/Fe element content distribution; (4) checking the fouling condition of fly ash on the water wall and the tail heating surface after stopping the furnace; (5) observing the combustion flame form of the waste liquid in the furnace and the formation of the molten pool at the bottom of the furnace. The pilot system consists of six sub-systems: waste liquid transportation system, combustion system, flue gas system, steam water system, slag removal system, and instrument control system.
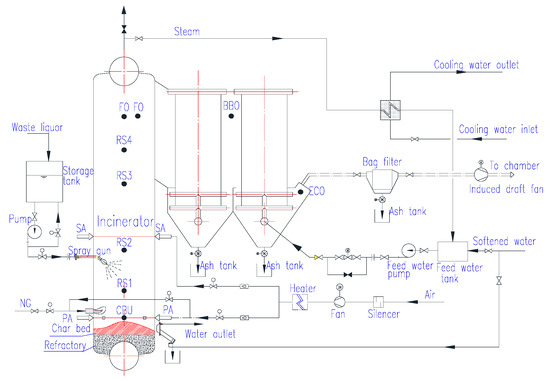
Figure 6.
Flowsheet of pilot plant for waste liquor combustion.
2.4. Measuring Equipment
2.4.1. Flue Gas Analyzer
The GermanTesto340 flue gas analyzer is a portable flue gas analyzer, which is suitable for industrial flue gas analysis applications and suitable for a variety of testing environments. The sensor chromatography filter is used to avoid gas crossover and the measurement accuracy is high. The Testo340 can accommodate up to four sensors. The sensor has an automatic high-density protection range extension function and fully automatic range-expansion function without interrupting the measurement process. The flue gas analyzer used in the test is equipped with four sensors, which can simultaneously measure the content of O2, CO, NO, and SO2 in the flue gas, with measuring errors of: O2, ±0.2 vol%; CO, ±10 vol%; NO, ±5 vol%; SO2, ±5 vol%.
Since the flue gas in the incinerator has a high temperature and contains a high concentration of alkali dust, it is necessary to use a pre-gas sampling pretreatment device to extract the flue gas from the incinerator and purify the extracted flue gas to avoid damage to the flue gas analyzer.
2.4.2. Thermogravimetric Analyzer
Differential Thermal Analysis (DTA) is a commonly used thermal analysis method for determining the characteristic temperature of a substance during thermal reaction, including physical and chemical reactions such as phase transformation, decomposition, and melting. The Thermogravimetric Analysis (TG)-DTA method is used to compare and analyze the mass and differential heat curves of alkali ash during heating, so as to find the characteristic temperature of alkali ash phase transformation and melting. The thermogravimetric analyzer used in the test was model TGA/SDTA851e, a new type of thermogravimetric analyzer with differential thermal analysis and differential scanning calorimetry manufactured by METTLER TOLEDO.
The technical parameters of the TGA/SDTA851e thermogravimetric analyzer are as follows:
Temperature range: room temperature ~1600 °C;
Temperature accuracy: ±0.25 °C;
Temperature repeatability: ±0.15 °C;
Linear heating rate: 0.01–100 °C/min;
Cooling method: water bath cooling;
Sample test range: 0–5000 mg;
Sensitivity: 0.1 μg;
Signal acquisition rate: up to 10 values/sec.
2.5. Test Condition
The fuel used in the waste combustion test was 85 kg/h (waste liquid) + 10 Nm3/h (gas); the theoretical air volume was 376 Nm3/h, and the theoretical flue gas volume was 470 Nm3/h.
The combustion test conditions were arranged as shown in Table 4, for a total of four working conditions. Working conditions 1–3 are the equivalent air volume (α = 1.0). The change law of temperature field and smoke composition in the furnace is studied by changing the ratio of primary and secondary air ratio. Working condition 4 is the excess air volume (α = 1.2), which is mainly compared with working condition 3, studying the change law of temperature field and smoke composition under the same primary and secondary air. In order to ensure the accuracy of the measurement data of each test condition, each working condition needs to run stably for 3 hours.
Table 4.
Pilot test combustion tissue distribution and theoretical calculation of air volume.
3. Influence of Air Distribution on Operating Parameters of Incinerator
After the combustion of the waste liquid incinerator is stable, the data of each measuring point will continuously fluctuate. At this time, the recorded instantaneous value has a certain deviation from the actual value. Clicking the measuring point value on the Distributed Control System (DCS) screen will bring up the dialogue shown in Figure 7. Dialog box, selecting the average value of the measured value curve for a period of time as the running data value, which is closer to the real operating parameters.
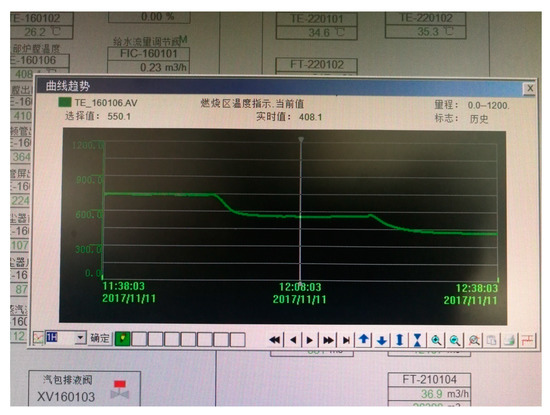
Figure 7.
Example of measuring point curve.
Due to the high combustion temperature in the combustion chamber, the sodium alkali is highly corrosive to the thermocouple at high temperatures. Therefore, the on-line temperature measuring instrument is not provided in the combustion chamber (except at the outlet), but the portable temperature measuring instrument was used for manual measurement through the measuring hole. From the outlet of the combustion chamber, the tail flue gas temperature measurement point is the online temperature measurement.
When measuring the smoke composition in the incinerator, the Testo340 flue gas analyzer has a certain fluctuation in the measured data, which is the average value measured from 5–10 min.
Photographs of the operation of the incinerator combustion chamber and the slag opening are shown in the photograph in Figure 8. The left picture shows the flame in the combustion chamber, and the middle and right pictures show the sodium alkali smelt flowing out from the bottom of the combustion chamber.
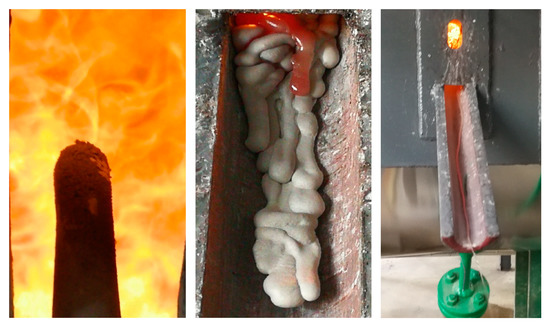
Figure 8.
Furnace flame and smelt outflow.
3.1. Effect of Air Distribution on Steam Production
From the hot combustion test data, it can be seen that under the same fuel condition, the combustion air distribution has a direct influence on the steam production and the CO production concentration, as shown in Figure 9.
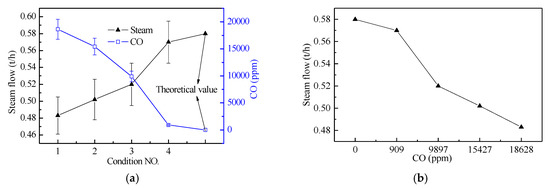
Figure 9.
(a) Effects of combustion conditions on steam production and CO concentration, and (b) the relationship between steam production and CO.
It can be seen from Figure 9 that the steam production has a negative correlation with the CO concentration at the outlet of the incinerator boiling tube screen, and the high CO concentration has a low steam yield, and the steam production in the calculation condition is the largest. Under the condition of equivalent air (conditions 1, 2, and 3), as the primary air rate increases, the CO concentration decreases and the steam production increases, indicating that the concentrated supply of combustion air in the main combustion zone (primary air zone) can improve combustion efficiency is conducive to the burning of combustible gases. From the smoke component detection data, the unburned CO gas content of working condition 4 is significantly smaller than the first three working conditions, and the steam output is also closest to the calculation working condition, indicating that increasing the excess air coefficient is beneficial to the burnout of combustible gas, thereby improving energy efficiency.
Under the equivalent air volume, the primary air rate increases the steam production, but this does not mean that the larger the primary air rate the better, because the pilot incinerator is smaller, affected by the boundary cooling effect, and the time in the high temperature zone is shorter, but in industrial applications, the heat load is very high and the residence time is very long, which is less affected by this.
3.2. Effect of Air Distribution on Furnace Temperature
Figure 10 is a graph showing the temperature variation of each measuring point in the furnace under different air distribution conditions. Under the four working conditions, the temperature of the molten pool CB is similar, which indicates that the molten pool absorbs high-temperature radiant heat and radiates heat to the surrounding radiation. The high-temperature molten pool has stable heat storage capacity and greatly promotes the temperature field stability in the lower part of the furnace.
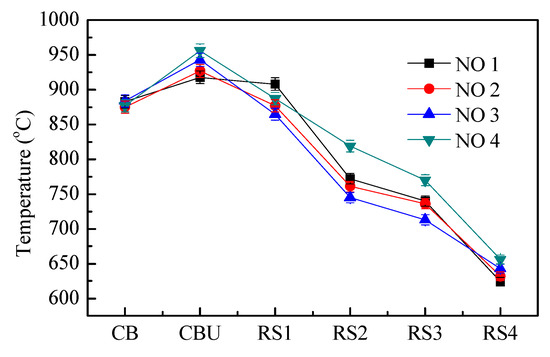
Figure 10.
Temperature comparison in the incinerator from bottom to top.
The primary air is located in the upper part of the molten pool. Increasing the air supply can effectively increase the combustion intensity of the fuel in the area, so that the temperature of the upper Upper zone of char bed (CBU) of the molten pool increases with the increase of the primary air volume. The RS1 measuring point is located in the upper part of the auxiliary burner, which is affected by the combination of natural gas combustion and waste liquid combustion. The temperature data under the four working conditions has no obvious regularity. The CBU and RS1 areas are the main combustion zones. This area has a high combustion temperature and is the key to ensure the stable operation of the pilot incinerator.
The RS2 and RS3 measuring points are located near the secondary airport, and the unburned material will burn further as the secondary air is replenished. The total air volume of working conditions 1, 2, and 3 is the same, and the secondary air rate is decreased in turn, so that the combustion temperature of the two measuring points is gradually reduced, which is opposite to the measuring point CBU, and the working condition 4 has a large excess air coefficient. The combustion temperature is significantly higher than the other three conditions.
The combustion chamber is radiation heat transfer process. The RS4 measuring point is close to the outlet of the combustion chamber. The temperature of the four working conditions drops to around 650 °C. The combustion has basically ended. The fuel combustion efficiency determines the temperature of the exhaust gas. Working condition 4 has the highest combustion efficiency and the working condition 1 has the lowest combustion efficiency, which is consistent with the CO concentration in the flue gas.
3.3. The Change Law of CO
Figure 11 shows the CO measurement data of each measuring point under four working conditions. The CO concentration under each working point of working condition 4 is significantly lower than that of the other three working conditions. Under the equivalent air condition, the higher the primary air rate, the smaller the amount of CO generated.
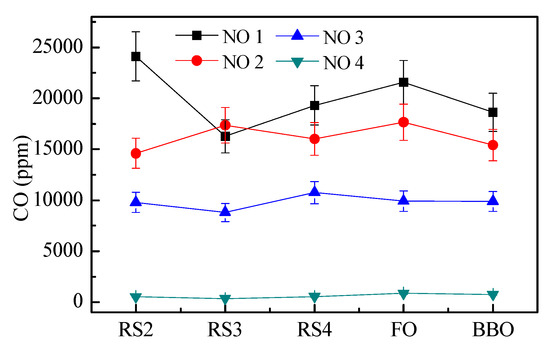
Figure 11.
Comparison and trend of CO concentration at different measuring points under four condition tests.
The production of CO is caused by incomplete combustion, and the higher the content of CO in the flue gas indicates that the combustion of the combustible gas is insufficient. The four working conditions have different combustion results due to different air distribution modes. Even under the same air-equivalent ratio, the different air-distribution results are different. In condition 1, CO concentration at RS3 decreases obviously, which is due to the maximum secondary air rate in condition 1 and the centralized feeding of the front and rear walls, resulting in the collision of air in the hearth center, resulting in faster combustion of CO in the upper part of the hearth center of the secondary air vane blast furnace, resulting in a rapid decrease of CO concentration at RS3 measuring point, but with the rise of flue gas, the flow field distribution becomes more uniform and CO concentration increases. In general, increasing the excess air ratio is beneficial to improve combustion efficiency and reduce CO emissions. Under the same air-equivalent ratio, increasing the primary air rate is beneficial to reduce CO emissions. The graded air supply has a discrete effect on combustion. When the secondary air rate is increased, if the temperature field is not well organized, the combustion efficiency will be significantly reduced.
3.4. Pollutant Discharge Law
The secondary pollutants generated by combustion in the flue gas of incinerators are mainly NO and SO2, and the amount of these two pollutants is directly related to the combustion conditions [38]. Because the measurement data of NO and SO2 in the pilot test fluctuated greatly, especially the NO value fluctuated between several ppm. Since the combustion at the RS4 measurement point has basically ended, the three measurement points of RS4, FO, and BBO are selected. The average values of NO and SO2 are used as the basis for analysis, which can reduce the error caused by the measurement.
Figure 12 is a graph showing the relationship between NO, SO2, and CO in flue gas. The reduction of CO is stronger than that of NO. Under high temperature, reacts [39]. The incinerator test results also show that NO has a negative correlation with CO, and NO increases with the decrease of CO concentration. The SO2 concentration in the flue gas decreased with the decrease of CO concentration, and it has a positive correlation. The SO2 concentration of working condition 4 is close to zero, which is significantly lower than the other three working conditions, indicating that a larger excess air coefficient can effectively reduce SO2 emissions.
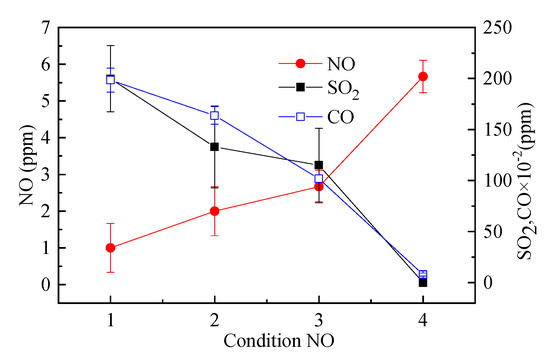
Figure 12.
Trends and comparisons of NO and SO2 and CO under four test conditions.
The NO concentration in the pure natural gas working conditions reached 23 ppm, but the NO concentration in the flue gas after incineration was very small. Under the four conditions, the NO concentration was less than 10 ppm, which fully met the most stringent environmental emission requirements. There is also a negative correlation between NO and SO2 after the combustion of waste liquid. The concentration of NO increases and the concentration of SO2 decreases. The black liquor of pulping also has similar characteristics of seesaw [40].
The test results show that when the incomplete combustion loss of the incinerator gas is large, the SO2 emission concentration in the flue gas exceeds 100 ppm, and the desulfurization facility needs to be considered. However, by adjusting the excess air coefficient to improve the combustion efficiency, the SO2 emission can be greatly reduced, which completely satisfied the environmental requirements.
4. Analysis of Alkali Ash Characteristics
The hot pilot test was carried out for 21 h, the total amount of combustion waste was 1785 kg, and the amount of alkali ash was calculated to be 103.6 kg. The weight of the smelt alkali ash collected in the pilot test was 79.45 kg, and the weight of the fly ash was 2.81 kg. The flue gas of the incinerator is collected by the dust collector and the dust concentration is reduced to below 20 mg/Nm3, and then discharged. The actual discharge concentration is about 15 mg/Nm3, and the dry flue gas volume is about 451 Nm3/h. The empty alkali ash has a mass of about 0.14 kg. The deposition position of the alkali ash in the heating surface of the incinerator is mainly the combustion chamber, the condensate tube bank, the boiling tube screen, and the economizer. The area of each main heating surface is shown in Table 5.
Table 5.
Size of the heated surface of each alkali ash deposit in the incinerator.
4.1. Alkali Ash TG-DTA Analysis
There are three places in the alkali ash generated after the combustion of chemical alcohol waste liquid, smelt alkali ash, bonded ash, and fly ash, as shown from left and right of Figure 13, respectively. The smelt alkali ash is collected through the bottom smelt spout, and the fly ash is collected by the dust collector and the boiler proper ash hopper, and the bonded ash is deposited on the heating surface of the incinerator.
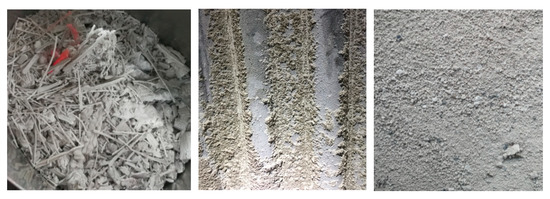
Figure 13.
Form of alkali ash collected in different parts of the incinerator.
The main component of the alkali ash produced by the combustion of chemical alcohol waste liquid is sodium tungstate (melting point temperature of 698 °C), in addition to a small amount of sodium sulfate (melting point temperature of 884 °C) and sodium chloride (melting point temperature of 801 °C), due to low melting point of alkali ash, it cannot be accurately measured using conventional ash melting point measuring equipment.
The collected three types of alkali ash were ground into a fine powder with a particle size of 200 mesh, and the amount is less than 5 mg. In order to facilitate the comparative analysis of the alkali ash and the sodium tungstate, the test sample of the high-purity sodium tungstate is increased, and the heating rate of the thermogravimetric analyzer was 20 °C/min. The TG-DTA curves for sodium tungstate, molten ash, bonded ash, and fly ash are shown in Figure 14.
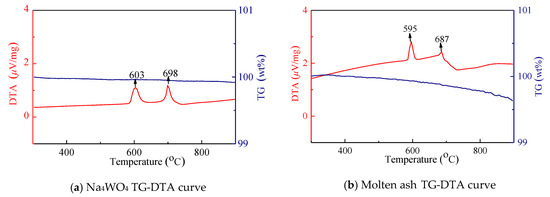
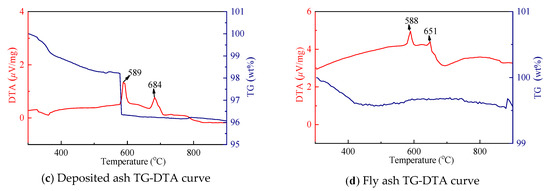
Figure 14.
TG-DTA curve in various forms of soda ash.
Both alkali ash and sodium tungstate have strong moisture absorption, and absorb certain moisture after contact with air. Therefore, the temperature range selected by TG-DTA curve is in the range of 300–900 °C. The TG curve of pure sodium tungstate is very stable, and the weight loss curve of molten ash and fly ash is also small, but the weight loss of the bonded ash varies greatly, especially at a large steep slope near 580 °C. The phenomenon should be related to the presence of certain residual organic matter in the bonded ash (the molten ash and fly ash are collected outside the furnace after a sufficient combustion reaction, and the bonded ash is collected after shutdown). At this temperature, decomposition of residual organic matter occurred. There are two distinct differential heat peaks in the DTA curves of the four working conditions. In particular, the DTA curve of the sodium tungstate curve is very clear, it is easy to judge the state change during heating, and the transformation temperature is 603 °C. The melting temperature is 698 °C; the hot peak of the DTA curve of molten ash shows that phase transformation occurs near 591 °C, absorbs heat at 687 °C, and then melted; the bonded ash undergoes decomposition and phase transformation at 589 °C, absorbs heat at 684 °C, and then melted; the fly ash undergoes phase change transformation at 588 °C, absorbs heat at 651 °C, and then melted.
It can be seen from the above analysis that the phase transition temperature and melting temperature of the alkali ash are lower than that of sodium tungstate, and the melting point temperature of the fly ash is significantly lower than that of the molten ash and the bonded ash, which increases the risk of bonding of the heated surface of the tail.
4.2. Alkali Ash Deposition Characteristics
The fly ash in the flue gas of the incinerator includes mechanical carrying and smoke, and the two fly ash formation mechanisms are different. The size of the particles carried by the mechanical carrying is relatively large, ranging from 20 μm to 3 mm, mainly from the droplets carried by the flue gas and part of the alkali ash blown up by the surface of the molten pool; the particles of the smoke are much smaller, ranging from 0.1 μm to 1 μm. Formed by condensation of volatile inorganic salts [41]. The deposition of fly ash on the heated surface includes two forms, one is turbulent diffusion and ash deposition, and the other is inertial collision ash deposition, as shown in Figure 15. In addition to the above form, the water-cooled wall alkali ash deposition is also a part of the waste liquid sprayed on the waterwall, and the alkali ash generated after the combustion is directly attached to the waterwall.
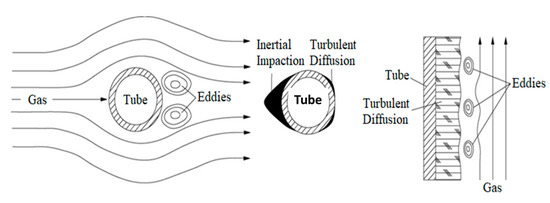
Figure 15.
Gas flow and deposition patterns.
4.2.1. Alkali Ash Deposition Rate
In the pilot test of waste liquid incineration, it was found that a large amount of alkali ash was deposited and adhered on the heated surface, especially the alkali ash deposition and bonding on the wall surface of the combustion chamber. The mass of the ash on the heated surface was 21.2 kg. In order to study the adhesion of alkali ash, the concept of deposition rate is given, which is expressed by the Equation (1):
where —alkali ash deposition rate, kg/m2∙h;
—the deposition quality at time t, kg;
H—the deposition surface area, m2.
The alkali ash deposition quality in the pilot test is calculated by the difference between the feed amount and the discharge amount of the entire test section, and the deposition surface area is the heating surface of the entire incinerator, and the average deposition rate can be calculated by the Equation (1), simplified to Equation (2):
where M = 21.2 kg, ΣH = 80.7 m2, ∆t = 21 h;
The average deposition rate of alkali ash is 1.25 × 10⁻² kg/m2∙h.
The ash accumulation status of the four-stage heating surface of the incineration chamber, the Feston tube, the boiling tube screen and the economizer is sequentially reduced, which can be simplified as follows:
- The area of the Feston tube is small, and the amount of ash is negligible;
- The economizer has a small ash pollution coefficient, the surface is very clean, and the ash accumulation is negligible;
- Alkali ash deposition is mainly in the combustion chamber and the boiling tube screen.
The thickness of the ash in the combustion chamber is measured by the thickness meter to be about six times that of the boiling tube screen. According to the measurement results and the three-point simplification, the average deposition rate of the alkali ash of the combustion chamber and the boiling tube screen can be calculated to be 5.57 × 10⁻² kg/m2∙h and 0.93 × 10⁻² kg/m2∙h.
4.2.2. Relative Deposition Rate
The data of the deposition amount and the amount of fly ash of the alkali ash were analyzed by the concept of "relative deposition rate", and the relative deposition rate can be expressed by the Equation (3) [42]:
where Rd—relative deposition rate, %;
m1—the mass of alkali ash deposited on the heated surface, kg;
m0—the total alkali ash mass carried by the flue gas, kg.
The higher the relative deposition rate, the easier the alkali ash is deposited on the surface of the heating surface. The relative deposition rate of alkali ash in the incinerator is of 87.8%, which is much higher than the relative deposition rate of coal-fired boilers [42].
The calculated relative deposition rate is the average value over a period of time, but the instantaneous relative deposition rate is constantly changing. As the alkali ash of the heating surface is continuously deposited, the flow area of the convective heating surface is gradually reduced, and the flow rate of the flue gas is increased. The ash self-cleaning ability is improved. In the industrial production, the incinerator is equipped with an automatic cleaning device, and the heating surface is kept clean by continuous cleaning.
5. Conclusions
In the design and construction of the pilot-scale incinerator, a comprehensive experimental study on the hot combustion of waste liquid was carried out. The experimental research shows that the waste liquid has good combustion performance, stable operating conditions, comprehensive analysis of different combustion conditions, and air distribution. The following is the temperature of the furnace, the emission of smoke pollutants, the adhesion of alkali ash, etc.
- The CO measurement data in the flue gas after combustion of the waste liquid decreases with the increase of the excess air coefficient, decreases with the increase of the primary air rate, and has a positive correlation between the steam production and the CO concentration. Under the test condition of excess air coefficient of 1.2, steam production is the closest to the theoretical calculations. The temperature of the furnace is greatly affected by the distribution air. The higher the primary air rate, the more concentrated the combustion. The higher the temperature of the primary air region, the longer the primary combustion rate is, the longer the main combustion area is, and the furnace outlet temperature will decrease.
- The NO concentration in the flue gas combustion has a negative correlation with the CO concentration. The SO2 concentration has a positive correlation with the CO concentration, and the NO concentration has a negative correlation with the SO2 concentration. Increasing the excess air ratio is beneficial to improve the combustion efficiency, and can greatly reduce SO2 emissions, while satisfying the condition that the SO2 and NO production concentrations in the flue gas are less than 10 ppm.
- The TG-DTA method was used to determine that the alkali ash melting temperature was less than 687 °C, and specifically, that the fly ash melting temperature was 651 ° C. The deposition amount of alkali ash on the heating surface decreased with the decrease of flue gas temperature, and the deposition bond in the high temperature zone of the furnace was severe. The low temperature zone of the economizer was relatively clean, and the average deposition rate of alkali ash in the combustion chamber and the boiling tube screen was 5.57 × 10⁻² kg/m2∙h and 0.93 × 10⁻² kg/m2∙h for the incinerator. The relative alkali ash deposition rate of the incinerator was as high as 87.8%, indicating that the alkali ash has a very strong cohesiveness.
Author Contributions
D.W., G.Z., and L.W. conceived and designed the experiments; D.W. and L.W. performed the experiments; D.F. and C.D. analyzed the data; D.W. contributed reagents/materials/analysis tools; D.W. wrote the paper.
Funding
This work was funded by the National Natural Science Foundation of China (51906052) and the National Postdoctoral Program for Innovative Talents of China (BX20180086), China Postdoctoral Science Foundation Funded Project (2018M641826), Heilongjiang Provincial Postdoctoral Science Foundation, Foundation of State Key Laboratory of High-Efficiency Utilization of Coal and Green Chemical Engineering (2018-K20) and Fundamental Research Funds for the Central Universities (Grant No. HIT. NSRIF. 2020052).
Conflicts of Interest
The authors declare no conflict of interest.
References
- Kamm, B.; Gruber, P.R.; Kamm, M. Biorefineries – Industrial Processes and Products: Status Quo and Future Directions; Wiley-VCH: Weinheim, Germany, 2010. [Google Scholar]
- Feng, D.; Zhao, Y.; Zhang, Y.; Xu, H.; Zhang, L.; Sun, S. Catalytic mechanism of ion-exchanging alkali and alkaline earth metallic species on biochar reactivity during CO2/H2O gasification. Fuel 2018, 212, 523–532. [Google Scholar] [CrossRef]
- Feng, D.; Zhang, Y.; Zhao, Y.; Sun, S. Catalytic Effects of Ion-Exchangeable K+ and Ca2+ on Rice Husk Pyrolysis Behavior and its Gas–Liquid–Solid Product Properties. Energy 2018, 152, 166–177. [Google Scholar] [CrossRef]
- Sun, H.; Feng, D.; Zhao, Y.; Guo, D.; Ma, Y.; Tan, H.; Sun, S. Characteristics of Gas–Liquid–Solid Products in Corn Straw Gasification: Effect of the Char–Tar–H2O Interaction. Energy Fuels 2019, 33, 9974–9984. [Google Scholar] [CrossRef]
- Cruz-Aldaco, K.; Flores-Loyola, E.; Aguilar-González, C.N.; Burgos, N.; Jiménez, A. Synthesis and Thermal Characterization of Polyurethanes Obtained from Cottonseed and Corn Oil-Based Polyols. J. Renew. Mater. 2016, 4, 178–184. [Google Scholar] [CrossRef]
- Chang, G.; Miao, P.; Wang, H.; Wang, L.; Hu, X.; Guo, Q. A synergistic effect during the co-pyrolysis of Nannochloropsis sp. and palm kernel shell for aromatic hydrocarbon production. Energy Convers. Manag. 2018, 173, 545–554. [Google Scholar] [CrossRef]
- Wang, D.W.; Hu, C.W.; Tang, L.; Wang, B.H. Combustion Method of Biochemical Polyol Boiler. China’s Patent Application No. CN103486573A, 6 June 2012. [Google Scholar]
- Zhao, Y.; Feng, D.; Zhang, Y.; Huang, Y.; Sun, S. Effect of pyrolysis temperature on char structure and chemical speciation of alkali and alkaline earth metallic species in biochar. Fuel Process. Technol. 2016, 141, 54–60. [Google Scholar] [CrossRef]
- Wang, D.; Du, C.; Feng, D.; Li, Y.; Zhao, Y.; Zhao, G. Thermal Swelling Properties of Plant Chemical Alcohol Waste Liquid. Energies 2019, 12, 4184–4194. [Google Scholar] [CrossRef]
- Zhong, J.; Han, G.; Chen, Q. Recent developments in treatment technology for highly saline organic wastewater. Chem. Ind. Eng. Prog. 2012, 31, 920–926. [Google Scholar]
- Chen, J.; Xie, J.; An, B. Study on Salty Organic Waste Incinerator. Ind. Boil. 2017, 116, 26–30. [Google Scholar]
- Li, Y. Experimental Investigation on the Combustion and Swelling Properties of Biological Chemical Glycol Waste Liquid; Harbin Institute of Technology: Harbin, China, 2014. [Google Scholar]
- Zhao, L.; Tran, H.; Maki, K. Combustion behaviors of lignin-lean black liquor and lignin. Tappi J. 2015, 14, 451–458. [Google Scholar] [CrossRef]
- Chen, C.; Alén, R.; Lehto, J. Combustion properties of spruce black liquor droplets: Sulfur-free pulping and influence of hot-water pretreatment. Nord. Pulp Pap. Res. J. 2016, 31, 531–540. [Google Scholar] [CrossRef]
- Hupa, M.; Solin, P.; Hyoty, P. Combustion Behavior of Black Liquor Droplets; TAPPI PRESS: Atlanta, GA, USA, 1986; pp. 335–344. [Google Scholar]
- Engblom, M. Modeling and Field Observations of Char Bed Processes in Black Liquor Recovery Boilers; Åbo Akademi University: Turku, Finland, 2010. [Google Scholar]
- Järvinen, M.; Zevenhoven, R.; Vakkilainen, E.; Forssén, M. Black liquor devolatilization and swelling—A detailed droplet model and experimental validation. Biomass Bioenergy 2003, 24, 495–509. [Google Scholar] [CrossRef]
- Bai, B.; Guo, Q.; Li, Y.; Hu, X.; Ma, J. Catalytic gasification of crushed coke and changes of structural characteristics. Energy Fuels 2018, 32, 3356–3367. [Google Scholar] [CrossRef]
- Dayton, D.C. Direct Observation of Alkali Vapor Release during Biomass Combustion and Gasification. 2. Black Liquor Combustion at 1100 °C. Energy Fuels 1996, 10, 284–292. [Google Scholar] [CrossRef]
- Saw, W.L.; Nathan, G.J.; Ashman, P.J.; Alwahabi, Z.T.; Hupa, M. Simultaneous measurement of the surface temperature and the release of atomic sodium from a burning black liquor droplet. Combust. Flame 2010, 157, 769–777. [Google Scholar] [CrossRef]
- Saw, W.L.; Nathan, G.J.; Ashman, P.J.; Hupa, M. Influence of droplet size on the release of atomic sodium from a burning black liquor droplet in a flat flame. Fuel 2010, 89, 1840–1848. [Google Scholar] [CrossRef]
- Kevin, W.; Mika, K.; Vesa, S.; Rainer, B.; Mikko, H. Influence of pressure on pyrolysis of black liquor: 2. Char yields and component release. Bioresour. Technol. 2008, 99, 671–679. [Google Scholar]
- Bernath, P.; Sinquefield, S.A.; Baxter, L.L.; Sclippa, G.; Rohlfing, C.M.; Barfield, M. In situ analysis of ash deposits from black liquor combustion. Vib. Spectrosc. 1998, 16, 95–103. [Google Scholar] [CrossRef]
- Jorshari, K.R. Effects of Potassium and Carbonate on the Deposition of Synthetic Recovery Boiler Carryover Particles; University of Toronto: Toronto, ON, Canada, 2000. [Google Scholar]
- Veverka, P.J.; Nichols, K.M.; Horton, R.R. On the form of nitrogen in wood and its fate during kraft pulping. In Proceedings of the TAPPI Environmental Conference; TAPPI Press: Atlanta, GA, USA, 1993; pp. 777–780. [Google Scholar]
- Wang, Y.; Hu, X.; Hao, J.; Ma, R.; Guo, Q.; Gao, H.; Bai, H. Nitrogen and Oxygen Codoped Porous Carbon with Superior CO2 Adsorption Performance: A Combined Experimental and DFT Calculation Study. Ind. Eng. Chem. Res. 2019, 58, 13390–13400. [Google Scholar] [CrossRef]
- Forssén, M.; Hupa, M.; Pettersson, R. Nitrogen oxide formation during black liquor char combustion and gasification. J. Pulp Pap. Sci. 1997, 23, 439–446. [Google Scholar]
- DeMartini, N. Conversion Kinetics for Smelt Anions: Cyanate and Sulfide; Åbo Akademi University: Turku, Finland, 2004. [Google Scholar]
- Demartini, N.; Forssén, M.; Niemela, K.; Samuelsson, Å.; Hupa, M. Release of nitrogen species from the recovery processes of three kraft pulp mills. Tappi J. 2003, 3, 3–8. [Google Scholar]
- Vähäsavo, N. Behavior of Black Liquor Nitrogen in Combustion: Formation of Cyanate; Åbo Akademi University: Turku, Finland, 2014. [Google Scholar]
- Vaha-Savo, N.; Demartini, N.; Hupa, M. Combustion of Black Liquor-Solid Biomass Mixtures in a Single Particle Reactor-Characteristics and Fate of Nitrogen. Energy Fuels 2011, 25, 4944–4951. [Google Scholar] [CrossRef]
- Vaha-Savo, N.; Demartini, N.; Hupa, M. Fate of biosludge nitrogen in black liquor evaporation and combustion. Tappi J. 2012, 11, 53–59. [Google Scholar] [CrossRef]
- Vähä-Savo, N.; Demartini, N.; Engblom, M.; Brink, A.; Hupa, M. The Fate of Char Nitrogen in Black Liquor Combustion—Cyanate Formation and Decomposition. Ind. Eng. Chem. Res. 2015, 54, 2831–2842. [Google Scholar] [CrossRef]
- Song, X.F.; Ji, X.Y.; Bie, H.P.; Liu, Q.Q.; Bie, R.S. Characteristics of gas and char generation study from reed black liquor particles (RBLP) pyrolysis in fluidized bed. Fuel 2015, 159, 89–97. [Google Scholar] [CrossRef]
- Nichols, K.M.; Lien, S.J. Formation of fuel NOx during black-liquor combustion. TAPPI J. 1993, 76, 185–191. [Google Scholar]
- Boonsongsup, L.; Iisa, K.; Frederick, W.J. Kinetics of the Sulfation of NaCl at Combustion Conditions. Indengchemres 1997, 36, 4212–4216. [Google Scholar] [CrossRef]
- Tran, H.; Frederick, W.J.; Iisa, K. Relationship between SO2 Emmisions and Precipitator Dust Composition in Recovery Boilers. In Proceedings of the TAPPI Engineering Conference; TAPPI Press: Atlanta, GA, USA, 2000. [Google Scholar]
- Wu, S.; Chen, X.; Xu, J.; Xiang w Hao, Y.; Zhao, M. Research on the SO2 and NOx Emission Characters of a 300 MW Circulating Fluidized Bed Boiler. Boil. Technol. 2015, 46, 31–34. [Google Scholar]
- Li, J.-J.; Zhang, Y.; Yang, H.-R.; Yang, Y.-M. Study of the effect of ash composition in coal on the kinetic parameters of NO reduction reaction by CO. J. China Coal Soc. 2016, 41, 2448–2453. [Google Scholar]
- Jin, F.-m. Technical Analysis on Emission Control Method of Recovery Boiler. China Pulp Pap. 2018, 37, 64–71. [Google Scholar]
- Adams, T.N.; Frederick, W.J.; Grace, T.M. Kraft Recovery Boilers; TAPPI Press: Atlanta, GA, USA, 1997; pp. 248–249. [Google Scholar]
- Wang, L. Experimental Study on Characteristics of Coal Ash Deposition; Harbin Institute of Technology: Harbin, China, 2015. [Google Scholar]
© 2019 by the authors. Licensee MDPI, Basel, Switzerland. This article is an open access article distributed under the terms and conditions of the Creative Commons Attribution (CC BY) license (http://creativecommons.org/licenses/by/4.0/).