Insight into the Pore Characteristics of a Saudi Arabian Tight Gas Sand Reservoir
Abstract
:1. Introduction
2. Methodology
2.1. Rock Sample Preparation
2.2. Porosity and Permeability
2.3. Petrographic and QEMSCAN Analyses
2.4. Nuclear Magnetic Resonance Measurements
2.5. High-Resolution Images of Samples
2.6. Electrical Resistivity Measurements
3. Results and Discussions
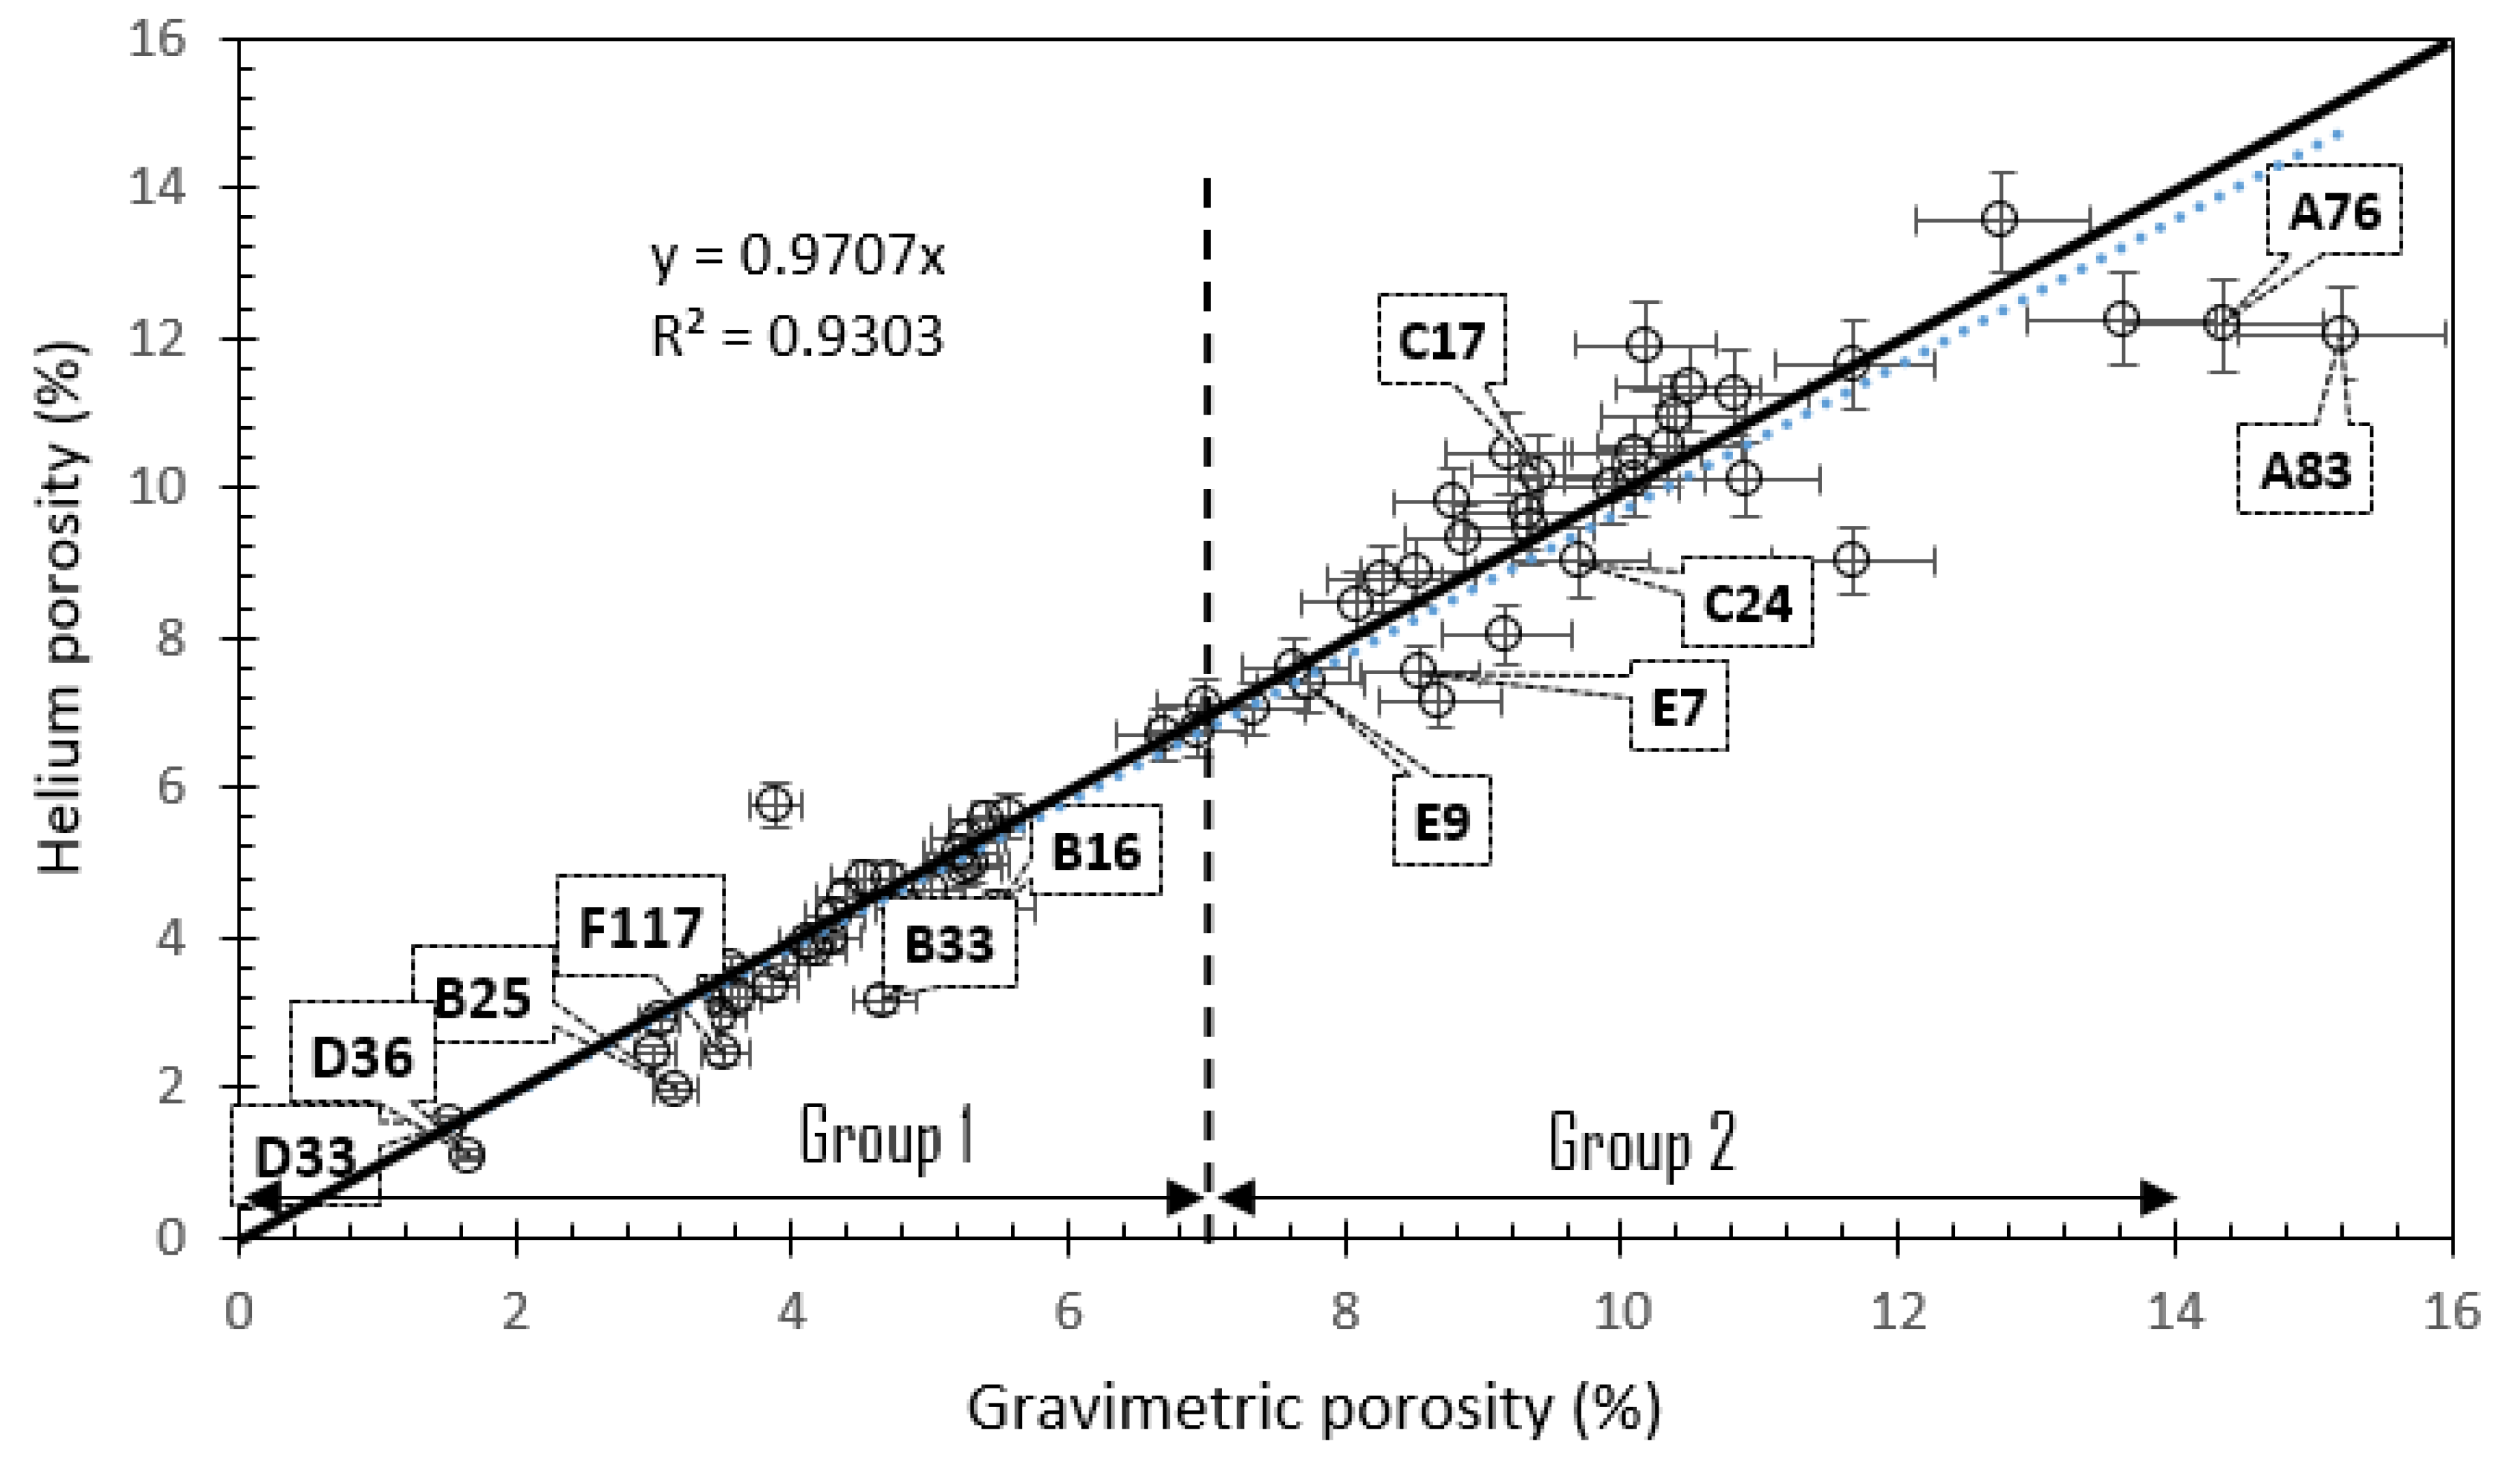
3.1. Porosity and Permeability
3.2. Porosity–Permeability Relationship
3.3. Facies Classification
3.4. Petrophysical Rock Typing
3.5. QEMSCAN Analysis
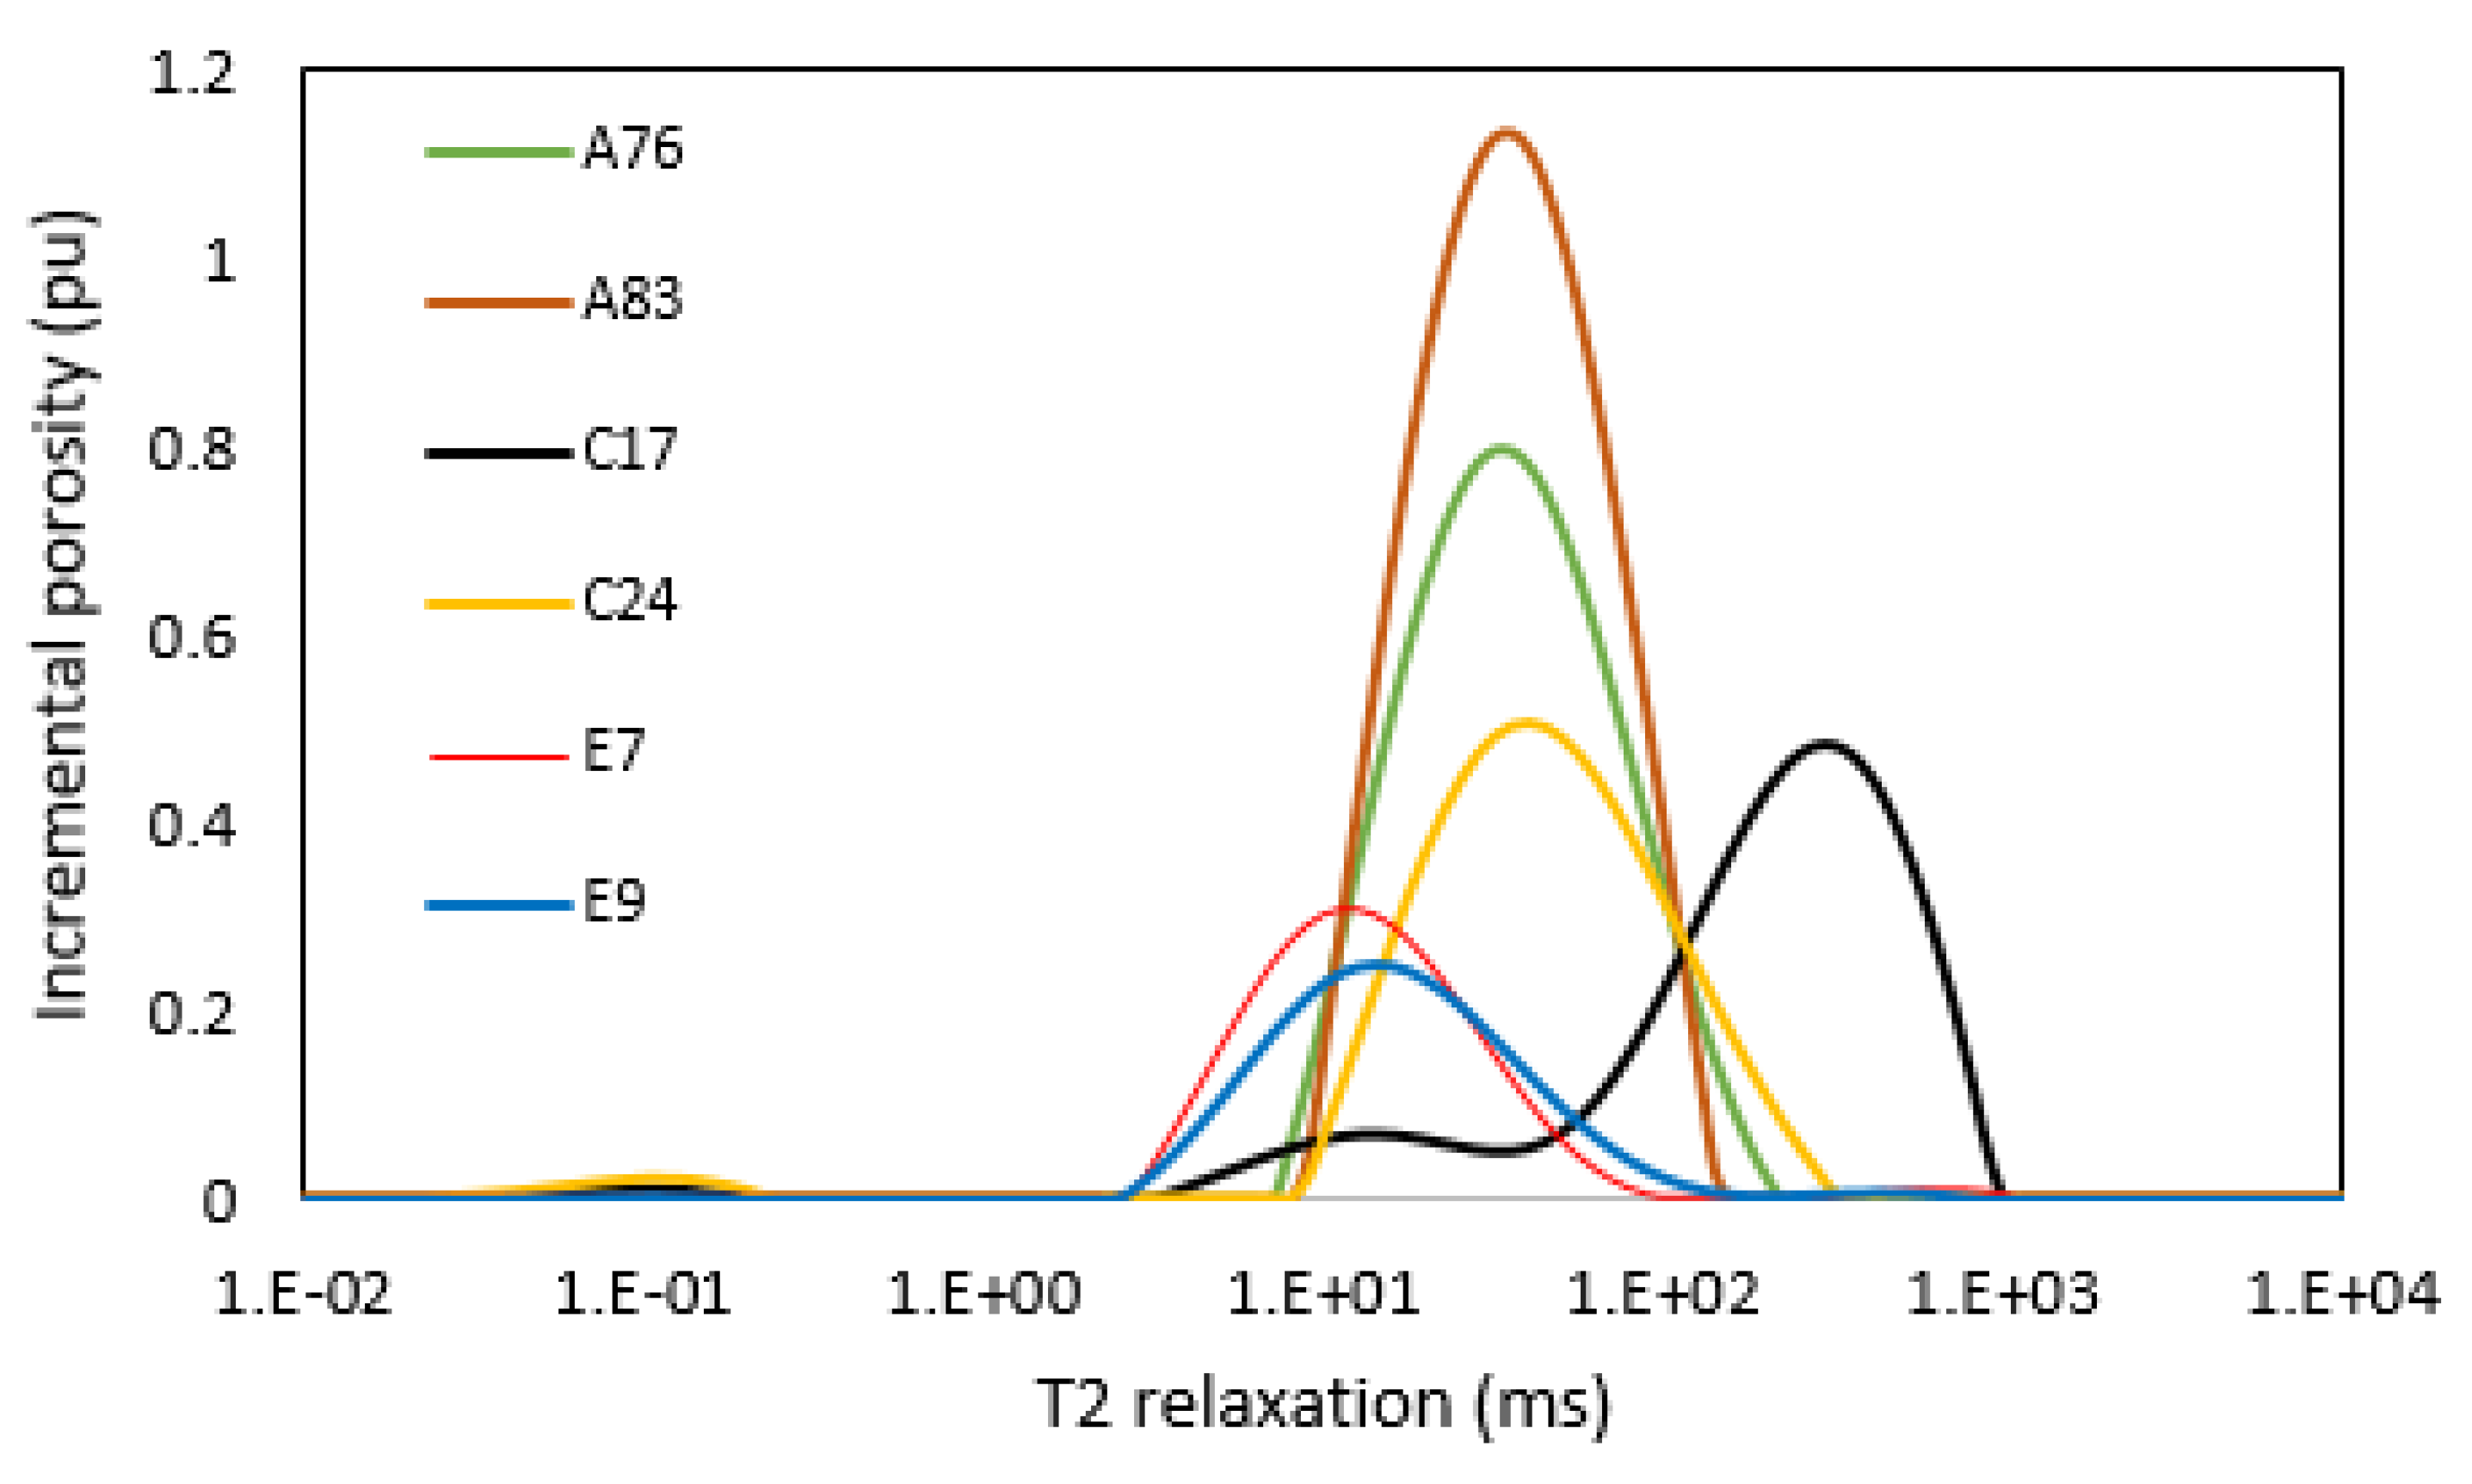
3.6. NMR T2 Distribution and Permeability
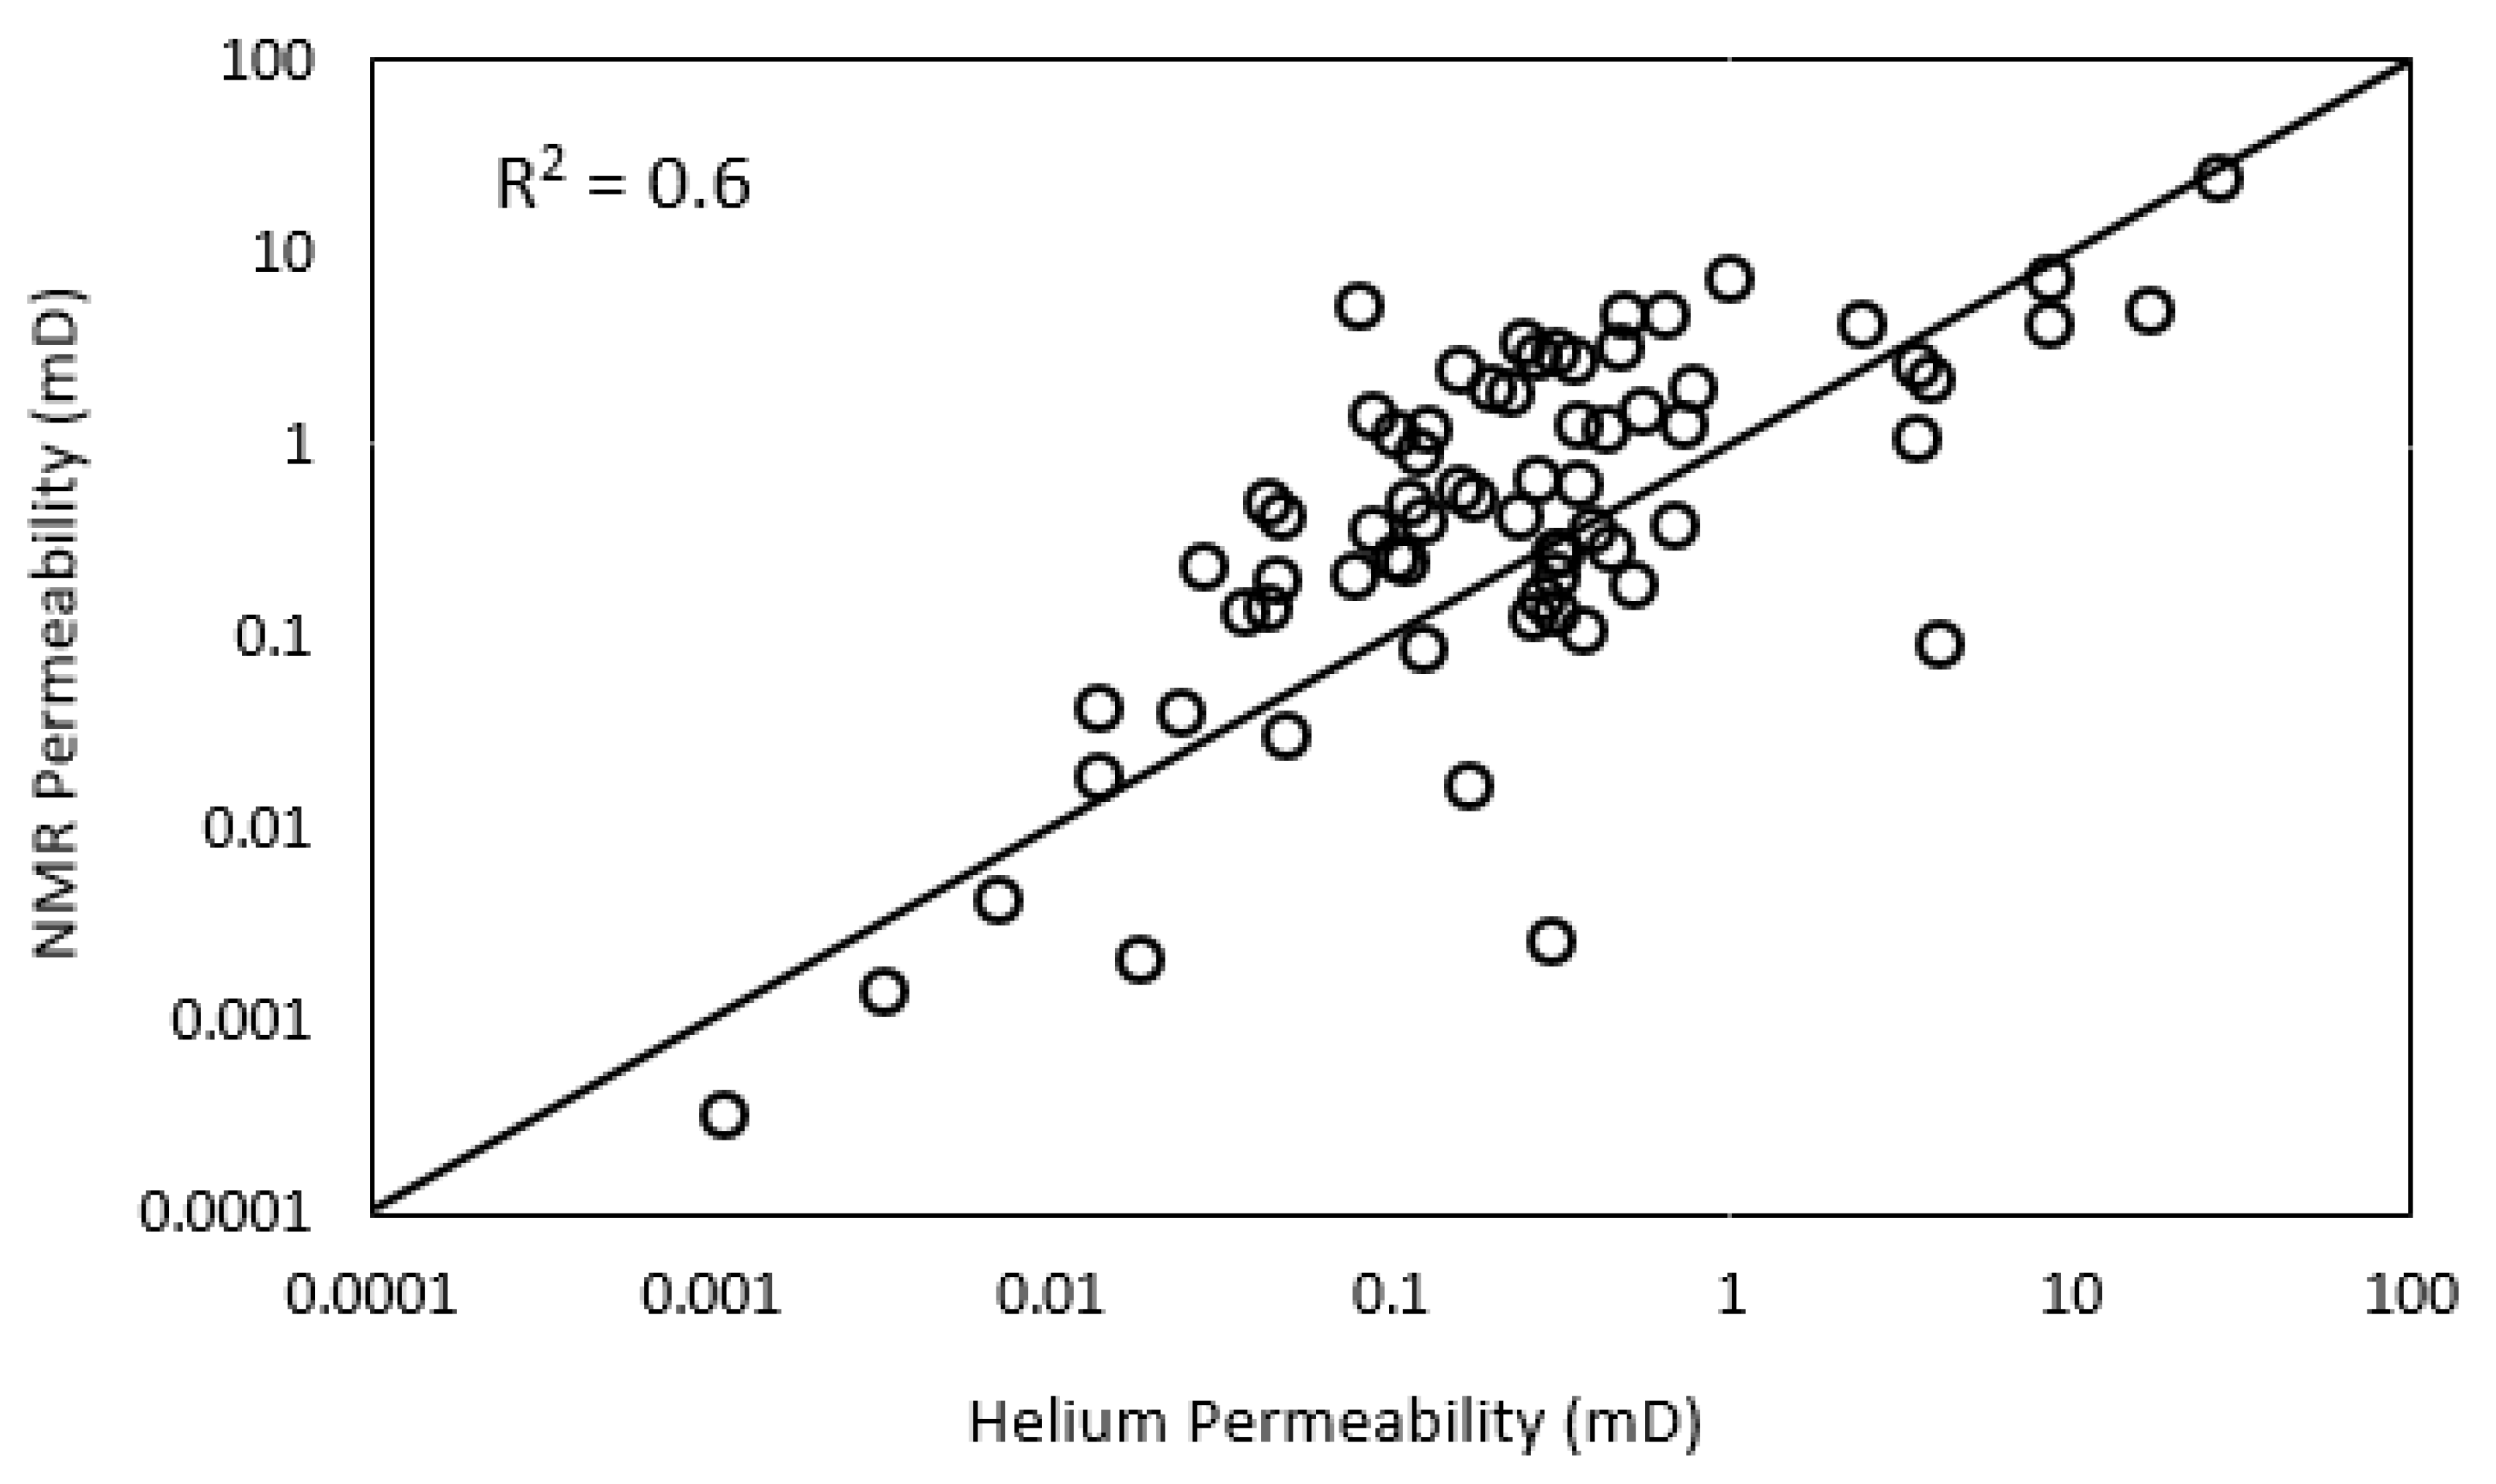
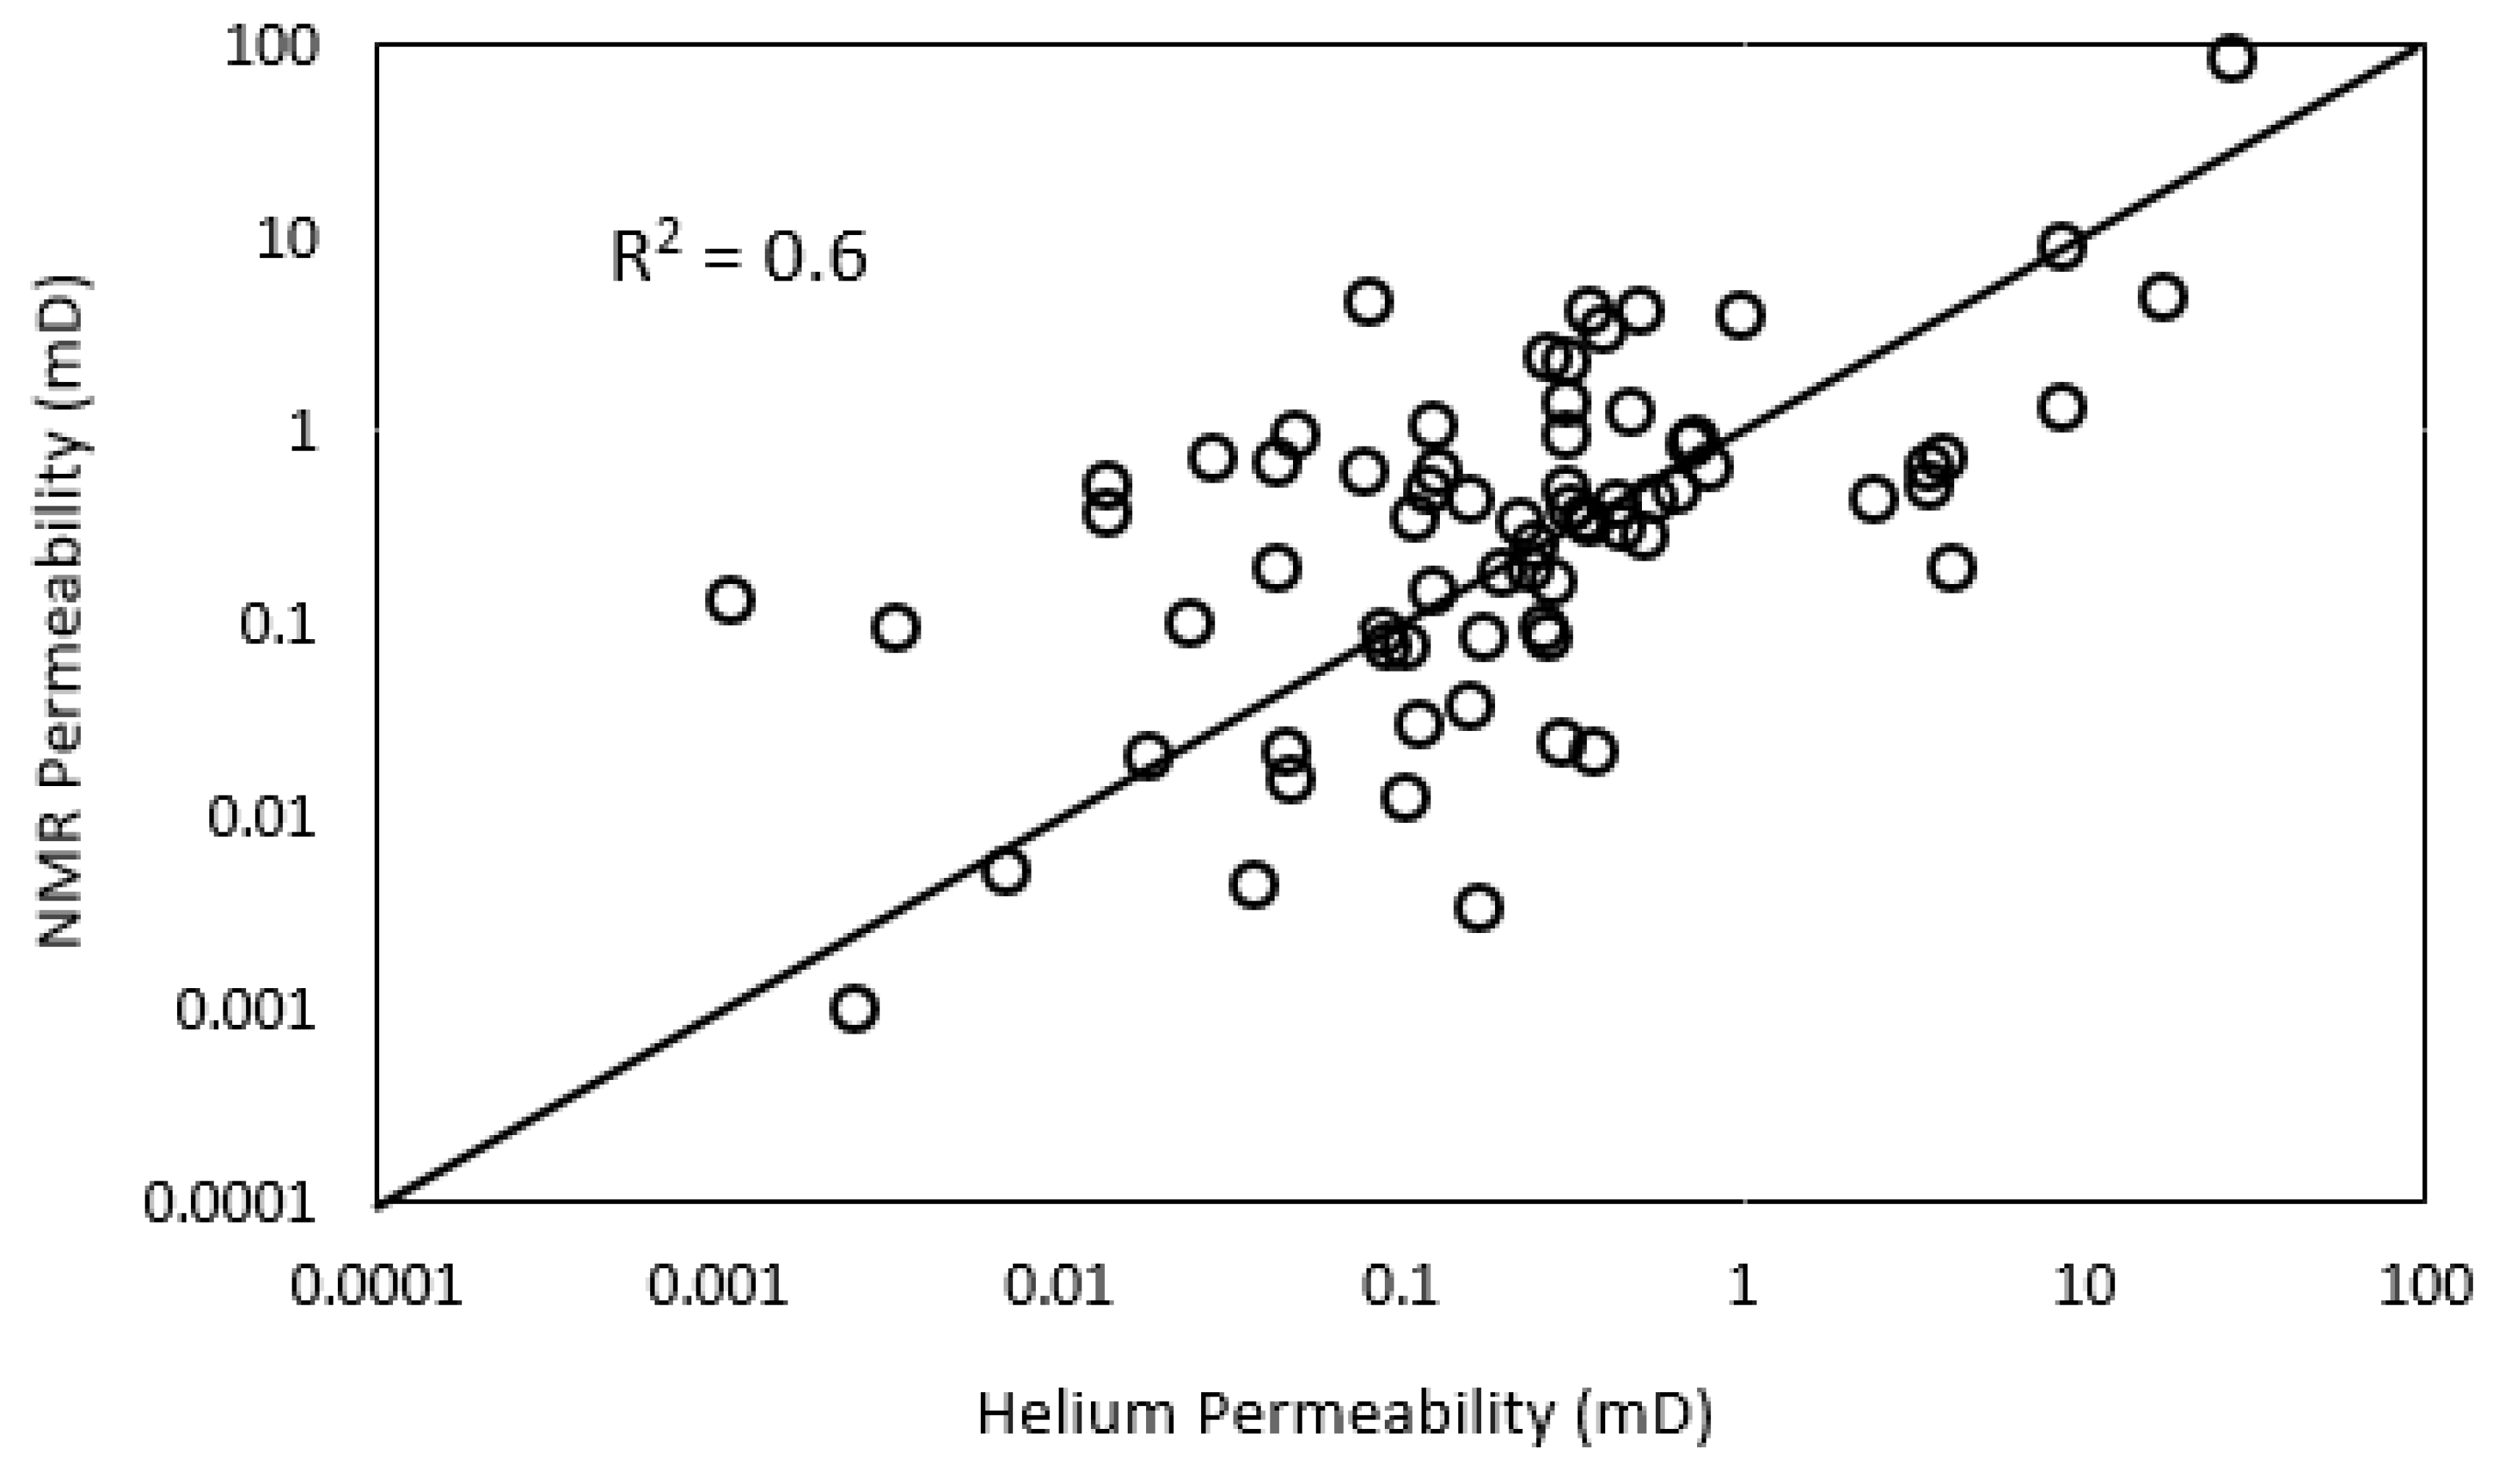
3.7. NMR Porosity and Permeability
3.8. High-Resolution CT Images
3.9. Formation Resistivity and Cementation Factors
4. Conclusions
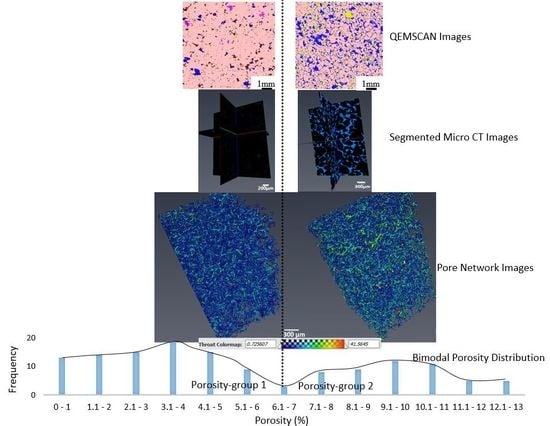
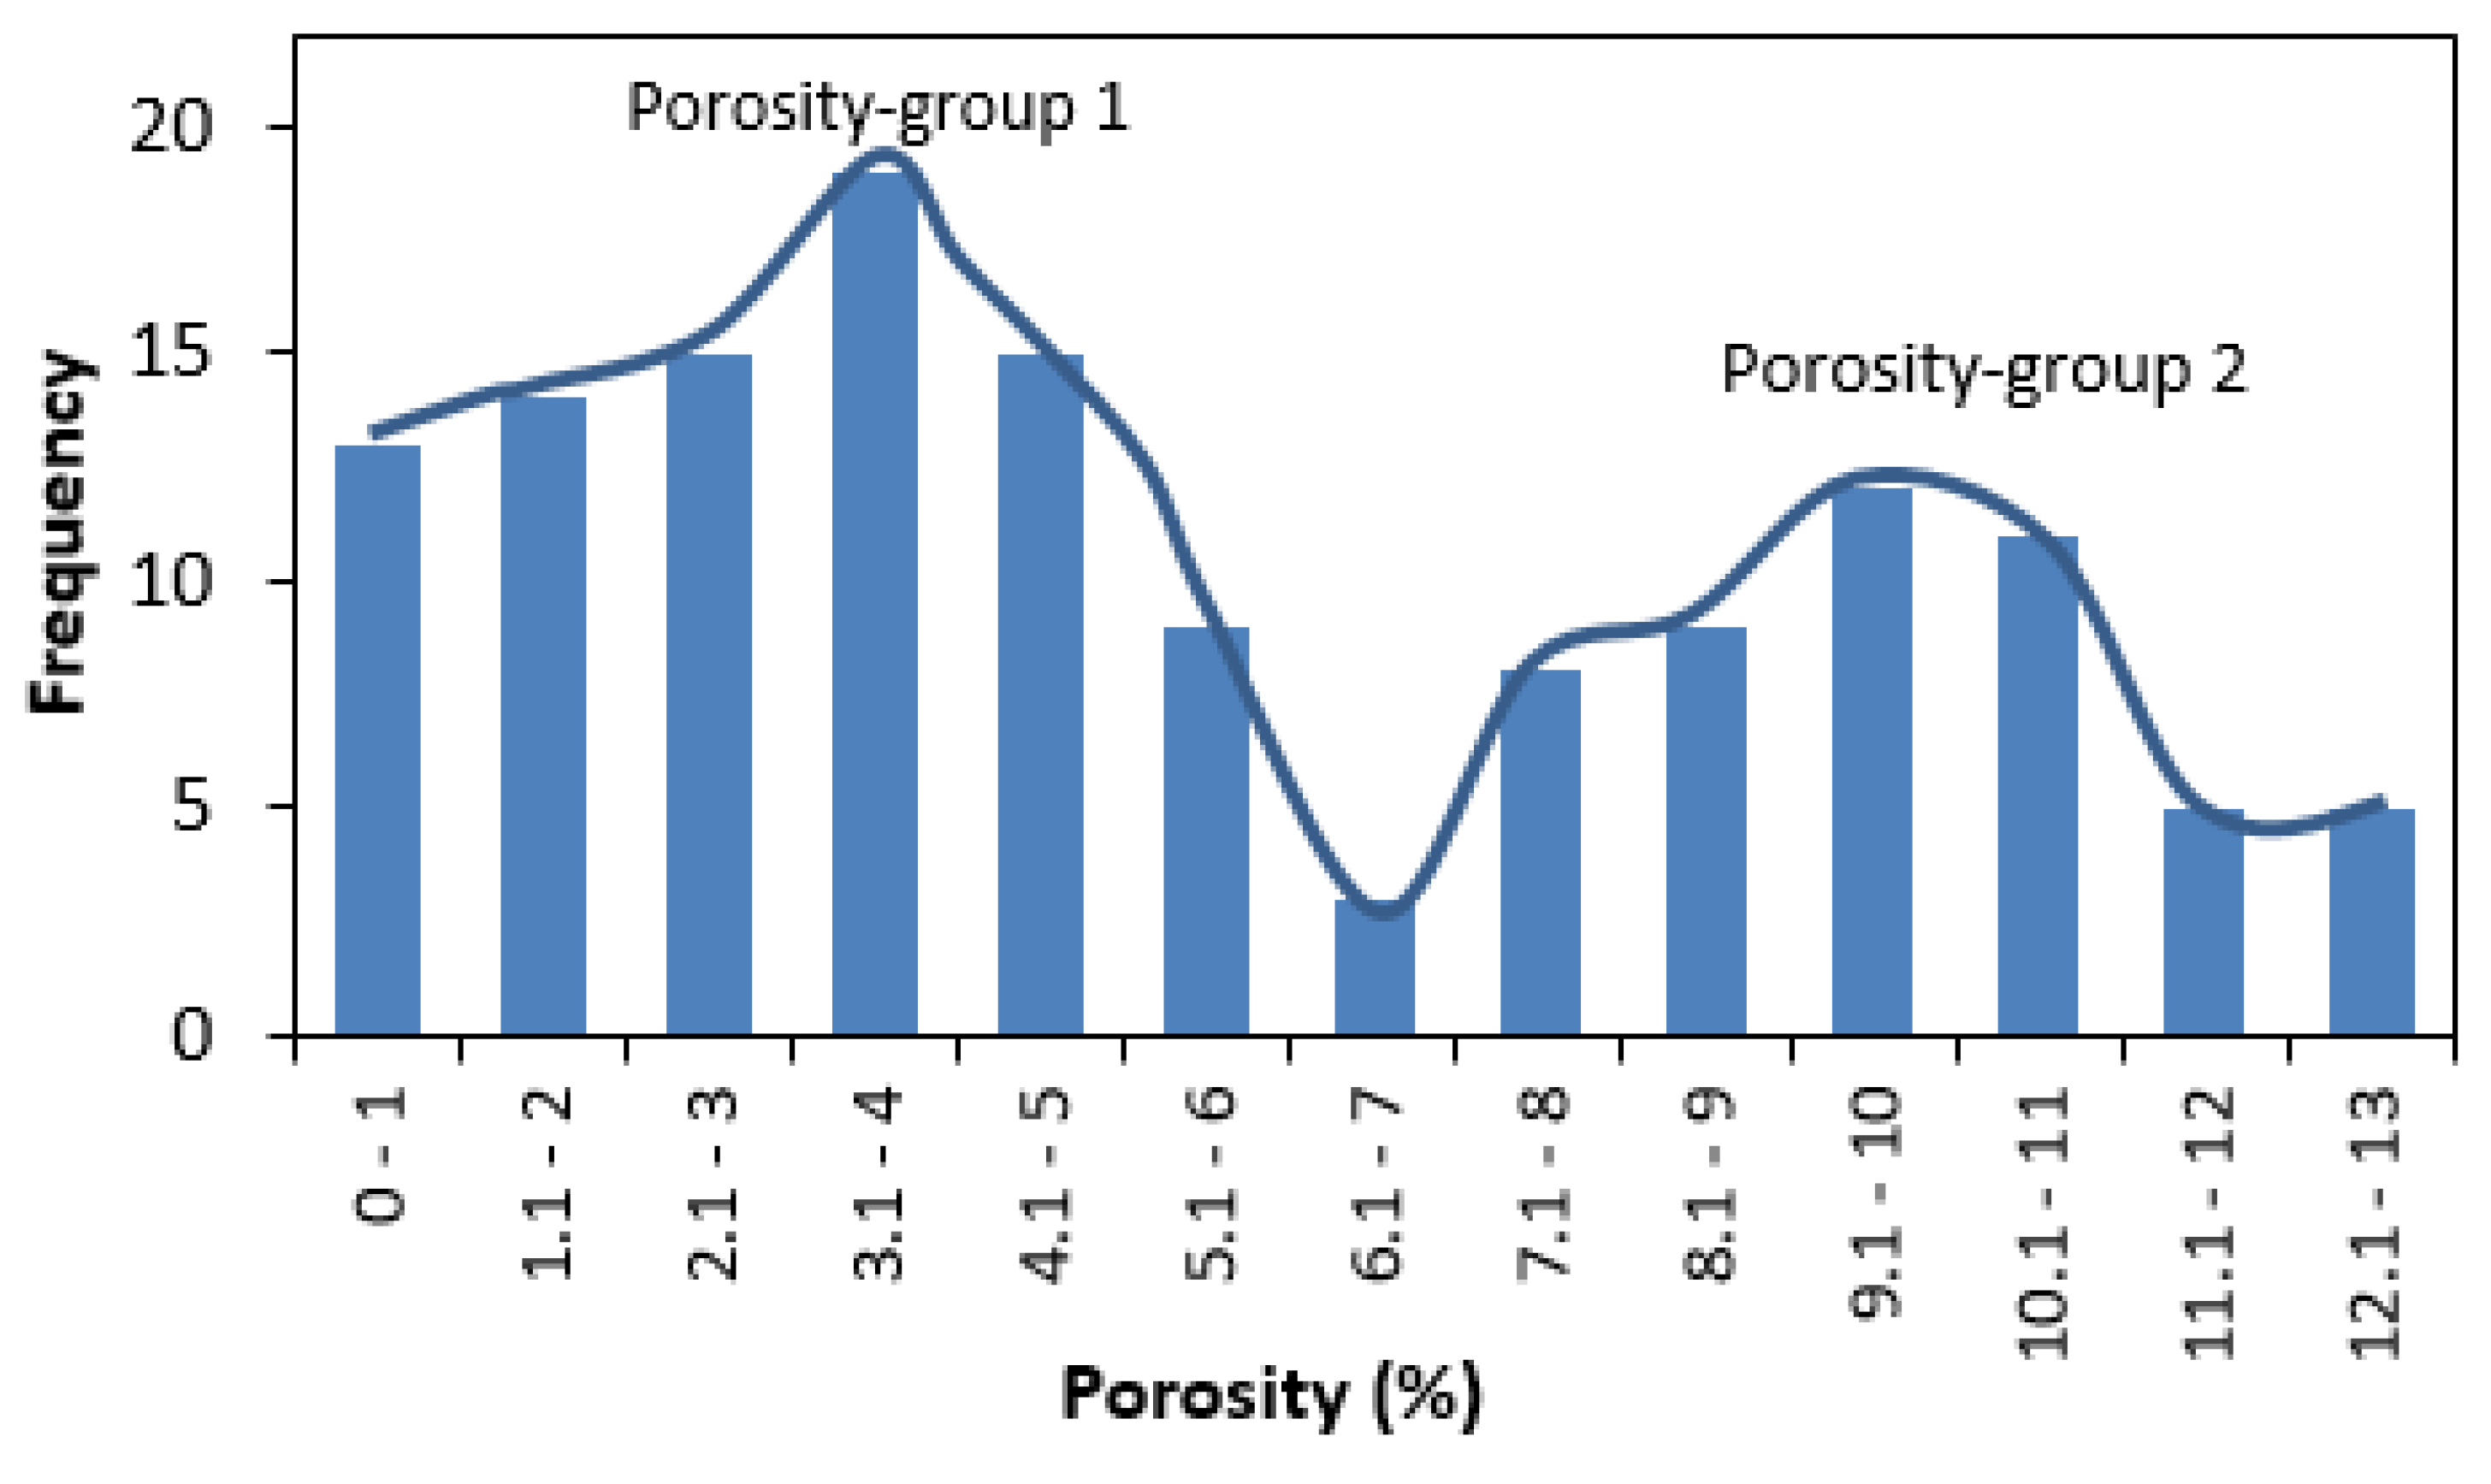
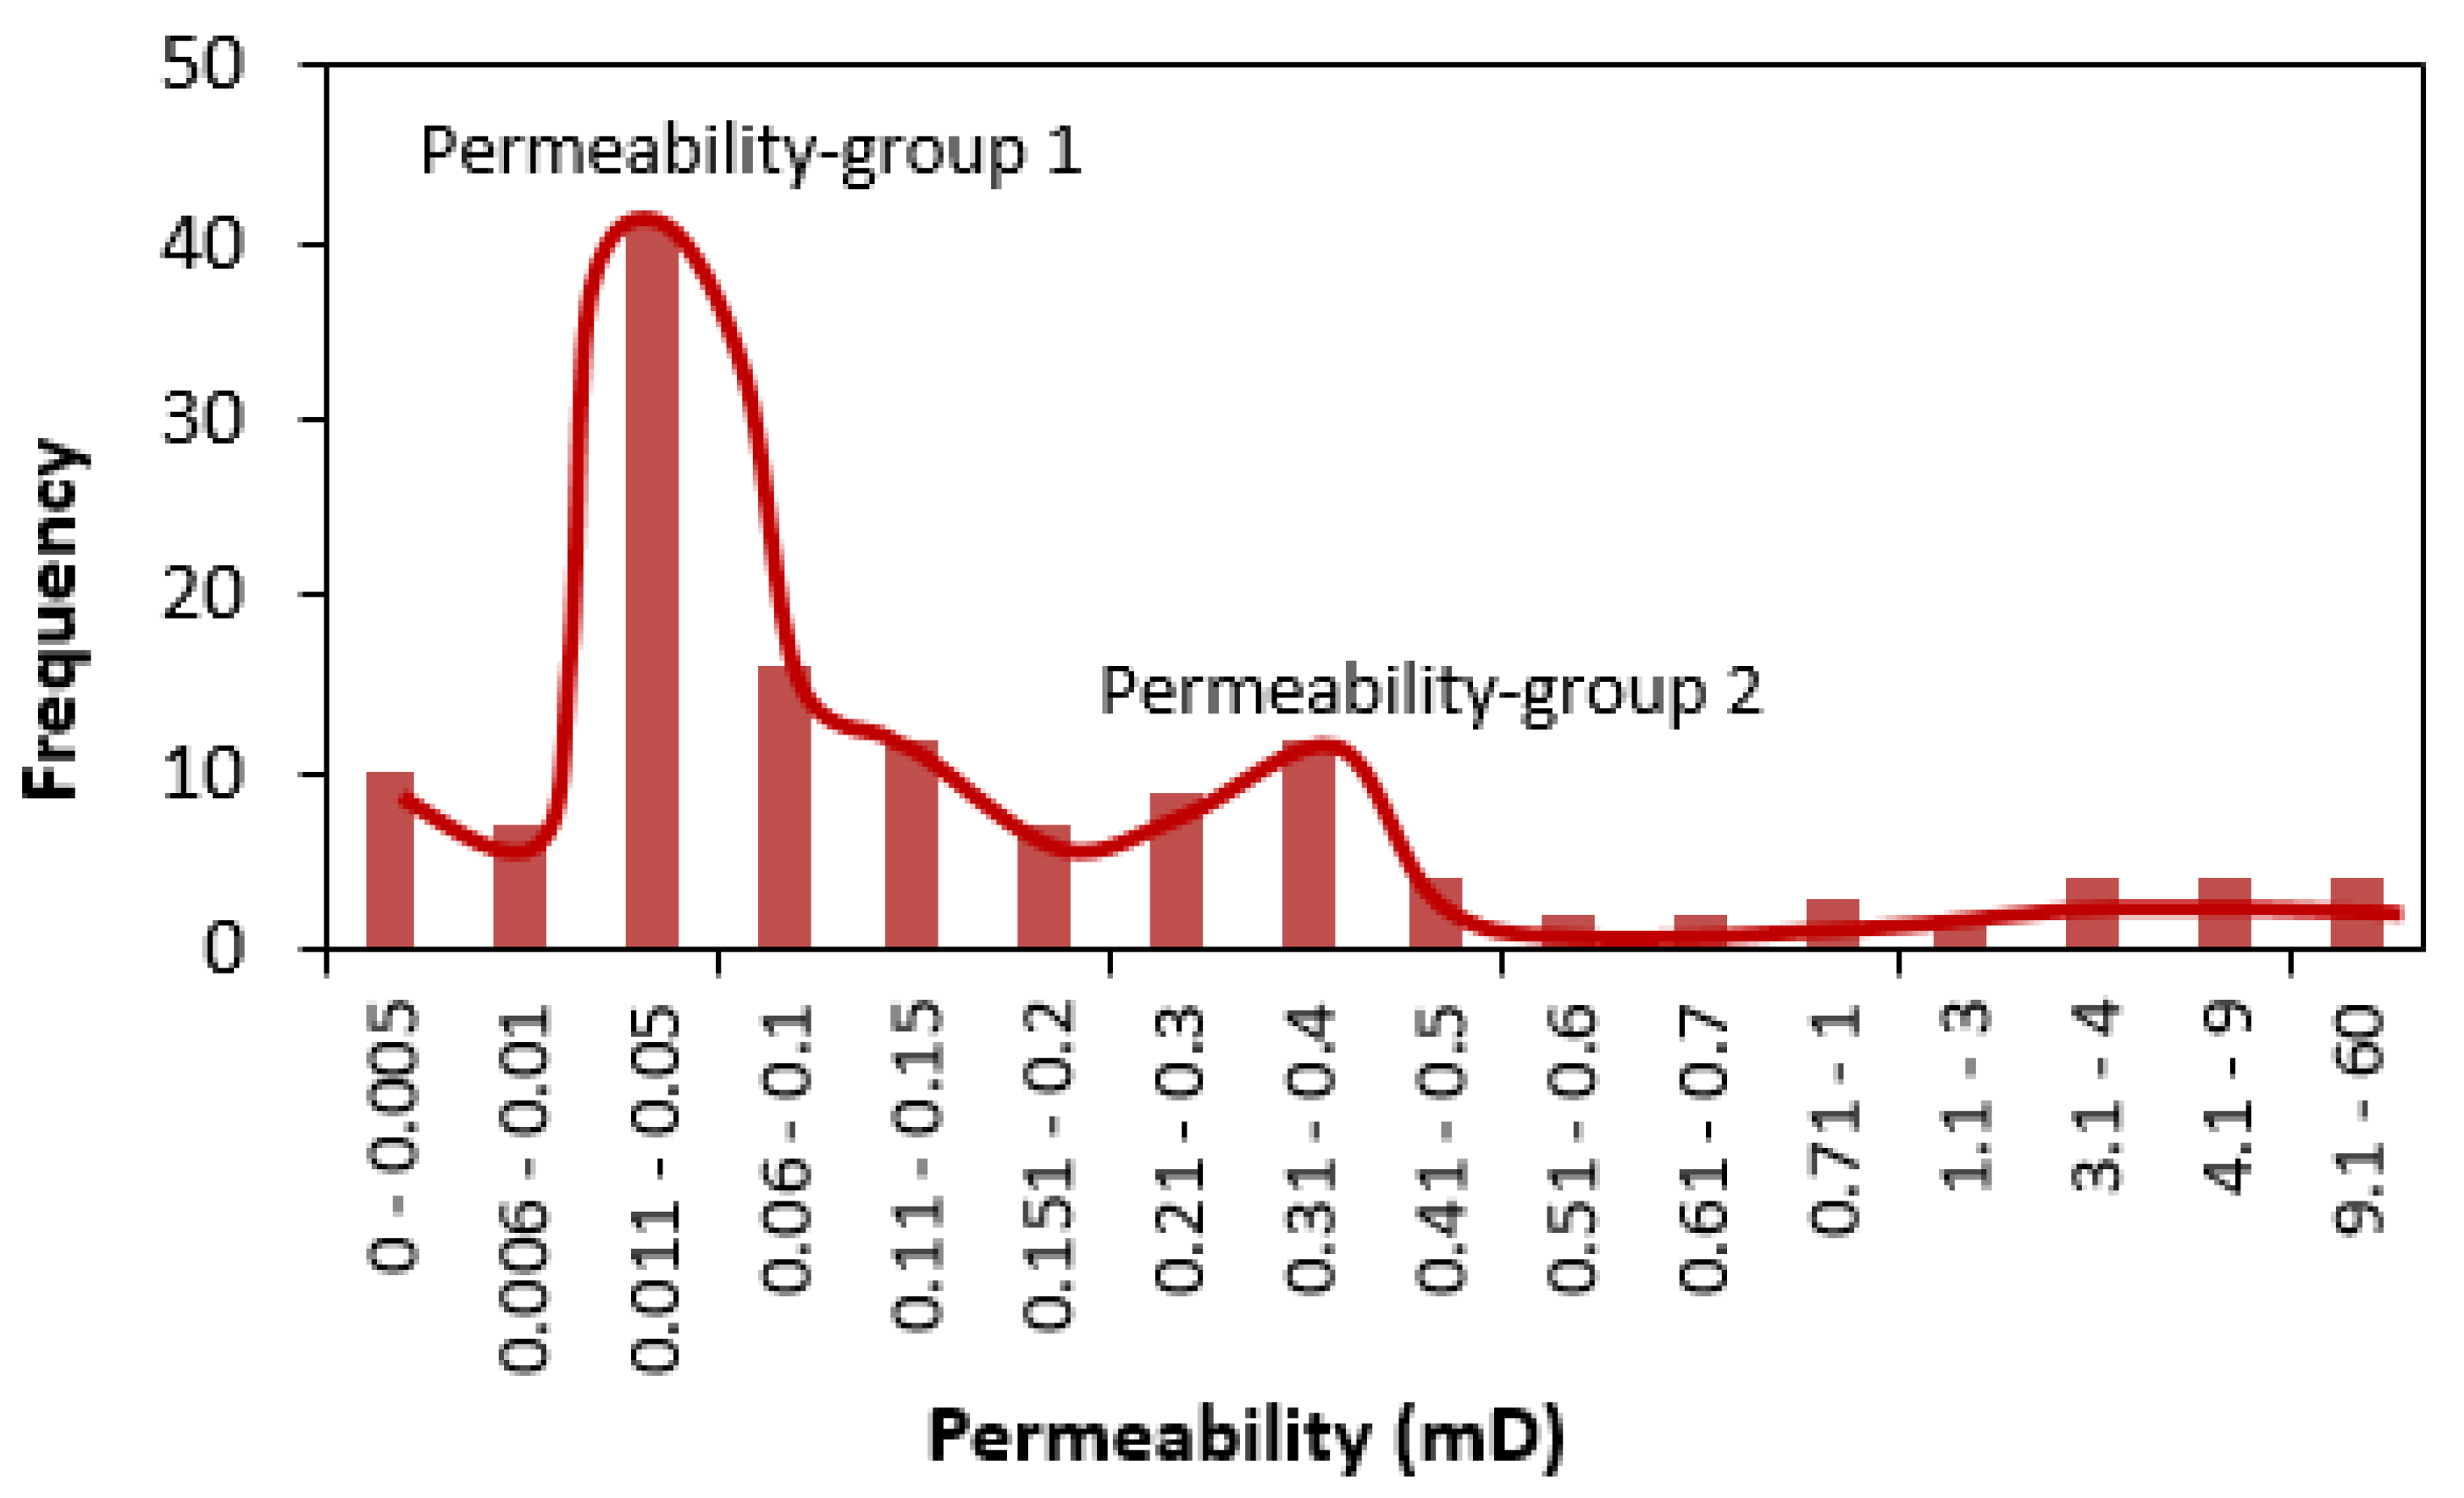
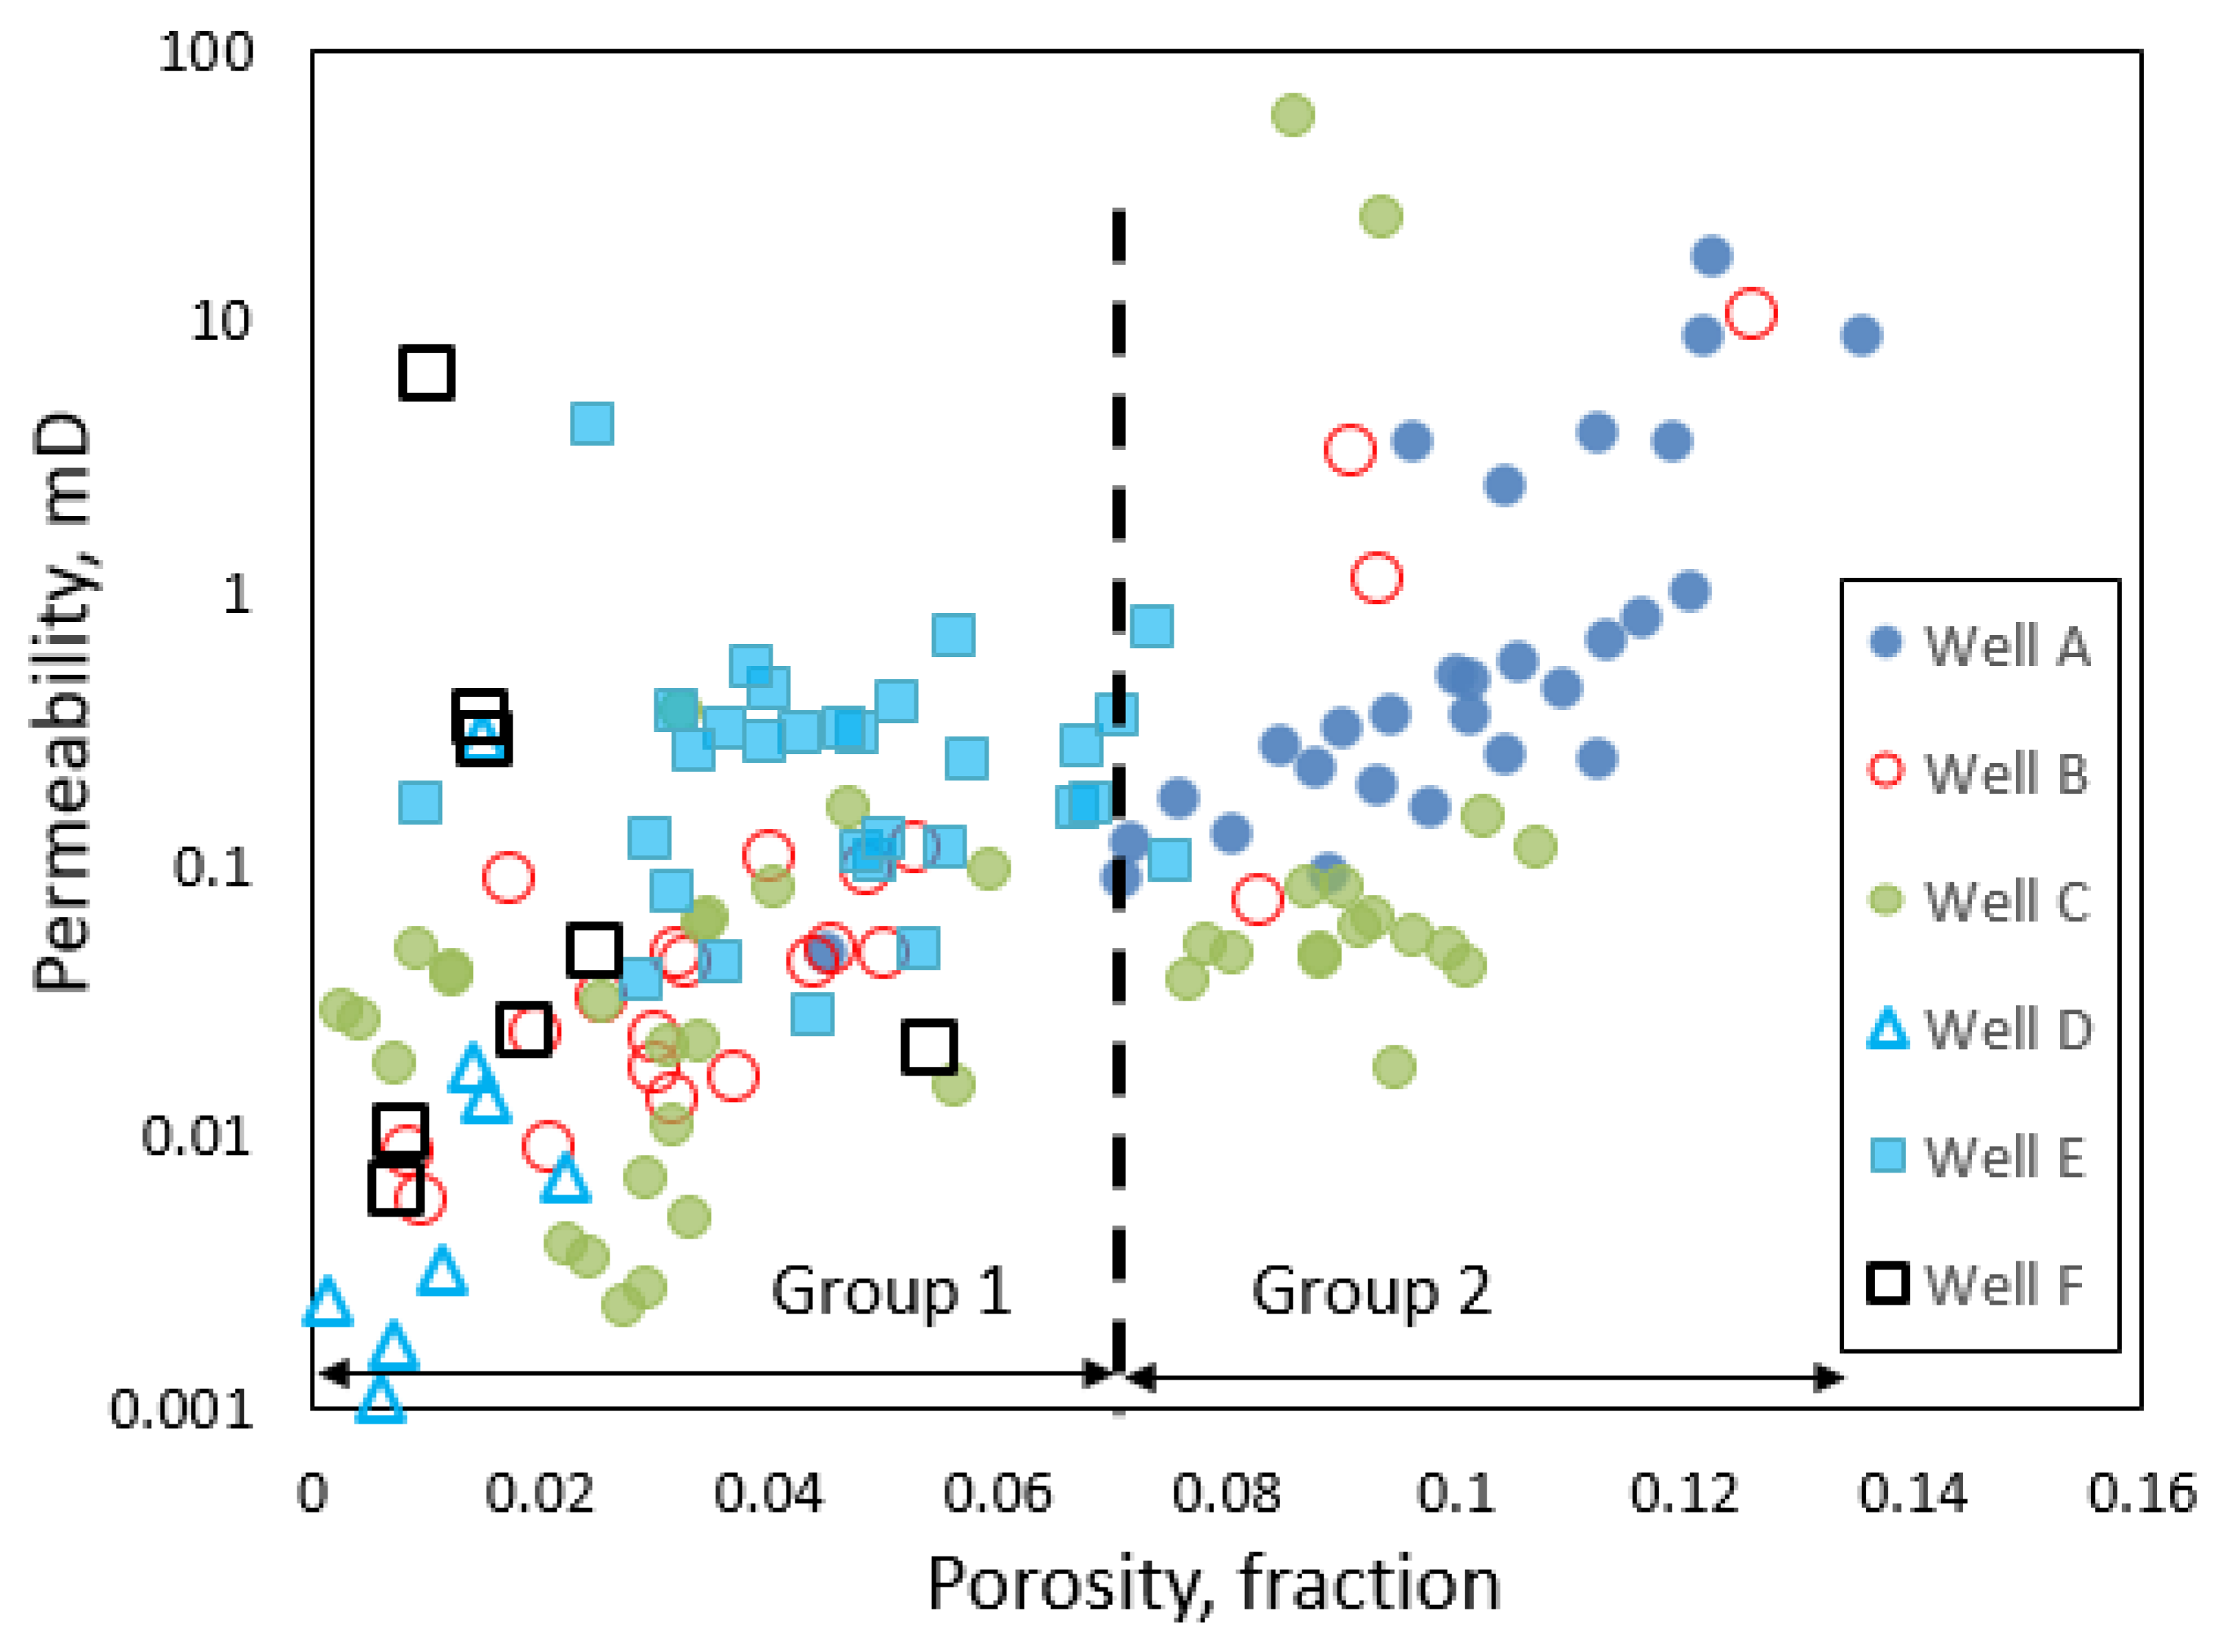
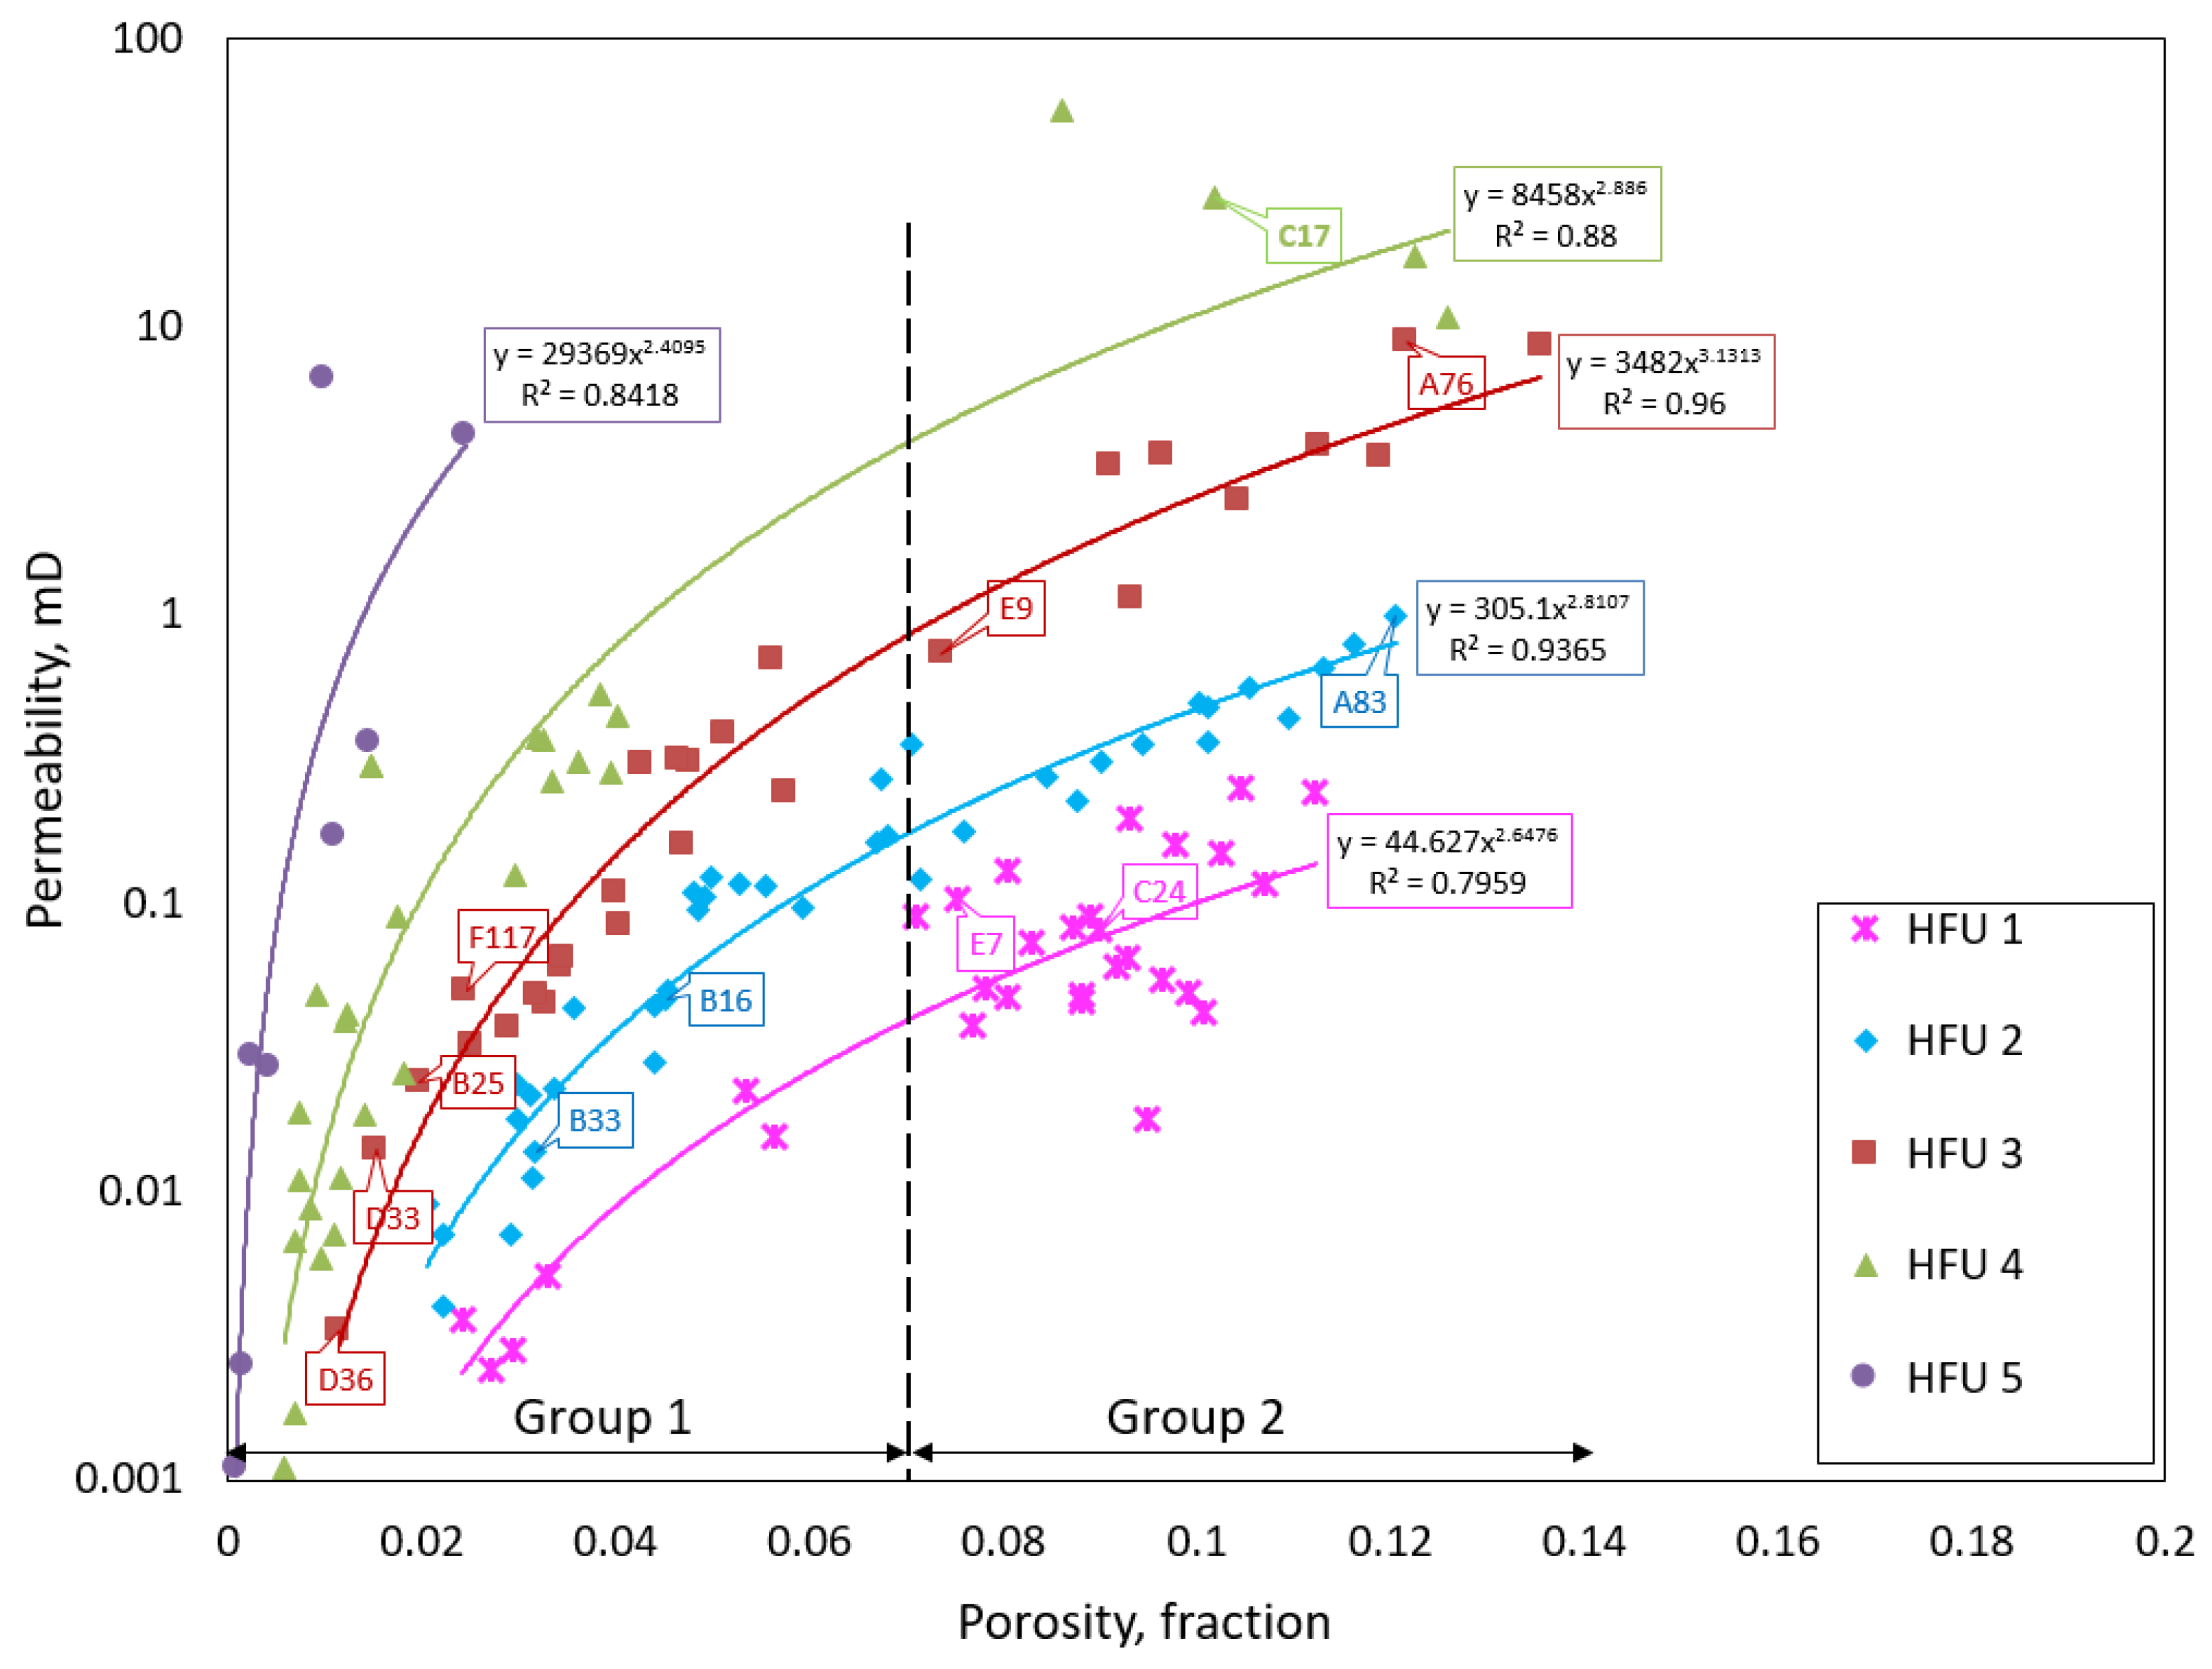
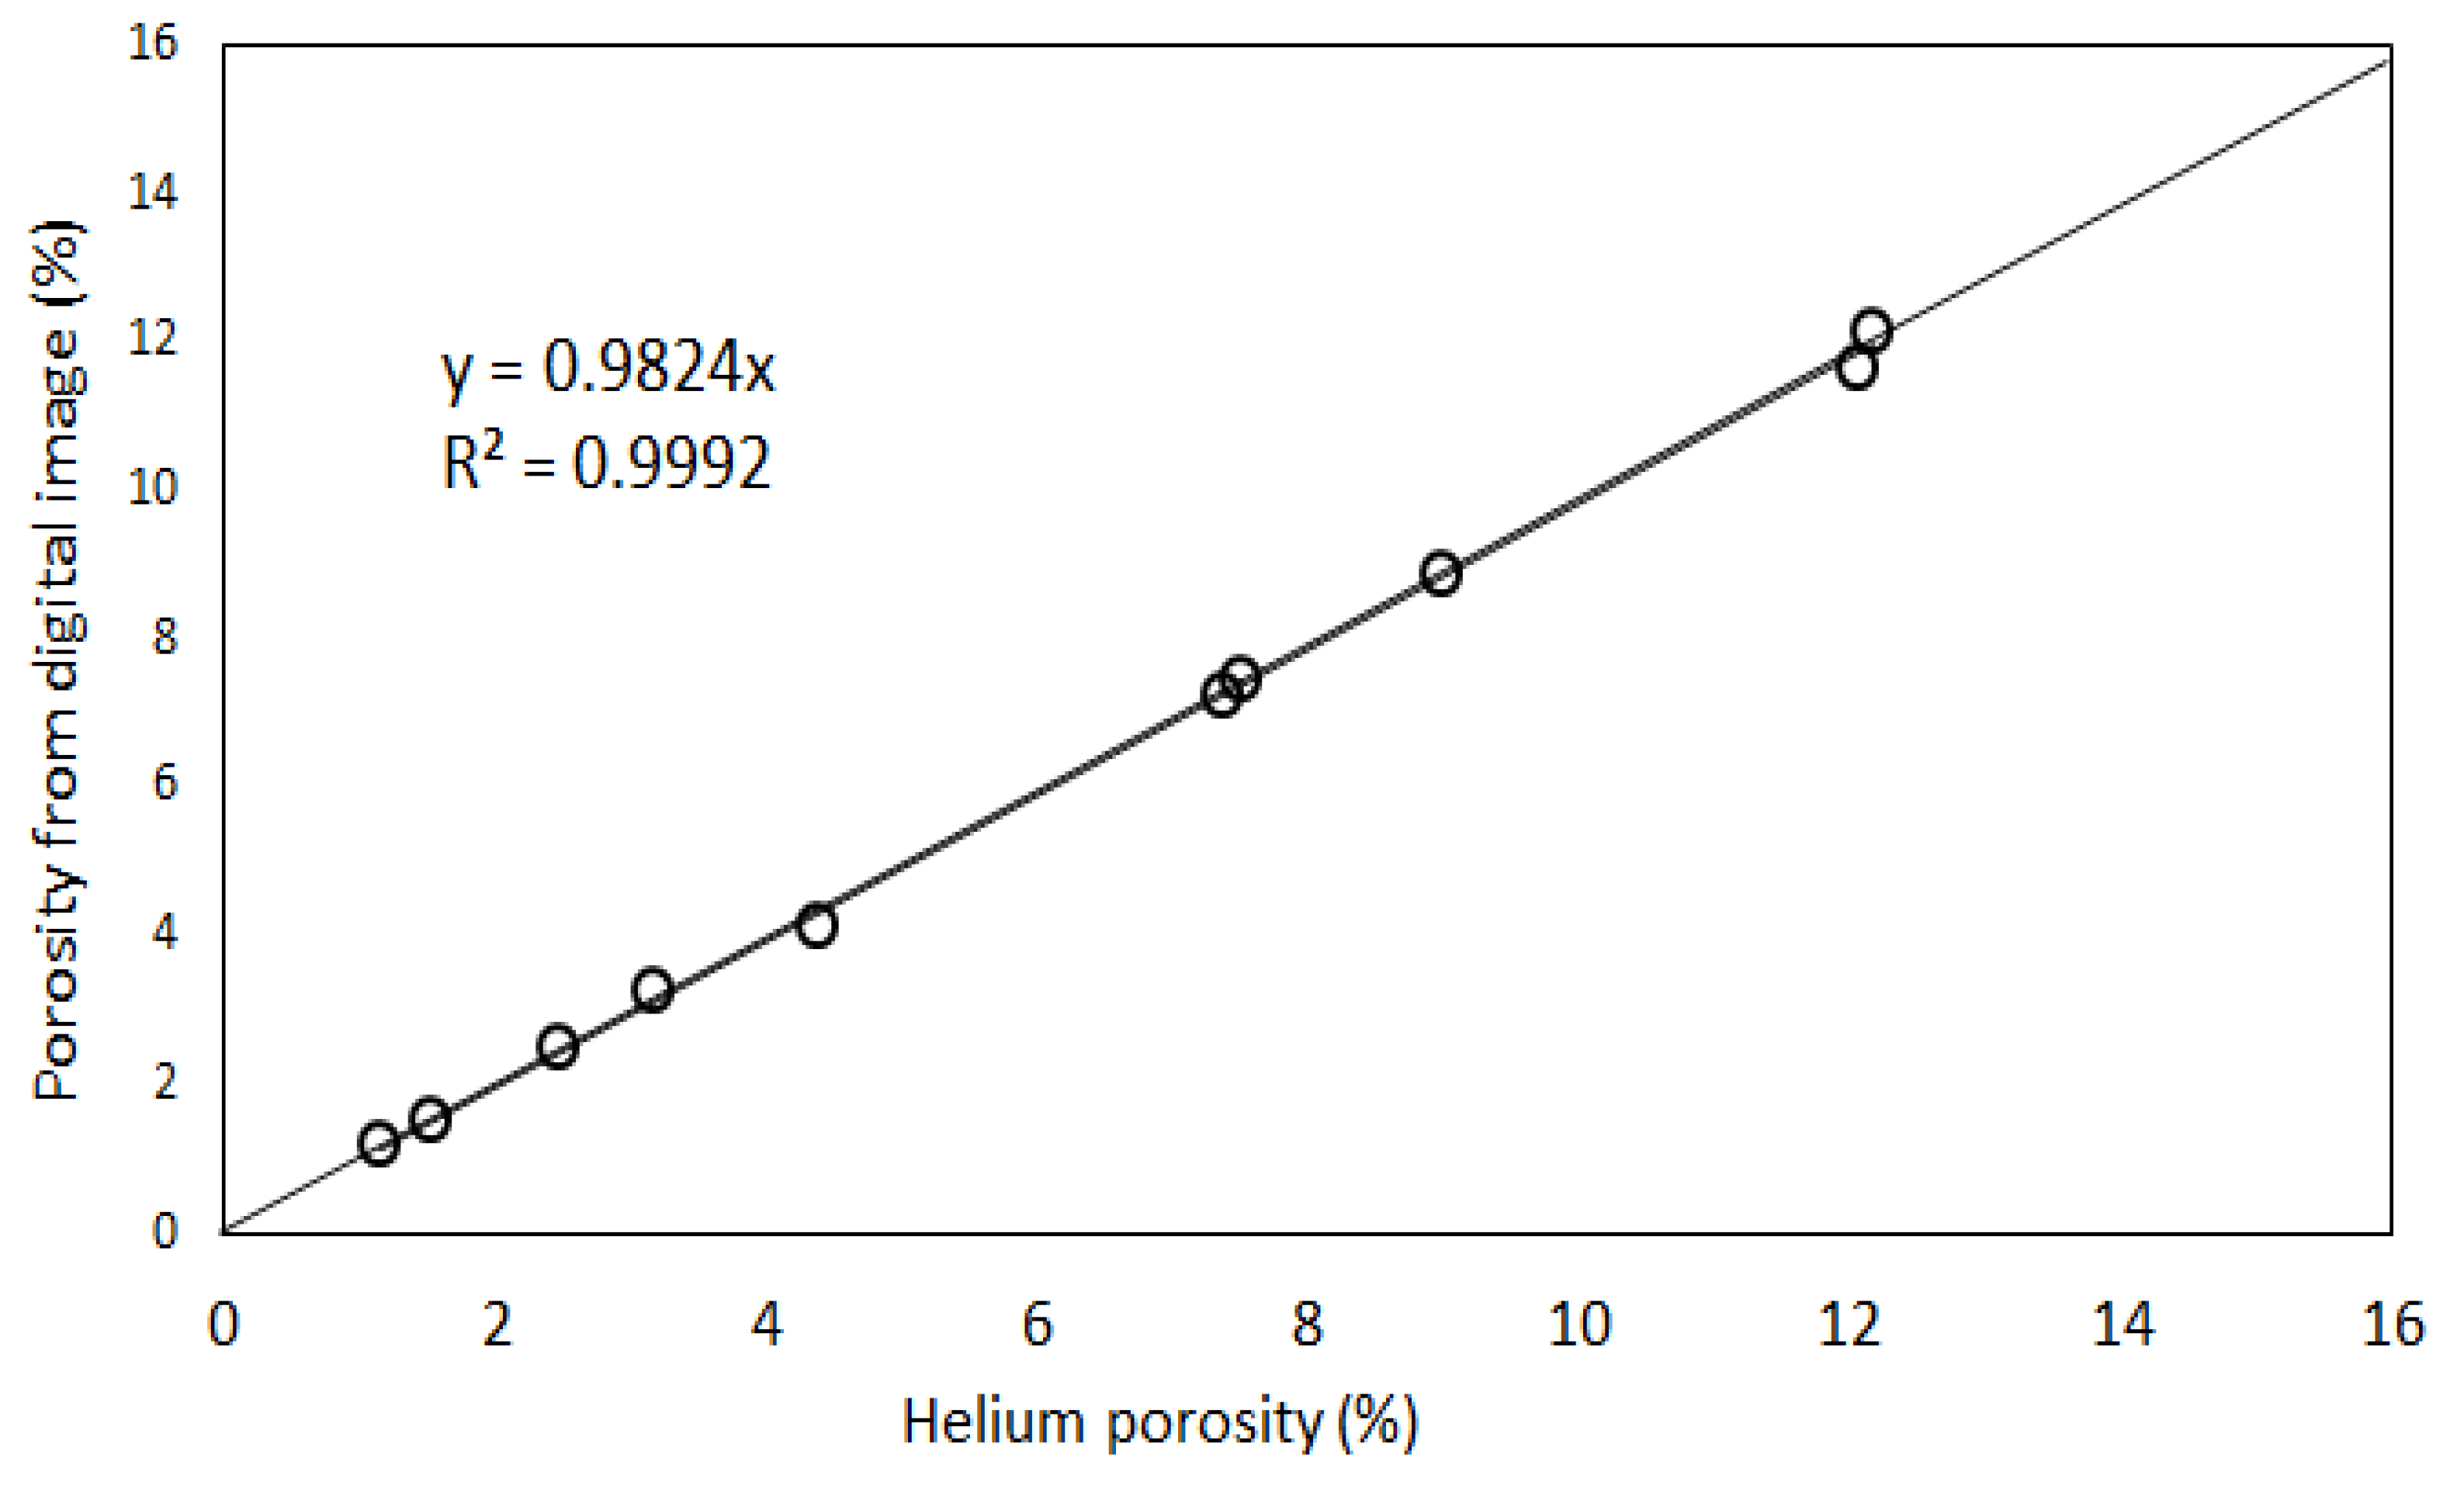
- Our analysis identified two major porosity groups of rock samples. One group is characterized by porosity values less than 7% while the second group has porosity values above 7%. There is a generally a good agreement between different methods of porosity measurements in samples with <7% porosity compared to samples with >7% porosity values.
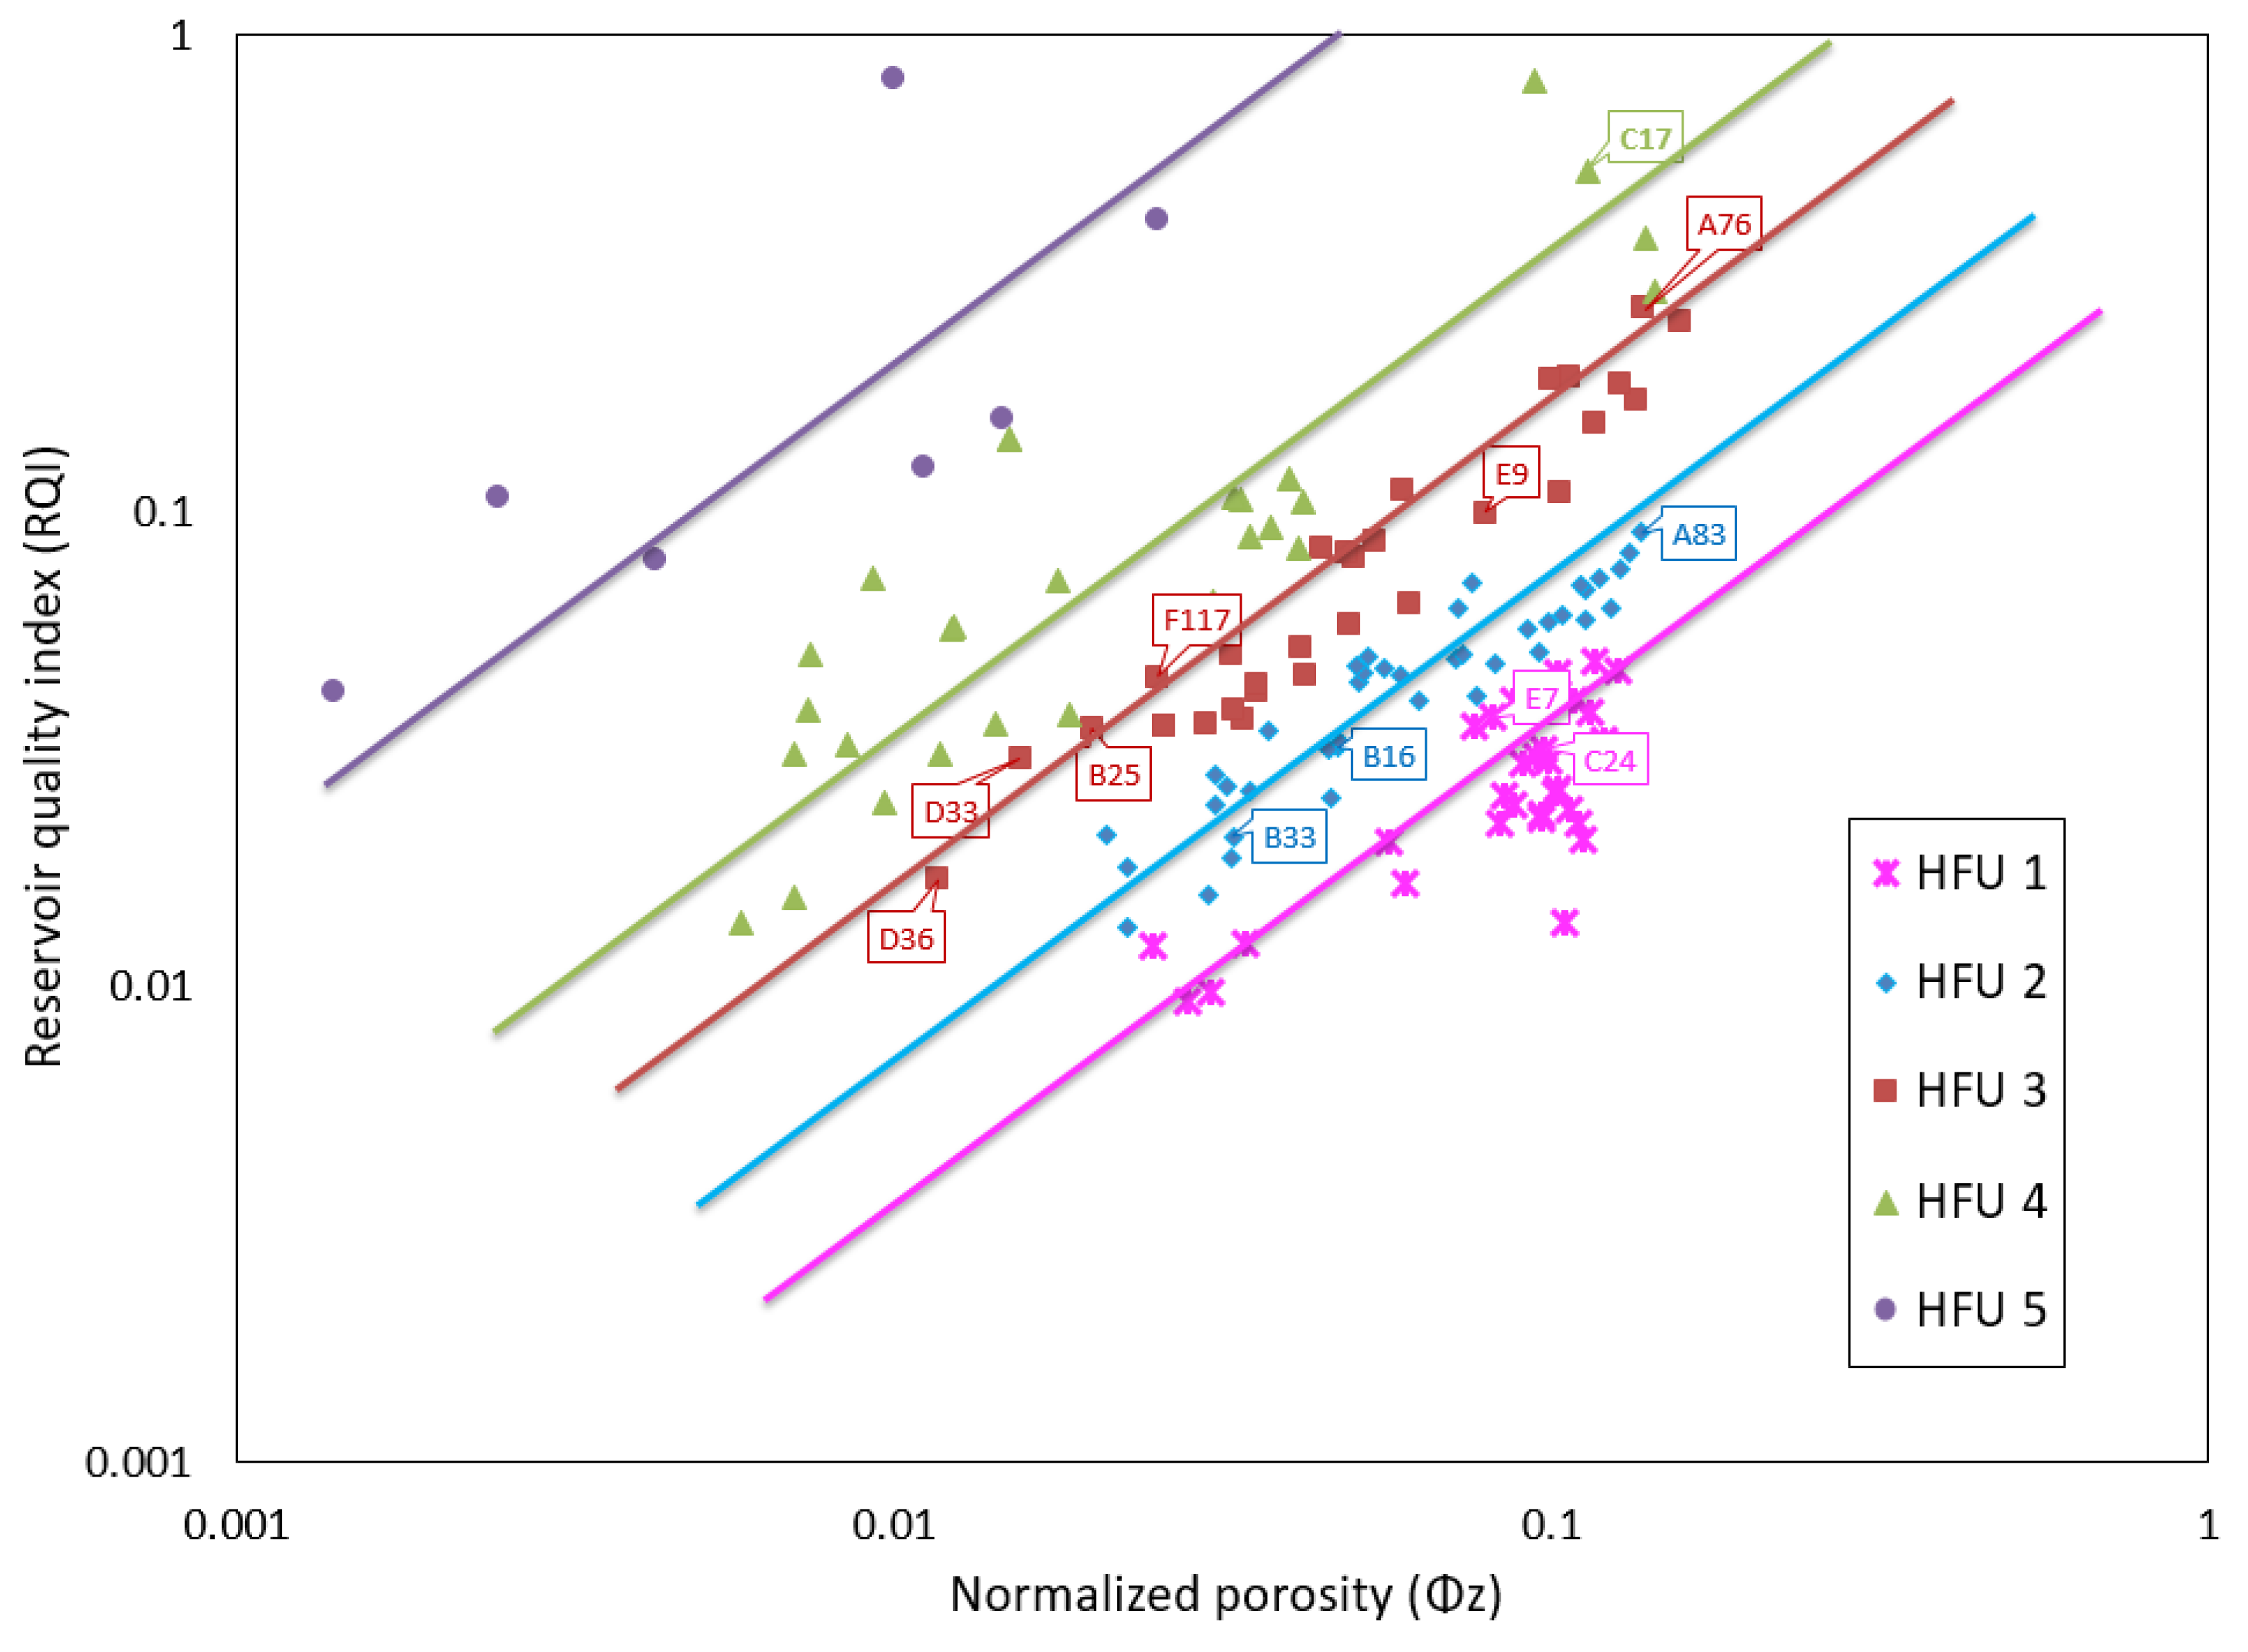
- Rock typing using the flow zone indicator (FZI) identified five hydraulic flow units (HFUs). Each of the HFUs has reservoir rocks with porosity values that fall within both groups of porosity.
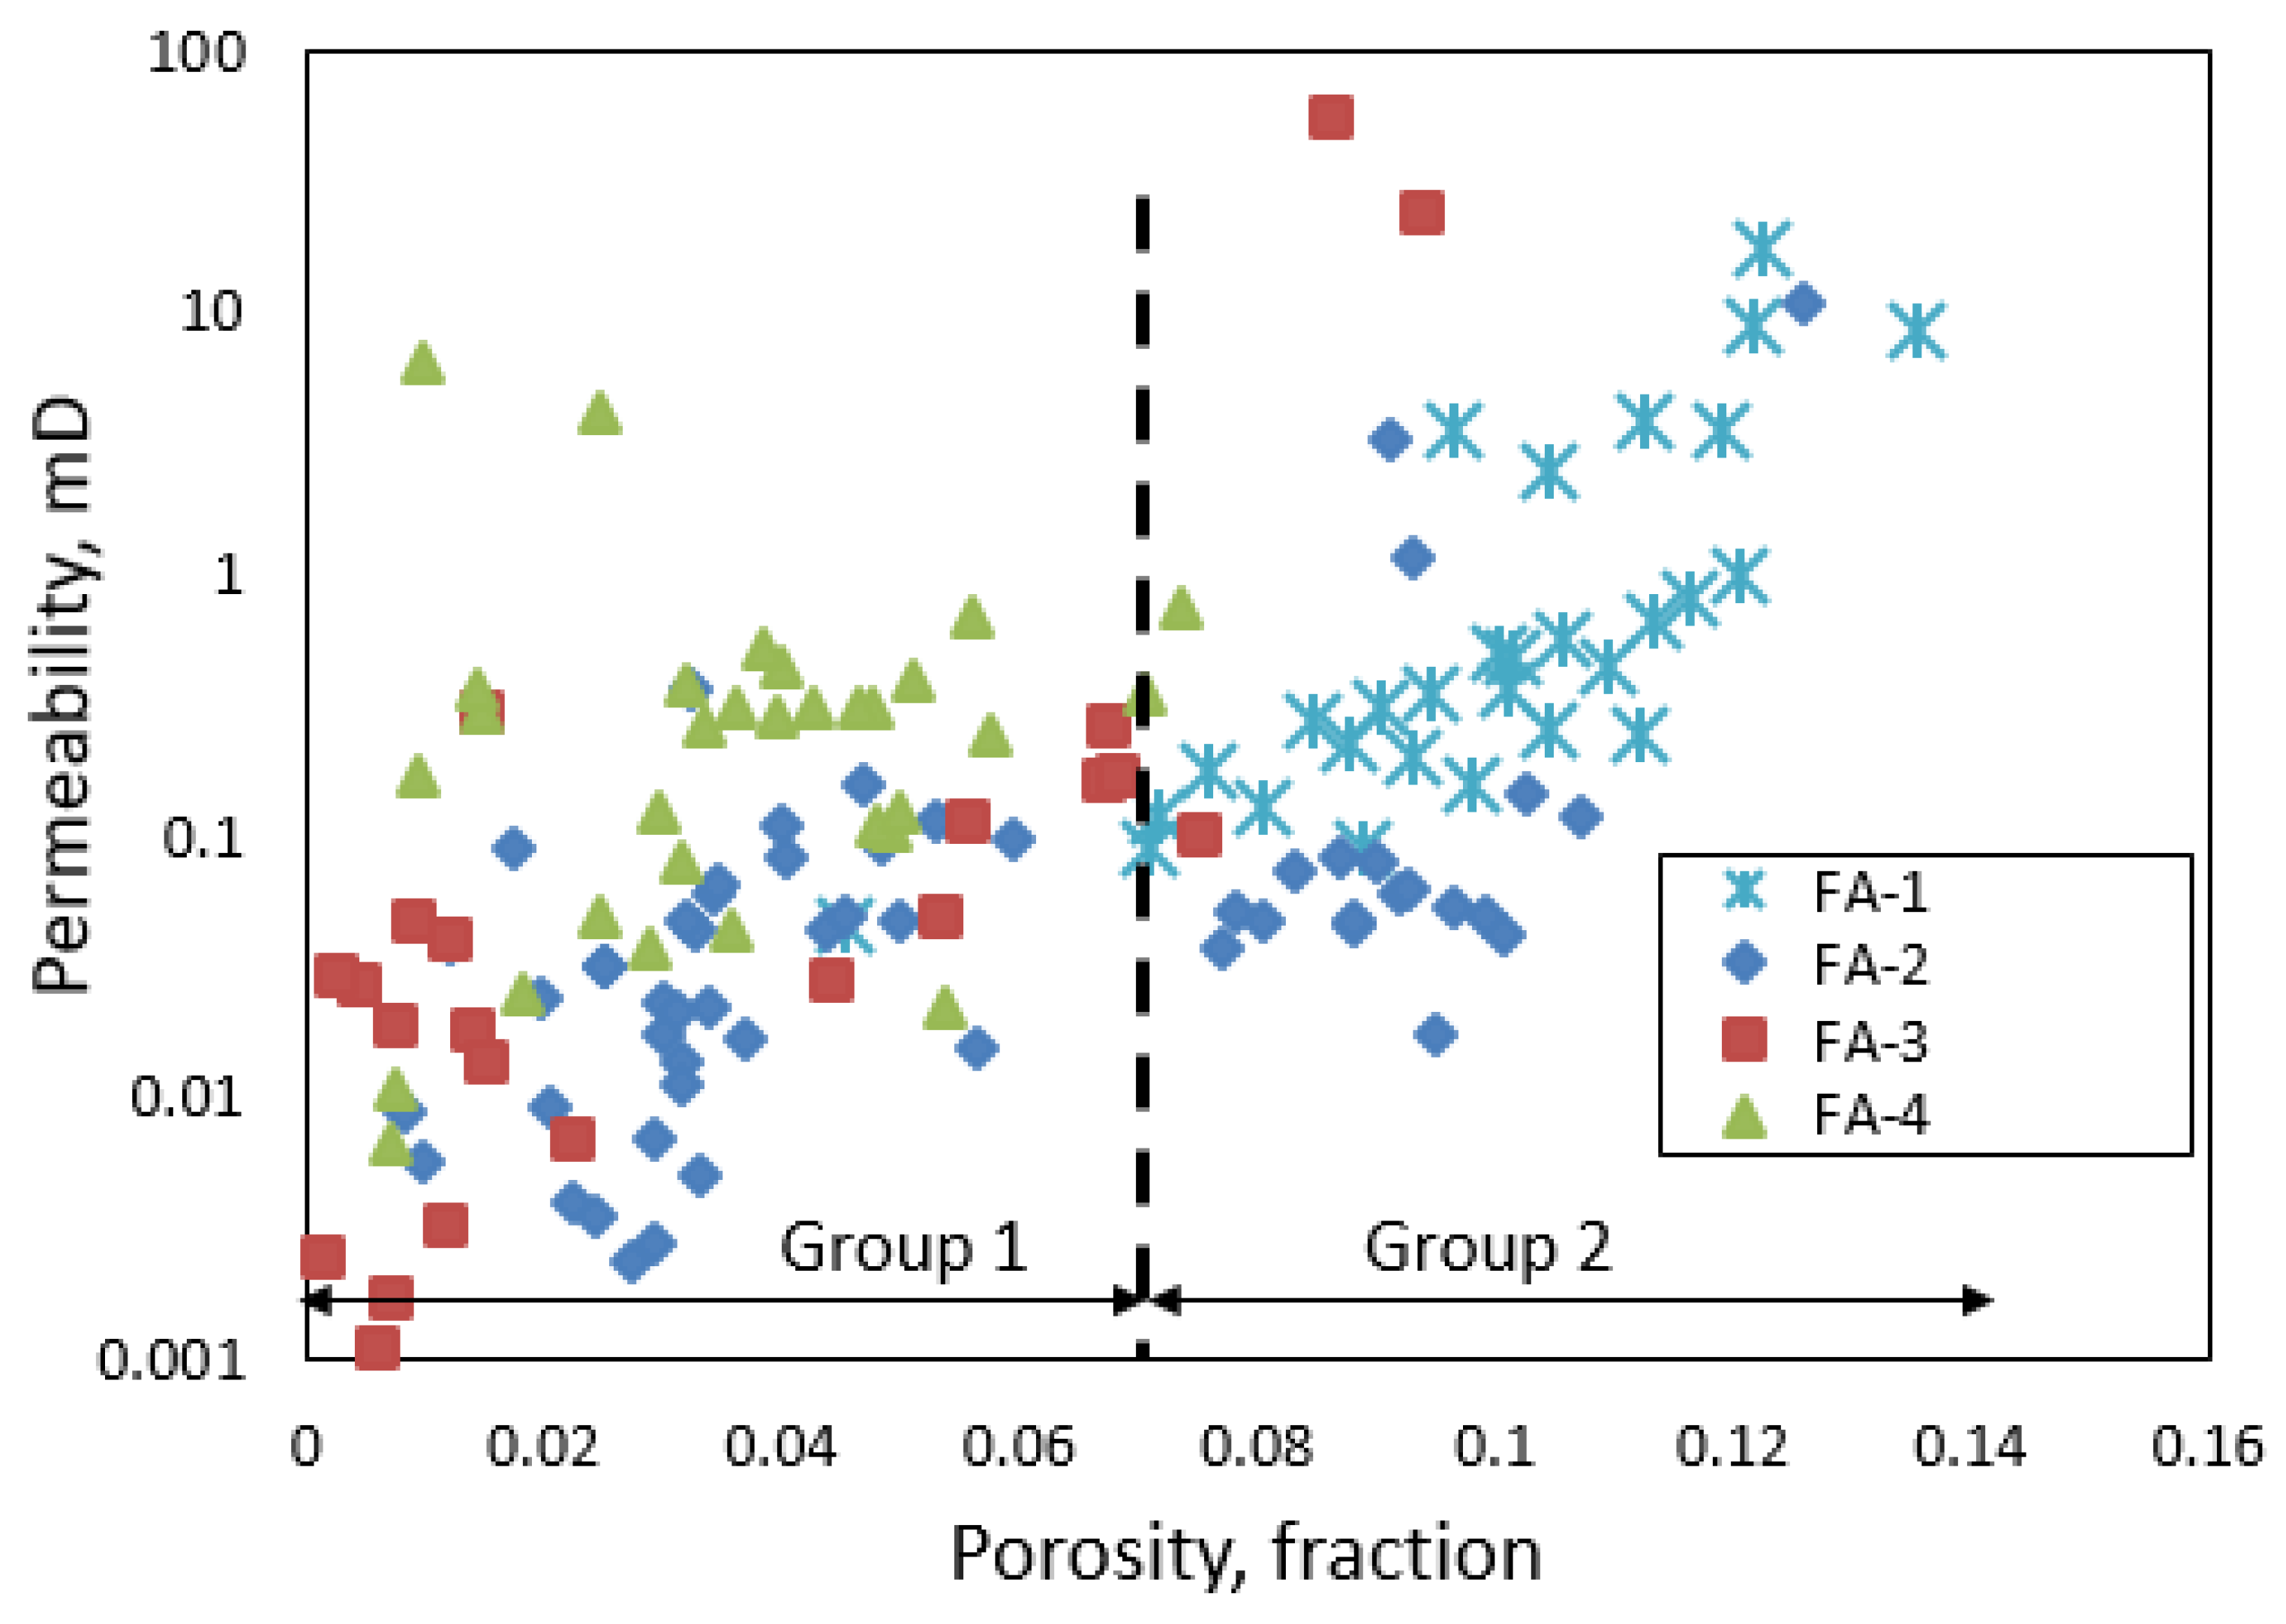
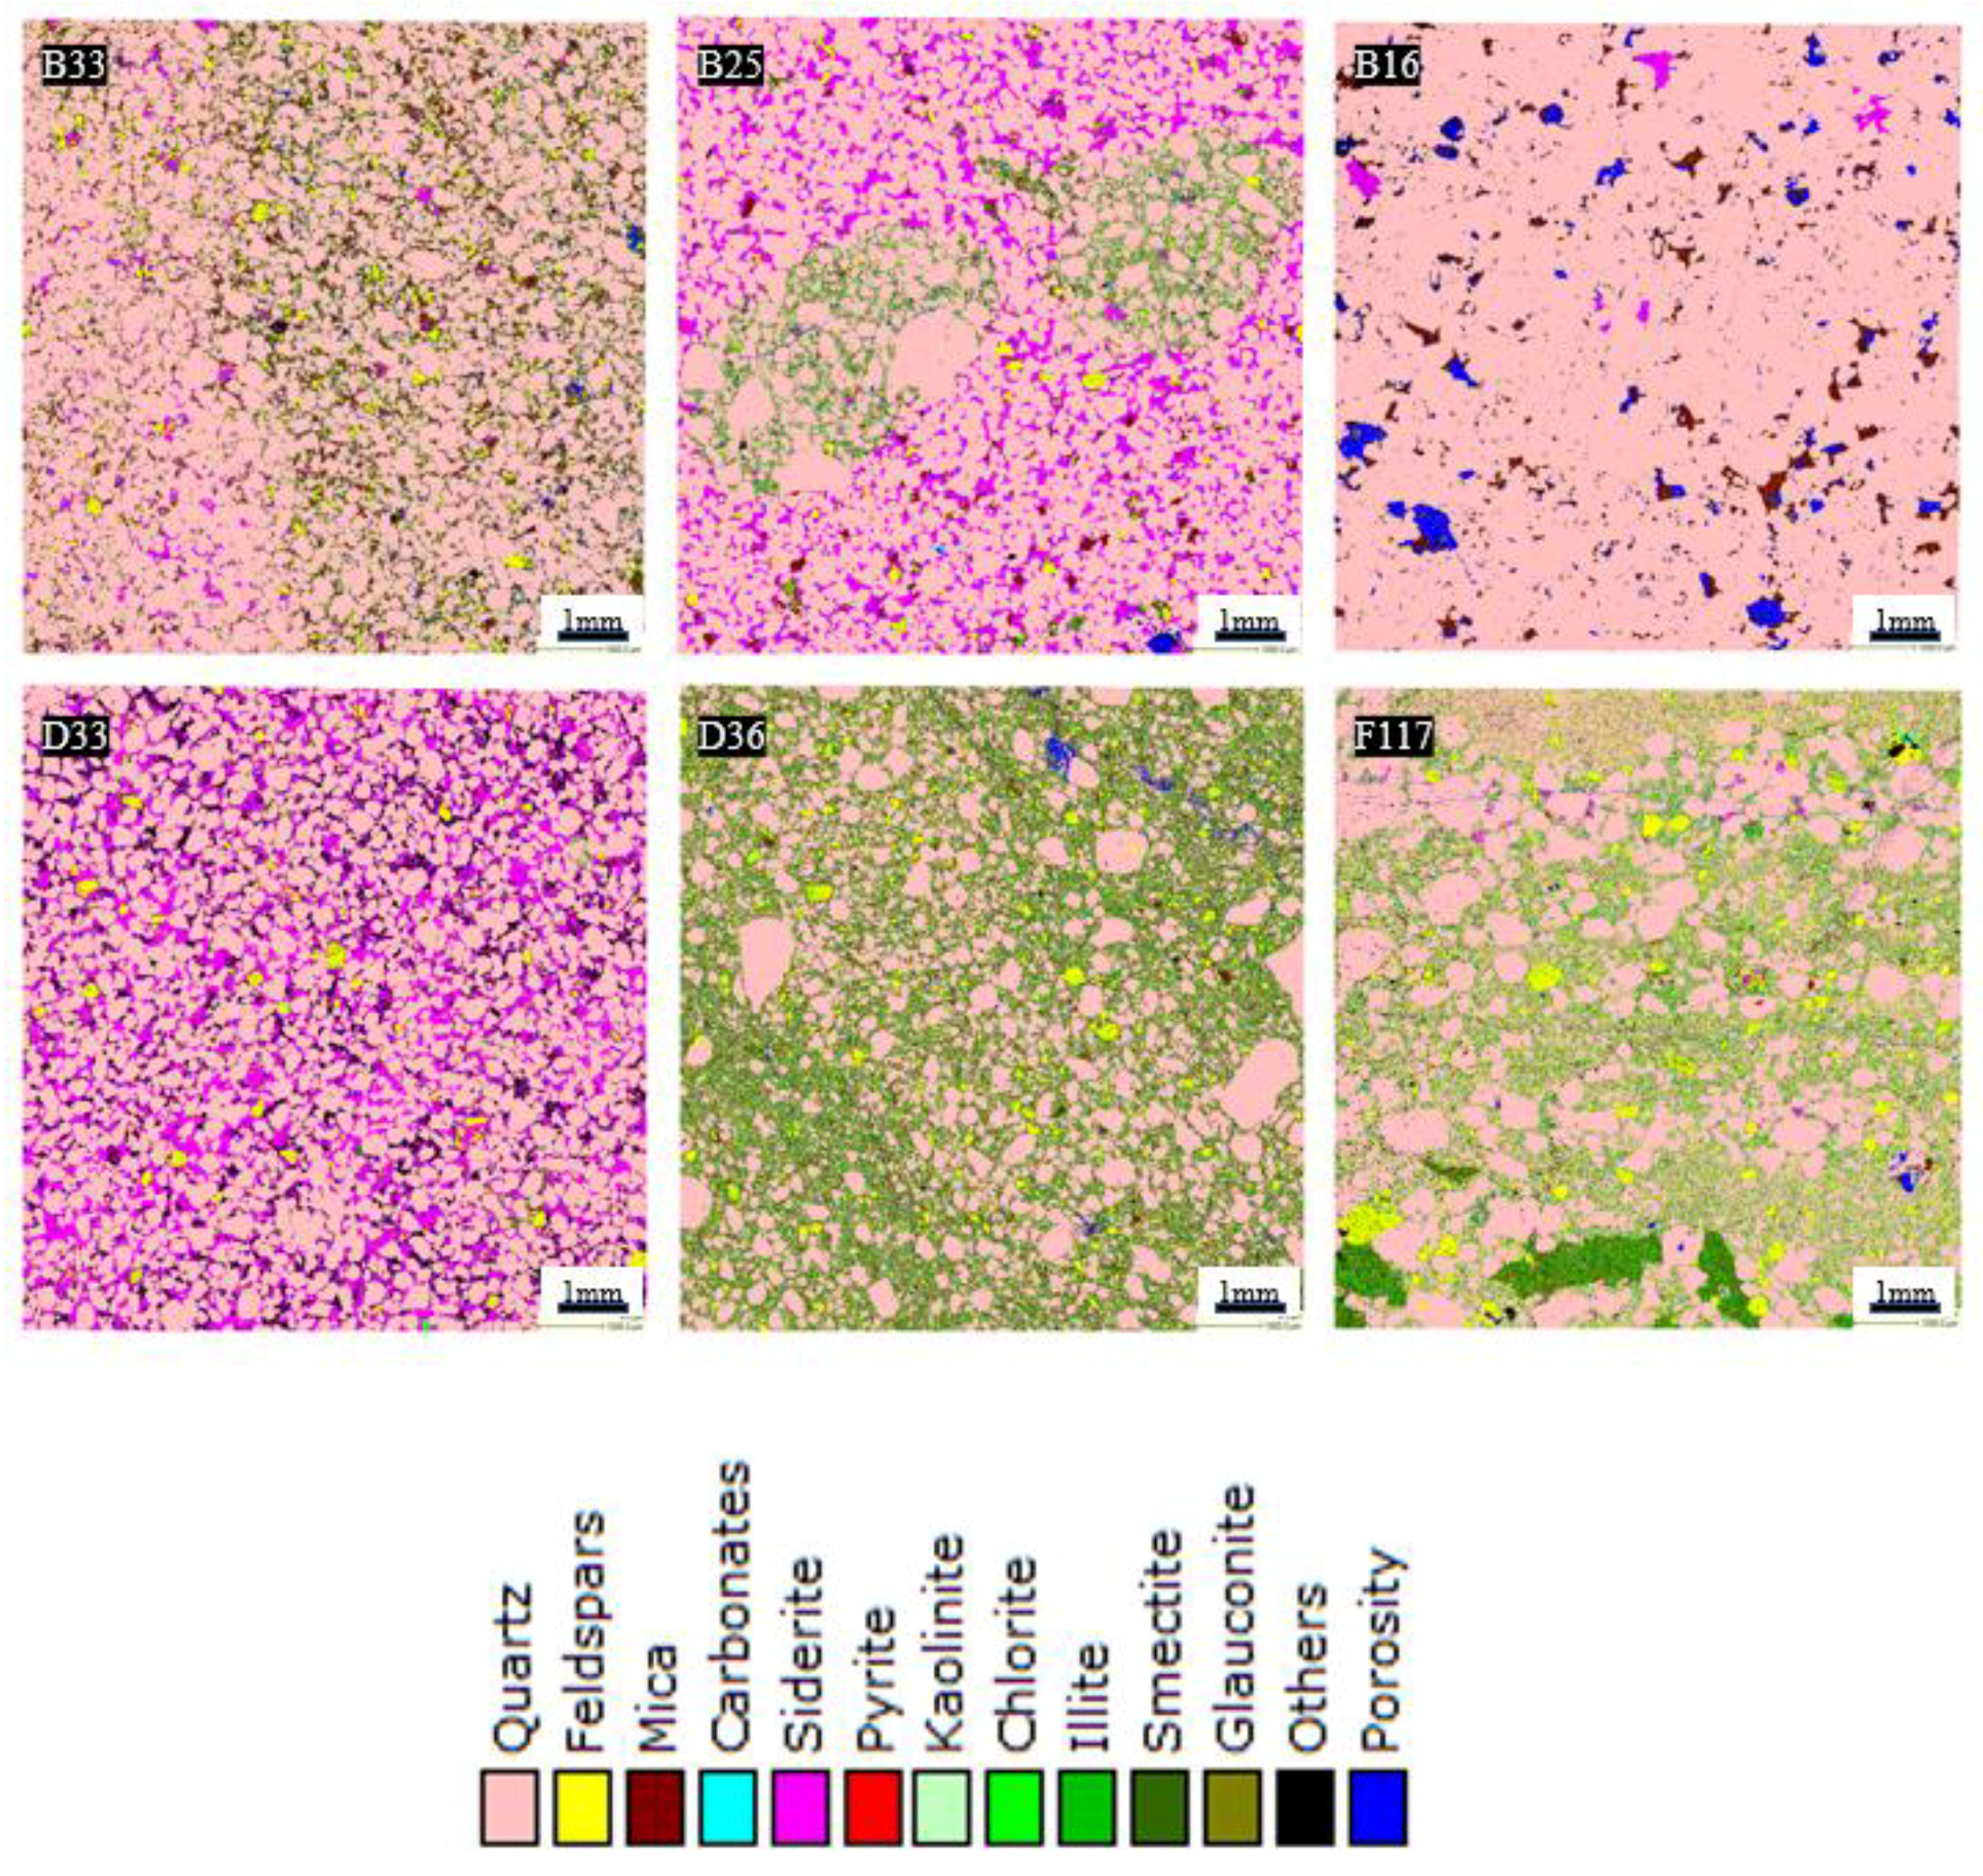
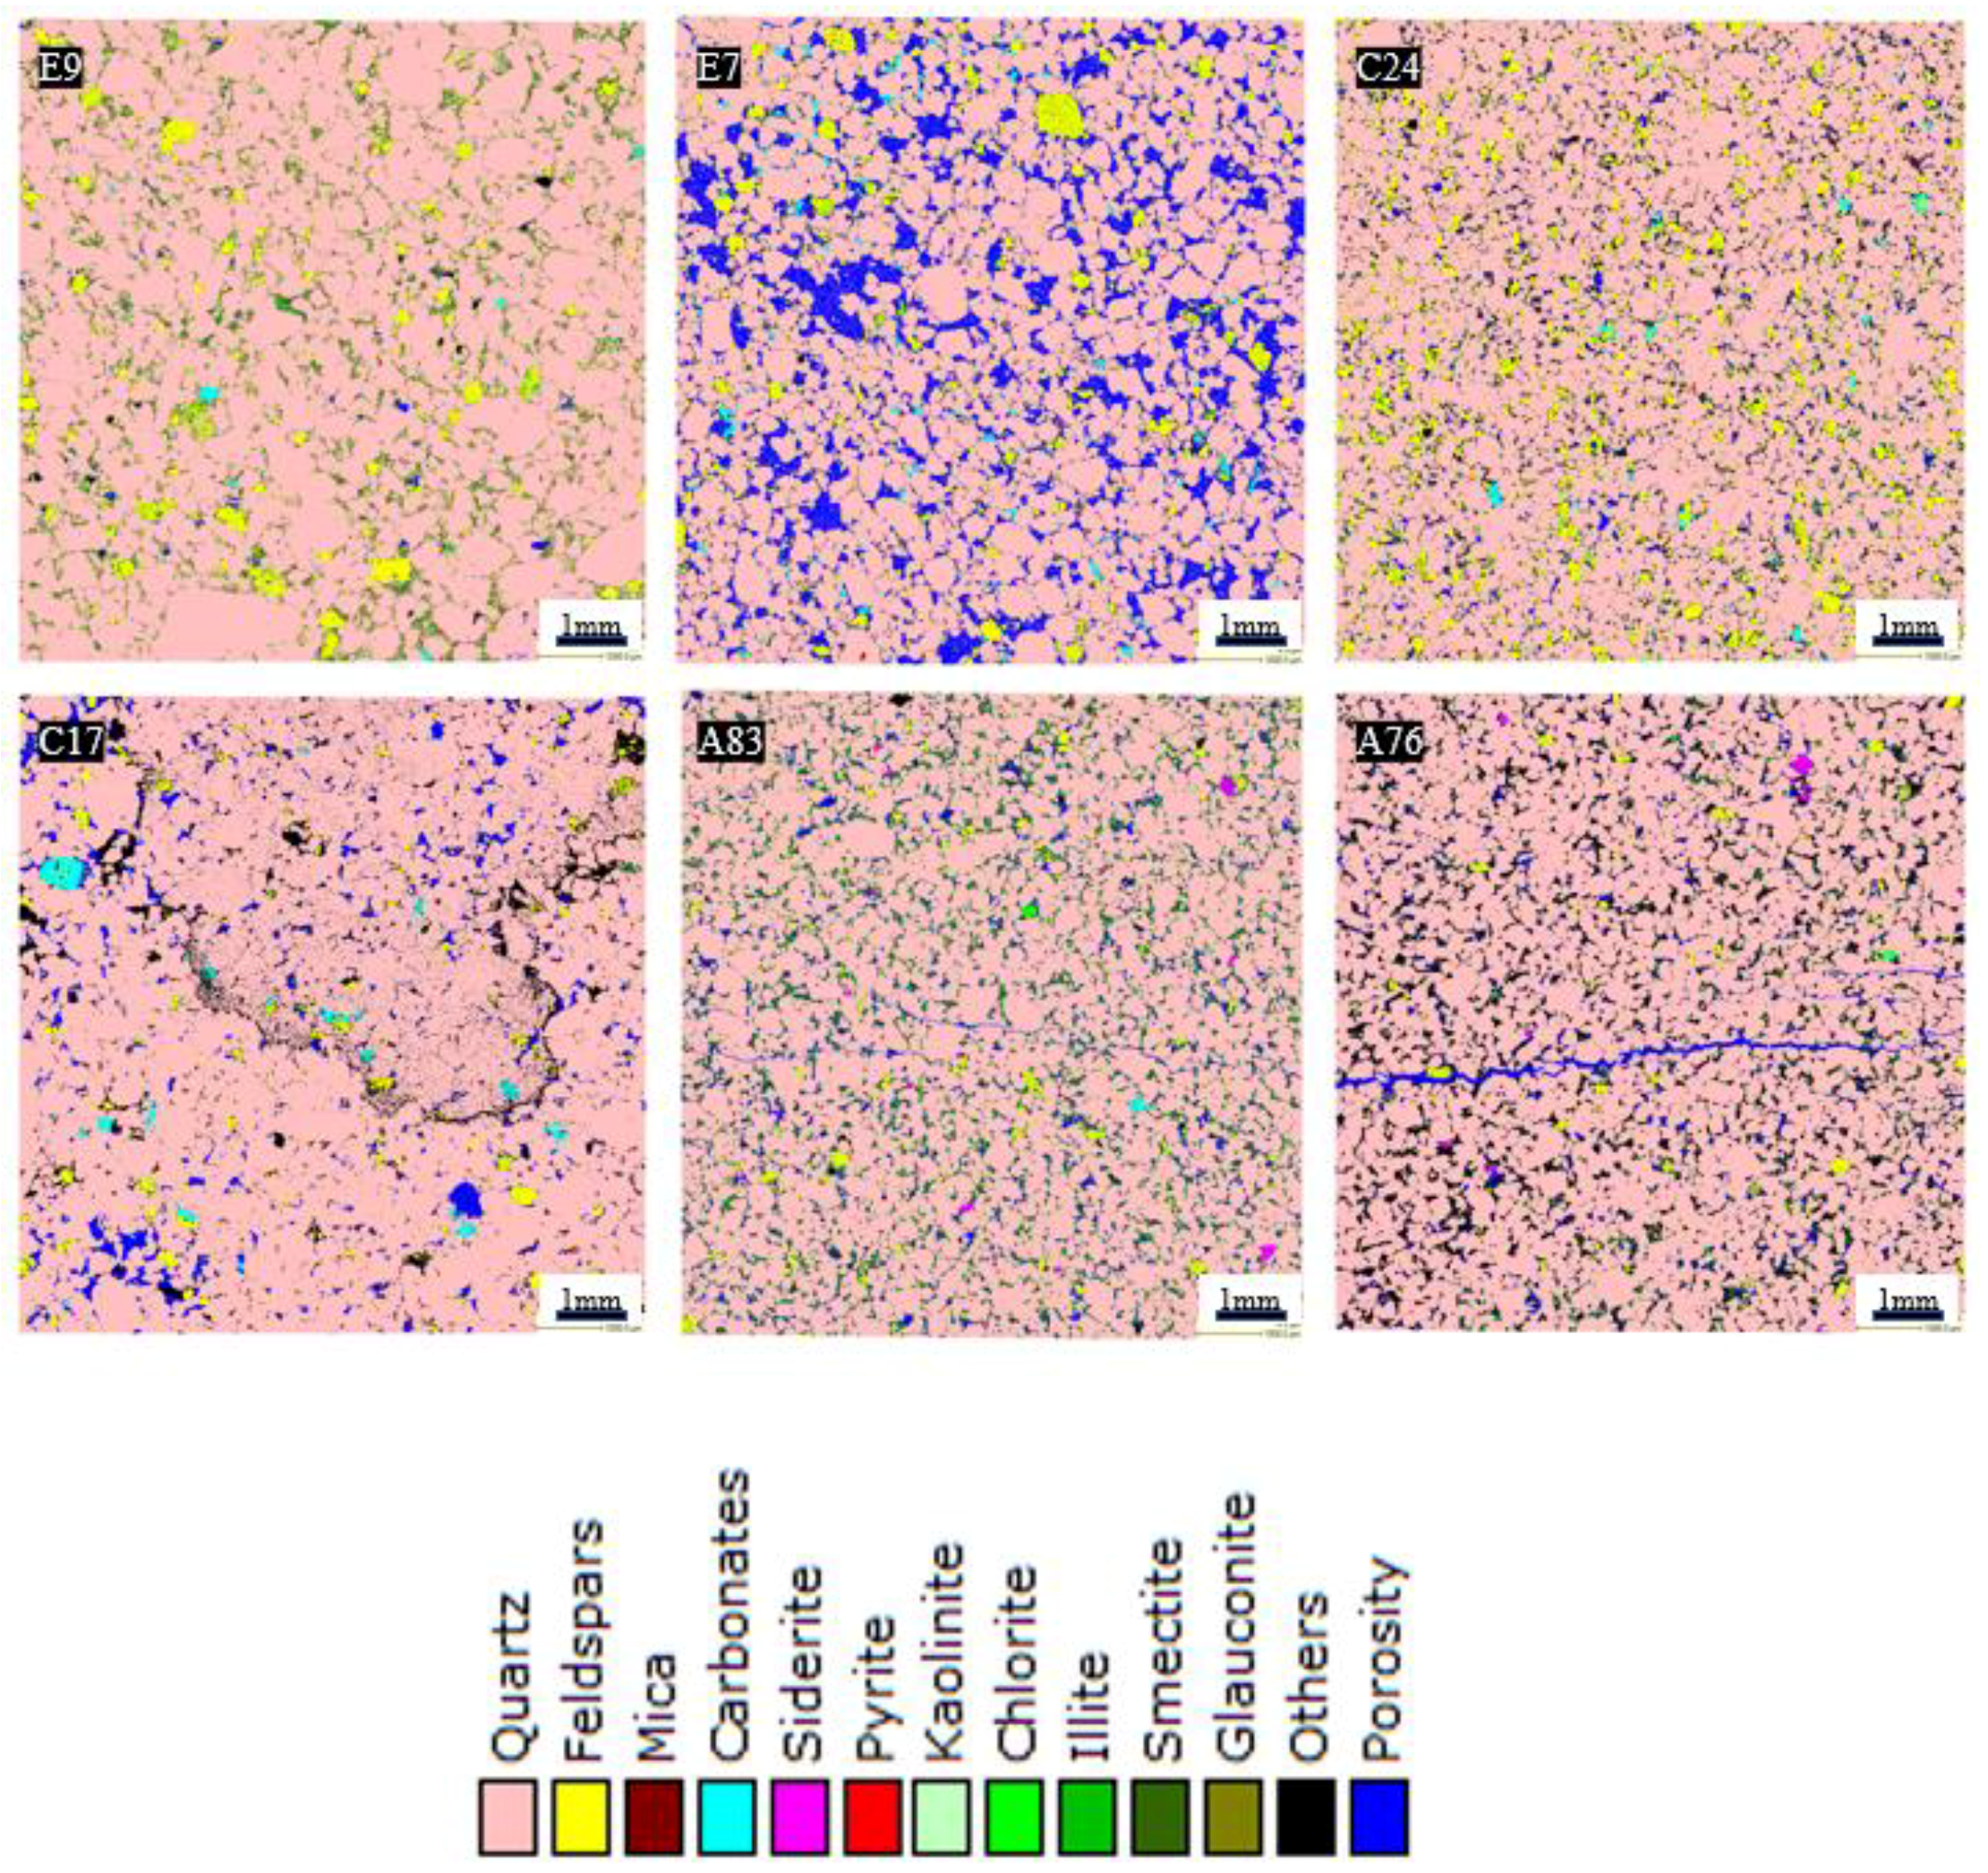
- Petrographic analysis revealed that the low-porosity samples have a significant amount of clay (mainly illite). However, quartz was identified as the dominant mineral in all the rock samples while subordinate amounts of feldspars, mica, and clay minerals were also identified.
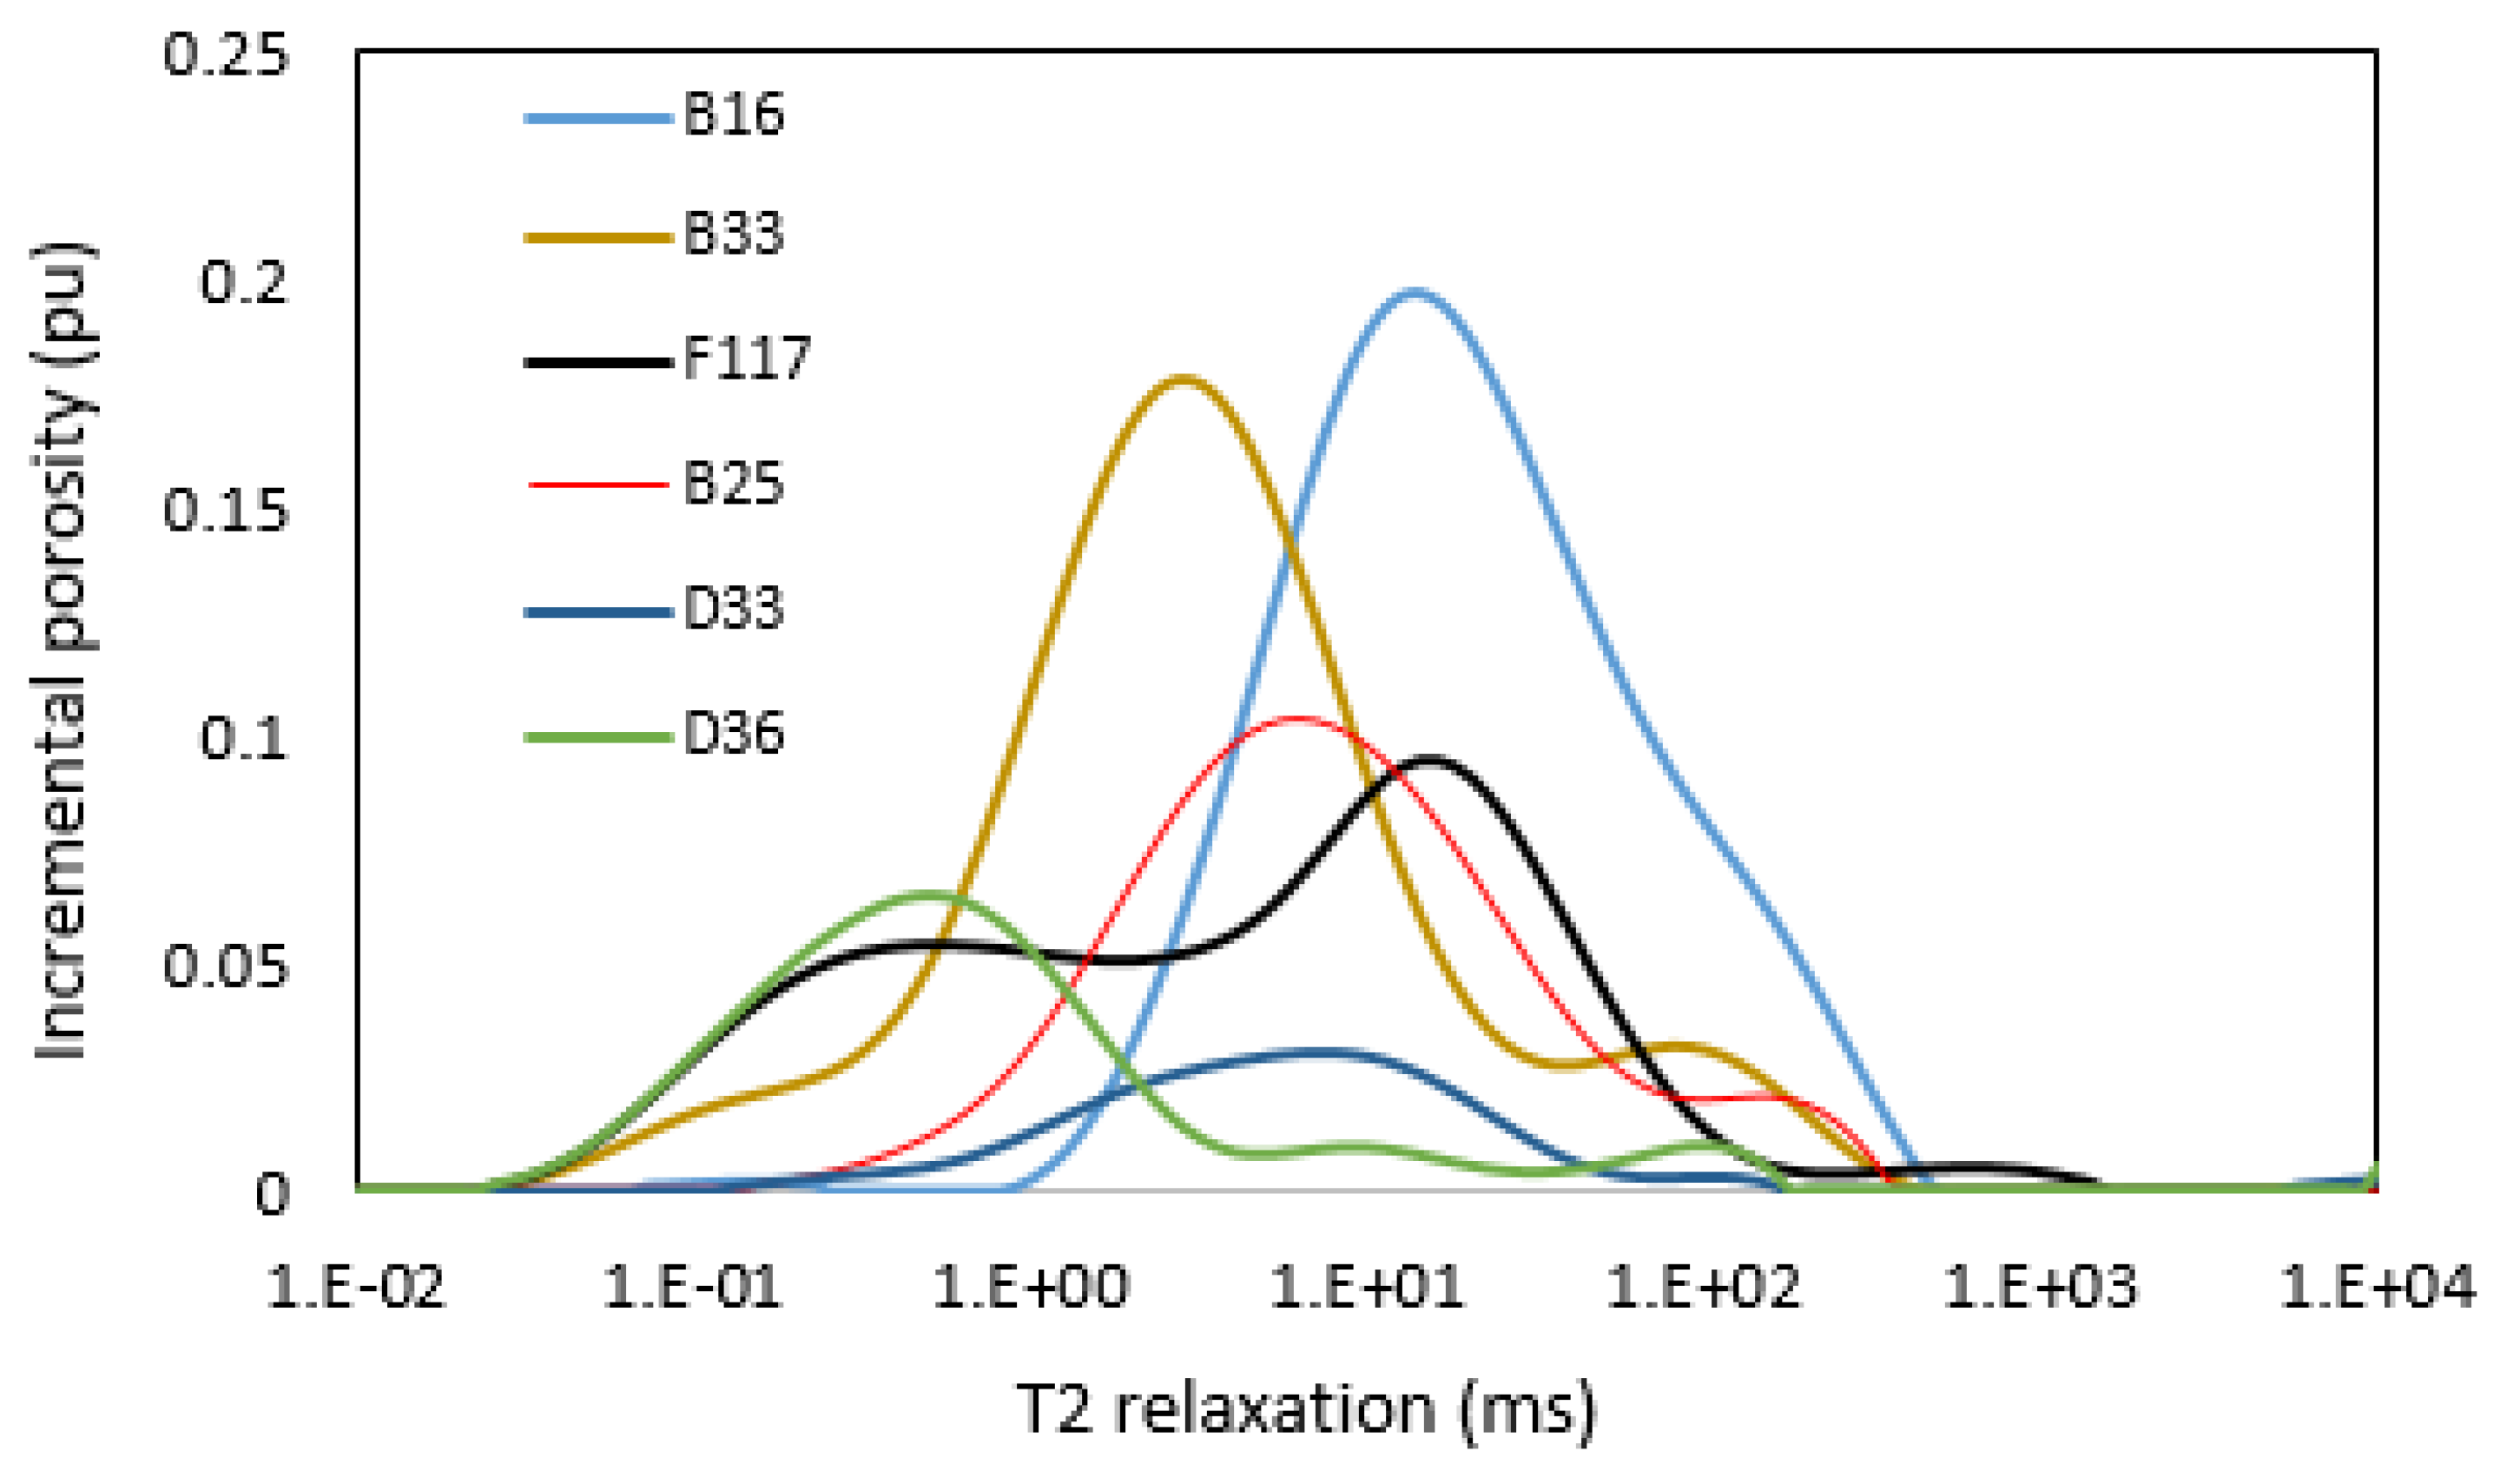
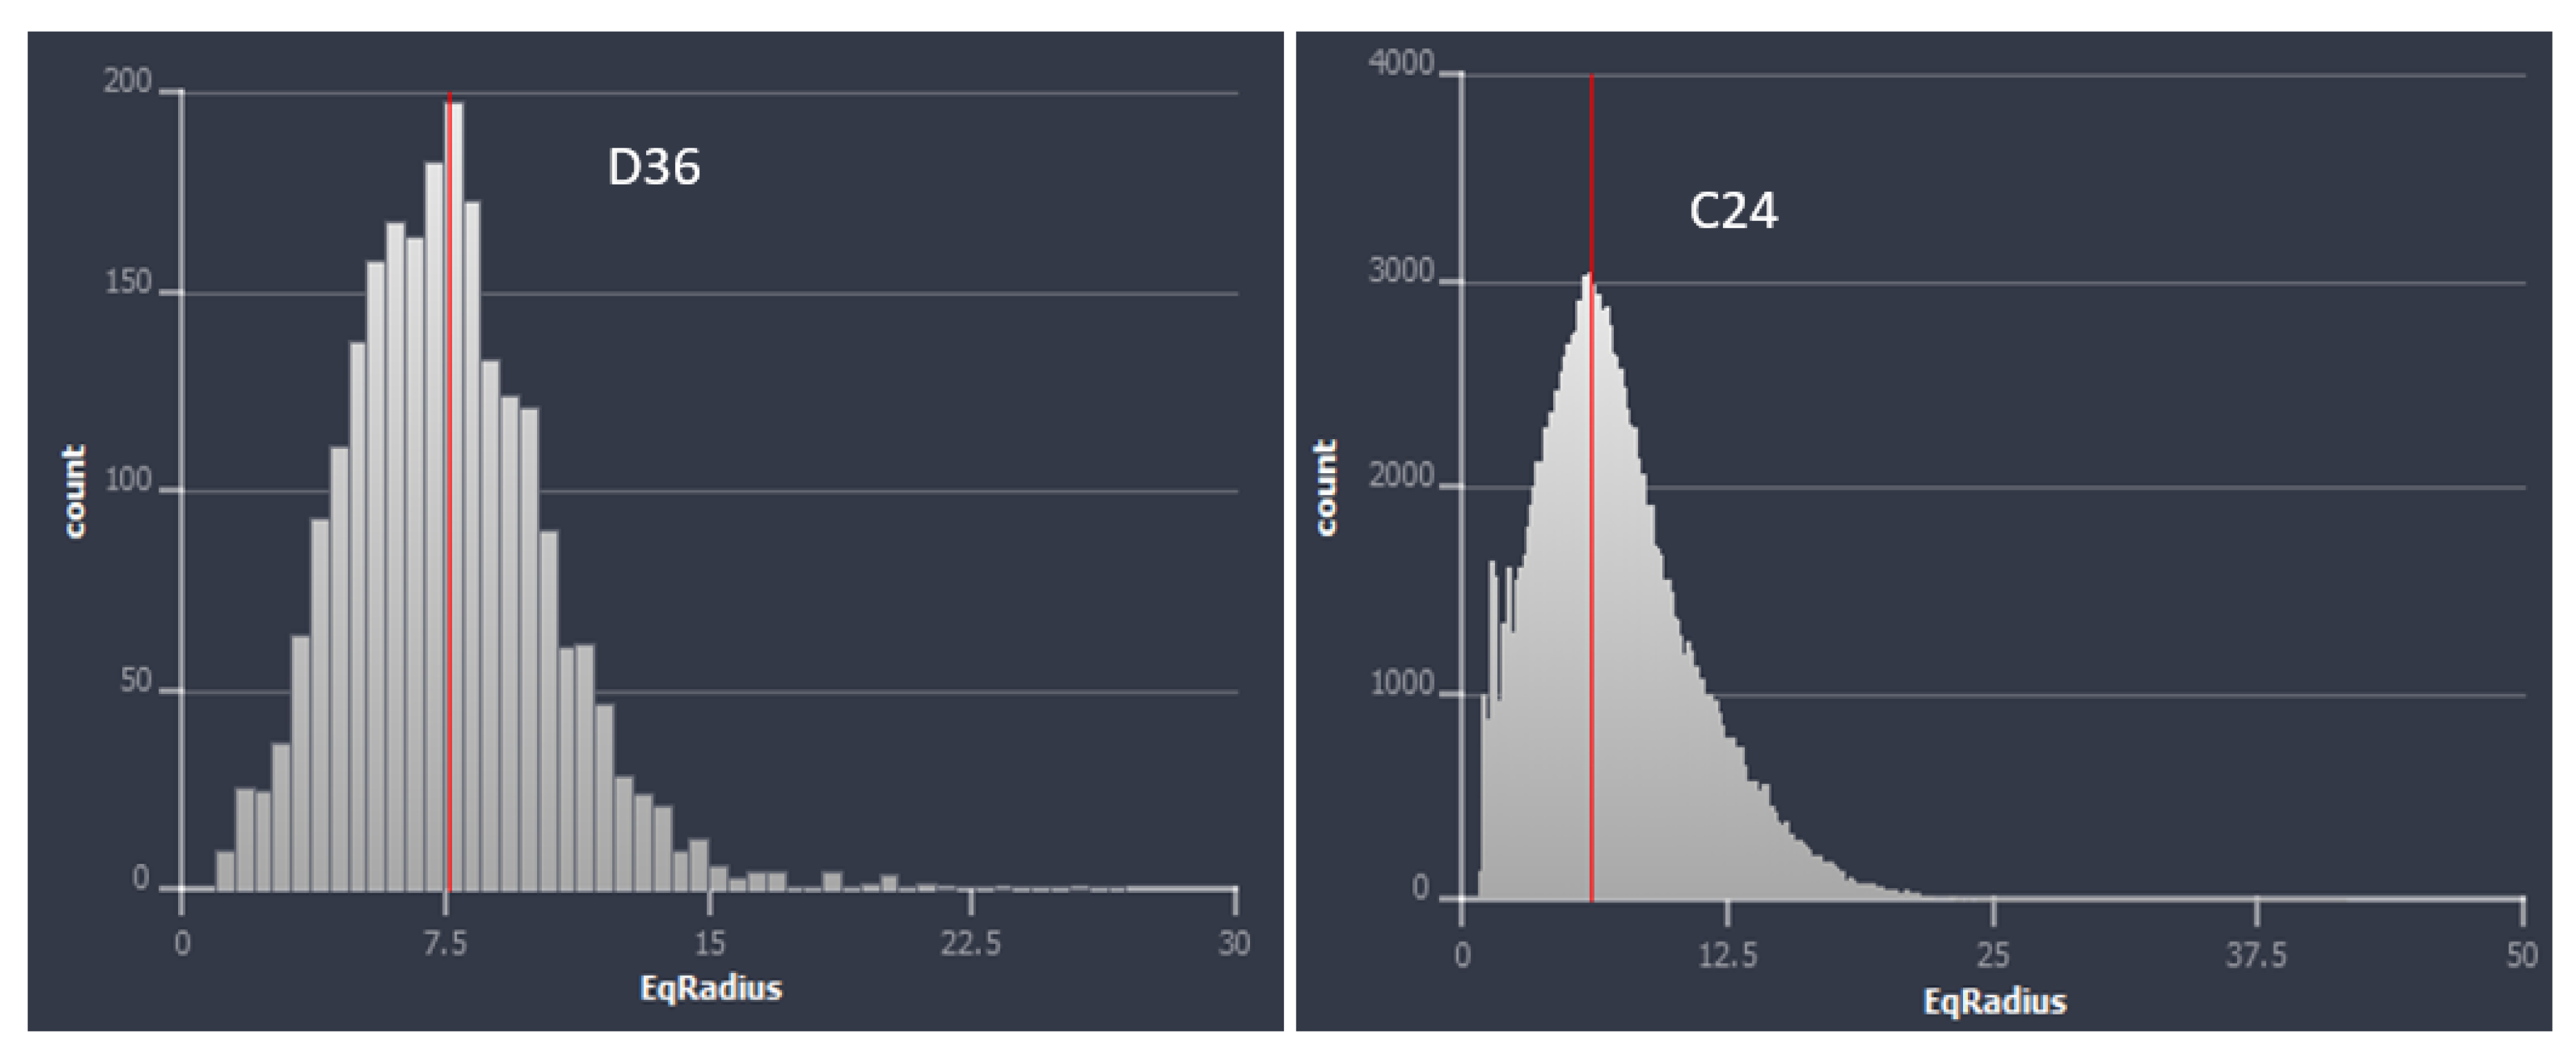
- NMR analysis showed that the group 1 samples are dominated by micropores, while the group 2 samples are dominated by macropores. Group 1 samples apparently showed a polymodal pore system, while the samples in group 2 generally showed unimodal pore distribution.
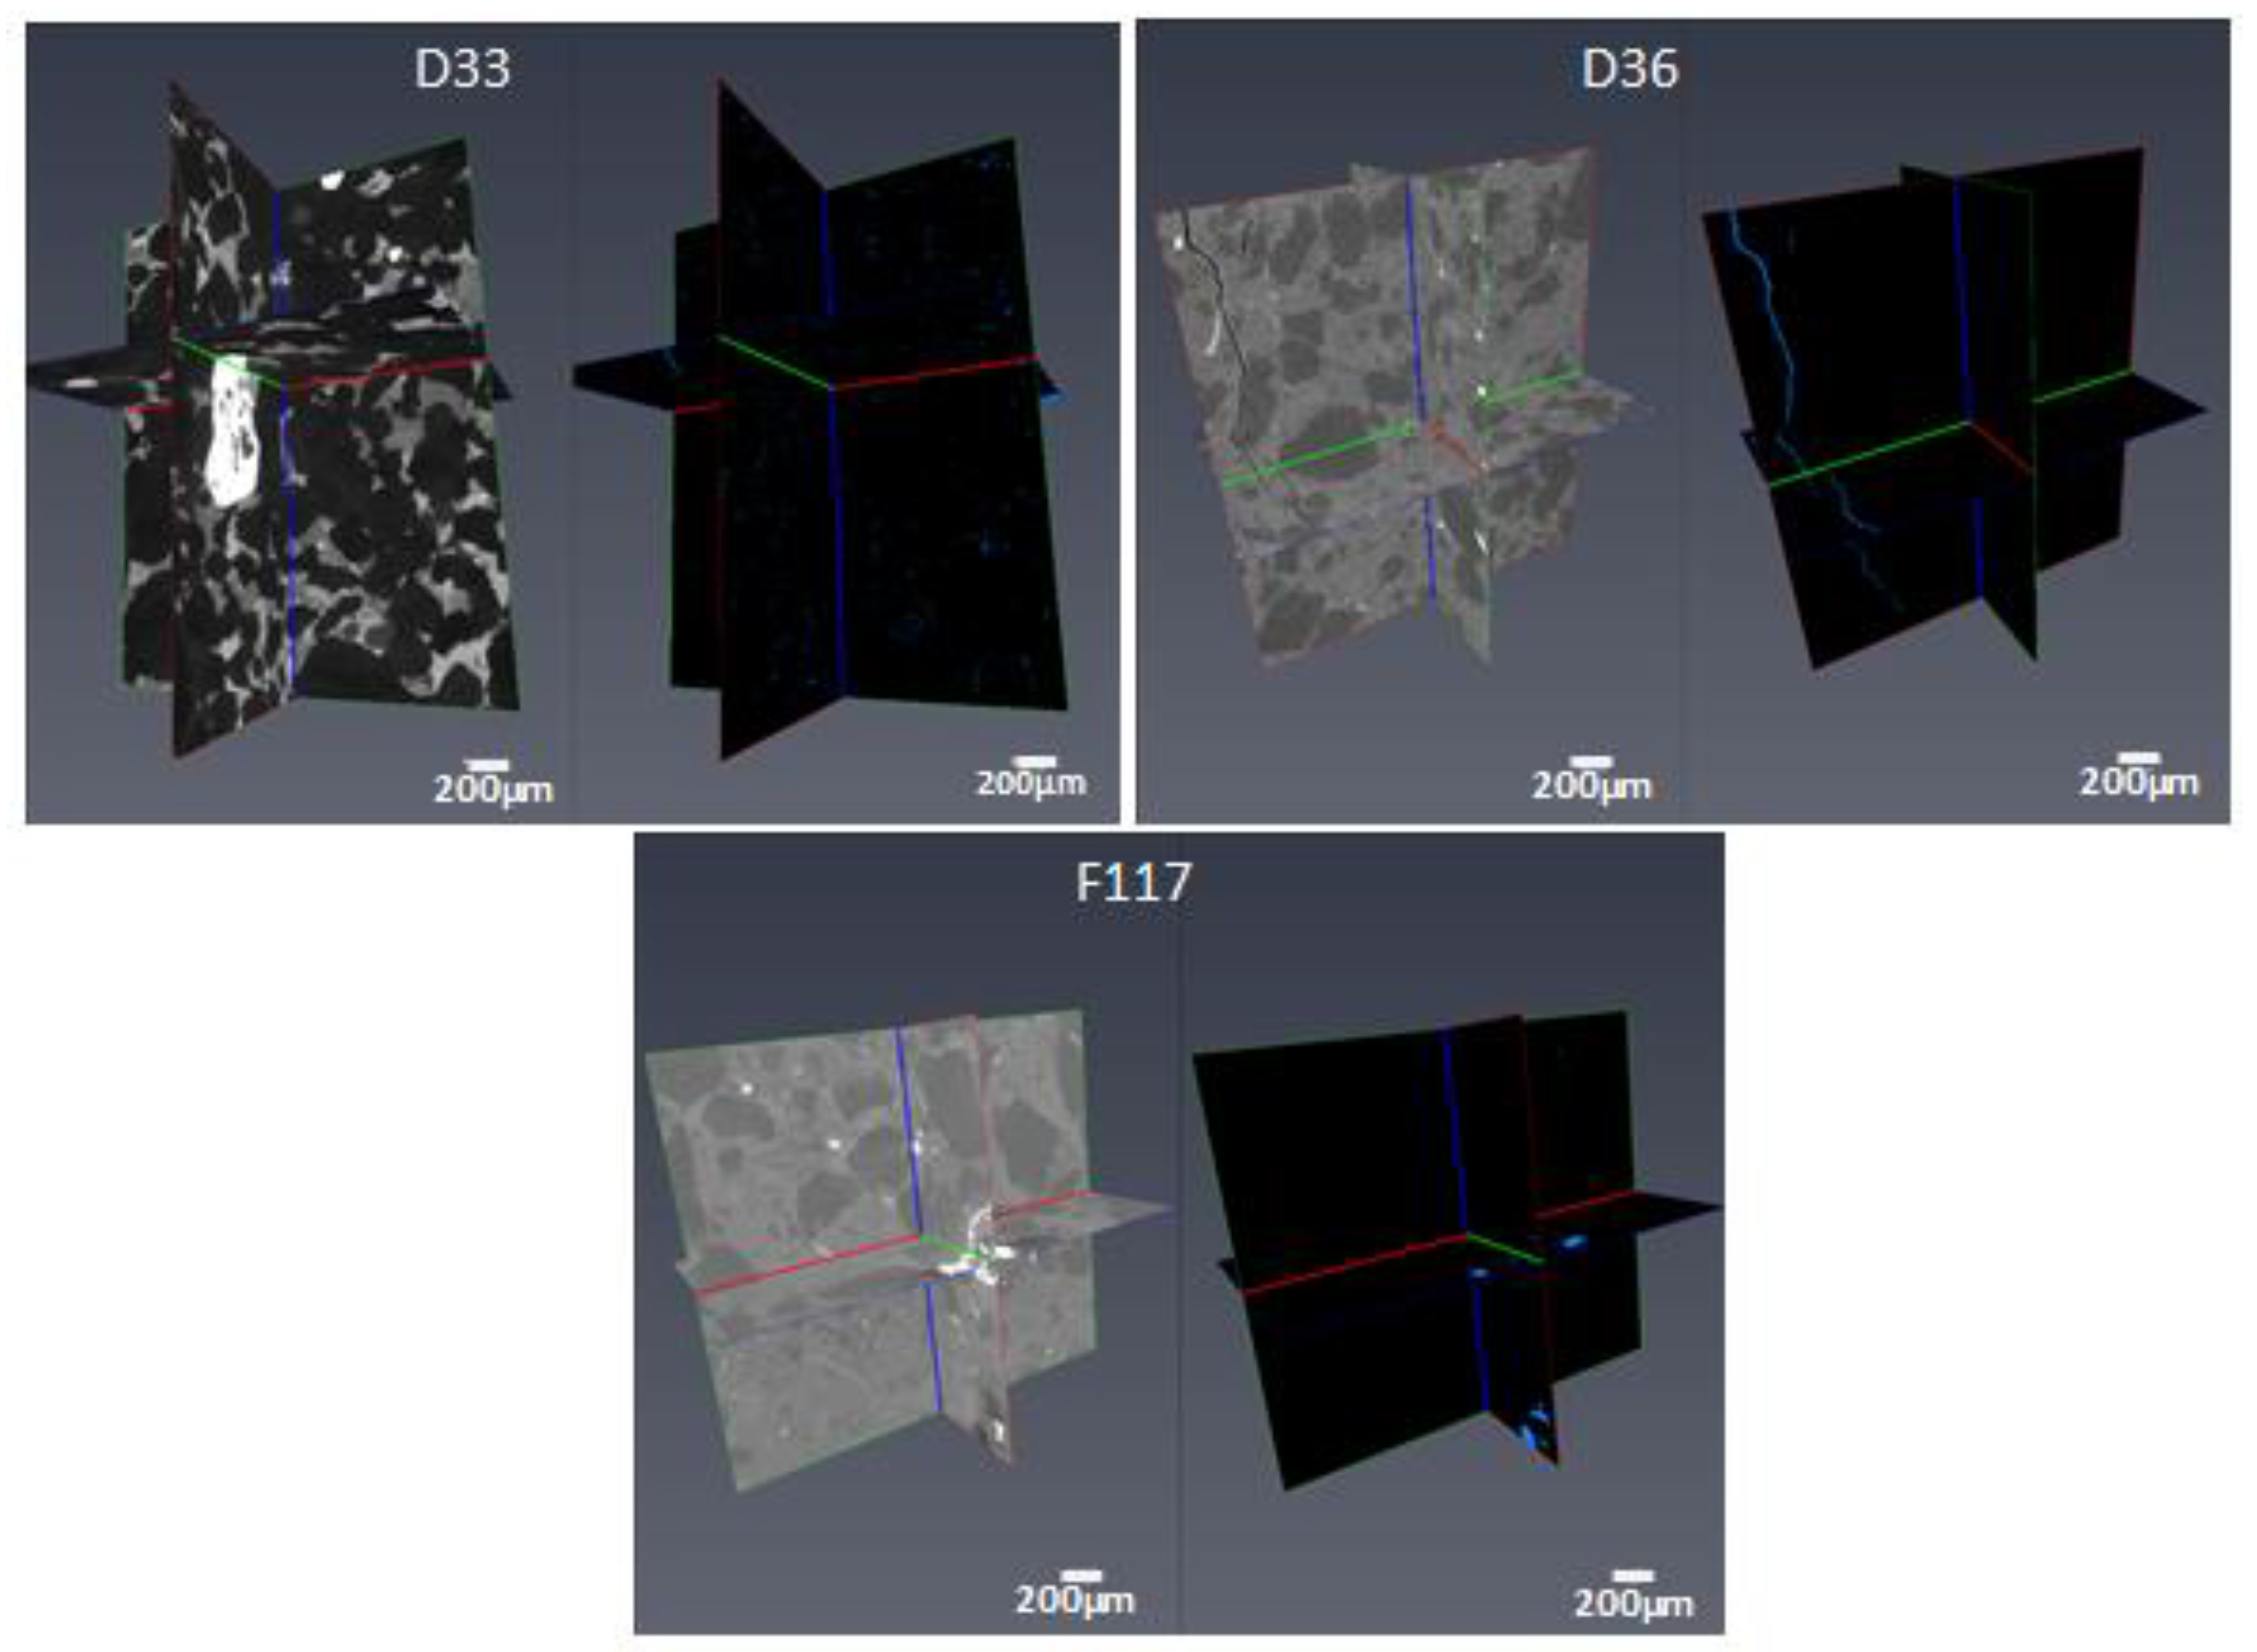
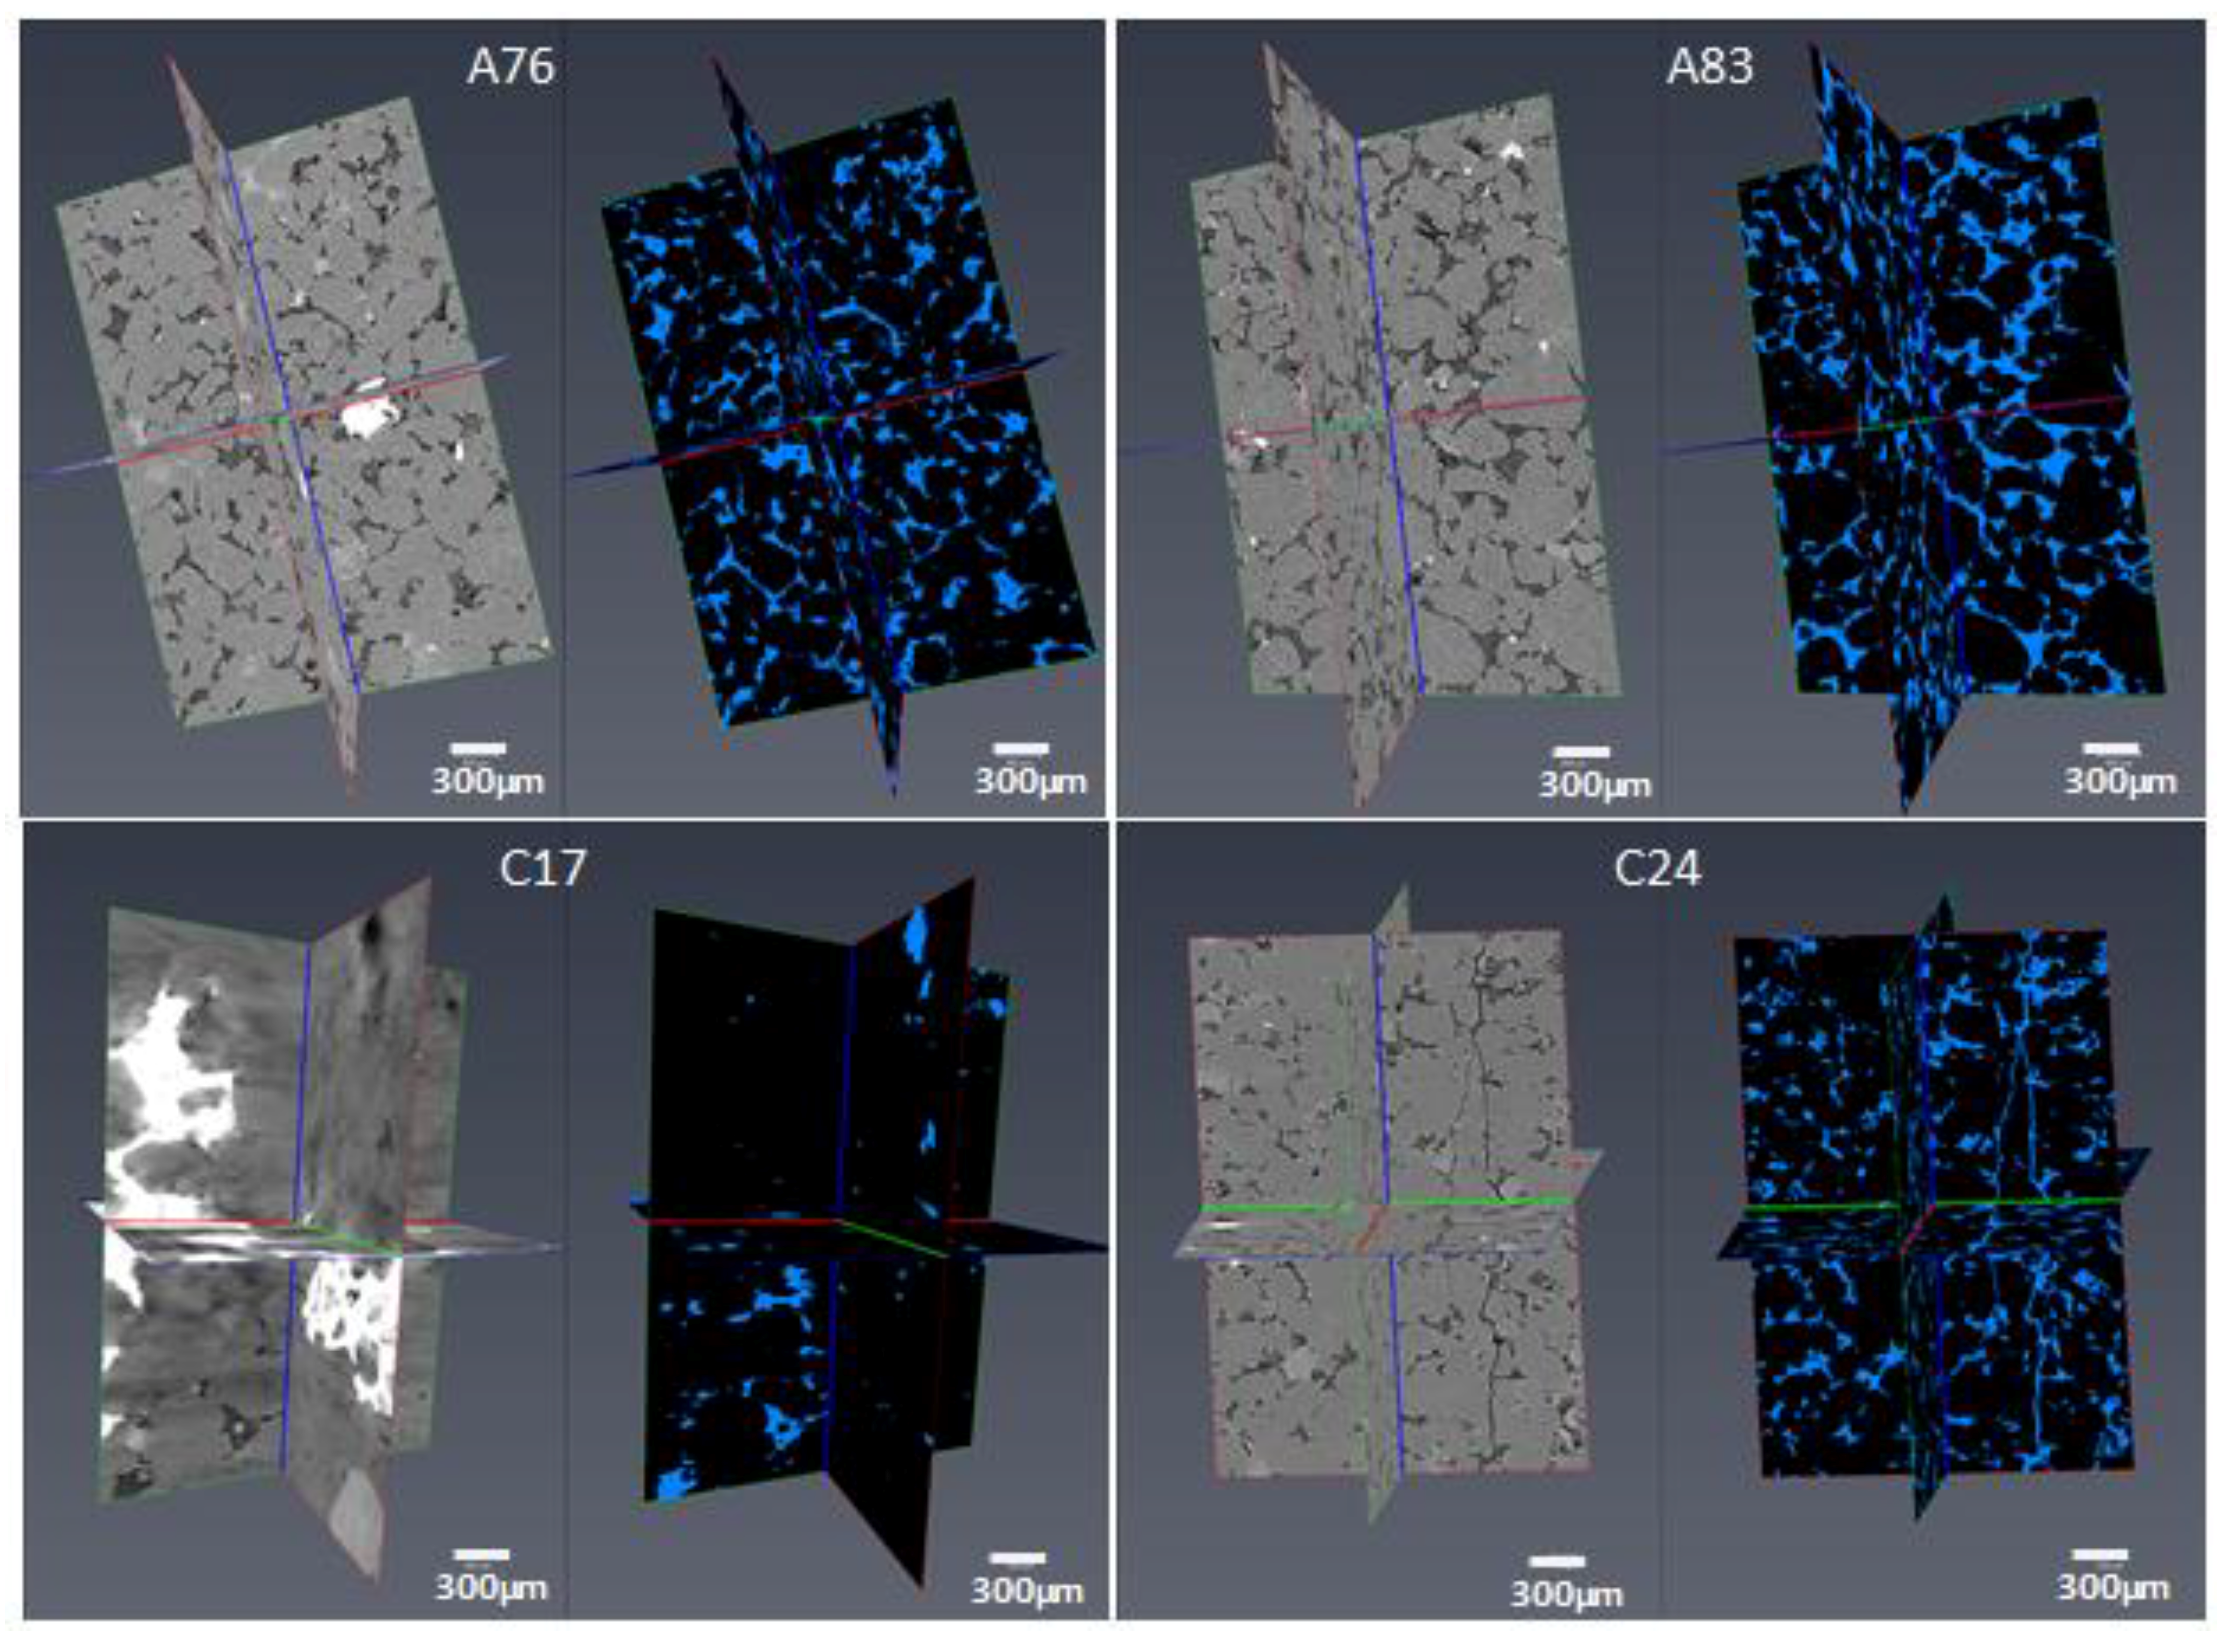
- High-resolution micro-CT images showed that pore throat size plays a very important role in the NMR porosity measurements, and may be responsible for the poor correlation between NMR porosity and gravimetric porosity in the group 2 samples (>7%).
- NMR-estimated permeability in tight sandstones shows fair correlation with helium permeability with an R2 of 0.6 and RMSE of 1.8.
- Electrical resistivity measurements showed that the tight sand samples have a cementation factor of 1.5, when the laboratory measurements are fitted with the Archie model. When a value of tortuosity factor other than 1 is allowed, the cementation factor is about 1 and the tortuosity factor is 5.14. Electrical tortuosity values computed using various empirical models range between 1.2 and 9.6.
Author Contributions
Funding
Acknowledgments
Conflicts of Interest
References
- Saudi Aramco Unconventional Gas: A Growing Resource. Available online: https://www.jobsataramco.eu/people-projects/unconventional-gas-growing-resource (accessed on 8 June 2019).
- Weeden, S. Saudi Arabia Gears Up For Unconventional Gas Exploration. Available online: https://www.hartenergy.com/exclusives/saudi-arabia-gears-unconventional-gas-exploration-19011#p=full (accessed on 8 June 2019).
- Shehata, A.; Tps, A.U.C.; Aly, A.; Schlumberger, A.U.C.; Ramsey, L.; Tgcoe, S. Overview of Tight Gas Field Development in the Middle East and North Africa Region. In Proceedings of the North Africa Technical Conference and Exhibition, Cairo, Egypt, 14–17 February 2010. [Google Scholar]
- Luffel, D.L.; Howard, W.E. Reliability of Laboratory Measurement of Porosity in Tight Gas Sands. In Proceedings of the Low Permeability Reservoirs Symposium, Denver, Colorado, 18–19 May 1987. [Google Scholar]
- Sondergeld, C.H.; Newsham, K.E.; Comisky, J.T.; Rice, M.C.; Rai, C.S. Petrophysical considerations in evaluating and producing shale gas resources. In Proceedings of the SPE Unconventional Gas Conference; Society of Petroleum Engineers, Pittsburgh, PA, USA, 23–25 February 2010. [Google Scholar]
- Song, L.; Warner, T.; Carr, T. An efficient, consistent, and trackable method to quantify organic matter–hosted porosity from ion-milled scanning electron microscope images of mudrock gas reservoirs. Am. Assoc. Pet. Geol. Bull. 2019, 103, 1473–1492. [Google Scholar] [CrossRef]
- Bush, D.C.; Jenkins, R.E. Proper Hydration of Clays for Rock Property Determinations. J. Pet. Technol. 1970, 22, 800–804. [Google Scholar] [CrossRef]
- Sullivan, M.; Song, L. Briggs colour cubing of spectral gamma ray—A novel technique for easier stratigraphic correlation and rock typing. In Proceedings of the SPWLA 58th Annual Logging Symposium, Oklahoma City, OK, USA, 17–21 June 2017. [Google Scholar]
- Morrow, N.R.; Cather, M.E.; Buckley, J.S.; Dandge, V. Effects of Drying on Absolute and Relative Permeabilities of Low-Permeability Gas Sands. In Proceedings of the Low Permeability Reservoirs Symposium, Denver, Colorado, 15–17 April 1991. [Google Scholar]
- Laboun, A.A. Regional tectonic and megadepositional cycles of the Paleozoic of northwestern and central Saudi Arabia. Arab. J. Geosci. 2013, 6, 971–984. [Google Scholar] [CrossRef]
- Al-Harbi, O.A.; Khan, M.M. Source and origin of glacial paleovalley-fill sediments (Upper Ordovician) of Sarah Formation in central Saudi Arabia. Arab. J. Geosci. 2011, 4, 825–835. [Google Scholar] [CrossRef]
- Alqubalee, A.; Abdullatif, O.; Babalola, L.; Makkawi, M. Characteristics of Paleozoic tight gas sandstone reservoir: integration of lithofacies, paleoenvironments, and spectral gamma-ray analyses, Rub’ al Khali Basin, Saudi Arabia. Arab. J. Geosci. 2019, 12, 344. [Google Scholar] [CrossRef]
- Alqubalee, A.; Babalola, L.; Abdullatif, O.; Makkawi, M. Factors Controlling Reservoir Quality of a Paleozoic Tight Sandstone, Rub’ al Khali Basin, Saudi Arabia. Arab. J. Sci. Eng. 2019, 1–19. [Google Scholar] [CrossRef]
- Klinkenberg, L.J. The permeability of porous media to liquids and gases. In Proceedings of the Drilling and Production Practice, New York, NY, USA, 1 January 1941. [Google Scholar]
- Ayling, B.; Rose, P.; Petty, S.; Zemach, E.; Drakos, P. QEMSCAN® Quantitative evaluation of minerals by scanning electron microscopy: capability and application to fracture characterization in geothermal systems. In Proceedings of the Thirty-Eighth Workshop on Geothermal Reservoir Engineering, Stanford University, Stanford, CA, USA, 30 January–1 February 2012; p. 11. [Google Scholar]
- Gottlieb, P.; Wilkie, G.; Sutherland, D.; Ho-Tun, E.; Suthers, S.; Perera, K.; Jenkins, B.; Spencer, S.; Butcher, A.; Rayner, J. Using quantitative electron microscopy for process mineralogy applications. JOM 2000, 52, 24–25. [Google Scholar] [CrossRef]
- Qian, G.; Li, Y.; Gerson, A.R. Applications of surface analytical techniques in Earth Sciences. Surf. Sci. Rep. 2015, 70, 86–133. [Google Scholar] [CrossRef]
- Elster, A. MRIQuestion: T2 Relaxation Definition. Available online: http://mriquestions.com/what-is-t2.html (accessed on 8 October 2019).
- Amaefule, J.O.; Kersey, D.G.; Marschall, D.M.; Powell, J.D.; Valencia, L.E.; Keelan, D.K. Reservoir Description: A Practical Synergistic Engineering and Geological Approach Based on Analysis of Core Data. In Proceedings of the SPE Annual Technical Conference and Exhibition, Houston, TX, USA, 2–5 October 1988. [Google Scholar]
- Al-Ajmi, F.; Holditch, S. NMR Permeability Calibration using a Non-Parametric Algorithm and Data from a Formation in Central Arabia. In Proceedings of the SPE Middle East Oil Show, Manama, Bahrain, 17–20 March 2001. [Google Scholar]
- Winsauer, W.O.; Shearin, H.M.; Winsauer, W.O.; Shearin, H.M., Jr.; Masson, P.H.; Williams, M. Resistivity of Brine-Saturated Sands in Relation to Pore Geometry. Am. Assoc. Pet. Geol. Bull. 1952, 36, 253–277. [Google Scholar]
- Wyllie, M.R.J.; Spangler, M.B. Application of Electrical Resistivity Measurements to Problem of Fluid Flow in Porous Media. Am. Assoc. Pet. Geol. Bull. 1952, 36, 359–403. [Google Scholar]
- Faris, S.R.; Gournay, L.S.; Lipson, L.B.; Webb, T.S. Verification of Tortuosity Equations: GEOLOGICAL NOTES. Am. Assoc. Pet. Geol. Bull. 1954, 38, 2226–2232. [Google Scholar]
- Pirson, S.J. Geological Well Log Analysis; Gulf Publishing Co.: Houston, TX, USA, 1983. [Google Scholar]
- Cornell, D.; Katz, D.L. Flow of Gases through Consolidated Porous Media. Ind. Eng. Chem. 1953, 45, 2145–2152. [Google Scholar] [CrossRef]
- McPhee, C.; Reed, J.; Zubizarreta, I. Core Analysis: A Best Practice Guide; Elsevier: Amsterdam, The Netherlands, 2015. [Google Scholar]




| Components | Range |
|---|---|
| pH | 4.62–6.6 |
| EC, mmho/cm (25 °C) | 96–534 |
| Total Solids (mg/L) | 103,250–369,200 |
| Density (g/mL) | 1.088–1.264 |
| Cl (mg/L) | 46,981–185,596 |
| Br (mg/L) | 411–1492 |
| SO4 (mg/L) | 137–1039 |
| HCO3(mgL) | <1.0 |
| B (mg/L) | 25.16–43.56 |
| Ba(mg/L) | 311–1275 |
| Ca (mg/L) | 16,315–54,500 |
| Fe(mg/L) | 695–66,700 |
| K(mg/L) | 971–2870 |
| Mg (mg/L) | 568–1350 |
| Mn (mg/L) | 48.74–221.24 |
| Na (mg/L) | 16,012–159,575 |
| Si (mg/L) | 10.13–18.46 |
| Sr (mg/L) | 272–1336 |
| Zn (mg/L) | 92.38–188.63 |
| TPH (mg/L) | 1.51–1346.75 |
| Sample ID | Silicates (%) | Carbonates (%) | Pyrite | Clay (%) | Others | FA | |||||||
|---|---|---|---|---|---|---|---|---|---|---|---|---|---|
| Quartz | Feldspars | Mica | Calcite | Siderite | Kaolinite | Chlorite | Illite | Smectite | Glauconite | ||||
| B16 | 90.66 | 0.04 | 3.21 | 0.01 | 0.55 | 0.21 | 0.01 | 0.00 | 0.95 | 0.00 | 0.00 | 1.38 | FA2 |
| B25 | 75.32 | 1.45 | 3.06 | 0.01 | 13.50 | 0.06 | 0.02 | 0.12 | 4.07 | 0.00 | 0.02 | 0.39 | FA3 |
| B33 | 75.12 | 3.10 | 9.27 | 0.01 | 1.76 | 0.05 | 0.03 | 0.11 | 7.81 | 0.00 | 0.01 | 0.49 | FA2 |
| D33 | 64.45 | 1.50 | 1.60 | 0.03 | 21.21 | 0.10 | 0.01 | 0.21 | 1.13 | 0.00 | 0.03 | 8.44 | FA4 |
| D36 | 57.41 | 5.03 | 13.16 | 0.07 | 0.00 | 0.17 | 0.13 | 0.68 | 21.43 | 0.02 | 0.11 | 0.70 | FA3 |
| F117 | 67.44 | 8.91 | 4.13 | 0.05 | 0.26 | 0.15 | 0.03 | 0.48 | 16.04 | 0.07 | 0.04 | 1.63 | FA3 |
| A83 | 80.89 | 1.60 | 2.23 | 0.05 | 0.26 | 0.02 | 0.23 | 0.11 | 7.82 | 0.02 | 0.01 | 1.45 | FA1 |
| C24 | 79.19 | 7.56 | 2.19 | 0.33 | 0.00 | 0.03 | 0.02 | 0.01 | 3.84 | 0.02 | 0.00 | 3.09 | FA2 |
| E7 | 73.93 | 3.65 | 1.75 | 0.82 | 0.00 | 0.01 | 0.02 | 0.22 | 2.06 | 0.04 | 0.06 | 0.34 | FA4 |
| E9 | 86.15 | 3.85 | 3.09 | 0.14 | 0.00 | 0.03 | 0.07 | 0.18 | 5.46 | 0.03 | 0.03 | 0.34 | FA4 |
| A76 | 80.93 | 1.13 | 0.83 | 0.02 | 0.25 | 0.03 | 0.04 | 0.06 | 2.38 | 0.00 | 0.00 | 10.38 | FA1 |
| C17 | 85.15 | 2.05 | 1.34 | 0.72 | 0.00 | 0.02 | 0.01 | 0.00 | 0.90 | 0.01 | 0.00 | 5.29 | FA2 |
| Authors | Tortuosity Model | Equation # |
|---|---|---|
| Winsauer et al. [21] | (9) | |
| Wyllie and Spangler [22] | (10) | |
| Faris et al. [23] | (11) | |
| Pirson [24] | (12) | |
| Cornell and Katz [25] | (13) |
| Tortuosity Model | Tortuosity (τ) |
|---|---|
| Winsauer et al. [21] | 1.28–3.89 |
| Wyllie and Spangler [22] | 2.28–92.55 |
| Faris et al. [23] | 1.34–4.93 |
| Pirson [24] | 1.23–3.1 |
| Cornell and Katz [25] | 1.51–9.62 |
| Sample ID | He-Porosity % | NMR Porosity | Permeability (mD) | RQI (µm) | FZI (µm) | Formation factor (FF) | Tortuosity (τ) * | KNMR (mD) |
|---|---|---|---|---|---|---|---|---|
| D36 | 1.15 | 1.4 | 0.0033 | 0.01682 | 20 | 137.2 | 1.51 | 0.0967 |
| D33 | 1.53 | 0.9 | 0.014 | 0.030036 | 100 | 238.8 | 3.65 | 0.5224 |
| B25 | 1.97 | 2.8 | 0.024 | 0.034772 | 100 | - | - | 0.0976 |
| F117 | 2.46 | 3.7 | 0.05 | 0.044759 | 100 | 376.73 | 9.25 | 0.9415 |
| B33 | 3.17 | 4.9 | 0.014 | 0.020714 | 4 | - | - | 0.3646 |
| B16 | 4.39 | 5.1 | 0.044 | 0.031463 | 4 | - | - | 0.6781 |
| E9 | 7.37 | 4.6 | 0.738 | 0.099349 | 20 | 64.05 | 4.72 | 0.8955 |
| E7 | 7.52 | 3.3 | 0.103 | 0.036748 | 2.5 | 61.72 | 4.64 | 0.075 |
| C24 | 9 | 9.2 | 0.081 | 0.029844 | 2.5 | - | - | 4.5309 |
| C17 | 10.18 | 8.5 | 27.87 | 0.519591 | 10,000 | - | - | 82.9 |
| A83 | 12.05 | 11.2 | 0.99 | 0.089997 | 4 | - | - | 3.9619 |
| A76 | 12.17 | 12.9 | 8.844 | 0.267724 | 100 | 37.29 | 4.54 | 8.7779 |
© 2019 by the authors. Licensee MDPI, Basel, Switzerland. This article is an open access article distributed under the terms and conditions of the Creative Commons Attribution (CC BY) license (http://creativecommons.org/licenses/by/4.0/).
Share and Cite
Adebayo, A.R.; Babalola, L.; Hussaini, S.R.; Alqubalee, A.; Babu, R.S. Insight into the Pore Characteristics of a Saudi Arabian Tight Gas Sand Reservoir. Energies 2019, 12, 4302. https://doi.org/10.3390/en12224302
Adebayo AR, Babalola L, Hussaini SR, Alqubalee A, Babu RS. Insight into the Pore Characteristics of a Saudi Arabian Tight Gas Sand Reservoir. Energies. 2019; 12(22):4302. https://doi.org/10.3390/en12224302
Chicago/Turabian StyleAdebayo, Abdulrauf R., Lamidi Babalola, Syed R. Hussaini, Abdullah Alqubalee, and Rahul S. Babu. 2019. "Insight into the Pore Characteristics of a Saudi Arabian Tight Gas Sand Reservoir" Energies 12, no. 22: 4302. https://doi.org/10.3390/en12224302
APA StyleAdebayo, A. R., Babalola, L., Hussaini, S. R., Alqubalee, A., & Babu, R. S. (2019). Insight into the Pore Characteristics of a Saudi Arabian Tight Gas Sand Reservoir. Energies, 12(22), 4302. https://doi.org/10.3390/en12224302


