Article

Creating Statistics for China’s Building Energy Consumption Using an Adapted Energy Balance Sheet

1
School of Environment and Energy Engineering, Beijing University of Civil Engineering and Architecture, Beijing 100044, China
2
School of Construction Management and Real Estate, Chongqing University, Chongqing 400044, China
3
Wuppertal Institute for Climate, Environment and Energy, 42103 Wuppertal, Germany
*
Author to whom correspondence should be addressed.
Energies 2019, 12(22), 4293; https://doi.org/10.3390/en12224293
Submission received: 2 October 2019 / Revised: 3 November 2019 / Accepted: 8 November 2019 / Published: 11 November 2019

Abstract

:
China’s regular energy statistics does not include the building sector, and data on building energy demand is included in other types of energy consumption in the Energy Balance Sheet (EBS). Therefore data on building energy demand is not collected based on statistics, but rather calculated or estimated by various approaches in China. This study aims at developing and testing China’s building energy statistics by applying an adapted EBS. The advantage of the adapted EBS is that statistical data is from the regular statistical system and no additional statistical efforts are needed. The research result shows that the adapted EBS can be included in China regular energy statistical system and can be standardized in a transparent way. Testing of the adapted EBS shows that China’s building energy demand has shown an annual increase of 7.6% since 2001, and a lower contribution to the total energy demand as compared to the developed world. There is also a close link to lifestyle and living standard while industrial energy demand is mainly driven by economy and decoupling of building energy demand with increasing of building floor area, this is due to a considerable improvement of building energy efficiency. The adapted EBS creates a method for China conducting statistics of building energy consumption at the sector level in a uniform way and serves as the basis for any sound building energy efficiency policy decisions.

1. Introduction

China’s energy consumption has increased dramatically since 1980. Around 2011 China became the largest energy-consuming country, replacing the USA. In 2015, China had a 28% share of the global end-energy demand while USA had a 22% share [1]. Building, transportation and industry are the three key energy demand sectors worldwide. The building sector is responsible for more than 25% of China’s total primary energy consumption and this figure will increase to 35% by 2030. The GHG emissions contributed by the building sector are about 25% of China’s total emissions [2]. Internationally, buildings consume about 30–45% of the global energy demand [3]. Although China’s current building energy consumption share is significantly lower than the international level, the fast urbanization, the fast development of the building sector, rising of living standards and increasing consumption will increase the energy demand in the building sector. China is now facing the challenges of both a fast growing building energy demand and low building energy efficiency. It is estimated that more than 30%–50% of the existing building energy consumption could be saved [4] by adopting various energy efficiency solutions.
Statistics on building energy consumption at the sector level are essential to assess the building energy situation and are indeed used as the basis for any sound building energy efficiency policy decisions. Authorities, building developers, building owners and the public need information about where the building energy demand is and the impact of policy enforcements. The building sector needs information about progress achieved or reasons that prevent progress. The key to meet the information needs mentioned above is to provide complete, timely and reliable data on building energy demand.
In China’s national energy statistical system, the final consumption is composed of seven sectors: (1) farming, forestry, animal husbandry, fishery & water conservancy, (2) industrial, (3) construction, (4) transport, storage, postal and telecommunications services, (5) wholesale, retail and catering services, (6) others, and (7) residential consumption. The energy consumption of buildings is mainly included in the consumption sector and also included in other sectors. There are various studies on statistics and monitoring of energy consumption at a single building level, however, there is no specific sectoral building energy statistical system in China and data on building energy consumption at the sector level is calculated or estimated by various approaches [5]. There are many office buildings in industrial sectors, and those buildings’ energy consumption is included in the energy demand statistics of the industrial sectors. There are similar cases in other sectors of transportation and construction as well. The lack of reliable and accurate data on building energy consumption at a sector level has been a major barrier for policy making at the national and sectoral levels. The establishment of a national statistical system of building energy consumption in China will create a method for determining the statistics of building energy consumption at the sector level in a uniform way and serve as the basis for any sound building energy efficiency policy decisions.
There are many studies aiming at getting data of building energy demand at the sectoral level. The Building Energy Research Centre of Tsinghua University (THUBERC) has developed the China Building Energy Model, CBEM), based on building energy intensity and building floor area, to estimate China’s total building energy consumption [6]. By applying this model, THUBERC publishes an annual report on China’s building energy efficiency, which has been one of the key national sources for different stakeholders to get energy consumption data for the building sector. Wang calculated the total building energy demand based on international EBS, surveys and expert workshops and concluded that China’s building energy demand was 370 million tons-coal-equivalent (tce) in 2006 [7], which accounts for 21.7% of the total energy demand in China. Long [8] developed a model, based on an analysis of China’s energy consumption by sectors and by comparing its industrial structures with USA and Japan, to estimate building energy consumption. According to this model, China’s total energy consumption in the building sector was 330 million tce in 2003, which accounts for 20% of the total energy demand of China. The Ministry of Housing and Urban & Rural development of China estimated the existing building energy consumption based on building stocks, climate zone characters and relevant energy efficiency standards, and concluded that China building energy consumption accounts for 27.5% of China total energy demand. From the literature reviews, there are basically four methods to get information on building energy demand at a sector level:
  • Sampling surveys [8]. Surveys are widely applied to get detailed information on building energy demand. However, it is costly and impossible for surveys to cover all buildings. Therefore sampling surveys are applied. The scale of the survey depends on the resources and complete data of building energy demand at the sector level is calculated, based on the survey results and estimated total floor areas of all types of buildings.
  • Statistics for defined-scale and defined-type buildings [9,10,11,12]. This method builds on building energy consumption statistics that are applied for defined-scale buildings (e.g., with a floor area of more than 10.000 m2) and defined-type buildings (public buildings), and statistics gathered by local statistics departments. Total building energy consumption can therefore be estimated by using the statistical data.
  • Modelling [6,13,14,15]. Modelling is widely used by academic institutes for estimating energy consumption at the sector level. Models are developed based on building types and building stocks, building age, characters of climate zones, and total floor areas of each type of buildings in each of China’s climate zones.
  • EBS together with expert approach [16,17,18]. In the EBS of IEA and other developed countries, energy consumption data is collected for the three main sectors of industrial, transportation and buildings, and thus data of building energy consumption is available from the EBS database. However, building energy consumption data in China’s EBS is divided into the different sectors of industries, transportation, consumptions and others. Thus getting building energy consumption data from China’s EBS needs additional work that may be done by professional energy analysts and therefore the EBS together with expert approach is applied to gather building energy consumption data.
The methods mentioned above have the disadvantages of needing the additional data collection efforts or surveys in addition to regular energy statistics, due to limited samples, using assumptions in modelling, and making estimations by historical experiences. None of the methods mentioned above are standardized and thus it is difficult for China to build up its regional comparisons and benchmarking of building energy performance and compare it to international data.
There have been several studies on China building energy consumption statistics using adapted EBS and those studies are all on a local level [18]. The main disadvantage of these local studies is that the data from EBS is directly used and lacks necessary corrections. This study, built on those local-level studies, focuses on national level and has made necessary amendments to the EBS data. The justified amendments to the data ensure that the study results are closer to the real energy consumption of buildings in China.
EBS is the key resource for all sectors to get energy information. However, building energy consumption is not listed separately in China’s EBS and it is divided among the energy consumptions of different sectors. Therefore the first step of this research is to identify and analyze the data sources and statistical definitions of energy consumption of all sectors included in China’s EBS. China’s EBS has defined the following seven sectors of final energy consumption. This research builds on the following analysis of the final energy consumption of the seven sectors included in China’s EBS:
(S1) Farming, forestry, animal husbandry, fishery & water conservancy. This sector is the primary industry and energy consumption of this sector included in EBS covers all production and production related services energy consumption. Thus final energy consumption of this sector does not include building energy consumption. Energy consumption of transportation of this sector is included in EBS.
(S2) Industry. Industries in China’s EBS include mining and quarrying, machinery, and power, heating, fuel gas and water production and services. The industrial energy consumption in China’s EBS is comparable to but different from the International Energy Agency (IEA) data. There are mainly three differences between China’s and IEA’s industrial energy consumption: (1) China’s industrial energy consumption includes energy consumption of energy industry itself. In IEA energy statistics, energy consumption of energy production is not included in industrial energy consumption but rather listed in the energy loss of energy processing. (2) China’s industrial energy consumption includes the transportation energy consumption of this sector. (3) Industrial building energy consumption is included in industrial energy consumption in China’s EBS.
(S3) Construction. The energy consumption of construction in China’s EBS is mainly the energy consumption of construction process. In IEA’s statistics, construction energy consumption is included in industrial energy consumption. China’s EBS has separately listed construction energy consumption. Similar to the industrial energy consumption of China, construction energy consumption in China’s EBS also includes building energy consumption of construction sector, e.g., office buildings in this sector.
(S4) Transport, storage, postal and telecommunications services. This sector’s energy consumption is mainly from transportation enterprises, and it does not include the transportation energy consumption of other sectors as well as citizens’ transportation energy consumption. Energy consumption of this sector covers building energy consumption of this sector, e.g., the building energy consumptions of airports, railway stations, bus stations and post office buildings.
(S5) Wholesale, retail trade and catering services. These sectors are mainly tertiary industry and main energy consumption of these sectors are building energy consumption. These sectors’ energy consumption is comparable to the IEA’s statistics of energy consumption of commercial and public services.
(S6) Others. Energy consumption of “others” in China’s EBS is defined as the energy consumption of the tertiary industrial energy consumption excluding the abovementioned sectors (S4) and (S5). “Others” includes software and information technology services, financing, real estate industry, education, science, culture and public health and public administrations. Energy consumption of these sectors are mainly from building performance.
(S7) Residential consumption. Energy demand in residential consumption includes the living energy consumption of citizens and is mainly from building performance. It also includes the transportation energy consumption of citizens.
Another issue is how to amend the data of energy consumption of central heating systems from EBS. The existing data of energy consumption of central heating systems from EBS is significantly low and it is necessary to correct this data. As an example [19], the energy consumption of central heating in the sectors of (S5) Wholesale, retail trade and catering services, (S6) Others and (S7) Residential consumption was 31.11 million tce in 2011 and the floor area of the central heating is 5.18 billion m2. Thus the energy efficiency of central heating is 6 kg coal-equivalent per M2, which is incorrect given to the fact that energy efficiency of the most efficient central heating by a large-scale cogeneration project is 9 kg coal-equivalent per m2, and the national average energy efficiency of central heating by regular boilers is 20 kg coal-equivalent per mM2 [19]. There are three reasons that data of energy consumption of central heating system from EBS is significantly low:
(1) Heat metering is not well installed in China, in particular there is almost no heat metering in the buildings built before 2010.
(2) China’s EBS statistics targets enterprises that are on the scale of 20 million Chinese Yuan turnover or energy consumption of above 10,000 tce. There are many SMEs’ heat-generators or heat-suppliers (small and medium enterprises) that do not meet this scale and are therefore excluded from the EBS statistics. Therefore heating generated by those SMEs are not included in the EBS.
(3) Heating energy consumption of cogeneration systems is excluded from the central heating energy consumption, but included in energy consumption of power generation (energy industry energy consumption).
For correcting the data of energy consumption of central heating system from EBS, we use the data of central heating from national and local statistics yearbook. In China, statistics yearbooks include detailed data on central heating and this data covers all heat-generators or heat suppliers regardless of their scale.
Since EBS is recognized as a reliable, timely and complete data source of both energy supply and demand, our focus is to develop and test a method of adapted EBS for providing reliable data of China’s energy consumption at sector level. Specifically this paper makes the following contributions to develop China’s energy consumption statistics by the adapted EBS:
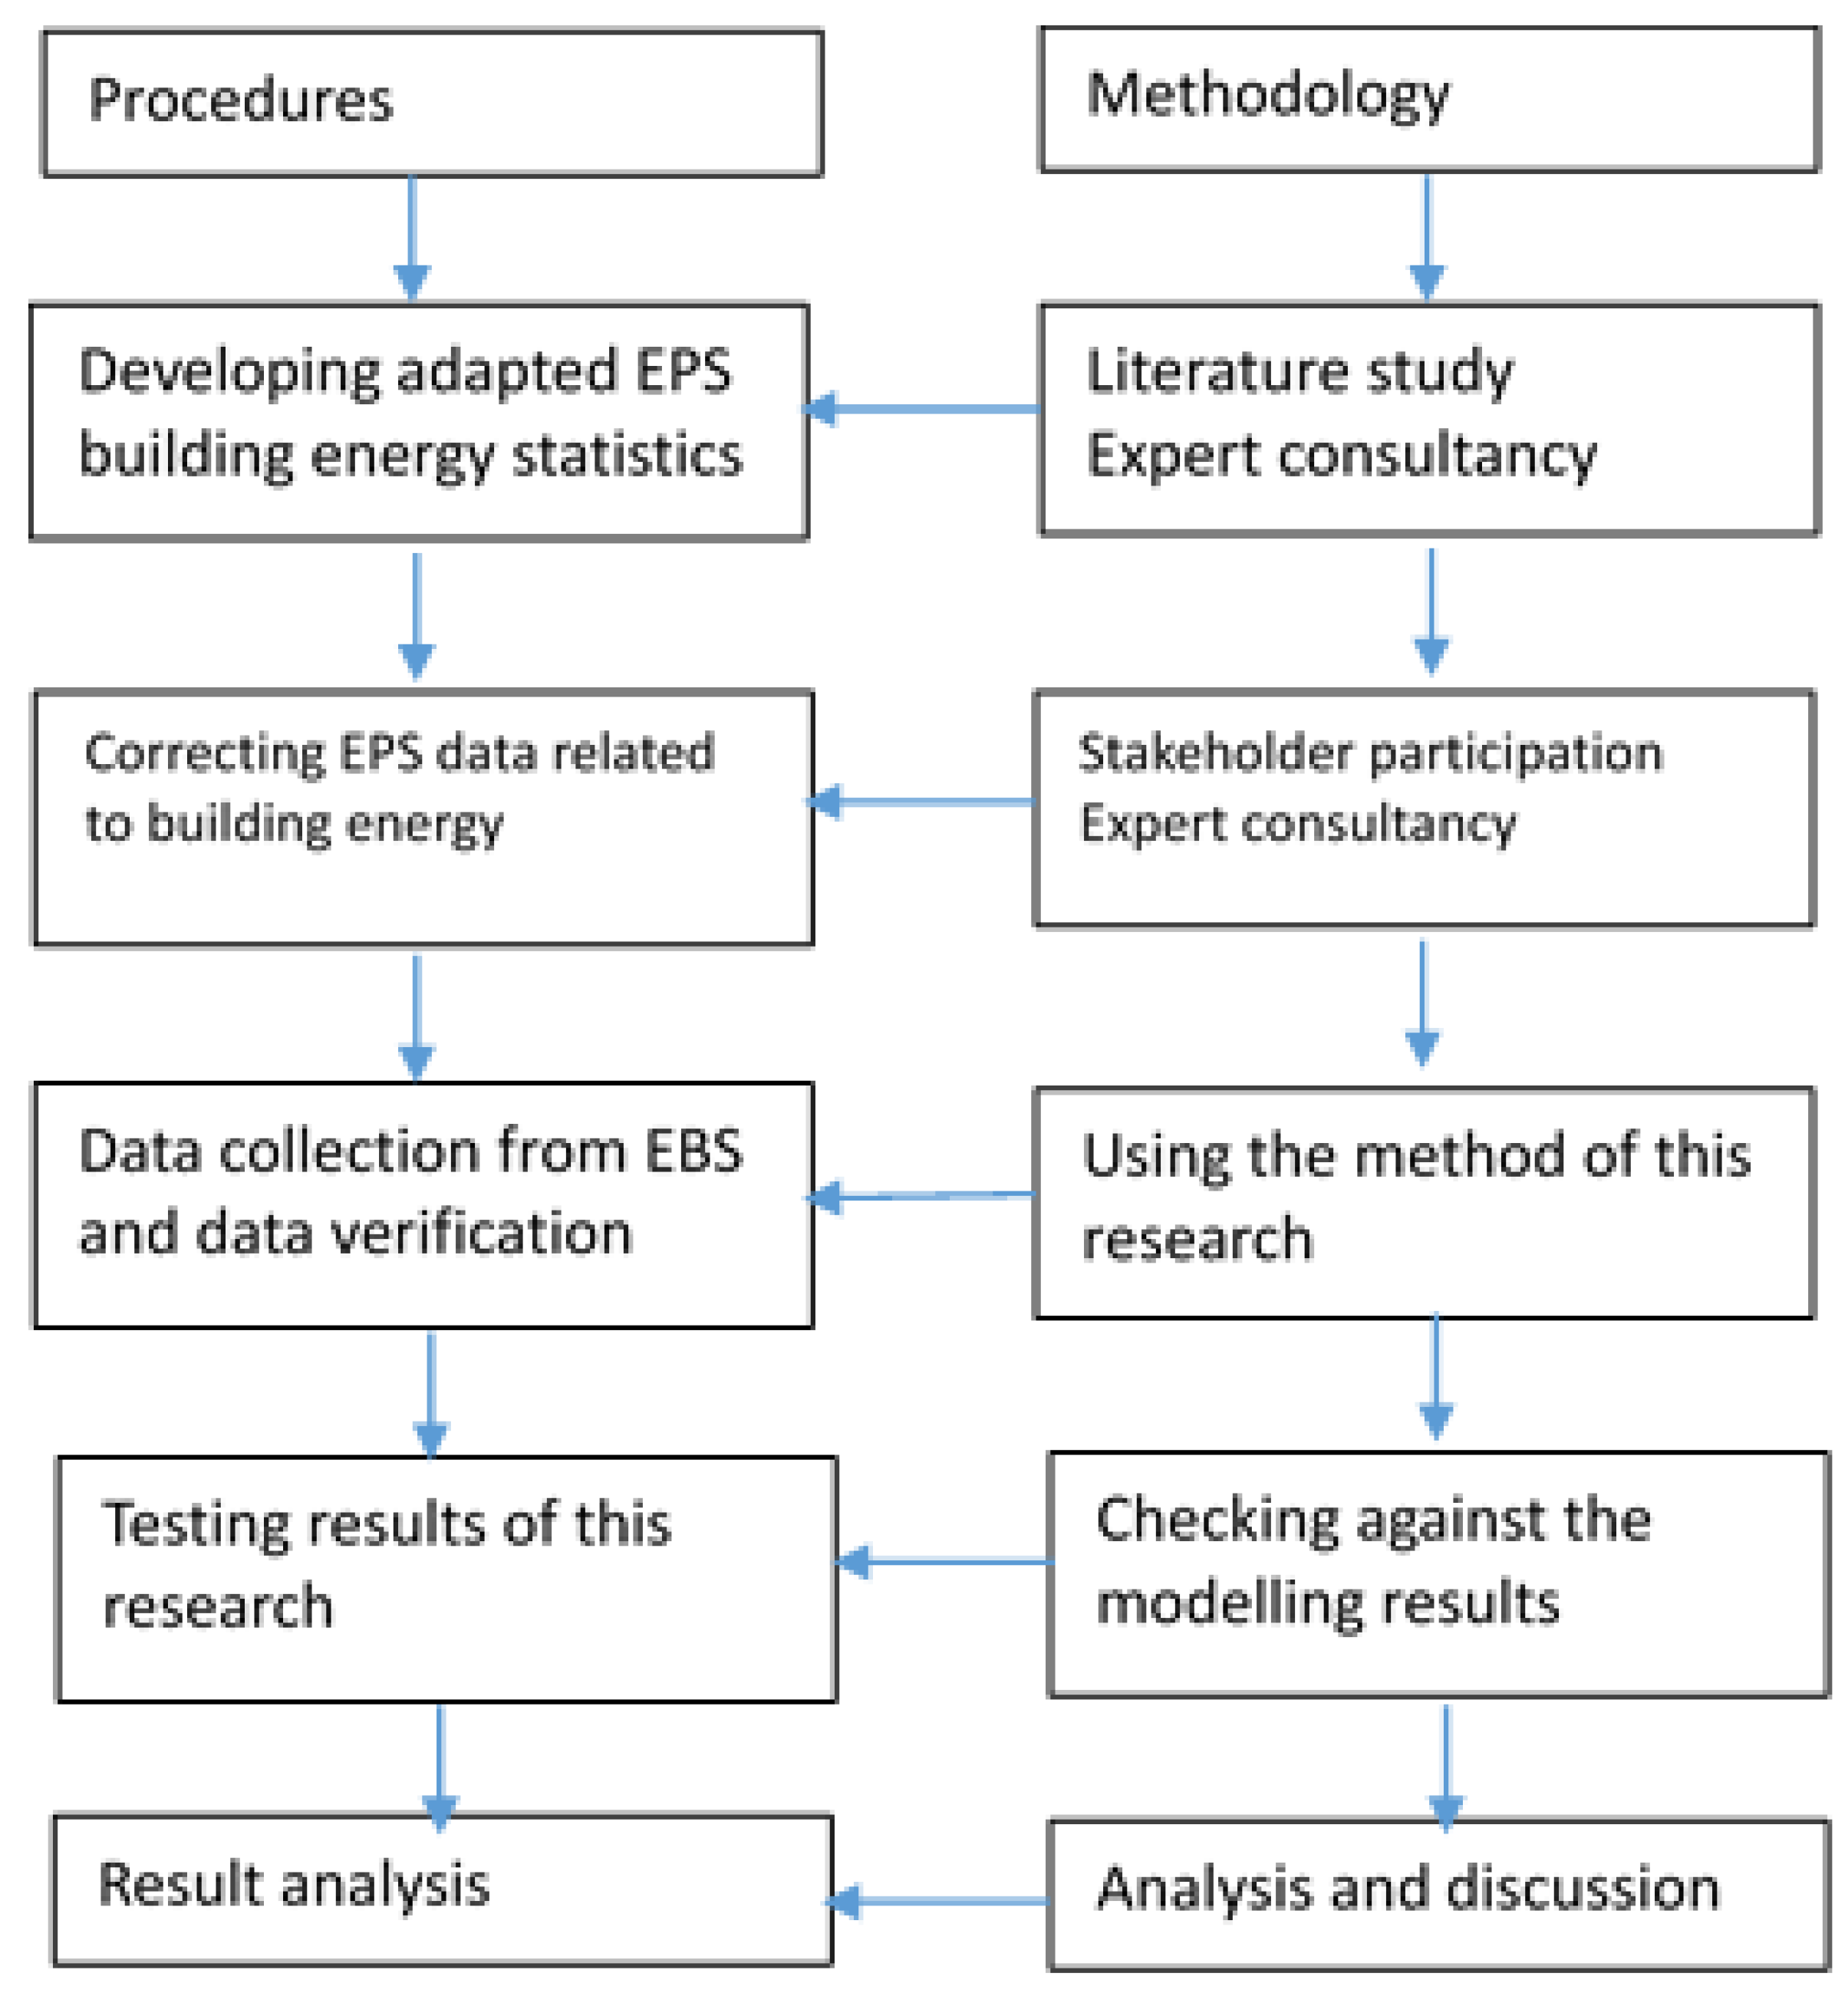
  • Developing and testing a method that is adapted from China’s existing EBS. This method is applied to calculate China building energy consumption at the sector level.
  • Comparing the calculated results of this research with other sources and evaluating what the differences are between this research and other similar researches.
  • Comparing the energy consumption of China’s commercial (so-called public buildings in China), urban residential and rural residential buildings by the calculated results of this research for the period of 2001–2015.
  • Analyzing building energy demand against economic growth to gain insights on differences of energy demand in industrial and building sectors.
  • Comparing China’s building energy demand with international practices, in particular with the USA, European Union and Japan.
  • Recommending how China could build up its building energy consumption statistical system by applying the adapted EBS.

2. Methods

2.1. Procedures and Methods of This Research

The following Figure 1 presents the procedures and methods applied in this research.

2.2. Data Collection and Analysis

Based on the analysis of the existing EBS of China, we develop the following Formula (1) for statistics of complete building energy consumption in China:
Ec = Eb − Et + Eh + Eo
where Ec: complete building energy consumption, Eb: total energy consumption in the sectors of (S5) wholesale, retail trade and catering services, (S6) others and (S7) residential consumption, which are available from the existing EBS, Et: Transportation energy consumption of (S5) wholesale, retail trade and catering services, (S6) others and (S7) residential consumption, Eh: Energy consumption of corrected central heating and Eo: Building energy consumption from the sectors of (S2) industry, (S3) construction and (S4) transport, storage, postal and telecommunications services.
To gather data on Et, we conducted a survey aiming at getting information on the consumption of different types of energy among the sectors of (S5) wholesale, retail trade and catering services, (S6) others and (S7) residential consumption, which are available from the existing EBS. The survey conducted by this study took place between October–December 2018 and it included three phases: 1) collecting data of different types of energy consumption of the sectors of S5, S6 and S7 from national EBS and local EBS of the four megacities of Beijing, Shanghai, Tianjin and Chongqing and seven provinces of Liaoning, Hebei, Shandong, Guangdong, Henan, Sichuan, Ningxia and Gansu. These four megacities and seven provinces are recommended by the China Association of Building Energy Efficiency, given to the facts that: (1) these 11 cities and provinces have quite good energy consumption databases and good EBS, (2) they are good representatives of China’s climate zones and (3) they were willing to cooperate with this research and to answer the questionnaire; 2) sending 11 questionnaires to the energy administrations (local Development and Reform Commission) of the four megacities and abovementioned provinces. All 11 questionnaires were answered and have been sent back for this study. The questionnaires aimed at getting information on allocation of energy consumption among different types of energy in the sectors S5, S6 and S7; 3) analyzing the data and providing survey results. The survey results shows that 95% of gasoline and 35% of diesel are used by transportation of the sectors of (S5) wholesale, retail trade and catering services and (S6) others. Almost 100% of gasoline and 95% of diesel consumption are made by transportation in the sector of (S7) residential consumption. This survey results are in line with the study conducted by Wang [7]. Therefore, in this research, we calculated the Et by using Equation (2):
Et = (95% gasoline consumption + 35% diesel consumption) of Sector (S5) wholesale, retail trade and catering services and (S6) others + (100% gasoline consumption + 95% diesel consumption) of Sector (S7) residential consumption
In Equation (2), data on gasoline and diesel consumption in all sectors is available from the existing EBS in China. Eh is calculated by the following Equation (3):
Eh = total energy consumption of central heating − energy consumption of central heating in sector (S5) wholesale, retail trade and catering services, (S6) others and (S7) residential consumption
The total energy consumption of central heating in Equation (3) is available in the China Statistical Yearbook. Energy consumption of central heating of the sectors (S5) wholesale, retail trade and catering services, (S6) others and (S7) residential consumption is available from EBS.
Eo is calculated by the following Equation (4):
Eo = Ebt + Ebi
Ebt is the energy consumption of buildings in the Sector (S4) transport, storage, postal and telecommunications services. An assumption of this research is that coal consumption is only for building energy performance, given to the fact that coal is not used as power fuel in transportation in China. Therefore, Ebt is the sum of coal consumption and electricity consumption of buildings in Sector (S4) transport, storage, postal and telecommunications.
Ebi is the energy consumption of buildings of the sectors (S2) industry and (S3) construction. Those are mainly office buildings and buildings used for production. Energy consumption of those buildings has a limited contribution to the total energy consumption of buildings. In this research, we organized an expert workshop aiming to estimate Ebi. Sixteen experts participated in this workshop. Twelve experts were energy managers from energy-related sectors. Two experts were from Sectors (S4) transport, storage, postal and telecommunications services and the remaining two experts were from universities. Participants were selected based on criteria like: 1) at least seven years of working experience in statistics or estimation of building energy consumption; 2) good knowledge of building energy efficiency; 3) members of the Expert Committee of China Association of Building Energy Efficiency. The workshop, based on the fact that total floor area of buildings of the sectors of (S2) industry and (S3) construction is about same as the floor area of buildings of Sector (S4) transport, storage, postal and telecommunications services, concluded that Ebi is comparable to Ebt.

3. Results

3.1. China Building Energy Consumption 2001–2015

Figure 2 shows that China’s total building energy consumption increased from 310 million tce in 2001 to 860 million tce in 2015, with an average annual increase of 7.6%, which is in line with China’s total energy consumption that increased from 1560 million tce to 4300 million tce with an average annual increase of 7.5%. Table 1 shows that the increase of both energy demand and building energy demand is different in the three five-year periods of 2001–2005, 2006–2010 and 2011–2015. During the 2001–2005 period (known as the China National 10th Five-Year Plan), building energy consumption was increasing by 11.9%, while the total energy consumption was increasing by 13.9%. However, the increase of building energy consumption slowed down to 5.3% in the National 11th Five-Year Plan of 2006–2010 and to 5.5% in the National 12th Five Year Plan of 2011–2015. The main reason is that China’s national and local governments launched various building energy efficiency initiatives in 2005–2006, and their key initiatives were energy retrofits for existing buildings, promoting green building & low energy building development and compulsorily energy efficiency improvement programme for large-scale public buildings.
Increased building energy consumption is mainly due to the increase of building floor areas and improvement of living standard. However, as shown in Figure 3, the annual growth of building energy consumption has stabilized, while the annual increasing of building floor area has stabilized at about 4%. This decoupling of building energy consumption with increasing building floor area is due to the improvement of building energy efficiency.
Although EBS is recognized as the most reliable energy information source and the original data of this research is from EBS, it is still necessary to compare the result of this research to other sources. Table 2 presents a comparison between this research and building energy consumption data from China Building Energy Model (CBEM). CBEM was developed and being updated by Tsinghua University Building Energy Research Centre (THUBERC). CBEM is based on a sampling of the energy consumption of different types of buildings in different climatic zones. Thus necessary sampling surveys are needed to support CBEM calculation, while the EBS approach of this research is based on official statistics and no additional data collection or survey efforts are needed. Since there is a systematic data verification, data quality control and application of standardized data collection, data from official statistics is highly accepted and well applied by policy makers as well as various stakeholders, while the CBEM approach is widely used by academic institutes and researchers. Table 2 shows a 15-years comparison of the building energy consumption data results from this research and CBEM.
Table 3 presents a comparison of energy consumption of three building types calculated by this research and the CBEM.
CBEM has been the most popular tool in China for estimating building energy consumption at the sector level, and this model is revised regularly. Table 2 shows that energy consumption data generated by CBEM in years of 2001 and 2002 is about 20% higher than the data calculated by this research. The difference is getting smaller in 2003–2005, then the difference has been less than 10% since 2006. The reason of the difference that appeared at the earlier stage is the poor-functioning of CBEM and the fact the model needs to be revised to meet the practical conditions. It is interesting that the CBEM results and the results of this research are aligned perfectly after 2007, which could be evidence that CBEM is now working properly and the data calculated by this research is reliable. Table 3 also shows that energy consumptions per category calculated by this study and CBEM are well aligned. We therefore suggest that both methods can be used at the same time for cross-checking and the method developed by this research can be standardized, since it is based on EBS that is dependent on the regular energy statistical system.

3.2. Energy Consumption of Building Types in China

Types of buildings are categorized into public buildings, urban residential buildings and rural residential buildings in China. Floor areas of public buildings and urban residential buildings are available from the statistics yearbooks. However, there are no statistics on the floor area of rural residential buildings. In this study, the expert workshop organized by this study suggested that the floor area of rural residential buildings could be estimated by the average floor area per farmer and the total population of farmers. Average floor area per farmer is available from both national and local housing authorities and the population of farmers is available from statistics yearbooks. The public buildings (so called commercial buildings internationally) are a mix of various buildings like offices, schools and universities, hotels, theaters, warehouses, airports, train stations, retail stores, etc.. Figure 4 provides information on the building energy consumption by the three building types in China, which shows that energy consumptions of all three types are increasing steadily. The main causes of the increasing energy consumption are the increase of building floor areas and improvement of office conditions and living standard. Energy consumption of public buildings represents a 37%–41% share of the total building energy consumption, the energy consumption of urban residential buildings represents a 36%–39% share and the energy consumption of rural residential buildings has a 23%–25% shares.
As shown in Figure 5, the energy intensity of public buildings is above 30 Kgce/m2 (Kg coal-equivalent), which is the highest among the three building types. The energy intensity of urban residential buildings is almost double that of rural residential buildings. Among the three building types, the energy intensity of rural residential buildings is increasing slightly, due to the significant improvement of living standards in rural areas. Figure 5 shows that energy intensity of public buildings is the highest. It was increasing in the period of 2001–2005 and then stabilized in the period from 2006–2010. It was decreasing in the period of 2011–2015, given to the successful energy efficiency solutions adopted in this period. The energy intensity of urban residential buildings is almost stabilized and is not increasing in response to the significant improvement of office conditions and living standards. This is also due to the achievements of energy efficiency efforts made by the building sectors. Figure 5 shows that energy intensity of rural residential buildings is increasing significantly, due to the significant improvement of living standards in rural areas.

3.3. China Building Energy Consumption Against Economic Growth

As shown in Figure 6, the share of building energy demand in the total energy demand varies from 17% to 21%. The share of building energy consumption is generally decoupled from GDP growth. A lower share of building energy consumption appears when there is higher GDP growth in the period of 2001–2015. During the period of 2002–2007, the GDP growth rate increased annually and reaches its peak of 18.8% in 2007, while the share of building energy consumption decreased from 20.26% in 2002 to 17.86% in 2007. During the period of 2007 to 2014, the GDP growth rate was fluctuating, while the share of building energy consumption is reversely fluctuating. After 2010, the GDP growth is slowing down, while the share of building energy consumption is increasing.
Contrary to the varying share of building energy consumption against GDP growth, the share of industrial energy consumption is coupled with GDP growth, as shown in Figure 7. During the period of 2001 to 2007, the GDP growth rate increased, while the share of industrial energy consumption also increased and reached its peak of 69% in 2007. After 2007, DGP growth is slowing down, and the share of industrial energy consumption is decreasing.
Figure 6 and Figure 7 provide evidence that building energy consumption and industrial energy consumption have different features. Building energy consumption is consumption-related and it is driven by lifestyles and living standards. However, industrial energy consumption is more production-related and it is driven by market and economic activities. Therefore, industrial energy consumption is mainly a consequence of economic development and building energy demand is mainly a consequence of the growing living standards. This can explain why higher GDP growth results in an increasing share of industrial energy demand and a decreasing share of building energy demand in Figure 6 and Figure 7.

3.4. China Building Energy Consumption: an International Comparison

After four decades of high economic growth since 1978 when China started its Reforming and Opening Policy, China has been the largest country in terms of total energy consumption and greenhouse gases emissions. China has a share of 28% of the global energy requirements, followed by USA with a share of 22% and by European Union with a share of 15% [1]. However, USA is the largest country in building energy consumption, with a share of 17% of global building energy consumption, while China has a share of 14%. Table 4 provides information that building energy consumption internationally accounts for as much as 30–40% of the global energy requirements. However, China is exceptional and its building energy consumption accounts for only 20.5% of total energy consumption, given the fact that China is still in its high-speed industrializing process and its industrial sectors are more energy-intensive and have a major contribution to total energy consumption, as shown in Figure 2.

4. Discussion

The establishment of building energy consumption statistics by adapted EBS creates a method for China to establish statistics of building energy consumption in a uniform way. An advantage of the adapted EBS is that statistical data comes from the regular statistical system and no additional statistical efforts are needed. However, the adapted EBS method has its limitations. First, all data related to building energy demand is extracted from existing EBS and thus various assumptions are made. Those assumptions are only related to the items (e.g., office building energy consumption in the sectors of transport, storage, postal and telecommunications services, industries and construction) of building energy consumption that have less than 5% contributions to the total energy consumption of buildings. This may cause errors in the final calculation of building energy demand, although we can be sure that those errors are not more than the errors generated by methods of sampling surveys, incomplete statistics, modelling and estimations. Further research is needed for identifying the error percentage and for assuming that the error can be negligible. Second, bio-energy has been widely used in Chinese rural residential buildings and this bio-energy consumption is not included in this adapted EBS system. This means that energy consumption of rural residential buildings calculated by this research is lower or significantly lower than the actual energy consumption of rural buildings. Third, our research finds that data on China building floor areas from various sources are quite different, since not all buildings are registered in building departments. The China Association of Building Energy Efficiency estimates that about 15%-25% of the existing buildings are not registered [19]. Thus building energy intensity calculated by this research is about 20% higher than the actual value. Therefore we suggest that building energy statistics and a complete building registration system should be established together. Lastly, there are more and more clean energy used at a single building scale in China [20,21] at this moment. In the existing China EBS, large-scale renewable energy production (e.g., hydropower) is already included. Clean energy production at a single building level (e.g., solar) is not included in the national EBS and thus clean energy uses at a single building scale is not included in this study. Thus further studies are needed for incorporating clean energy uses into the building energy consumption data. By doing so, the adapted EBS methods can be used to calculate CO2 emissions. Further research is also needed to test and ascertain whether this adapted EPS approach can truly help China in establishing building energy consumption statistics at both national and local levels.

5. Conclusions

China’s energy statistical system is different from the IEA system. Building energy demand is not a statistical sector in China’s EBS and thus data on building energy demand is not available directly from China’s EBS [22]. To gather data on China’s building energy demand at the sector level, various methods have been developed, tested and applied [6,19]. All the methods are based on limited sampling, incomplete statistics, modelling and estimations and thus those methods are not standardized and it is difficult to conduct regional comparisons and benchmarking in the building energy sector. This study explores a possibility where data on energy demand of the building sector can be made available from an adapted China EBS. Since EBS is the most reliable energy data source, our method can be standardized and thus will enable regional and international comparisons and benchmarking. Our study contributes to build up China building energy statistics and our key findings include six perspectives:
  • The building energy statistics by adapted EBS covers all types of buildings (commercial and residential buildings and multi-functions buildings that are used by sectors of industry, transportation and others), and it provides reliable, detailed and complete data on energy demand in China’s building sector. Based on EBS data, this method can be included in regular energy statistical system and can be standardized in a transparent way. Thus data generated by this method will ensure the international, national and regional comparisons and benchmarking of building energy demand.
  • Data comparison between this research and the existing most adopted China Building Energy Model (CBEM) shows no significant differences. We therefore suggest that both methods can be used for cross-checking to build up China statistics of building energy consumption.
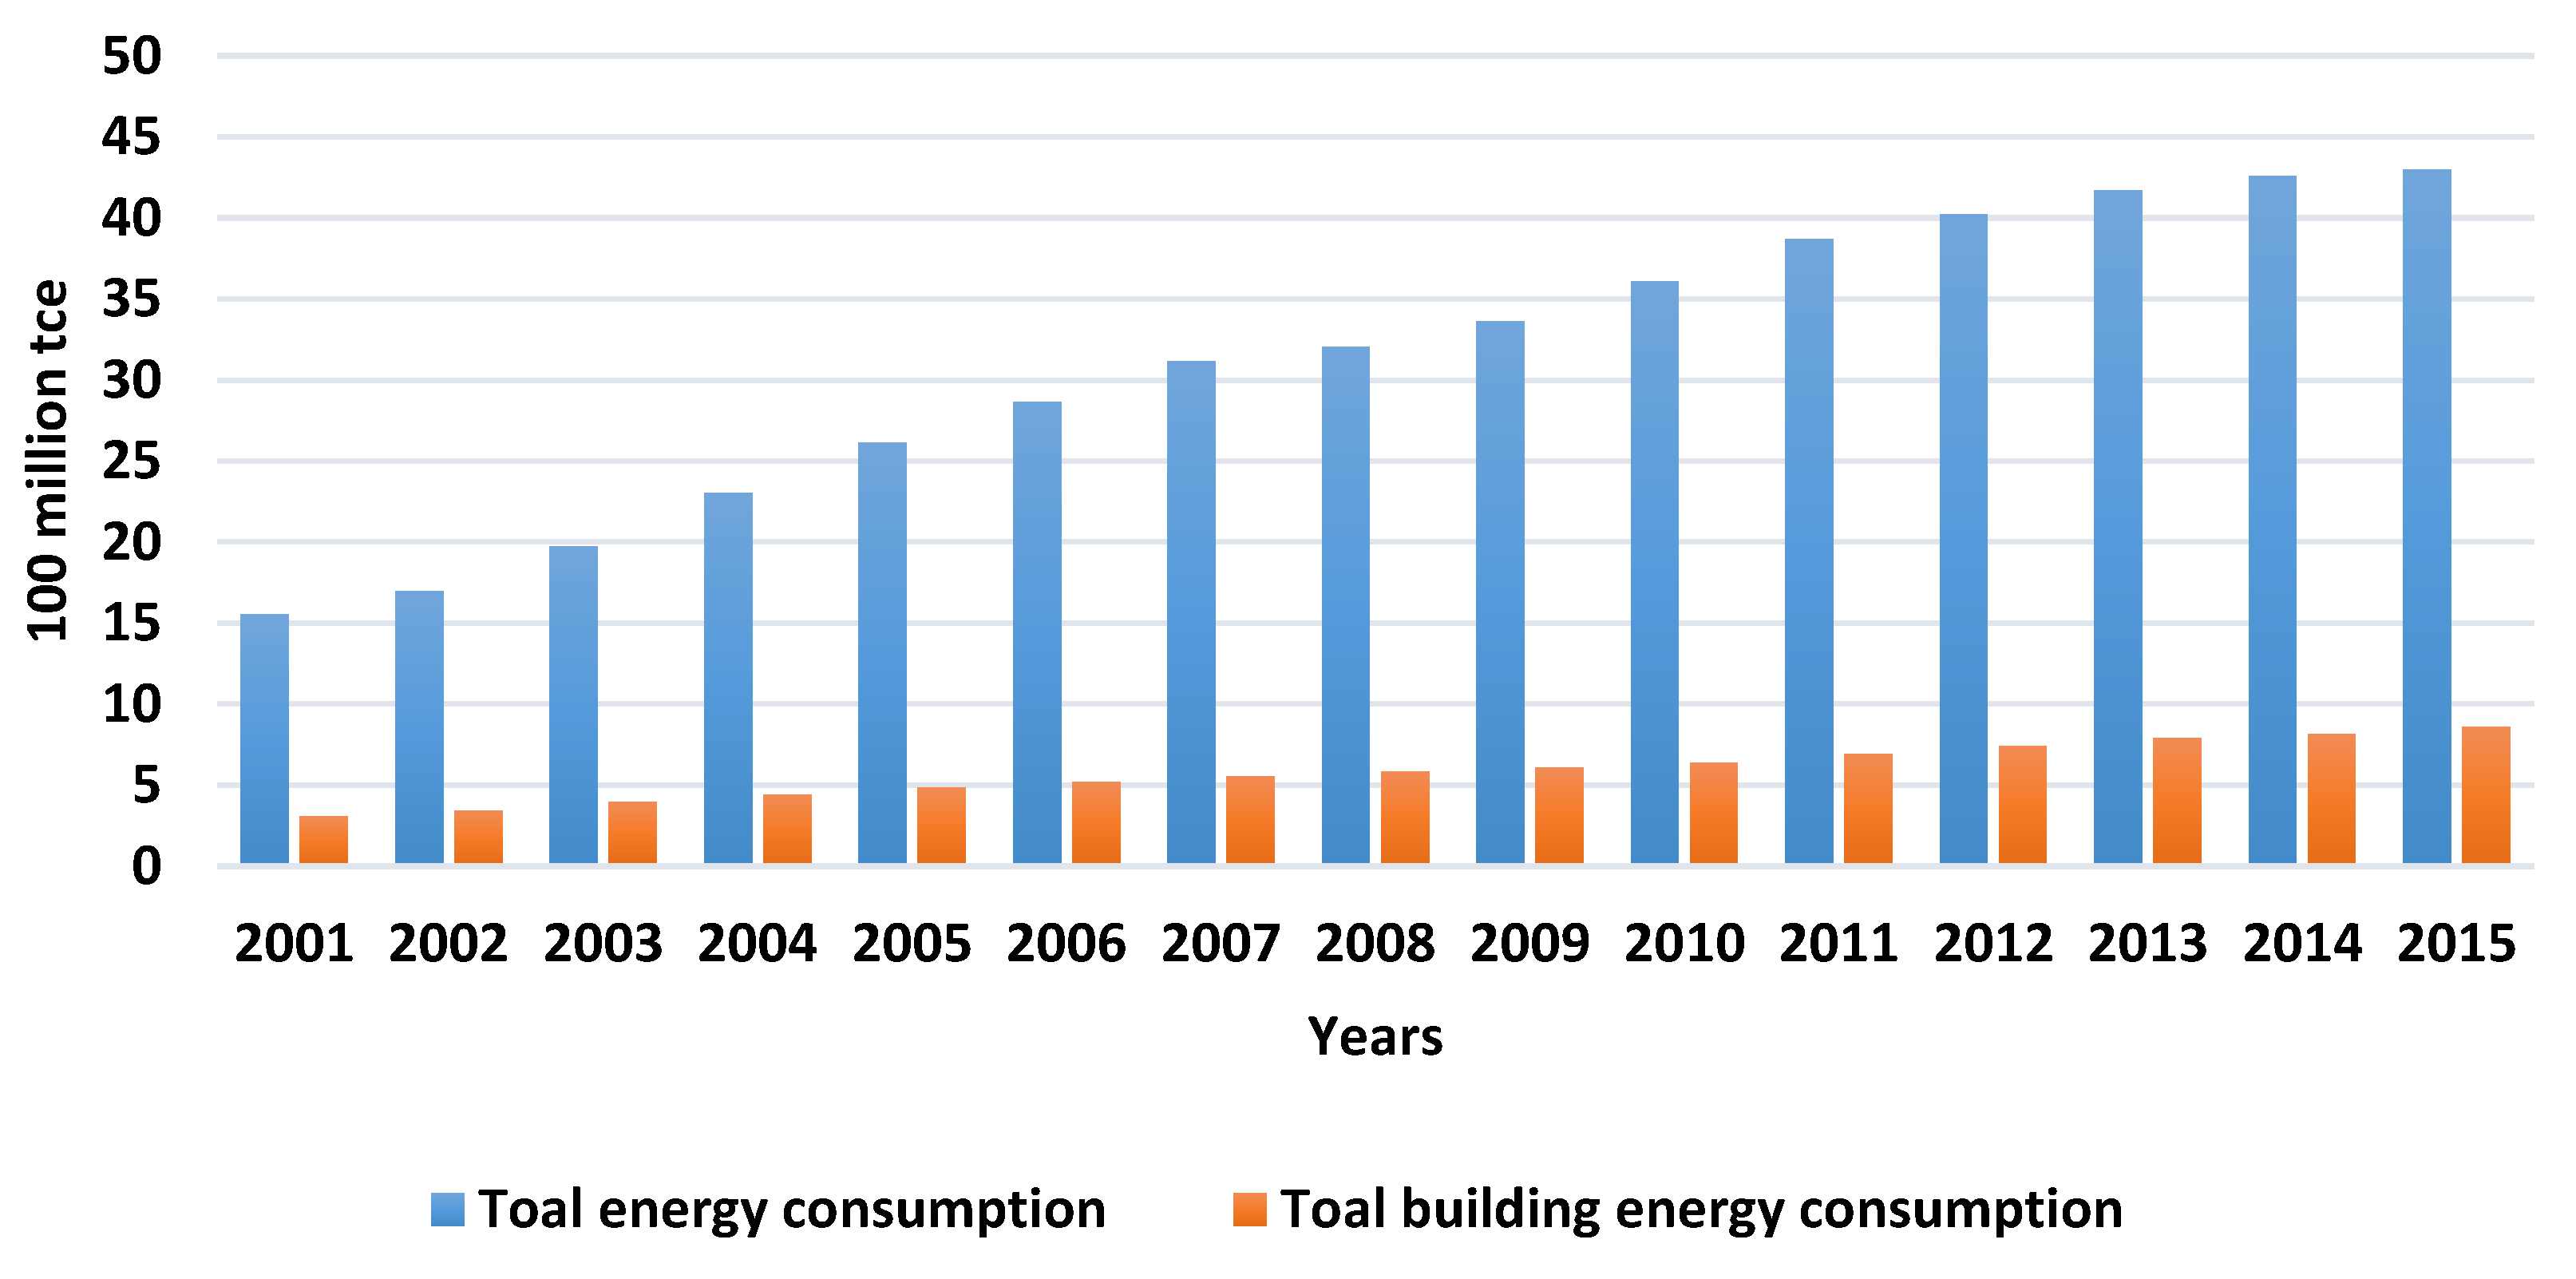
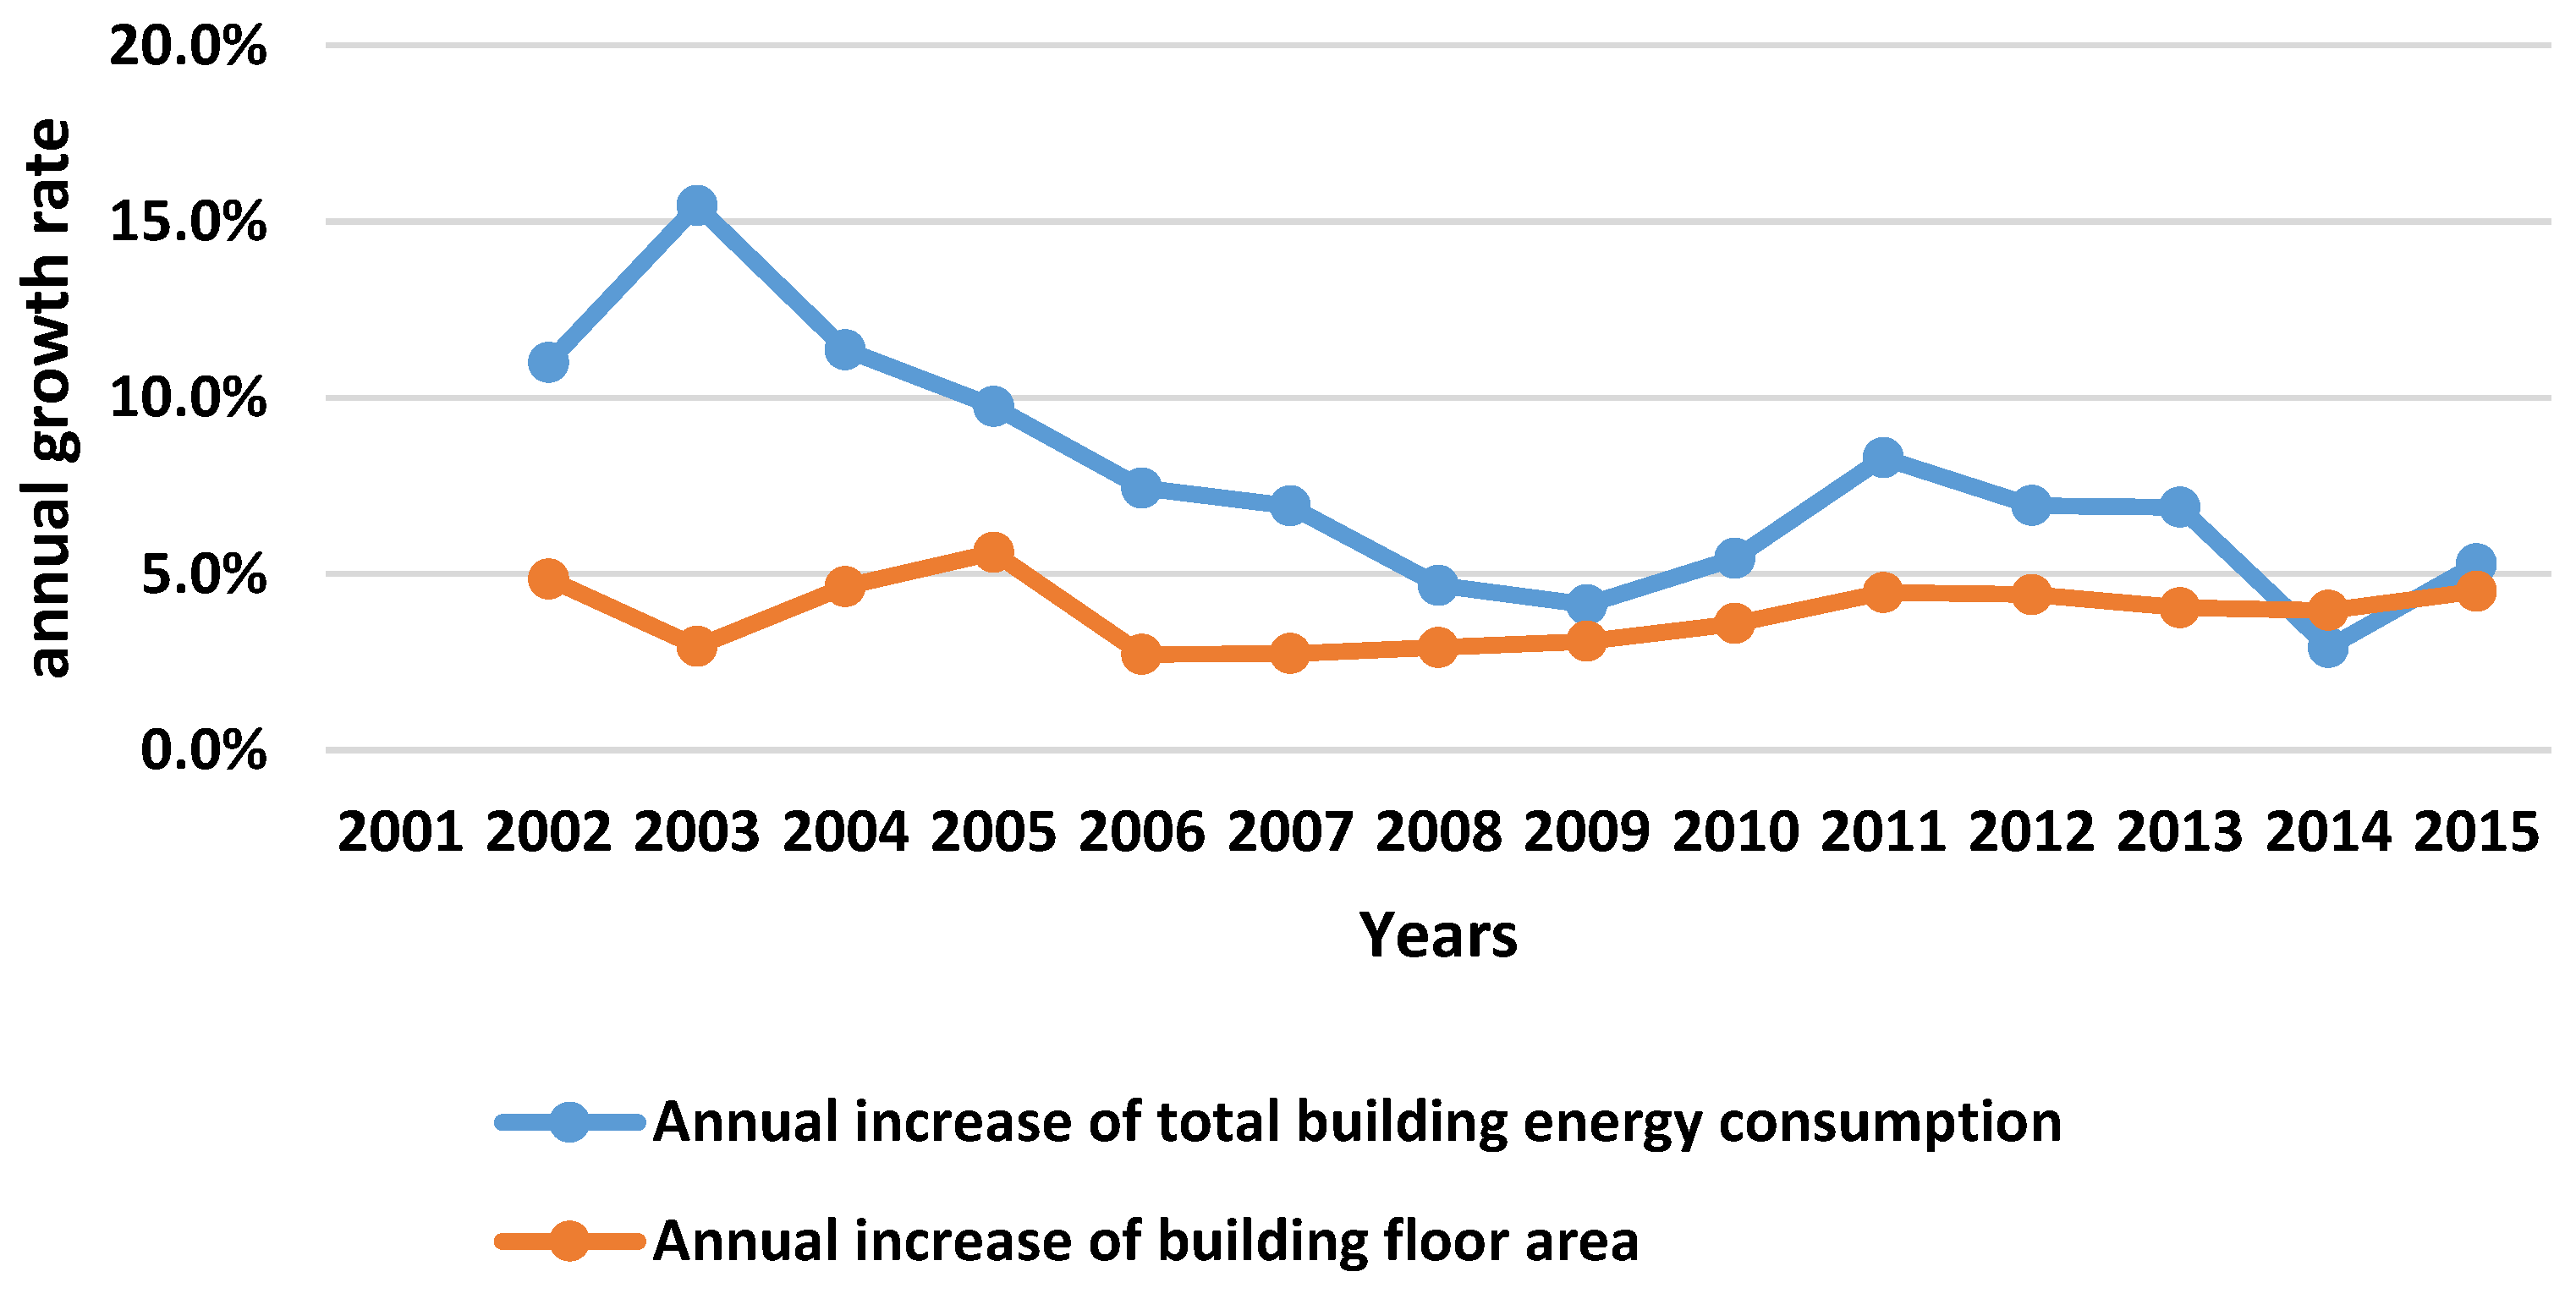
  • Both total energy consumption and building energy consumption have increased by about 7.6% in China since 2001. However the growth rate of total energy consumption is slowing down and annual growth of building energy consumption has been stabilized, although total building floor area is increasing by about 4%. Decoupling of building energy consumption with increasing of building floor area is due to the improvement of building energy efficiency.
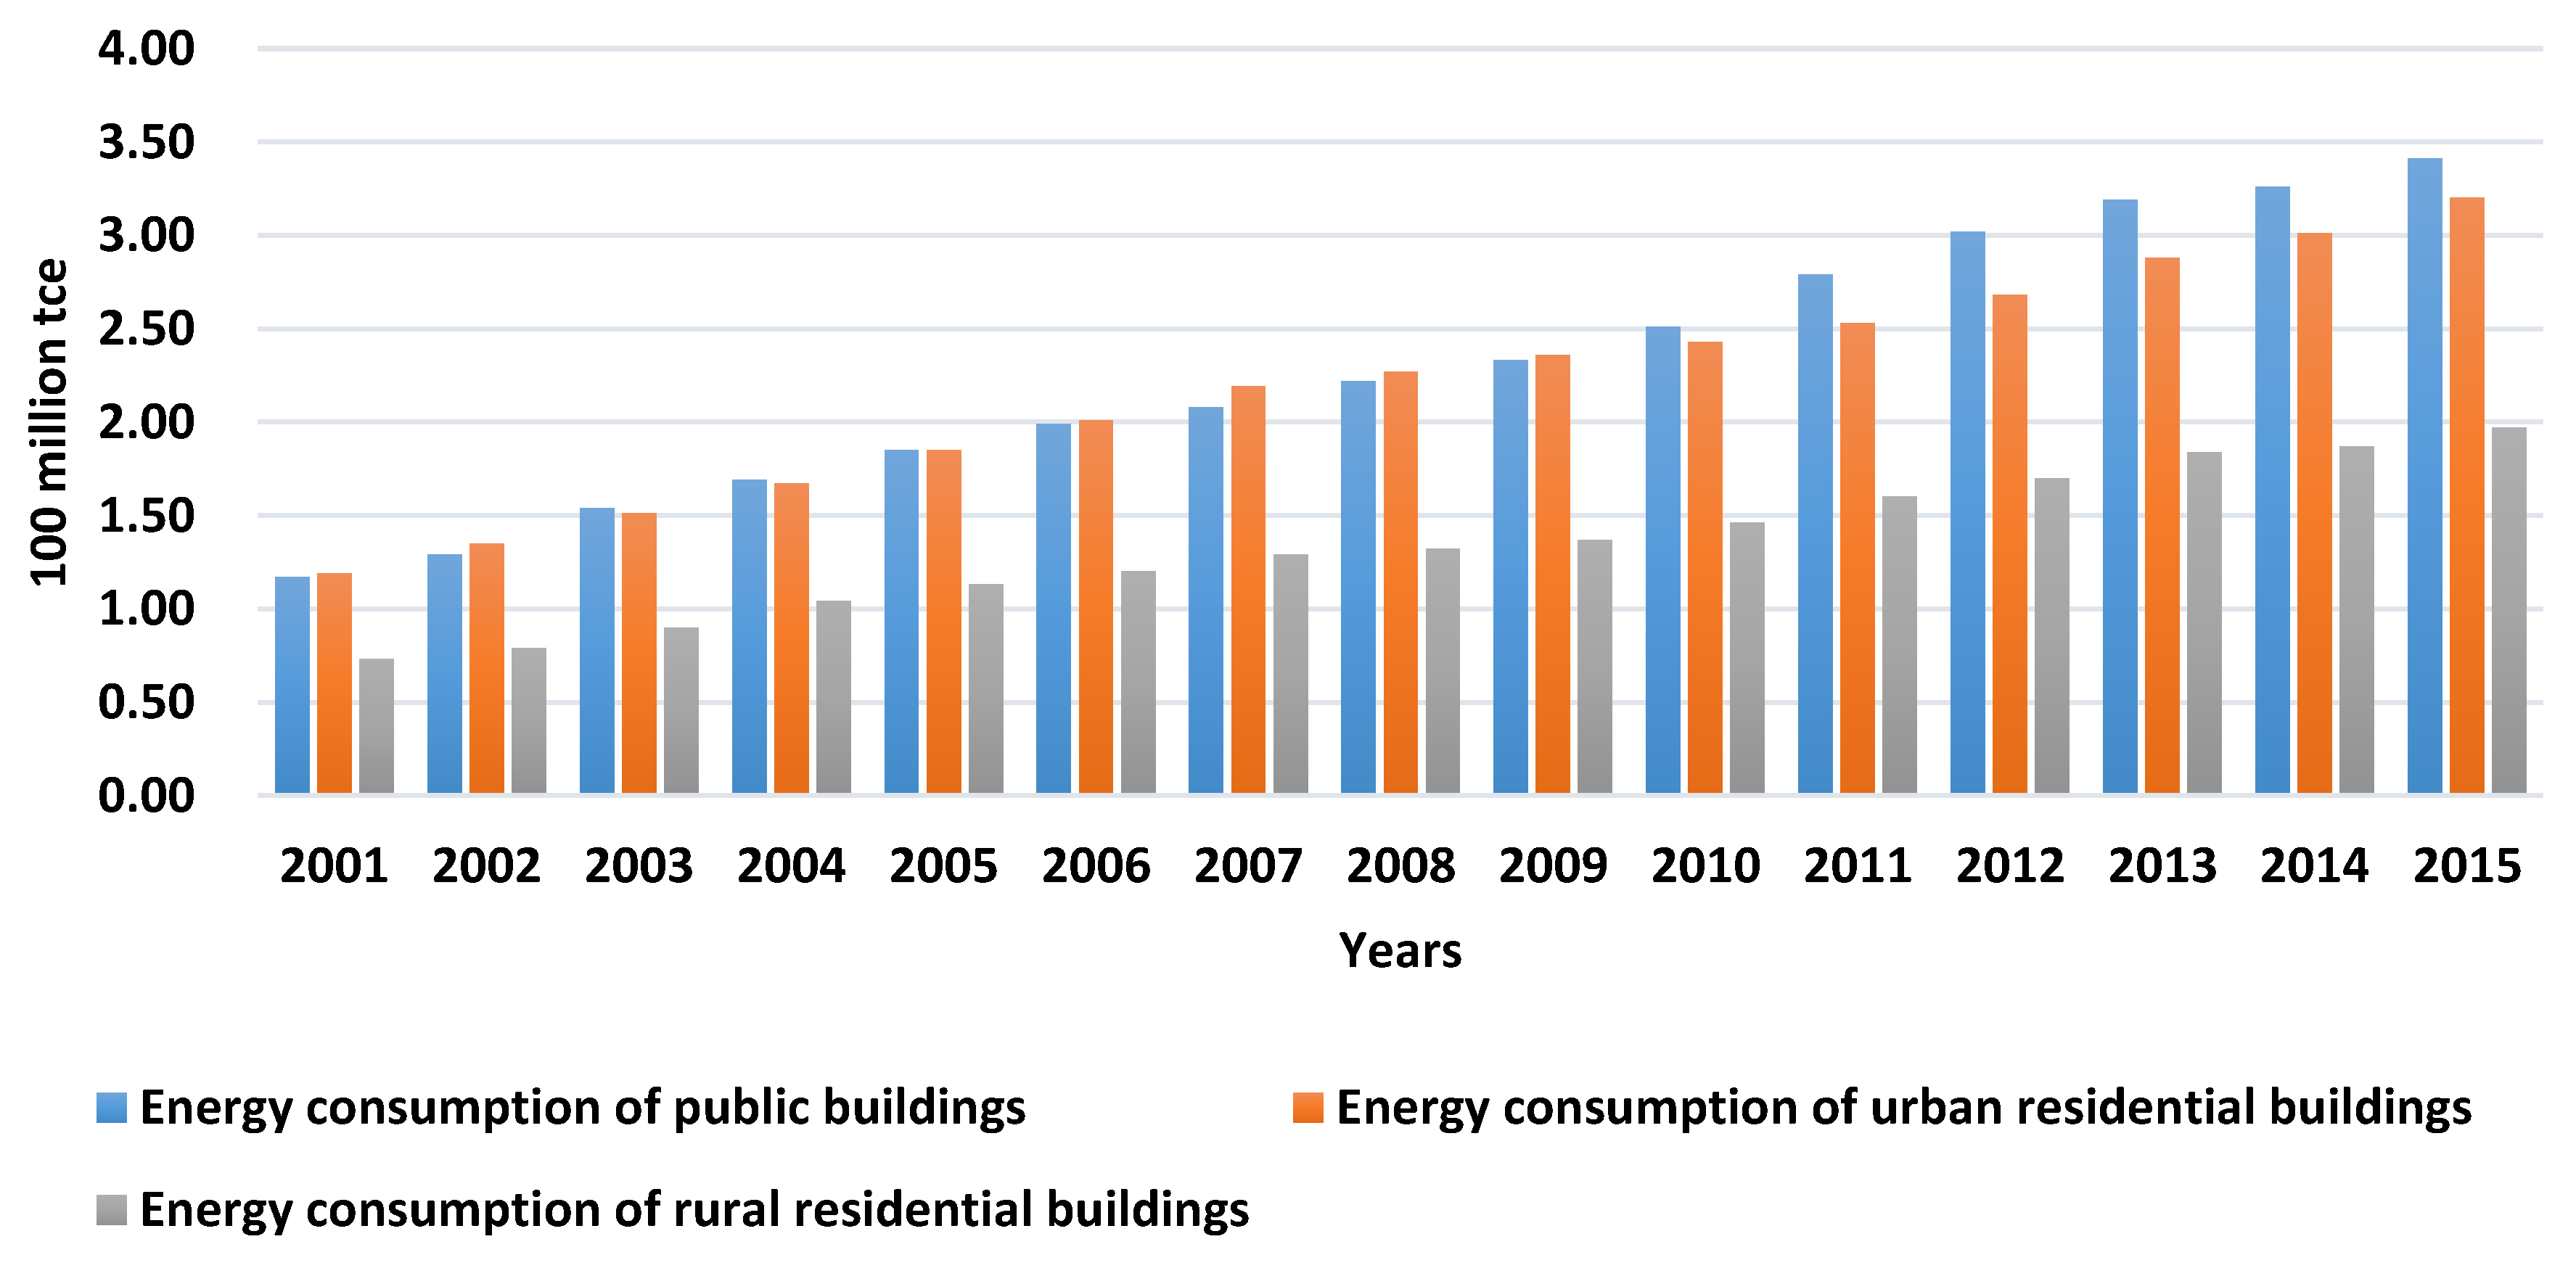
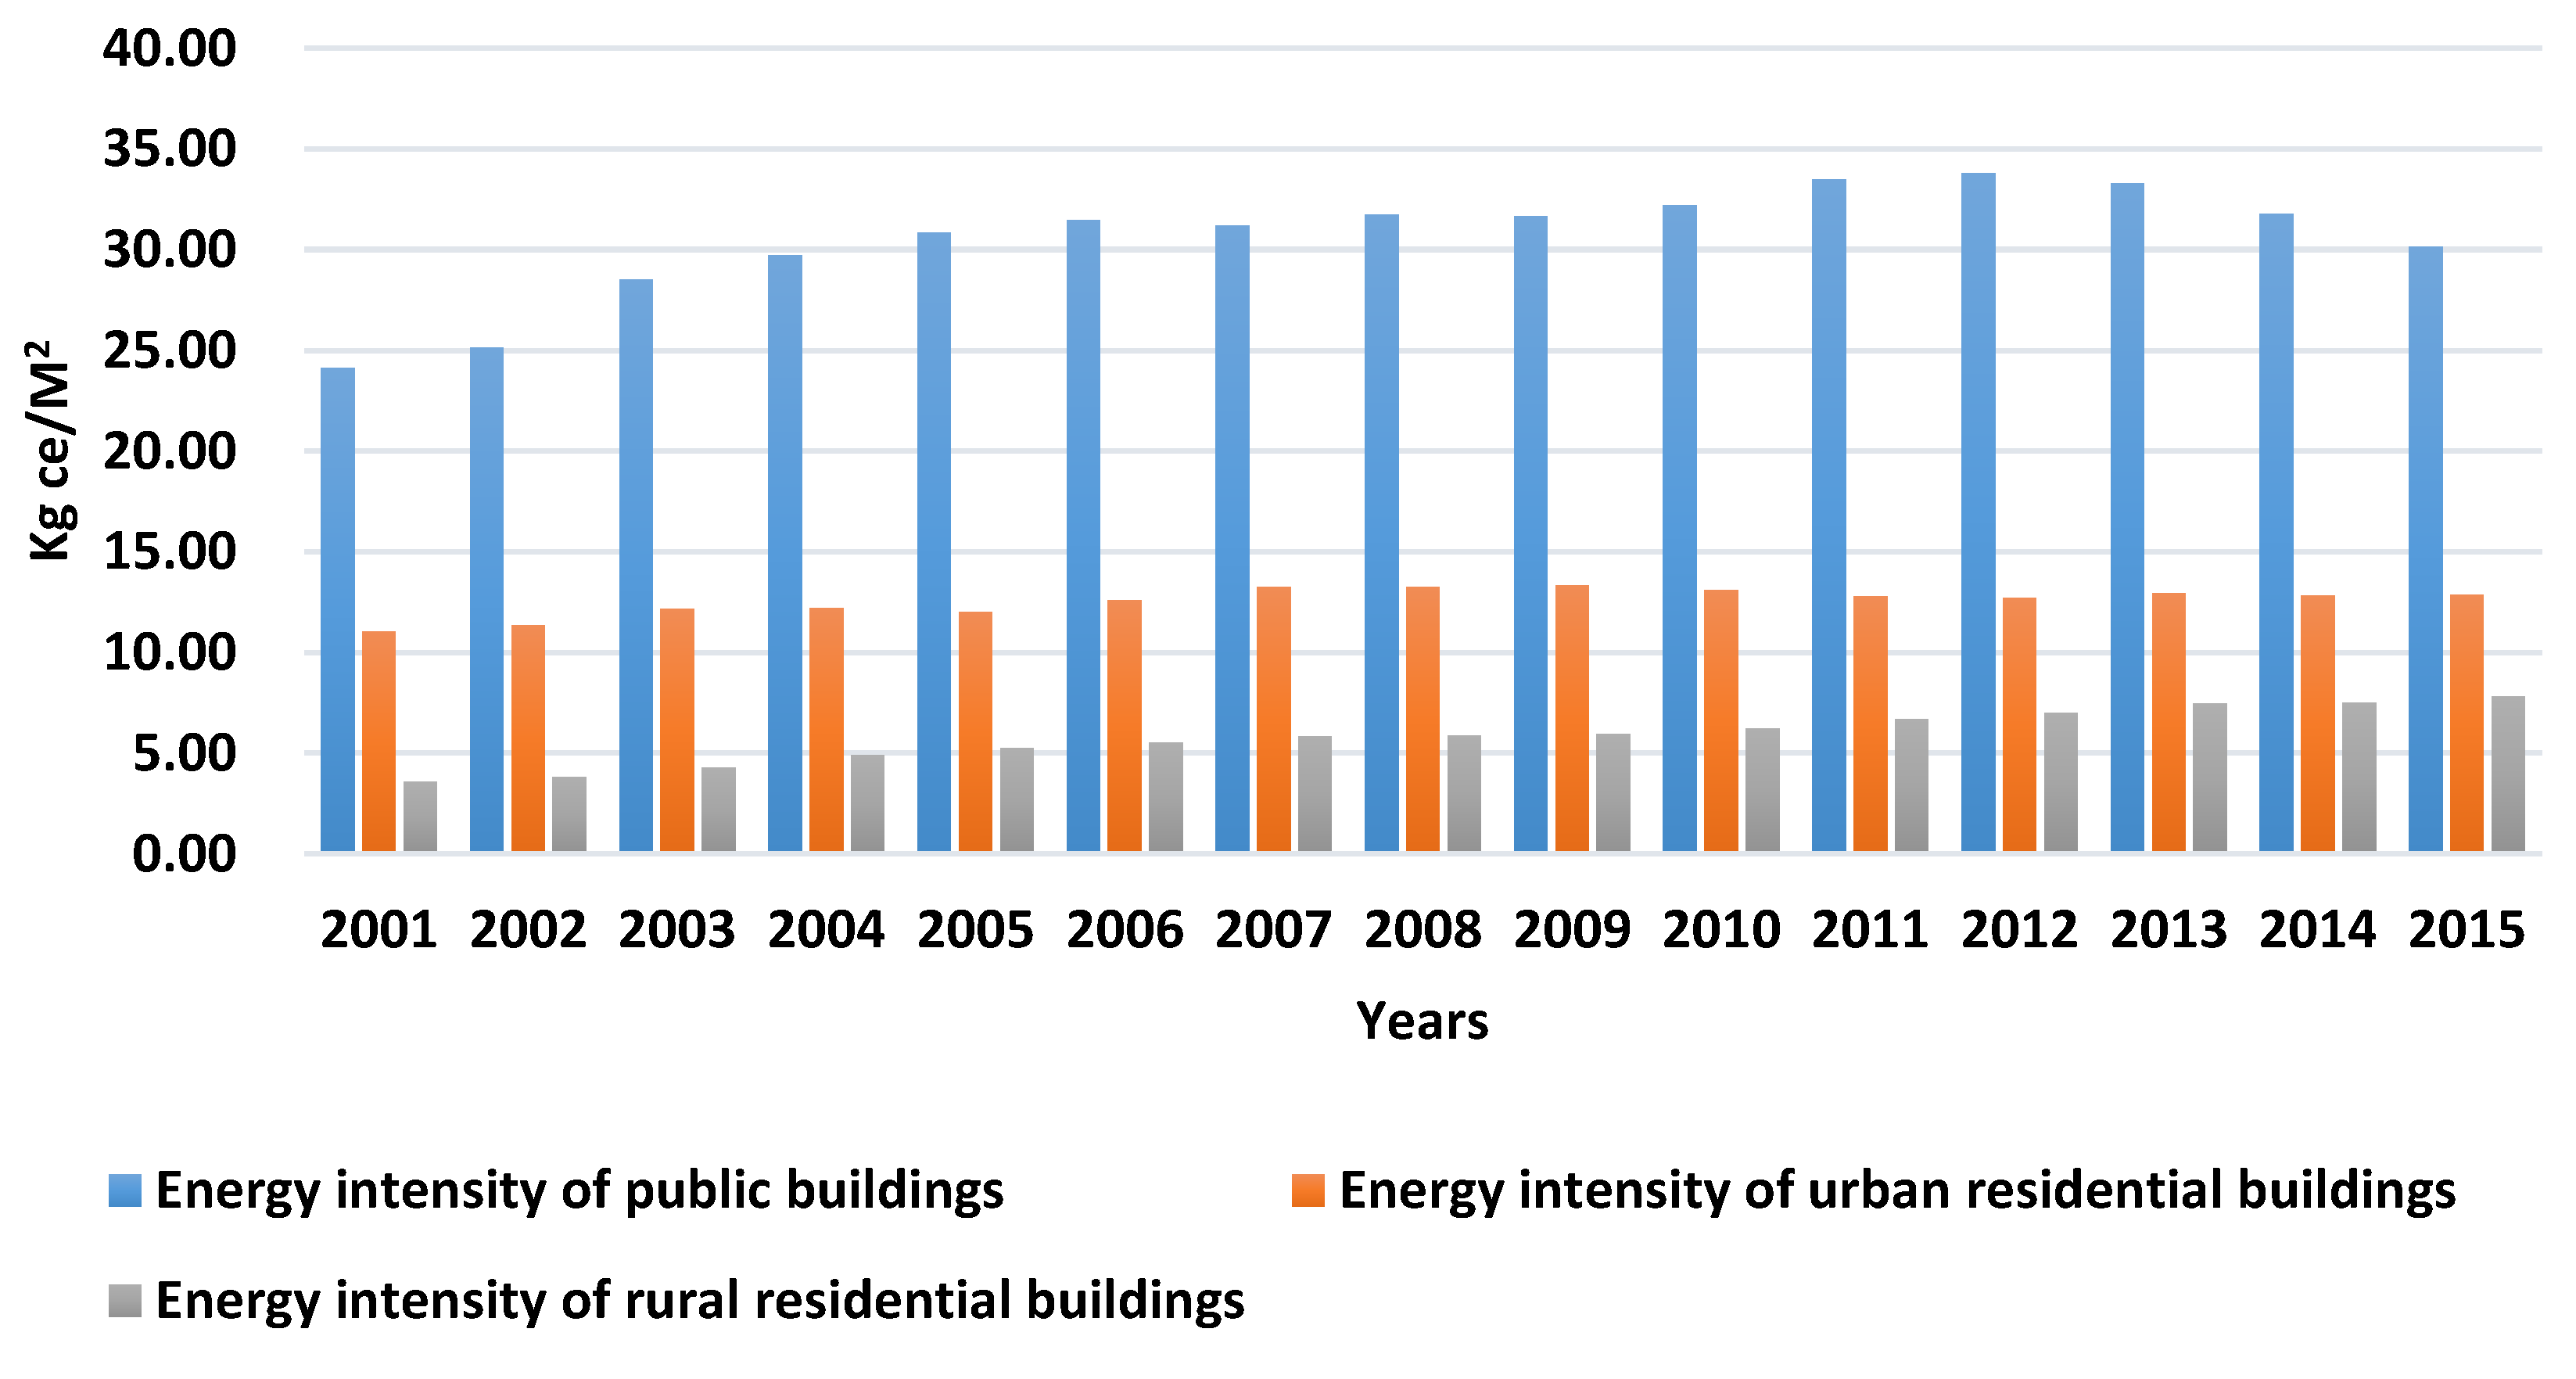
  • The energy consumption of public buildings accounts for a 37%–41% share of the total building energy consumption, residential buildings represent 36%–39% and rural residential buildings have a 23%–25% share in China. The energy intensity of commercial buildings is the highest compared to urban and rural residential buildings and the energy intensity of urban residential buildings is almost double that of rural residential buildings in China. This is completely different from the situation in Europe, where the energy efficiency of rural households is always higher than in urban households [23]. This research concludes that there are tremendous differences in the building energy efficiency of rural buildings between China and Europe, since building energy efficiency solutions are less developed in rural China [24,25,26,27].
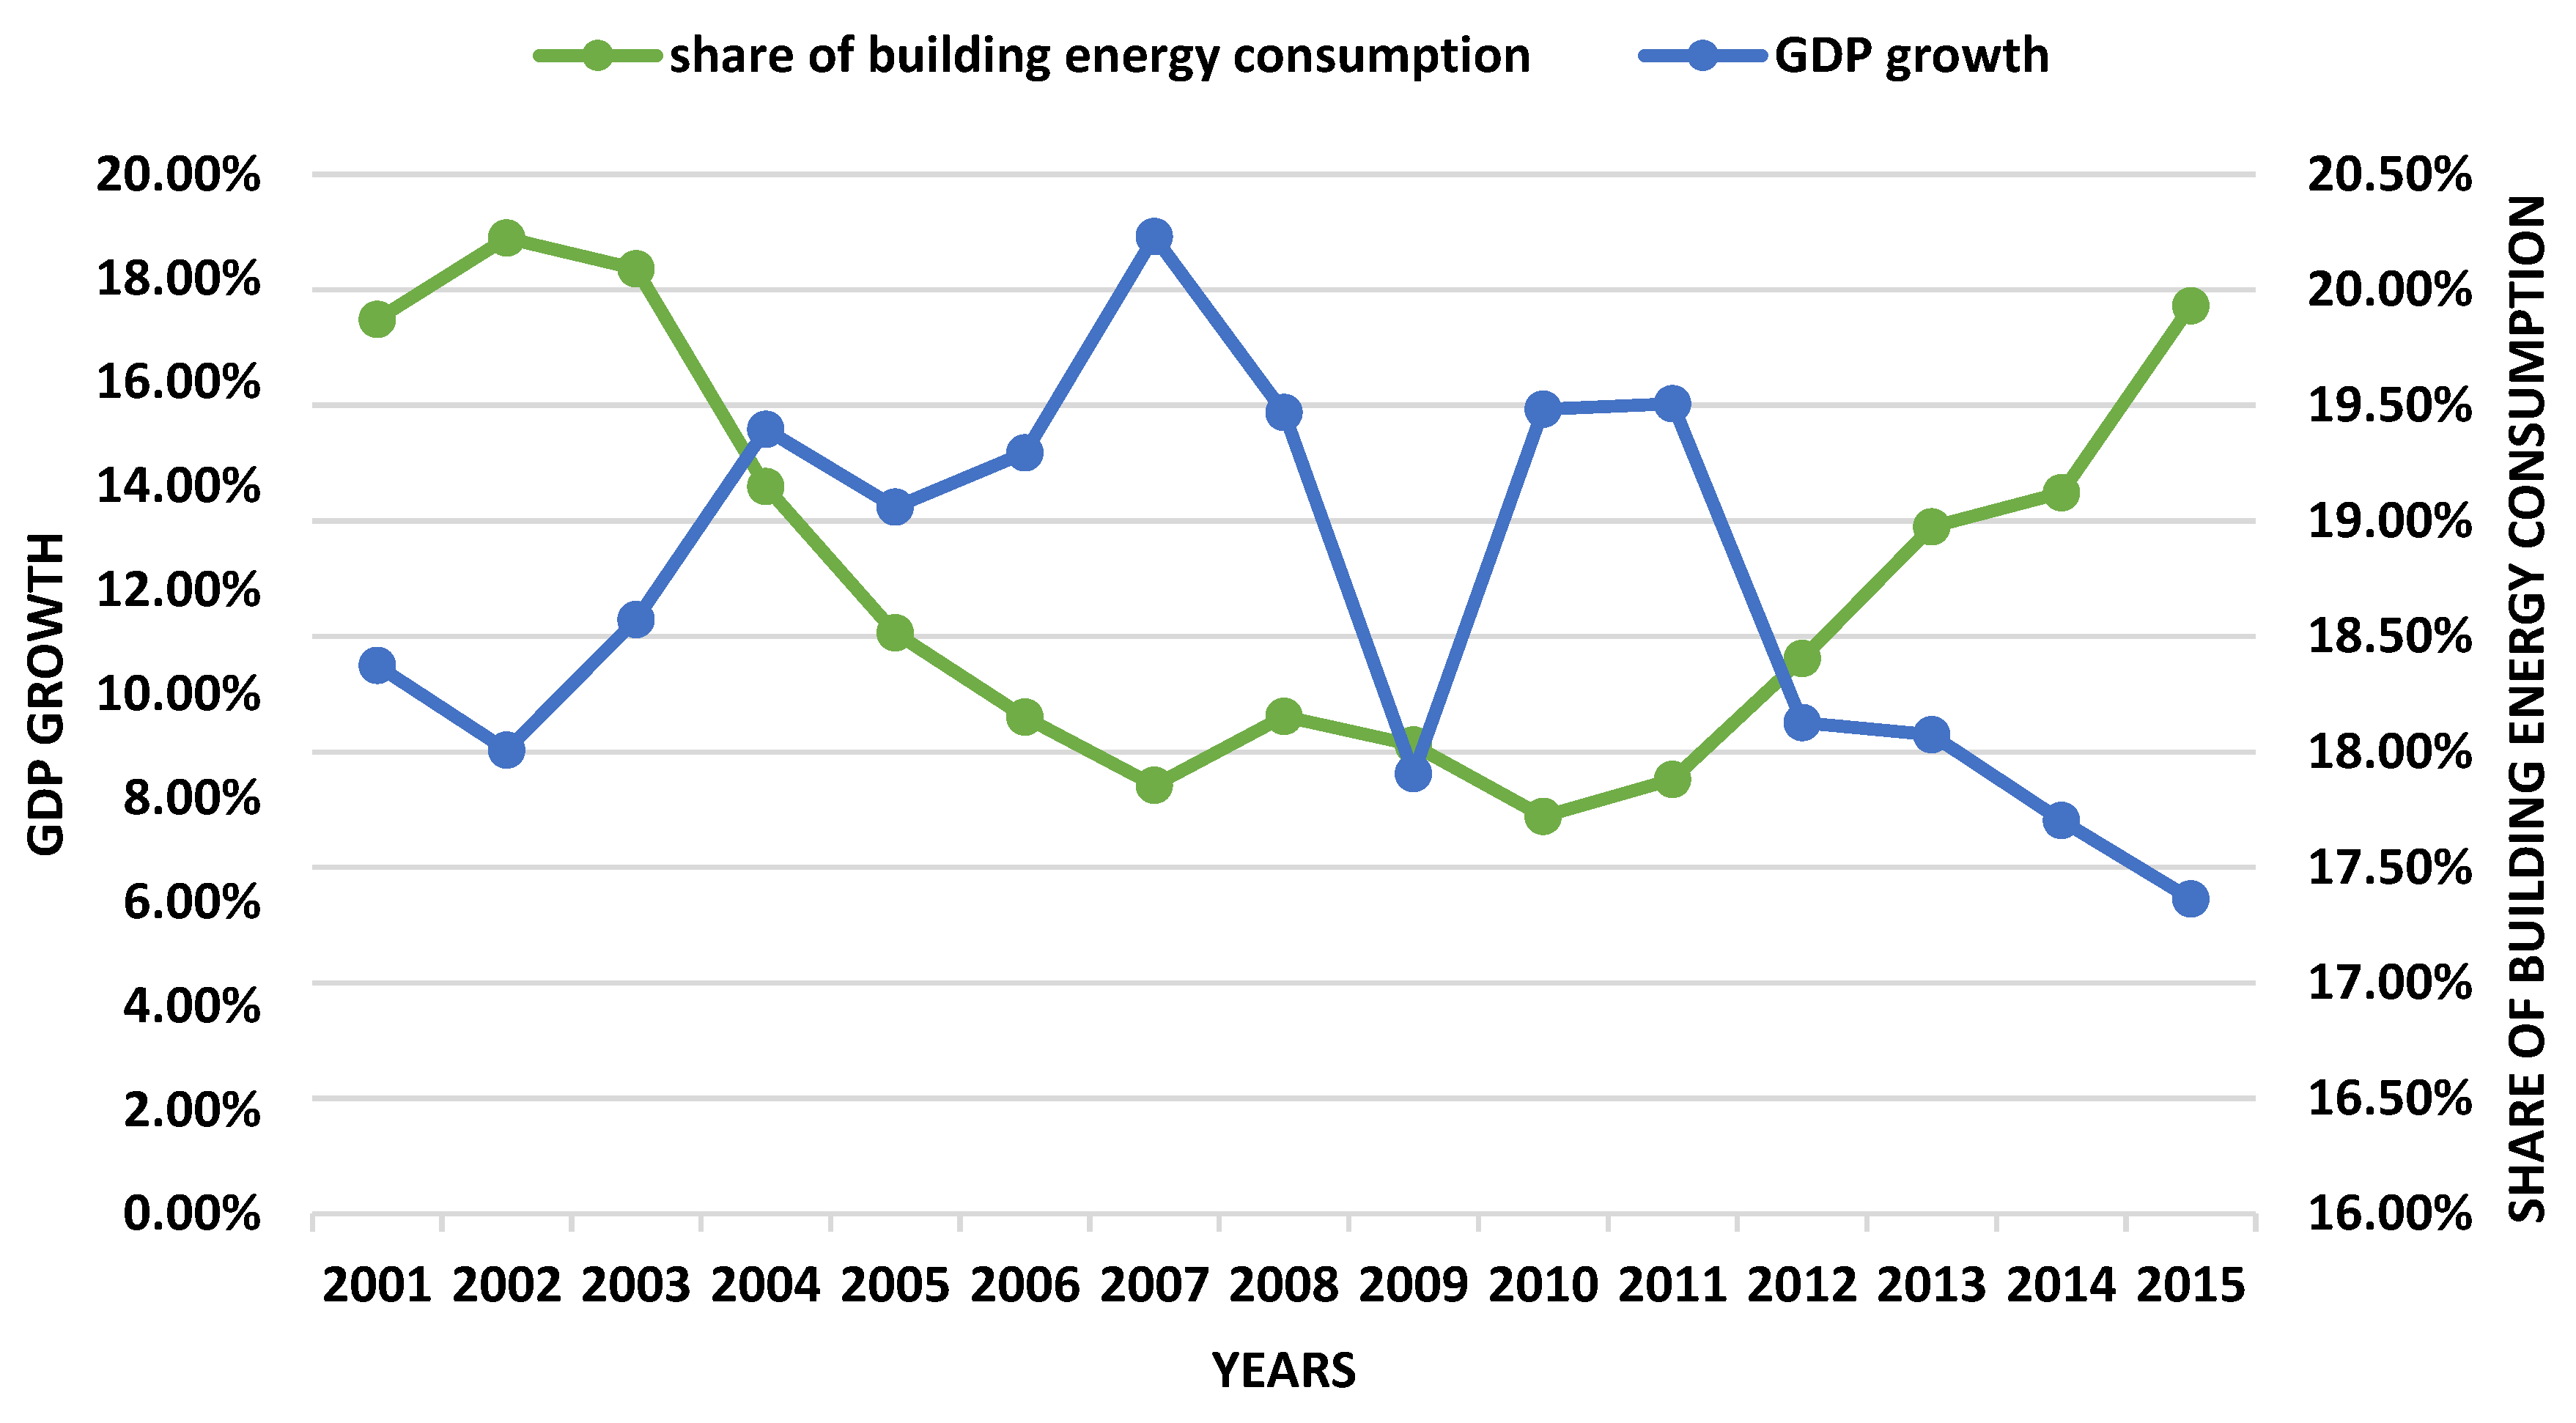
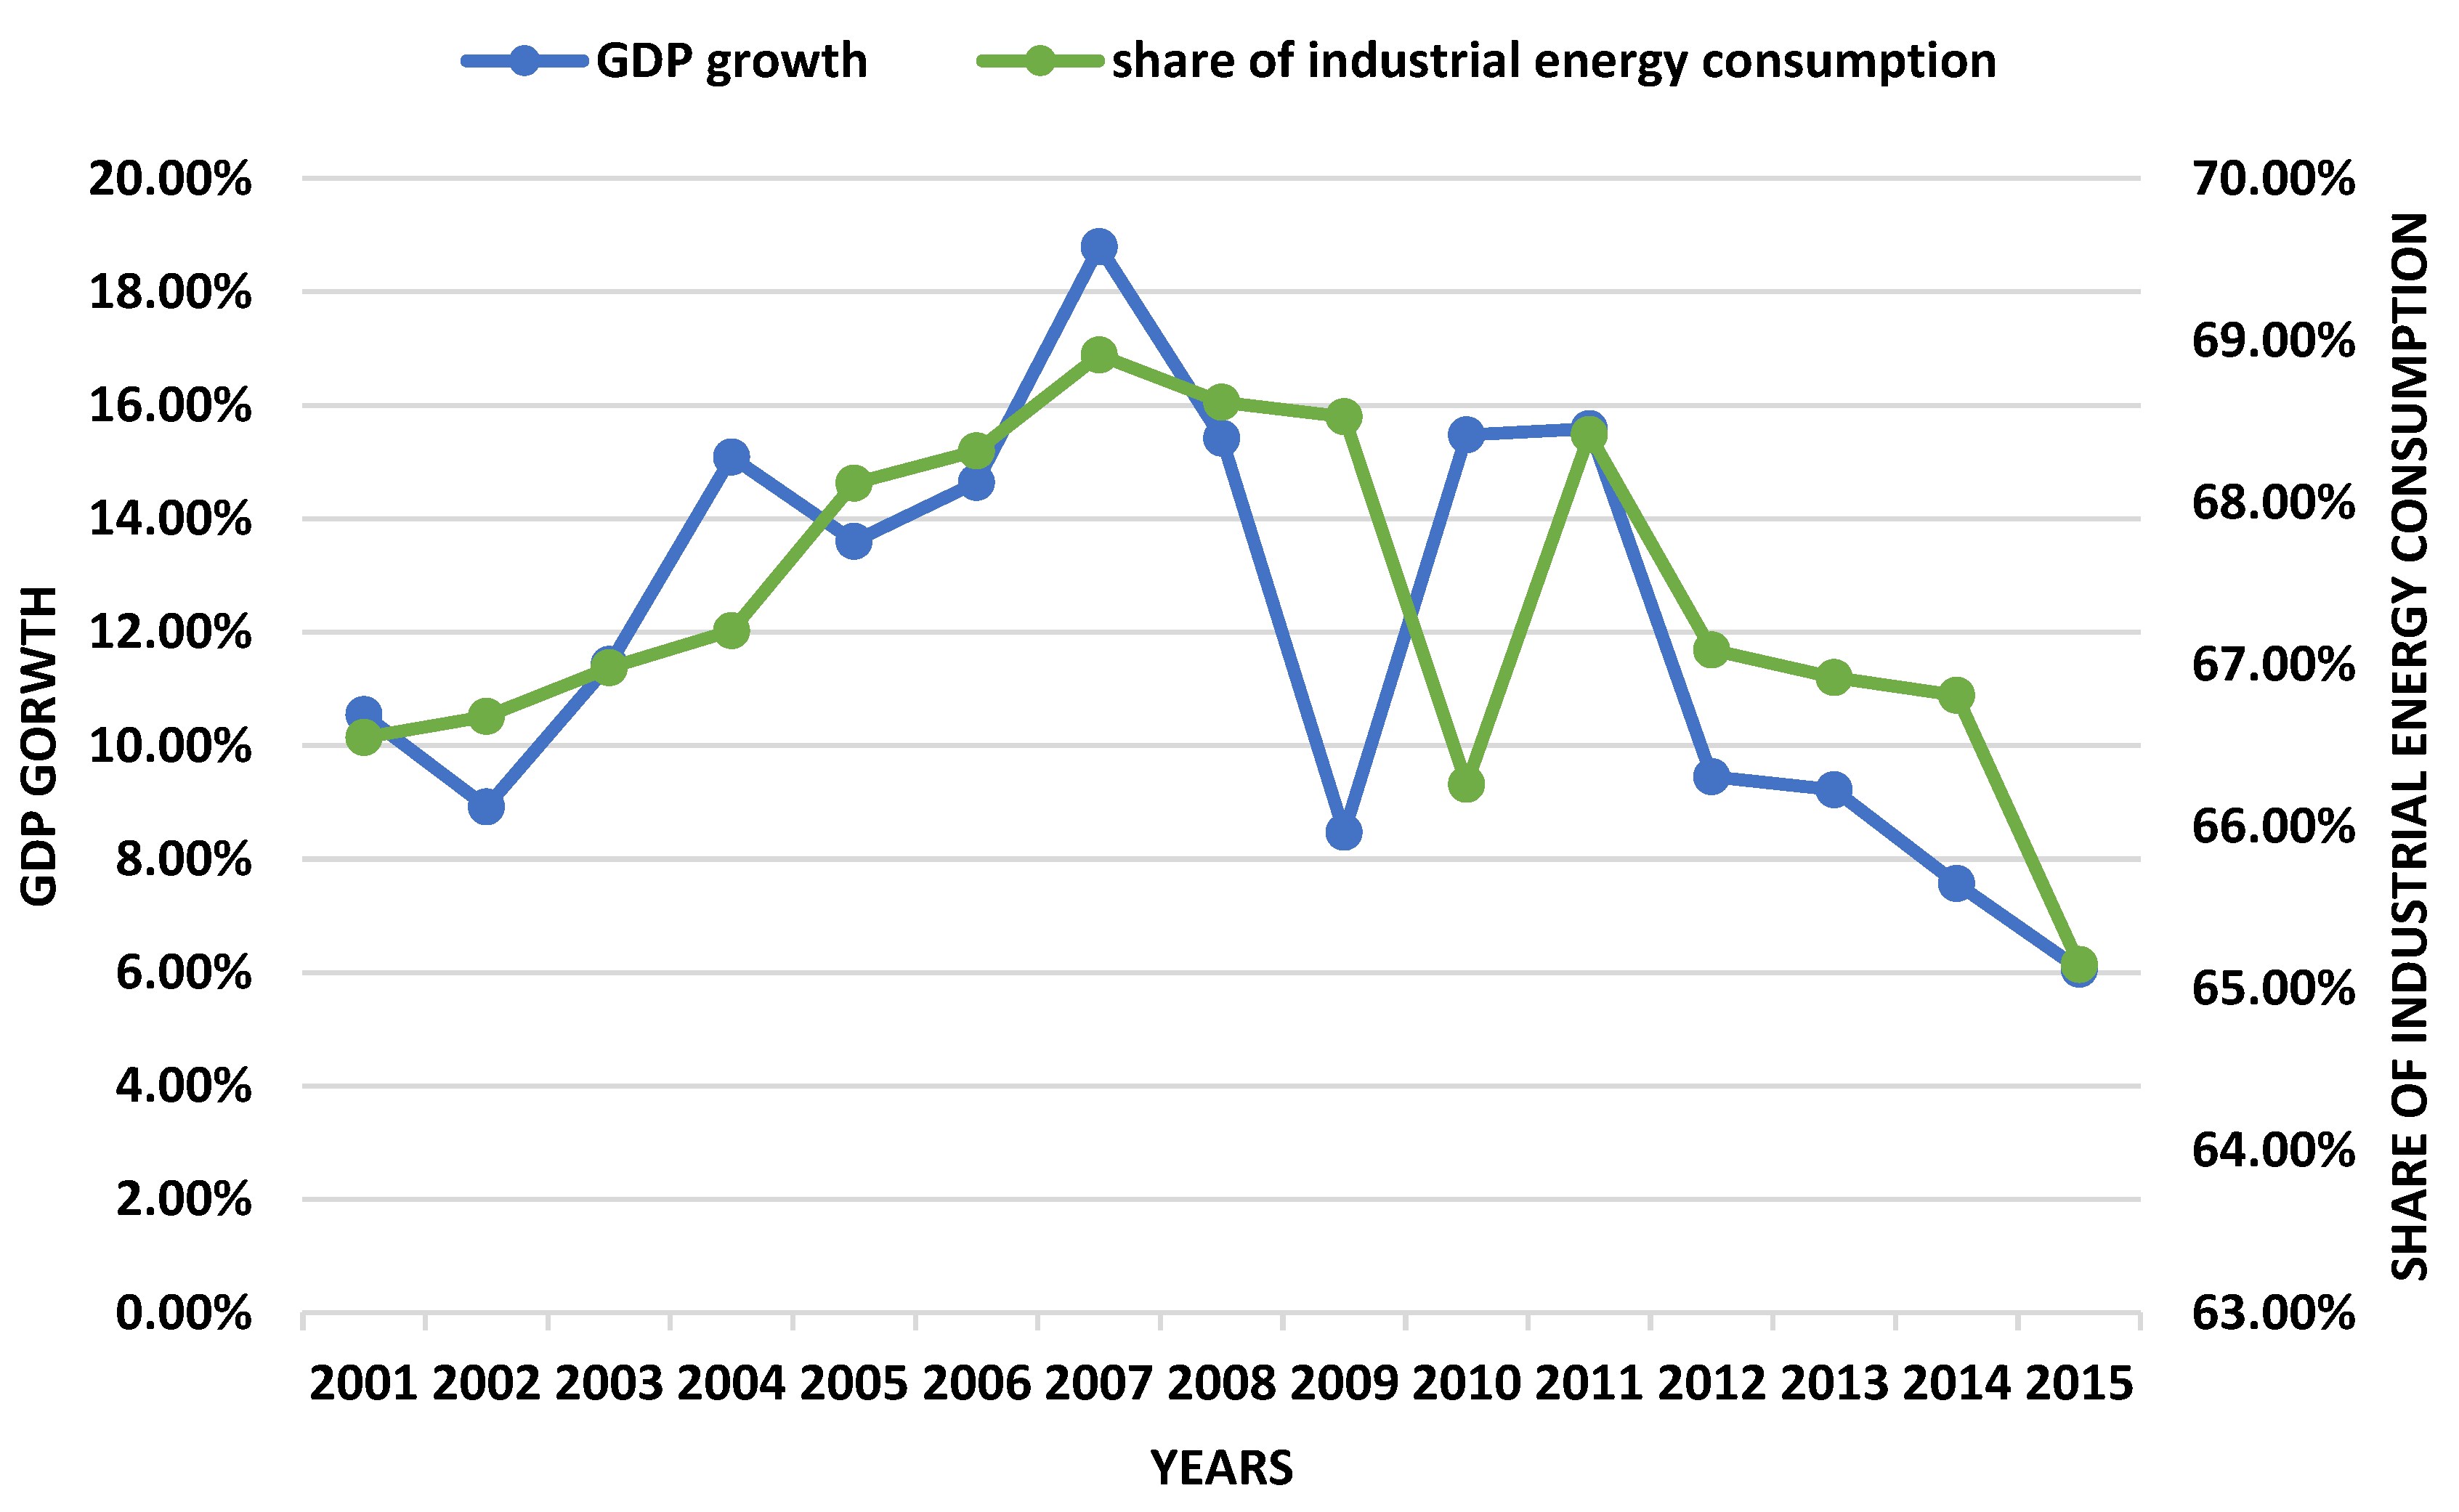
  • Building energy consumption and industrial energy consumption features are different. Building energy consumption is driven by lifestyle and living standards. However, industrial energy consumption is mainly driven by market and economic activities. Therefore, a higher GDP growth results in an increased share of industrial energy consumption and a decreased share of building energy consumption.
  • China’s building energy consumption has less of a contribution to the total energy demand, as compared to that of the developed world. This shows that China industrialization is still playing a more important role in the energy demand, while consumption and transportation sectors have more of a contribution to the total energy demand in the developed world.
The main conclusion from this study is that the existing EBS of China can be adapted to provide a more reliable and complete building energy demand information at the sector level. Thus, the underlying target is not to build up a new building energy statistics that is costly and separated from the existing regular energy statistics, but instead a better option is to apply the adapted EBS developed by this research. In addition, we suggest that the adapted EBS can be used with the support of the existing CBEM to ensure accurate data cross-checking.

Author Contributions

Conceptualization, M.Z., Y.Z. and C.X.-B.; methodology, M.Z. X.G. and C.X.-B.; validation, M.Z. X.G., Y.Z. and C.X.-B.; formal analysis, M.Z. and X.G.; data curation, X.G., Y.Z. and C.X.-B.; writing—original draft preparation, M.Z. X.G. and C.X.-B.; writing—review and editing, M.Z. and X.G.

Funding

This research is funded by the European Commission’s Switch Asia II programme: Promoting Sustainable Consumption and Production (contract number: DCI-ASIE/2015/368-399).

Acknowledgments

We would like to thank all the SusBuild project staff involved in this research for their valuable contribution and comments. We would like to give special thanks to China Association of Building Energy Efficiency, who provides us necessary data and supports us for data collection.

Conflicts of Interest

The authors declare no conflict of interest.

References

  1. IEA (International Energy Agency). World Energy Balances: Complete Energy Balances for over 150 Countries and Regions. 2018. Available online: https://www.iea.org/statistics/balances/ (accessed on 9 November 2019).
  2. Fridley, D.; Zheng, N.; Zhou, N. Estimating Total Energy Consumption and Emissions of China’s Commercial and Office Buildings (LBCN-248E Report); Lawrence Berkley National Laboratory: Berkeley, CA, USA, 2008. [Google Scholar]
  3. Asimakopoulos, D.A.; Santamouris, M.; Farrou, I.; Laskari, M.; Saliari, M.; Zanis, G.; Giannakidis, G.; Tigas, K.; Kapsomenakis, J.; Douvis, C.; et al. Modelling the energy demand projection of the building sector in Greece in the 21st century. Energy Build 2012, 49, 488–498. [Google Scholar] [CrossRef]
  4. Zhang, M.; Wang, M.; Jin, W.; Xia-Bauerc, C. Managing energy efficiency of buildings in China: A survey of energy performance contracting (EPC) in building sector. Energy Policy 2018, 114, 13–21. [Google Scholar] [CrossRef]
  5. Gu, L.; Yu, C. Data status and statistics of China building energy consumption. China Energy 2011, 33, 38–41. [Google Scholar]
  6. Building Energy Research Centre of Tsinghua University (THUBERC). 2017 Annual Report on China Building Energy Efficiency; China Architecture & Building Press: Beijing, China, 2017; pp. 7–9. ISBN 978-7-112-20573-8. [Google Scholar]
  7. Wang, Q. 2007 Research on statistics and calculation of China building energy consumption. Energy Sav. Environ. Prot. 2007, 8, 9–10. [Google Scholar]
  8. Long, H. Percentage of building energy consumption and building energy efficiency targets. China Energy 2005, 10, 23–27. [Google Scholar]
  9. Ding, J. Discussions on statistics and methodology of China building energy consumption. Mod. Econ. Inf. 2011, 23, 191. [Google Scholar]
  10. Chen, S.; Li, N.; Guan, J. Research on statistical methodology to investigate energy consumption in public buildings sector in China. Energy Convers. Manag. 2008, 49, 2152–2159. [Google Scholar] [CrossRef]
  11. Lombard, P.; Ortiz, J.; Pout, C. A review on buildings energy consumption information. Energy Build. 2008, 40, 394–398. [Google Scholar] [CrossRef]
  12. Zhao, L.; Liang, R.; Zhang, J.; Ma, L.; Zhao, T. A new method for building energy consumption statistics evaluation: Ratio of real energy consumption expense to energy consumption. Energy Syst. 2014, 5, 627–642. [Google Scholar] [CrossRef]
  13. Zhou, N.; Lin, J. The reality and future scenarios of commercial building energy consumption in China. Energy Build. 2008, 40, 2121–2127. [Google Scholar] [CrossRef]
  14. Zhang, Y.; He, C.; Tang, B.; Wei, Y. China’s energy consumption in the building sector: A life cycle approach. Energy Build. 2015, 94, 240–251. [Google Scholar] [CrossRef]
  15. Jiang, Y. Chinese building energy consumption situation and energy efficiency strategy. New Archit. 2008, 2, 4–8. [Google Scholar]
  16. Chen, S.; Li, N.; Guan, J.; Xie, Y.; Sun, F.; Ni, J. A statistical method to investigate national energy consumption in the residential building sector of China. Energy Build. 2008, 40, 654–665. [Google Scholar] [CrossRef]
  17. Xiao, H.; Wei, Q.; Jiang, Y. The reality and statistical distribution of energy consumption in office buildings in China. Energy Build. 2012, 50, 259–265. [Google Scholar] [CrossRef]
  18. Lin, X.; Peng, J.; Jiang, H. Study on statistics and calculation of building energy consumption in Chongqing City. Build. Energy Effic. 2008, 36, 55–57. [Google Scholar]
  19. China Association of Building Energy Efficiency (CABEE). 2017 Research Report of China Building Energy Consumption; China Association of Building Energy Efficiency: Beijing, China, 2017; pp. 1–25. [Google Scholar]
  20. Yu, S.; Eom, J.; Evans, M.; Clarke, L. A long-term, integrated impact assessment of alternative building energy code scenarios in China. Energy Policy 2014, 67, 626–639. [Google Scholar] [CrossRef]
  21. Liu, X.; Wang, C.; Liang, C.; Feng, G.; Yin, Z.; Li, Z. Effect of the energy-saving retrofit on the existing residential buildings in the typical city in northern China. Energy Build. 2018, 177, 154–172. [Google Scholar]
  22. Wang, J.; Zhang, Y.; Liu, M.; Wang, Y. Baseline comparison of China, USA and UK building energy consumption. Build. Sci. 2015, 31, 48–51. [Google Scholar] [CrossRef]
  23. Heinonen, J.; Junnila, S. Residential energy consumption patterns and the overall housing energy requirements of urban and rural households in Finland. Energy Build. 2014, 76, 295–303. [Google Scholar] [CrossRef]
  24. Yang, X. Introduction on building energy consumption statistics of USA. Build. Sci. 2010, 26, 8–11. [Google Scholar] [CrossRef]
  25. Zhang, M.; Cui, Y.; ter Avest, E.; van Dijk, M.P. Adoption of voluntary approach: Can voluntary approach generate collective impacts for China achieving ambitious energy efficiency targets? Energy Environ. 2018, 29, 281–299. [Google Scholar] [CrossRef]
  26. Zhang, M.; Li, H.; Jin, W.; ter Avest, E.; van Dijk, M.P. Voluntary agreements to achieve energy efficiency, a comparison between China and The Netherlands. Energy Environ. 2018, 29, 989–1003. [Google Scholar] [CrossRef]
  27. Lu, N.; Lin, G.; Yu, Y.; Ma, H.; Wang, Q. Analysis on China’s residential building energy consumption in 2003–2007. Constr. Econ. 2009, 95–97. [Google Scholar] [CrossRef]
Figure 1. Procedures and methods of this research.
Energies 12 04293 g001
Figure 2. China’s Building Energy Consumption 2001–2015. (Source: 1) Data on total energy consumption, China EBS 2001–2015; (Source: 2) Data on total building energy consumption, primary).
Energies 12 04293 g002
Figure 3. Changing annual growth of building energy consumption 2001–2015. Data source: data on building floor area [19].
Energies 12 04293 g003
Figure 4. Building Energy Consumption by Categories in China.
Energies 12 04293 g004
Figure 5. Energy Intensities of Three Types of Buildings in China.
Energies 12 04293 g005
Figure 6. Share of Building Energy Consumption vs. GDP Growth. Data source: GDP data is from [19].
Energies 12 04293 g006
Figure 7. Share of Industrial Energy Consumption vs. GDP Growth.
Energies 12 04293 g007
Table 1. China Energy Consumption growth rate in the three five-year periods.
Indicator2001–20052006–20102011–2015
Average annual growth of China total energy consumption13.9%5.9%2.7%
Average annual growth of China total building energy consumption11.9%5.3%5.5%
Table 2. Data comparison between this research and CBEM, in 100 million tce.
YearThis ResearchCBEM [6]Difference
20013.093.719.7%
20023.434.119.5%
20033.964.513.6%
20044.415.2017.9%
20054.845.5013.6%
20065.205.638.3%
20075.565.763.6%
20085.825.931.9%
20096.066.222.6%
20106.396.654.1%
20116.926.950.4%
20127.407.22-2.4%
20137.917.81-1.3%
20148.148.221.0%
20158.578.640.8%
Source: CBEM data [6].
Table 3. Data comparison of energy consumption of three building types, in 100 million tce.
Building TypesThis StudyCBEMDifference
Public building2.832.60–8.8%
Urban residential building1.851.997.0%
Rural residential building1.972.137.5%
Northern China heating1.931.91–1%
Source: CBEM data [6].
Table 4. An international comparison of building energy consumption, Mtoe (million tons-oil-equivalent).
IndicatorChinaUSAEUIndiaRussiaJapanGlobal
Total energy consumption1913.01519.01042.5577.6456.9291.36929
Building energy consumption393.0469.0364.8213.2150.795.12807
Share of building energy consumption20.5%30.9%35.0%36.9%33.0%32.6%40.5%
Data source: [1].

