Article

Experimental Study of Sand Production during Depressurization Exploitation in Hydrate Silty-Clay Sediments

1
Key Laboratory of Gas Hydrate, Guangzhou Institute of Energy Conversion, Chinese Academy of Sciences, Guangzhou 510640, China
2
Key Laboratory of Marine Mineral Resources, Ministry of Natural Resources, Guangzhou 510075, China
3
Guangdong Provincial Key Laboratory of New and Renewable Energy Research and Development, Guangzhou 510640, China
4
Guangzhou Center for Gas Hydrate Research, Chinese Academy of Sciences, Guangzhou 510640, China
5
State Key Laboratory of Oil & Gas Reservoir Geology and Exploitation, Southwest Petroleum University, Chengdu 610500, China
*
Author to whom correspondence should be addressed.
Energies 2019, 12(22), 4268; https://doi.org/10.3390/en12224268
Submission received: 9 October 2019 / Revised: 3 November 2019 / Accepted: 5 November 2019 / Published: 8 November 2019

Abstract

:
Silty-clay reservoirs are a weak point in sand production and sand control studies due to their low economy. However, China’s marine natural gas hydrates (NGH) mostly exist in silty-clay sediments, which restrict the sustainable and efficient development of NGH. In order to study the sand production of hydrate silty-clay sediments, hydrate production experiments in vertical wells and horizontal wells were carried out using a self-developed hydrate sand production and sand control simulation device. The results showed a great difference between the hydrate silty-clay sediments and hydrate sand sediments. The significant differences in production pressure and production temperature between the different layers indicated the low permeability and low heterogeneity of the hydrate silty-clay sediments. The sliding settlement of the overall depression in the horizontal well and overall subsidence in the vertical well of the hydrate silty-clay reservoir would easily lead to silty-clay flow and large-scale sand production. When water rates decreased, the property of “silty-clay sediment filtration and wall building” was found, which formed a “mud cake” around the wellbore. The good strength of adhesion and fracture permeability of the “mud cake” provided ideas for reservoir reformation. This study further discusses sand production and sediment reformation in hydrate silty-clay sediments.

Graphical Abstract

1. Introduction

Natural gas hydrates are crystalline solids composed of water and gas [1]. Highly concentrated gas hydrate accumulations may become an economical energy source [2,3]. However, the strength of the reservoir would be reduced dramatically during hydrate production, which would lead to engineering and geological problems, such as wellbore instability, sand production, submarine landslides, etc. [4,5,6,7]. The case of sand production has been reported in terrestrial hydrate production in Messoyakha [8], Mallik [9,10], and Alaska [11], and in offshore hydrate exploitation in Japan [12] and China [13,14,15]. Sand production occurs due to reservoir solids (sand and gravel) migrating into the wellbore by the flow of reservoir fluids, which restricts safe and sustainable hydrate exploitation [15,16,17]. From the Gas Hydrate Resources Pyramid model [18], 90% of natural gas hydrate resources are in marine mud silt reservoirs, while the massive tuberculous shell hydrates around sandy hydrates and the fluid basin are the first choice for mining. However, the conventional petroleum industry has performed less research on sand production and sand control in silty-clay reservoirs because of their low productivity without economy. While large effective pressure during hydrate mining and long-term efficient commercial exploitation requires a high standard of sand control technologies, sand production research relating to hydrate exploitation is not systematic at present.
Water flow drives sand production through pores, and it occurs in the process of unstable depressurization during hydrate exploitation; the velocity of the water flow is the main factor in sand production rates [19]. A low fines content also plays an important role in sand production in hydrate-bearing sediments [20]. Fines intrusion was observed with increasing flow rate in a laboratory simulation of Japan’s first hydrate test, which was not consistent with field test results [21]. From the disastrous sand production in Japan’s hydrate production test, it is speculated that the stable sand structure was produced as a whole [22,23]. The evaluation of sand control was performed in practice by way of conventional commercial sand screen laboratory tests for Japan’s first hydrate test [24]. Thus, it is possible to solve the sand production problem in hydrate exploitation. However, none of the above studies systematically considered sand production during hydrate exploitation or sand production experiments through the hydrate decomposition process.
From a numerical simulation of sand production in hydrate exploitation, shear failure of sediments was found to promote sediment subsidence and increase the risk of sand production [5]. An uneven stress distribution of hydrate-bearing sediments leads to shear deformation of the sediments [17,25]. The increasing pressure drop and production pressure difference leads to a stress concentration around the wellbore conducive to production [26]. However, there is still a difference between numerical simulations and the actual situation.
To date, it has been impossible to avoid sand production while fulfilling high long-term production rates in future hydrate exploitation. Moreover, there is little knowledge about the behaviors of sand production in hydrate silty-clay sediments. Due to the high expense of field testing, it is significant to study sand production and sediment deformation by experiments directly, which will provide a firm foundation for numerical simulations of sand production and sand control design.
This paper is the first to show sand production experiments in silty-clay hydrate sediments, which are different from sand production experiments in medium-sand hydrate sediments [27,28].

2. Experimental Introduction

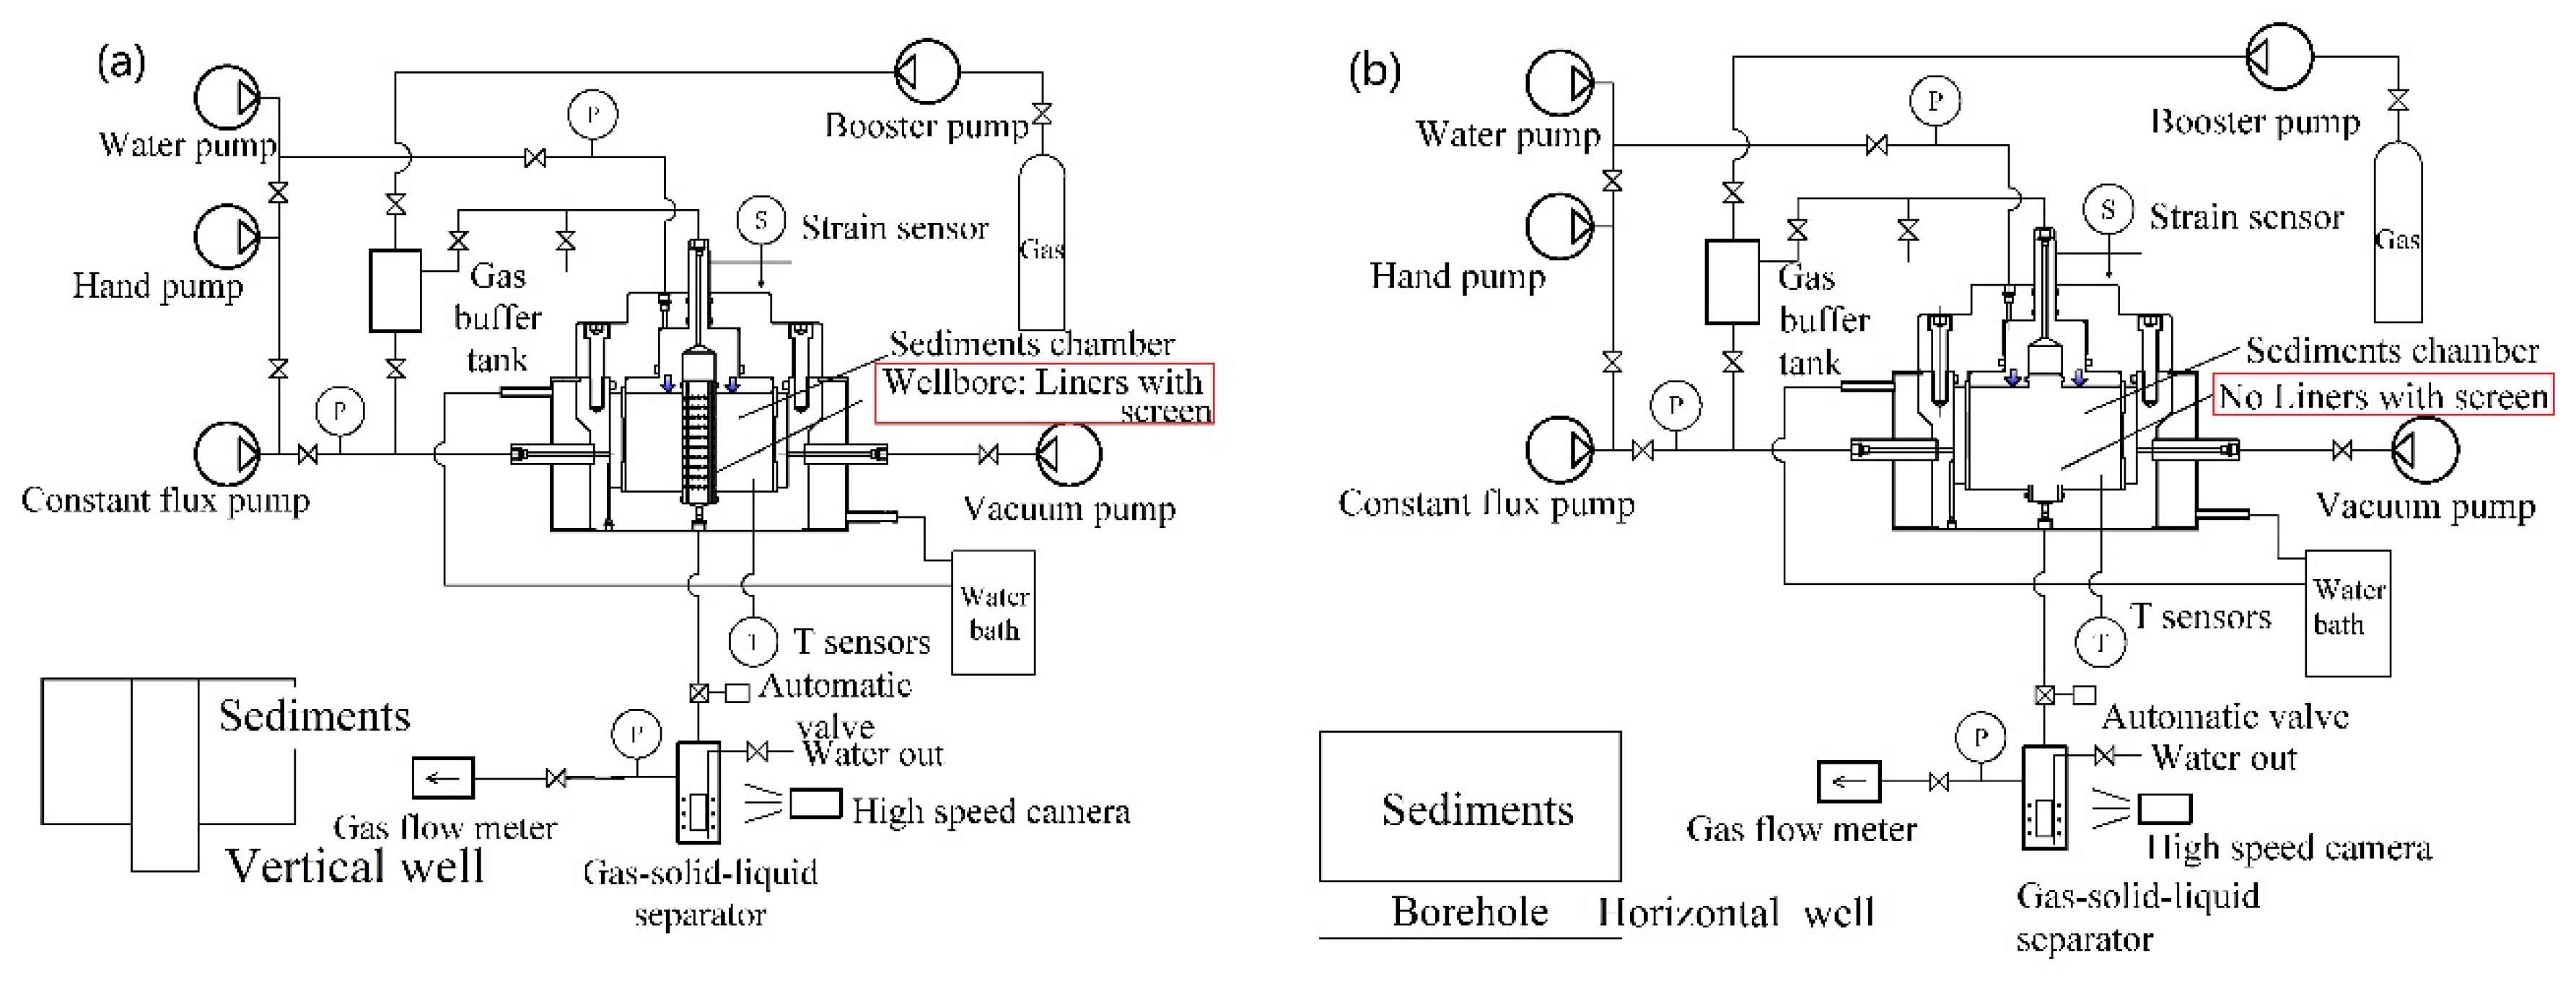
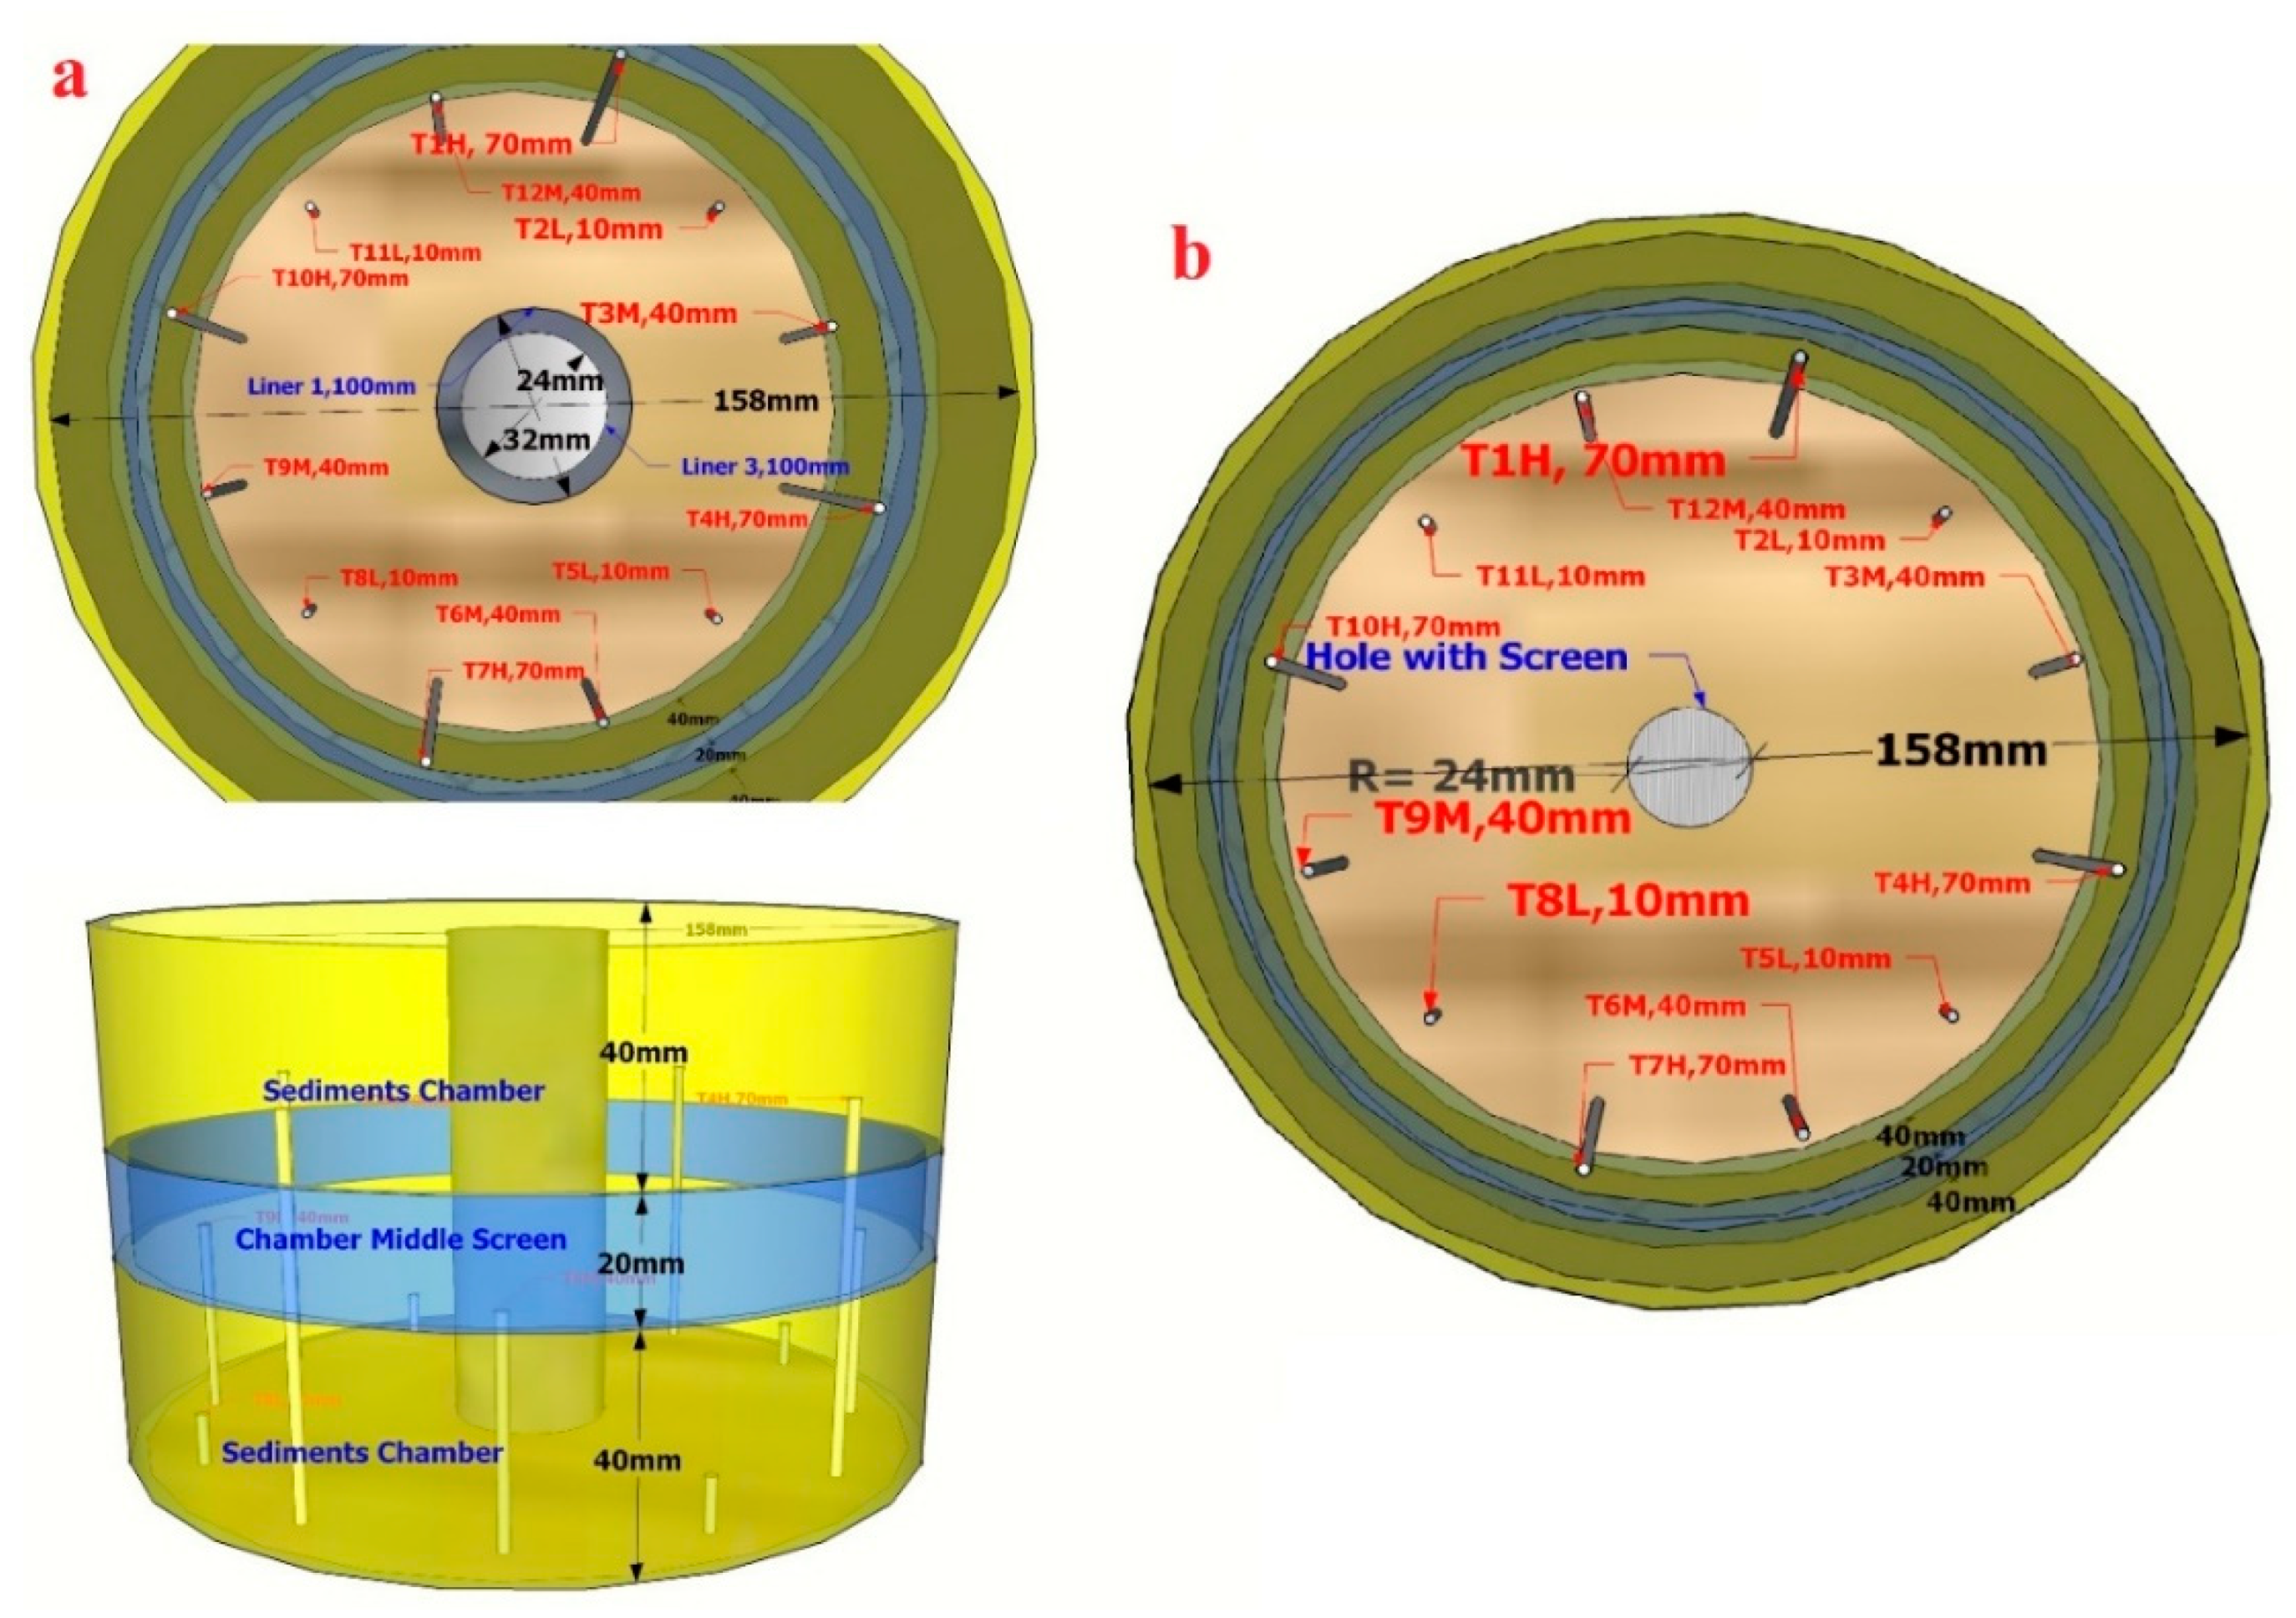
2.1. Experimental System

The experimental system, named the methane hydrate sand production and sand control simulator (MHSPSCS), was described in detail in a previous study [27]; its maximum inner volume (ø180 × 130 mm) was 3308 mL (that of the set sediment chamber, ø158 × 100 mm, was 1961 mL). The experimental facility comprised a stainless steel high-pressure reactor (up to 30 MPa), assembled with a water controlling system (253.15–323.15 K), the detachable wellbore, a mining unit, a data-collection system, a visual separation system, and a measurement unit. As can be seen from Figure 1a and Figure 2, the outer diameters of the perforated wellbore liners (Liner 1 and Liner 3 were 32 mm and 25.6 mm with 3 mm holes in 10 layers with 10 mm gaps at an angle of 36 degrees) were applied to form a vertical well. A bottom hole without a liner acted as one hole of the horizontal well, as shown in Figure 1b and Figure 2. Meshes of size 12 and 40 were applied to silty-clay and medium sand, which guaranteed the stability of the reservoir during hydrate formation and decomposition, and gave channels for fluid flow during exploitation.

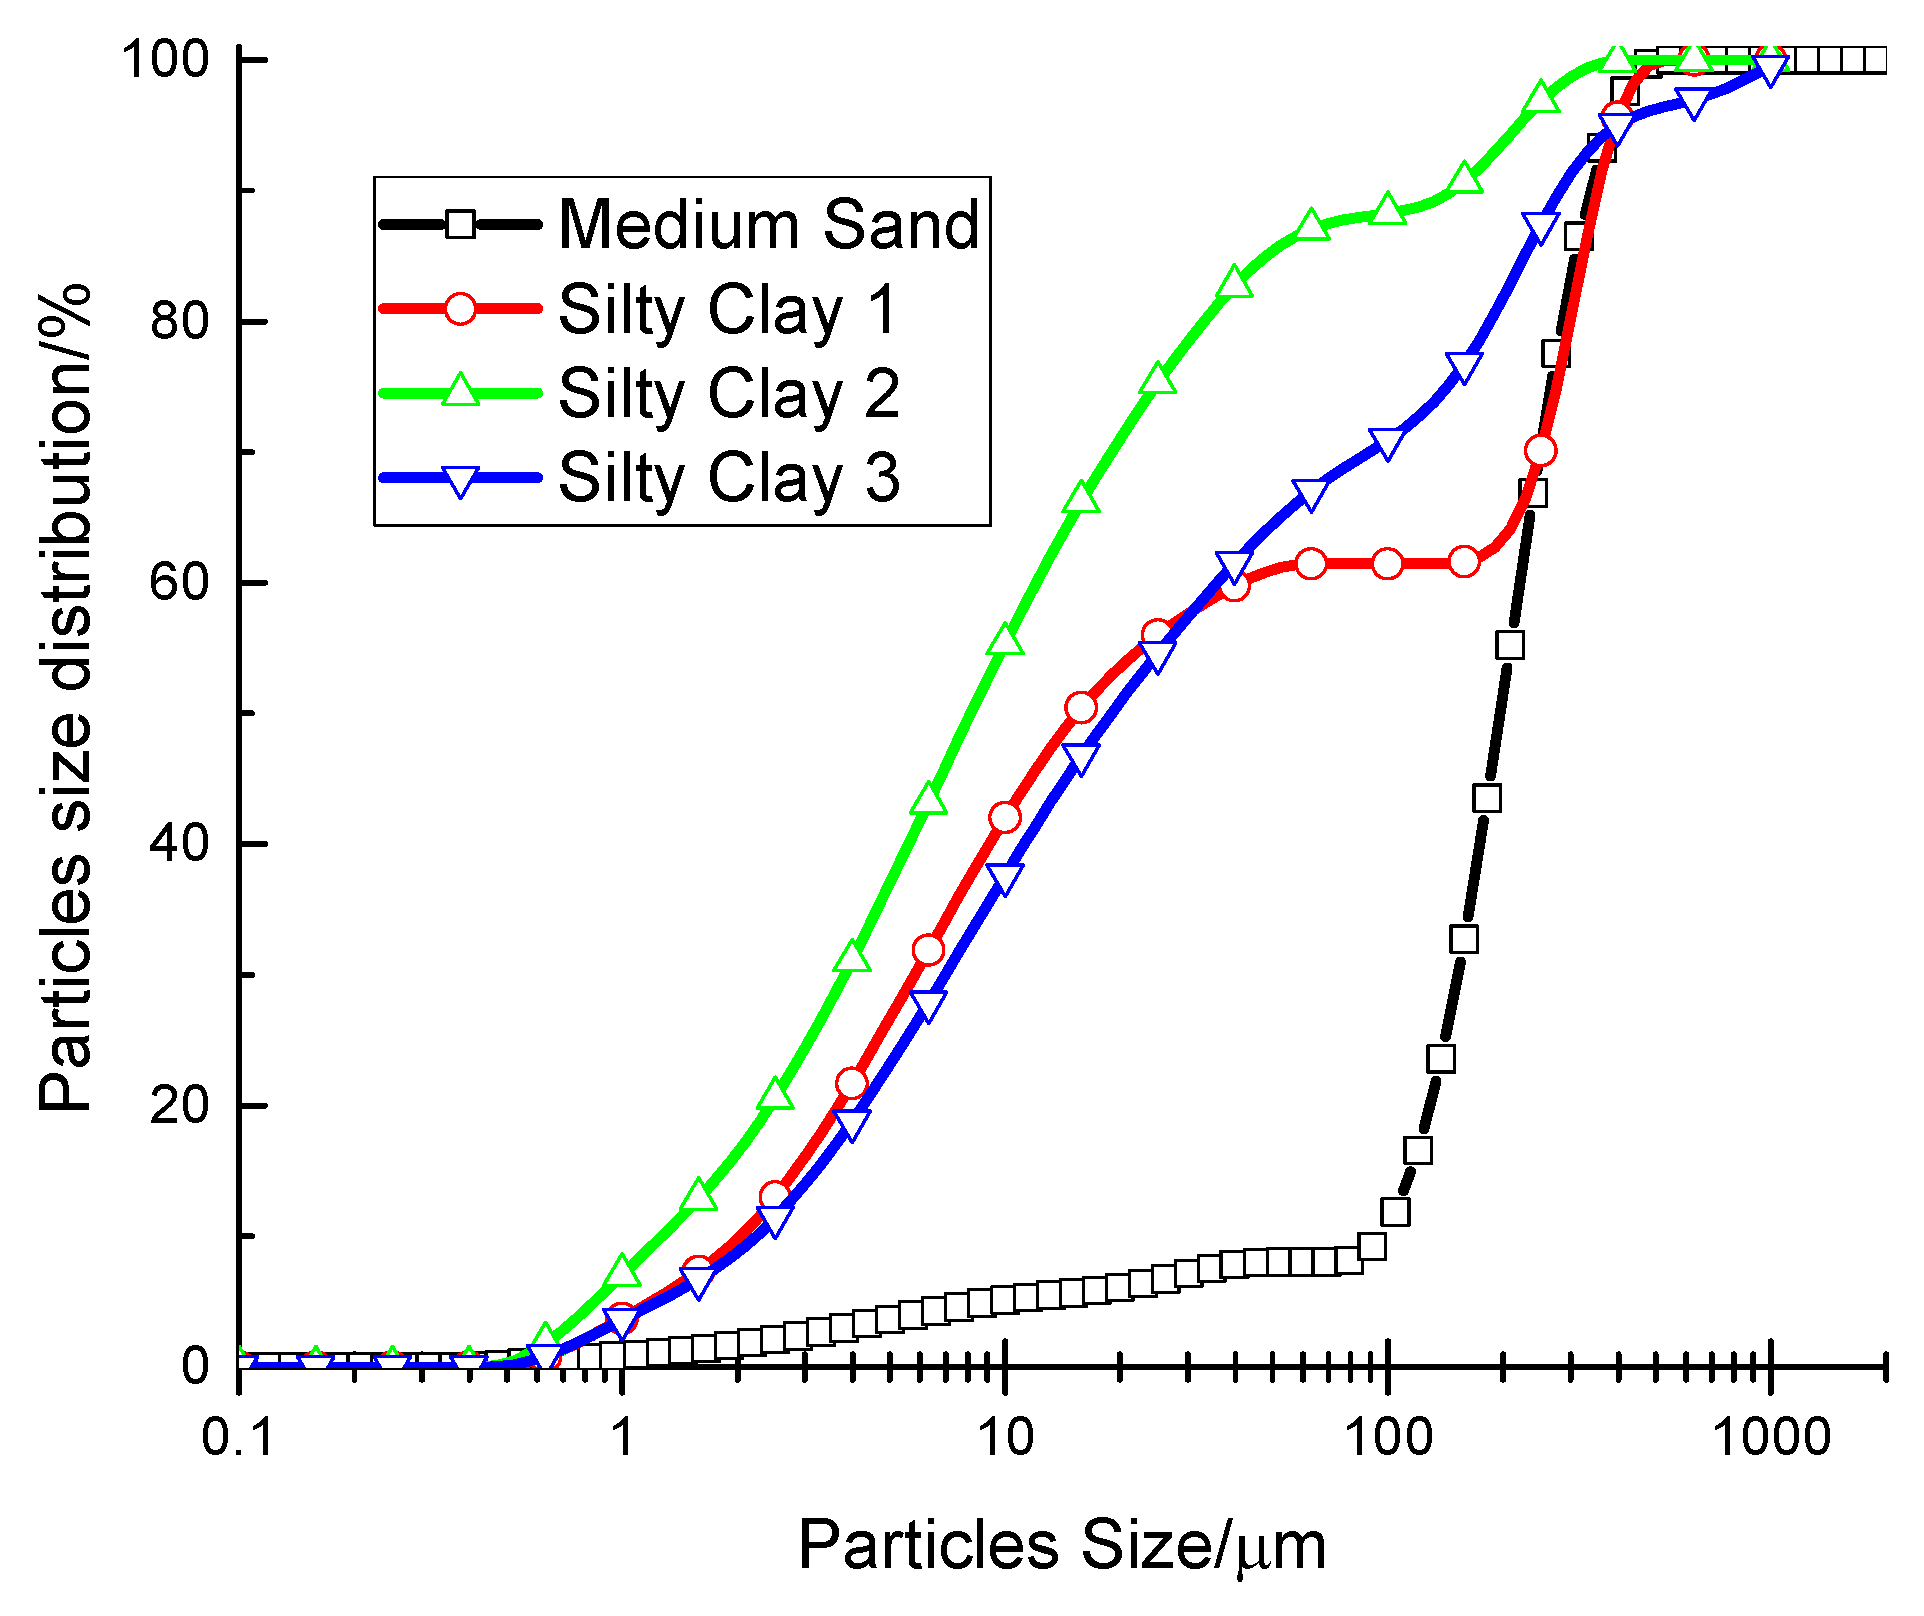
2.2. Experimental Materials

The sediments in this study were drilling samples from the Shenhu Area, South China Sea. The results of particle diameter distribution analyses are shown in Figure 3. The median grain sizes d50 of the silty-clay and medium-sand sediments were about 14.18 μm (average 8.14–18.98 μm) and 225 μm, respectively.

2.3. Experimental Procedure

Based on the experimental procedure of previous hydrate production experiments [27], 2.2 kg of dried silty-clay and a quantity of deionized water was put into the sediment chamber after 24 h of mixing. Overlying stress of 12 MPa was used to compress the sediments with 1 min vacuuming. Then, the pressure and temperature of the sediment chamber were maintained at 11 MPa by methane gas injection and 293.15 K for 24 h to guarantee thorough mixing of the silty-clay, water, and methane. For hydrate formation, the temperature of the sediment chamber was set at 275.15 K (the methane hydrate phase equilibrium pressure was 3.22 MPa). Gas entered the MHSPSCS around the circumference, which increased the hydrate formation rate over one-way or two-way gas-inlets. Meanwhile, the grains promoted hydrate formation [29]. After 48 h of hydrate formation, the free methane was driven out from the top valve by cooled deionized water at 273.15 K. Meanwhile, the pore pressure was still maintained at 11 MPa (the methane hydrate phase equilibrium pressure was 2.62 MPa) by a constant-flux pump [27]. After the displacement of water, the reactor was assumed to be water-saturated, and depressurization was carried out by opening the manual valves (minor adjustment) and an automatic valve. The production fluids were separated by the gas–solid–liquid separator. The visual window of the gas–solid–liquid separator was recorded on video. The gas production rates were restricted and measured using the gas flow meter. The overlying stress (crustal stress) was maintained either at a constant pressure of 12 MPa or at no crustal pressure.
To calculate the sand rate ø s (%) in water, the water with sand was drawn out to the beakers:
ø s = W s d f W w f .
In the same beaker, W w f is the weight (g) of the produced water and W s d f is the weight (g) of dry sand.
Because the experiments were water-driven, the gas was assumed to have been collected from hydrate decomposition, and methane hydrate would be I type hydrate; this means that 8 CH4 · 46 H2O, 1 m3 hydrate was formed by 0.8 m3 water. Thus, the final amount of hydrate in moles nh (mol) was calculated from the final produced gas volumes in the standard state V g (L). M in Equation (2) is gas mole volume at 22.4 L/mol. The experimental details can be seen in Table 1.
n h = V g 8 M

3. Experimental Results and Discussion

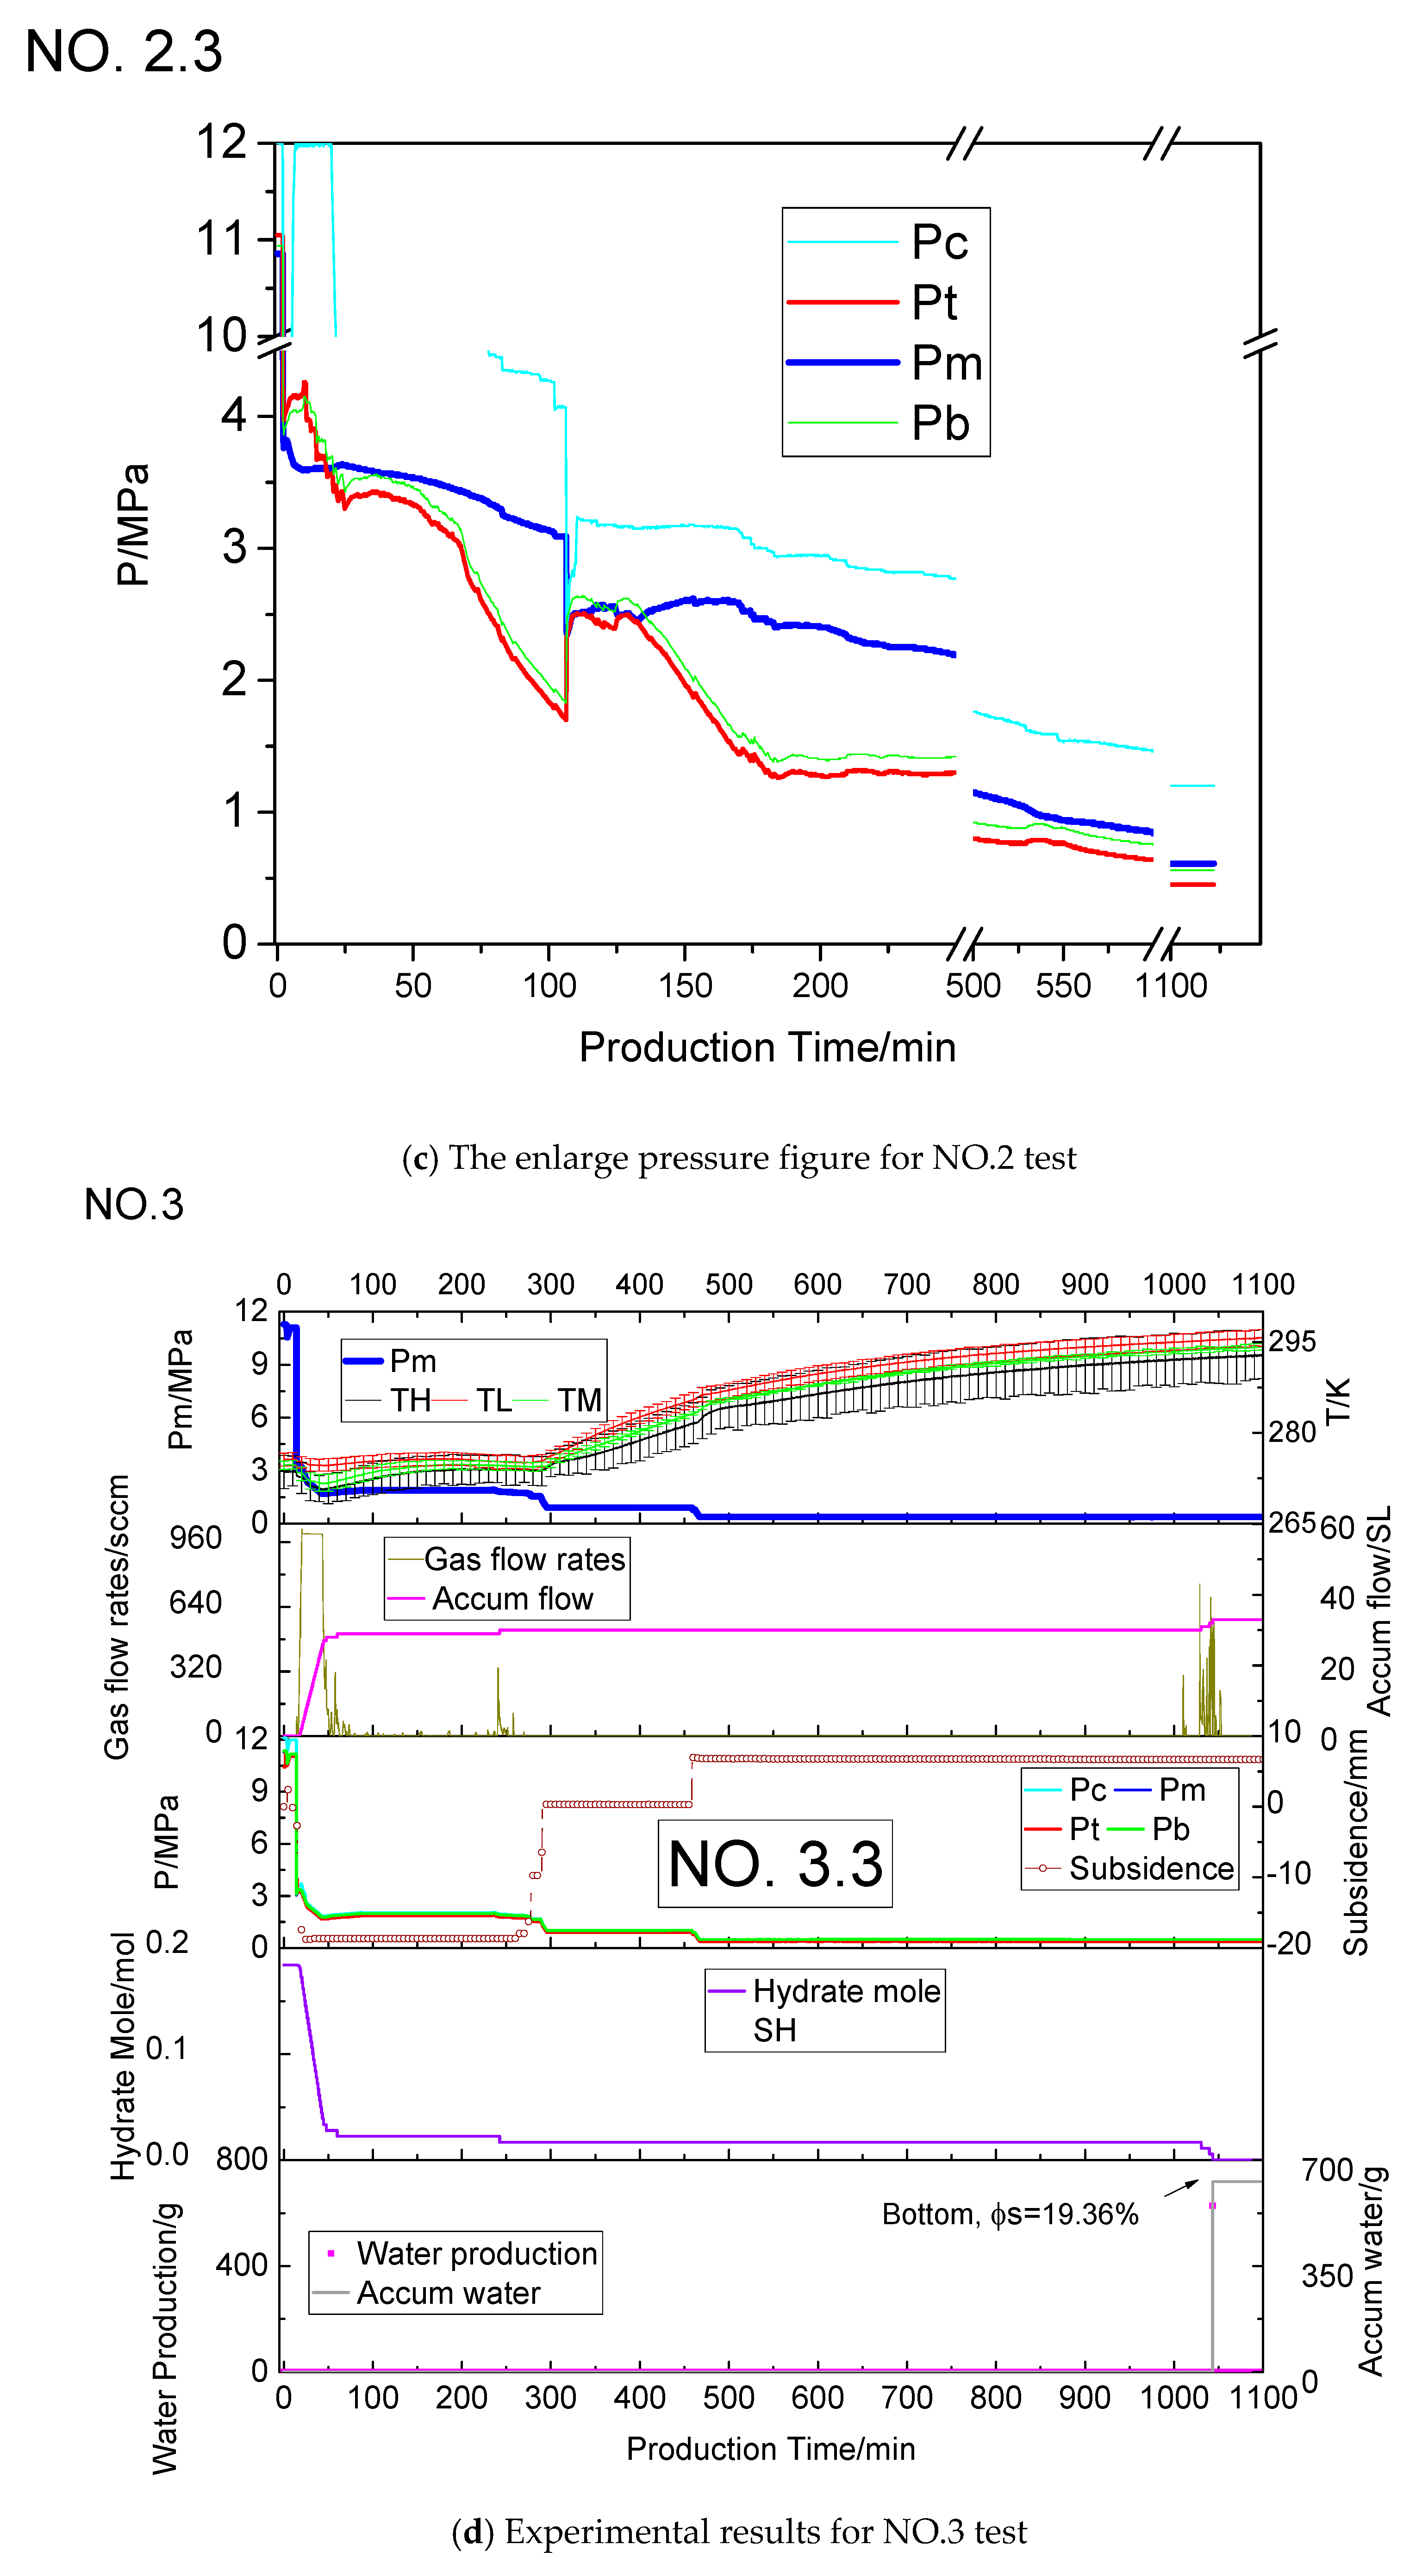
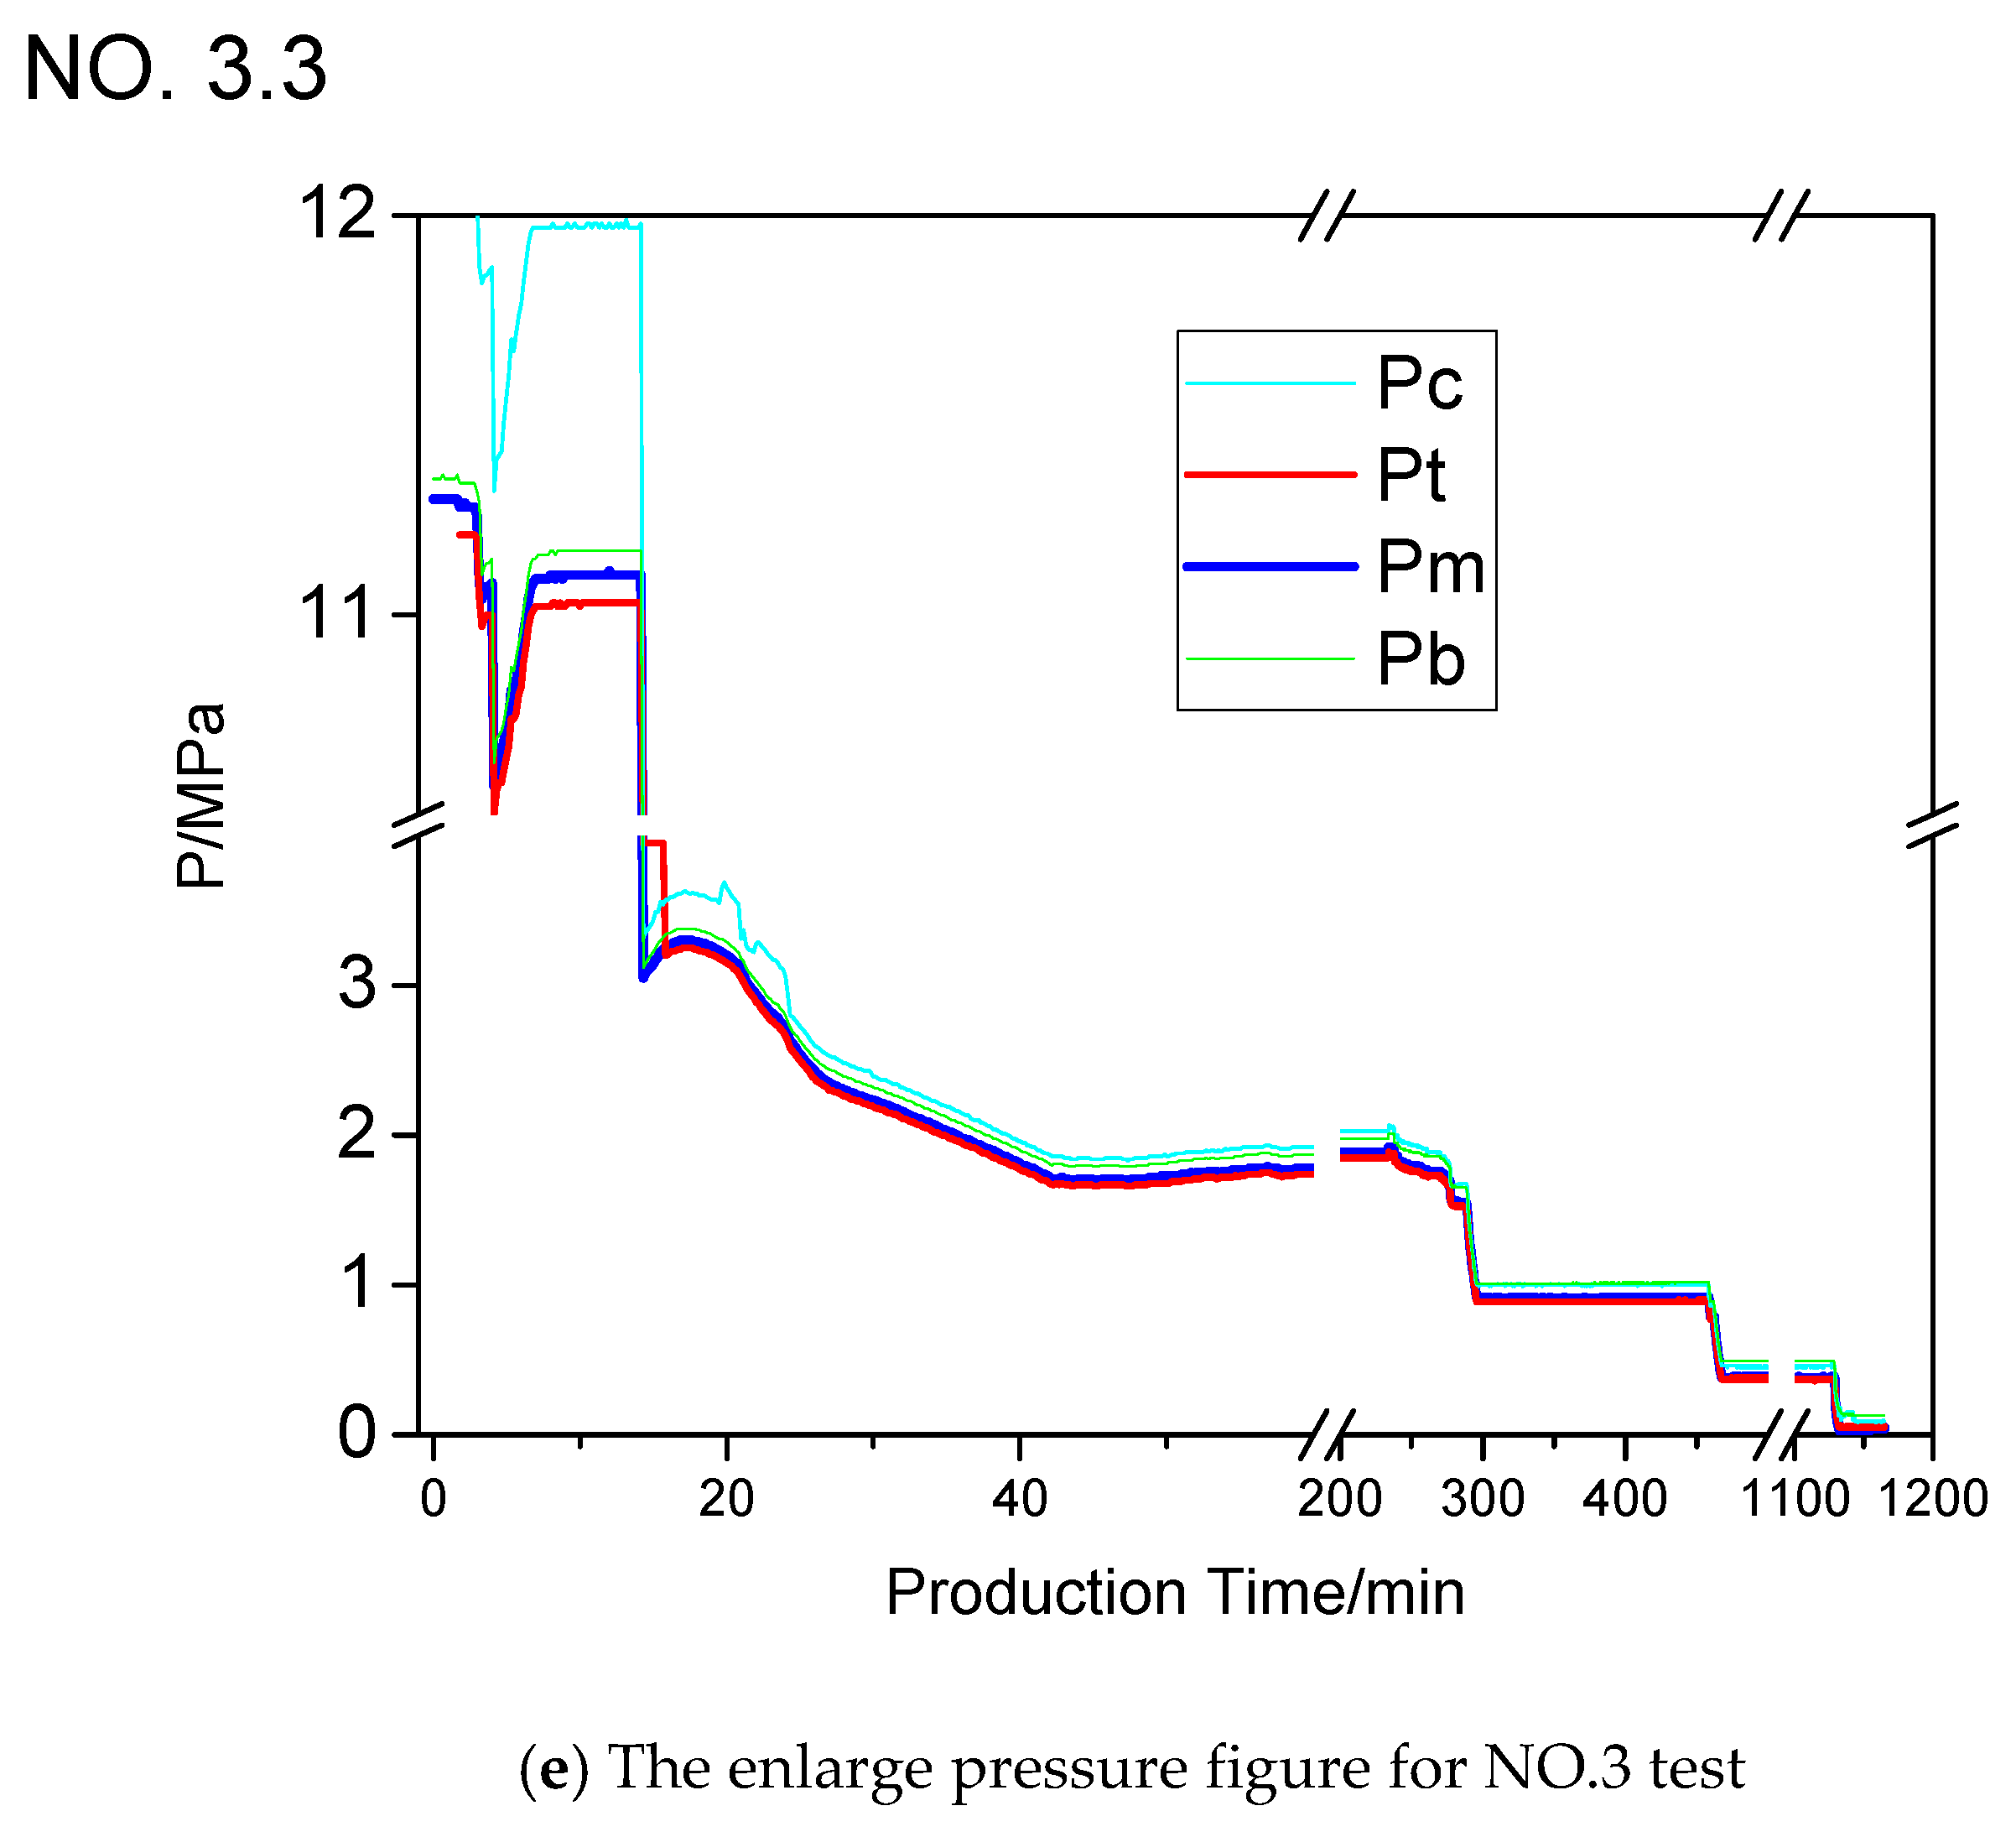
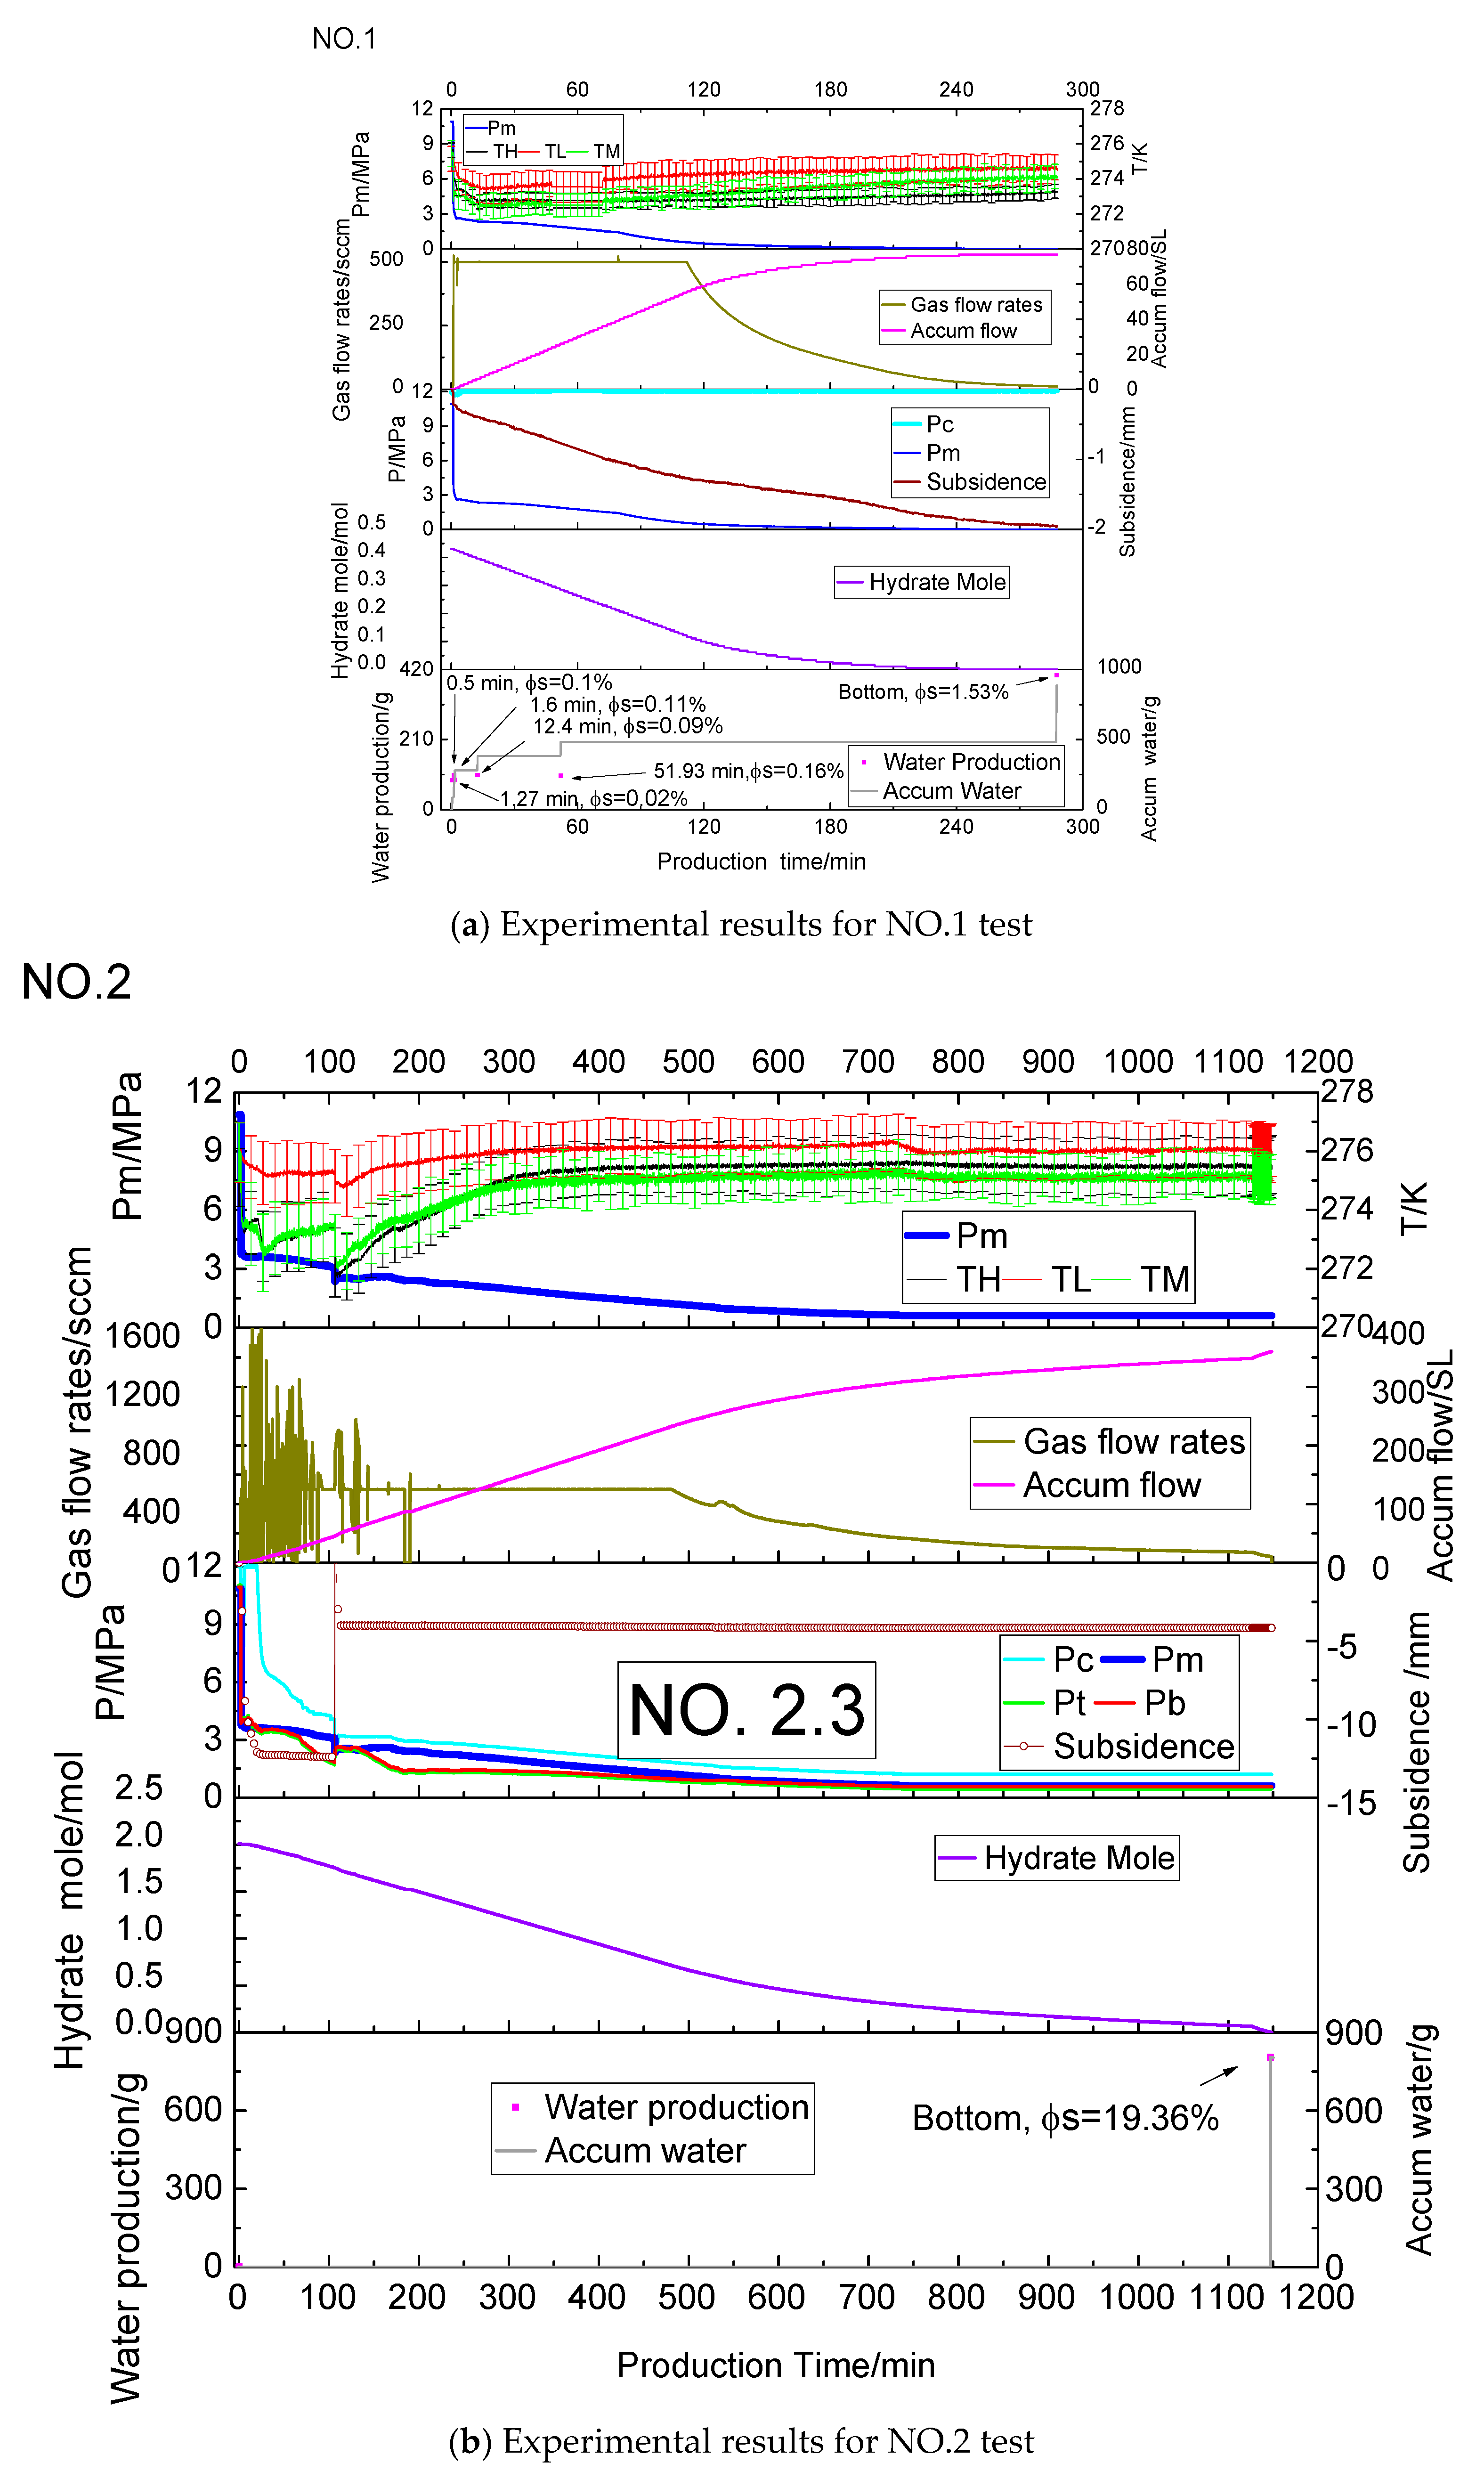
3.1. Characteristics Relating to Pressure

Due to the low permeability and low porosity of hydrate-bearing sediments in the field and experiments, the water and gas supply from the fixed wall at the radial outer boundary could be ignored in the tests. After several experiments, there was no disastrous sand production with a large sized sand screen, so the wellbore was an effective support for sediments. However, we only collected the water and sediments at the bottom in the silty-clay experiments because high mud-flow blocked the water outflow pipeline in the separator. As can be seen from Figure 4., Experiments Nos. 1, 2, and 3 were medium-sand sediments with a vertical well, silty-clay sediments with a vertical well, and silty-clay sediments with a horizontal well, respectively. Compared to the three production periods in medium-sand sediments [27], as shown in Figure 4 (No. 1), the silty-clay sediments showed dramatic sand production and the rates of gas production showed significant fluctuations, as shown in Figure 4 (Nos. 2 and 3).
The apparent differential pressure levels, as shown in Figure 4 (Nos. 2.3 and 3.3), were detected in the silty-clay hydrate sediment exploitation in Experiment Nos. 2 and 3. The pressure differential in different layers was small at the beginning of the well opening, then the pressure gap gradually increased. In the vertical well, the maximum pressure differential between the top and middle was 1.39 MPa at 106 min with crustal stress loading and strategy subsidence. Meanwhile, in the horizontal well, the maximum pressure differential between the top and bottom was 0.90 MPa. To avoid damage to the upper-temperature sensors by further subsidence (over 10%), crustal stress loading at 12 MPa was stopped at 13 min and 14 min in the Experiment Nos. 2 and 3, respectively. With the crustal pressure drop, the pressure gap reduced due to more reservoir space being provided for fluids by the recovered subsidence rates. Then, the pressure gap increased again during the hydrate depressurization. The maximum vertical well pressure differential in the layers was 1.17 MPa at 170 min, and the layer pressure differential gradually became stable after 550 min. Such an obvious pressure differential between layers indicated the low permeability of the silty-clay sediments, which was the main reason for the significant fluctuation in the gas production rates.
The initial water volume of the silty-clay sediments was lower than that in the medium-sand sediments, which means that the silty-clay sediments should produce less methane than the medium-sand sediments from hydrate. However, the silty-clay reservoir in Experiment No. 2 (360 SL) produced a much larger gas volume than did Experiment No. 1 (77 SL). It is speculated that the silty-clay sediments have greater absorption ability, so their gas storage ability is much higher than that of the medium-sand sediments. In Experiment No. 3, non-metered auxiliary gas discharge had to be performed at 240 min; this promoted hydrate decomposition by the temperature rise at 300 min due to the blockage.

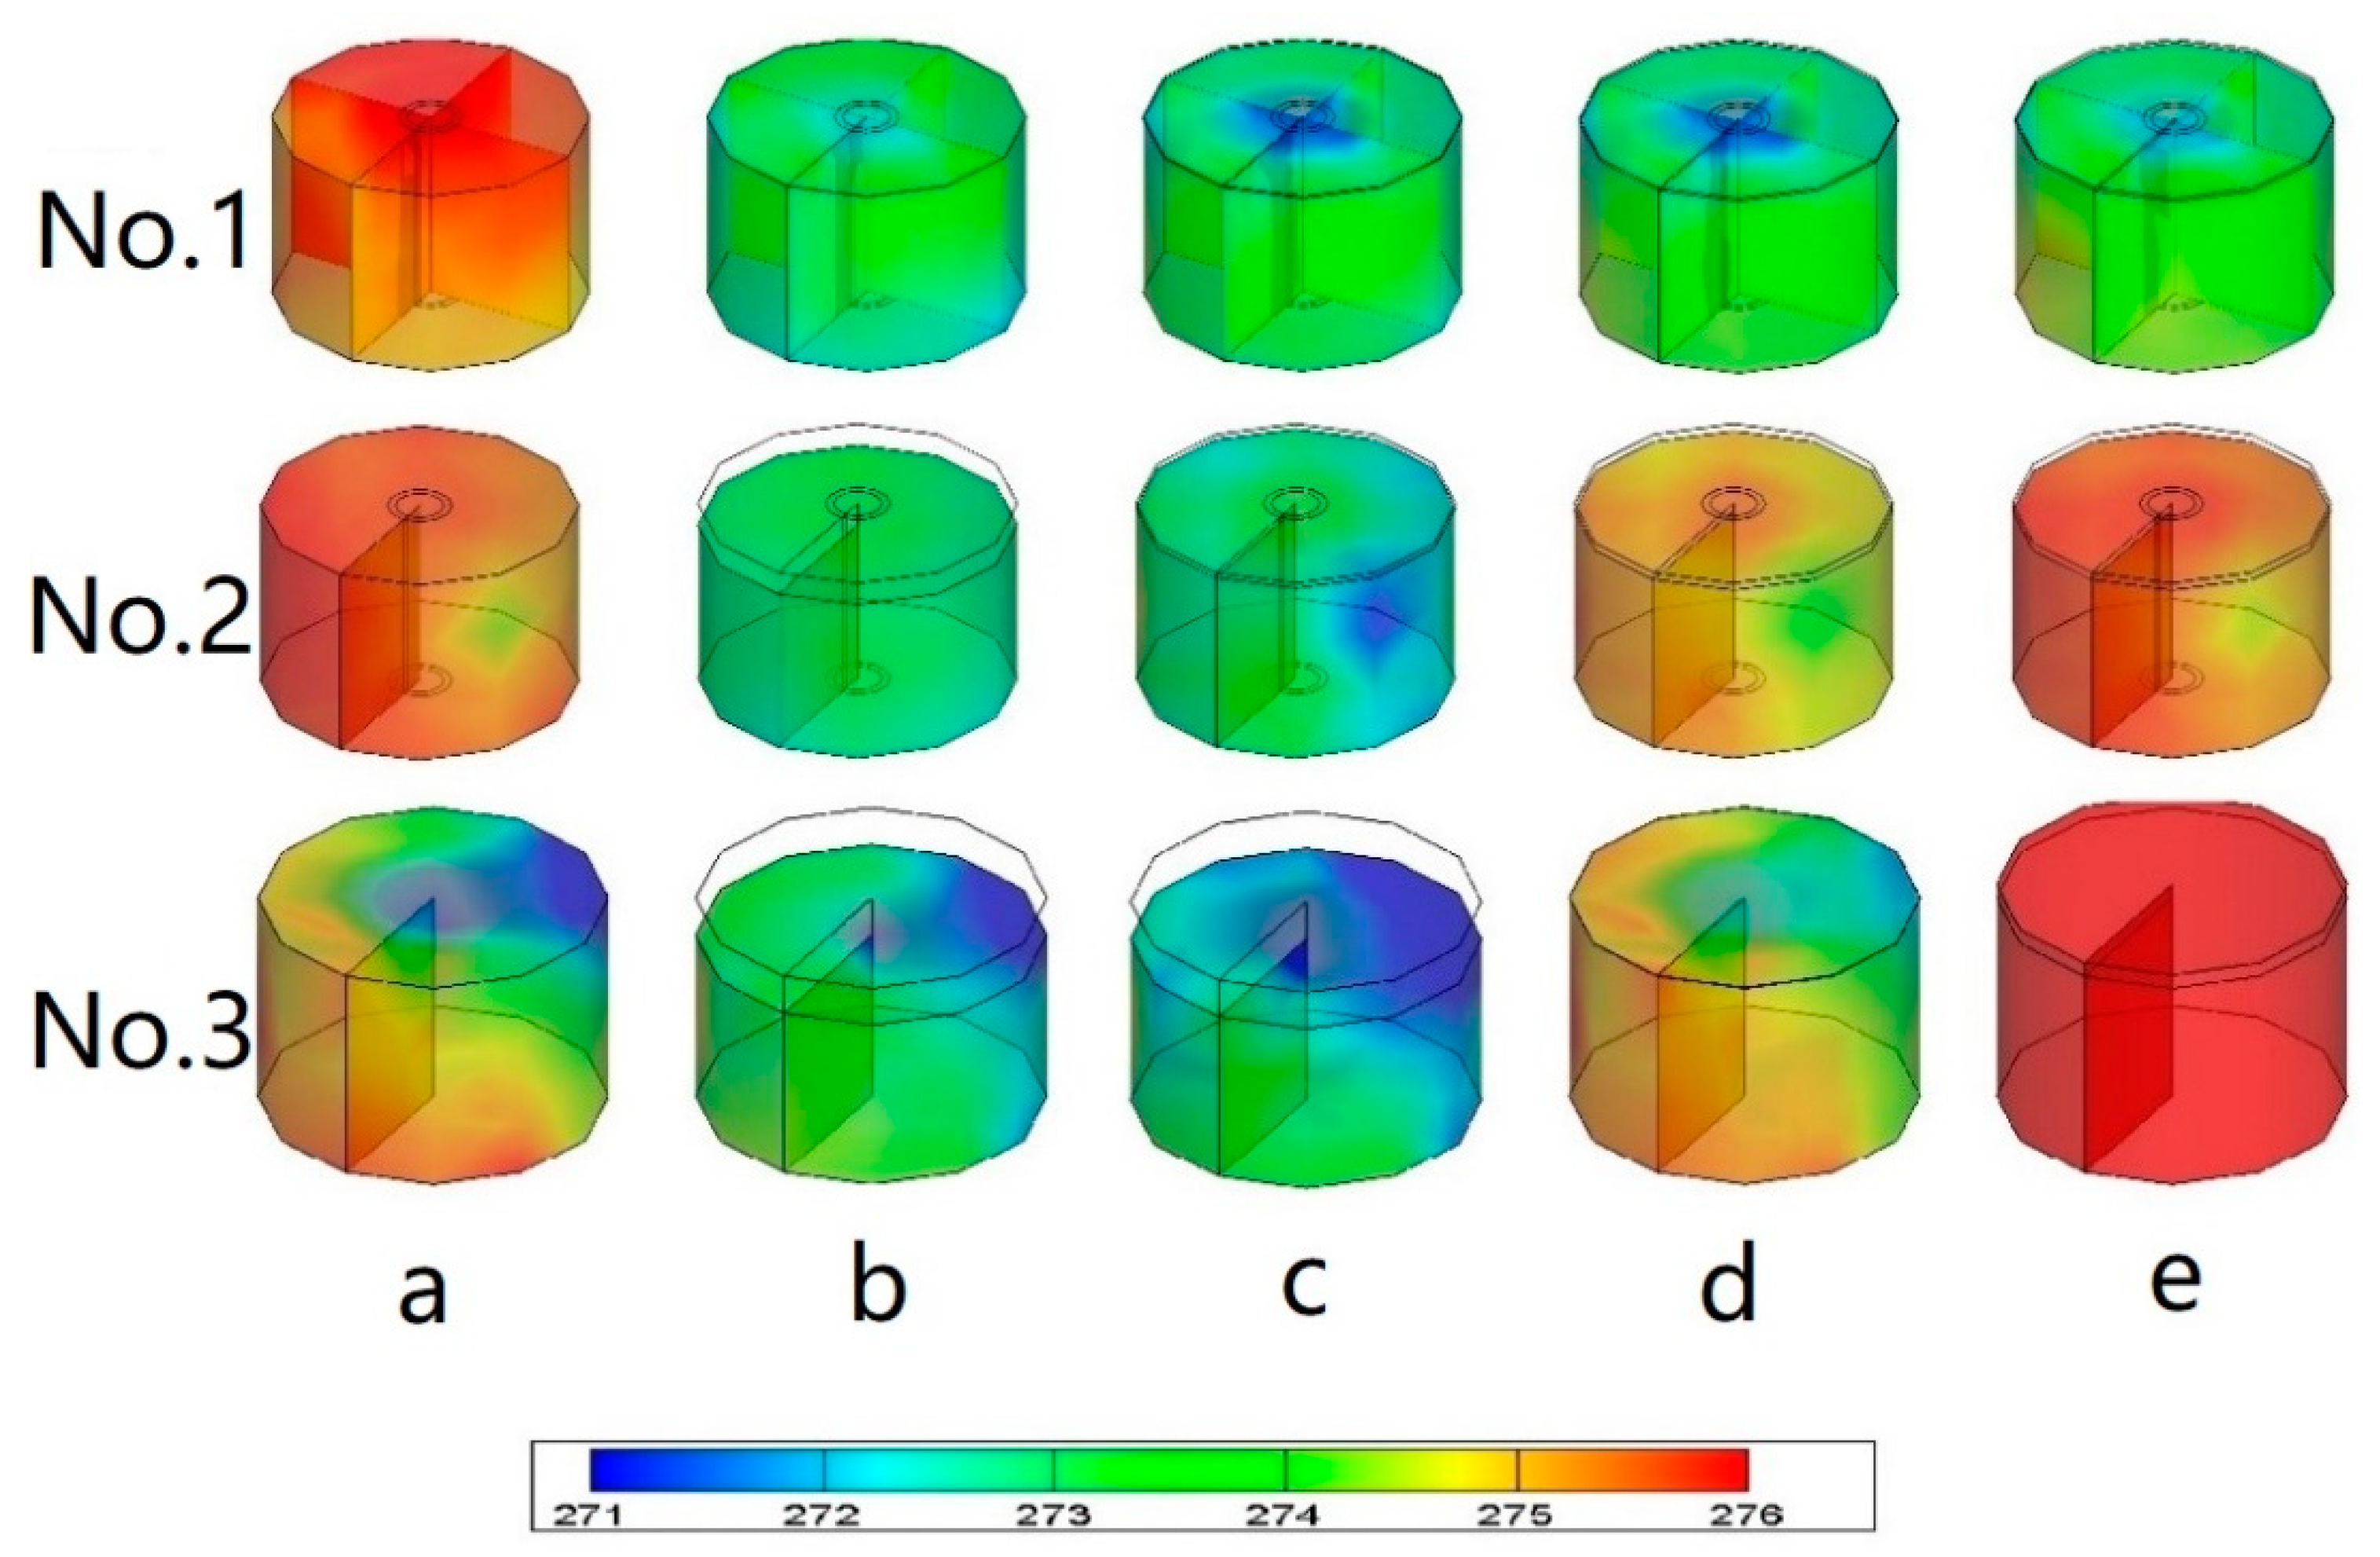
3.2. Characteristics Relating to Temperature

The temperature characteristics of the hydrate production are shown in Figure 5 and Table 2. The low-temperature areas during hydrate production in the vertical well in medium-sand sediments were situated around the wellbore, and the L and H layer temperatures were lower than those in the M layer [27], as shown in Figure 5, (No. 1).
However, the temperature field of the silty-clay hydrate sediments showed an apparent uneven distribution. Experiment Nos. 2 and 3 showed uneven temperatures in the layers. In Experiment No. 2, an apparent temperature difference was measured between the middle layer and top/bottom layers; we also detected an obvious pressure differential (1.39 MP) between the middle layer and top/bottom layer in the vertical well, as shown in Figure 5 (No. 2). Meanwhile, an apparent temperature difference and pressure differential (0.9 MPa) were detected between the top layer and bottom layers in the horizontal well, as shown in Figure 5 (No. 3). The low permeability of the silty-clay hydrate sediments resulted in worse thermal conductivity and heat transfer performance than that in the medium-sand reservoir. The heterogeneity of silty-clay hydrate sediments could also be a reason for this performance.

3.3. Characteristics Relating to Sand Production and Subsidence

In hydrate silty-clay sediment production, the silty-clay rates in the produced water were 19.36% (Experiment No. 2) and 60.46% (Experiment No. 3) in the separation system. This indicated that the silty-clay was carried more by fluid than the medium sand. It was mainly produced in the silty-clay slurry state. Although the total sand production weights accounted for 7.07% (Experiment No.2) and 18.39% (Experiment No. 3) of the total sand weight in the reactor, the maximum subsidence rates of hydrate-bearing sediments were over 12% (Experiment No. 2) and 20% (Experiment No. 3), which indicated high deformation of the silty-clay sediments.
According to the characteristics of silty-clay, there should be a process of silty-clay hydration and expansion during water substitution, which leads to reservoir volume increase. Then, the hydrated silty-clay shrinks when it loses water during the mining process, which is conducive to significant deformation of the reservoir volume; this was manifested as subsidence of the formation.

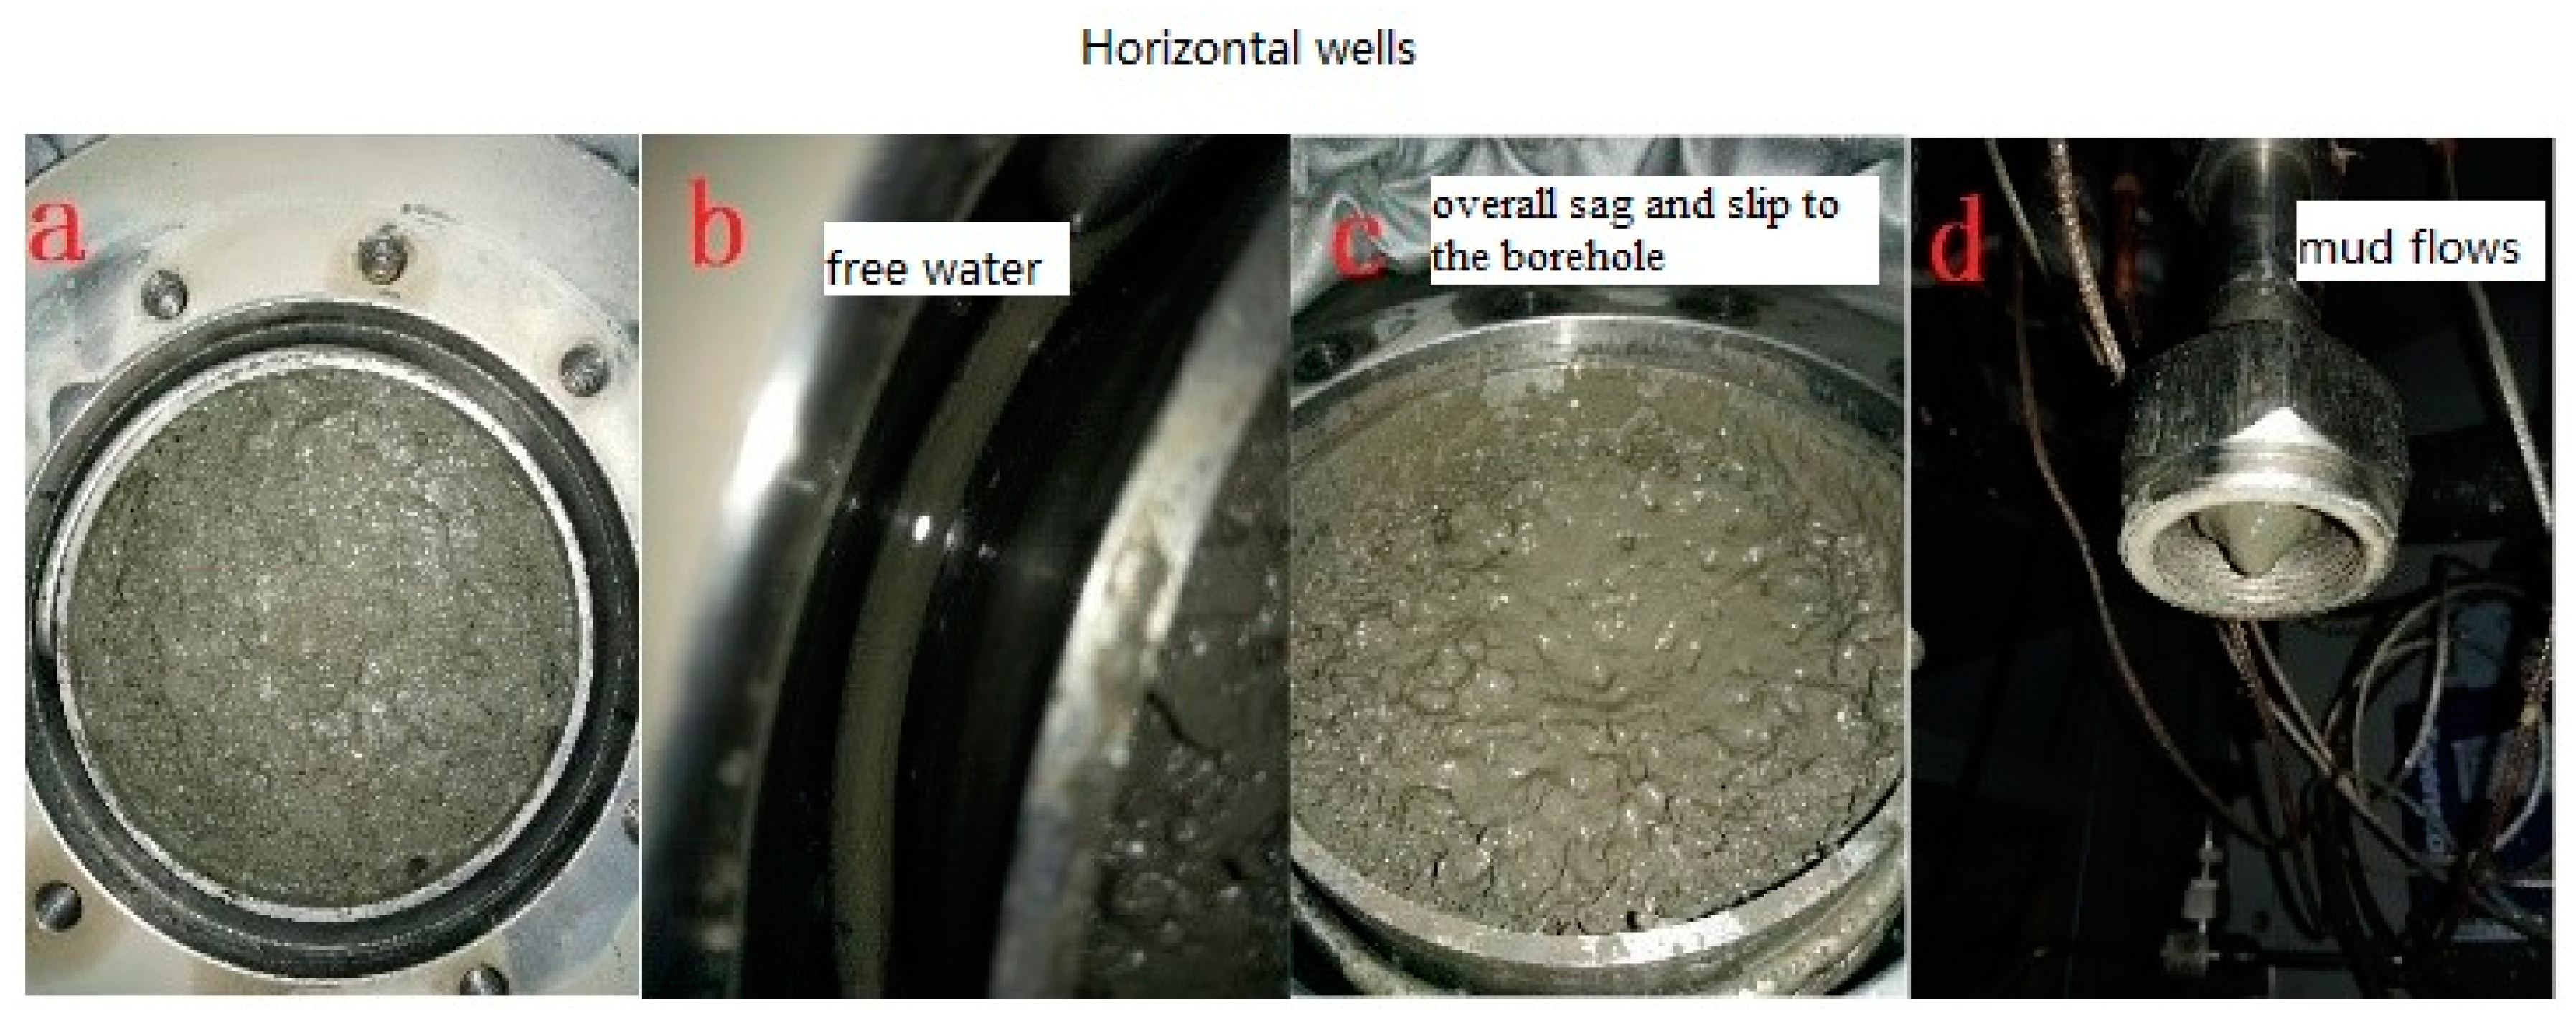
3.3.1. Sand Production and Subsidence Characteristics in a Horizontal Well

As can be seen from Figure 4, Figure 5 and Figure 6, the water-driven reservoir consisted of water-saturated sediments, as shown in Figure 6a. In the first production period [27], the drainage and gas production period, a large amount of silty-clay was carried into the wellbore and formed a mudflow, as shown in Figure 6b, and fluids could still pass through. In the second production period, the high gas production period, the gas production rates were maintained at 1000 sccm in the first 50 min of production. Then, the gas production decreased instantaneously and did not increase again. Thus, it was speculated that the wellbore was blocked, as shown in Figure 6d. Although the mudflow allowed for high sand production, the silty-clay was insufficient to aggregate in the wellbore due to the high water content. Then, the high speed of gas production reduced the water content in the silty-clay; the silty-clay adhered to the wellbore after the water loss and gradually accumulated and formed deposits, eventually blocking the wellbore.
In the end, free water was detected between the reactor wall and the sediment chamber wall, as shown in Figure 6b, indicating the low permeability of the reservoir. The silty-clay reservoir suffered overall sag and slip to the borehole of the horizontal well, as shown in Figure 6c, which conducted the mudflow and overall sand production. Thus, with the combined force of gravity and fluid thrust, it had a significant influence on the deformation of the silty-clay reservoir near the borehole. Therefore, the angle of perforation in the horizontal wells should be considered, which could avoid an increase in sand production and reservoir deformation by a combination of gravity and fluid thrust force.

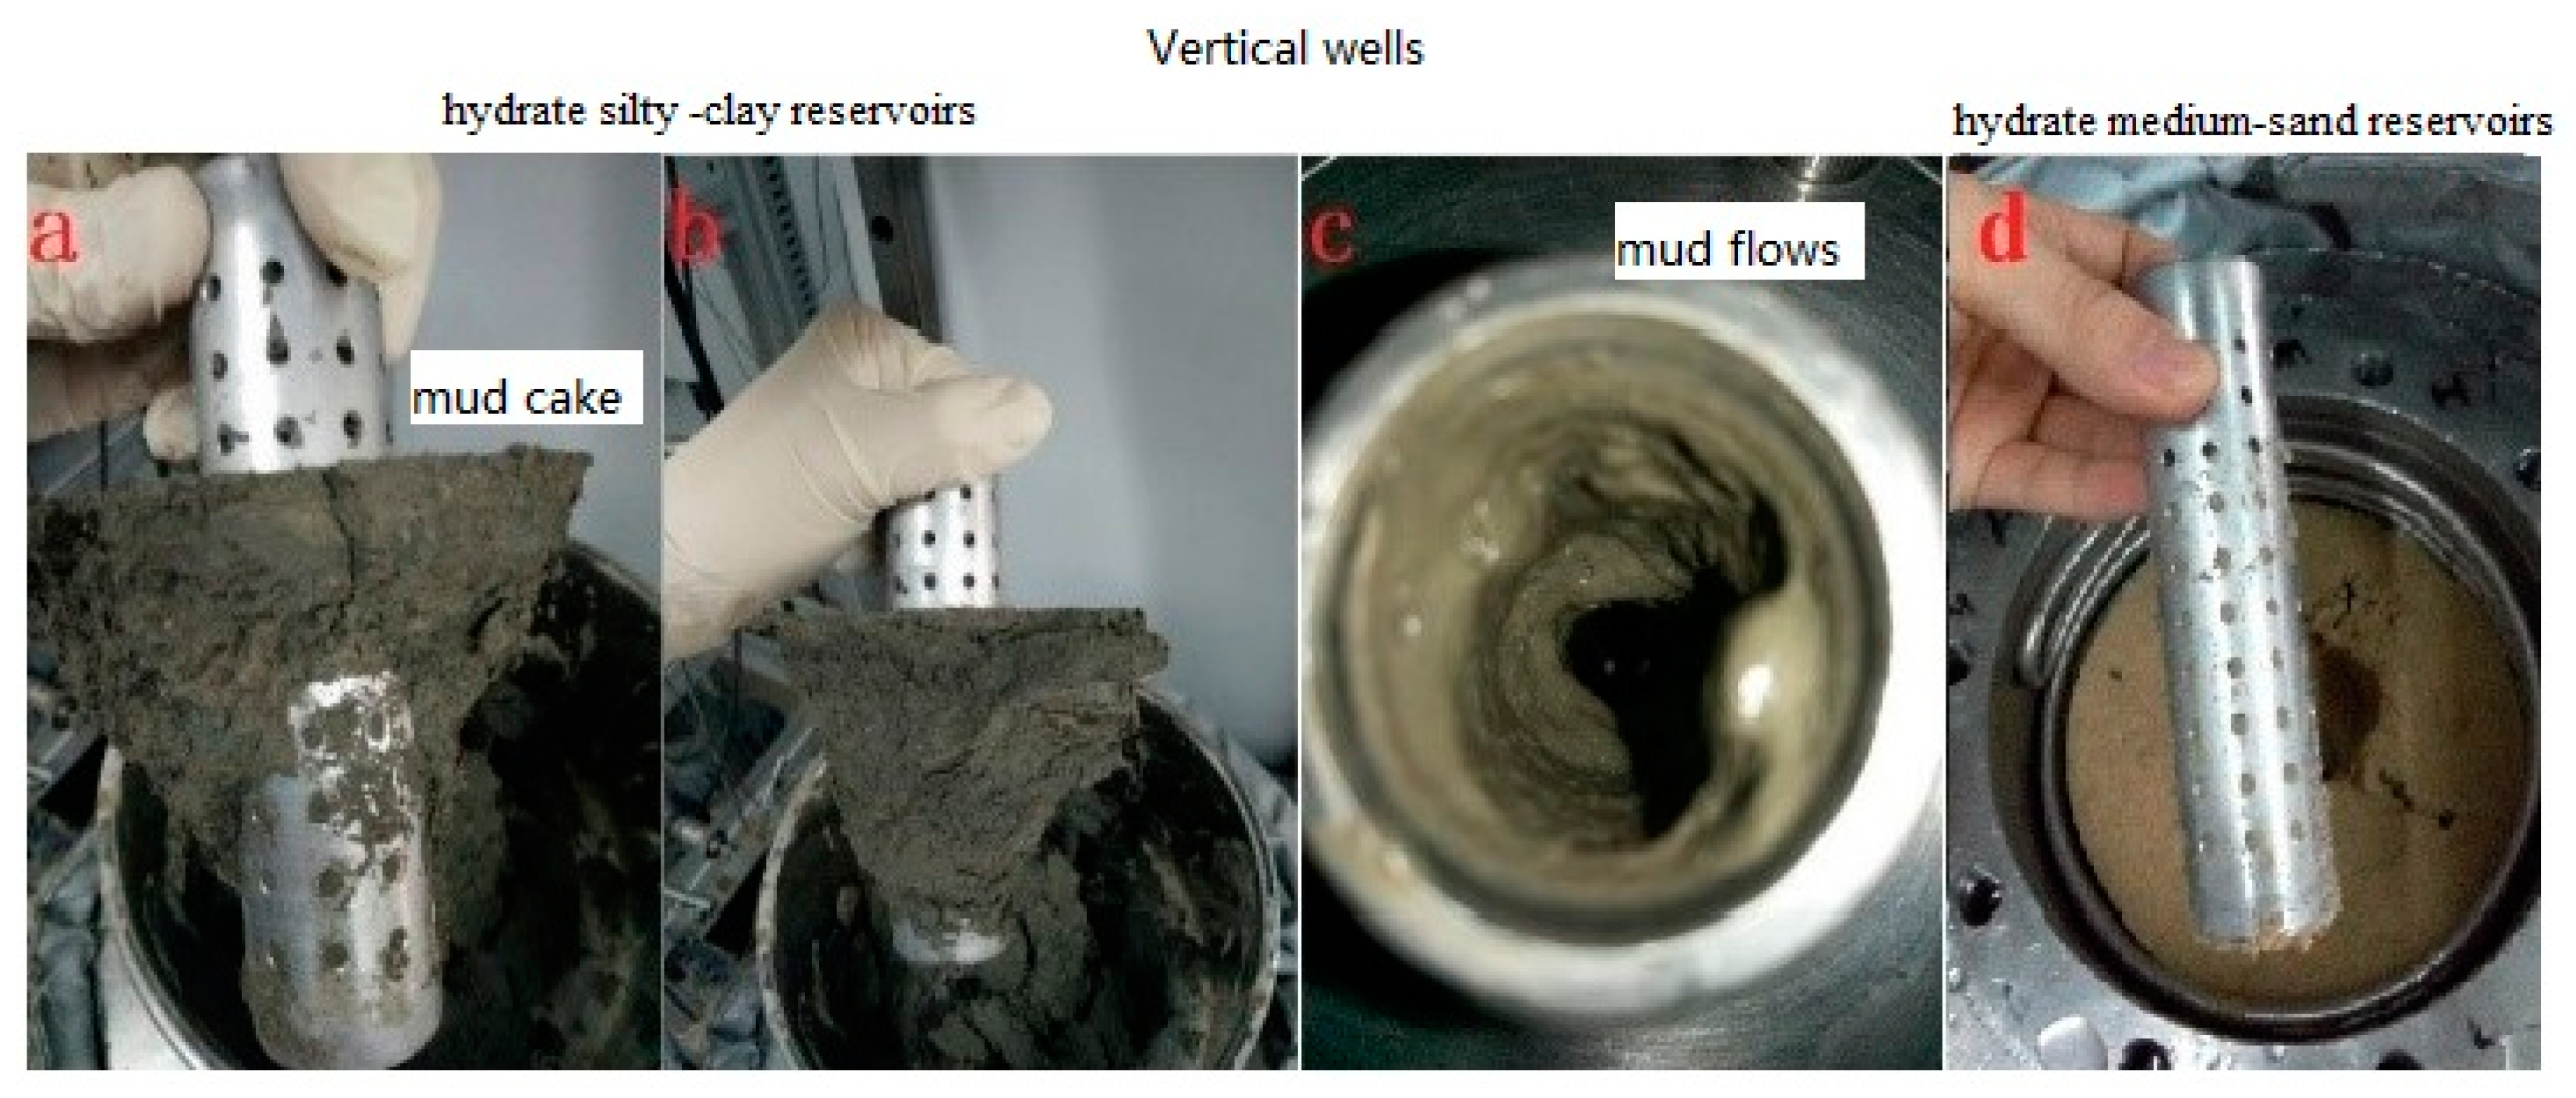
3.3.2. Sand Production and Subsidence Characteristics in a Vertical Well
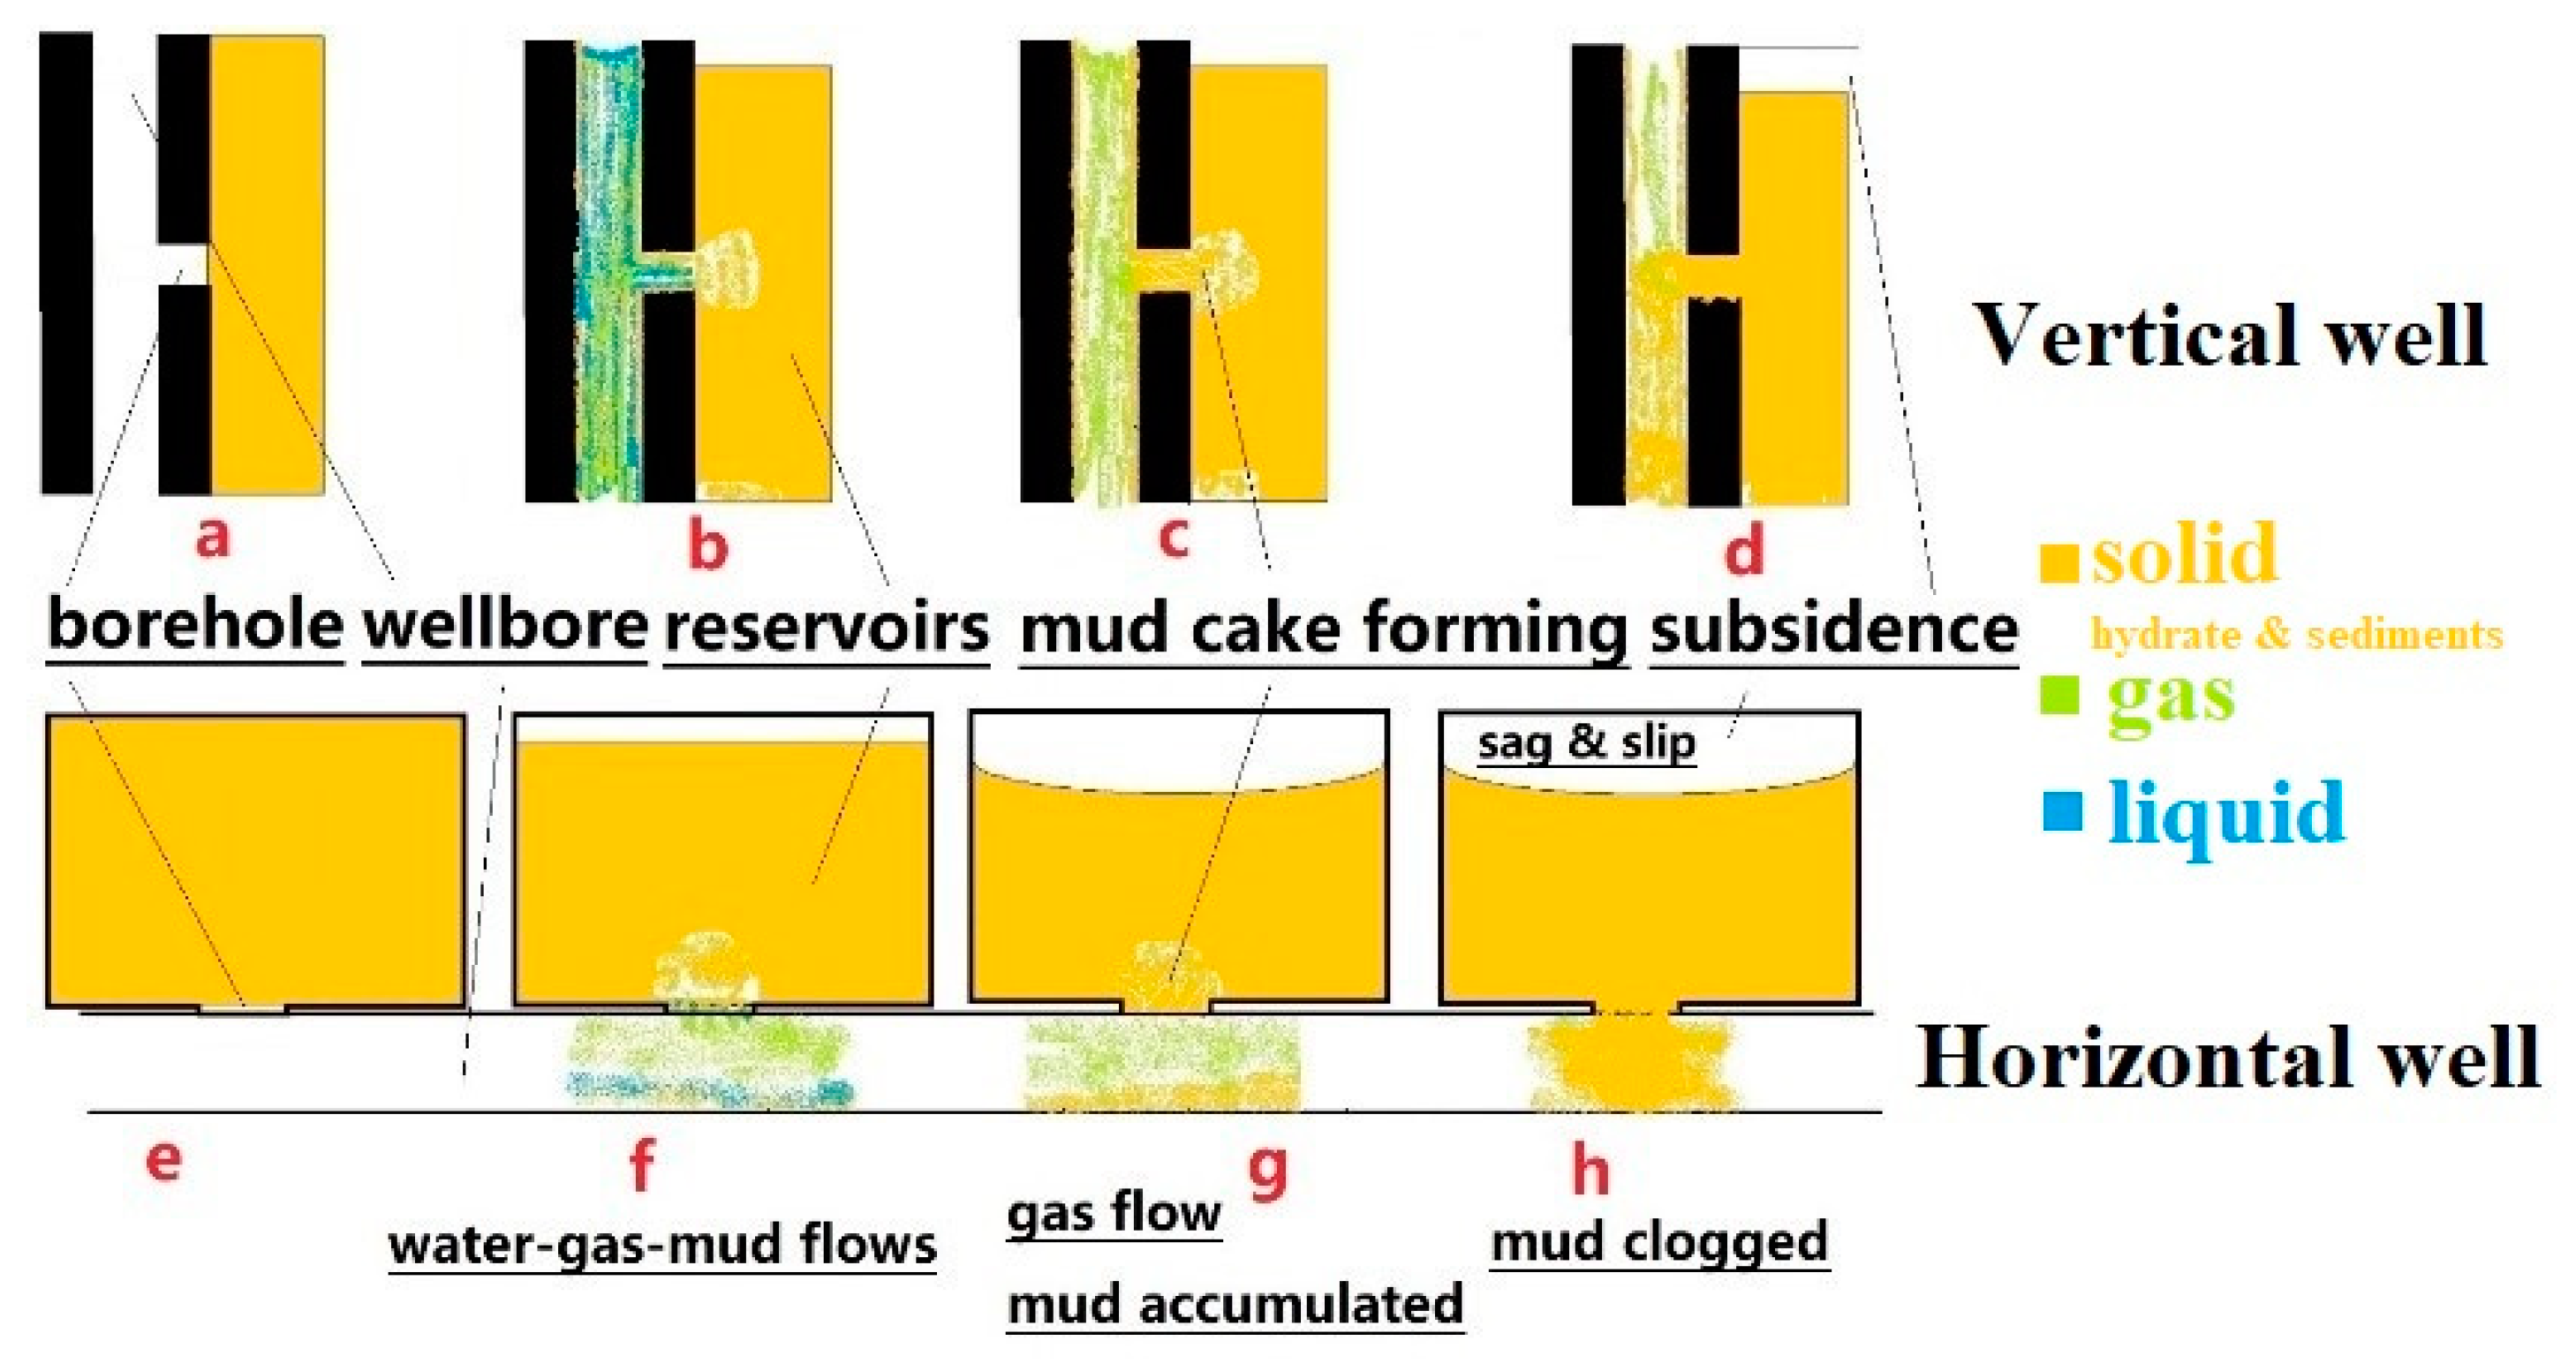
From Figure 4, Figure 5 and Figure 7, lots of silty-clay was carried by fluids into the wellbore as mudflow, as shown in Figure 7c, which resulted in unstable gas production in the first production period. Then, the produced silty-clay gradually accumulated on the wellbore wall and blocked the wellbore in the second and third production periods. In drilling engineering, the drilling fluid is capable of filtration and wall building. From the definition of drilling engineering, the silty-clay sediments exhibit the property of “silty-clay sediment filtration and wall building” during the production process, as shown in Figure 7a,b, but the medium-sand sediments show no such property, as shown in Figure 7d. According to this property, we can infer the formation of “mud cake” in the borehole and around the wellbore, as shown in Figure 7a,b, even blocking the borehole and wellbore, as shown in Figure 7a,b. This “mud cake” could have relatively stable adhesion around the wellbore. It showed visible cracks, which might provide fracture permeability between the wellbore and sediments, as shown in Figure 7a,b. Then, it guaranteed stable gas production at 400 sccm during the periods of 200–300 min and 1000–1100 min. Thus, the reservoir reformation of “mud cake” might increase the permeability of the sediments, and by the unique characteristics of silty-clay, “mud cake” adhesion could provide reservoir stability. It should be noted that the shear force due to the interlayer production pressure differential might cause “mud cake” sliding near the wellbore as a whole and sand production.

3.4. Discussion

The initial hydrate-bearing sediments contained solids (hydrate and sediments), liquid, and gas, as shown in Figure 8a,e.
In the first production period of the hydrate-bearing sediments, we found that sand production from medium-sand sediments was mainly small grains [27]. However, the sand production from the silty-clay sediments was a mudflow formed by liquids and solids with a high water cut, as shown in Figure 8b,f. There were high risks of subsidence and sand production as a whole due to the overall slip in this period.
In the second production period, the sand production from the medium-sand hydrate reservoir was mainly large sand grains, and sputters of hydrate decomposition provided the driving force for sand migration [27]. With the water cut decreasing, the silty-clay in the mudflow accumulated and deposited on the wall of the wellbore and borehole. Then, the water content was further decreased by gas carrying water from the silty-clay, and the “silty-clay sediment filtration and wall building” property allowed the formation of “mud cake” around the wellbore. This “mud cake” might form fractures to act as seepage channels. However, these “mud cake” fractures between the layers may not be connected, resulting in low interlayer permeability, as shown in Figure 8c,g. Under the condition of a high production pressure differential, the “mud cake” bears the risk of overall sliding sand production and subsidence. Meanwhile, the silty-clay needs less power to migrate than does the medium sand. Thus, the sputters of hydrate decomposition would drive the silty-clay more easily.
In the third production period, the medium-sand reservoir was mainly dominated by slow subsidence without visible sand production [27]. The silty-clay reservoir may have discontinued production at this period due to blockage in the second period, as shown in Figure 8d,h, or have low gas production through the gas channels formed by the “mud cake” fractures in the previous period. The silty-clay sediments showed apparent subsidence during the whole production process.
The “silty-clay sediment filtration and wall building” property can form a “mud cake” with strong adhesion force and good permeability. Thus, reservoir reconstruction is possible, which means reducing the water content of sediments, forming the optimized “mud cake”. Not only can we get “mud cake” with high adhesion strength, but the cracks in the “mud cake” also increase the permeability of the reservoir. Combined with the sand control concept, a “fluid pass, no silty-clay passing” property of the “mud cake” could be built using reservoir reformation technology, which is expected to solve the problem of the silty-clay sediment development.

4. Conclusions

In this study, depressurization production experiments were conducted in hydrate sediments. The results explained the characteristics of sand production and subsidence in vertical and horizontal wells in the hydrate silty-clay sediments.
(1) The hydrate silty-clay sediments and hydrate medium-sand sediments showed different production characteristics. The lower permeability and anisotropies between layers of hydrate silty-clay sediments resulted in the heterogeneity of the layers’ temperature and pressure. However, it still conformed to the three production periods of hydrate production. In the first production period, the sand production of the hydrate silty-clay sediments was mainly mudflow.
(2) The total sand production rates of hydrate silty-clay sediments were lower than the total subsidence rates. Thus, sediment deformation was evident during the mining process of hydrate production. The horizontal well showed the overall sagging and slippage towards the wellbore, and the vertical well presented subsidence of the sediments.
(3) The property of “silty-clay sediment filtration and wall building” was found, which can cause the formation of “mud cake” with cracks. This property provided the idea for hydrate reservoir reconstruction. However, the large production pressure difference between layers may increase the risk of sand production due to the “mud cake” sliding as a whole.
In further research, we will consider conditions closer to those in field tests, like constant crustal and horizontal stress (boundaries), recovery of pressure, heat, and mass.

Author Contributions

J.L., D.L. (Dongliang Li), and D.L. (Deqing Liang) conceived and designed the experiments; J.L. and Y.H. performed the experiments; J.L., L.S., D.L. (Dongliang Li), and D.L. (Deqing Liang) analyzed the data; Y.X. contributed materials and revised the manuscript; J.L. wrote the paper.

Funding

This work is supported by the National Key Research and Development Program of China (2017YFC0307305), Open Project Fund of Key Laboratory of Marine Mineral Resources, Ministry of Natural Resources (KLMMR-2018-B-05), Natural Science Foundation of China (51661165011, 51474197 and 41674076), Natural Science Foundation of Guangdong Province (2017A030310448 and 2018B0303110007) and the Guangdong Province MED Project (GDME-2018D001).

Conflicts of Interest

The authors declare no conflict of interest.

References

  1. Sloan, E.D.; Koh, C.A. Clathrate Hydrates of Natural Gases; CRC Press: Boca Raton, FL, USA, 2007. [Google Scholar]
  2. Milkov, A.V.; Sassen, R. Economic geology of offshore gas hydrate accumulations and provinces. Mar. Pet. Geol. 2002, 19, 1–11. [Google Scholar] [CrossRef]
  3. Milkov, A.V.; Sassen, R. Preliminary assessment of resources and economic potential of individual gas hydrate accumulations in the Gulf of Mexico continental slope. Mar. Pet. Geol. 2003, 20, 111–128. [Google Scholar] [CrossRef]
  4. Collett, T.; Bahk, J.-J.; Baker, R.; Boswell, R.; Divins, D.; Frye, M.; Goldberg, D.; Husebø, J.; Koh, C.; Malone, M. Methane Hydrates in Nature-Current Knowledge and Challenges. J. Chem. Eng. Data 2014, 60, 319–329. [Google Scholar] [CrossRef]
  5. Moridis, G.J.; Collett, T.S.; Pooladi-Darvish, M.; Hancock, S.; Santamarina, C.; Boswell, R.; Kneafsey, T.; Rutqvist, J.; Kowalsky, M.; Reagan, M.T. Challenges, Uncertainties and Issues Facing Gas Production from Gas Hydrate Deposits; Ernest Orlando Lawrence Berkeley National Laboratory: Berkeley, CA, USA, 2010.
  6. Hyodo, M.; Li, Y.; Yoneda, J.; Nakata, Y.; Yoshimoto, N.; Nishimura, A. Effects of dissociation on the shear strength and deformation behavior of methane hydrate-bearing sediments. Mar. Pet. Geol. 2014, 51, 52–62. [Google Scholar] [CrossRef]
  7. Li, D.; Wu, Q.; Wang, Z.; Lu, J.; Liang, D.; Li, X. Tri-Axial Shear Tests on Hydrate-Bearing Sediments during Hydrate Dissociation with Depressurization. Energies 2018, 11, 1819. [Google Scholar] [CrossRef]
  8. Grover, T.; Moridis, G.J.; Holditch, S.A. Analysis of Reservoir performance of messoyakha gas hydrate reservoir. In Proceedings of the Eighteenth International Offshore and Polar Engineering Conference, Vancouver, BC, Canada, 6–11 July 2008. [Google Scholar]
  9. Yamamoto, K.; Dallimore, S. Aurora-JOGMEC-NRCan Mallik 2006–2008 gas hydrate research project progress. Nat. Gas Oil 2008, 304, 285–4541. [Google Scholar]
  10. Haberer, R.M.; Mangelsdorf, K.; Wilkes, H.; Horsfield, B. Occurrence and palaeoenvironmental significance of aromatic hydrocarbon biomarkers in Oligocene sediments from the Mallik 5L-38 Gas Hydrate Production Research Well (Canada). Org. Geochem. 2006, 37, 519–538. [Google Scholar] [CrossRef]
  11. Lu, H.; Lorenson, T.D.; Moudrakovski, I.L.; Ripmeester, J.A.; Collett, T.S.; Hunter, R.B.; Ratcliffe, C.I. The characteristics of gas hydrates recovered from the Mount Elbert gas hydrate stratigraphic test well, Alaska North Slope. Mar. Pet. Geol. 2011, 28, 411–418. [Google Scholar] [CrossRef]
  12. Saeki, T. Road to Offshore Gas Production Test—from Mallik to Nankai Trough. In Offshore Technology Conference; Offshore Technology Conference: Houston, TX, USA, 2014. [Google Scholar]
  13. Zhou, S.; Chen, W.; Li, Q.; Zhou, J.; Shi, H. Research on the solid fluidization well testing and production for shallow non-diagenetic natural gas hydrate in deep water area. China Offshore Oil Gas 2017, 29, 1–8. [Google Scholar]
  14. Li, J.-F.; Ye, J.-L.; Qin, X.-W.; Qiu, H.-J.; Wu, N.-Y.; Lu, H.-L.; Xie, W.-W.; Lu, J.-A.; Peng, F.; Xu, Z.-Q.; et al. The first offshore natural gas hydrate production test in South China Sea. China Geol. 2018, 1, 5–16. [Google Scholar] [CrossRef]
  15. Wu, N.; Huang, L.; Hu, G.; Li, Y.; Chen, Q.; Liu, C. Geological control factors and scientific challenges for offshore gas hydrate exploitation. Mar. Geol. Quat. Geol. 2017, 37, 1–11. [Google Scholar]
  16. Lu, J.; Li, D.; He, Y.; Liang, D.; Xiong, Y. Research Status of Sand Production during the Gas Hydrate Exploitation Process. Adv. New Renew. Energy 2017, 5, 394–402. [Google Scholar]
  17. Uchida, S.; Klar, A.; Yamamoto, K. Sand production model in gas hydrate-bearing sediments. Int. J. Rock Mech. Min. Sci. 2016, 86, 303–316. [Google Scholar] [CrossRef]
  18. Boswell, R. Engineering. Is gas hydrate energy within reach? Science 2009, 325, 957. [Google Scholar] [CrossRef]
  19. Oyama, H.; Nagao, J.; Suzuki, K.; Narita, H. Experimental analysis of sand production from methane hydrate bearing sediments applying depressurization method. J. MMIJ 2010, 126, 497–502. [Google Scholar] [CrossRef]
  20. Jung, J.W.; Jang, J.; Santamarina, J.C.; Tsouris, C.; Phelps, T.J.; Rawn, C.J. Gas Production from Hydrate-Bearing Sediments: The Role of Fine Particles. Energy Fuels 2011, 26, 480–487. [Google Scholar] [CrossRef]
  21. Suzuki, S.; Kuwano, R. Evaluation on stability of sand control in mining methane hydrate. Seisan Kenkyu 2016, 68, 311–314. [Google Scholar]
  22. Murphy, A.; Soga, K.; Yamamoto, K. A laboratory investigation of sand production simulating the 2013 Daini- Atsumi Knoll gas hydrate production trial using a high pressure plane strain testing apparatus. In Proceedings of the 9th International Conferences on Gas Hydrate, Denver, CO, USA, 25–30 June 2017. [Google Scholar]
  23. Murphy, A.J. Sediment Heterogeneity and Sand Production in Gas Hydrate Extraction: Daini-Atsumi Knoll, Nankai Trough, Japan. Ph.D. Thesis, University of Cambridge, Cambridge, UK, 2017. [Google Scholar]
  24. Lee, J.; Ahn, T.; Lee, J.Y.; Kim, S.J. Laboratory test to evaluate the performance of sand control screens during hydrate dissociation process by depressurization. In Proceedings of the Tenth ISOPE Ocean Mining and Gas Hydrates Symposium, Szczecin, Poland, 22–26 September 2013. [Google Scholar]
  25. Uchida, S.; Klar, A.; Yamamoto, K. Sand production modeling of the 2013 Nankai offshore gas production test. Energy Geotech. 2016, 1, 451–458. [Google Scholar]
  26. Yan, C.; Li, Y.; Cheng, Y.; Wang, W.; Song, B.; Deng, F.; Feng, Y. Sand production evaluation during gas production from natural gas hydrates. J. Nat. Gas Sci. Eng. 2018, 57, 77–88. [Google Scholar] [CrossRef]
  27. Lu, J.; Xiong, Y.; Li, D.; Shen, X.; Wu, Q.; Liang, D. Experimental Investigation of Characteristics of Sand Production in Wellbore during Hydrate Exploitation by the Depressurization Method. Energies 2018, 11, 1673. [Google Scholar] [CrossRef]
  28. Lu, J.; Xiong, Y.; Li, D.; Liang, D.; Jin, G.; He, Y.; Shen, X. Experimental study on sand production and sea bottom subsidence of non-diagenetic hydrate sediments in depressurization production. Mar. Geol. Quat. Geol. 2019, 39, 13. [Google Scholar]
  29. Li, X.-S.; Yang, B.; Zhang, Y.; Li, G.; Duan, L.-P.; Wang, Y.; Chen, Z.-Y.; Huang, N.-S.; Wu, H.-J. Experimental investigation into gas production from methane hydrate in sediment by depressurization in a novel pilot-scale hydrate simulator. Appl. Energy 2012, 93, 722–732. [Google Scholar] [CrossRef]
Figure 1. Diagram of the sand production facility for (a) a vertical well [27] and (b) a horizontal well.
Energies 12 04268 g001
Figure 2. (a) Top and flat views of the sediment chamber in the vertical well [27]; (b) top view of the sediment chamber in the horizontal well. Each T is a temperature sensor, 1–12 displays their alignment; layers H, M, and L display the heights of the temperature sensors at 70, 40, and 10 mm, respectively.
Energies 12 04268 g002
Figure 3. The particle size distribution of the sand.
Energies 12 04268 g003
Figure 4. Pressure, temperature, flow rate, and subsidence rate. (TH, TL, and TM indicate the mean temperature and standard deviation in the top, bottom, and middle layers; Φs indicates the sand rates in produced water; Pc, Pt, Pm, and Pb indicate crustal pressure, top layer pore pressure, middle layer pore pressure, and bottom layer pore pressure).
Energies 12 04268 g004aEnergies 12 04268 g004bEnergies 12 04268 g004c
Figure 5. Temperature spatial distribution and subsidence over time in experiments.
Energies 12 04268 g005
Figure 6. (a) The reservoir after water substitution; (b) free water between the reactor wall and sediments chamber wall; (c) the reservoir after mining; (d) the blocked connection pipe (wellbore) of the gas–liquid–solid separator.
Energies 12 04268 g006
Figure 7. (a) The wellbore after production (borehole mud cake); (b) mud cake around the wellbore; (c) inside the wellbore after production; (d) wellbore (medium sand) after production.
Energies 12 04268 g007
Figure 8. Production schematics of horizontal and vertical silty-clay wells: (a) a vertical well in hydrate-bearing sediments; (b) the first production period of a hydrate vertical well; (c) the second production period of a hydrate vertical well; (d) the third production period of a hydrate vertical well; (e) a horizontal well in hydrate-bearing sediments; (f) the first production period of a hydrate horizontal well; (g) the second production period of a hydrate horizontal well; (h) the third production period of a hydrate horizontal well.
Energies 12 04268 g008
Table 1. Experimental details.
NoDry Sand Weight (kg)Formation Water (g)Amount of Water Substitution (mL)Gas Production (SL)Hydrate Mole (mol)Water-Sand-Production (g)Dried Sand Production (g)Water-Gas-Sand Mix ConditionsFormation Conditions
1Medium sand, 2250653.86770.43887.396.63T = 293.15 K;
P = 11 MPa;
t = 24 h.
T = 275.15 K;
P = 11 MPa;
t = 48 h.
Tw = 273.15 K.
2silty-clay, 2.2200978.243602.01803.67155.58
3silty-clay, 2.22001215.3933 *0.184 *669.09 *404.5 *
* The non-metered auxiliary gas discharge was used for decompression due to blockage. (T, P, and t are the temperature, pressure, and duration of formation. Tw is the water drive temperature).
Table 2. Description of parameters in Figure 5 (production time (m, min), subsidence ratio (S, %)).
Noabcde
10 m, S = 0%10.17 m, S = −0.38%110.83 m, S = −1.26%200 m, S = −1.66%287.17 m, S = −1.96%
20 m, S = 0%40 m, S = −12.26%110 m, S = −2.97%250 m, S = −4.04%400 m, S = −4.08%
30 m, S = 0%25 m, S = −18.78%50 m, S = −18.67%294 m, S = 0.35%494 m, S = 6.79%

