Article

Thermo-Economic Analysis of A Geothermal Binary Power Plant in Indonesia—A Pre-Feasibility Case Study of the Wayang Windu Site

by
Andreas Diga Pratama Putera
1,2,
Annisa Nurul Hidayah
1 and
Alison Subiantoro
3,*
1
Department of Engineering Science, The University of Auckland, 20 Symonds Street, Auckland 1010, New Zealand
2
Department of Chemical Engineering, Universitas Gadjah Mada, Jalan Grafika No. 2, Yogyakarta 55182, Indonesia
3
Department of Mechanical Engineering, The University of Auckland, 20 Symonds Street, Auckland 1010, New Zealand
*
Author to whom correspondence should be addressed.
Energies 2019, 12(22), 4269; https://doi.org/10.3390/en12224269
Submission received: 9 October 2019 / Revised: 1 November 2019 / Accepted: 5 November 2019 / Published: 8 November 2019

Abstract

:
Indonesia has a predicted geothermal potential of 29 GWe, which is the biggest in the world. With this potential, the government has the ambitious target to generate as much as 7 GWe of electricity in 2025 from geothermal energy. However, the installed capacity of geothermal power plant in Indonesia until 2019 is only 1.9 GWe. Enhancements in already-installed geothermal power plants with a binary power plant can be considered to achieve the 2025 target. In this research, a thermo-economic analysis is carried out to assess the feasibility of binary power systems to enhance the existing geothermal power plants in Indonesia. The Wayang Windu site is selected as the case study. Three working fluids, i.e., n-Pentane, isopentane, and R245fa, are compared. Two different optimization objectives are considered and compared. First, the thermal efficiency is optimized to maximize the thermodynamic performance. In the second scenario, the heat exchanger area is optimized to maximize the economic performance. Analysis of the economic profitability variables, namely the payback period and internal rate of return, shows that optimizing the heat exchangers gives better economic results when compared to optimizing the thermal efficiency. The results also show that the type of working fluid significantly affects both the thermal efficiency and economic profitability of the binary power plant. Moreover, n-Pentane has the most preferred thermo-economic performance for the geothermal conditions at Wayang Windu with the smallest payback period of 13 years and the highest internal rate of return of 11.28%.

1. Introduction

The Indonesian government has been putting a lot of effort into developing renewable energy sources in recent years to achieve the targeted energy mix of 23% from renewables by 2025 [1]. Of all the renewable energy sources in Indonesia, geothermal power is arguably the most promising with a predicted total potential of 29,000 MWe, which is the biggest in the world [2,3]. The government has set a target of 7000 MWe of installed geothermal power plant capacity in Indonesia by 2025 [4]. To put this target in perspective, the total installed electrical generation capacity from geothermal power plants in the country was only 1340 MWe in 2015 [5]. This has increased to 1925 MWe in 2018 [6]. While assuming a constant capacity growth until 2025, more than 600 MWe of new geothermal power plants must be built each year to achieve the target.
In general, there are two ways to boost power generation from geothermal power plants: (1) developing new sites and (2) enhancing existing power plants. Building new geothermal power plants typically take years from the initial study until operation in Indonesia. Experience has shown that the preliminary survey might take five to seven years to complete, the exploration three to five years, the drilling and plant development two to three years, and the Power Purchase Agreement (PPA) from two to three years [7]. Moreover, building new geothermal power plants are usually considered a risky investment with a high capital cost at the beginning of the development, which makes the business case often not too attractive [2]. On the other hand, enhancing an existing power plant is simpler, faster, and more economical.
Among the available options to enhance an existing geothermal power plant, recovering waste heat from the discharged geothermal brine with a binary power cycle is very attractive, because it offers the best performance and it is the most economical when compared to other methods [8]. Currently, there is only one commercially operational geothermal binary power plant in Indonesia, which is located in Sarulla, North Sumatera [9]. This binary system contributes as much as 49% of the total plant capacity of 110 MW [10]. A smaller binary power plant with a capacity of 500 kW has been in development in Lahendong, North Sulawesi, since 2015, but it is not operational yet at the moment [11]. Despite of all the promises, it is noted that there is still some reluctance to adopt binary power system technology, because the working fluids may have flammability and/or environmental issues [3]. Another issue is the fact that binary power plants cannot contribute as much power as the main geothermal power plant, which might deter investors [5].
To address these concerns, feasibility studies are crucial. Traditionally, such studies have been focused on working fluid selections and system architecture from a thermodynamics point of view. For example, the research by Franco and Villani [12] found that for water-dominated, medium-temperature geothermal fields, a binary power plant could enhance the first law efficiency by up to 12% and the second law efficiency by 45%. A study by Astolfi et al. [13] found that the optimal performance of a simple binary geothermal power plant that they studied was achieved by fluids with a ratio between its critical and inlet geofluid temperatures of 0.88 to 0.92. They also mentioned that superheating was not necessary and the optimal design adopted the saturated cycle configuration. Another research by Liu et al. [14], which emphasized the work output and exergy analysis, found that a simple cycle with R123 as the working fluid was the optimal design for a low-temperature geothermal resource, with a temperature of 80–95 °C.
Recently, the thermo-economic approach has been increasingly popular. It gives a more comprehensive picture of both the expected technical and economical performances. Hettiarachchi et al. [15] suggested that it is crucial to optimize the binary cycles based on the thermo-economic approach, especially in the case of utilizing low to medium temperature heat source. Such studies have been conducted in various places, including the thermo-economic investigation of a geothermal binary power plant based on typical geothermal resource conditions in New Zealand, which concluded that the most thermo-economic design for the specified brine conditions was a standard Rankine cycle while using n-Pentane as the working fluid, because it had the best payback period [16]. A low-temperature geothermal energy analysis in Italy was carried out by Gemelli et al. [17], which found that mountainous locations had a longer payback time than hills. Zare [18] studied the payback periods and the net present values of three different binary geothermal systems, i.e., a simple Organic Rankine Cycle (S-ORC), an Organic Rankine Cycle with internal heat exchanger (ORC-IHE), and a Regenerative Organic Rankine Cycle (R-ORC). The research found that the S-ORC system yielded the best economic performance while the ORC-IHE was the optimum from thermodynamic point of view. Assad et al. [8] compared the binary geothermal power plant system with single flash and double flash technology in Geneva, Switzerland while using both thermodynamics and economic approaches. The result shows that the binary power plant was the optimum system as compared to the other configurations based on the thermo-economic approach.
A number of feasibility studies in Indonesia for binary power systems have also been attempted. For example, Prananto [19] selected Kalina cycle as the binary system for the Wayang Windu site at Pangalengan, West Java, and showed that the cycle could produce up to 1660 kW of electricity with a system efficiency of 13.2%. Pasek et al. [20] assessed the application of a binary cycle to utilize the waste brine from the Lahendong geothermal power plant with maximum net power output as the objective. Pambudi et al. [21] analyzed the thermodynamic performance of a single flash–binary system for the Dieng geothermal power plant. Pikra et al. [22] assessed the implementation of Organic Rankine Cycle (ORC) for extracting energy from hot springs in Indonesia. However, none of these studies considered the economic aspect of building a binary system for a geothermal power plant in Indonesia. All of the research mentioned above only focused on the thermal efficiency and net power output as the assessment objectives.
This work aims at presenting a thermo-economic approach to study the feasibility of a binary geothermal power plant in Indonesia. The Wayang Windu geothermal plant in West Java was selected in this study due to the availability of the actual geothermal brine data. The study included the selection of the working fluid, optimization of the system performance, and financial analysis. The fluids considered included n-Pentane, Isopentane, and R245fa, which are some of the most popular fluids in binary power plants [23]. According to Zare (2015), these working fluids have [18]:
  • High latent and specific heat
  • High density in both liquid and gas phase
  • Moderate critical temperature and pressure
  • Moderate evaporating and condensing temperatures.
  • Excellent transport and heat transfer properties
  • Safety and chemical stability
  • Material capability and no corrosion
  • Market availability and low cost
  • Environmentally benign
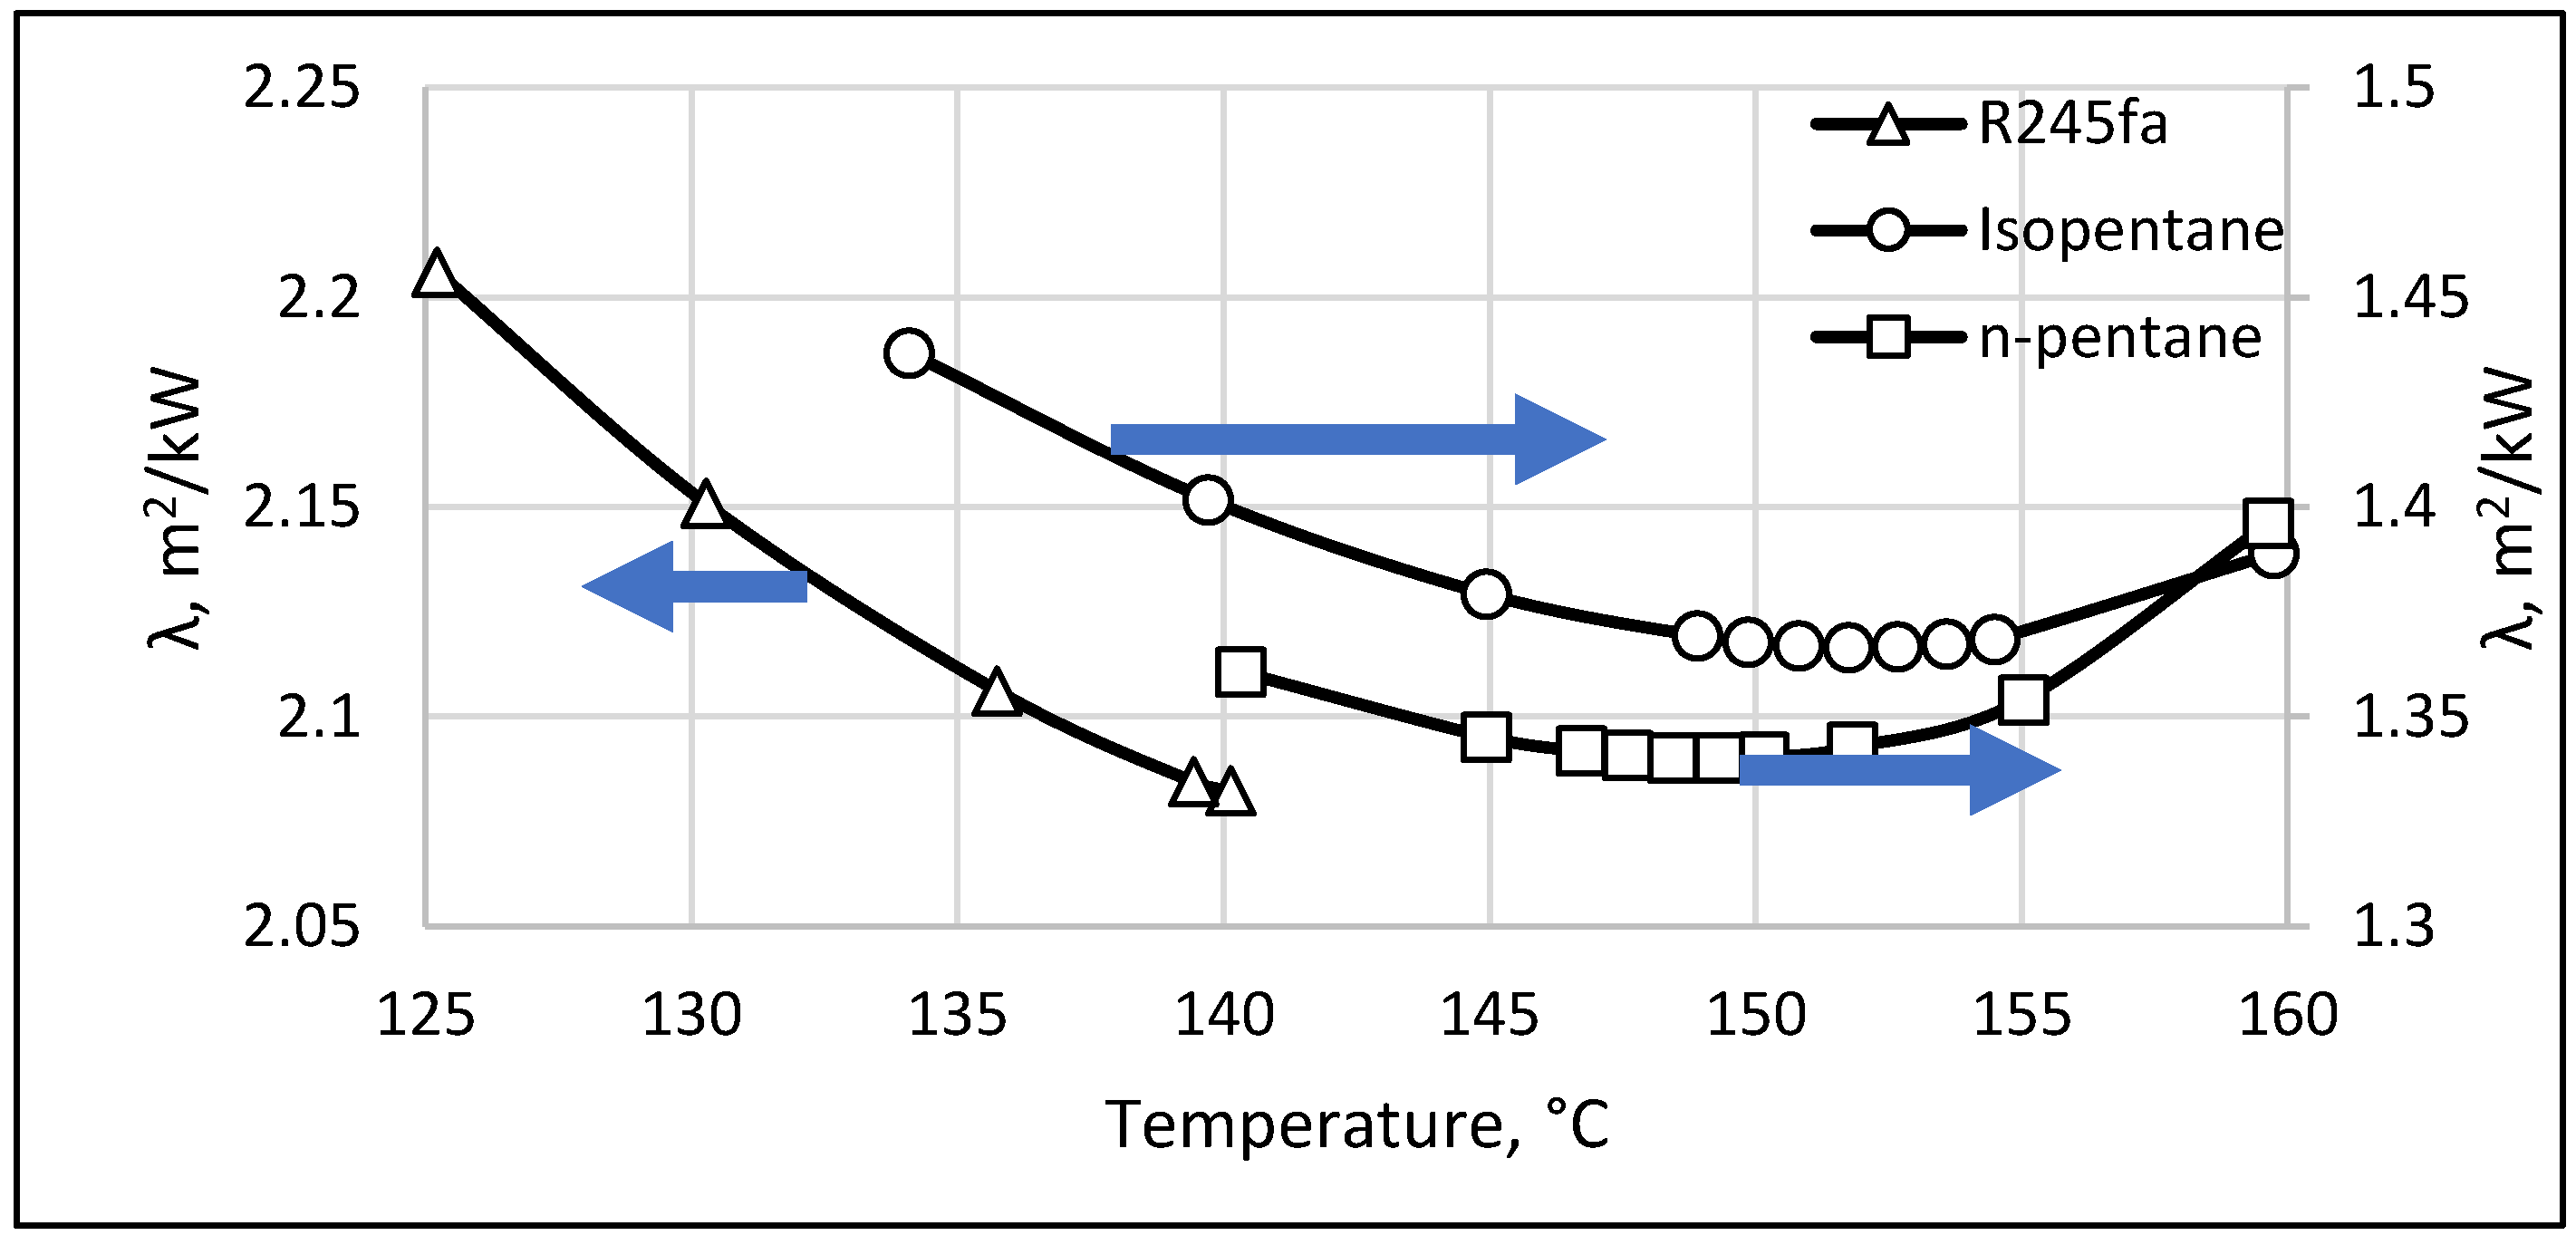
Two approaches were adopted and compared to find the optimum operating conditions: (1) maximizing the thermal efficiency and (2) minimizing the specific area of the heat exchangers to minimize the cost [24]. It is worth noting that a larger heat exchanger is required to extract the same amount energy from a low to medium temperature heat source. Consequently, the total capital cost of the system increases. As mentioned by Toffolo et al. [25] and Uehara et al. [26], the main cost of an ORC system for low to medium temperature heat source comes from the heat exchanger equipment. A profitability assessment was carried out to analyze the net present value (NPV) and the internal rate of return (IRR) to investigate the financial implications. NPV is a better economic measurement when compared to the simpler payback time and return of investment analysis approach, as it gives insight into the time value of money and annual variation in revenues and expenses. The time value of money means that the value of money at the present time is worth more than its value in the future due to its potential earning capacity. In addition, the IRR gives helpful insight to compare the performances of capital investments for different projects, the project’s lifetime, or the actual dominant interest rate. The IRR is also a more suitable method than NPV when comparing projects with very different sizes [27]. A more detailed explanation is provided in subsequent sections. The Aspen Plus version 8.6 [28] software is employed to carry out the study.

2. The Indonesian Context

2.1. Climate Conditions

Indonesia is located at the equator. Its climatic conditions are generally tropical, which is identified by the warm and humid conditions [29]. Furthermore, the ambient temperature does not significantly vary throughout the year. In Pangalengan, West Java, where the Wayang Windu geothermal site is located, the average ambient temperature is 25.5 °C and the recorded hottest and coldest temperature are only 29 and 21 °C. Figure 1 provides the daily temperature fluctuation in 2018.
Indonesia only has two seasons: wet and dry. Figure 2 presents the temperature and humidity profiles in wet and dry seasons in Pangalengan [30]. The hourly average temperature in the dry season is about 2–3 °C higher than in the wet season and the relative humidity always stays above 60%. These conditions obviously affect the thermodynamic performance of the power plant and they are considered in the model.

2.2. Electricity Market

Indonesia is the fourth most populous country in the world and it has the largest economy in Southeast Asia with a real gross domestic product (GDP) growth of 6% annually [31]. However, the electrification ratio in the country is relatively low when compared to the neighboring countries. For comparison, the electricity usage per capita in Indonesia is only around 1 MWh, whereas Brunei, Taiwan, and South Korea have reached more than 10 MWh [32]. The electricity demand is still concentrated in the more densely populated Sumatran and Javanese provinces [33], and it is projected to increase at a rate of 8.5% annually until 2050 [34].
The electricity market of Indonesia is fully managed by the government through Perusahaan Listrik Negara (PLN), a state-owned corporation, which acts as the sole electricity buyer in Indonesia. All power plants sell their electricity to PLN at a rate that is not wholly dictated by supply and demand, but rather by the government, depending on the energy source, location, year of commissioning, etc. [32,33]. PLN then sells the electricity to users according to their customer category and capacity load. It is useful to mention that the Indonesian government has set the highest electricity sales price from geothermal power plants to PLN to increase by 3.11% annually [35], as this number will be used to adjust the electricity sales price over the years. It is also useful to note that the geothermal business sector is required to pay an income tax of up to 34% from the net income [36]. Moreover, the average interest rate in Indonesia is 6%, according to Trading Economics (2019) [37].
Based on the latest Electricity Supply Business Plan that was developed by PLN in 2019, the total installed capacity of power plants in Indonesia in October 2018 was 56.5 GWe, of which 12.48% came from renewable energy resources. Geothermal power plants were one of the biggest contributors, providing 1.9 GWe or 27.8% of the total renewable energy sources. PLN plans to increase the renewable energy contribution to the power sector by adding 14.2 GWe more of renewable energy installed capacity by 2025, of which 30.4% (4.32 GWe) will come from geothermal resources [38].

3. Methodology

3.1. The Wayang Windu Geothermal Brine Characteristics

Table 1 provides information regarding the geothermal waste brine at the Wayang Windu geothermal power plant.
Even in geothermal sites with a vapor-dominated steam supply, the brine from its flash separation still contains a considerable amount of thermal energy [39]. However, this brine is usually not favorable for heat utilization or further flashing to generate power, because it is more concentrated with silica. Generally, in lower temperatures, the solubility of silica in geothermal fluids is also lower [40]. An excessive amount of insoluble silica in a geothermal fluid can cause severe scaling in the equipment and pipelines. Therefore, one of the most important design parameters in a binary power system is the minimum temperature of brine utilization.
The amorphous silica concentration in the brine is maintained at a certain level of silica saturation index (SSI) to determine the appropriate reinjection temperature of the geothermal brine, which is defined as the ratio between silica content to its equilibrium concentration at a certain temperature. The solubility of amorphous silica in the brine can be calculated while using the formula that is shown in Equation (1) and it is valid for temperatures of between 0 °C and 250 °C [41].
l o g 10 [ C ] = 731 ( T + 273.15 ) + 4.52 ,
where C is the soluble silica concentration in ppm and T is the temperature in °C.
The SSI can be calculated with Equation (2).
S S I = C I C ,
where CI is the measured silica in solution in ppm.
It is noted that a supersaturated condition that allows for silica precipitation starts at an SSI of 1. However, in a binary geothermal system, the allowable SSI can be extended up to 2 [40]. Therefore, the minimum allowable reinjection temperature is approximately 114 °C in this study.

3.2. Thermodynamic Model

Figure 3 shows the schematic and temperature-entropy diagrams of the organic Rankine cycle (ORC) that is used in this study. In such configuration, the working fluid is pumped through a preheater and an evaporator before entering the turbine. In the evaporator, the working fluid can be vaporized to a superheated state. However, it is useful to note that Bao & Zhao [42] found that it is not necessary for dry-type working fluids, like n-Pentane, Isopentane, and R245fa, to be superheated before entering the turbine. The expansion turbine drives the generator to produce electricity. The expanded working fluid is condensed through a heat exchanger and then pumped to start the cycle again. In the benchmark system, an air-cooled heat exchanger was used. Other assumptions adopted in this study were:
  • Steady state conditions
  • Constant isentropic efficiencies for the pump and the turbine
  • Geothermal brine was water with silica content only (zero non-condensable gas content)
The thermodynamic process of a basic ORC system can be understood by looking at the temperature-entropy diagram that is shown in Figure 3. The processes are described below.
  • Point 1 to point 2 shows the preheating process of the working fluid. In this process, the geothermal fluid as the heat source transfers its heat to the working fluid. The working fluid gets heated and changes its phase from subcooled liquid into saturated liquid.
  • Point 2 to point 3 shows the evaporation process of the working fluid. In this process, the geothermal fluid transfers more of its energy to evaporate the working fluid. This process is crucial to the ORC system to ensure that there is no liquid droplet entering the turbine. The heat that is required in the evaporation process from point 2 to point 3 is calculated by using Equation (3).
    Q ˙ i n =   m ˙ g e o , i n × ( h g e o , i n h g e o , o u t ) ,
    where
    • Q ˙ i n = the amount of heat required for the evaporation process in kJ/s
    • m ˙ g e o , i n = geothermal fluid mass flow rate in kg/s
    • h g e o , i n = enthalpy of the geothermal fluid entering the system in kJ/kg
    • h g e o , o u t = enthalpy of the geothermal fluid leaving the system in kJ/kg
  • Point 3 to point 4 shows the expansion process in the turbine. The thermodynamic assumption used in calculating the turbine work is explained in Equations (4) and (5).
    W T ˙ = m ˙ W F × ( h 3 h 4 ) ,
    η s = h 3 h 4 h 3 h 4 s ,
    where
    • W T ˙ =power generated by the turbine in kJ/s
    • m ˙ W F = working fluid mass flow rate in kg/s
    • h 3 =enthalpy at point 3 in kJ/kg
    • h 4 =enthalpy at point 4 in kJ/kg
    • h 4 s =enthalpy at point 4s, which is the turbine outlet condition if the expansion is isentropic, in kJ/kg
    • η s = isentropic efficiency of the turbine in %
  • Point 4 to point 5 shows the condensation process of the working fluid. The process starts when the working fluid is in the saturated vapour condition. At point 5, the working fluid has entirely changed phase into liquid. The amount of heat released in the condensation process ( Q ˙ o u t ) is calculated with Equation (6).
    Q ˙ o u t = ( m ˙ W F × ( h 4 h 5 ) ) + ( m ˙ W F × λ p ) ,
    where
    • h 4   = enthalpy at point 4 in kJ/kg
    • h 5   = enthalpy at point 5 in kJ/kg
    • λ p   = latent heat for the current pressure of the condensation
  • Point 5 to point 1 illustrate the pumping process of the saturated liquid to the desired operating pressure. Based on the Hysys Guide Book, the power that is required for the pump ( W ˙ P ) can be calculated while using Equation (7).
    W P ˙ = ( P 1 P 5 ) ×   m ˙ W F × 100 % ρ W F   × η s ,
    where
    • P 5 = pump inlet pressure
    • P 1 = pressure at point 1
    • ρ W F   = working fluid density at specific pressure
    • η s = isentropic efficiency of the pump in %

3.3. Initial Working Parameters

There is no set of standard rules to specify the working parameters of a binary system. However, it is usually recommended to set the highest temperature of the working fluid in the cycle at 15 °C below its critical point [43]. Additionally, the highest pressure for the working fluid should not exceed 30 bar while considering the equipment compression capacity and the cost of the system [44]. Near the critical point, the system can be unstable because large pressure changes may occur even with small temperature changes [42]. Therefore, as the starting point, the limit for the inlet turbine temperature in this study was set 20 °C below the geothermal brine temperature. An exception to this was when the working fluid was R245fa. Its critical temperature is 154 °C, so the inlet temperature was set at 140 °C because the pressure was already close to 30 bar.
The working fluid was always at its saturated vapor state when entering the turbine. The outlet pressure of the turbine followed the condensation temperature condition. The power plant’s condenser was designed according to the hottest temperature in the area throughout the year. According to the weather data, during the dry season in April 2018, in Pangalengan, West Java, Indonesia, the highest air temperature was almost 29 °C at noon, and the relative humidity was 63% [29]. The suggested minimum temperature difference between the working fluid and air was 10 °C [24], so the working fluid’s condensation temperature was fixed at 39 °C. To set all simulated cases to have the same level of heat inputs, the mass flow rate of the working fluids were adjusted, such that the reinjection temperature was 142 °C, while using Equations (8)–(10).
Q i n = m ˙ G . ( h 180.7   ˚ C h 142.0   ˚ C ) ,
Q i n = m ˙ r . ( H p r e h e a t e r + H e v a p o r a t o r ) ,
m ˙ r = m ˙ G . ( h 180.7 ˚ C h 142.0 ˚ C ) ( H p r e h e a t e r + H e v a p o r a t o r ) ,
where Qin is the heat input to the system brought by geothermal brine in kW, G is the mass flow rate of geothermal brine in kg/s, r is the mass flow rate of the working fluids in kg/s, hb is the specific enthalpy of the geothermal brine in corresponding temperature in kJ/kg, and hi is the specific enthalpy that is required in the corresponding equipment in kJ/kg. The obtained working fluid mass flow rate will be used in the optimization processes. A summary of the initial working parameters for all fluids, according to their states in Figure 3, is presented in Table 2 below.

3.4. Thermal Efficiency Optimization

The thermal efficiency optimization was assessed by varying the turbine inlet temperature and pressure, as can be seen in Table 5. Other variables in the system were kept constant. The thermal efficiency was calculated with Equation (11):
µ T H = W N E T Q i n .100 % ,
where µTH is the thermal efficiency in % and WNET is the work output of the turbine minus the pump workload in kW.

3.5. Specific Area Optimization

The specific area of the system was defined as the total area of the heat exchangers, including preheater, evaporator, and air-cooled heat exchanger divided by the WNET. It can be calculated with Equation (12).
λ = A W N E T ,
where λ is the specific area in m2/kW and A is the total heat exchanger area in m2. The controlled variable in this optimization was the turbine inlet temperature. It was varied by fixing it at the saturated vapor phase. In this optimization, the optimized configuration was the one that yields a minimum specific area.

3.6. Process and Economic Modelling

The processes were simulated in Aspen Plus version 8.6 [28] while using the Soave-Redlich-Kwon equation of state (EOS). All heat exchanger calculations were carried out with the shortcut LMTD method. There are several assumptions taken for the equipment as can be seen in Table 3. The isentropic efficiency ranged from 74 to 80% and 75% originated from Aspen. The mechanical and electrical efficiency are both around 98%, thus making the multiplication around 96% [45]. In this research, 95% and 93% are taken to anticipate other inefficiencies from turbulence and leakage inefficiency.
The program was also used for cost analysis of the equipment while using the Aspen Process Economic Analyzer (APEA) tool to estimate the total purchase equipment cost (PEC). The cost escalation for PEC due to inflation and economic condition change can be calculated using Equation (13):
P E C n e w = P E C o l d ( I n e w I o l d ) ,
where I is the cost index. Subscripts old and new refer to the base years the equipment cost are known and desired, respectively. The cost index data were estimated following the data from Coker [46]. The total investment cost can be calculated while using the method from Peters and Timmerhaus [47]. In this calculation, there are three main components: (1) Direct cost, (2) indirect cost, and (3) working capital cost. The total capital investment is the summation of the threee components. The working capital cost covers 15% of total direct and indirect cost, whereas the direct and indirect cost is based on purchase equipment cost (PEC) with the details presented in Table 4 below.
Two profitability parameters were assessed in this work: Net Present Value (NPV) and Internal Rate of Return (IRR). Towler and Sinnott [27] defined the NPV as the sum of the present values of the future cash flow. Hence, it can be computed while using Equation (14).
N P V = n = 1 n = t C F n ( 1 + i ) n ,
where CFn is the cash flow in year n, t is the project lifetime in years, and i is the interest rate. Mathematically, the IRR is the interest rate of the project resulting in zero net present value (NPV), which is computed with Equation (15).
N P V = n = 1 n = t C F n ( 1 + i ) n   =   0 ,

3.7. Study Limitations

This study is a simplification of the actual conditions on site. It is widely known that the geothermal fluid mass and energy production are not constant and they tend to decline over the years because the rate of heat energy extraction might surpass the pre-exploitation rate of heat flow from its source [48]. Furthermore, geothermal power plant development in a mountainous area might affect the costing of the project [49]. In this study, these considerations were not taken into account. Moreover, to the best of the authors’ knowledge, there is no published data on the detailed costs of geothermal power plant developments in Indonesia. Hence, the final project cost was validated while using the Specific Investment Cost (SIC) [16].

4. Results and Discussion

4.1. Binary Geothermal Power Plants in Indonesia

The first geothermal binary system in Indonesia was built in Lahendong, North Sulawesi. Using the geothermal brine from the single flash separator unit, the system can theoretically generate around 400 kW of electricity [4,11]. However, to the best of the authors’ knowledge, this plant is still not yet operational. Another commercially running hybrid geothermal single-flash and binary power plant is in Sarulla, North Sumatra, which generates around 330 MW of electricity using geothermal fluid as the heat source [9].
Weather temperature and humidity can affect the cooling process/condenser. The temperature will determine the condenser’s pressure and, consequently, the condenser’s pressure will affect the energy output from the turbine. However, the temperature and humidity fluctuations in Indonesia are mild throughout the year. Therefore, in this research, the average data throughout the year, as shown in Figure 1 and Figure 2, were considered in the calculations.

4.2. Optimization Results

The first optimization was done with the thermal efficiency objective. Figure 4 presents the results. They show that the thermal efficiency always increased with an increase in the turbine inlet pressure and temperature. Previously, it has been stated that for dry-type working fluids, the optimum condition of the inlet turbine should be on the saturation vapour condition with no superheating [42]. The results confirmed that there was no superheating needed in the system and, therefore, the initial conditions in Table 2 already performed in the optimum condition. It is noted that, in practice, the working fluid will usually be slightly superheated to avoid any liquid in the turbine. However, theoretically, this study confirmed that the maximum thermal efficiencies for all fluids were obtained when the inlet condition of the turbine was at the vapor saturation point.
In the specific area optimization approach, the working fluid temperature at the turbine inlet was varied, while the pressure was kept constant in the saturation point, as it was considered to be the best operating condition based on the thermal efficiency objective optimization exercise. The optimum point for this approach was obtained when the ratio of total surface heat area per total net power output was at its lowest value, as it showed the smallest heat transfer area required for the heat exchangers to generate every kW of electricity from the system. Figure 5 shows the results. It was found that the optimum working condition was different for each working fluid. The n-Pentane system reached the optimum working condition at a temperature of 149.3 °C with a saturation pressure of 16.0 bar. Meanwhile, the Isopentane system’s optimum working condition was at a temperature of 151.7 °C and a saturation pressure of 19.5 bar. Lastly, the optimum working condition for R245fa was at a temperature of 140.1 °C, with a saturation pressure of 26.3 bar. In the case of R245fa, the optimum working condition was reached at its highest possible pressure working condition, which was limited to be under 30 bar [44].
One of the most interesting findings from these results is that the optimum working conditions that were obtained with the specific area optimization approach were different from those with the thermal efficiency objective approach. In the thermal efficiency objective approach, the optimum condition was obtained by increasing the turbine inlet pressure and temperature. Whereas, in the area optimization approach, the optimum condition was obtained at a certain temperature where the efficiency curve slope in Figure 4 was steeper. The steep curve suggested that the increase in performance at that point was significant, which meant that less area was required to generate more energy. As the temperature got higher, the curve slopes rapidly decreased. Although the thermal efficiency kept increasing at higher temperatures, the required heat transfer area increased at a constant rate.
The total required heat transfer area was also affected by the logarithmic temperature difference between the working fluid and the geothermal brine (ΔTLMTD). Equation 16 shows the correlation between the exchange heat duty (Q), the total heat transfer coefficient (U), the total heat transfer area (A), and ΔTLMTD. The definition of ΔTLMTD is given in Equation (17).
Q = U . A . Δ T L M T D ,
Δ T L M T D =   ( T 1 t 2 ) ( T 2 t 1 ) ln ( ( T 1 t 2 ) / ( T 2 t 1 ) ) ,
As can be seen from Equation (16), to collect the same amount of heat, the required total heat transfer area is higher when ΔTLMTD is low. It also explains the sharp increase of λ at a higher temperature for both the n-Pentane and isopentane systems in Figure 5. The detailed values are presented in Table 5.

4.3. Profitability Analysis

Table 6 presents the total capital investment for the optimum cycles with various working fluids. To simplify the nomenclature, the optimum condition from the thermal efficiency approach is now labelled ‘A’, while the optimum condition from the specific area optimization is labelled ‘B’. Both of the conditions were compared in the economic profitability assessment from the total capital investment, specific investment cost, PBP, and IRR. The specific investment cost comparison for the three working fluids is shown in Figure 6. The first economic assessment is the specific investment cost (SIC). The SIC can be calculated by dividing the total investment cost (TCI) with the WNET. The SIC of the simulations ranged from 3689 US$/kW to 3003 US$/kW. These values are still within the range of about 2500 US$/kW to 5000 US$/kW reported by Budisulistyo and Krumdieck [16]. Other study reported that, in 2009, the typical SIC for ORC systems ranged from 2000 US$/kW to 4000 US$/kW [50]. Based on research that was conducted by Quoilin et al. also in 2011 that studied the thermo-economic of various working fluids for ORC system, the SIC ranged from 2136 US$/kW to 4260 US$/kW [51].
The capital expenditure of the project is usually paid in the first year, and the power plant will start to generate electricity in the following year. The plant availability factor is around 95% [52]. The lifetime of a power plant can reach 28 years in normal conditions [53]. Therefore, the lifetime of the project was limited to 25 years in this study. The electricity revenue price for geothermal power was set to US$0.083/kWh and the operation and maintenance cost was US$0.013/kWh [16]. Table 7 summarizes the parameters in this work.
The results show that, generally, the specific area optimization yielded better economic performance than that of the thermal efficiency optimization. As can be seen in Figure 7, the after-tax NPV of n-Pentane B was US$ 1,879,224, and the NPV of n-Pentane was only US$ 1,261,835. The NPV trend result was consistent for Isopentane. The Isopentane B system had a higher NPV of US$ 1,535,937 than that of Isopentane A with an NPV of only US$ 1,446,371. However, the R-245fa option achieved an NPV of US$ 1,298,029, which was smaller than both optimization results for Isopentane, but slightly higher than the n-Pentane A system.
The results were also consistent in terms of payback period and the internal rate of return. The economic profitability parameters of the specific area optimization were always better than that of the thermal efficiency results. As presented in Table 8, Both payback periods for the n-Pentane B and Isopentane B systems were 13 and 15 years, whereas the payback period for the n-Pentane A, Isopentane A, and R-245fa systems were all above 15 years. The IRRs for both n-Pentane B and Isopentane B were also higher than those of the n-Pentane A and Isopentane A alternatives.
The good economic parameter results for the specific area optimization can be explained, as follows. The optimization allowed for the system to run with a higher temperature difference with the heat source, which was the geothermal brine, and to have smaller heat exchangers areas, as shown in Equation (11). The heat exchanger area significantly affected the purchase equipment cost and the total capital investment. Therefore, although the systems had a significantly lower investment cost, the power output reduction was not very significant.

4.4. Weather Sensitivity Analysis

From thermodynamic aspects, the condensation temperature after turbine will determine the power output from the generator. Furthermore, the temperature and humidity of the surrounding air affect the condensation temperature. The sensitivity analysis is divided into two parts throughout the year: (1) Dry season and (2) Rain season for 24 h during the day and night. The selected working fluid in this sensitivity analysis is n-Pentane, since it outperforms the other working fluids.
The result shows that there is no significant difference in terms of overall power plant’s efficiency. As can be seen from Figure 2, the temperature difference between the dry season and rain season in Indonesia is only about 2 °C and the temperature difference between night and day can reach around 7 °C. Thus, the power output of the power plant, which originally was 1010 MW, only affected about 3% between the dry season and rain season and only 8% between the night and day. The results are presented in Figure 8, below.

5. Conclusions

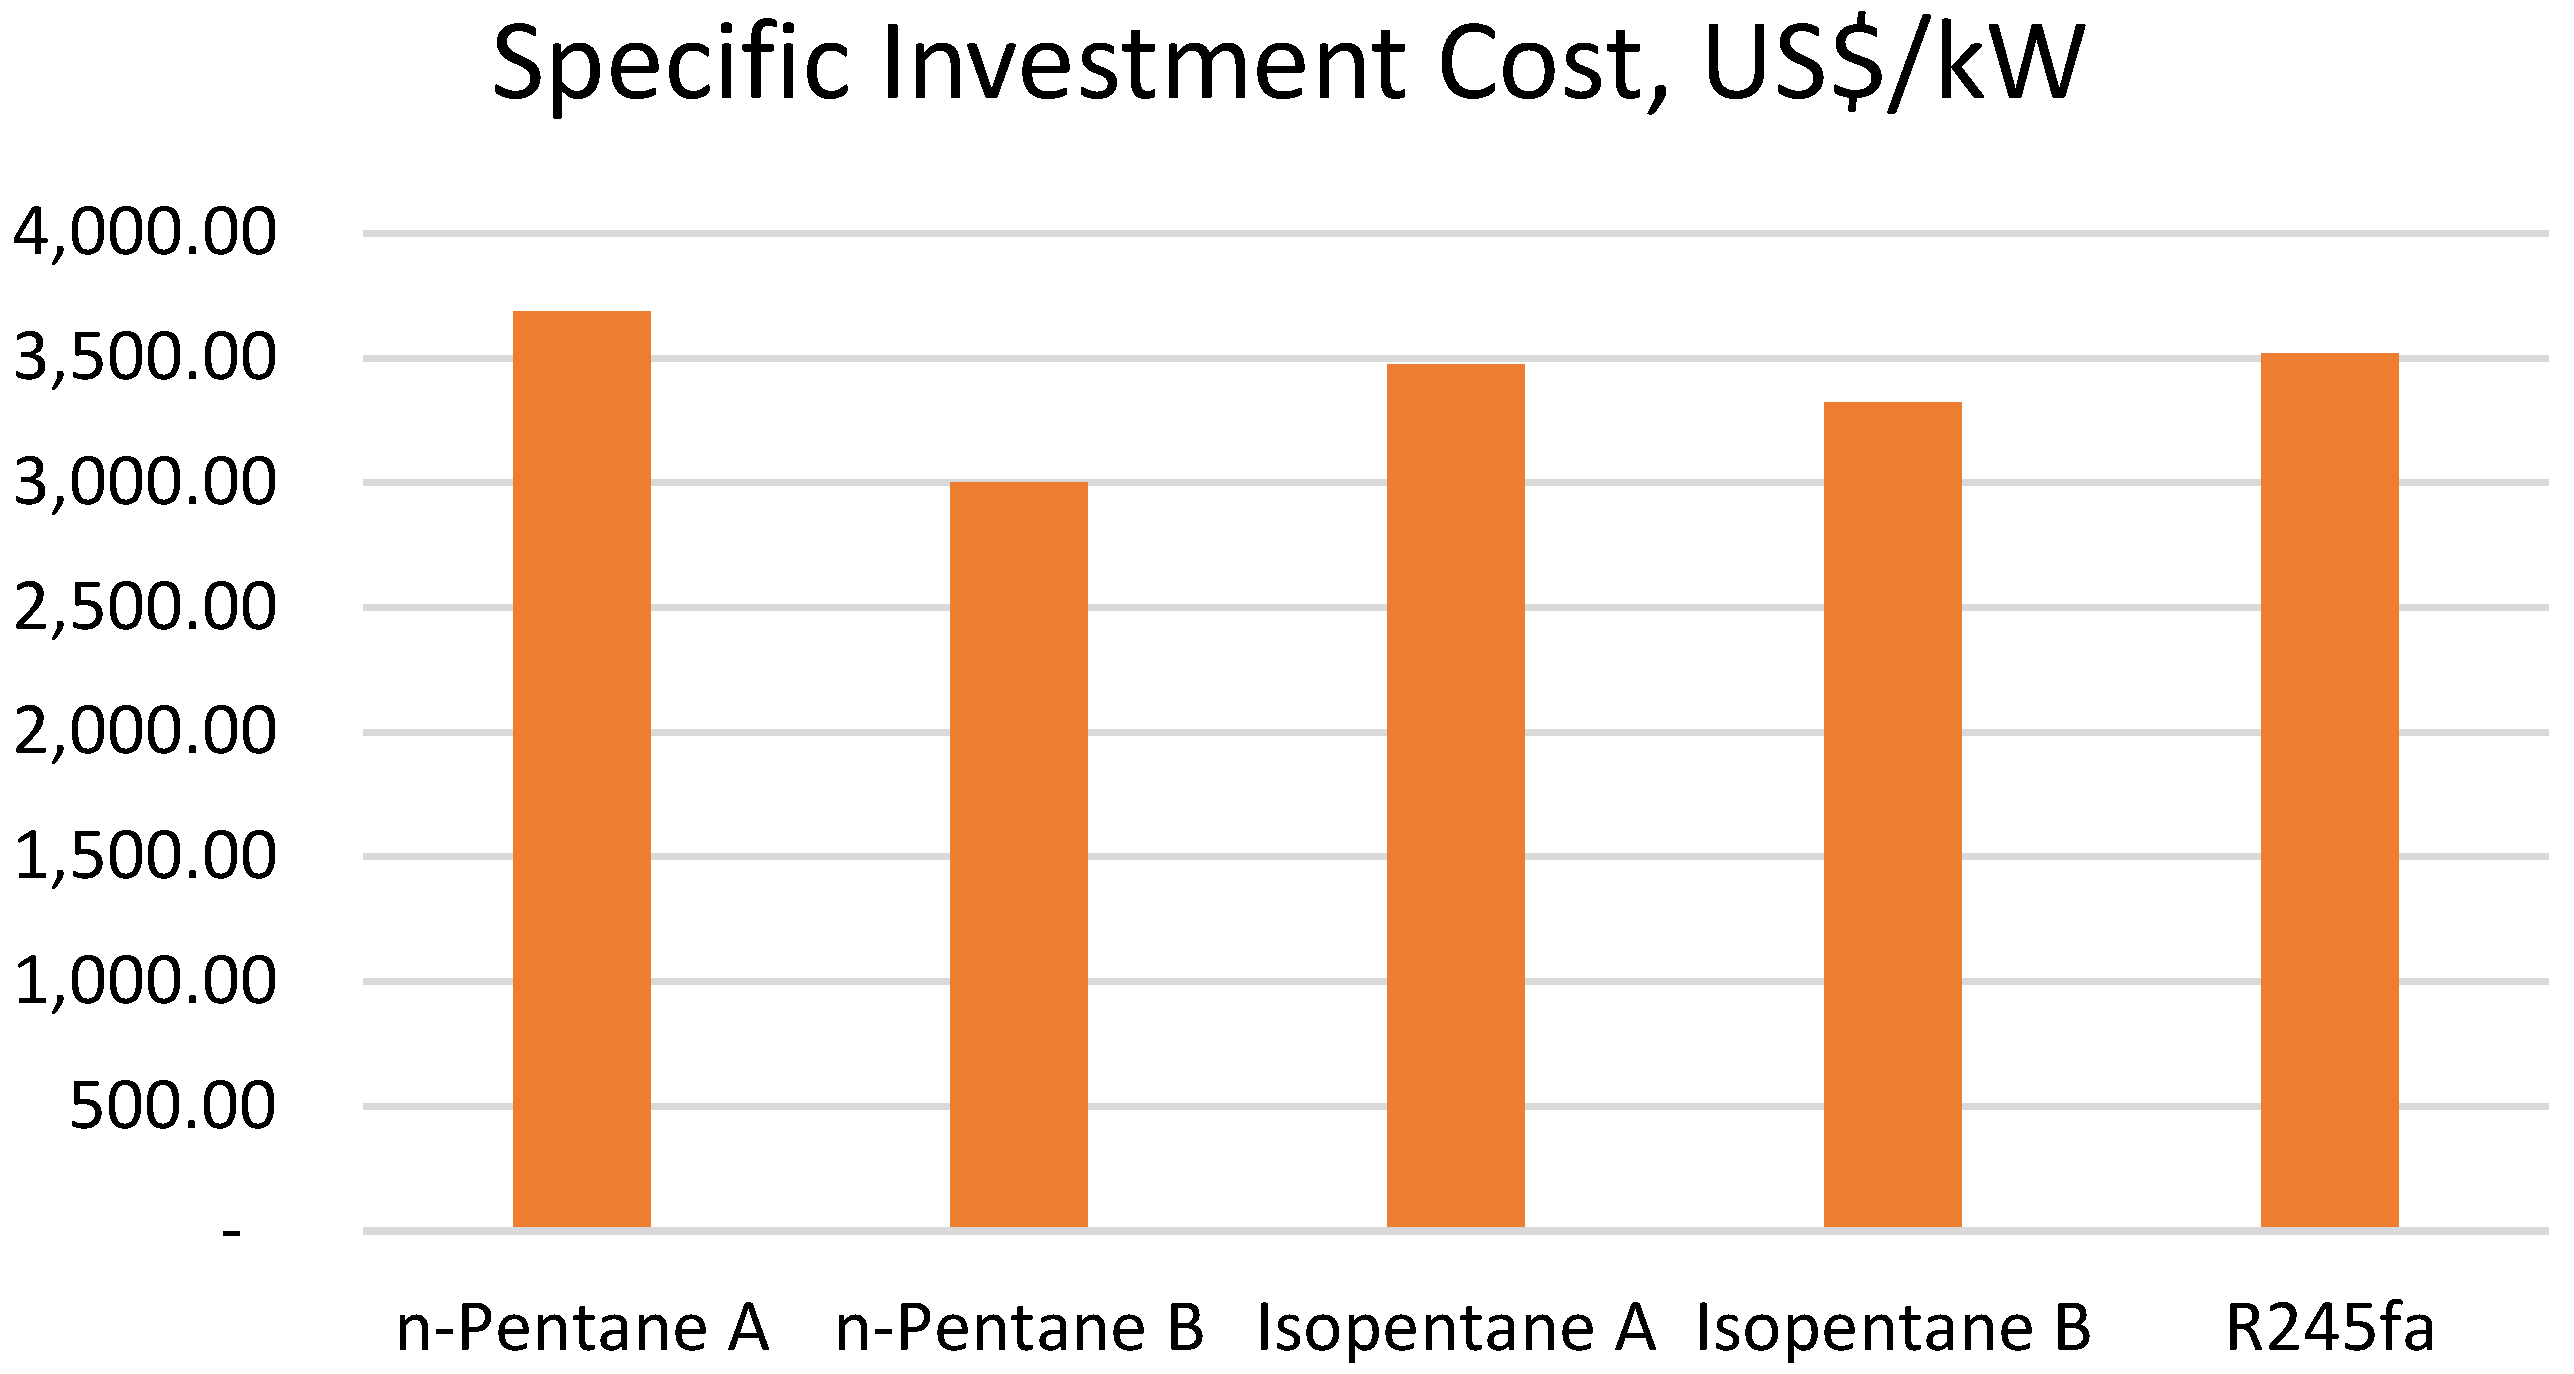
A technical and economic pre-feasibility study of a binary geothermal power plant at the Wayang Windu site, Indonesia, was carried out with various optimization approaches and working fluids. Two optimizations were executed by maximizing the thermal efficiency and minimizing the specific area of the system. Three working fluids, namely n-Pentane, Isopentane, and R-245fa, were tested. The geothermal brine from Wayang Windu geothermal power plant had a temperature of 180.7 °C, a pressure of 1.02 MPa, a mass flow rate of 48 kg/s, and a silica content of 853 ppm. The heat input for all systems was adjusted at the same level, which resulted in a constant temperature value of the brine reinjection of 142 °C.
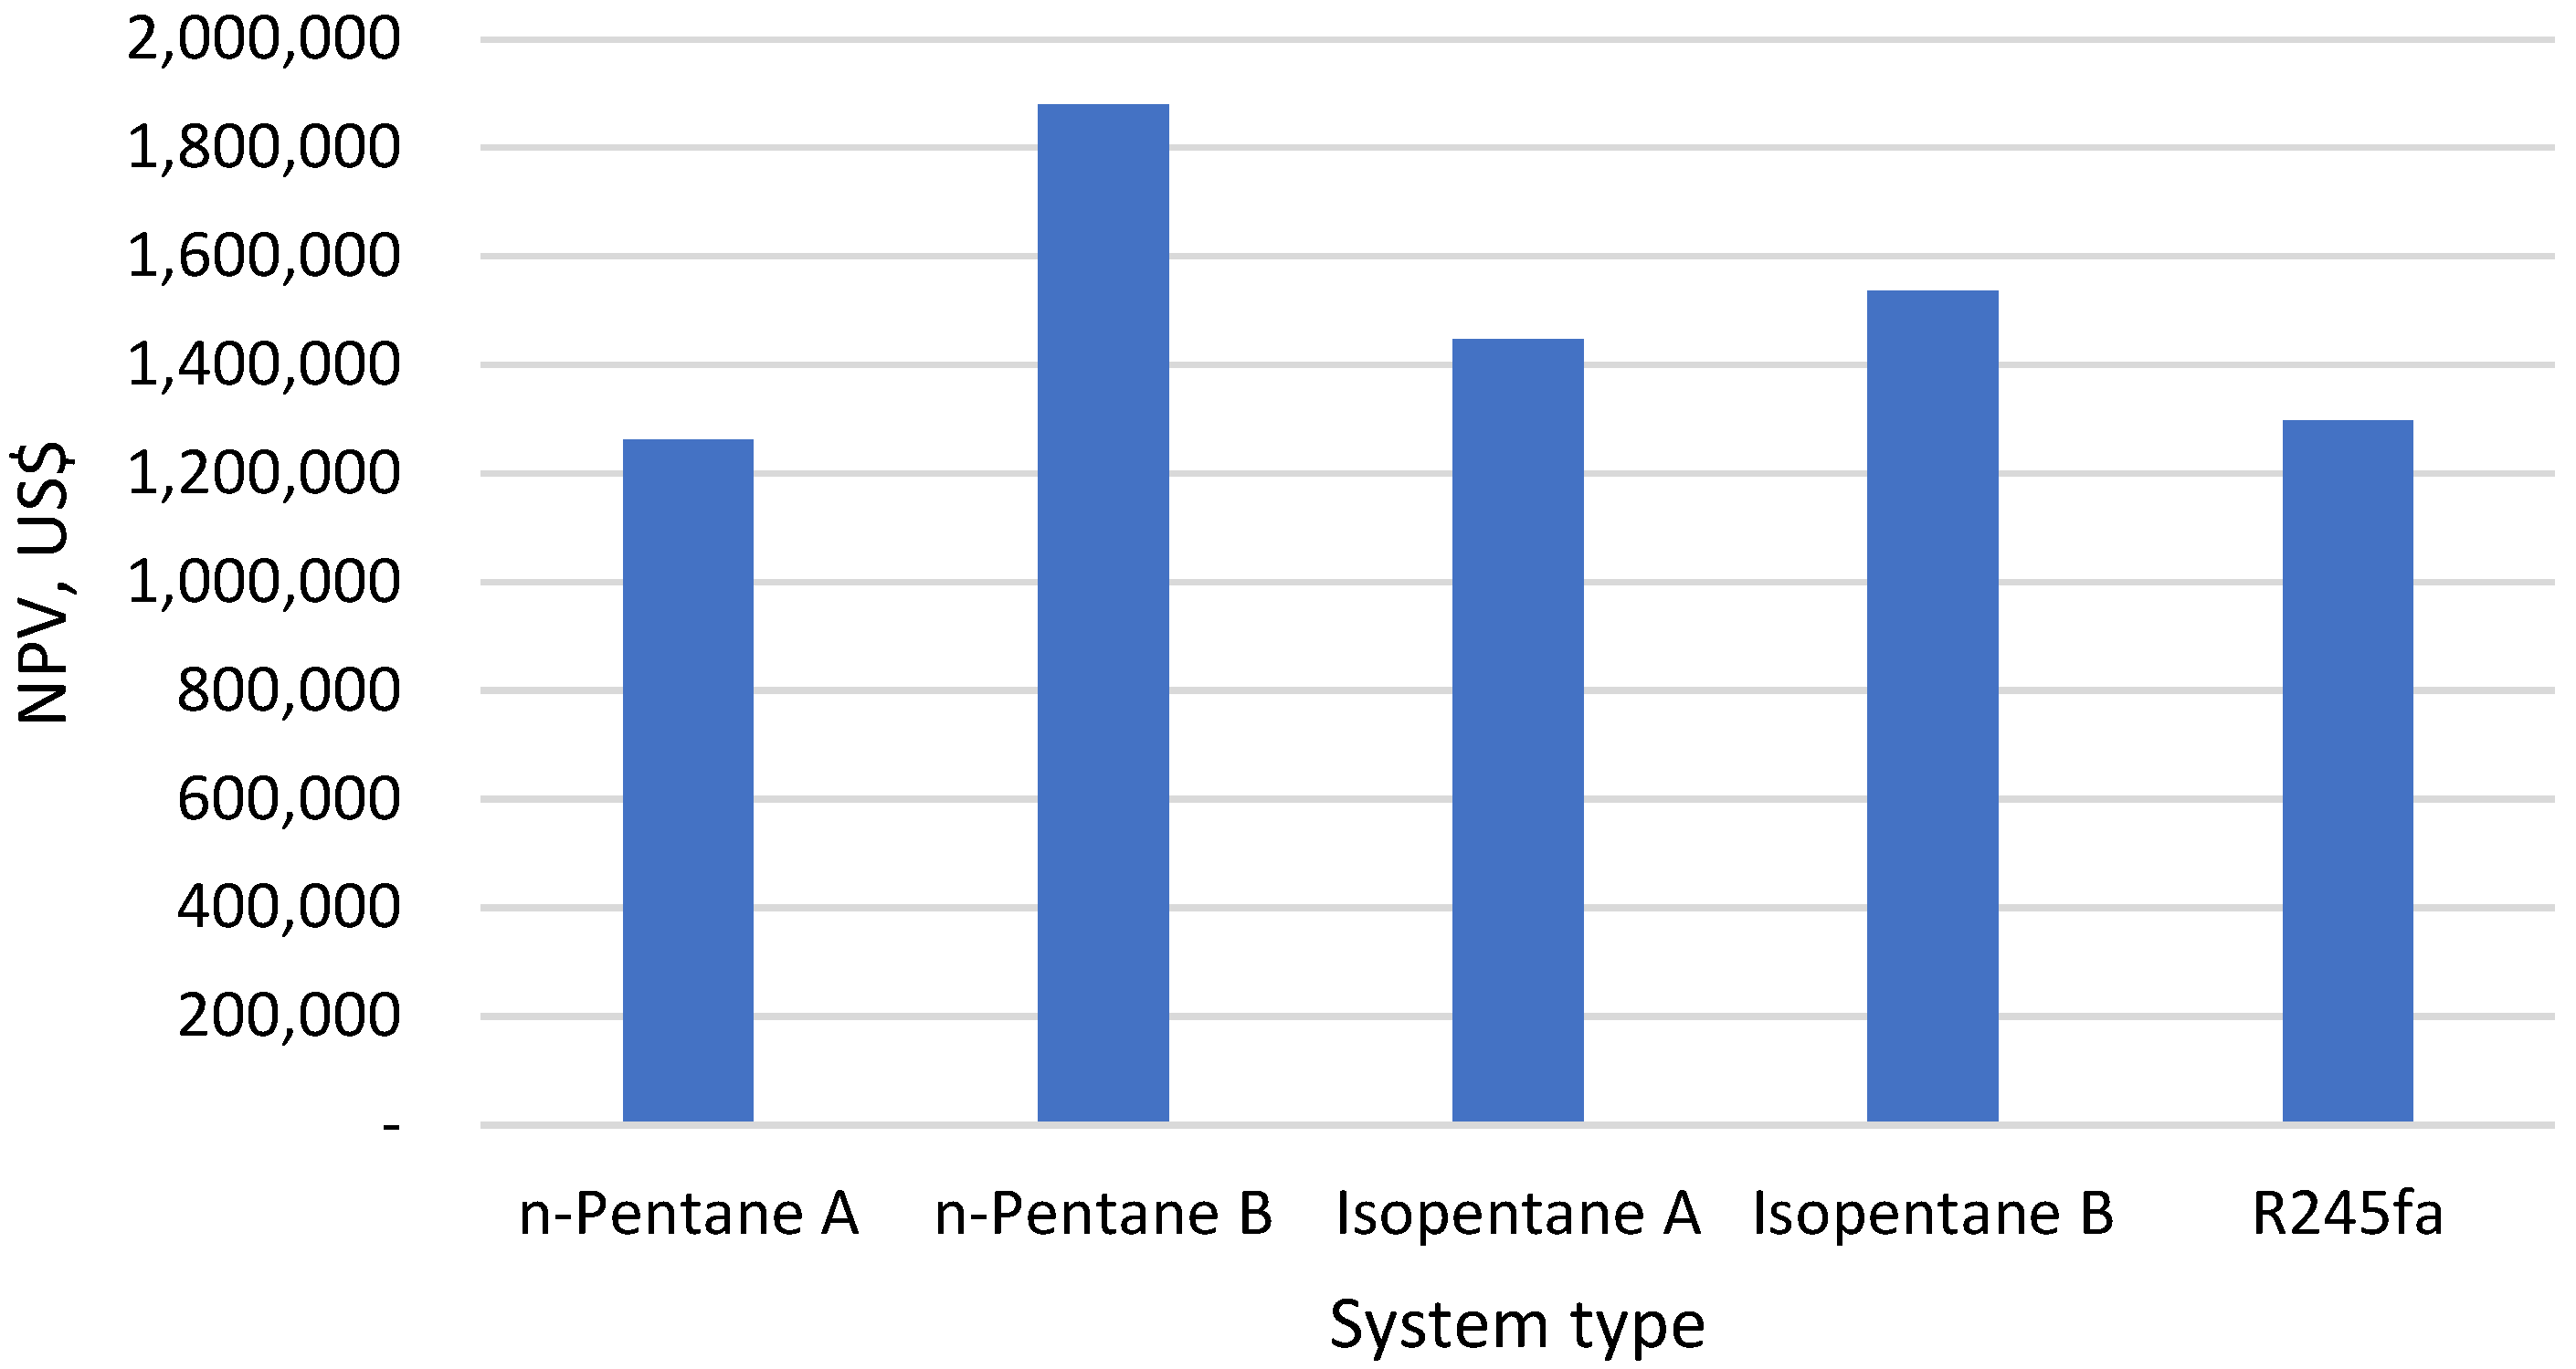
The most economically profitable working fluid in this work was the n-Pentane, obtained with the specific area optimization approach. The system had the lowest specific investment cost of only 3003 US$/kWh and it yielded the highest net present value of US$1,879,224. Its payback period was only 13 years and the internal rate of return was 11.28%. For comparison, based on the thermal efficiency approach, the specific investment cost of the binary system using the same working fluid (n-pentane) was 3689 US$/kWh with a payback period of 17 years, and the internal rate of return was 8.85%. Thus, the result of the area optimization approach reduced the specific investment cost of the system by 687 US$/kWh and it shortened the system payback period by four years.
Generally, the specific area optimization approach resulted in better economic performance than the thermal efficiency approach. It allowed for the system to run with a higher temperature difference with the heat source and to have smaller heat exchangers areas, which affected the purchase equipment cost and the total capital investment.

6. Future Research

It is recommended to conduct further study that covers the other technical aspects. This study only considers a steady heat source profile of Wayang Windu geothermal field with a temperature of 180.7 °C and 48 kg/s geothermal fluid mass flow rate. It is also recommended to optimize the system by varying the heat source temperature, pressure, mass flow rate, and silica content to see the impact of changing in those values to the optimization result. Other than that, the impact of changing other parameters, such as the ORC configuration as well as the cooling system type, are also needed to be further evaluated while using the thermo-economic approach, as it is not covered in this study.

Author Contributions

A.D.P.P. conceived the presented idea. A.D.P.P and A.N.H. carried out the investigations. A.S. supervised the study. All authors discussed the results and contributed to the final manuscript.

Funding

The authors express their great appreciation to the Indonesia Endowment Fund for Education (LPDP) and the New Zealand Aid Scholarship (NZAS) for the financial supports given to enable the authors to complete this research.

Conflicts of Interest

The authors declare no conflict of interest.

References

  1. Indonesia. Peraturan Pemerintah Republik Indonesia No. 79 Tahun 2014 tentang Kebijakan Energi Nasional; Lembaran Negara Republik Indonesia: Jakarta, Indonesia, 2014.
  2. Nazif, H.; Valdimarsson, P.; Thòrhallsson, S. Developing choices for optimal binary power plants in the existing geothermal production areas in Indonesia. In Proceedings of the World Geothermal Congress 2015, Melbourne, Australia, 19–25 April 2015. [Google Scholar]
  3. DiPippo, R. Geothermal Power Plants, 4th ed.; Butterworth-Heinemann: Waltham, MA, USA, 2016. [Google Scholar]
  4. Pambudi, N.A. Geothermal power generation in Indonesia, a country within the ring of fire: Current status, future development and policy. Renew. Sustain. Energy Rev. 2018, 81, 2893–2901. [Google Scholar] [CrossRef]
  5. Bertani, R. Geothermal power generation in the world 2010–2014 update report. Geothermics 2016, 60, 31–43. [Google Scholar] [CrossRef]
  6. Richter, A. Indonesia Reaches 1,925 MW Installed Geothermal Power Generation Capacity. 2018. Available online: http://www.thinkgeoenergy.com/indonesia-reaches-1925-mw-installed-geothermal-power-generation-cacapaci/ (accessed on 8 May 2018).
  7. Poernomo, A.; Satar, S.; Effendi, P.; Kusuma, A.; Azimudin, T.; Sudarwo, S. An Overview of Indonesia Geothermal Development—Current Status and Its Challenges. In Proceedings of the World Geothermal Congress, Melbourne, Australia, 19–24 April 2015. [Google Scholar]
  8. Assad, M.E.H.; Hani, E.B.; Khalil, M. Performance of geothermal power plants (single, dual, and binary) to compensate for LHC—CERN power consumption: Comparative study. Geotherm. Energy 2017, 5, 1–16. [Google Scholar]
  9. Wolf, N.; Gabbay, A. Sarulla 330 MW Geothermal Project Key Success Factors in Development. In Proceedings of the World Geothermal Congress, Melbourne, VIC, Australia, 19–24 April 2015; pp. 19–25. [Google Scholar]
  10. Sarulla Operations Ltd. Our Business; Sarulla Operations Ltd.: Jakarta, Indonesia, 2019. [Google Scholar]
  11. Frick, S.; Saadat, A.; Taufan, S.; Eben, E.; Kupfermann, A.; Erbas, K.; Mawardi, A. Geothermal Binary Power Plant for Lahendong, Indonesia: A German-Indonesian Collaboration Project. In Proceedings of the World Geothermal, Melbourne, VIC, Australia , 19–24 April 2015; pp. 1–5. [Google Scholar]
  12. Franco, A.; Villani, M. Optimal design of binary cycle power plants for water-dominated, medium-temperature geothermal fields. Geothermics 2009, 38, 379–391. [Google Scholar] [CrossRef] [Green Version]
  13. Astolfi, M.; Romano, M.C.; Bombarda, P.; Macchi, E. Binary ORC (Organic Rankine Cycles) power plants for the exploitation of medium-low temperature geothermal sources—Part B: Techno-economic optimization. Energy 2014, 66, 435–446. [Google Scholar] [CrossRef]
  14. Liu, X.; Wei, M.; Yang, L.; Wang, X. Thermo-economic analysis and optimization selection of ORC system configurations for low temperature binary-cycle geothermal plant. Appl. Therm. Eng. 2017, 125, 153–164. [Google Scholar] [CrossRef]
  15. Hettiarachchi, H.M.; Golubovic, M.; Worek, W.M.; Ikegami, Y. Optimum design criteria for an Organic Rankine cycle using low-temperature geothermal heat sources. Energy 2007, 32, 1698–1706. [Google Scholar] [CrossRef]
  16. Budisulistyo, D.; Krumdieck, S. Thermodynamic and economic analysis for the pre-feasibility study of a binary geothermal power plant. Energy Convers. Manag. 2015, 103, 639–649. [Google Scholar] [CrossRef]
  17. Gemelli, A.; Mancini, A.; Longhi, S. GIS-based energy-economic model of low temperature geothermal resources: A case study in the Italian Marche region. Renew. Energy 2011, 36, 2474–2483. [Google Scholar] [CrossRef]
  18. Zare, V. A comparative exergoeconomic analysis of different ORC configurations for binary geothermal power plants. ENERGY Convers. Manag. 2015, 105, 127–138. [Google Scholar] [CrossRef]
  19. Prananto, L.A.; Soelaiman, T.M.F.; Aziz, M. Adoption of Kalina cycle as a bottoming cycle in Wayang Windu geothermal power plant. Energy Procedia 2017, 142, 1147–1152. [Google Scholar] [CrossRef]
  20. Pasek, A.D.; Soelaiman, T.F.; Gunawan, C. Thermodynamics study of flash-binary cycle in geothermal power plant. Renew. Sustain. Energy Rev. 2011, 15, 5218–5223. [Google Scholar] [CrossRef]
  21. Pambudi, N.A.; Itoi, R.; Jalilinasrabady, S.; Sirait, P. Preliminary analysis of single flash combined with binary system using thermodynamic assessment: A case study of Dieng geothermal power plant. Int. J. Sustain. Eng. 2015, 8, 258–267. [Google Scholar] [CrossRef]
  22. Pikra, G.; Rohmah, N.; Pramana, R.I.; Purwanto, A.J. The electricity power potency estimation from hot spring in Indonesia with temperature 70–80 °C using organic Rankine cycle. Energy Procedia 2015, 68, 12–21. [Google Scholar] [CrossRef]
  23. Zeyghami, M. Performance analysis and binary working fl uid selection of combined fl ash-binary geothermal cycle. Energy 2015, 1–10. [Google Scholar] [CrossRef]
  24. Nicolae, L.C.; Gewald, D. Thermo-economic optimization of waste heat recovery systems. UPB Sci. Bull. Ser. D Mech. Eng. 2013, 75, 41–48. [Google Scholar]
  25. Toffolo, A.; Lazzaretto, A.; Manente, G.; Paci, M. A multi-criteria approach for the optimal selection of working fluid and design parameters in Organic Rankine Cycle systems. Appl. Energy 2014, 121, 219–232. [Google Scholar] [CrossRef]
  26. Uehara, H.; Ikegami, Y. Optimization of a closed-cycle OTEC system. J. Sol. Energy Eng. 1990, 112, 247–256. [Google Scholar] [CrossRef]
  27. Towler, G.; Sinnott, R. Chemical Engineering Design; Butterworth-Heinemann: London, UK, 2008. [Google Scholar]
  28. Pablo, J.; Benitez, L.A.; Ale, E.L.; Erdmann, E. A sensitivity analysis and a comparison of two simulators performance for the process of natural gas sweetening. J. Nat. Gas Sci. Eng. 2016, 31, 800–807. [Google Scholar]
  29. Karyono, T.H. Thermal Comfort in Indonesia. In Sustainable Houses and Living in the Hot-Humid Climates of Asia; Kubota, T., Rijal, H.B., Takaguchi, H., Eds.; Springer: Singapore, 2018; pp. 115–121. [Google Scholar]
  30. Pangalengan, Indonesia Monthly Weather Forecast. 2018. Available online: https://weather.com/weather/monthly/l/IDXX1211:1:ID (accessed on 1 December 2018).
  31. Shahbaz, M.; Hye, Q.M.A.; Tiwari, A.K.; Leitão, N.C. Economic growth, energy consumption, financial development, international trade and CO2 emissions in Indonesia. Renew. Sustain. Energy Rev. 2013, 25, 109–121. [Google Scholar] [CrossRef]
  32. PWC. Power in Indonesia: Investment and Taxation Guide; PWC: London, UK, 2017.
  33. Directorate General of Electricity. 2017 Performance Report; Directorate General of Electricity: Jakarta, Indonesia, 2018. [Google Scholar]
  34. Nasruddin; Alhamid, M.I.; Daud, Y.; Surachman, A.; Sugiyono, A.; Aditya, H.B.; Mahliad, T.M.I. Potential of geothermal energy for electricity generation in Indonesia: A review. Renew. Sustain. Energy Rev. 2016, 53, 733–740. [Google Scholar] [CrossRef]
  35. Ministry of Energy and Mineral Resources. MEMR Regulation No 14/ 2014 about Electricity Procurement from PLTP and Geothermal Steam for PLTP from State Electricity Company; Ministry of Energy and Mineral Resources: Jakarta, Indonesia, 2014.
  36. Minister of Finance. Regulation of Minister of Finance of Republic of Indonesia Number 90/PMK.02/2017 regarding Second Amendment of Minister of Finance Decision Number 766/KMK.04/1992 concerning Procedures for Calculation, Deposit, and Reporting of Government Share, Income Tax; Minister of Finance: Jakarta, Indonesia, 2017.
  37. Trading Economics. Indonesia Interest Rate. Trading Economics. 2019. Available online: https://tradingeconomics.com/indonesia/interest-rate (accessed on 23 January 2019).
  38. Perusahaan Listrik Negara (PLN). Electricity Supply Business Plan (Rencana Umum Penyediaan Tenaga Listrik-“RUPTL”) 2019–2028; Perusahaan Listrik Negara: Jakarta, Indonesia, 2019. [Google Scholar]
  39. Diaz, A.R.; Kaya, E.; Zarrouk, S.J. Reinjection in geothermal fields—A worldwide review update. Renew. Sustain. Energy Rev. 2016, 53, 105–162. [Google Scholar] [CrossRef]
  40. Zarrouk, S.J.; Woodhurst, B.C.; Morris, C. Silica scaling in geothermal heat exchangers and its impact on pressure drop and performance: Wairakei binary plant, New Zealand. Geothermics 2014, 51, 445–459. [Google Scholar] [CrossRef]
  41. Fournier, R.O.; Rowe, J.J. The solubility of amorphous and high pressures silica in water at high temperatures. Am. Mineral. 1977, 62, 1052–1056. [Google Scholar]
  42. Bao, J.; Zhao, L. A review of working fluid and expander selections for organic Rankine cycle. Renew. Sustain. Energy Rev. 2013, 24, 325–342. [Google Scholar] [CrossRef]
  43. Delgado-Torres, A.M.; García-Rodríguez, L. Double cascade organic Rankine cycle for solar-driven reverse osmosis desalination. Desalination 2007, 216, 306–313. [Google Scholar] [CrossRef]
  44. Zhang, X.; Wu, L.; Wang, X.; Ju, G. Comparative study of waste heat steam SRC, ORC and S.-ORC. Appl. Therm. Eng. 2016, 106, 1427–1439. [Google Scholar] [CrossRef]
  45. Ion, D.; Codrut, P.D. Efficiency Assessment of Condensing Steam Turbine. In Advances in Environment, Ecosystems and Sustainable Tourism; Marascu-klein, V., Panaitescu, F.-V., Panaitescu, M., Eds.; WSEAS Press: Petrosani, Romania, 2013; pp. 203–208. [Google Scholar]
  46. Coker, A.K. Ludwig’s Applied Process Design for Chemical and Petrochemical Plants, 4th ed.; Butterworth-Heinemann: Burlington, NJ, USA, 2007. [Google Scholar]
  47. Peters, M.S.; Timmerhaus, K.D. Plant Design and Economics for Chemical Engineers, 4th ed.; McGraw-Hill: Singapore, 1991. [Google Scholar]
  48. Sullivan, M.O.; Yeh, A.; Mannington, W. Renewability of geothermal resources. Geothermics 2010, 39, 314–320. [Google Scholar] [CrossRef]
  49. Guidos, J.; Burgos, J. Geothermal Activity And Development In El Salvador–Producing And Developing. In Proceedings of the Short Course on Geothermal Development and Geothermal Wells, Santa Tecla, El Salvador, 11–17 March 2012. [Google Scholar]
  50. Roos, C.J. An Overview of Industrial Waste Heat Recovery Technologies for Moderate Temperatures Less Than 1000 F; Olympia: London, UK, 2013. [Google Scholar]
  51. Quoilin, S.; Declaye, S.; Tchanche, B.F.; Lemort, V. Thermo-economic optimization of waste heat recovery Organic Rankine Cycles. Appl. Therm. Eng. 2011, 31, 2885–2893. [Google Scholar] [CrossRef] [Green Version]
  52. Purnanto, M.H.; Purwakusumah, A. Fifteen Years (Mid-Life Time) of Wayang Windu Geothermal Power Station Unit-1: An Operational Review. In Proceedings of the World Geothermal Congress, Melbourne, Australia, 19–24 April 2015; pp. 19–25. [Google Scholar]
  53. Peter, M.S.; Timmerhaus, K.D.; West, R.E. Equipment Costs for Plant Design and Economics for Chemical Engineers, 5th ed.; Mc Graw Hill: New York, NY, USA, 2002. [Google Scholar]
Figure 1. The ambient temperature in Pangalengan, West Java, Indonesia in 2018 [30].
Energies 12 04269 g001
Figure 2. Typical temperature and humidity profiles in dry and wet Season in Pangalengan Area [29].
Energies 12 04269 g002
Figure 3. (a) Schematic and (b) temperature-entropy diagram of the benchmark cycle [18].
Energies 12 04269 g003
Figure 4. Thermal efficiency optimization results with varied temperature and pressure for (a) n-Pentane; (b) Isopentane; (c) R245fa.
Energies 12 04269 g004
Figure 5. Specific area optimization results for all working fluids. (blue arrows represent the axis values reading).
Energies 12 04269 g005
Figure 6. Specific investment costs for the optimum cycles.
Energies 12 04269 g006
Figure 7. Project net present value results.
Energies 12 04269 g007
Figure 8. Weather sensitivity analysis to power output.
Energies 12 04269 g008
Table 1. Waste Brine Characteristics from the Wayang Windu Geothermal Power Plant.
ParameterValue
Brine Temperature180.7 ˚C
Brine Pressure1.02 MPa
Mass Flow Rate48 kg/s
Silica Content (CI)853 mg/L
Source: [19].
Table 2. The Initial Conditions for All Working Fluids.
Working FluidParameterState
12345
n-PentaneTemperature, °C40.3159.6159.7 95.239.3
Pressure, bar19.119.119.1 1.11.1
Mass flow rate, kg/s 14.3
IsopentaneTemperature, °C40.4159.7159.894.339.1
Pressure, bar22.722.722.71.51.5
Mass flow rate, kg/s 15.0
R245faTemperature, °C40.2140.1140.265.838.7
Pressure, bar28.528.528.52.42.4
Mass flow rate, kg/s 33.2
Table 3. Assumptions for the Equipment.
EquipmentAssumptions
Turbine
  • Isentropic Efficiency: 75%
  • Mechanical Efficiency: 95%
Pump
  • Isentropic Efficiency: 75%
  • Mechanical Efficiency: 93%
Preheater, Evaporator, Air-Cooled Heat Exchanger
  • Method: Shortcut
  • No Pressure Drop
Table 4. Cost Estimation for Total Capital Investment.
ComponentPercentage, %Of Component
Installation47PEC
Instrumentation and controls18PEC
Piping 66PEC
Electrical systems11PEC
Building 18PEC
Yard and improvements10PEC
Service facilities70PEC
Direct cost240PEC
Engineering and supervision33PEC
Construction expenses41PEC
Legal expenses4PEC
Contractor’s fee22PEC
Contingency44PEC
Indirect Cost144PEC
Working Capital Cost15Direct + Indirect Cost
Total Capital Investment100Direct + Indirect + Working Capital Cost
Source: [47].
Table 5. Optimization Data Result (bold represent optimized data).
ORC FluidThermal Efficiency OptimizationSpecific Area Optimization
Turbine Inlet Temperature, °CTurbine Inlet Pressure, barWNET, kWµTH, %Turbine Inlet Temperature, °CTurbine Inlet Pressure, barWNET, kWλ, m2/kW
n-Pentane159.719.1107413.31159.719.110741.3960
17.2106613.06155.017.710461.3541
15.3104812.69150.216.210151.3404
13.4102012.24149.316.010101.3401
150.216.2101612.77148.515.710041.3402
14.6100112.45147.615.59981.3408
13.097812.06146.715.39931.3418
11.494611.57144.914.89811.3452
140.313.695012.16140.313.69491.3607
12.293011.83
10.990311.42
9.586710.93
Isopentane159.722.3104012.89159.722.310401.3889
20.0103912.61154.520.410111.3685
17.8102512.26153.620.110061.3674
15.6100011.79152.719.810011.3667
149.918.998612.44151.719.59961.3666
17.097612.12150.819.29911.3670
15.195611.71149.918.99851.3679
13.292511.22144.917.49551.3792
139.715.992211.89139.715.99221.4018
14.390511.53
12.788011.08
11.184610.54
R245fa140.128.596611.89140.128.59662.0824
25.798811.76135.726.39522.1062
22.898611.48130.323.89272.1508
20.096711.05125.221.68992.2060
Table 6. Total Capital Investment for Optimum Cycles.
ORC Fluid SystemPurchase Equipment Cost (US$)Total Capital Investment (US$)
PreheaterEvaporatorTurbineAir-Cooled HEXPumpTotal
n-Pentane A45,30072,800491,900182,50060,300852,8003,962,109
n-Pentane B31,60044,400464,900182,20055,000778,1003,033,423
Isopentane A21,40037,800485,100185,80065,100795,2003,612,196
Isopentane B35,00042,900465,900185,60061,000790,4003,308,614
R245fa34,70032,500469,800313,60032,100882,7003,400,602
Table 7. Project Profitability Analysis Parameters.
ParameterValue
Project lifetime25 years
Electricity revenue priceUS$0.083/kWh
O&M costUS$0.013/kWh
Plant availability95%
Inflation5.15%
Tax rate34%
Annual price escalation3.11%
Discount rate6%
Table 8. Project Payback Period and Internal Rate of Return results.
Working FluidPBP (Years)IRR
n-Pentane A178.85%
n-Pentane B1311.28%
Isopentane A169.53%
Isopentane B1510.05%
R-245fa169.38%

