Sustainable Water Generation on a Mediterranean Island in Greece


Abstract
:1. Introduction
2. Methods
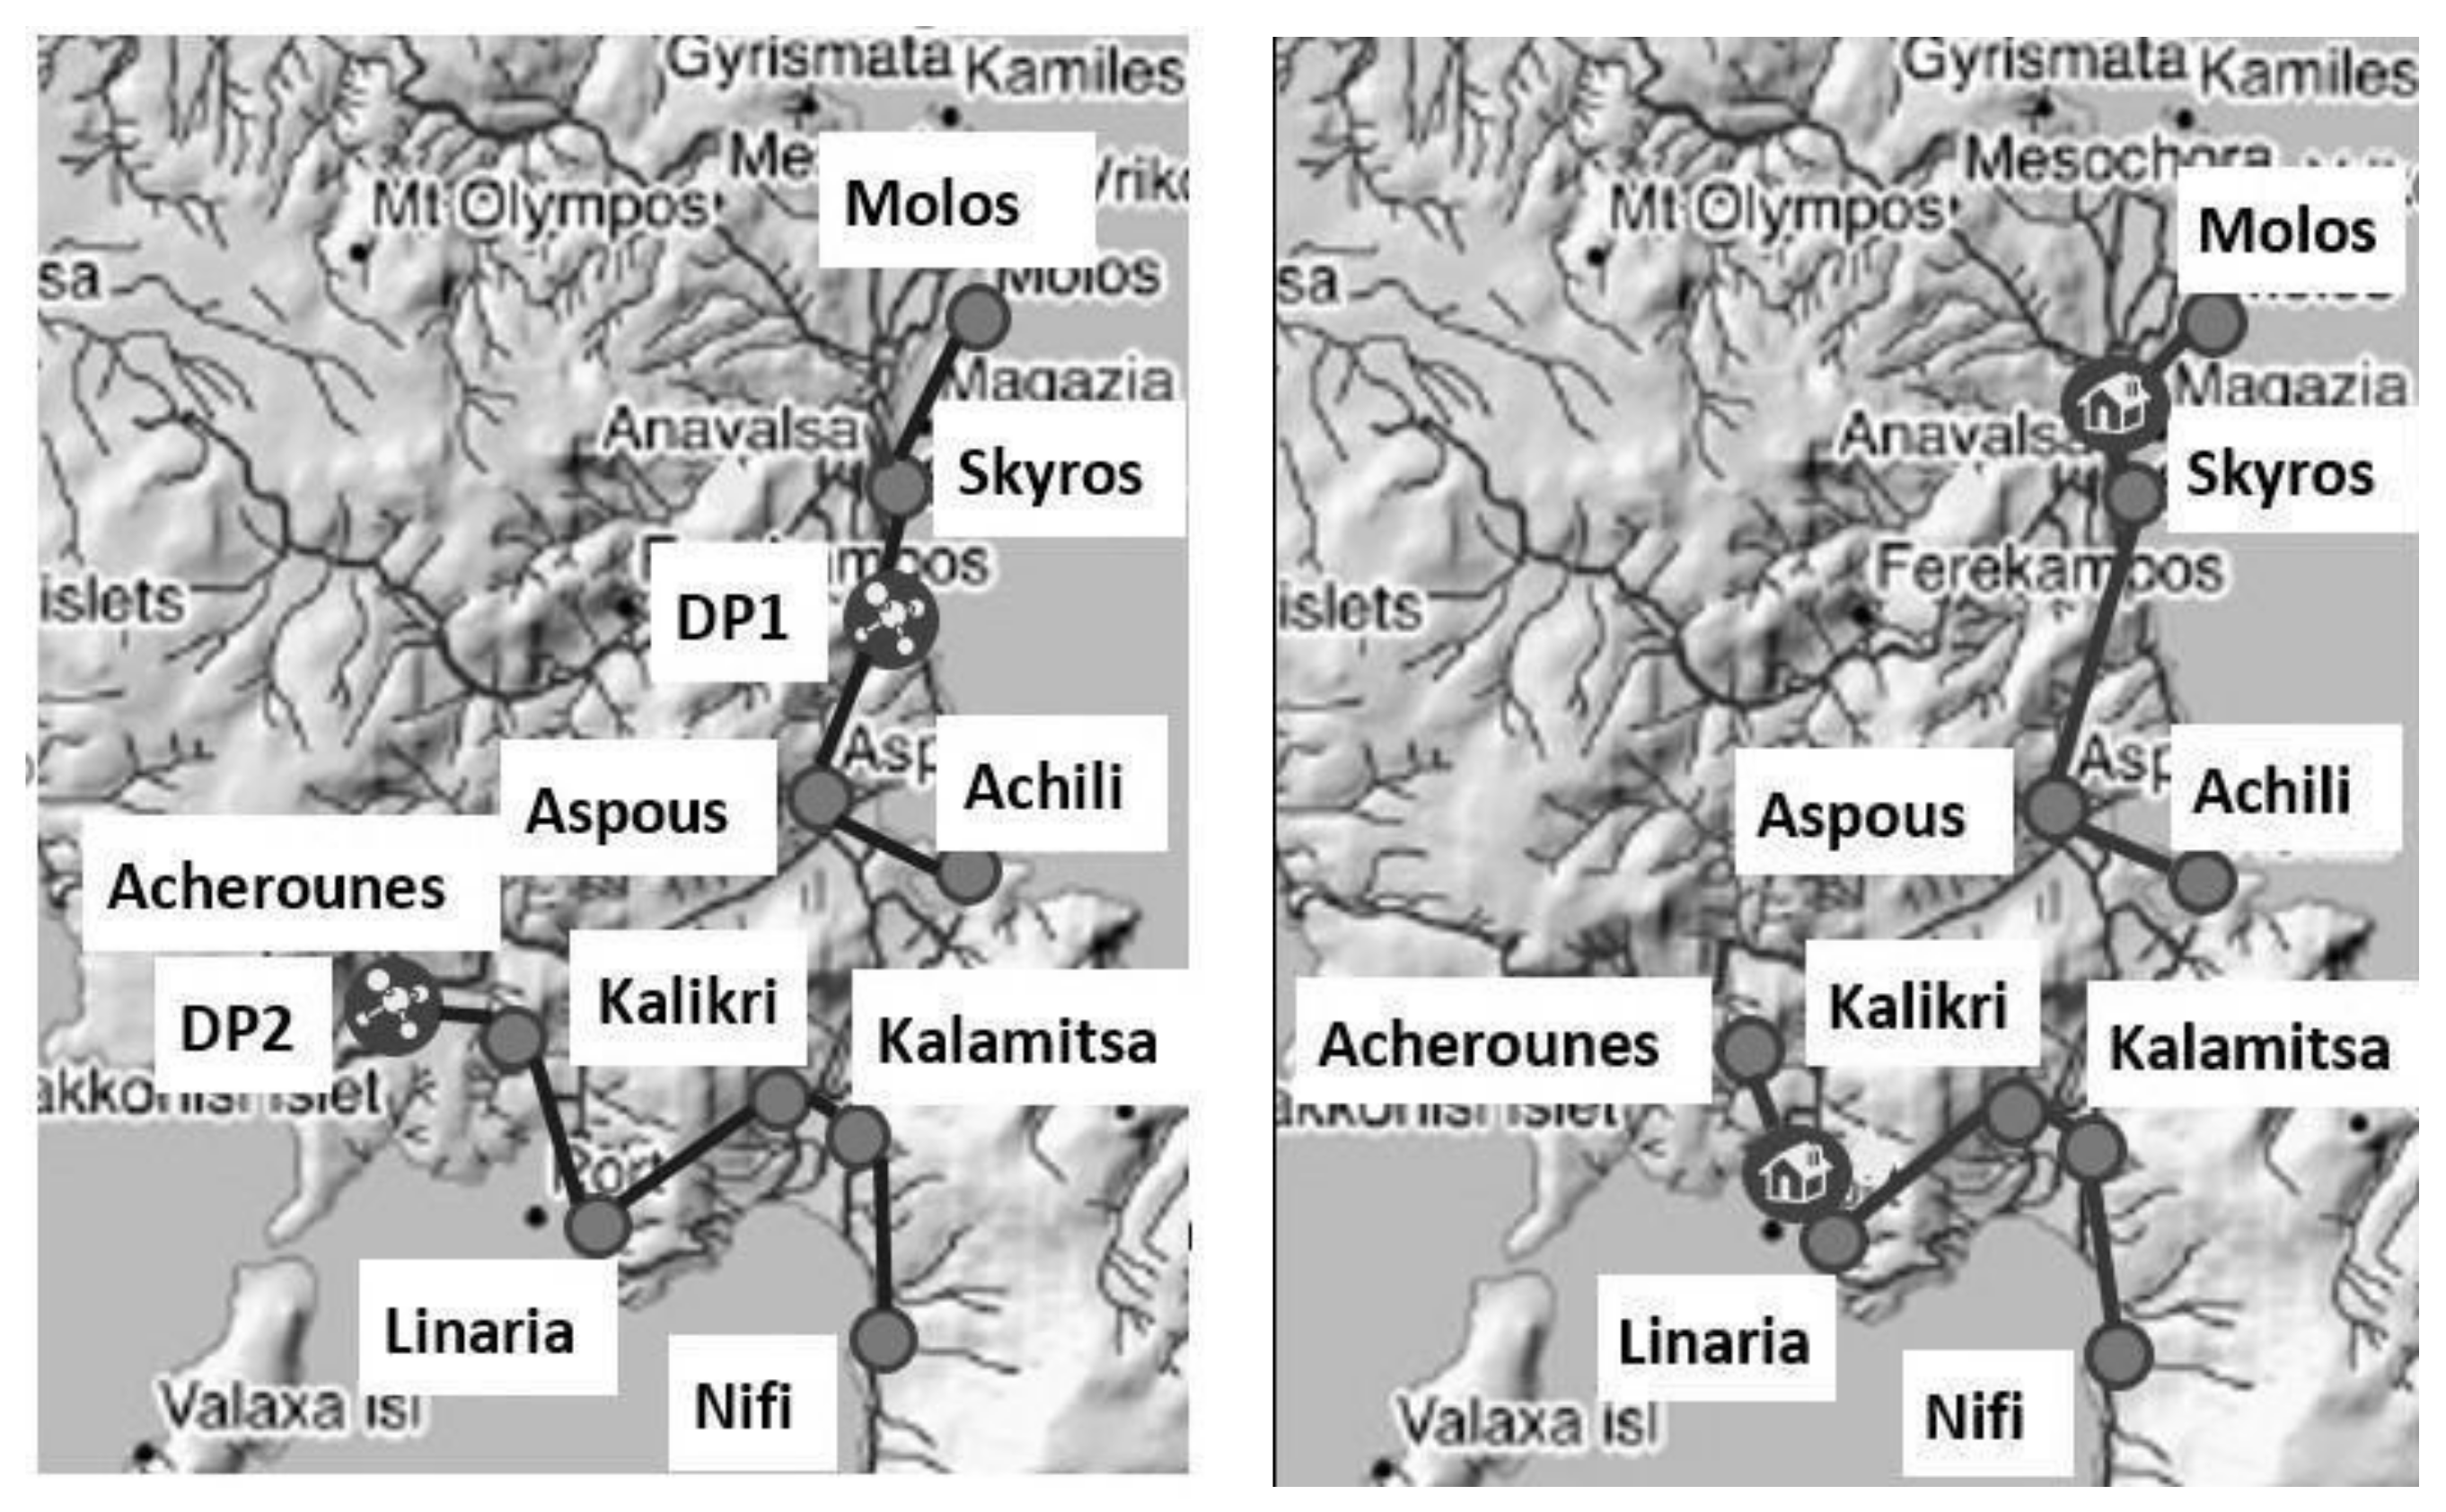
2.1. Water Network Design
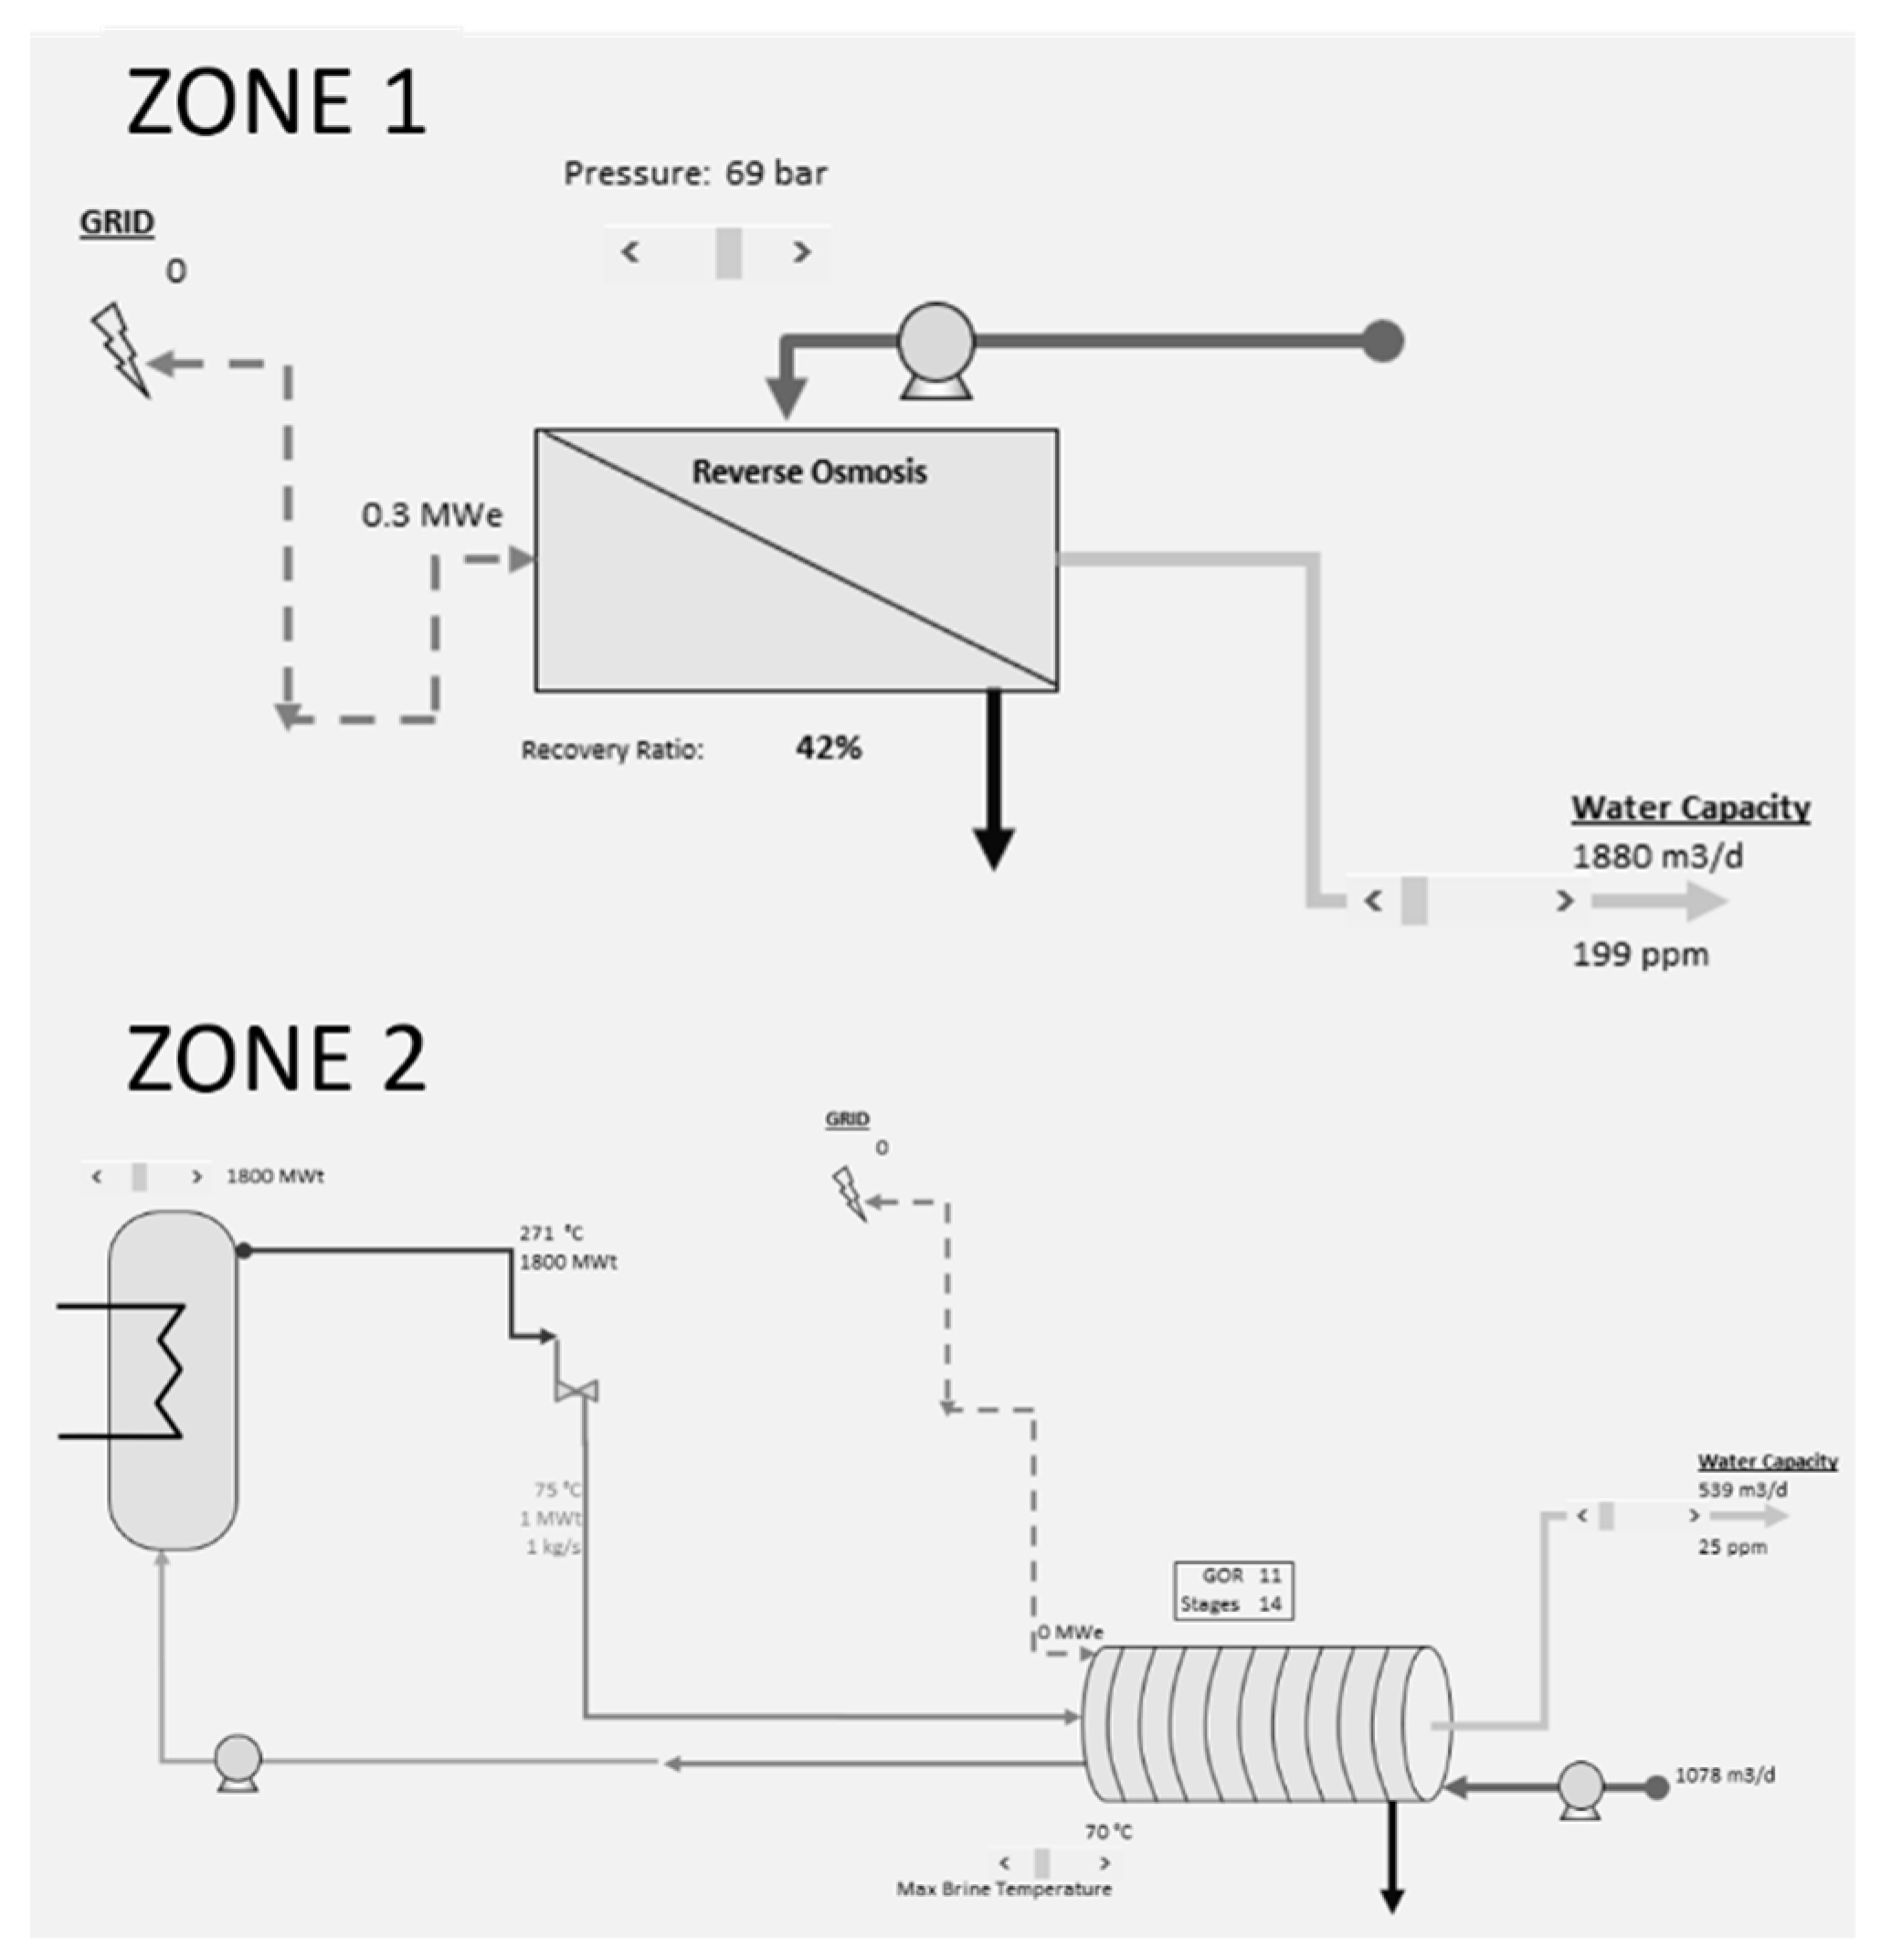
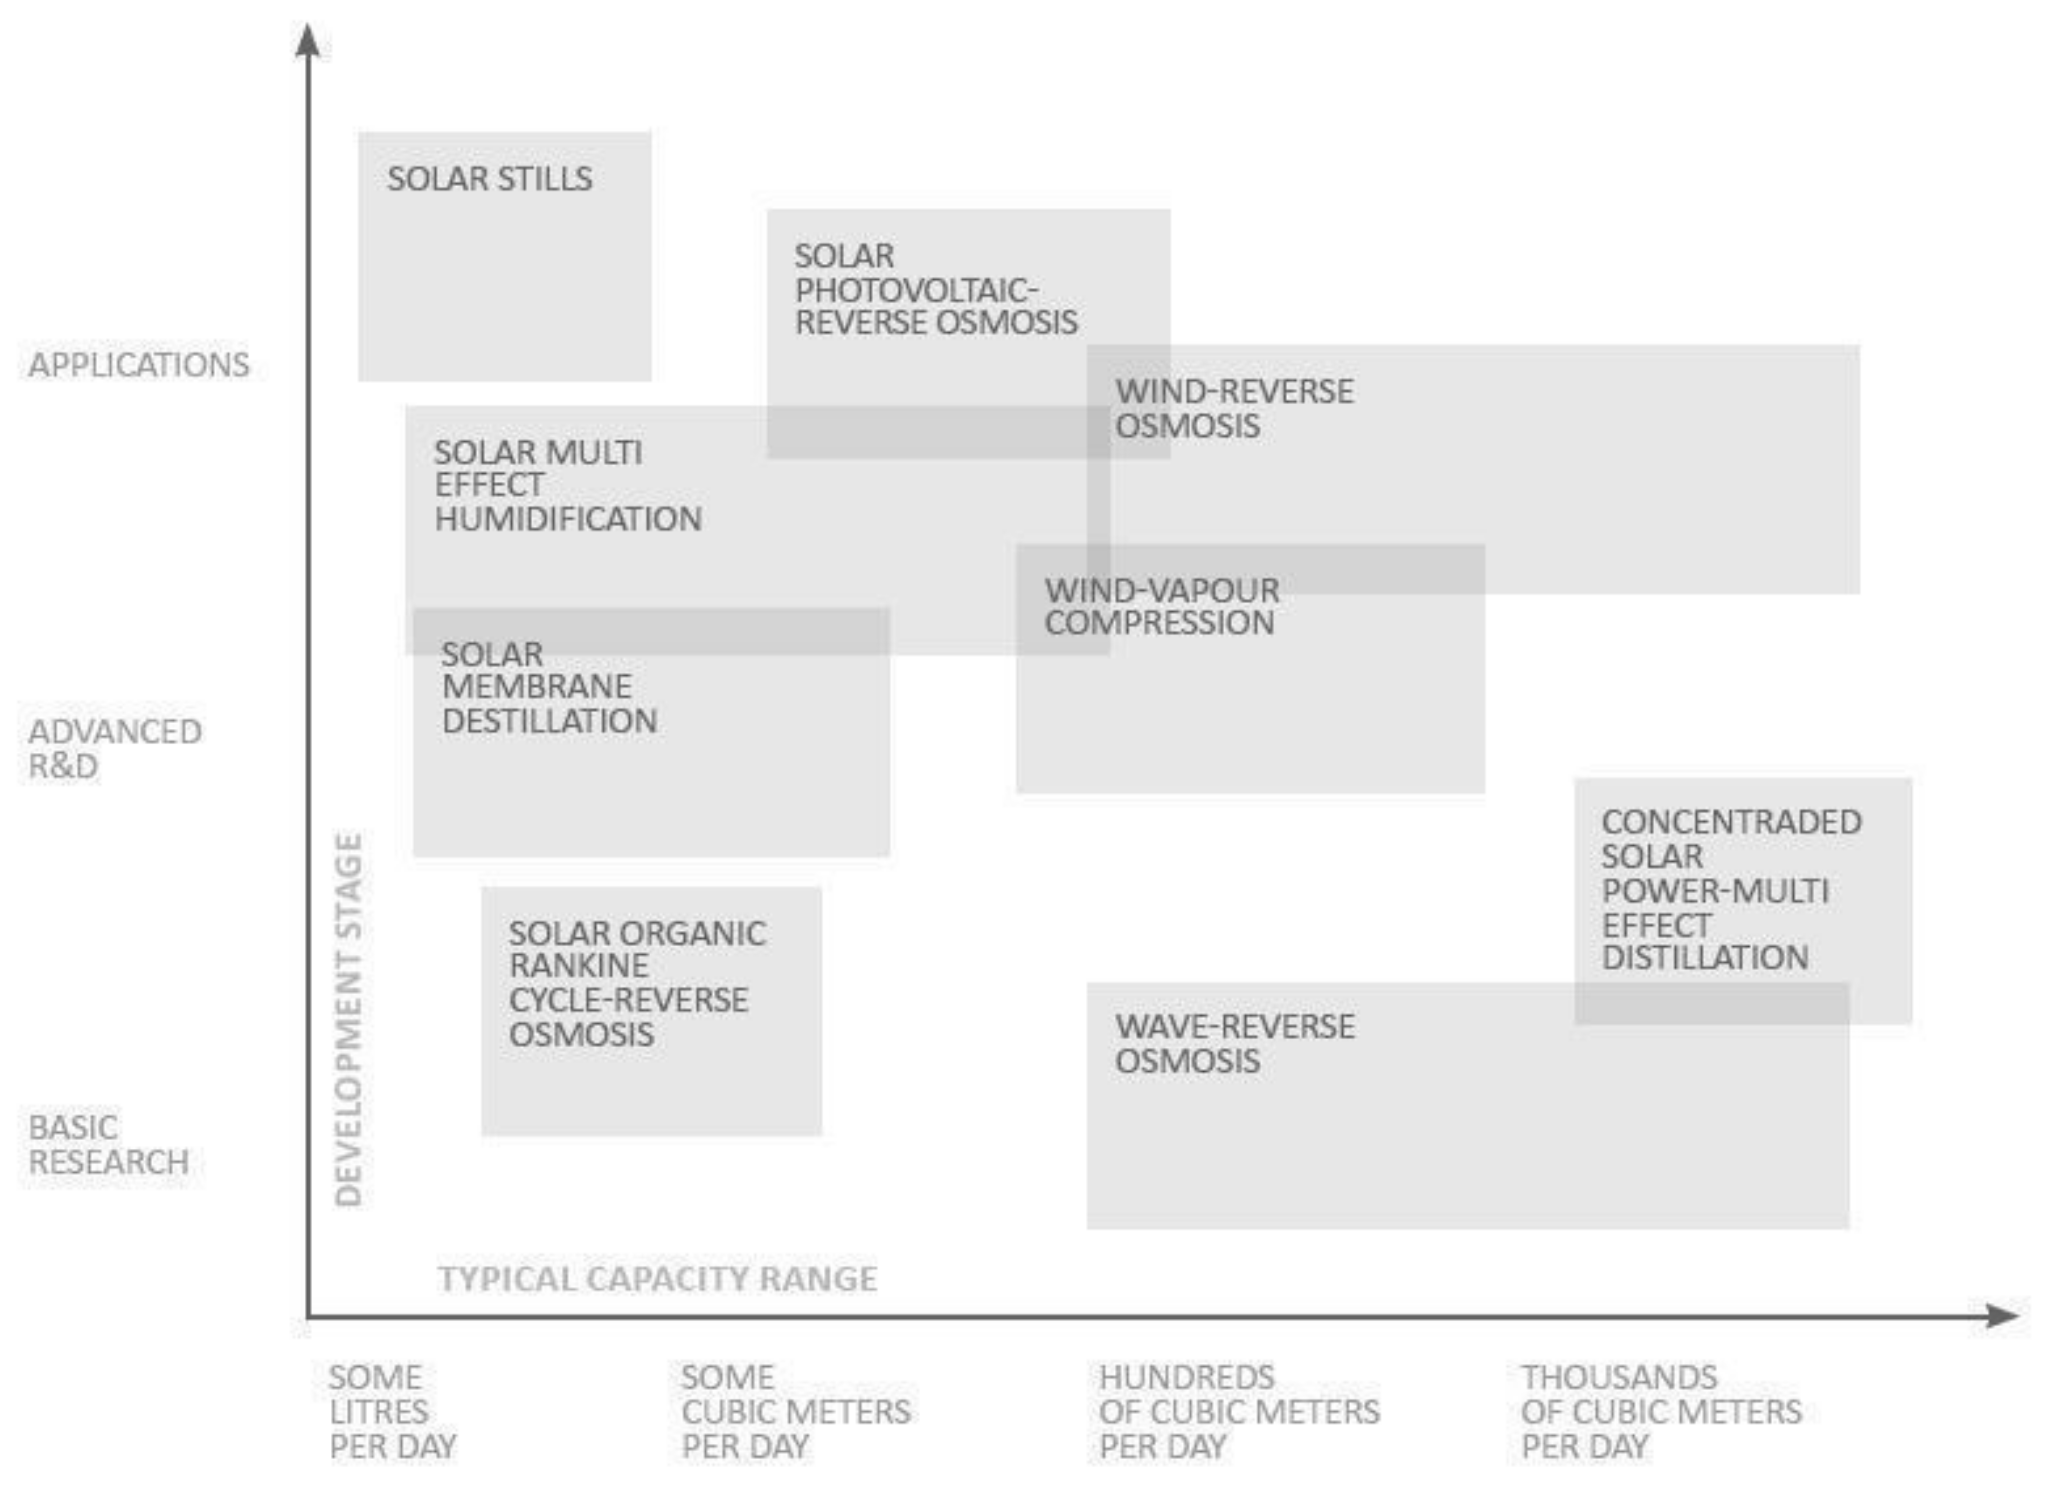
2.2. Desalination Plants
2.3. Wastewater Treatment Plants
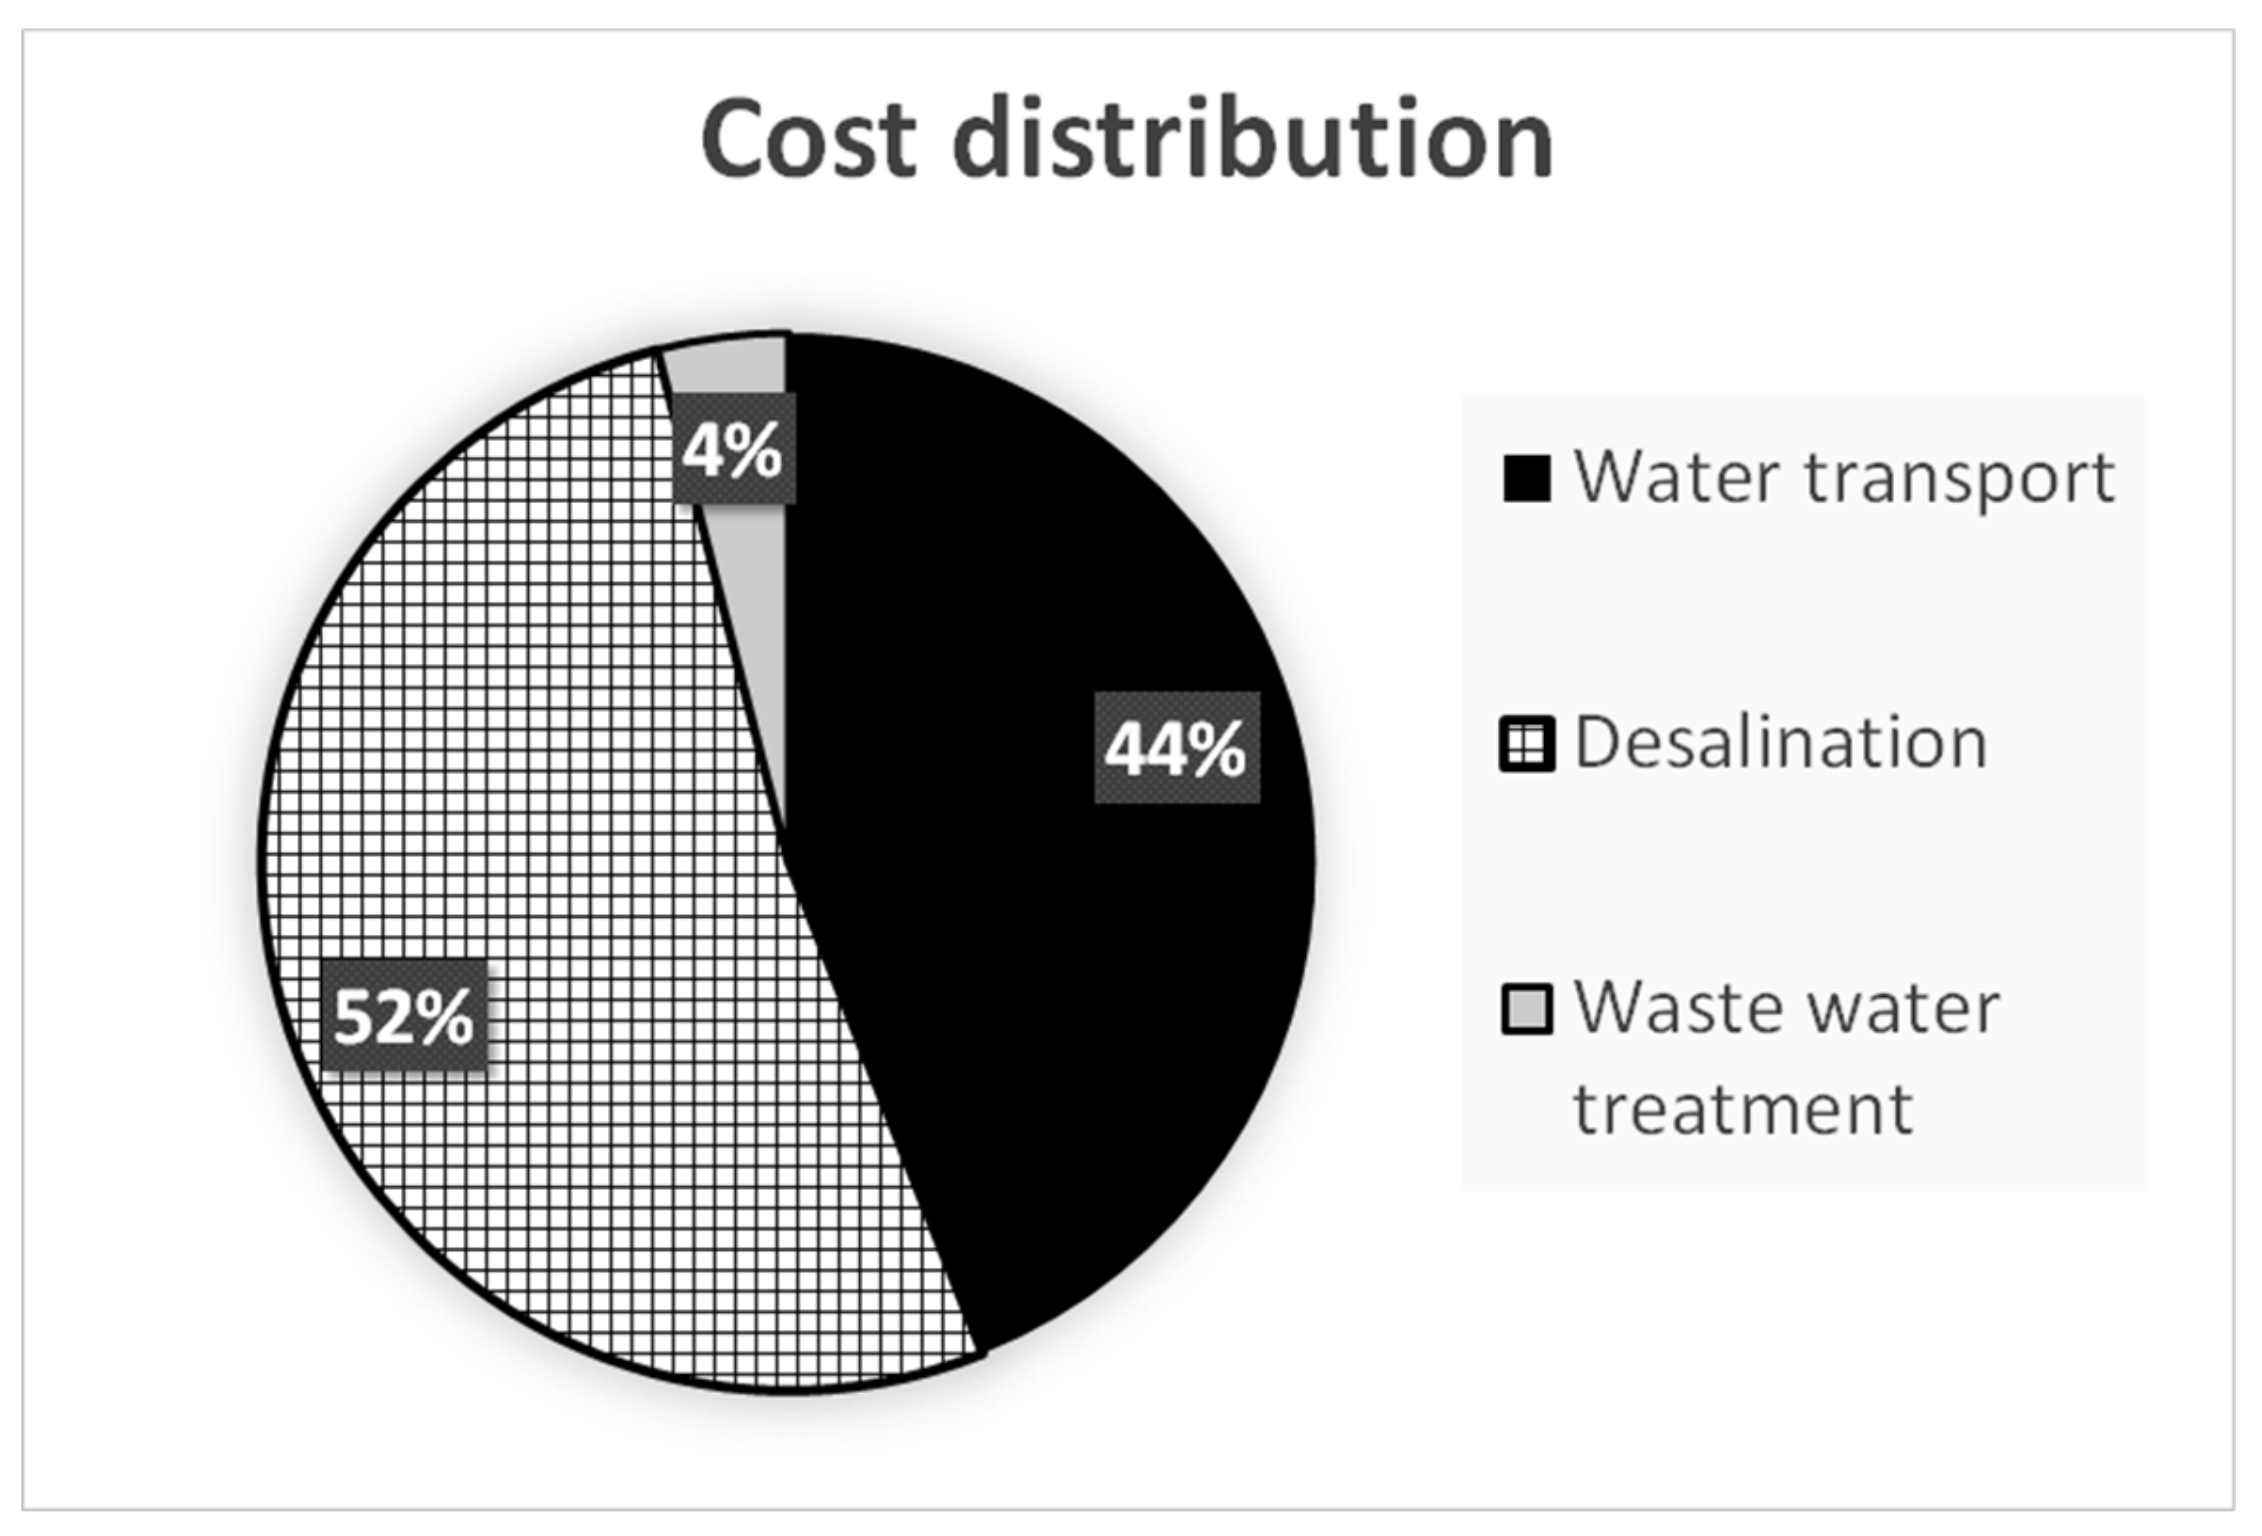
2.4. Economic Analysis
3. Results and Discussion
3.1. Water Networks Proposed
3.1.1. Zones 1 and 2
3.1.2. Zones 3 and 4
3.1.3. Comparison with Current Situation
4. Conclusions
Author Contributions
Funding
Conflicts of Interest
Appendix A

| Scenario 1 | |||||
|---|---|---|---|---|---|
| Current plant | Concentrated solar power plant (CSP) | Plant after the enlargement | |||
| PFI* | 41,449,819 | € | PFI | 50,957,419 | € |
| Price/kW | 5282 | €/kW | Price/kW | 5282 | €/kW |
| Power | 7.847 | MW | Power | 9.647 | MW |
| Terrain cost | 916,000 | € | Terrain cost | 1,126,108.556 | € |
| Terrain | 183,200 | m2 | Terrain | 225,221.7111 | m2 |
| Hybrid plant | Hybrid plant | ||||
| Rest of the plants (cost) | 15,568,922 | € | Rest of the plants (cost) | 15,568,922 | € |
| Total PFI | 57,018,741 | € | Total PFI | 66,526,341 | € |
| TRR* | 10,168,125 | €/year | TRR | 11,565,249 | €/year |
| Energy supplied | 25,000 | MWh/year | Energy supplied | 25,000 | MWh/year |
| Terrain cost total | 1,519,255 | € | Terrain cost total | 1,729,363.556 | € |
| Price of electricity | 406.725 | €/MWh | Price of electricity | 462.609 | €/MWh |
| Scenario 2 | |||||
| Current plant | PV | Plant after the enlargement | |||
| PFI | 17,915,100 | € | PFI | 20,985,900 | € |
| Price/kW | 1706 | €/kW | Price/kW | 1706 | €/kW |
| Power | 10.501 | MW | Power | 12.301 | MW |
| Terrain cost | 617,645 | € | Terrain cost | 723,514.588 | € |
| Terrain | 123,529 | m2 | Terrain | 144,702.917 | m2 |
| Hybrid plant | Hybrid plant | ||||
| Rest of the plants (cost) | 37,534,371 | € | Rest of the plants (cost) | 37,534,371 | € |
| Total PFI | 55,449,471 | € | Total PFI | 58,520,271 | € |
| TRR | 9,610,162 | €/year | TRR | 10,066,939 | €/year |
| Energy supplied | 25,000 | MWh/year | Energy supplied | 25,000 | MWh/year |
| Terrain cost total | 1,807,940 | € | Terrain cost total | 1,913,809.589 | € |
| Price of electricity | 384.406 | €/MWh | Price of electricity | 402.677 | €/MWh |
| Scenario 3 | |||||
| Current plant | PV | Plant after the enlargement | |||
| PFI | 17,915,100 | € | PFI | 20,985,900 | € |
| Price/kW | 1706 | €/kW | Price/kW | 1706 | €/kW |
| Power | 10.501 | MW | Power | 12.301 | MW |
| Terrain cost | 617,645 | € | Terrain cost | 723,514.5886 | € |
| Terrain | 123,529 | m2 | Terrain | 144,702.9177 | m2 |
| Hybrid plant | Hybrid plant | ||||
| Rest of the plants (cost) | 40,709,396 | € | Rest of the plants (cost) | 40,709,396 | € |
| Total PFI | 58,624,496 | € | Total PFI | 61,695,296 | € |
| TRR | 9,805,051 | €/year | TRR | 10,261,706 | €/year |
| Energy supplied | 25,000 | MWh/year | Energy supplied | 25,000 | MWh/year |
| Terrain cost total | 1,989,785 | € | Terrain cost total | 2,095,654.589 | € |
| Price of electricity | 392.202 | €/MWh | Price of electricity | 410.46824 | €/MWh |
| Cost of Electricity | Thermal Energy Cost | ||||
|---|---|---|---|---|---|
| Scenario 1 | 462.609 | €/MWh | Scenario 1 | 55.884 | €/MWh |
| Scenario 2 | 402.677 | €/MWh | Scenario 2 | 18.271 | €/MWh |
| Scenario 3 | 410.464 | €/MWh | Scenario 3 | 18.266 | €/MWh |
| Zone 1 | ||||
|---|---|---|---|---|
| Header | Technology | MED | TVC | RO |
| Zone 2 | MED | 421.25 | 404.50 | 387.75 |
| TVC | 421.25 | 404.50 | 387.75 | |
| RO | 417.90 | 401.15 | 384.41 | |
| Zone 1 | ||||
|---|---|---|---|---|
| Technology | MED | TVC | RO | |
| Zone 2 | MED | 36.84 | 20.09 | 3.35 |
| TVC | 36.84 | 20.09 | 3.35 | |
| RO | 33.49 | 16.74 | N/A | |
| Technology | Electric Power(MWe) | Thermal Power (MWt) | Total Investment (M€) | Annual Maintenance cost (M€) | Annual Thermal Energy (MWh) | Annual Electric Energy (MWh) | Annualized Investment Cost (M€) | Total Annualized Cost (k€) |
|---|---|---|---|---|---|---|---|---|
| MED-MED | 0.1 | 6 | 4 | 0.44 | 52,560 | 876 | 0.373 | 2224.072 |
| MED-TVC | 0.2 | 6 | 4 | 0.44 | 52,560 | 1752 | 0.373 | 2578.415 |
| MED-RO | 0.2 | 5 | 4 | 0.55 | 43,800 | 1752 | 0.373 | 2359.918 |
| TVC-MED | 0.3 | 3 | 4 | 0.44 | 26,280 | 2628 | 0.373 | 2114.227 |
| TVC-TVC | 0.4 | 3 | 4 | 0.44 | 26,280 | 3504 | 0.373 | 2459.768 |
| TVC-RO | 0.4 | 2 | 4 | 0.55 | 17,520 | 3504 | 0.373 | 2411.382 |
| RO-MED | 0.3 | 1 | 4 | 0.54 | 8760 | 2628 | 0.373 | 1961.894 |
| RO-TVC | 0.4 | 1 | 4 | 0.54 | 8760 | 3504 | 0.373 | 2301.567 |
| RO-RO | 0.4 | 0 | 4 | 0.65 | 0 | 3504 | 0.373 | 2370.513 |
Appendix B
| Symbol | Meaning |
|---|---|
| F1 | Friction factor guessed |
| F’ | Friction factor after iteration |
| D | Pipeline diameter |
| hg | Pump head (height difference) |
| h0 | Pump head (given by friction) |
| Q | Water flow |
| Z0 | Height initial point |
| Zl | Height final point |
| Connection Aspous–Achilli | Connection Kalamitsa–Nifi | ||||
|---|---|---|---|---|---|
| Initial data | Initial data | ||||
| Distance | 1392.84 | m | Distance | 1216.55 | m |
| Q | 0.02 | m3/s | Q | 0.01 | m3/s |
| Z0 | 0.00 | m | Z0 | 0.00 | m |
| Zl | 0.00 | m | Zl | 0.00 | m |
| Values after iteration | Values after iteration | ||||
| F1 | D | F’ | F1 | D | F’ |
| 0.02 | 0.187 | 0.023 | 0.025 | 0.148 | 0.024 |
| Final values | Final values | ||||
| Diameter | 0.19 | m | Diameter | 0.15 | m |
| F | 0.03 | F | 0.03 | ||
| Velocity | 0.82 | m/s | Velocity | 0.77 | m/s |
| Reynolds | 149,801.27 | Reynolds | 110,968.08 | ||
| hg | 0.00 | m | hg | 0.00 | m |
| h0 | 6.37 | m | h0 | 6.20 | m |
| Economic results | Economic results | ||||
| Pipelines cost | 445,530.76 | € | Pipelines cost | 307,884.23 | € |
| Power | 1.69 | kW | Power | 0.96 | kW |
| Pumps cost | 8138.54 | € | Pumps cost | 5416.92 | € |
| Pumping cost/year | 5753.46 | €/year | Pumping cost/year | 3276.42 | €/year |
| Annualized total cost | 43,094.08 | € | Annualized total cost | 29,063.62 | € |
| Connection Ferekampos–Aspous | Connection Ferekampos–Skyros | ||||
| Initial data | Initial data | ||||
| Distance | 1878.83 | m | Distance | 3001.67 | m |
| Q | 0.07 | m3/s | Q | 0.91 | m3/s |
| Z0 | 80.00 | m | Z0 | 80.00 | m |
| Zl | 0.00 | m | Zl | 60.00 | m |
| Final values | Final values | ||||
| Diameter | 0.19 | m | Diameter | 0.75 | m |
| Velocity | 2.51 | m/s | Velocity | 2.07 | m/s |
| Reynolds | 455,545.09 | Reynolds | 1,515,001.74 | ||
| Economic results | Economic results | ||||
| Pipelines cost | 596,058.55 | € | Pipelines cost | 8,613,660.26 | € |
| Annualized total cost | 49,060.40 | € | Annualized total cost | 708,973.29 | € |
| Connection Skyros–Molos | Connection Reservoir 2–Linaria | ||||
| Initial data | Initial data | ||||
| Distance | 1456.02 | m | Distance | 776.21 | m |
| Q | 0.26 | m3/s | Q | 0.04 | m3/s |
| Z0 | 60.00 | m | Z0 | 200.00 | m |
| Zl | 0.00 | m | Zl | 0.00 | m |
| Final values | Final values | ||||
| Diameter | 0.31 | m | Diameter | 0.11 | m |
| Velocity | 3.43 | m/s | Velocity | 4.47 | m/s |
| Reynolds | 1,046,659.81 | Reynolds | 482,413.44 | ||
| Economic results | Economic results | ||||
| Pipelines cost | 992,625.04 | € | Pipelines cost | 152,259.78 | € |
| Annualized total cost | 81,701.00 | € | Annualized total cost | 12,532.20 | € |
| Connection Reservoir 2–Acherounes | Connection Reservoir 2–Kalikri | ||||
| Initial data | Initial data | ||||
| Distance | 1025.91 | m | Distance | 1520.69 | m |
| Q | 0.03 | m3/s | Q | 0.05 | m3/s |
| Z0 | 200.00 | m | Z0 | 200.00 | m |
| Zl | 100.00 | m | Zl | 100.00 | m |
| Final values | Final values | ||||
| Diameter | 0.11 | m | Diameter | 0.15 | m |
| Velocity | 2.77 | m/s | Velocity | 2.75 | m/s |
| Reynolds | 305,196.42 | Reynolds | 407,636.35 | ||
| Economic results | Economic results | ||||
| Pipelines cost | 204,485.00 | € | Pipelines cost | 394,452.13 | € |
| Annualized total cost | 16,830.75 | € | Annualized total cost | 32,466.57 | € |
| Connection Kalikri–Kalamitsa | |||||
| Initial data | |||||
| Distance | 282.84 | m | |||
| Q | 0.03 | m3/s | |||
| Z0 | 100.00 | m | |||
| Zl | 0.00 | m | |||
| Final values | |||||
| Diameter | 0.09 | m | |||
| Velocity | 4.68 | m/s | |||
| Reynolds | 422,834.90 | ||||
| Economic results | |||||
| Pipelines cost | 47,548.43 | € | |||
| Annualized total cost | 3913.62 | € | |||
| Connection Achilli–Aspous | Connection Aspous–Skyros | ||||
|---|---|---|---|---|---|
| Initial data | Initial data | ||||
| Distance | 1392.84 | m | Distance | 2469.82 | m |
| Q | 0.01 | m3/s | Q | 0.02 | m3/s |
| Z0 | 0.00 | m | Z0 | 0.00 | m |
| Zl | 0.00 | m | Zl | 60.00 | m |
| Values after iteration | Values after iteration | ||||
| F1 | D | F’ | F1 | D | F’ |
| 0.025 | 0.098 | 0.027 | 0.025 | 0.172 | 0.023 |
| Final values | Final values | ||||
| Diameter | 0.10 | m | Diameter | 0.17 | m |
| F | 0.03 | F | 0.03 | ||
| Velocity | 0.78 | m/s | Velocity | 0.76 | m/s |
| Reynolds | 74,794.91 | Reynolds | 128,325.64 | ||
| hg | 0.00 | m | hg | 60.00 | m |
| h0 | 11.13 | m | h0 | 70.67 | m |
| Economic results | Economic results | ||||
| Pipelines cost | 245,520.38 | € | Pipelines cost | 722,095.67 | € |
| Power | 0.77 | kW | Power | 14.80 | kW |
| Pumps cost | 4612.72 | € | Pumps cost | 39,014.17 | € |
| Pumping cost/year | 2623.40 | €/year | Pumping cost/year | 50,279.28 | €/year |
| Annualized total cost | 23,211.36 | € | Annualized total cost | 112,924.72 | € |
| Connection Aspous–Skyros | Connection Molos–WWTP1 | ||||
| Initial ddata | Initial data | ||||
| Distance | 860.23 | m | Distance | 2469.82 | m |
| Q | 0.07 | m3/s | Q | 0.02 | m3/s |
| Z0 | 0.00 | m | Z0 | 0.00 | m |
| Zl | 0.00 | m | Zl | 60.00 | m |
| Values after iteration | Values after iteration | ||||
| F1 | D | F’ | F1 | D | F’ |
| 0.02 | 0.33 | 0.02 | 0.025 | 0.172 | 0.023 |
| Final values | Final values | ||||
| Diameter | 0.33 | m | Diameter | 0.17 | m |
| F | 0.03 | F | 0.03 | ||
| Velocity | 0.80 | m/s | Velocity | 0.76 | m/s |
| Reynolds | 257,967.65 | Reynolds | 128,325.64 | ||
| hg | 0.00 | m | hg | 60.00 | m |
| h0 | 2.12 | m | h0 | 70.67 | m |
| Economic results | Economic results | ||||
| Pipelines cost | 643,484.49 | € | Pipelines cost | 722,095.67 | € |
| Power | 1.71 | kW | Power | 14.80 | kW |
| Pumps cost | 8202.35 | € | Pumps cost | 39,014.17 | € |
| Pumping cost/year | 5815.94 | €/year | Pumping cost/year | 50,279.28 | €/year |
| Annualized total cost | 59,454.99 | € | Annualized total cost | 112,924.72 | € |
| Connection Kalamitsa–Kalikri | Connection Nifi–Kalamitsa | ||||
| Initial data | Initial data | ||||
| Distance | 282.84 | m | Distance | 1216.55 | m |
| Q | 0.01 | m3/s | Q | 0.003 | m3/s |
| Z0 | 0.00 | m | Z0 | 0 | m |
| Zl | 100.00 | m | Zl | 0 | m |
| Values after iteration | Values after iteration | ||||
| F1 | D | F’ | F1 | D | F’ |
| 0.025 | 0.116 | 0.026 | 0.03 | 0.077 | 0.029 |
| Final values | Final values | ||||
| Diameter | 0.12 | m | Diameter | 0.08 | m |
| F | 0.03 | F | 0.025 | ||
| Velocity | 0.78 | m/s | Velocity | 0.7449946 | m/s |
| Reynolds | 88,042.89 | Reynolds | 5.58 x 10⁴ | ||
| hg | 100.00 | m | hg | 0 | m |
| h0 | 101.88 | m | h0 | 11.220727 | m |
| Economic results | Economic results | ||||
| Pipelines cost | 57,819.37 | € | Pipelines cost | 173,708.5 | € |
| Power | 9.87 | kW | Power | 0.5 | kW |
| Pumps cost | 29,104.60 | € | Pumps cost | 3148.4 | € |
| Pumping cost/year | 33,525.19 | €/year | Pumping cost/year | 1546.8 | €/year |
| Annualized total cost | 40,679.73 | € | Annualized total cost | 16,103.6 | € |
| Connection Linaria–WWTP2 | |||||
| Initial data | |||||
| Distance | 707.11 | m | |||
| Q | 0.03 | m3/s | |||
| Z0 | 0.00 | m | |||
| Zl | 0.00 | m | |||
| Values after iteration | |||||
| F1 | D | F’ | |||
| 0.03 | 0.215 | 0.022 | |||
| Final values | |||||
| Diameter | 0.22 | m | |||
| F | 0.03 | ||||
| Velocity | 0.71 | m/s | |||
| Reynolds | 149,475.02 | ||||
| hg | 0.00 | m | |||
| h0 | 2.12 | m | |||
| Economic results | |||||
| Pipelines cost | 269,538.41 | € | |||
| Power | 0.65 | kW | |||
| Pumps cost | 4057.13 | € | |||
| Pumping cost/year | 2196.70 | €/year | |||
| Annualized total cost | 24,715.81 | € | |||
| Connection Skyros–WWTP1 | Connection Kalikri–Linaria | ||||
| Initial data | Initial data | ||||
| Distance | 707.11 | m | Distance | 1772.00 | m |
| Q | 0.20 | m3/s | Q | 0.01 | m3/s |
| Z0 | 60.00 | m | Z0 | 100.00 | m |
| Zl | 0.00 | m | Zl | 0.00 | m |
| Final values | Final values | ||||
| Diameter | 0.25 | m | Diameter | 0.09 | m |
| Velocity | 4.24 | m/s | Velocity | 1.88 | m/s |
| Reynolds | 1,019,093.94 | Reynolds | 172,043.01 | ||
| Economic results | Economic results | ||||
| Pipelines cost | 328,755.22 | € | Pipelines cost | 301,424.13 | € |
| Annualized total cost | 27,059.19 | € | Annualized total cost | 24,809.62 | € |
| Connection Acherounes–WWTP2 | |||||
| Initial data | |||||
| Distance | 1000.00 | m | |||
| Q | 0.01 | m3/s | |||
| Z0 | 100.00 | m | |||
| Zl | 0.00 | m | |||
| Final values | |||||
| Diameter | 0.08 | m | |||
| Velocity | 1.81 | m/s | |||
| Reynolds | 125,804.38 | ||||
| Economic results | |||||
| Pipelines cost | 134,076.10 | € | |||
| Annualized total cost | 11,035.54 | € | |||
| Connection DP1–Ferekampos | Connection DP2–Reservoir 2 | ||||
|---|---|---|---|---|---|
| Initial data | Initial data | ||||
| Distance | 2624.88 | m | Distance | 1530.52 | m |
| Q | 0.02 | m3/s | Q | 0.01 | m3/s |
| Z0 | 0.00 | m | Z0 | 0.00 | m |
| Zl | 80.00 | m | Zl | 200.00 | m |
| Values after iteration | Values after iteration | ||||
| F1 | D | F’ | F1 | D | F’ |
| 0.02 | 0.184 | 0.023 | 0.025 | 0.101 | 0.027 |
| Final values | Final values | ||||
| Diameter | 0.18 | m | Diameter | 0.10 | m |
| F | 0.03 | F | 0.03 | ||
| Velocity | 0.82 | m/s | Velocity | 0.78 | m/s |
| Reynolds | 147,229.92 | Reynolds | 76,990.52 | ||
| hg | 80.00 | m | hg | 200.00 | m |
| h0 | 92.24 | m | h0 | 211.83 | m |
| Economic results | Economic results | ||||
| Pipelines cost | 822,782.58 | € | Pipelines cost | 276,967.11 | € |
| Power | 23.68 | kW | Power | 15.60 | kW |
| Pumps cost | 54,796.98 | € | Pumps cost | 40,514.39 | € |
| Pumping cost/year | 80,435.44 | €/year | Pumping cost/year | 52,972.94 | €/year |
| Annualized total cost | 152,667.27 | € | Annualized total cost | 79,104.21 | € |
References
- Kaldellis, J.K.; Kondili, E.M. The water shortage problem in the Aegean archipelago islands: Cost-effective desalination prospects. Desalination 2007, 216, 123–138. [Google Scholar] [CrossRef]
- Ghaffour, N.; Mujtaba, I.M. Desalination using renewable energy. Desalination 2018, 435, 1–2. [Google Scholar] [CrossRef]
- Ilias, A.; Panoras, A.; Angelakis, A. Wastewater recycling in Greece: The case of Thessaloniki. Sustainability 2014, 6, 2876–2892. [Google Scholar] [CrossRef]
- Demographics, Geography, Economy and Energy Statistics of Skyros. Technical Report. Available online: http://www.genergis.eu/deliverables (accessed on 5 November 2019).
- Hellenic National Meteorological Service. HNMS Climatology Skyros; Hellenic National Meteorological Service: Athens, Greece, 2018.
- Hellenic National Meteorological Service. ELSTAT Censo Población Skyros; Hellenic National Meteorological Service: Athens, Greece, 2011.
- Gikas, P.; Tchobanoglous, G. Sustainable use of water in the Aegean Islands. J. Environ. Manag. 2009, 90, 2601–2611. [Google Scholar] [CrossRef]
- Petrakopoulou, F.; Loizidou, M. Scenarios for the Sustainable Development of Energy Autonomy of Skyros. Technical Report. Available online: http://www.genergis.eu/deliverables (accessed on 05 November 2019).
- The Council of the European Union. Council Directive 98/83/EC; The Council of the European Union: Brussels, Belgium, 2008. [Google Scholar]
- Energy, Legislative and Institutional Issues for Energy & Water Greece, Italy, Spain, Portugal. 2010. Available online: https://www.prodes-project.org/fileadmin/Files/Deliverable_6_1.pdf (accessed on 5 November 2019).
- Hellenic Ministry for the Environment. Establishment of Measures, Conditions and Procedures for the Re-Use of Treated Waste Water and Other Provisions; Hellenic Ministry for the Environment: Athens, Greece, 2011.
- Swamee, P.K.; Sharma, A.K. Design of Water Supply Pipe Networks; John Wiley & Sons: Hoboken, NJ, USA, 2008; ISBN 9780874216561. [Google Scholar]
- Davis, M.L. Water and Wastewater Engineering: Design Principles and Practice; McGraw-Hill: New York, NY, USA, 2011; ISBN 9780071713856. [Google Scholar]
- Mekonnen, Y. Population Forecasting for Design of Water Supply System in Injibara Town, Amhara Region, Ethiopia. IISTE 2018, 10, 54–65. [Google Scholar]
- International Atomic Energy Agency. DEEP 5 User Manual; International Atomic Energy Agency: Vienna, Austria, 2013. [Google Scholar]
- Kampragou, E.; Grigoropoulou, H.; Assimacopoulos, D. Treated wastewater reuse potential: Mitigating water. Water Resour. 2014, 53, 3272–3282. [Google Scholar]
- Bakir, H.A. Sustainable wastewater management for small communities in the Middle East and North Africa. J. Environ. Manag. 2001, 61, 319–328. [Google Scholar] [CrossRef] [PubMed]
- Chartzoulakis, K.; Paranychianakis, N.; Angelakis, A. Water resources management in the Island of Crete, Greece, with emphasis on the agricultural use. Water Policy 2001, 3, 193–205. [Google Scholar] [CrossRef]
- Tsagarakis, K.P.; Dialynas, G.E.; Angelakis, A.N. Water resources management in Crete (Greece) including water recycling and reuse and proposed quality criteria. Agric. Water Manag. 2004, 66, 35–47. [Google Scholar] [CrossRef]
- Water Transmission. Available online: https://www.samsamwater.com/library/TP40_20_Water_transmission.pdf (accessed on 5 November 2019).
- Bixio, D.; Thoeye, C.; De Koning, J.; Joksimovic, D.; Savic, D.; Wintgens, T.; Melin, T. Wastewater reuse in Europe. Desalination 2006, 187, 89–101. [Google Scholar] [CrossRef]
- Voutchkov, N. Desalination Engineering, Planing and Design; McGraw-Hill: New York, NY, USA, 2013; ISBN L9780071777162. [Google Scholar]
- Asano, T.; Burton, F.L.; Engineer, C.; Altos, L.; Leverenz, H.L.; Tsuchihashi, R.; Specialist, T.; Tchobanoglous, G. Water Reuse, Issues, Technologies and Applications; McGraw-Hill: New York, NY, USA, 2007; ISBN 9780071459273. [Google Scholar]


| Potential Use | Minimum Required Treatment Level | Effluent Quality Standards |
|---|---|---|
| Restricted irrigation | Secondary biological treatment & disinfection |
|
| Unrestricted irrigation | Tertiary biological treatment & disinfection |
|
| Urban use | Advanced treatment & disinfection |
|
| Groundwater recharge (non- potable purposes) | Secondary biological treatment & disinfection |
|
| Industrial use | Tertiary biological treatment & disinfection |
|
| Parameter | Assumption |
|---|---|
| Water demand | 10,812 m3/day for the year 2038 |
| Irrigation needs | 65% of the total demand |
| Wastewater | 75% of the urban use |
| Material used for the pipes | Ductile iron |
| Pipe water velocity range | 0.5–4 m/s |
| Pipe diameter range | 0.08–0.75 m |
| Pressure head range | −2.5–50 m |
| Pipe cost coefficient, km | 1320 |
| Pipe cost exponent, m | 0.866 |
| Peak day factor (used to oversize the pipes) | 2 |
| Peak hour factor (used to oversize the system) | 5 |
| Seawater salinity | 37.5 psu |
| Seawater temperature | 18 °C |
| Distance of the water transport by ships | 100 km |
| Diesel cost for the ships | 0.65€/L |
| Power Plant | Power (MW) | Terrain (m2) | Cost of Electricity (€/MWh) | Thermal Energy Cost (€/MWh) |
|---|---|---|---|---|
| Current photovoltaic (PV) plant | 10.5 | 123,529 | 384.4 | - |
| Plant after the enlargement | 12.3 | 144,702 | 402.7 | 18.3 |
| Desalinated Water Supply System | ||||
| - | Total investment of pipes (k€) | Total investment of pumps (k€) | Operational costs (k€/year) | Total annual cost (k€/year) |
| Zone 1 | 10,648 | 8 | 6 | 2681 |
| Zone 2 | 1107 | 5 | 3 | 95 |
| Wastewater collection system | ||||
| - | Total investment of pipes (k€) | Total investment of pumps (k€) | Operational costs (k€/year) | Total annual cost (k€/year) |
| Zone 1 | 1940 | 52 | 59 | 223 |
| Zone 2 | 1236 | 37 | 37 | 129 |
| Desalinated water production costs | ||||
| - | Fixed costs (k€) | Maintenance costs (k€) | Energy costs (k€/year) | Total annual cost (k€/year) |
| DP1* | 3 | 350 | 1019 | 1649 |
| DP2 | 1 | 190 | 29 | 313 |
| Wastewater treatment costs | ||||
| - | Energy costs (€/day) | Total costs (€/day) | Total annual cost (k€/year) | |
| WWTP1* | 181 | 951 | 347 | |
| WWTP2 | 27 | 225 | 82 | |
© 2019 by the authors. Licensee MDPI, Basel, Switzerland. This article is an open access article distributed under the terms and conditions of the Creative Commons Attribution (CC BY) license (http://creativecommons.org/licenses/by/4.0/).
Share and Cite
Fernández-Gil, G.; Petrakopoulou, F. Sustainable Water Generation on a Mediterranean Island in Greece. Energies 2019, 12, 4247. https://doi.org/10.3390/en12224247
Fernández-Gil G, Petrakopoulou F. Sustainable Water Generation on a Mediterranean Island in Greece. Energies. 2019; 12(22):4247. https://doi.org/10.3390/en12224247
Chicago/Turabian StyleFernández-Gil, Guillermo, and Fontina Petrakopoulou. 2019. "Sustainable Water Generation on a Mediterranean Island in Greece" Energies 12, no. 22: 4247. https://doi.org/10.3390/en12224247
APA StyleFernández-Gil, G., & Petrakopoulou, F. (2019). Sustainable Water Generation on a Mediterranean Island in Greece. Energies, 12(22), 4247. https://doi.org/10.3390/en12224247