Urban Sustainability Audits and Ratings of the Built Environment

 ,
, 

Abstract
:
1. Introduction
Existing Systems for Rating and Labelling
2. The Common European Sustainable Built Environment Assessment for Mediterranean Cities (CESBA MED) Method
2.1. Sustainability Indicators and Key Performance Indicators (KPIs)
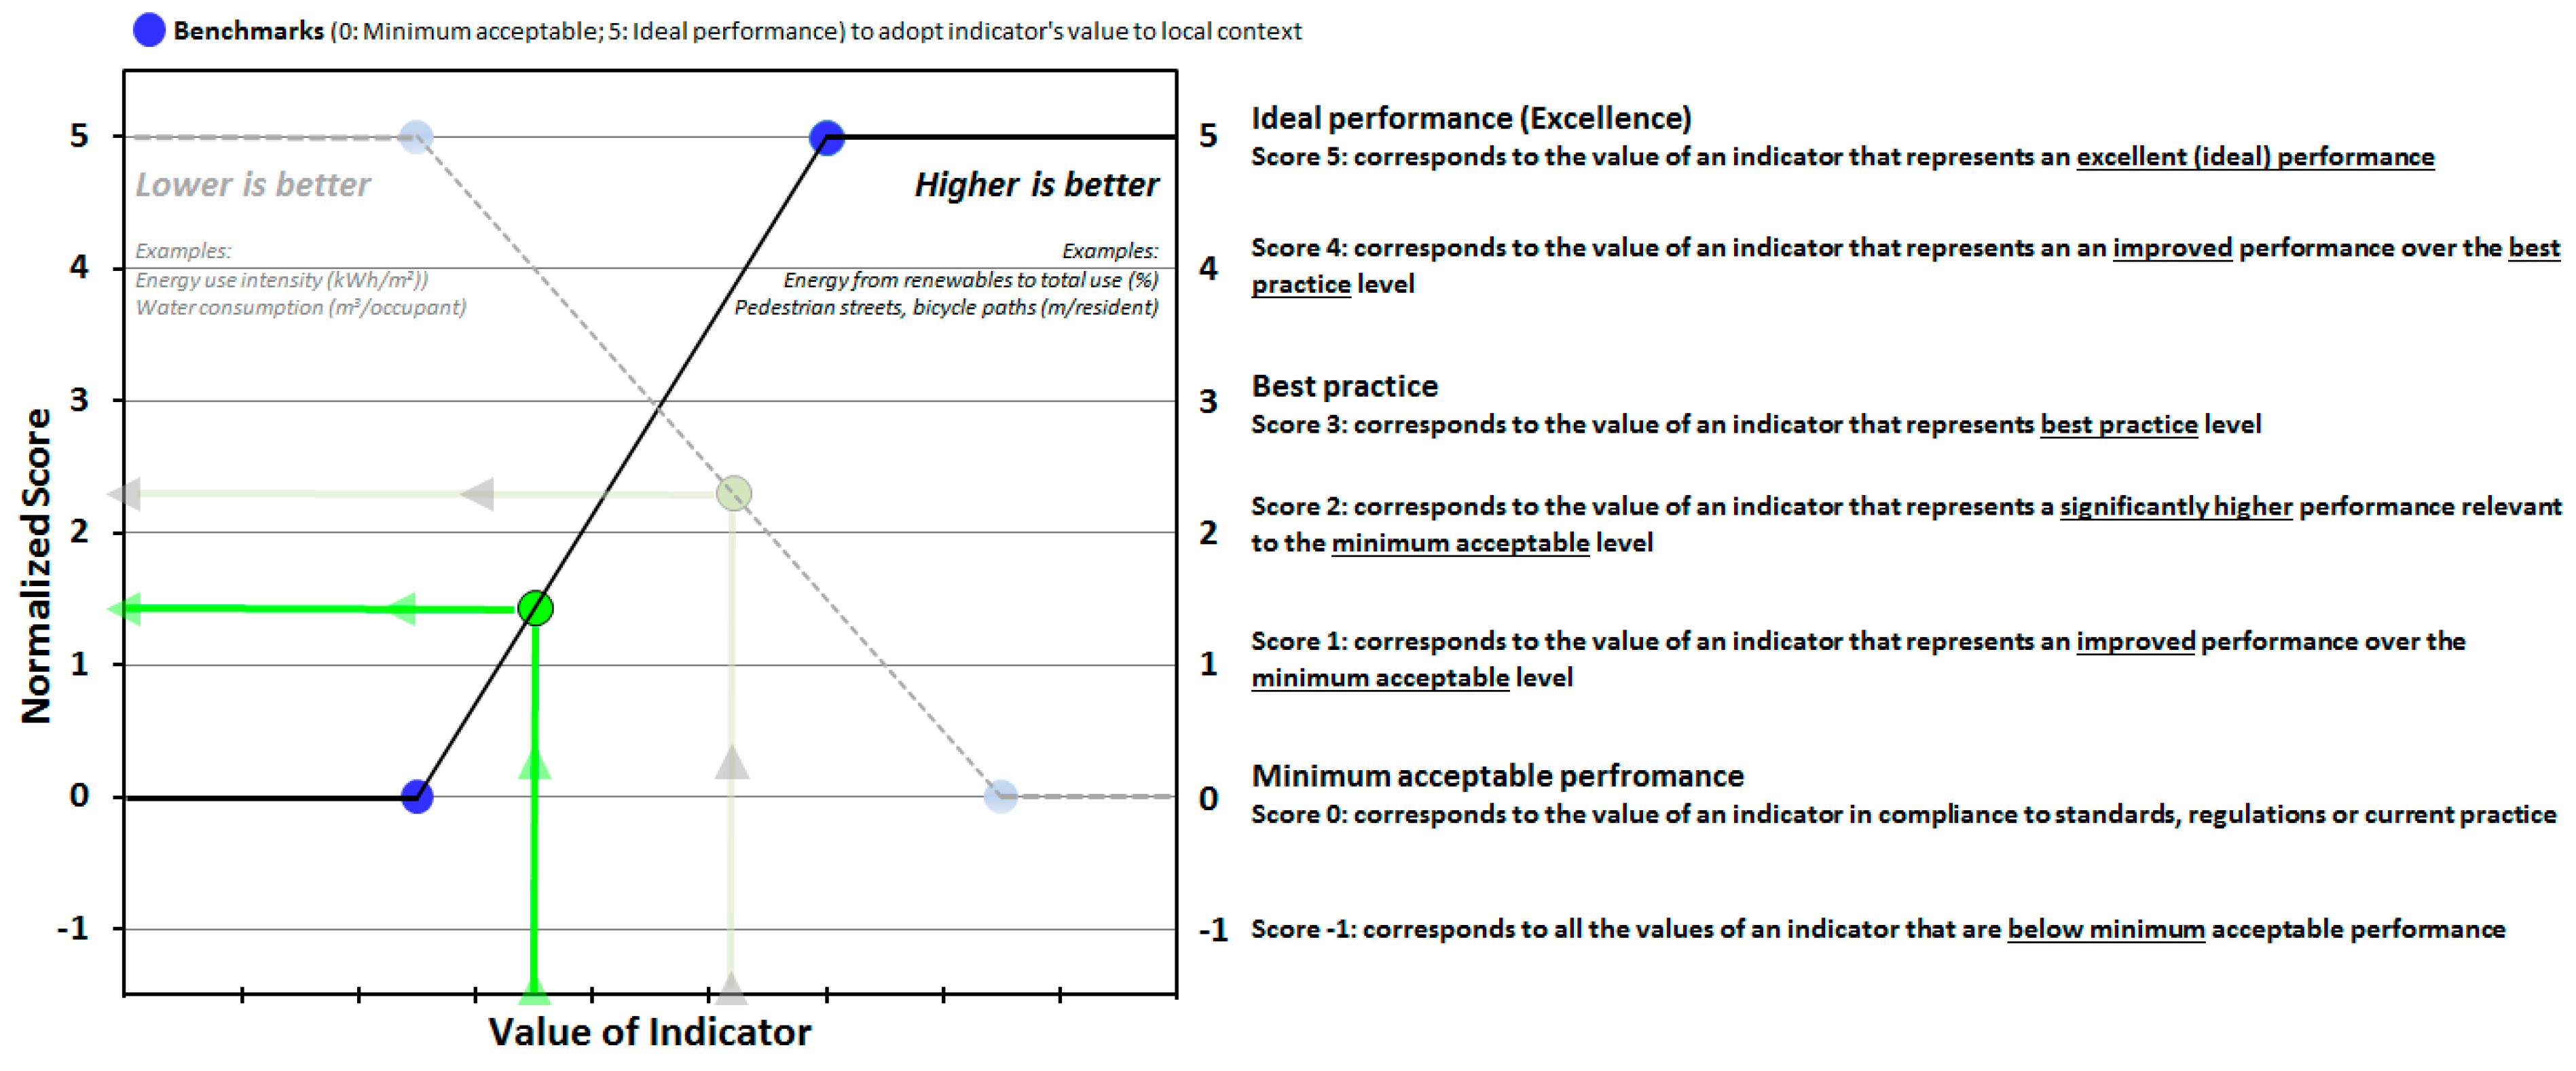
2.2. Normalization and Scoring
2.2.1. Indicator Scores
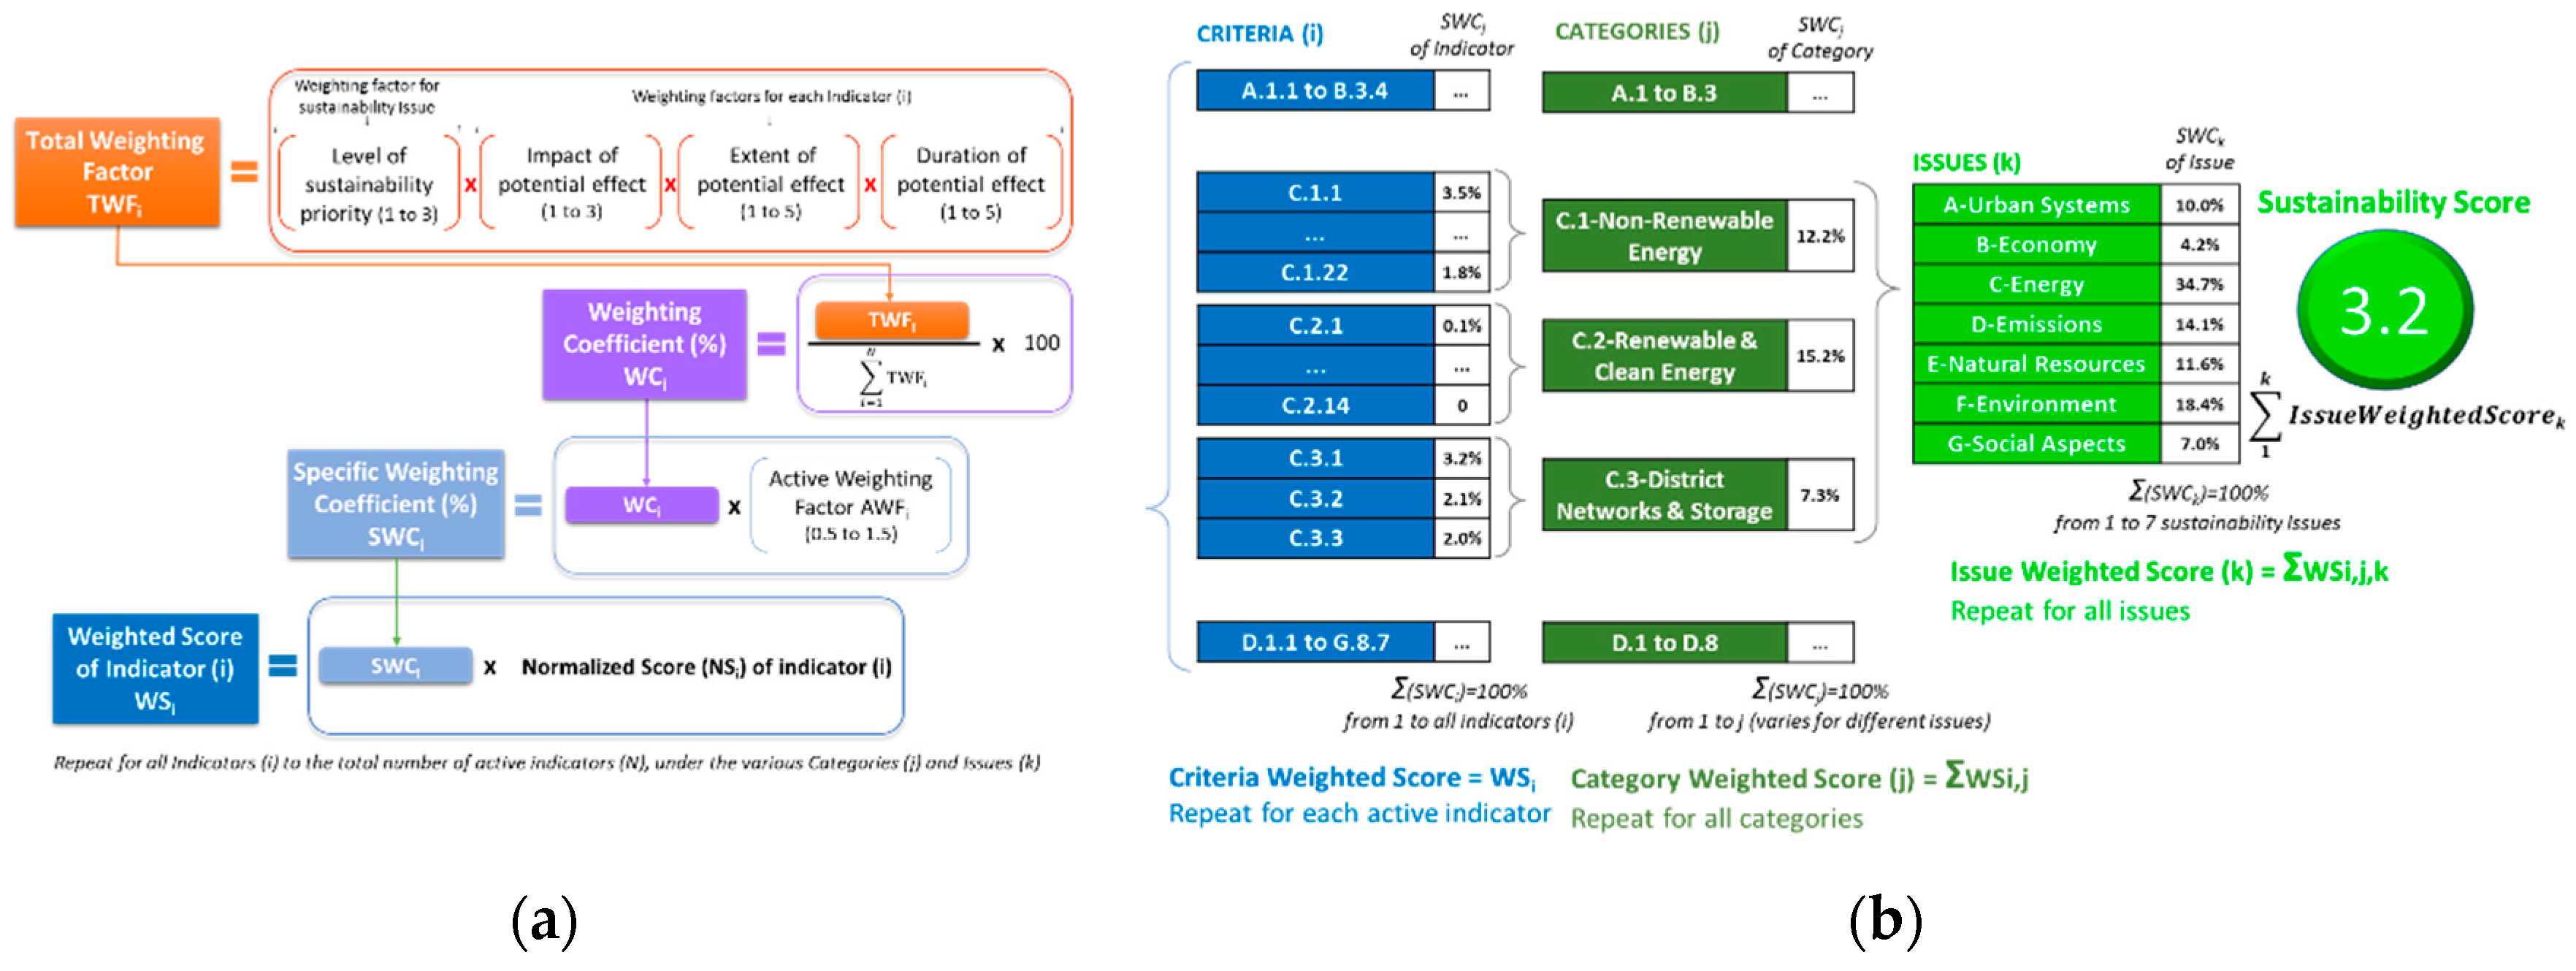
2.2.2. Sustainability Score
- Level of sustainability priority for the Issue that includes the specific indicator, which is rated using a 1 to 3 points scale described above, and for each Indicator the:
- Impact of potential effect, rated using a 1 to 3 points scale, i.e., 1-minor, 2-moderate, 3-major),
- Extent of potential effect, rated using a 1 to 5 points scale depending on the spatial coverage, i.e., 1-block, 2-neighborhood, 3-district, 4-urban/region, 5-global),
- Duration of potential effect, rated using a 1 to 5 points scale, i.e., 1 for 1 to 3 years, 2 for 3 to 10 years, 3 for 10 to 30 years, 4 for 30 to 75 years, 5 for greater than 75 years).
2.2.3. The Generic Framework
2.2.4. The GF Tools
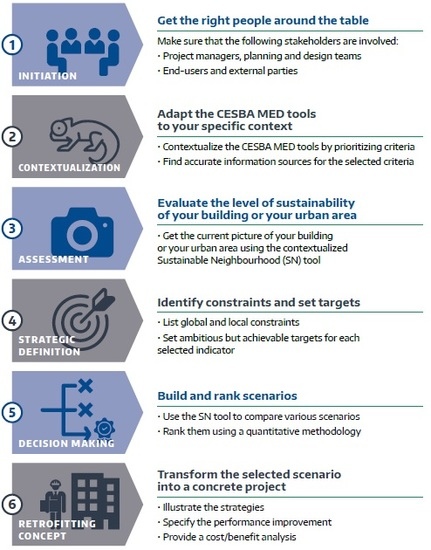
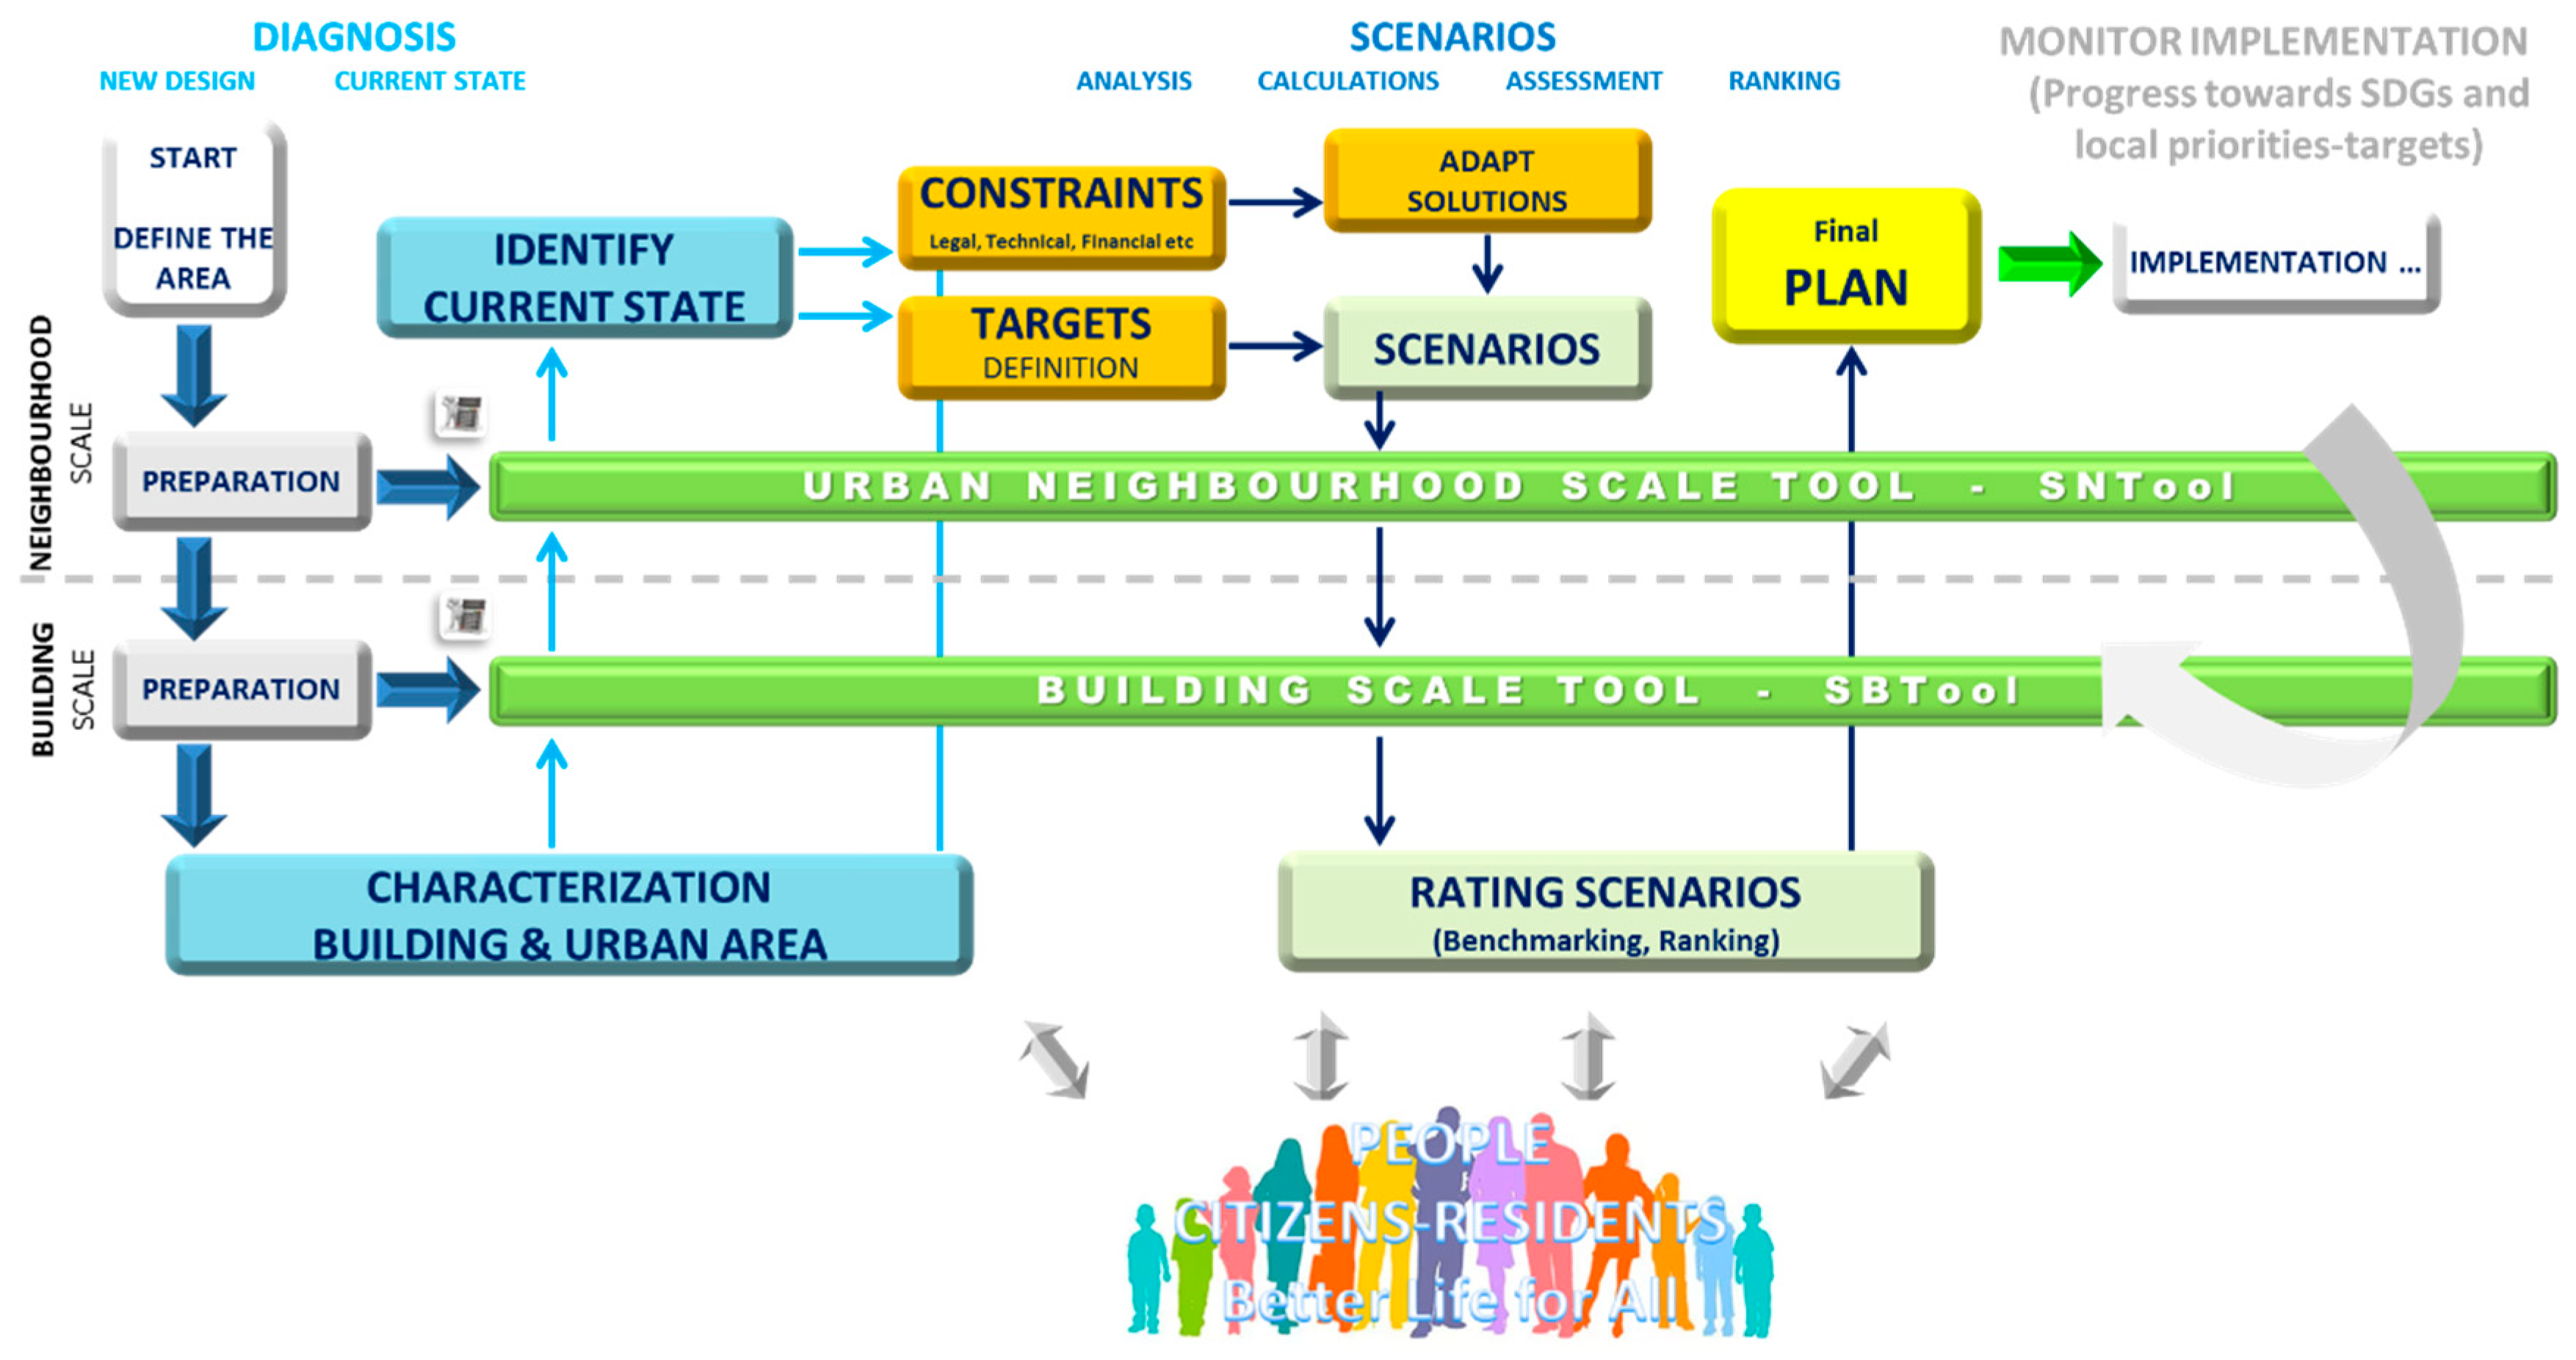
2.3. The Decision Making Process
2.3.1. Diagnosis
2.3.2. Scenarios
2.4. Training System
3. Results and Discussion
3.1. National Tools
3.2. Results from the Hellenic Pilot
4. Conclusions
Author Contributions
Funding
Acknowledgments
Conflicts of Interest
Appendix A

| Building Scale | |
|---|---|
| Issues | Categories |
| A—Site and Infrastructures | A.1—Site Regeneration and Development |
| A.1.1 Protection and restoration of wetlands (expert assessment, score); A.1.2 Protection and restoration of coastal environments (expert assessment, score); A.1.3 Reforestation for carbon sequestration, soil stability and biodiversity (expert assessment, score); A.1.4 Development or maintenance of wildlife corridors (expert assessment, score); A.1.5 Remediation of contaminated soil, groundwater or surface water (expert assessment, score); A.1.6 Shading of building(s) by deciduous trees (%); A.1.7 Use of vegetation to provide ambient outdoor cooling (ratio of total vegetated surface area by total site area); A.1.8 Use of native plant types (%); A.1.9 Provision of public open spaces (% of land within the site); A.1.10 Provision and quality of children’s play areas (expert assessment, score); A.1.11 Facilities for small-scale food production for residential occupants (expert assessment, score); A.1.12 Provision and quality of bicycle pathways and parking (expert assessment, score); A.1.13 Provision and quality of walkways for pedestrian use (expert assessment, score) | |
| A.2—Urban Design | |
| A.2.1 Efficiency of land use through development density (%); A.2.2 Need for commuting transportation through provision of mixed uses at site (expert assessment, score); A.2.3 Impact of orientation on the passive solar potential of building (expert assessment, score); A.2.4 Impact of site and building orientation on natural ventilation during warm seasons (wind pressure differential in Pa); A.2.5 Impact of site and building orientation on natural ventilation during cold seasons (wind pressure differential in Pa) | |
| A.3—Project Infrastructures and Services | |
| A.3.1 Supply, storage and distribution of surplus thermal energy amongst buildings (%); A.3.2 Supply, storage and distribution of surplus PV electrical energy amongst buildings (%); A.3.3 Supply, storage and distribution of surplus hot water amongst buildings (%); A.3.4 Supply, storage and distribution of surplus rainwater and greywater amongst buildings (%); A.3.5 Provision of facility to produce energy from solid waste (expert assessment, score); A.3.6 Provision of solid waste collection and sorting services (expert assessment, score); A.3.7 Composting and re-use of organic sludge (expert assessment, score); A.3.8 Provision of split grey/potable water services (%); A.3.9 Provision of surface water management system (expert assessment, score); A.3.10 On-site treatment of rainwater, storm water and greywater (expert assessment, score); A.3.11 On-site treatment of liquid sanitary waste (%); A.3.12 Provision of on-site communal transportation systems (expert assessment, score); A.3.13 Provision of on-site parking facilities for private vehicles (%); A.3.14 Connectivity of roadways (Mean distance between intersections, m); A.3.15 Provision of access roads and facilities for freight or delivery (expert assessment, score); A.3.16 Provision and quality of exterior lighting (expert assessment, score) | |
| B—Energy and Resources | B.1—Life Cycle Non-Renewable Energy |
| B.1.1 * Primary energy use (kWh/m2/y); B.1.2 * Final thermal energy use (kWh/m2/y); B.1.3 * Final electrical energy use (kWh/m2/y); B.1.4 Energy from renewables to total primary energy (%); B.1.5 * Renewables in final thermal energy use (%); B.1.6 * Renewables in final electrical energy use (%); B.1.7 Use of renewable energy for all building operations (kWh/m2/y); B.1.8 Use of non-renewable energy for all building operations (kWh/m2/y); B.1.9 Consumption of non-renewable energy for project-related transportation-commuting (kWh/m2/y); B.1.10 * Embodied non-renewable primary energy (MJ/m2/y) | |
| B.2—Electricity Peak Demand | |
| B.2.1 Electrical peak demand for building operations (W/m2); B.2.2 Scheduling of building operations to reduce peak loads on generating facilities (W/m2) | |
| B.3—Materials | |
| B.3.1 Re-use of suitable existing structures (%); B.3.2 Protection of materials during construction phase (expert assessment, score); B.3.3 Efficient use of material quantities for structural and building envelope components (kg/m3); B.3.4 Use of virgin non-renewable materials (%); B.3.5 Use of recycled materials (%); B.3.6 Efficient use of finishing materials (%); B.3.7 Ease of disassembly, re-use or recycling (expert assessment, score) | |
| B.4—Potable-, Rain-, Grey-Water | |
| B.4.1 Embodied water in original construction materials (Lt/m3); B.4.2 Water consumption for indoor uses (m3/m2/y); B.4.3 Use of water for irrigation purposes (m3/m2/y); B.4.4 Use of water for building systems (m3/m2/y); B.4.5 * Potable water consumption for indoor uses (m3/occupant/y) | |
| C—Environment | C.1—Greenhouse Gas Emissions |
| C.1.1 Emissions from embodied energy in original construction materials (kgCO2-eq/m2); C.1.2 Emissions from embodied energy in construction materials used for maintenance or replacement (kgCO2-eq/m2); C.1.3 * Global Warming Potential (kgCO2-eq/m2/y) | |
| C.2—Other Atmospheric Emissions | |
| C.2.1 Emissions of ozone-depleting substances during facility operations (leaks CFCeq g/m2/y); C.2.2 Acidifying emissions during facility operations (SO2eq kg/m2/y); C.2.3 Emissions leading to photo-oxidants during facility operations (Ethene eq. kg/m2/y) | |
| C.3—Solid and Liquid Wastes | |
| C.3.1* Construction and demolition waste during life cycle (kg/m2); C.3.2 Solid waste categories recycled (%); C.3.3 Liquid effluents from building operations transported off the site (m3/y) | |
| C.4—Impacts on Project Site | |
| C.4.1 Recharge of groundwater through permeable paving or landscaping (%); C.4.2 Changes in biodiversity on the site (expert assessment, score); C.4.3 Adverse wind conditions at grade around tall buildings (expert assessment, score) | |
| C.5—Other Local and Regional Impacts | |
| C.5.1 Impact of building on access to daylight or solar energy potential of adjacent property (%); C.5.2 Impact of construction process on local residents and commercial facility users (expert assessment, score); C.5.3 Impact of building occupancy on peak load capacity of public transportation (%); C.5.4 Impact of private vehicles used by building occupants on peak load capacity of local road system (%); C.5.5 Potential for project operations to contaminate nearby water aquifer or wetland (m); C.5.6 Annual thermal changes to lake water or sub-surface aquifers (°C); C.5.7 Contribution to Heat Island Effect from roofing, landscaping and paved areas (variance °C); C.5.8 Atmospheric light pollution caused by project exterior lighting (%) | |
| D—Indoor Environmental Quality (IEQ) | D.1—Indoor Air Quality and Ventilation |
| D.1.1 Pollutant migration between occupancies (expert assessment, score); D.1.2 Formaldehyde concentration (μg/m3); D.1.3 * TVOC concentration in indoor air (μg/m3); D.1.4 CO2 concentrations in indoor air (ppm); D.1.5 Effectiveness of natural ventilation during cooling season (ach); D.1.6 Effectiveness of natural ventilation during intermediate seasons (ach); D.1.7 Effectiveness of natural ventilation during heating season (ach); D.1.8 Air movement in mechanically ventilated occupancies (m/s); D.1.9 * Ventilation rate (Lt/s/m2) | |
| D.2—Air Temperature and Humidity | |
| D.2.1 Time outside of thermal comfort range (%); D.2.2 * Thermal comfort index (PPD %); D.2.3 Appropriate air temperature and relative humidity in mechanically cooled occupancies (expert assessment, score); D.2.4 Appropriate air temperature in naturally ventilated occupancies (expert assessment, score) | |
| D.3—Daylight and Illumination | |
| D.3.1 Appropriate daylighting in primary occupancy areas (DF %); D.3.2 Control of glare from daylighting (max ratio of contrast) | |
| D.4—Noise and Acoustics | |
| D.4.1 Noise attenuation through the exterior envelope (STC); D.4.2 Transmission of facility equipment noise to primary occupancies (NRC); D.4.3 Noise attenuation between primary occupancy areas (STC) | |
| E—Service Quality | E.1—Safety and Security |
| E.1.1 Risk to occupants and facilities from fire (expert assessment, score); E.1.2 Risk to occupants and facilities from flooding (expert assessment, score); E.1.3 Risk to occupants and facilities from earthquake (expert assessment, score); E.1.4 Risk to occupants from incidents involving biological or chemical substances (expert assessment, score); E.1.5 Maintenance of core building functions during power outages (days); E.1.6 Personal security for building users during normal operations (expert assessment, score) | |
| E.2—Functionality and Efficiency | |
| E.2.1 Appropriateness of type of facilities for occupant needs (expert assessment, score); E.2.2 Suitability of interior layout(s) for required functions (expert assessment, score); E.2.3 Appropriateness of space for required functions (expert assessment, score); E.2.4 Exterior access and unloading facilities for freight or delivery (expert assessment, score); E.2.5 Service quality and efficiency of vertical or horizontal transportation systems (expert assessment, score); E.2.6 Spatial efficiency (%); E.2.7 Volumetric efficiency (%) | |
| E.3—Controllability | |
| E.3.1 Effectiveness of facility management control system (expert assessment, score); E.3.2 Capability for partial operation of facility technical systems (expert assessment, score); E.3.3 Degree of local control of lighting systems (m2); E.3.4 Degree of personal control of technical systems by occupants (expert assessment, score) | |
| E.4—Flexibility and Adaptability | |
| E.4.1 Ability for building operator or tenant to modify facility technical systems (expert assessment, score); E.4.2 Potential for horizontal or vertical extension of structure (expert assessment, score); E.4.3 Adaptability constraints imposed by structure or floor-to-floor heights (expert assessment, score); E.4.4 Adaptability constraints imposed by building envelope and technical systems (expert assessment, score); E.4.5 Adaptability to future changes in type of energy supply (expert assessment, score) | |
| E.5—Operation and Maintenance | |
| E.5.1 Operating functionality and efficiency of key facility systems (expert assessment, score); E.5.2 Adequacy of the building envelope for maintenance of long-term performance (expert assessment, score); E.5.3 Durability of key materials (expert assessment, score); E.5.4 Maintenance management plan (expert assessment, score); E.5.5 On-going monitoring and verification of performance (expert assessment, score); E.5.6 Retention of as-built documents (expert assessment, score) | |
| F—Social, Cultural, Perceptual | F.1—Social Aspects |
| F.1.1 Universal access on-site and within the building (expert assessment, score); F.1.2 Access to direct sunlight from living areas of dwelling units (%); F.1.3 Visual privacy in principal areas of dwelling units (%); F.1.4 Access to private open space from dwelling units (%) | |
| F.2—Culture and Heritage | |
| F.2.1 Compatibility of urban design with local cultural values (expert assessment, score); F.2.2 Provision of public open space compatible with local cultural values (expert assessment, score); F.2.3 Impact of the design on existing streetscapes (expert assessment, score); F.2.4 Use of traditional local materials and techniques (%); F.2.5 Maintenance of the heritage value – external (expert assessment, score); F.2.6 Maintenance of the heritage value—internal (expert assessment, score) | |
| F.3. Perceptual Aspects | |
| F.3.1 Impact of tall structure(s) on existing view corridors (expert assessment, score); F.3.2 Quality of views from tall structures (expert assessment, score); F.3.3 Sway of tall buildings in high wind conditions (m); F.3.4 Perceptual quality of site development (expert assessment, score); F.3.5 Aesthetic quality of facility exterior (expert assessment, score); F.3.6 Aesthetic quality of facility interior (expert assessment, score); F.3.7 Access to exterior views from interior (expert assessment, score) | |
| G—Economy | G.1—Operational Cost |
| G.1.1 Construction cost (€/m2); G.1.2 Operating and maintenance cost (€/m2); G.1.3 Life-cycle cost (€/m2); G.1.4 * Operational energy cost (€/m2/y); G.1.5 * Operational water cost (€/m2/y); G.1.6 Investment risk (expert assessment, score); G.1.7 Affordability of residential rental or cost levels (%) | |
| NEIGHBOURHOOD SCALE | |
|---|---|
| Issues | Categories |
| A—Urban Systems | A.1—Urban Structure and Form |
| A.1.1 Concentration of lots to the total area (%); A.1.2 Urban compactness (m3/m2); A.1.3 Building plot ratios (%); A.1.4 Residential density (inhabitants/hectare); A.1.5 Urban street canyons H/W aspect ratio (%); A.1.6 Homogeneity of the urban fabric (%); A.1.7 * Conservation of land (%) | |
| A.2—Transportation Infrastructure | |
| A.2.1 Walking distance to public transport for area residents (% of residential buildings located within 500m); A.2.2 Walking distance to public transport for area workers and students (%); A.2.3 Extent and connectivity of pedestrian streets and walkways (%); A.2.4 Extent and connectivity of bicycle paths separated from vehicular traffic (km/1000 residents); A.2.5 Cyclomatic complexity of the street network (-); A.2.6 Connectivity of the street network (number/km2); A.2.7 Street network connection and accessibility (%); A.2.8 Scale of the street network (m); A.2.9 On-street and indoor parking spaces relative to local population (%); A.2.10 Intermodality facilities (expert assessment, score) | |
| B—Economy | B.1—Economic Structure and Value |
| B.1.1 Affordability of building property (%); B.1.2 Affordability of building rental (%); A.1.3 Long-term risk for capital investments (%); B.1.4 Impact of land values on adjacent areas (%); B.1.5 Impact of construction and operations on the local economy (%); B.1.6 Percent of building vacancies (%) | |
| B.2—Economic Activity | |
| B.2.1 Income equity for households (GINI index 0-1); A.2.2 Percent of average annual per-capita income of residents to region’s total (%); A.2.3 Employment rate (%); A.2.4 Economic viability of local commercial businesses (%); A.2.5 Economic contribution from tourism activity (€/resident) | |
| B.3—Cost and Investment | |
| B.3.1 Adequacy of social housing (expert assessment, score); B.3.2 Public contribution in residential retrofitting investments (%); B.3.3 * Operational energy costs for public buildings (€/m2/y); B.3.4 Levels of total public and private investment (€/resident) | |
| C—Energy | C.1—Non-Renewable Energy |
| C.1.1 * Total final thermal energy consumption for all buildings (kWh/m2/y); C.1.2 Total final thermal energy consumption for residential buildings (kWh/m2/y); C.1.3 Total final thermal energy consumption for non-residential buildings (kWh/m2/y); C.1.4 * Total final electrical energy consumption for all buildings (kWh/m2/y); C.1.5 Total final electrical energy consumption for residential buildings (kWh/m2/y); C.1.6 Total final electrical energy consumption for non-residential buildings (kWh/m2/y); C.1.7 * Total primary energy consumption for all buildings (kWh/m2/y); C.1.8 Average total primary energy use of residential buildings to the local minimum value (%); C.1.9 Average total primary energy use of non-residential buildings to the local minimum value (%); C.1.10 Average total primary energy use for heating of residential buildings to the local minimum value (%); C.1.11 Average total primary energy use for heating of non-residential buildings to the local minimum value (%); C.1.12 Average total primary energy use for cooling of residential buildings to the local minimum value (%); C.1.13 Average total primary energy use for cooling of non-residential buildings to the local minimum value (%); C.1.14 Average total primary energy use for DHW of residential buildings to the local minimum value (%); C.1.15 Average total primary energy use for DHW of non-residential buildings to the local minimum value (%); C.1.16 Average total primary energy use for indoor lighting of residential buildings to the local minimum value (%); C.1.17 Average total primary energy use for indoor lighting of non-residential buildings to the local minimum value (%); C.1.18 Electrical peak demand for non-residential buildings (MW); C.1.19 Time periods of electrical peak loads (h/y); C.1.20 Energy use for public lighting (kWh/m2/y); C.1.21 Energy use for local public transport (km/MJ); C.1.22 Final energy use for building demolition or dismantling (kWh/m2/y) | |
| C.2—Renewable and Clean Energy | |
| C.2.1 * On-site renewables in total final thermal energy consumption for all buildings (%); C.2.2 On-site renewables in total final energy consumption for residential buildings (%); C.2.3 On-site renewables in total final energy consumption for non-residential buildings (%); C.2.4 On-site renewables in total primary energy consumption for all buildings (%); C.2.5 On-site renewables in total primary energy consumption for residential buildings (%); C.2.6 On-site renewables in total primary energy consumption for non-residential buildings (%); C.2.7 * On-site renewables in total final electrical energy consumption for all buildings (%); C.2.8 Aggregated electrical energy generation from renewables located on public properties (MWh/y); C.2.9 Aggregated electrical energy generation from renewables located on private properties (MWh/y); C.2.10 Aggregated electrical energy generated from renewables that is exported from the local area (MWh/y); C.2.11 Percentage of electrical energy use from renewables (%); C.2.12 Aggregated thermal energy generation from renewables located on public properties (MWh/y); C.2.13 Aggregated thermal energy generation from renewables located on private properties (MWh/y); C.2.14 Aggregated thermal energy generated from renewables that is exported from the local area (MWh/y) | |
| C.3—District Networks and Storage | |
| C.3.1 Waste heat recovery from building operations (%); C.3.2 Mid- and long-term thermal storage capacity of geothermal energy sinks (%); C.3.3 Mid-term storage of electrical energy (GWh) | |
| D—Emissions | D.1—Atmospheric Pollution |
| D.1.1 GHG emissions from embodied energy in materials used for construction, maintenance or replacements (tons CO2eq./1000 m2); D.1.2 * Total GHG emissions from energy use in buildings (kgCO2eq./m2/y); D.1.3 Aggregate ozone-depleting emissions from 3-year building operations (tons CO2eq./1000 m2); D.1.4 Aggregate of acidifying-emissions from 5-year building operations (kg CO2eq./1000 m2); D.1.5 Aggregate GHG emissions from the use of private vehicles (tons CO2eq./y); D.1.6 Aggregate GHG emissions from the use of public transport (tons CO2eq./10,000 passengers); D.1.7 Total GHG Emissions from buildings, private and public mobility (tons CO2eq./1000 residents) | |
| E—Natural Resources | E.1—Potable-, Rain-, Grey-Water |
| E.1.1 Availability of a public municipal water supply (%); E.1.2 Provision of split grey/potable water services in buildings (%); E.1.3 Re-use of rainwater in residential buildings (%); E.1.4 Re-use of rainwater in non-residential buildings (%); E.1.5 Re-use of storm water (%); E.1.6 * Water consumption in residential buildings (m3/occupant/y); E.1.7 *Water consumption in non-residential buildings (m3/m2/y); E.1.8 Consumption of potable water for irrigation purposes (m3/1000 m2/y); E.1.9 Intensity of water purification treatment (kWh/m3/y) | |
| E.2—Solid and Liquid Wastes | |
| E.2.1 Proximity of residents to solid waste and recycling collection points (%); E.2.2 Separate collection and disposal of solid waste and recycling (%); E.2.3 Solid waste from construction and demolition projects retained in the area for re-use or recycling (%); E.2.4 Solid waste from residents’ activities and facility operations sent out of the area for re-use, recycling or disposal (%); E.2.5 Composting and re-use of organic sludge (%); E.2.6 Public wastewater that is disposed or treated (%); E.2.7 Liquid effluents from building operations that are exported (%); E.2.8 Potential for building operations to contaminate nearby bodies of water (expert assessment, score); E.2.9 Cumulative annual thermal changes to lake water or sub-surface aquifers (expert assessment, score) | |
| E.3—Usage, Retention and Maintenance | |
| E.3.1 Consumption of non-renewable material resources for building construction or renovation (Tons/1000 m2); E.3.2 Efficient use of materials for construction of infrastructures (Tons/1000 m2); E.3.3 Reused or recycled materials for building construction or renovation (%); E.3.4 Adaptive re-use of existing buildings and structures (%); E.3.5 Preservation and maintenance of existing buildings and structures (expert assessment, score); E.3.6 Heritage preservation of existing buildings (expert assessment, score) | |
| F—Environment | F.1—Environmental Impacts |
| F.1.1 Impact of construction activities on natural environment and land preservation (expert assessment, score); F.1.2 Impact of construction activities or landscaping on soil stability or erosion (expert assessment, score); F.1.3 * Recharge of groundwater through permeable paving/landscaping (%); F.1.4 Impacts on local biodiversity (expert assessment, score); F.1.5 Urban heat island effects (°C); F.1.6 Impact on access to daylight or solar energy potential of contiguous buildings (%); F.1.7 Impact of local building user population on peak load capacity of public transport system (%); F.1.8 Impact of private vehicles used by local population on peak load capacity of the local road network (expert assessment, score); F.1.9 Atmospheric light pollution from exterior lighting systems of building (Night sky brightness cd/m2); F.1.10 Atmospheric light pollution from public lighting (Night sky brightness cd/m2); F.1.11 Albedo of building and paving surfaces (number); | |
| F.2—Outdoor Environmental Quality | |
| F.2.1 Ambient air quality (PM2.5) above acceptable limits (days/y); F.2.2 Ambient air quality (PM2.5) above acceptable limits over a week (days/week); F.2.3 * Ambient air quality (PM10) above acceptable limits (days/y); F.2.4 Ambient air quality (PM10) above acceptable limits over a week (days/week); F.2.5 Ambient air quality (CO) above acceptable limits (days/y); F.2.6 Ambient air quality (O3) above acceptable limits (days/y); F.2.7 Olfactory air quality (odours) in the area (number of anecdotal reports/y); F.2.8 Adverse wind conditions at grade around low-rise buildings (expert assessment, score); F.2.9 Adverse wind conditions at grade around high-rise buildings (expert assessment, score); F.2.10 Area above acceptable ambient daytime noise limits (%); F.2.11 Area above acceptable ambient nigh time noise limits (%); F.2.12 Summer thermal comfort conditions (SET); F.2.13 Winter thermal comfort conditions (SET) | |
| F.3—Ecosystems and Landscape | |
| F.3.1 Green zones and recreation areas availability (%); F.3.2 Proximity to green zones and recreation areas (m); F.3.3 Green zones and recreation areas density (%); F.3.4 Contamination of soil and water resources in undeveloped land (%); F.3.4 Surface water management to prevent flooding (expert assessment, score); F.3.6 Tree shade open area coverage (%); F.3.7 Green roofs (%); F.3.8 Vegetated walls and other building surfaces (m2); F.3.9 Presence or potential for wildlife corridors (expert assessment, score); F.3.10 Ecological diversity (expert assessment, score); F.3.11 Ecological sensitivity (expert assessment, score); F.3.12 Walking or bicycling nature trails (km/1000 residents); F.3.13 Condition of surface freshwater systems (expert assessment, score); F.3.13 Condition of groundwater and subsurface aquifers (expert assessment, score); F.3.14 Viability of adjacent wetlands and urban marine environments (expert assessment, score) | |
| G—Social Aspects | G.1—Accessibility and Safety |
| G.1.1 Building accessibility by physically disabled persons (%); G.1.2 Sidewalks and other pedestrian paths accessibility by physically disabled persons (%); G.1.3 Barrier-free accessibility in outdoor public areas (%); G.1.4 Accessibility to and use of public transport for physically disabled persons (%); G.1.5 Adequacy of signage and traffic safety measures (expert assessment, score) | |
| G.2—Traffic and Mobility Services | |
| G.2.1 * Proximity of residents to public transport (%); G.2.2 Availability of car sharing services (%); G.2.3 Measures to limit passing through car and truck traffic (expert assessment, score); G.2.4 * Pedestrian and bicycle network (m/100 inhabitants); G.2.5 Availability of sheltered bicycle parking facilities (%) | |
| G.3—Communication Services | |
| G.3.1 Coverage of broadband communication network (%); G.3.2 Access to a broadband communication network (%) | |
| G.4—Facilities and Services | |
| G.4.1 Availability and proximity of key food and retail services (%); G.4.2 * Proximity of residents to key services (%); G.4.3 Proximity of residents to a primary school (%); G.4.4 Proximity of residents to a secondary school (%); G.4.5 Proximity of residents to children’s’ play facilities (%); G.4.6 Proximity of residents to leisure facilities (%); G.4.7 Proximity of residents to indoor sports facilities (%) | |
| G.5—Local Food Production | |
| G.5.1 Local food production (m²/inhabitant); G.5.2 Residents’ access to and use of urban agricultural plots (%) | |
| G.6—Management and Community Involvement | |
| G.6.1 Involvement of residents in community affairs (%); G.6.2 Community management of urban facilities and urban spaces (%); G.6.3 * Community involvement in urban planning activities (expert assessment, score); G.6.4 Individual access to community facilities and key services during off-hours (%) | |
| G.7—Society, Culture, Heritage | |
| G.7.1 Compatibility of urban design with local cultural values (expert assessment, score); G.7.2 Compatibility of public open space with local cultural values (expert assessment, score); G.7.3 Compatibility of new building designs with existing streetscapes (expert assessment, score); G.7.4 Use of traditional local materials and techniques (expert assessment, score); G.7.5 Maintenance of UNESCO or other protected landscapes (expert assessment, score) | |
| G.8—Acceptance and Perception of Conditions | |
| G.8.1 Impact of tall structure(s) on existing view corridors (expert assessment, score); G.8.2 Panoramic and scenic routes or viewpoints (expert assessment, score); G.8.3 Perceived safety of public areas for pedestrians (expert assessment, score); G.8.4 Impact of commercial signage on the visual environment (expert assessment, score); G.8.5 Impact of overhead electric distribution system on the visual environment (expert assessment, score); G.8.6 Perceptual quality of area development (expert assessment, score); G.8.7 Aesthetic quality of new facility exteriors (expert assessment, score) | |
Appendix B
| Italy (A) | Neighbourhood pre1950 with mixed uses: 1.1 km2, 613 buildings, social housing (101,109 m2), other (93,099 m2); 12,607 inhabitants; recently has undergone a major urban transformation (e.g., underground railway to reunite parts of divided urban areas, new low circulation roads). KPIs *: 0.5/8.2/235/78.2/403/0/1.23/86/63.5/0.8/17.2/118/100/12.1/100/0 Sustainability scores **: 0.4/0.1/1/−1/0.9/−1/2.6; Total: 0.62 |
| Italy (B) | Neighbourhood for social housing: 1 km2, 333 buildings, residential (226,983 m2) and commercial (3960 m2) buildings; 4455 inhabitants. KPIs *: 7.2/9.7/76.3/17.4/252/3/3/34/48.7/0.9/61/22/90.1/84.9/97.3/4 Sustainability scores **: 4.6/0.9/−1/0.3/1.2/2.3/2.3; Total: 1.42 Scenario: Renovate two building; Redevelop area used as barracks (construct some new buildings and recover some existing structures); Develop new sports areas, green spaces, access roads; Introduce new services for residents; Motivate local food production for personal use; Enable participative involvement of residents KPIs *: 7.2/9.7/74.3/17.4/181.1/3/3.1/33.9/48.7/0.9/60.8/22/90.1/84.9/97.3/5 Sustainability scores **: 4.6/0.9/−1/1.1/1.2/2.4/3.4; Total: 1.75 |
| France (A) | Urban renewal area: 1.2 km2, 3600 residential buildings, 1372 social housing; 11,000 inhabitants. KPIs *: 7/NA/NA/NA/NA/NA/NA/NA/50/NA/NA/8/97/63.4/100/3.5 Sustainability scores **: −1/NA/NA/NA/1/NA/3.8; Total: 0.57 |
| France (B) | New development of an industrial and urban brownfield: 0.08 km2, 23 buildings, residential (95,000 m2), office (25,000 m2) and commercial (8600 m2) buildings; 4700 inhabitants. KPIs *: 0/5.9/41/7/53/32/25/8/62/8/30/11.5/80/94/100/3 Sustainability scores **: NA/3.8/1/5/2.2/4.1/3.8; Total: 3.30 |
| Spain (A) | Building block with mixed uses: 0.013 km2, 17 buildings, 19th and early 20th century residential (56,750 m2), office (2468 m2) and retail (5736 m2) buildings, with Art Nouveau architecture; 766 inhabitants, 1750 daytime working population. KPIs *: 0/16.6/54.8/53.3/172.2/1.2/0.73/26.4/35.8/0.58/0.12/5/100/115.5/100/2 Sustainability scores **: 1.3/1.4/−1/0.9/5/1.7/4.8; Total: 1.64 Scenario: Form a cooperative among building owners to finance renovations, Recover space for public use, Reduce loads (insulate building envelopes, green roofs) and energy costs, Exploit renewables (building-integrated PVs), Use efficient equipment (heat pumps for heating, cooling, DHW), Reduce emissions, Remove access barriers to buildings, Improve IEQ KPIs *: 4.0/10.0/20.1/75/75/40/40/20/25/0.10/10/0/100/250/100/3 Sustainability scores **: 1.9/4.4/2.8/2.5/5.0/1.7/4.8; Total: 3.08 |
| Spain (B) | Neighbourhood with mixed uses: 0.44 km2, 625 buildings, residential (560,673 m2), office (554,869 m2) and retail (537,203 m2) buildings; 11,060 inhabitants. KPIs *: 2.7/7.1/47.5/33.3/124.6/1.6/0.03/31.2/49.1/4.9/15.4/6.7/100/16.2/100/2 Sustainability scores **: 1.9/2.2/−1/−1/4.4/1.8/3.8; Total: 1.02 Scenario: Expand pedestrian streets; Encourage light mobility (reduce emissions, noise); Expand green and leisure areas (reduce heat island effects) KPIs *: 2.7/7.1/47.5/33.3/1.6/0.9/0.03/31.2/49.1/4.9/15.4/6.7/100/30/100/4 Sustainability scores **: 2.1/2.2/−1/0.1/4.4/2.1/4.4; Total: 1.60 |
| Malta | University Campus: 0.27 km2, 30 buildings, office (194,674 m2) and retail (1296 m2) buildings; Daytime population 14,000 people. KPIs *: 27.9/NA/16.1/103.2/233.8/64/16.4/76.5/NA/7.9/18.3/12.6/60/26/100/3 Sustainability scores **: 2.7/2.7/1.8/0.3/3.1/0.5/2.8; Total: 1.85 |
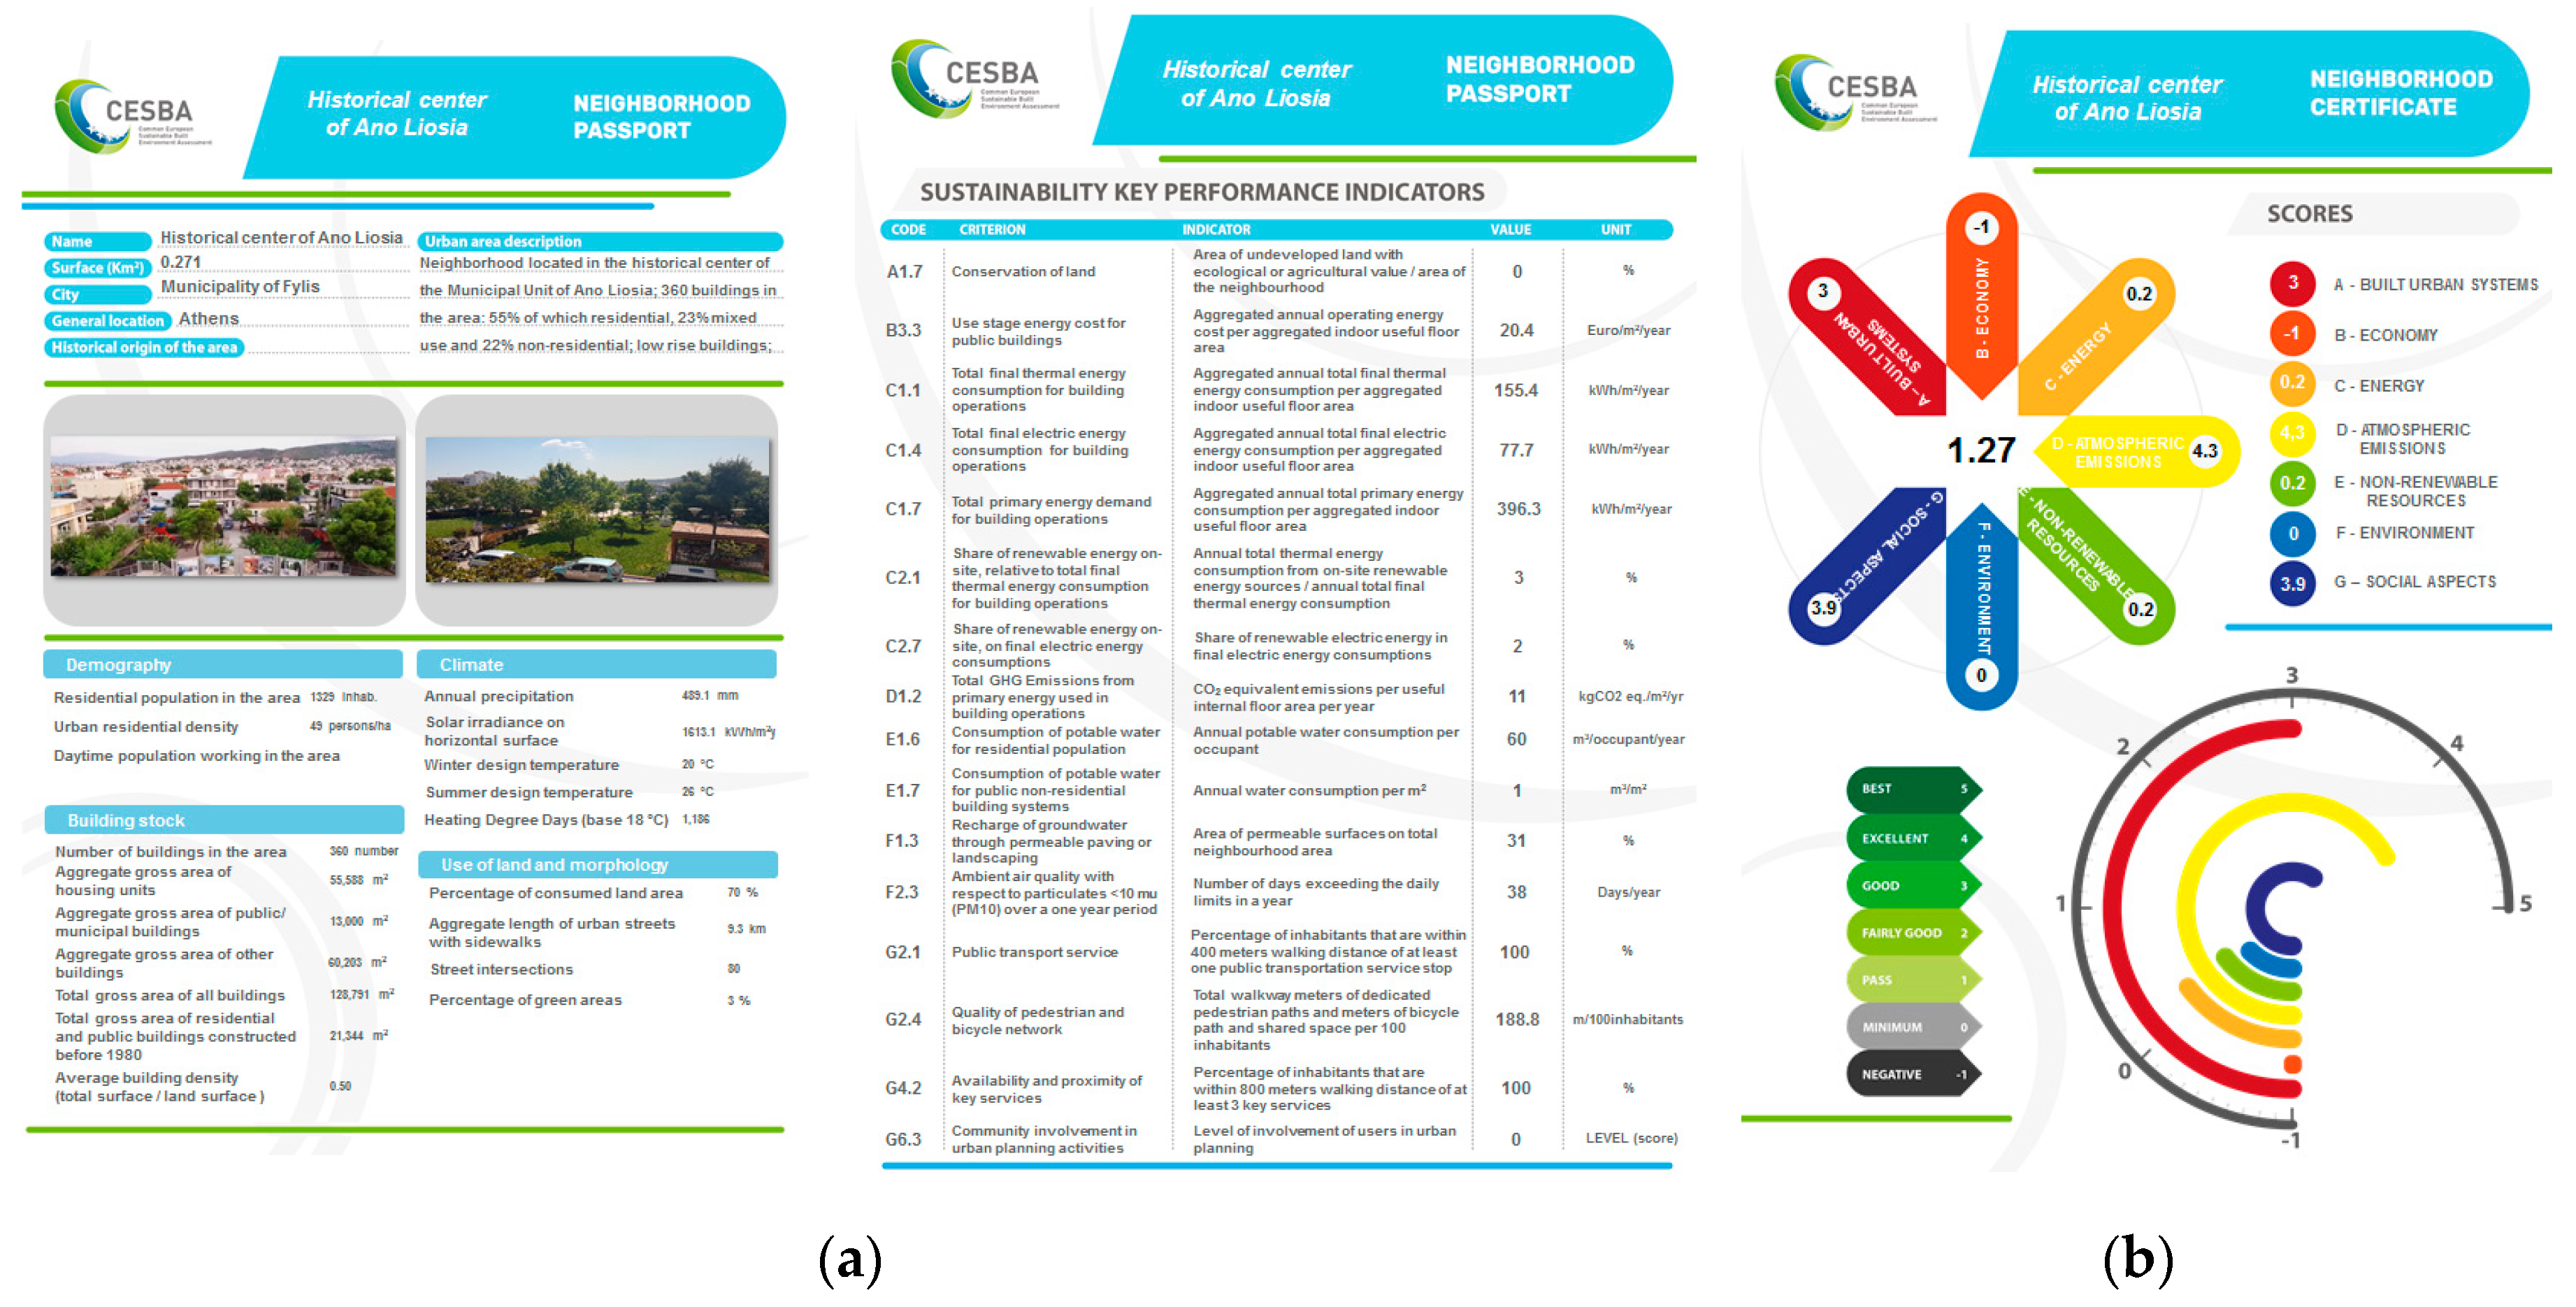
| Greece | Neighbourhood historical centre with mixed uses: 0.271 km2, 360 buildings, residential (55,588 m2), office (13,000 m2) and retail (60,203 m2) buildings; 1329 inhabitants. KPIs *: 0/20.4/155.4/77.7/396.3/3/2/11/60/1/31/38/100/188.8/100/0 Sustainability scores **: 3/−1/0.2/4.3/0.2/0/3.9; Total: 1.27 Scenario: Form an energy community and work towards power generation from renewables to cover needs for municipal buildings and low income households; Exploit renewables (roof PVs on public buildings); Use efficient equipment (high performance heat pumps for heating, cooling); Connect all buildings to new natural gas central network; Replace all lighting fixtures in public spaces with LED; Increase recycling collection bins; Reintroduce municipality transportation with two lines; Improve safety KPIs *: 0/1.9/132.0/72.1/341.4/4/6/6.5/59.5/0.6/31/38/100/188.8/100/1 Sustainability scores **: 3.1/−1/2.2/4.8/1.9/0/4.1; Total: 2.24 |
| Croatia | Neighbourhood with mixed uses: 0.95 km2, 354 buildings, residential (32,376 m2) and commercial (4000 m2) buildings; 1368 inhabitants. KPIs *: 2/8/64/194/147/3/0/22/49/3.8/79/−/40/138.9/0/0 Sustainability scores **: 1.5/3.2/0.2/1.0/2.1/1.0/0.6; Total: 1.03 Scenario: Encourage electromobility (install fast-charging stations, provide electric bicycles and scooters for public use); Refurbish family houses (target 40 households, renovate building envelopes to reduce loads, install high performance heat pumps or wood pellet boilers, and install roof PVs); Implement passive measures to reduce energy demand in residential buildings and reduce urban heat island effect; Promote the use of stone or recycled materials for paving pedestrian paths; Increase natural ground areas and green open spaces to reduce flood risk; Promote the use of rainwater for irrigation; Increase local food production and exchange of eco-food production to cover half of the total local demand; Collect local biomass for composting and/or heating/cooking; Enable participative involvement of residents. KPIs *: 2/8/53/60/139/11/20/22/100/3.8/79/20.8/70/138.9/0/3 Sustainability scores **: 1.5/4.4/1.9/2.5/3.9/1.0/3.2; Total: 2.58 |
References
- Eurostat. Energy Statistical Country Datasheets; European Commission, DG Energy, Unit A4: Brussels, Belgium, 2019; Available online: https://ec.europa.eu/eurostat/web/energy/data/energy-balances (accessed on 10 July 2019).
- Dodd, N.; Donatello, S.; Garbarino, E.; Gama-Caldas, M. Identifying Macro-Objectives for the Life Cycle Environmental Performance and Resource Efficiency of EU Buildings; Joint Research Centre, European Commission: Seville, Spain, 2015; 116p, Available online: https://www.construction-products.eu/application/files/1615/2466/0561/151222_Resource_Efficient_Buildings_Macro_objectives_WP_Final_version.pdf (accessed on 10 July 2019).
- Construction and Demolition Waste (CDW); Waste streams, Environment, European Commission: Brussels, Belgium; Available online: https://ec.europa.eu/environment/waste/construction_demolition.htm (accessed on 10 July 2019).
- Regional Policy; Urban Development; European Commission: Brussels, Belgium; Available online: https://ec.europa.eu/regional_policy/en/policy/themes/urban-development/ (accessed on 15 October 2019).
- Circular Economy Action Plan; Environment, European Commission: Brussels, Belgium; Available online: https://ec.europa.eu/environment/circular-economy/index_en.htm (accessed on 7 October 2019).
- 2030 Climate & Energy Framework; Climate Strategies & Targets; European Commission: Brussels, Belgium; Available online: https://ec.europa.eu/clima/policies/strategies/2030_en (accessed on 8 October 2019).
- Clean Energy for all Europeans Package; Energy; European Commission: Brussels, Belgium; Available online: https://ec.europa.eu/energy/en/topics/energy-strategy-and-energy-union/clean-energy-all-europeans (accessed on 7 October 2019).
- Saheb, Y.; Shnapps, S.; Paci, D. From Nearly-Zero Energy Buildings to Net-Zero Energy Districts; EUR 29734 EN; Publications Office of the European Union: Luxembourg, Luxembourg, 2019. [Google Scholar]
- De Pascali, P.; Bagaini, A. Energy Transition and Urban Planning for Local Development. A Critical Review of the Evolution of Integrated Spatial and Energy Planning. Energies 2019, 12, 35. [Google Scholar] [CrossRef]
- UN Sustainable Development Goals; United Nations: New York, NY, USA, 2019; Available online: https://www.un.org/sustainabledevelopment/sustainable-development-goals/ (accessed on 10 July 2019).
- COM. 739 Communication from the Commission to the European Parliament, the Council, the European Economic and Social Committee and the Committee of the Regions; European Commission: Strasbourg, France, 22 November 2016; Available online: https://eur-lex.europa.eu/legal-content/EN/TXT/PDF/?uri=CELEX:52016DC0739&from=EN (accessed on 7 October 2019).
- Urban Agenda for the EU; European Commission: Brussels, Belgium; Available online: https://ec.europa.eu/futurium/en/urban-agenda (accessed on 5 October 2019).
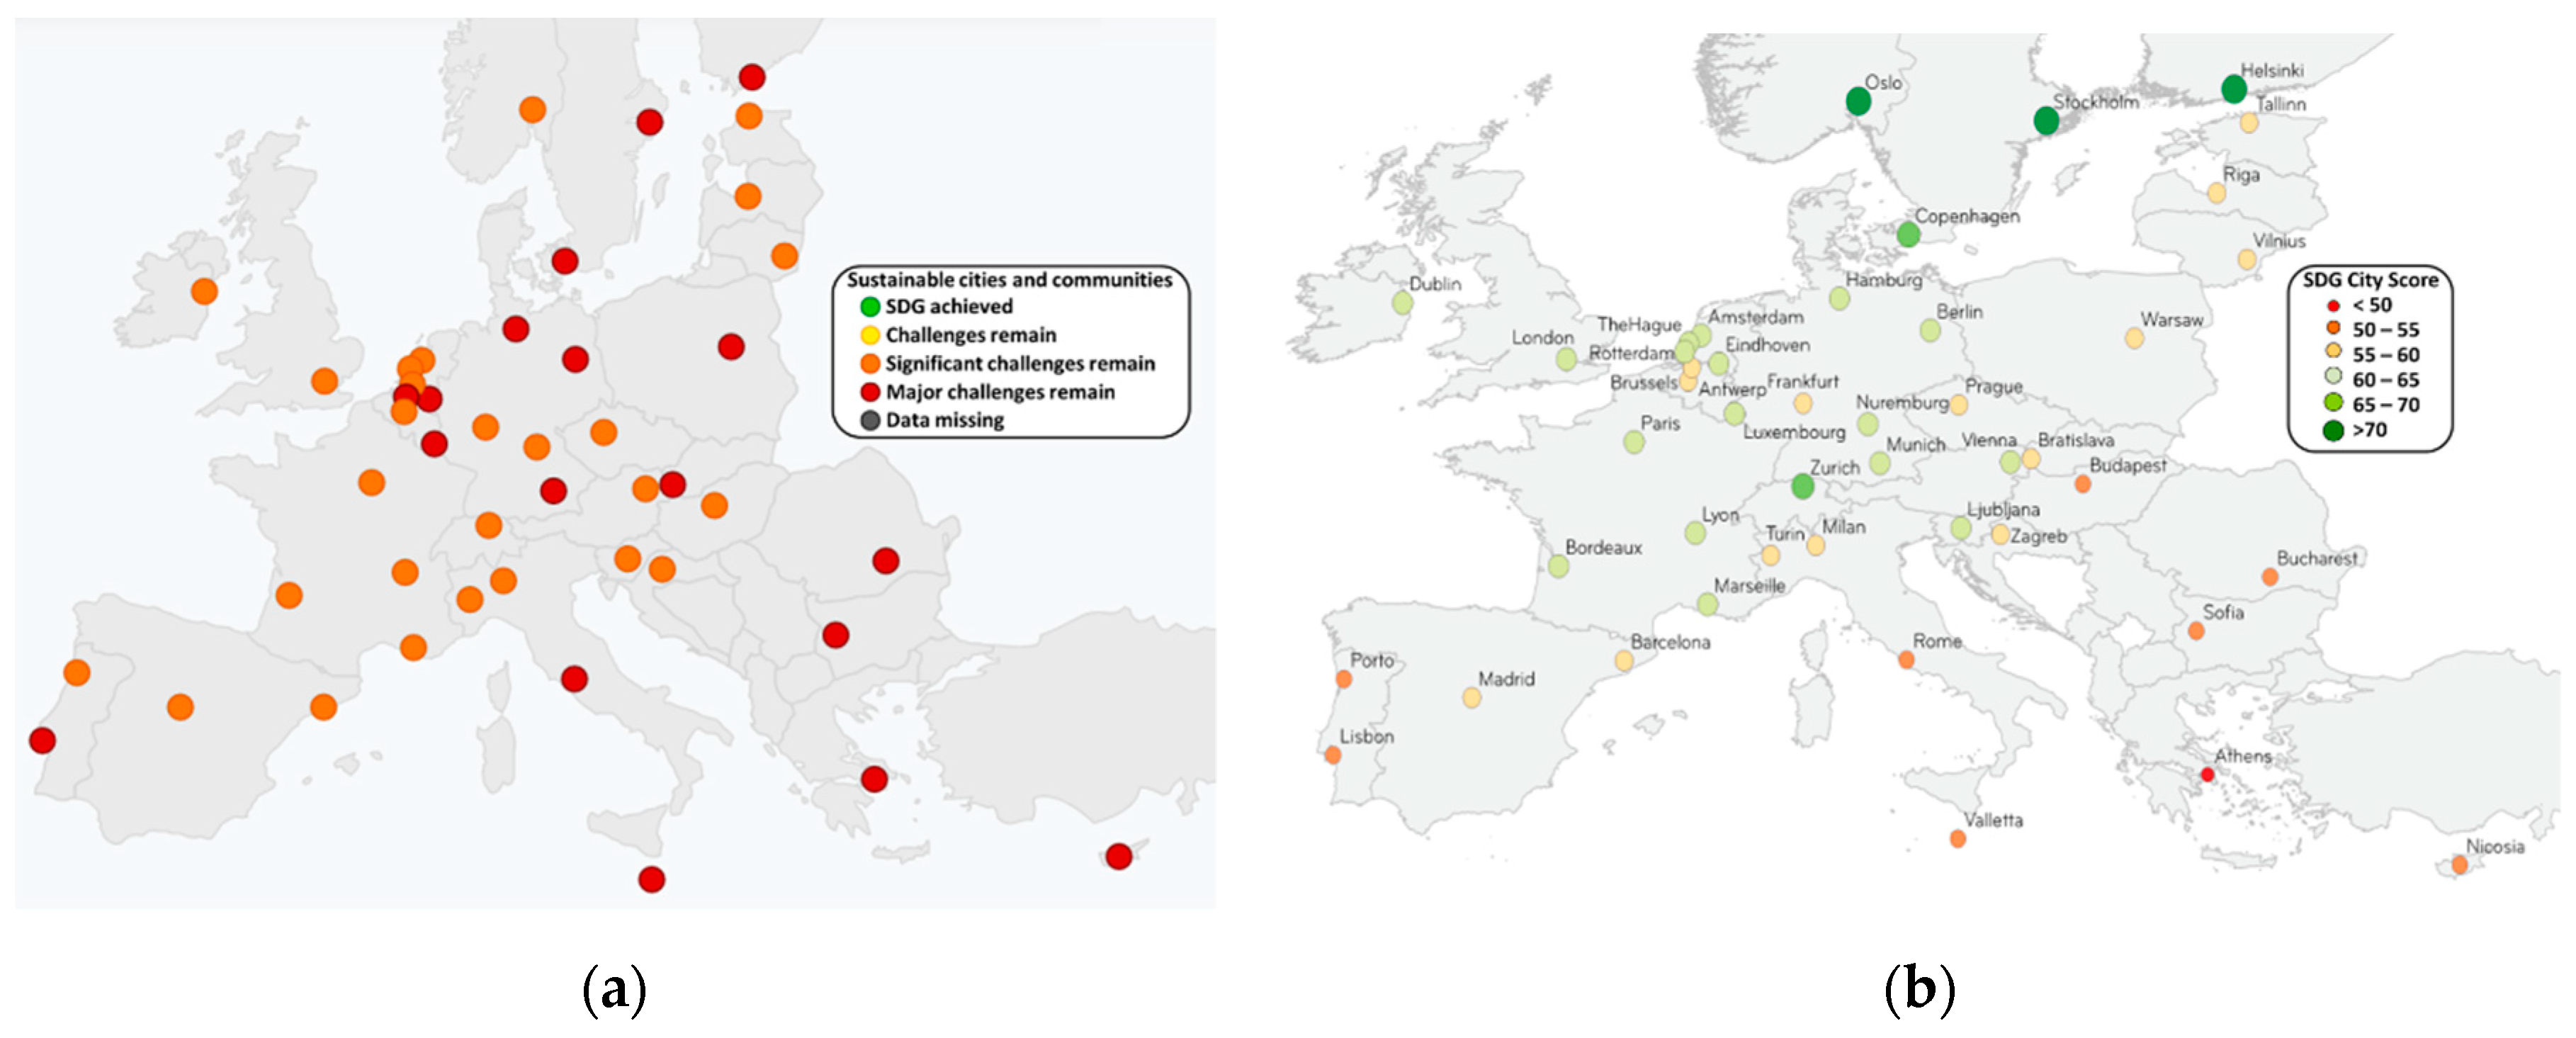
- Lafortune, G.; Zoeteman, K.; Fuller, G.; Mulder, R.; Dagevos, J.; Schmidt-Traub, G. The 2019 SDG Index and Dashboards Report for European Cities (prototype version). Sustainable Development Solutions Network (SDSN) and the Brabant Center for Sustainable Development (Telos), 2019. Available online: https://www.sustainabledevelopment.report/news/first-ever-sdg-index-and-dashboards-report-for-european-cities/ (accessed on 16 October 2019).
- Balaras, C.A.; Dascalaki, E.G. Chapter 9.1—Energy Audits of Existing Buildings. In Handbook of Energy Efficiency in Buildings, 1st ed.; Asdrubali, F., Desideri, U., Eds.; Butterworth-Heinemann Elsevier: Oxford, UK, 2018; pp. 677–713. [Google Scholar]
- Barbano, G.; Eßig, N.; Mittermeier, P.; Orova, M.; Beagon, P.; Claudi, L.; Gómez-Salcedo, J.F.; Kiedaisch, F. Definition of Sustainable Key Performance Indicators; NEWTREND Project, H2020 Program; European Commission: Brussels, Belgium, 2016; Available online: http://newtrend-project.eu/wp-content/uploads/2015/11/NewTREND_WP2_D2.2_KPI_GB04_V5.2.pdf (accessed on 16 October 2019).
- Lawrence, T.; Balaras, C.A.; Means, J.K. A Comparison of How Sustainability and Green Building Standards are Being Adopted into Building Construction Codes within the United States and the EU. In Proceedings of the International Conference on Sustainable Built Environment SBE 16—Strategies—Stakeholders—Success Factors, Hamburg, Germany, 8–11 March 2016; pp. 42–51. Available online: https://pure.tugraz.at/ws/portalfiles/portal/3050178/SBE16Hamburg_ConferenceProceedings.pdf (accessed on 8 October 2019).
- ANSI/ASHRAE/USGBC/IES Standard 189.1—Standard for the Design of High Performance Green Buildings Except Low-Rise Residential Buildings; ASHRAE: Atlanta, GA, USA, 2017; Available online: https://www.ashrae.org/standards-research--technology/standards--guidelines (accessed on 8 October 2019).
- Mattoni, B.; Guattari, C.; Evangelisti, L.; Bisegna, F.; Gori, P.; Asdrubali, F. Critical review and methodological approach to evaluate the differences among international green building rating tools. Renew. Sustain. Energy Rev. 2018, 82, 950–960. [Google Scholar] [CrossRef]
- Chethana, I.M.; Illankoon, S.; Tam, V.W.Y.; Le, K.N.; Shen, L. Key credit criteria among international green building rating tools. J. Clean. Prod. 2017, 164, 209–220. [Google Scholar] [CrossRef]
- He, Y.; Kvan, T.; Liu, M.; Li, B. How green building rating systems affect designing green. Build. Environ. 2018, 133, 19–31. [Google Scholar] [CrossRef]
- Sicignano, E.; Di Ruocco, G.; Stabile, A. Quali—A Quantitative Environmental Assessment Method According to Italian CAM, for the Sustainable Design of Urban Neighbourhoods in Mediterranean Climatic Regions. Sustainability 2019, 11, 4603. [Google Scholar] [CrossRef]
- Level(s)—Taking Action on the Total Impact of the Construction Sector, Joint Research Centre (JRC); Publications Office of the European Union: Luxembourg, Luxembourg, 2019; Available online: https://ec.europa.eu/environment/eussd/pdf/LEVELS_REPORT_en.pdf (accessed on 7 October 2019).
- Martos, A.; Pacheco-Torres, R.; Ordóñez, J.; Jadraque-Gago, E. Towards successful environmental performance of sustainable cities: Intervening sectors. A review. Renew. Sustain. Energy Rev. 2016, 57, 479–495. [Google Scholar] [CrossRef]
- iiSBE. International Initiative for a Sustainable Built Environment; Ottawa, ON, Canada, 2007; Available online: www.iisbe.org (accessed on 8 October 2019).
- Balaras, C.A.; Dascalaki, E.G.; Droutsa, K.G.; Moro, A.; Barbano, G.; Chanussot, L.; Cazas, J.; Zidar, M.; Bačan, I.; et al. D3.1.1 Transnational Indicators and Assessment Methods for Buildings and Urban Areas; CESBA MED Consortium: Marseille, France, 2017; 409p, Available online: https://cesba-med.interreg-med.eu/fileadmin/user_upload/Sites/Efficient_Buildings/Projects/CESBA_MED/D3.1.1_Indicators_CESBA_MED_Final-V1.5_June_2017.pdf (accessed on 8 October 2019).
- Moro, A. D3.3.1 Testing Protocol—Assessment Methodology; CESBA MED Consortium: Marseille, France, 2017; 100p, Available online: https://cesba-med.interreg-med.eu/results/deliverables/ (accessed on 16 October 2019).
- Moro, A. D3.4.1—CESBA MED SBT Building Generic Framework; CESBA MED Consortium: Marseille, France, 2019; 78p, Available online: https://cesba-med.interreg-med.eu/results/deliverables/ (accessed on 16 October 2019).
- Moro, A. D3.4.2—CESBA MED SNT Urban Generic Framework; CESBA MED Consortium: Marseille, France, 2019; 83p, Available online: https://cesba-med.interreg-med.eu/results/deliverables/ (accessed on 16 October 2019).
- Dodd, N.; Cordella, M.; Traverso, M.; Donatello, S. Level(s)—A common EU Framework of Core Sustainability Indicators for Office and Residential Buildings, Part 3: How to Make Performance Assessments Using Level(s); Joint Research Centre, European Commission: Seville, Spain, 2017; 211p, Available online: https://susproc.jrc.ec.europa.eu/Efficient_Buildings/docs/170816_Levels_EU_framework_of_building_indicators.pdf (accessed on 7 October 2019).
- ITACA. Istituto per l′Innovazione e Trasparenza Degli Appalti e la Compatibilità Ambientale; Institute for Transparency of Contracts and Environmental Compatibility: Rome, Italy; Available online: http://www.itaca.org (accessed on 7 October 2019).
- Moro, A. D3.4.3a CESBA MED KPIs—Building Scale; CESBA MED Consortium: Marseille, France, 2019; 30p, Available online: https://cesba-med.interreg-med.eu/results/deliverables (accessed on 16 October 2019).
- Moro, A. D3.4.3b CESBA MED KPIs—Urban Scale; CESBA MED Consortium: Marseille, France, 2019; 28p, Available online: https://cesba-med.interreg-med.eu/results/deliverables (accessed on 16 October 2019).
- Moro, A. D3.3.2 v.1.1 Model of Decision Making Process for Sustainable Urban Areas and Public Buildings; CESBA MED Consortium: Marseille, France, 2018; 15p, Available online: https://cesba-med.interreg-med.eu/results/deliverables/ (accessed on 16 October 2019).
- Borgaro, P. D4.2.2 v.1.4 Training System Framework; CESBA MED Consortium: Marseille, France, 2018; 26p, Available online: https://cesba-med.interreg-med.eu/results/deliverables/ (accessed on 16 October 2019).
- Borg, R.P. D5.2.1—elearning Courses; CESBA MED Consortium: Marseille, France, 2019; 19p, Available online: https://cesba-med.interreg-med.eu/results/deliverables/ (accessed on 16 October 2019).
- STRAT-Board: Territorial and Urban Strategies Dashboard; Greece Country Fact Sheet; European Commission: Brussels, Belgium; Available online: https://urban.jrc.ec.europa.eu/strat-board/#/factsheetcountry?id=EL&name=Greece&fullscreen=yes (accessed on 15 October 2019).
- Droutsa, K.G.; Balaras, C.A.; Dascalaki, E.G.; Kontoyiannidis, S. D3.3.2-GR Pilot Test in Greece, Assessment Report—Hellenic Pilot Test Results; CESBA MED Consortium: Marseille, France, 2019; 15p, Available online: https://cesba-med.interreg-med.eu/results/deliverables (accessed on 16 October 2019).
- Torrent, L.; Wadel, G.; Sagrera, A. D5.3.1 CESBA MED Policy Paper; CESBA MED Consortium: Marseille, France, 2019; 15p, Available online: https://cesba-med.interreg-med.eu/results/deliverables (accessed on 16 October 2019).


| GF | Italy (A) | Italy (B) | France (A) | France (B) | Spain (A) | Spain (B) | Malta | Greece | Croatia | Average | |
|---|---|---|---|---|---|---|---|---|---|---|---|
| Building Scale | |||||||||||
| Issues | 7 | 7 | 7 | 7 | 7 | 7 | 7 | 7 | 7 | 7 | 7 |
| Categories | 25 | 15 | 18 | 8 | 8 | 19 | 21 | 11 | 16 | 15 | 15 |
| Indicators | 153 | 16 | 31 | 16 | 19 | 38 | 40 | 36 | 31 | 27 | 28 |
| KPIs | 13 | 13 | 13 | 13 | 13 | 13 | 13 | 13 | 13 | 13 | 13 |
| Neighbourhood Scale | |||||||||||
| Issues | 7 | 7 | 7 | 7 | 7 | 7 | 7 | 7 | 7 | 7 | 7 |
| Categories | 23 | 14 | 20 | 11 | 13 | 16 | 20 | 20 | 16 | 20 | 17 |
| Indicators | 178 | 34 | 46 | 16 | 19 | 33 | 59 | 66 | 44 | 38 | 39 |
| KPIs | 16 | 16 | 16 | 16 | 16 | 16 | 16 | 16 | 16 | 16 | 16 |
| Code | Key Performance Indicators (KPIs) | Units | Value | Italy (A) | Italy (B) | France (A) | France (B) | Spain (A) | Spain (B) | Malta | Greece | Croatia | Average |
|---|---|---|---|---|---|---|---|---|---|---|---|---|---|
| BUILDING SCALE | |||||||||||||
| B.1.1 | Primary energy use | kWh/m2/y | Minimum | 80 | 140 | 48 | 140 | 225 | 292 | 310.6 | 90 | 165.7 | |
| Best | 30 | 23 | 0 | 0 | 70 | 58 | 87.6 | 55 | 40.5 | ||||
| B.1.2 | Final thermal energy use | kWh/m2/y | Minimum | 70 | 80 | 40 | 130 | 22 | 75 | 69.1 | 50 | 67.0 | |
| Best | 20 | 10 | 0 | 30 | 12 | 20 | 11.5 | 10 | 14.2 | ||||
| B.1.3 | Final electrical energy use | kWh/m2/y | Minimum | 30 | 23 | 40 | 140 | 75 | 70 | 99.4 | 30 | 63.4 | |
| Best | 20 | 5 | 0 | 0 | 20 | 30 | 29.1 | 0 | 13.0 | ||||
| B.1.5 | Renewables in final thermal energy use | % | Minimum | 30 | 25 | 25 | 10 | 30 | 30 | 16 | 20 | 23.3 | |
| Best | 100 | 50 | 100 | 100 | 100 | 100 | 80 | 90 | 90.0 | ||||
| B.1.6 | Renewables in final electrical energy use | % | Minimum | 40 | 35 | 10 | 10 | 40 | 40 | 20 | 5 | 25.0 | |
| Best | 100 | 75 | 200 | 100 | 100 | 100 | 100 | 90 | 108.1 | ||||
| B.1.10 | Embodied non-renewable primary energy | MJ/m2 | Minimum | 2500 | 180 | 900 | 6230 | 14 | 1964.8 | ||||
| Best | 1000 | 90 | 504 | 3000 | 3 | 919.4 | |||||||
| B.4.5 | Water consumption for indoor uses | m3/occupant/y | Minimum | 40 | 47 | 40 | 90 | 100 | 11 | 6 | 5.5 | 34.2 | |
| Best | 25 | 23 | 20 | 20 | 20 | 5 | 1.5 | 2 | 13.8 | ||||
| C.1.3 | Global warming potential | kg CO2 eq./m2/y | Minimum | 30 | 28 | 20 | 80 | 30 | 96.31 | 7.5 | 40 | 43.1 | |
| Best | 0 | 5 | 5 | 5 | 10 | 19.26 | 2 | 5 | 5.9 | ||||
| C.3.2 | Solid waste categories recycled | % | Minimum | 50 | 14 | 0.4 | 0.4 | 15 | 57 | 28 | 23.5 | ||
| Best | 80 | 100 | 1 | 1 | 100 | 100 | 100 | 68.9 | |||||
| D.1.9 | Ventilation rate | Lt/s/m2 | Minimum | 10 | 0.35 | 0.5 | 6 | 0.29 | 2.77 | 3.3 | |||
| Best | 20 | 0.49 | 0.9 | 12 | 0.83 | 6 | 6.7 | ||||||
| D.2.2 | Thermal comfort index | % | Minimum | 10 | 10 | 10 | 10 | 25 | 10 | 25 | 25 | 15.6 | |
| Best | 0 | 6 | 5 | 0 | 5 | 0 | 5 | 5 | 3.3 | ||||
| G.1.4 | Operational energy cost | €/m2/y | Minimum | 20 | 10.7 | 15 | 15 | 60 | 35 | 18.9 | 7.5 | 22.8 | |
| Best | 10 | 1.75 | 5 | 5 | 40 | 10 | 4.7 | 1.5 | 9.7 | ||||
| G.1.5 | Operational water cost | €/m2/y | Minimum | 5 | 1.55 | 10 | 13 | 5 | 0.59 | 0.5 | 5.1 | ||
| Best | 1 | 0.7 | 3 | 2.3 | 1 | 0.15 | 0.2 | 1.2 | |||||
| NEIGHBOURHOOD SCALE | |||||||||||||
| A.1.7 | Land conservation | % | Minimum | 0.5 | 7 | 15 | 10 | 4 | 10 | 10 | 10 | 2 | 7.6 |
| Best | 2 | 42 | 30 | 20 | 15 | 20 | 28 | 20 | 10 | 20.8 | |||
| B.3.3 | Operational energy cost for public buildings | €/m2/yr | Minimum | 7.4 | 10 | 14 | 14 | 20 | 13.56 | 100 | 17.7 | 100 | 33.0 |
| Best | 4 | 3 | 3.5 | 3.5 | 10 | 3.33 | 0 | 4.1 | 0 | 3.5 | |||
| C.1.1 | Total final thermal energy consumption for buildings | kWh/m2/yr | Minimum | 70 | 80 | 40 | 50 | 75 | 76.23 | 50 | 314 | 100 | 95.0 |
| Best | 30 | 10 | 0 | 0 | 20 | 33.8 | 0 | 21.1 | 50 | 18.3 | |||
| C.1.4 | Total final electric energy consumption for buildings | kWh/m2/yr | Minimum | 50 | 23 | 12 | 55 | 70 | 29.85 | 25 | 64.2 | 75 | 44.9 |
| Best | 20 | 5 | 0 | 5 | 20 | 10.88 | 5 | 7.9 | 50 | 13.8 | |||
| C.1.7 | Total primary energy consumption for buildings | kWh/m2/yr | Minimum | 322 | 72 | 40 | 140 | 225 | 152 | 50 | 461.9 | 100 | 173.7 |
| Best | 242 | 50 | 0 | 0 | 70 | 15 | 15 | 38.2 | 70 | 55.6 | |||
| C.2.1 | On-site renewables in total final thermal energy consumption | % | Minimum | 20 | 25 | 25 | 30 | 25 | 25 | 25 | 4 | 5 | 20.4 |
| Best | 100 | 50 | 100 | 100 | 90 | 90 | 90 | 14 | 30 | 73.8 | |||
| C.2.7 | On-site renewables in total final electrical energy consumption | % | Minimum | 20 | 35 | 25 | 35 | 15 | 15 | 35 | 1 | 20 | 22.3 |
| Best | 100 | 75 | 200 | 75 | 75 | 75 | 75 | 47 | 35 | 84.1 | |||
| D.1.2 | Total GHG Emissions from energy use in buildings | kg CO2 eq./m2/yr | Minimum | 22.5 | 13 | 20 | 30 | 30 | 30 | 80 | 46 | 22 | 32.6 |
| Best | 0 | 11 | 5 | 10 | 10 | 10 | 30 | 5 | 15 | 10.7 | |||
| E.1.6 | Water consumption in residential buildings | m3/occupant/yr | Minimum | 65 | 47.45 | 40 | 68 | 150 | 150 | 15 | 62.1 | 250 | 94.2 |
| Best | 61 | 23.7 | 20 | 30 | 40 | 60 | 5 | 18.6 | 100 | 39.8 | |||
| E.1.7 | Water consumption in public buildings | m3/m2 | Minimum | 1 | 1.3 | 5 | 1.1 | 15 | 15 | 0.65 | 5 | 5.5 | |
| Best | 0.5 | 0.6 | 2 | 0.4 | 5 | 5 | 0.33 | 3 | 2.1 | ||||
| F.1.3 | Recharge of groundwater through permeable paving/landscaping | % | Minimum | 20 | 40 | 20 | 20 | 20 | 20 | 20 | 15 | 20 | 21.7 |
| Best | 40 | 60 | 70 | 100 | 70 | 70 | 100 | 80 | 80 | 74.4 | |||
| F.2.3 | Ambient air quality (PM10) above acceptable limits | days/yr | Minimum | 35 | 35 | 30 | 30 | 15 | 15 | 35 | 20 | 26.9 | |
| Best | 25 | 0 | 11 | 11 | 11 | 11 | 0 | 15 | 10.5 | ||||
| G.2.1 | Proximity of residents to public transport | % | Minimum | 70 | 60 | 50 | 0 | 30 | 30 | 30 | 50 | 5 | 36.1 |
| Best | 100 | 100 | 100 | 100 | 100 | 100 | 100 | 100 | 40 | 93.3 | |||
| G.2.4 | Pedestrian & bicycle network | m/100 inhabitants | Minimum | 14 | 43 | 15 | 200 | 20 | 5 | 5 | 2 | 0 | 33.8 |
| Best | 42 | 129 | 40 | 50 | 80 | 40 | 40 | 20 | 500 | 104.6 | |||
| G.4.2 | Proximity of residents to key services | % | Minimum | 80 | 30 | 30 | 30 | 30 | 50 | 50 | 50 | 20 | 41.1 |
| Best | 100 | 80 | 100 | 100 | 80 | 100 | 100 | 90 | 70 | 91.1 | |||
| G.6.3 | Community involvement in urban planning (qualitative score) | level (score) | Minimum | 0 | 3 | 0 | 0 | 0 | 0 | 0 | 0 | 0 | 0.3 |
| Best | 5 | 5 | 5 | 5 | 5 | 5 | 5 | 5 | 3 | 4.8 | |||
| Sustainability Issues | Italy (A) | Italy (B) | France (A) | France (B) | Spain (A) | Spain (B) | Malta | Greece | Croatia | Average |
|---|---|---|---|---|---|---|---|---|---|---|
| Building Scale | ||||||||||
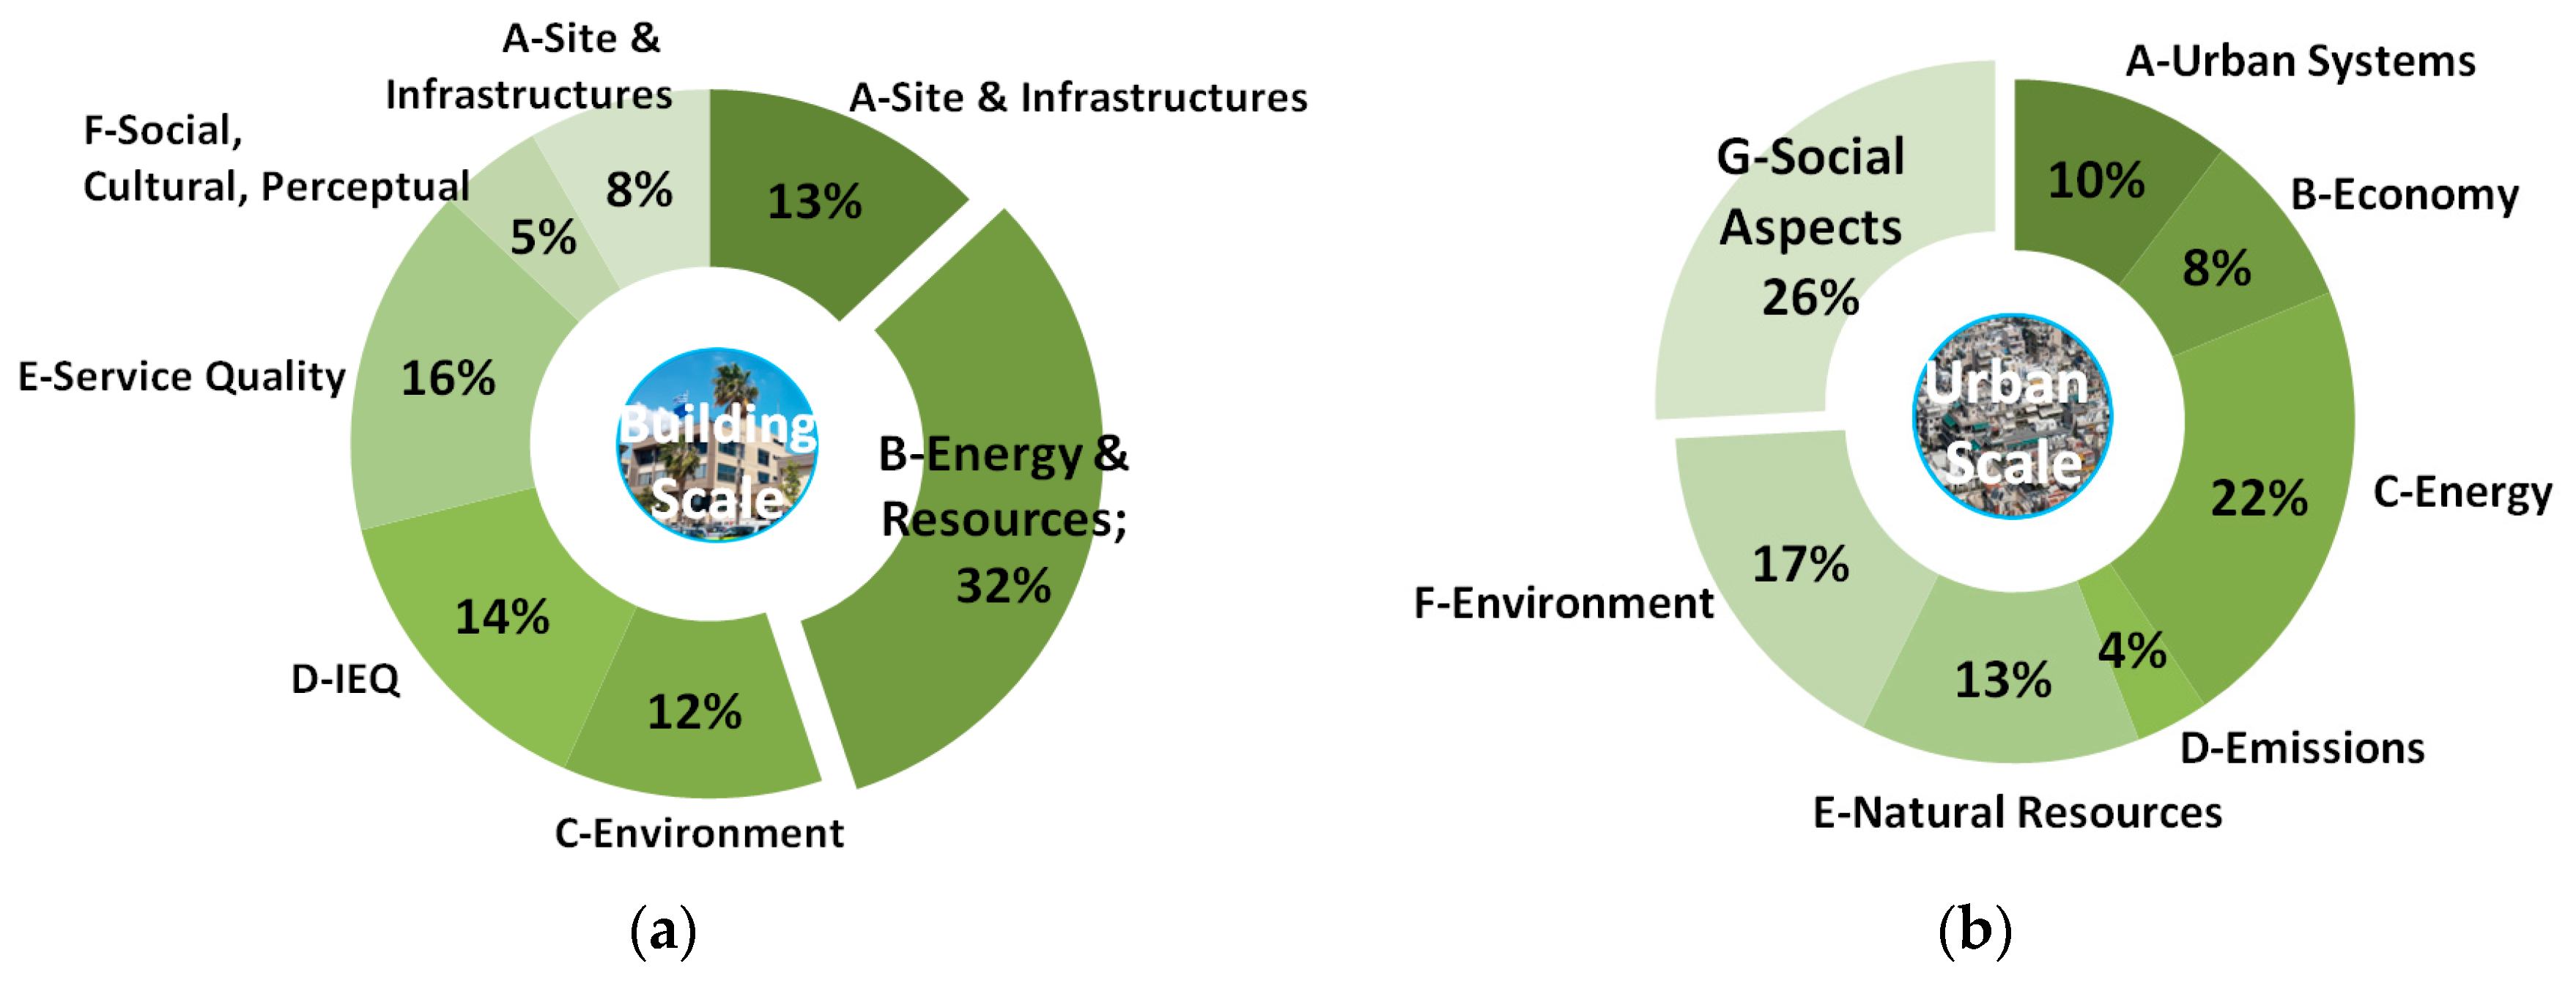
| A-Site and Infrastructures | 0.0% | 0.0% | 0.0% | 0.0% | 4.9% | 11.6% | 7.0% | 6.5% | 7.6% | 4.2% |
| B-Energy and Resources | 58.0% | 69.8% | 72.0% | 72.0% | 62.9% | 54.9% | 31.6% | 28.5% | 51.2% | 55.7% |
| C-Environment | 23.0% | 24.3% | 25.0% | 25.0% | 19.5% | 20.4% | 23.6% | 36.6% | 19.5% | 24.1% |
| D-IEQ | 11.0% | 4.2% | 2.0% | 2.0% | 2.1% | 1.5% | 2.0% | 0.5% | 8.0% | 3.7% |
| E-Service Quality | 0.0% | 0.0% | 0.0% | 0.0% | 7.9% | 8.1% | 20.7% | 12.6% | 3.2% | 5.8% |
| F-Social, Cultural, Perceptual | 0.0% | 0.0% | 0.0% | 0.0% | 1.9% | 2.7% | 12.0% | 4.3% | 5.1% | 2.9% |
| G-Economy | 8.0% | 1.8% | 2.0% | 2.0% | 0.8% | 0.8% | 3.1% | 11.0% | 5.5% | 3.9% |
| Neighbourhood Scale | ||||||||||
| A-Urban Systems | 11.6% | 10.4% | 18.9% | 0.0% | 6.5% | 10.2% | 13.5% | 10.8% | 12.2% | 10.4% |
| B-Economy | 1.7% | 6.6% | 5.0% | 1.8% | 9.1% | 3.6% | 1.8% | 4.2% | 4.6% | 4.3% |
| C-Energy | 41.1% | 18.4% | 30.5% | 28.2% | 26.7% | 25.9% | 16.2% | 33.7% | 21.5% | 26.9% |
| D-Emissions | 6.9% | 14.3% | 23.6% | 33.9% | 7.3% | 12.7% | 5.8% | 14.7% | 13.3% | 14.7% |
| E-Natural resources | 6.9% | 14.1% | 3.4% | 8.7% | 7.3% | 10.1% | 11.7% | 11.5% | 14.3% | 9.8% |
| F-Environment | 18.3% | 15.7% | 9.4% | 9.9% | 31.3% | 23.8% | 28.7% | 18.2% | 9.0% | 18.3% |
| G-Social Aspects | 13.4% | 20.5% | 9.1% | 17.4% | 15.4% | 13.6% | 22.3% | 6.9% | 25.0% | 15.9% |
© 2019 by the authors. Licensee MDPI, Basel, Switzerland. This article is an open access article distributed under the terms and conditions of the Creative Commons Attribution (CC BY) license (http://creativecommons.org/licenses/by/4.0/).
Share and Cite
Balaras, C.A.; Droutsa, K.G.; Dascalaki, E.G.; Kontoyiannidis, S.; Moro, A.; Bazzan, E. Urban Sustainability Audits and Ratings of the Built Environment. Energies 2019, 12, 4243. https://doi.org/10.3390/en12224243
Balaras CA, Droutsa KG, Dascalaki EG, Kontoyiannidis S, Moro A, Bazzan E. Urban Sustainability Audits and Ratings of the Built Environment. Energies. 2019; 12(22):4243. https://doi.org/10.3390/en12224243
Chicago/Turabian StyleBalaras, Constantinos A., Kalliopi G. Droutsa, Elena G. Dascalaki, Simon Kontoyiannidis, Andrea Moro, and Elena Bazzan. 2019. "Urban Sustainability Audits and Ratings of the Built Environment" Energies 12, no. 22: 4243. https://doi.org/10.3390/en12224243
APA StyleBalaras, C. A., Droutsa, K. G., Dascalaki, E. G., Kontoyiannidis, S., Moro, A., & Bazzan, E. (2019). Urban Sustainability Audits and Ratings of the Built Environment. Energies, 12(22), 4243. https://doi.org/10.3390/en12224243