Article

Effect of Shale Anisotropy on Hydration and Its Implications for Water Uptake

1
State Key Laboratory of Petroleum Resources and Prospecting, China University of Petroleum (Beijing), Beijing 102249, China
2
College of Petroleum Engineering, China University of Petroleum (Beijing), Beijing 102249, China
3
Discipline of Petroleum Engineering, WA School of Mines: Minerals, Energy and Chemical Engineering, Curtin University, 26 Dick Perry Avenue, Kensington 6151, Western Australia, Australia
4
Department of Civil and Environmental Engineering, National University of Singapore, Singapore 117576, Singapore
*
Authors to whom correspondence should be addressed.
Energies 2019, 12(22), 4225; https://doi.org/10.3390/en12224225
Submission received: 18 September 2019 / Revised: 30 October 2019 / Accepted: 4 November 2019 / Published: 6 November 2019
(This article belongs to the Section L: Energy Sources)

Abstract

:
Water uptake induced by fluid–rock interaction plays a significant role in the recovery of flowback water during hydraulic fracturing. However, the existing accounts fail to fully acknowledge the significance of shale anisotropy on water uptake typically under in situ reservoir temperature. Thus we investigated the shale-hydration anisotropy using two sets of shale samples from the Longmaxi Formation in Sichuan Basin, China, which are designated to imbibe water parallel and perpendicular to shale bedding planes. All the samples were immersed in distilled water for one to five days at 80 °C or 120 °C. Furthermore, samples’ topographical and elemental variations before and after hydration were quantified using energy-dispersive spectroscopy–field-emission scanning electron microscopy. Our results show that shale anisotropy and imbibition time strongly affect the width of pre-existing micro-fracture in hydrated samples. For imbibition parallel to lamination, the width of pre-existing micro-fracture initially decreases and leads to crack-healing. Subsequently, the crack surfaces slightly collapse and the micro-fracture width is enlarged. In contrast, imbibition perpendicular to lamination does not generate new micro-fracture. Our results imply that during the flowback process of hydraulic fracturing fluid, the shale permeability parallel to bedding planes likely decreases first then increases, thereby promoting the water uptake.

1. Introduction

With an increasing demand for geo-energy, unconventional resources, such as shale gas, play a significant role in meeting demand, and are expected to continue to do so for the foreseeable future [1]. Shale gas production in 2012 accounted for 34% of total natural gas production in the U.S. and is estimated to increase to nearly 50% by 2035 [2,3]. Due to the ultra-low permeability (tens of nano-Darcy to 1 milli-Darcy), a combination of horizontal drilling and multi-stage hydraulic fracturing has been widely used to enhance the formation connectivity by generating new fractures and activating pre-existing micro-fracture to achieve commercial shale gas production [4,5,6,7,8].
However, only 10% to 20% of injected hydraulic fluids are recovered during the flowback period for some shale plays [9,10]. For example, Nicot and Scanlon [11,12] conclude that up to 80% of hydraulic fluids remain underground after hydraulic fracturing in the Eagle Ford shale reservoir. Published works show that this large amount of fluid loss is associated with fluid–rock interaction such as hydration of clay minerals [13,14], capillary pressure [13,15,16] and osmotic flow [17,18]. Binazadeh et al. [14] quantified the effect of solution ionic strength on clay hydration. They conclude that low ionic strength may expand the electrostatic double layer (EDL) on clay surface, and generate a thicker hydration shell, which facilitates water imbibition. Fakcharoenphol et al. [18] simulated the effect of osmotic pressure on water and oil flow into and out of the shale plugs with consideration of capillary pressure. Their results indicate that high osmotic pressure likely takes place in shales due to the considerable salinity difference between in situ brine and slick water, which would promote water imbibition and oil counter-current flow. All these mechanisms imply that spontaneous imbibition associated with fluid–shale interaction and capillary forces governs hydraulic fracturing fluids loss [9,13,15,16,19,20,21].
Moreover, shale reservoirs present strong anisotropy [22], which would significantly affect water imbibition [15,23]. Existing studies show that the rate of water uptake depends significantly on the imbibition direction, whether parallel or perpendicular to the bedding planes [24]. For instance, Makhanov et al. [24] experimentally measured the brine-imbibition rate into shale plugs from Horn River Basin, Canada. They found that compared to the imbibition perpendicular to lamination, parallel imbibition to bedding planes can accelerate water uptake due to the shale layered structure. Moreover, Makhanov et al. [25] and Dehghanpour et al. [26] report that the clay hydration-induced micro-fracture likely increases shales’ permeability, and thus favour water uptake, which may also account for the low recovery of flowback water. However, Dehghanpour et al. [26] and Roychaudhuri et al. [27] draw the opposite conclusions that due to the clay minerals swelling and grains migration, the excess water imbibition would trigger a micro-fracture healing, which may decrease shale permeability and impair the imbibition rate. Hitherto, the nature of shale hydration associated with strong anisotropy still remains to be unveiled. Moreover, few existing studies investigate the effect of shale anisotropy on water uptake with consideration of in situ reservoir temperature and pressure. Furthermore, the time effect on water imbibition with respect to the shale anisotropy has been overlooked. Therefore, in this study, we aim to identify the controlling factors that drive shale hydration by addressing the following questions:
  • How does the imbibition direction (parallel or perpendicular to the bedding planes) influence the shale hydration?
  • How do the temperature and pressure affect shale water uptake?
  • What are the mechanisms of hydration?
To answer these questions, we investigated shale hydration anisotropy experimentally using two sets of shale samples extracted from the Longmaxi Formation in Sichuan Basin, China. The first set of experiments was designed to imbibe water parallel to the bedding plane, whereas the second set of experiments was conducted for the perpendicular imbibition. All samples were immersed in distilled water for one to five days with pressure of 3.5 MPa at 80 °C or 120 °C. Furthermore, to better characterize the samples’ topographical and elemental variations, energy-dispersive spectroscopy–field-emission scanning electron microscopy (EDS–FE-SEM) was used before and after hydration for quantitative analysis.

2. Experimental Materials and Procedures

2.1. Mineralogy

Shale reservoir samples in this work (Figure 1) were extracted from the Longmaxi Formation in the Changning-Weiyuan area of Sichuan province, China, which is currently the main commercial exploration and production shale gas target in China (see Figure 2). This formation has been characterised by the high total organic carbon content (TOC), high gas content and is a relatively easily to frack [28,29,30]. Considering that the shale hydration would be strongly affected by the organic matter (kerogen) and inorganic minerals [27,31], a carbon-sulphur analyser and X-ray diffraction (XRD) were used to analyse the samples’ organic content and mineral compositions. Results show that the content of total organic carbon (TOC) ranges from 1.78% to 2.85% with kerogen of type III (Table 1). Quartz is the dominant mineral followed by calcite and feldspar together with a high content of clay minerals, especially illite/smectite (Table 2). It is worth noting that the mineralogy of Longmaxi samples in this study is similar to that of Lower Bakken and Haynesville shales in the U.S., which contain a high content of quartz and illite/smectite [32]. Besides, Xu and Sonnenberg [33] observed that the micro-fracture surfaces of lower Bakken shale samples are mainly covered by quartz, K-feldspar, calcite, dolomite, and a little amount of organic matters in some areas. Therefore, we assumed that the experimental results for Longmaxi samples should be also applied to these established shale plays.

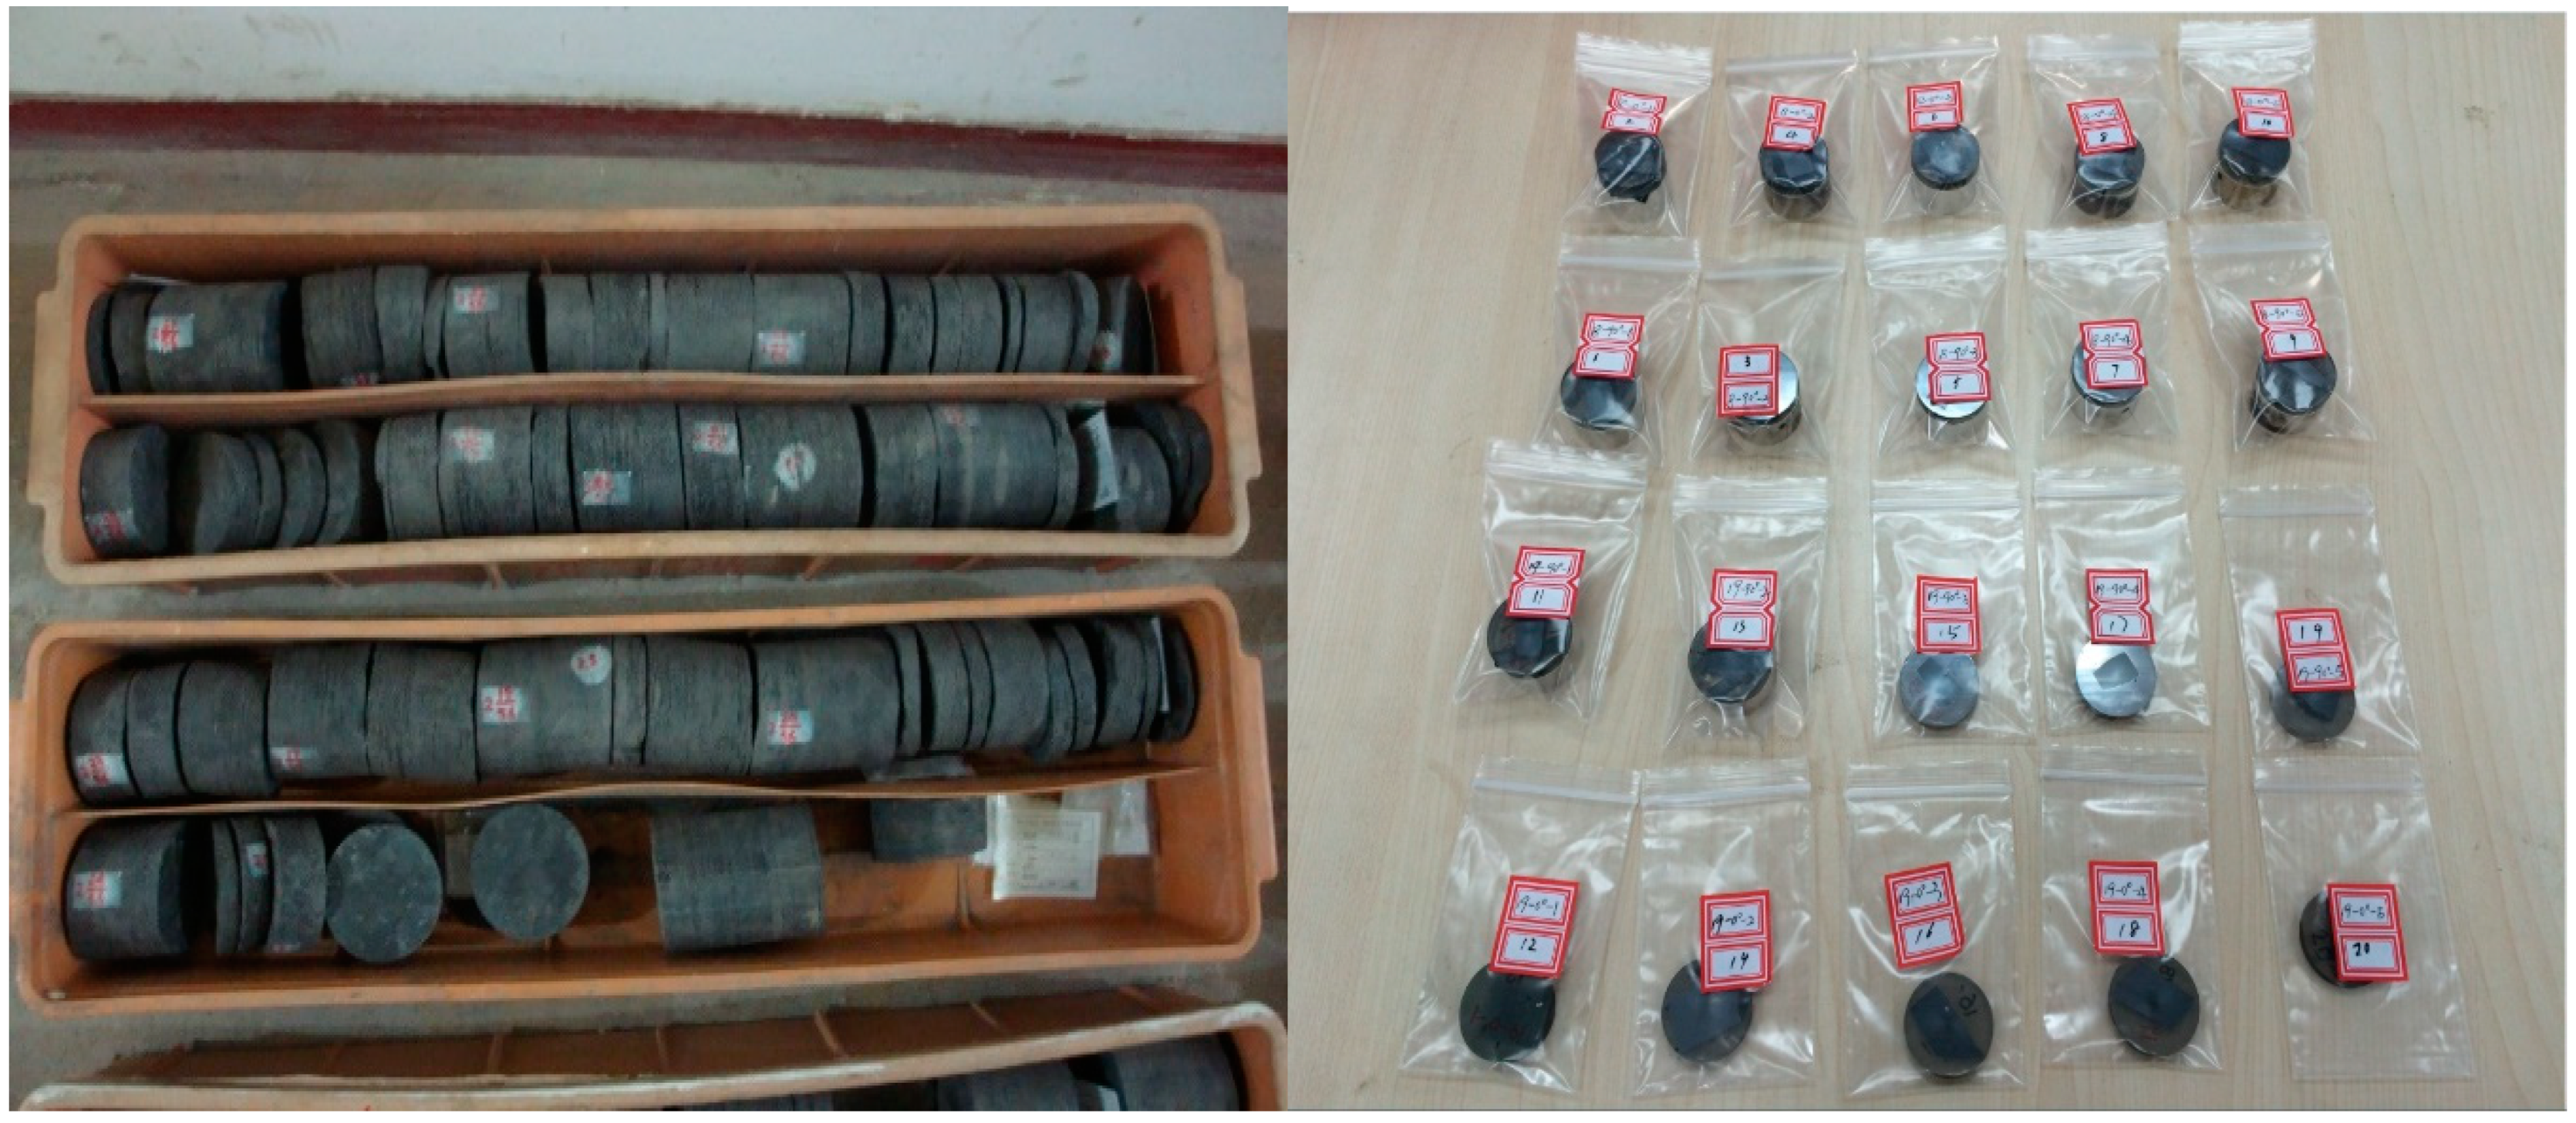
2.2. Sample Preparation and Characterization

The micro-structure of shale plays a vital role in anisotropy hydration during water imbibition [13,24,25]. Therefore, it is worth investigating the microscopic structure of the bedding planes. First, samples were cut either in parallel or perpendicular to the lamination with a dimension of 10 mm × 10 mm × 2 mm using a freeze corer with liquid nitrogen. Second, the sample surfaces were polished by argon ion and sprayed with a pure carbon film [34]. Focused ion beam (FIB) combined with field-emission scanning electron microscopy (FE-SEM) (type FEI Helios NanoLab 650) was used to investigate the microscopic features of shale. With the advance of the conventional backscatter (CBS) detection mode and secondary electrons. Through-the-lens detection (SE-TLD) mode in FIB–FESEM can characterize the nano-structure of shale bedding planes with resolution of 0.8 nm under vacuum condition. Results show that at the surface perpendicular to the bedding planes, the mineral grains with different sizes are homogeneously dispersed and do not present any specific orientation (Figure 3a). For the surface parallel to the bedding planes, the mineral grains are also arranged parallel to the lamination. In addition, we observed considerable nanoscale fractures and pores on sample sublayer surface. Some of these pores are filled with kerogen or asphaltene, implying a strong anisotropy and heterogeneity which is generally in line with existing literature [35,36] (Figure 3b).

2.3. Sample Slice Preparation

To precisely investigate the hydration process during water imbibition on shale surfaces parallel or perpendicular to the laminations, first, we used a freeze corer with liquid nitrogen to cut shale slices with dimensions of 20 mm × 18 mm × 10 mm. The samples were labelled with odd- and even-numbers, which corresponded to the cases that cut parallel and perpendicular to bedding planes, respectively (see Table 3). Second, we stabilized the samples with epoxy and UNNIPOL-80 mechanical polisher was used to grind the samples. Third, to better present the mineral skeletal structure and nano-pore system, we polished the slices using an 1060-Argon-Ion-Polisher to smooth the samples’ surfaces.

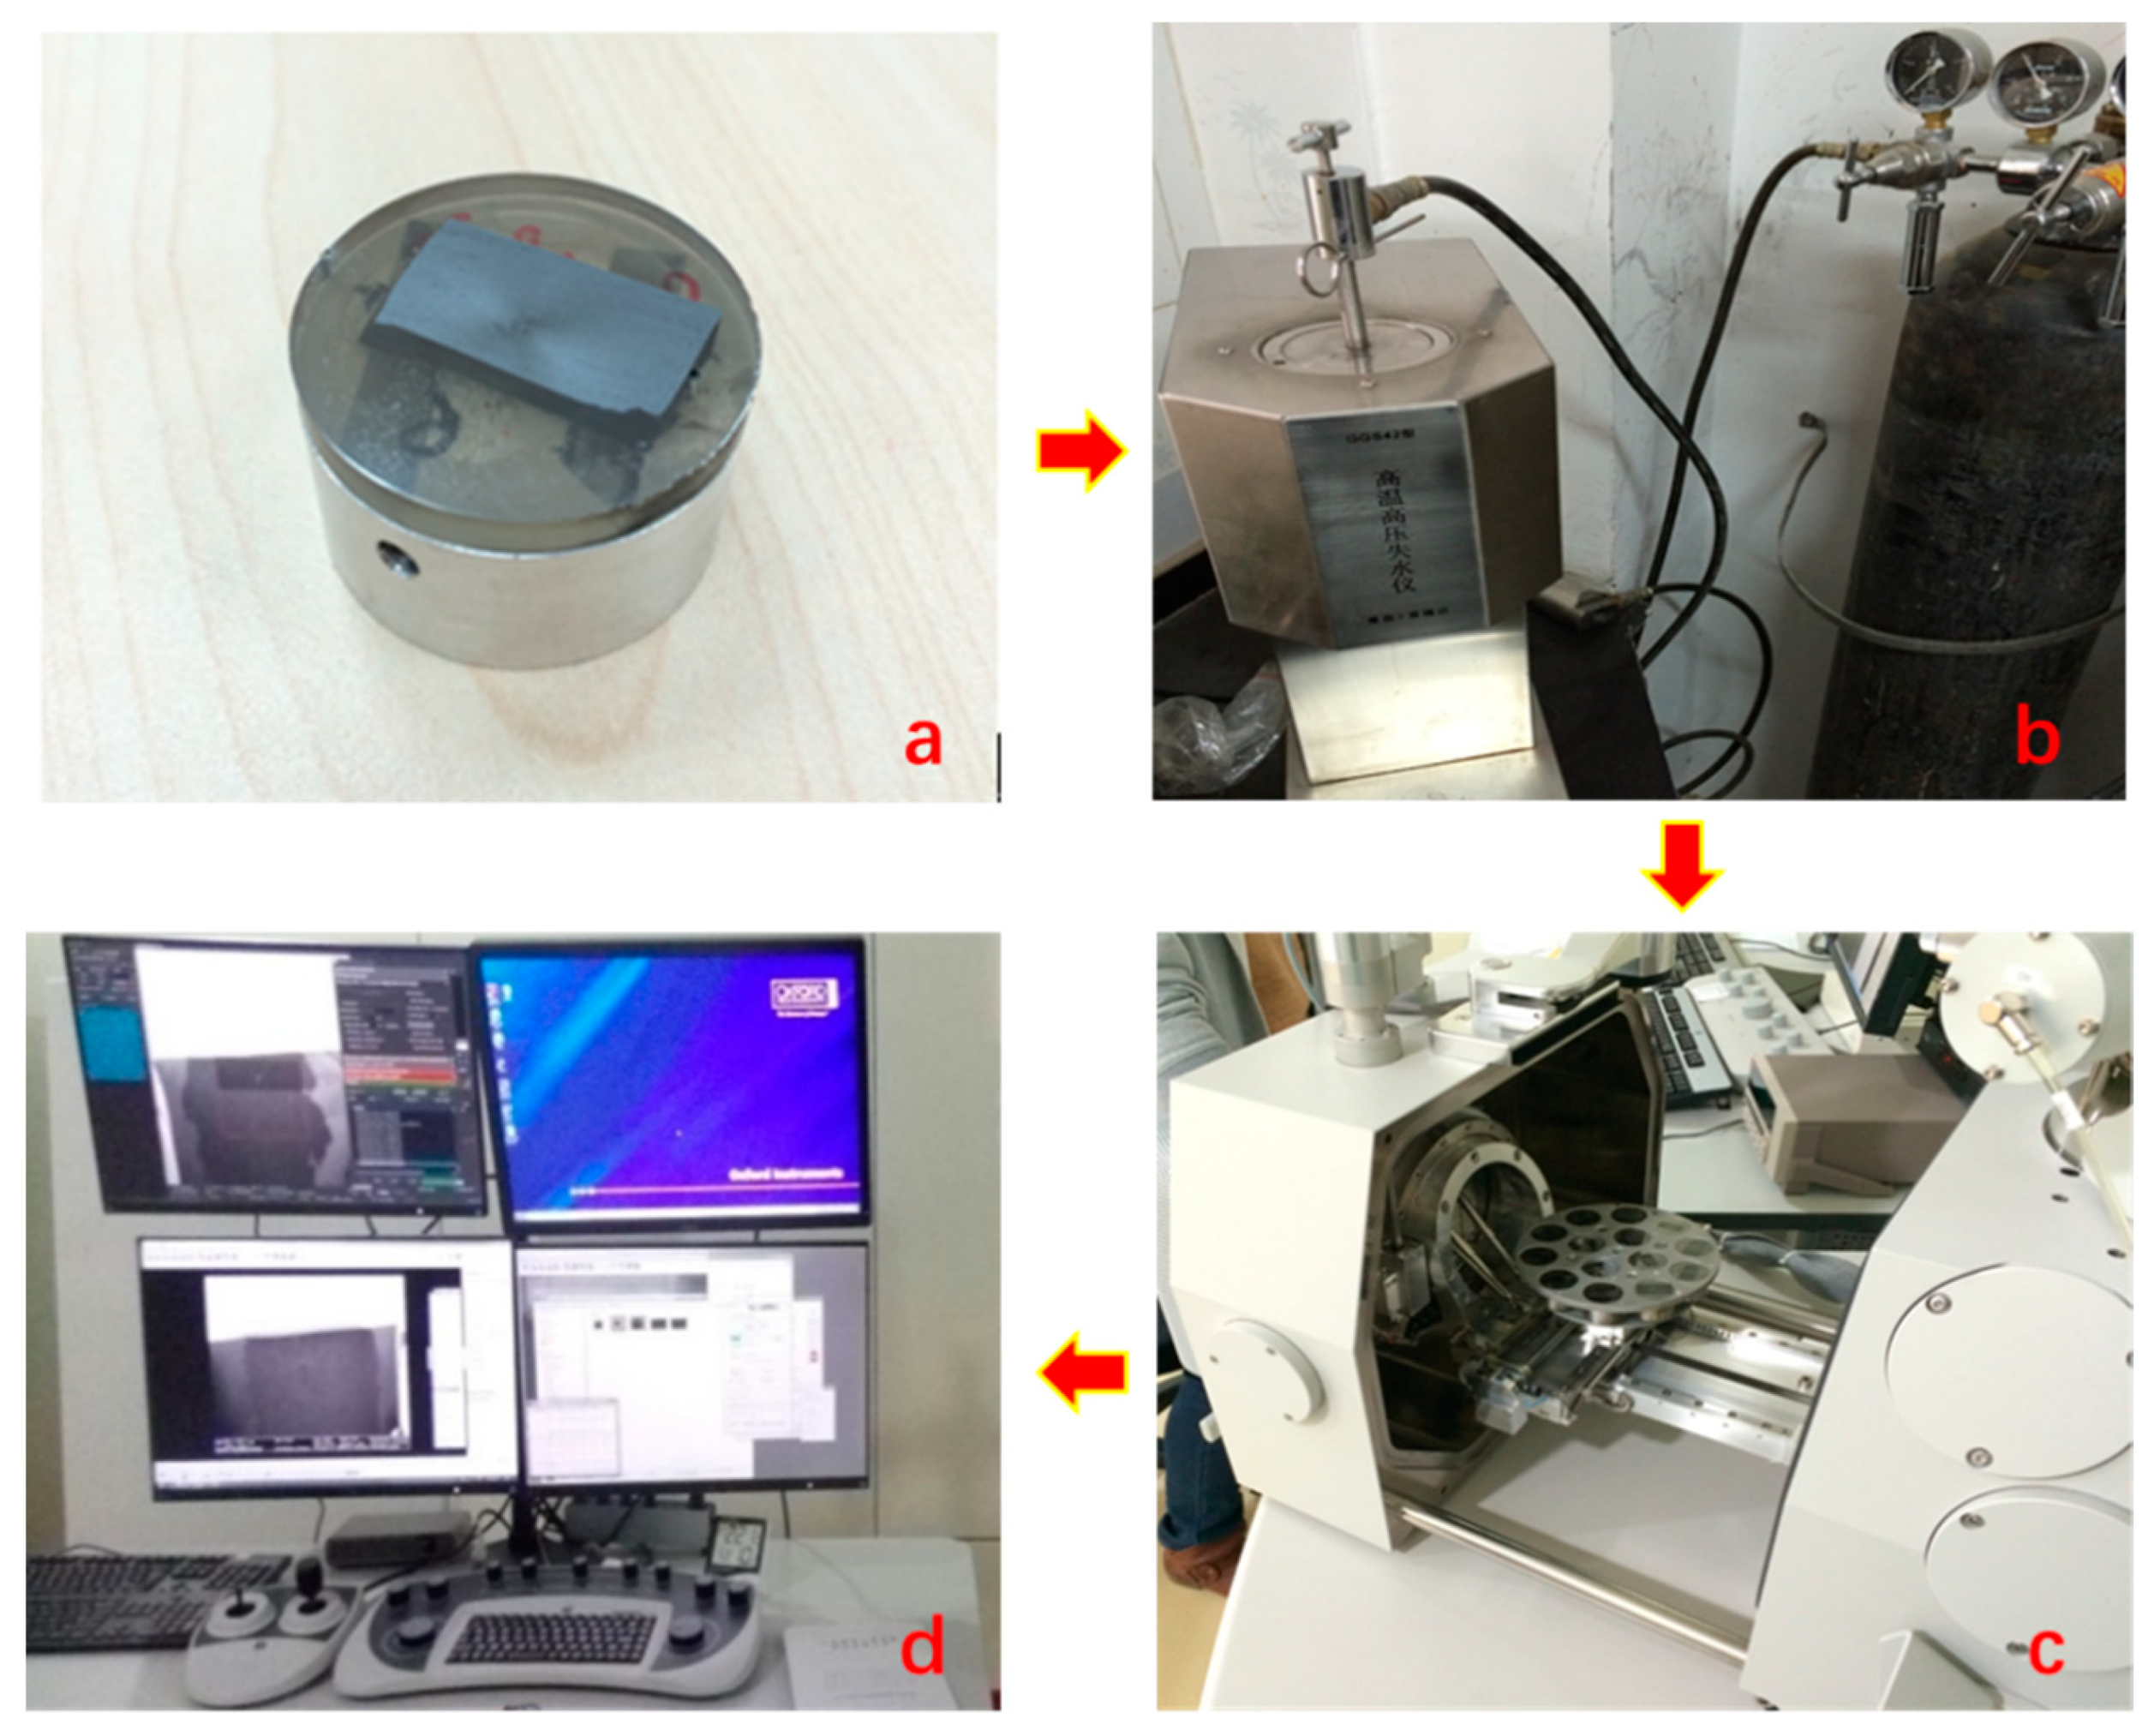
2.4. Experimental Procedures

The depth of shale formation in Changning-Weiyuan area is approximately from 2000 to 3000 m with temperature ranging from 75 to 125 °C [37]. Therefore, experimental temperature in this work was set as 80 °C and 120 °C. According to the American Petroleum Institute (API) standards for high-temperature and high-pressure (HTHP) filtration tests, the pressure was set as 3.5 MPa for the fluids saturation [38]. A FEI Qemscan 650F energy-dispersive spectroscopy field-emission scanning electron microscope (EDS–FESEM) was used to quantitatively investigate the samples’ topographical structure under vacuum condition (Figure 4). The sample workbench of FEI Qemscan 650F can simultaneously carry 14 samples with diameter less than 30 mm with a resolution of 0.8 nm.
During the hydration tests, all the samples needed to be transferred for re-hydration and re-drying periodically. To record the change of nano-pore structures precisely, we performed SEM for all samples and labelled the feature points before the experiments. Therefore, the samples could be replaced to initial positions by these featured points and coordinates. Furthermore, to investigate the effect of temperature on hydration anisotropy, 20 samples were divided into two groups and immersed in a GGS42 HTHP Filtration Press with a pressure of 3.5 MPa and temperatures of 80 and 120 °C. We used FD-1A-50 vacuum freezing dryer to dry the samples and ETD-100AF coating machine to re-spray carbon film. Finally, EDS–FE-SEM was applied again to characterize the labelled micro-structures.

3. Results and Discussion

3.1. Effect of Time on Hydration

Parallel to bedding plane: Figure 3 shows the variation of shale hydration with time (from 1 to 5 days) along the direction of parallel to lamination with pressure of 3.5 MPa at 80 °C. The results indicate that the width of pre-existing micro-fracture gradually decreases from 212 to 142 nm at the end first day of immersion (Figure 5a). At the end of the third day, the micro-fracture appeared to heal in some extent (Figure 5b). However, at the end of fifth day, the fracture surfaces started to spall and collapse, leading to an increase of fracture width from 476 to 694 nm. Taken together, the shale hydration processes with imbibition parallel to the bedding plane likely enlarged the width of micro-fracture due to the fluid–shale interaction. This physicochemical process may not only increase the transmissibility of in situ micro-fracture, but would also re-activate these micro-fracture by connecting the individual ones, which potentially contributes to shale gas production (Figure 5c). Our observations also account for the generation of hydrated micro-fractures during shale imbibition [15,39]. Ghanbari and Dehghanpour [15] report a similar observation on micro-fracture generation due to the clay hydration, although the details of whole hydration process are omitted. Chakraborty et al. [39] observed the healing of micro-fracture during shale spontaneous imbibition. However, they did not report the subsequent process that micro-fracture would re-open due to clay (especially the smectite) hydration-induced surface collapse. In this work, we observed the time effect on the generation of hydrated micro-fracture. To be more specific, micro-fracture would close first, then heal and finally re-open due to the surface peeling.
Smectite likely peels off from the pore surfaces, thus increasing the width of micro-fracture. This is largely due to the incompatible deformation between smectite and illite. When shale imbibes water along the bedding planes, the fluids contact with the surface of existing micro-fractures, which facilitates the expansion of smectite and illite [13,17,40]. Initially, the clay expansion may decrease the width of micro-fracture and gradually heal these cracks. However, further expansion of smectite would trigger fracture surface collapse and generate new fractures as shown in Figure 5. This process depends considerably on the clay mineral compositions in the sublayers of laminations [41]. Previous studies point out that the expansion degree of smectite and illite would increase with increasing water content, but smectite has a higher swelling capacity than illite [42,43]. Therefore, the strong swelling of smectite may not only increase the width of micro-fracture due to the peeling-off process, but could also loosen the surrounding minerals attachment. As a result, it is possible that some grains are forced out from the free micro-fracture surfaces because of the smectite swelling (see the top left corner of Figure 5c), which may also contribute to the water imbibition and shale gas production.
Perpendicular to bedding plane: compared to hydration along the direction of parallel to shale bedding planes, we did not observe induced micro-fracture on the sublayer surfaces when the imbibition was perpendicular to the bedding planes (Figure 6). However, the dissolved pores area on the sample surfaces increased with immersion time (Figure 7). It is worth noting that the image processing program ImageJ was used to analyze the variation of dissolved pores area on the shale surface before and after immersion. Figure 6 shows that compared to initial condition, area of dissolved pores increased significantly with increasing immersion time from 1 to 5 days. Our results indicate that water saturation likely dissolves minerals on shale surfaces, especially feldspar (Figure 6a–c), thus generating dissolved pores, although more quantitative work remains to be made to further quantify the dissolved minerals.
Feldspar dissolution likely yields additional pore spaces, which contributes to the low recovery of flowback water. When water uptake is perpendicular to laminations, the hydrophobic kerogens that lie along the sublayer surfaces act as a nano-filter to prevent water from flowing [44]. Therefore, the interaction between water and minerals inside the porous rock would be minimized. Rather, the water would react with rock surface, especially feldspar, thus generating dissolved pores. For example, Heydari and Wade [45] point out that feldspar may react with water under temperatures of 80 to 120 °C and release ions and other minerals, which leads to the generation of dissolved pores. Besides, it is also reported that the dissolution of feldspar can increase the formation porosity and permeability [46]. During the field shut-in period, a large amount of hydraulic fracturing fluid with additives is trapped in the shale fracture networks. These fluids can generate dissolved pores on the rock surface, thus enhancing the flow conductivity of the shale formation and increasing communication among the flowing channels. Moreover, the dissolution of feldspar may also consume huge amounts of water on the basis of the reaction. K A I S i O 8 + 6 H 2 O + H + A I O ( O H ) + 3 H 4 S i O 4 + K + [47,48] although more quantitative work on this remains to be made.

3.2. Effect of Temperature on Hydration

Parallel to bedding plane: increasing temperature increased the rate and degree of shale hydration, implying that shale hydration likely plays an important role in deep shale reservoirs. Figure 8 shows the effect of temperature on shale hydration with immersion time from 1 to 5 days under the pressure of 3.5 MPa. Compared to the low temperature (80 °C), for a higher temperature (120 °C), the existing micro-fracture appeared to close at the end of first day and completely heal at the end of three days. Although new fractures were generated after five days’ immersion for both temperature conditions, the high temperature significantly enlarged the surface stretching degree as shown in Figure 8.
The high temperature accelerated shale hydration and the micro-fracture healing due to a greater swelling rate of smectite and illite on rock surface. This process also promotes the fracture surface collapse and the creation of new fractures that are parallel to the bedding planes thus enhances formation conductivity. Besides, literature show that the interaction between hydraulic fracturing fluids and shale during well shut-in period may weaken the shale surface and trigger proppants embedment at in-situ temperature [49]. Therefore, we tentatively conclude that temperature would affect the formation conductivity variation through shale hydration as a complex result of micro-fracture generation and mineral dissolution.
Perpendicular to bedding plane: increasing temperature increased the dissolved area on shale surfaces when the imbibition was perpendicular to bedding planes (Figure 9). Compared to 80 °C, immersing samples at 120 °C for 1 day and 5 days increased the percentage of dissolved pores area from 1.22% to 1.66% and 14.61% to 29.99%, respectively (Figure 10). Our results indicated that high temperature accelerated the rate and degree of shale-water interaction and thus prompted the K-feldspar and Na-feldspar dissolution. We did not observe new generated micro-fracture even at high temperature for imbibition perpendicular to bedding planes, which is in line with previous observations.
K-feldspar and Na-feldspar are the main dissolved minerals which contributes to increase of the porosity at micro-fracture surfaces. When the imbibition is perpendicular to the bedding planes, high temperature slightly facilitates the feldspar dissolution. This is because the Gibbs energy of K-feldspar and Na-feldspar decreases with increasing temperature so that the dissolving process would occur with lower energy barrier [50,51,52]. In contrast, the dissolution of Ca-feldspar is restricted at high temperature [52]. To summarize, increasing temperature increases the percentage of dissolved pores area on shale sublayer surface, which significantly enhances the water uptake in shale.

3.3. Proposed Mechanisms and Implications

In this work, our first goal was to acknowledge the significance of shale anisotropy on water uptake, typically under in situ reservoir temperature and an elevated pressure. Our second goal was to characterize the micro-fracture initiation and propagation with respect to shale anisotropy during water uptake. To understand how the anisotropy of shale affects water uptake during hydraulic fracturing in shales, thus building an overall conceptual framework that supports the optimization and prediction of flowback water and shale gas production, we proposed a shale hydration mechanism that drives the evolution of micro-fracture initiation and propagation due to the complex physiochemical processes.
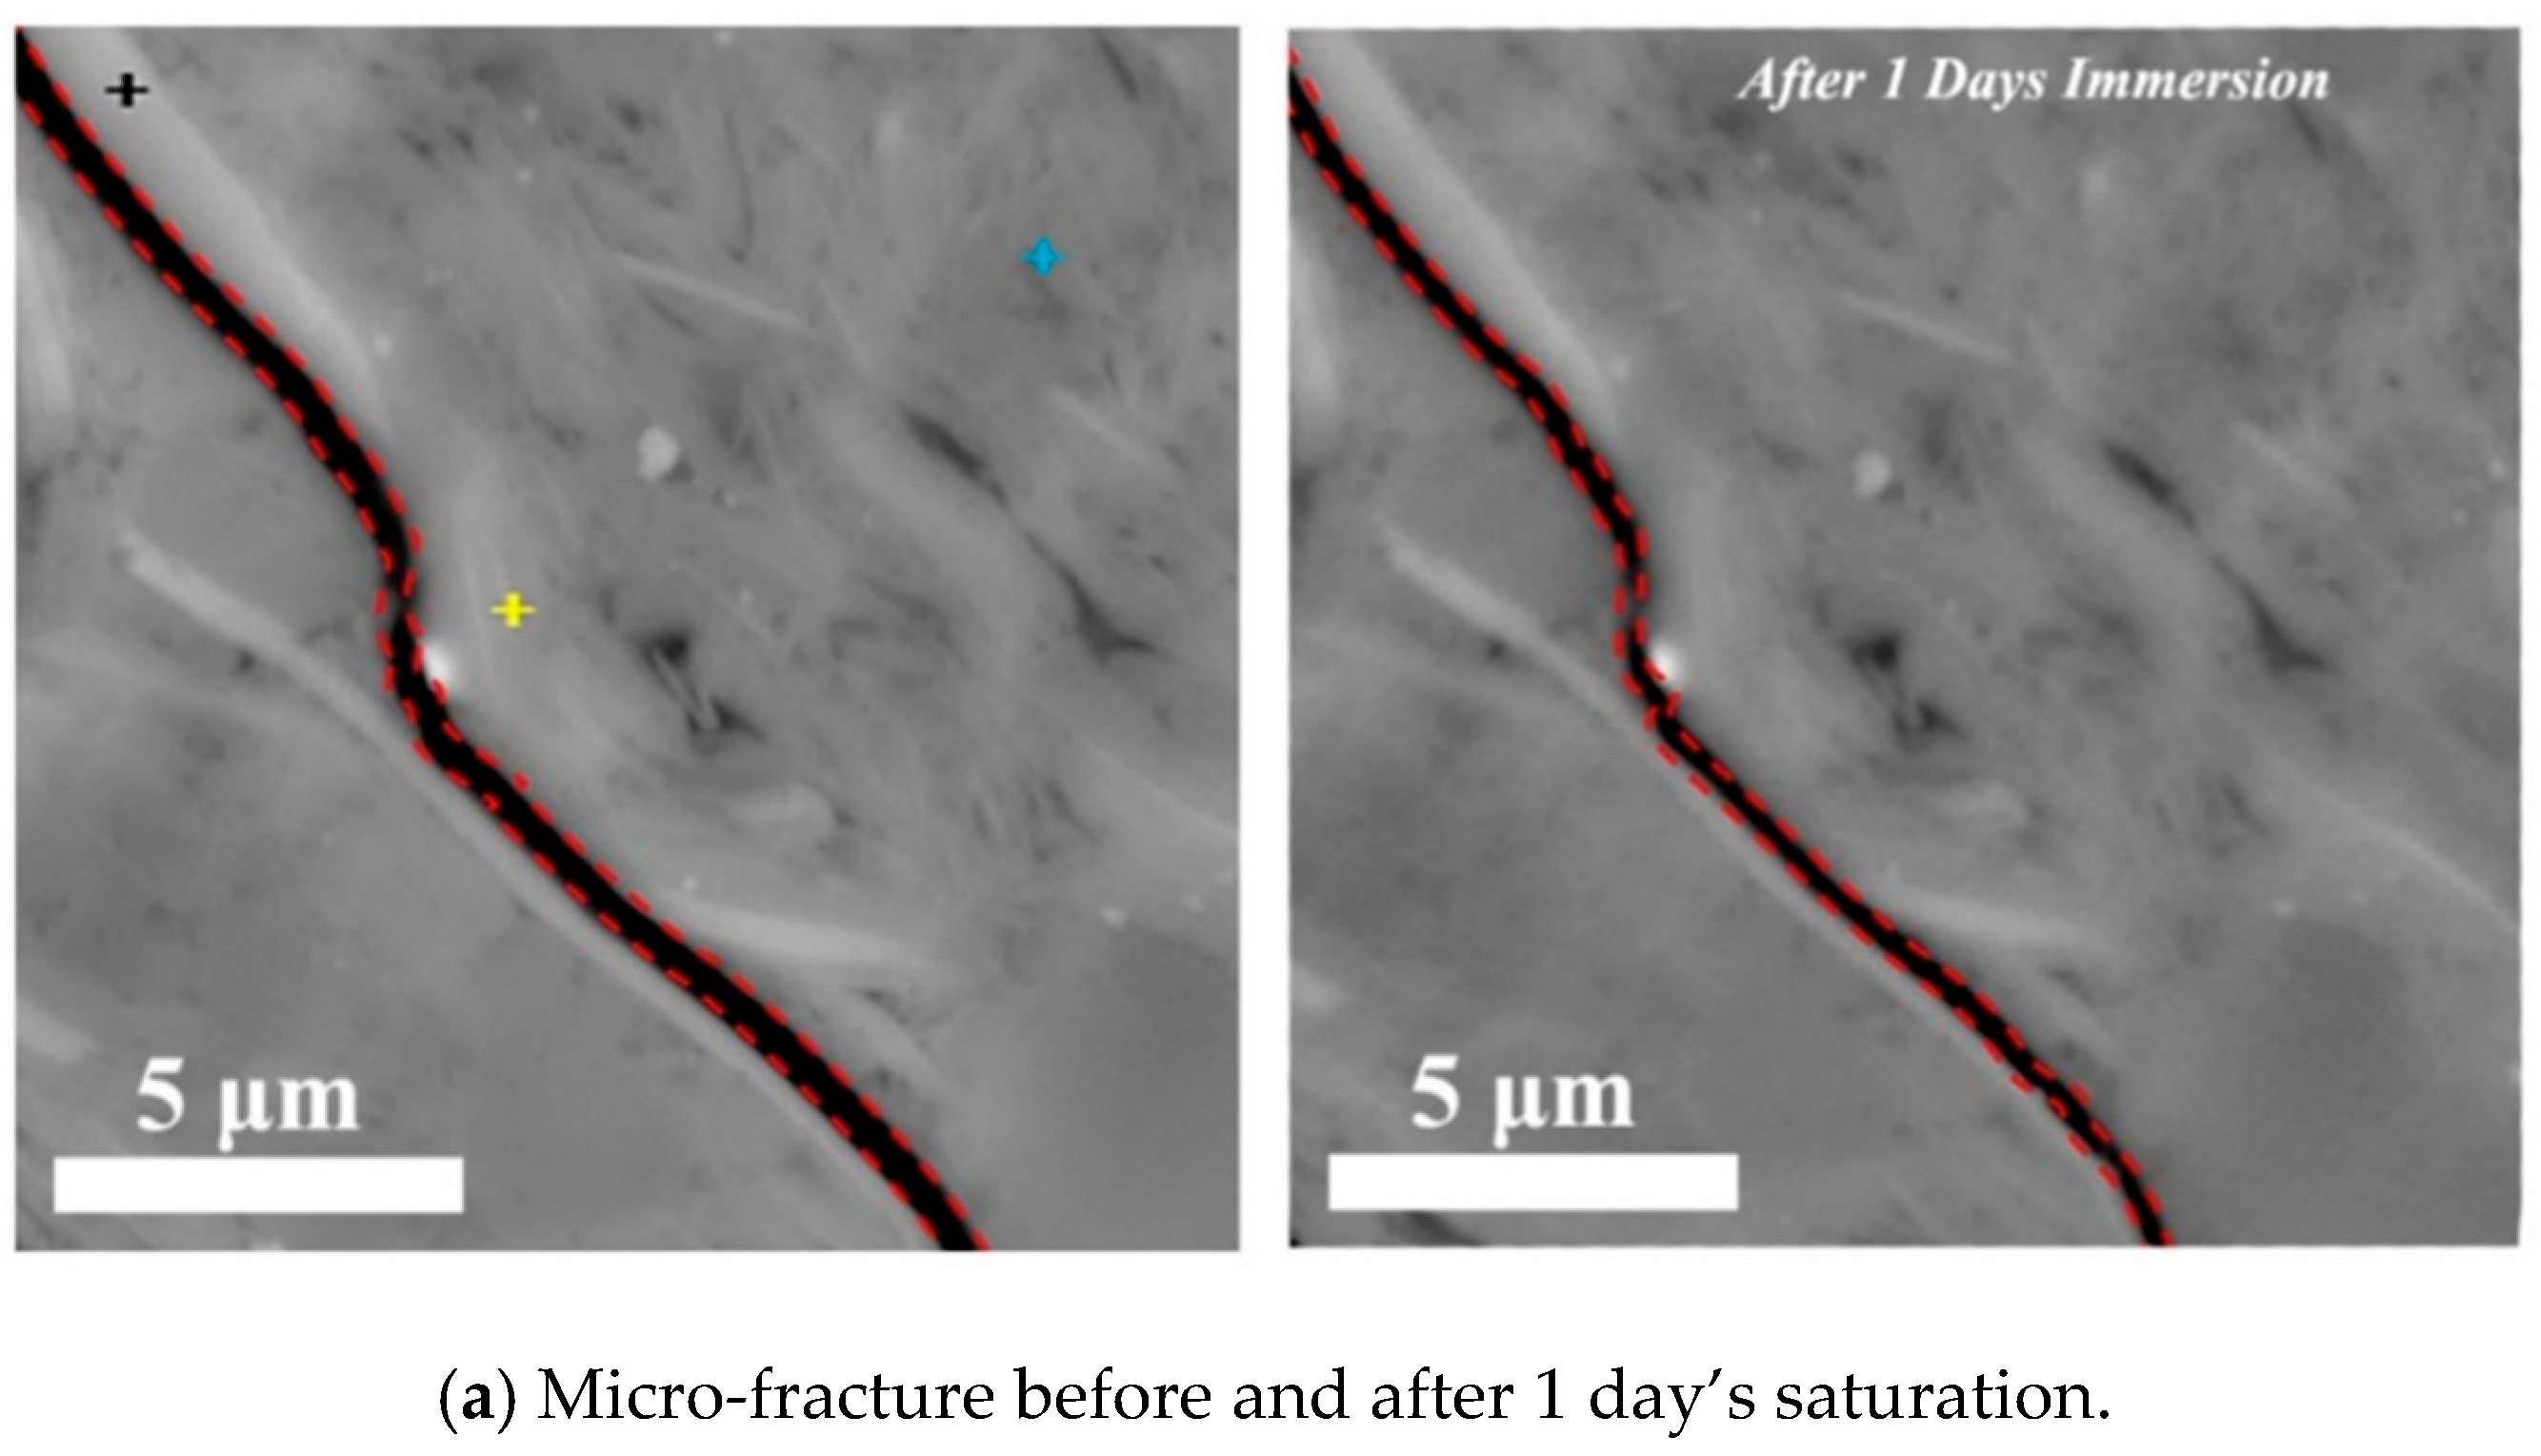
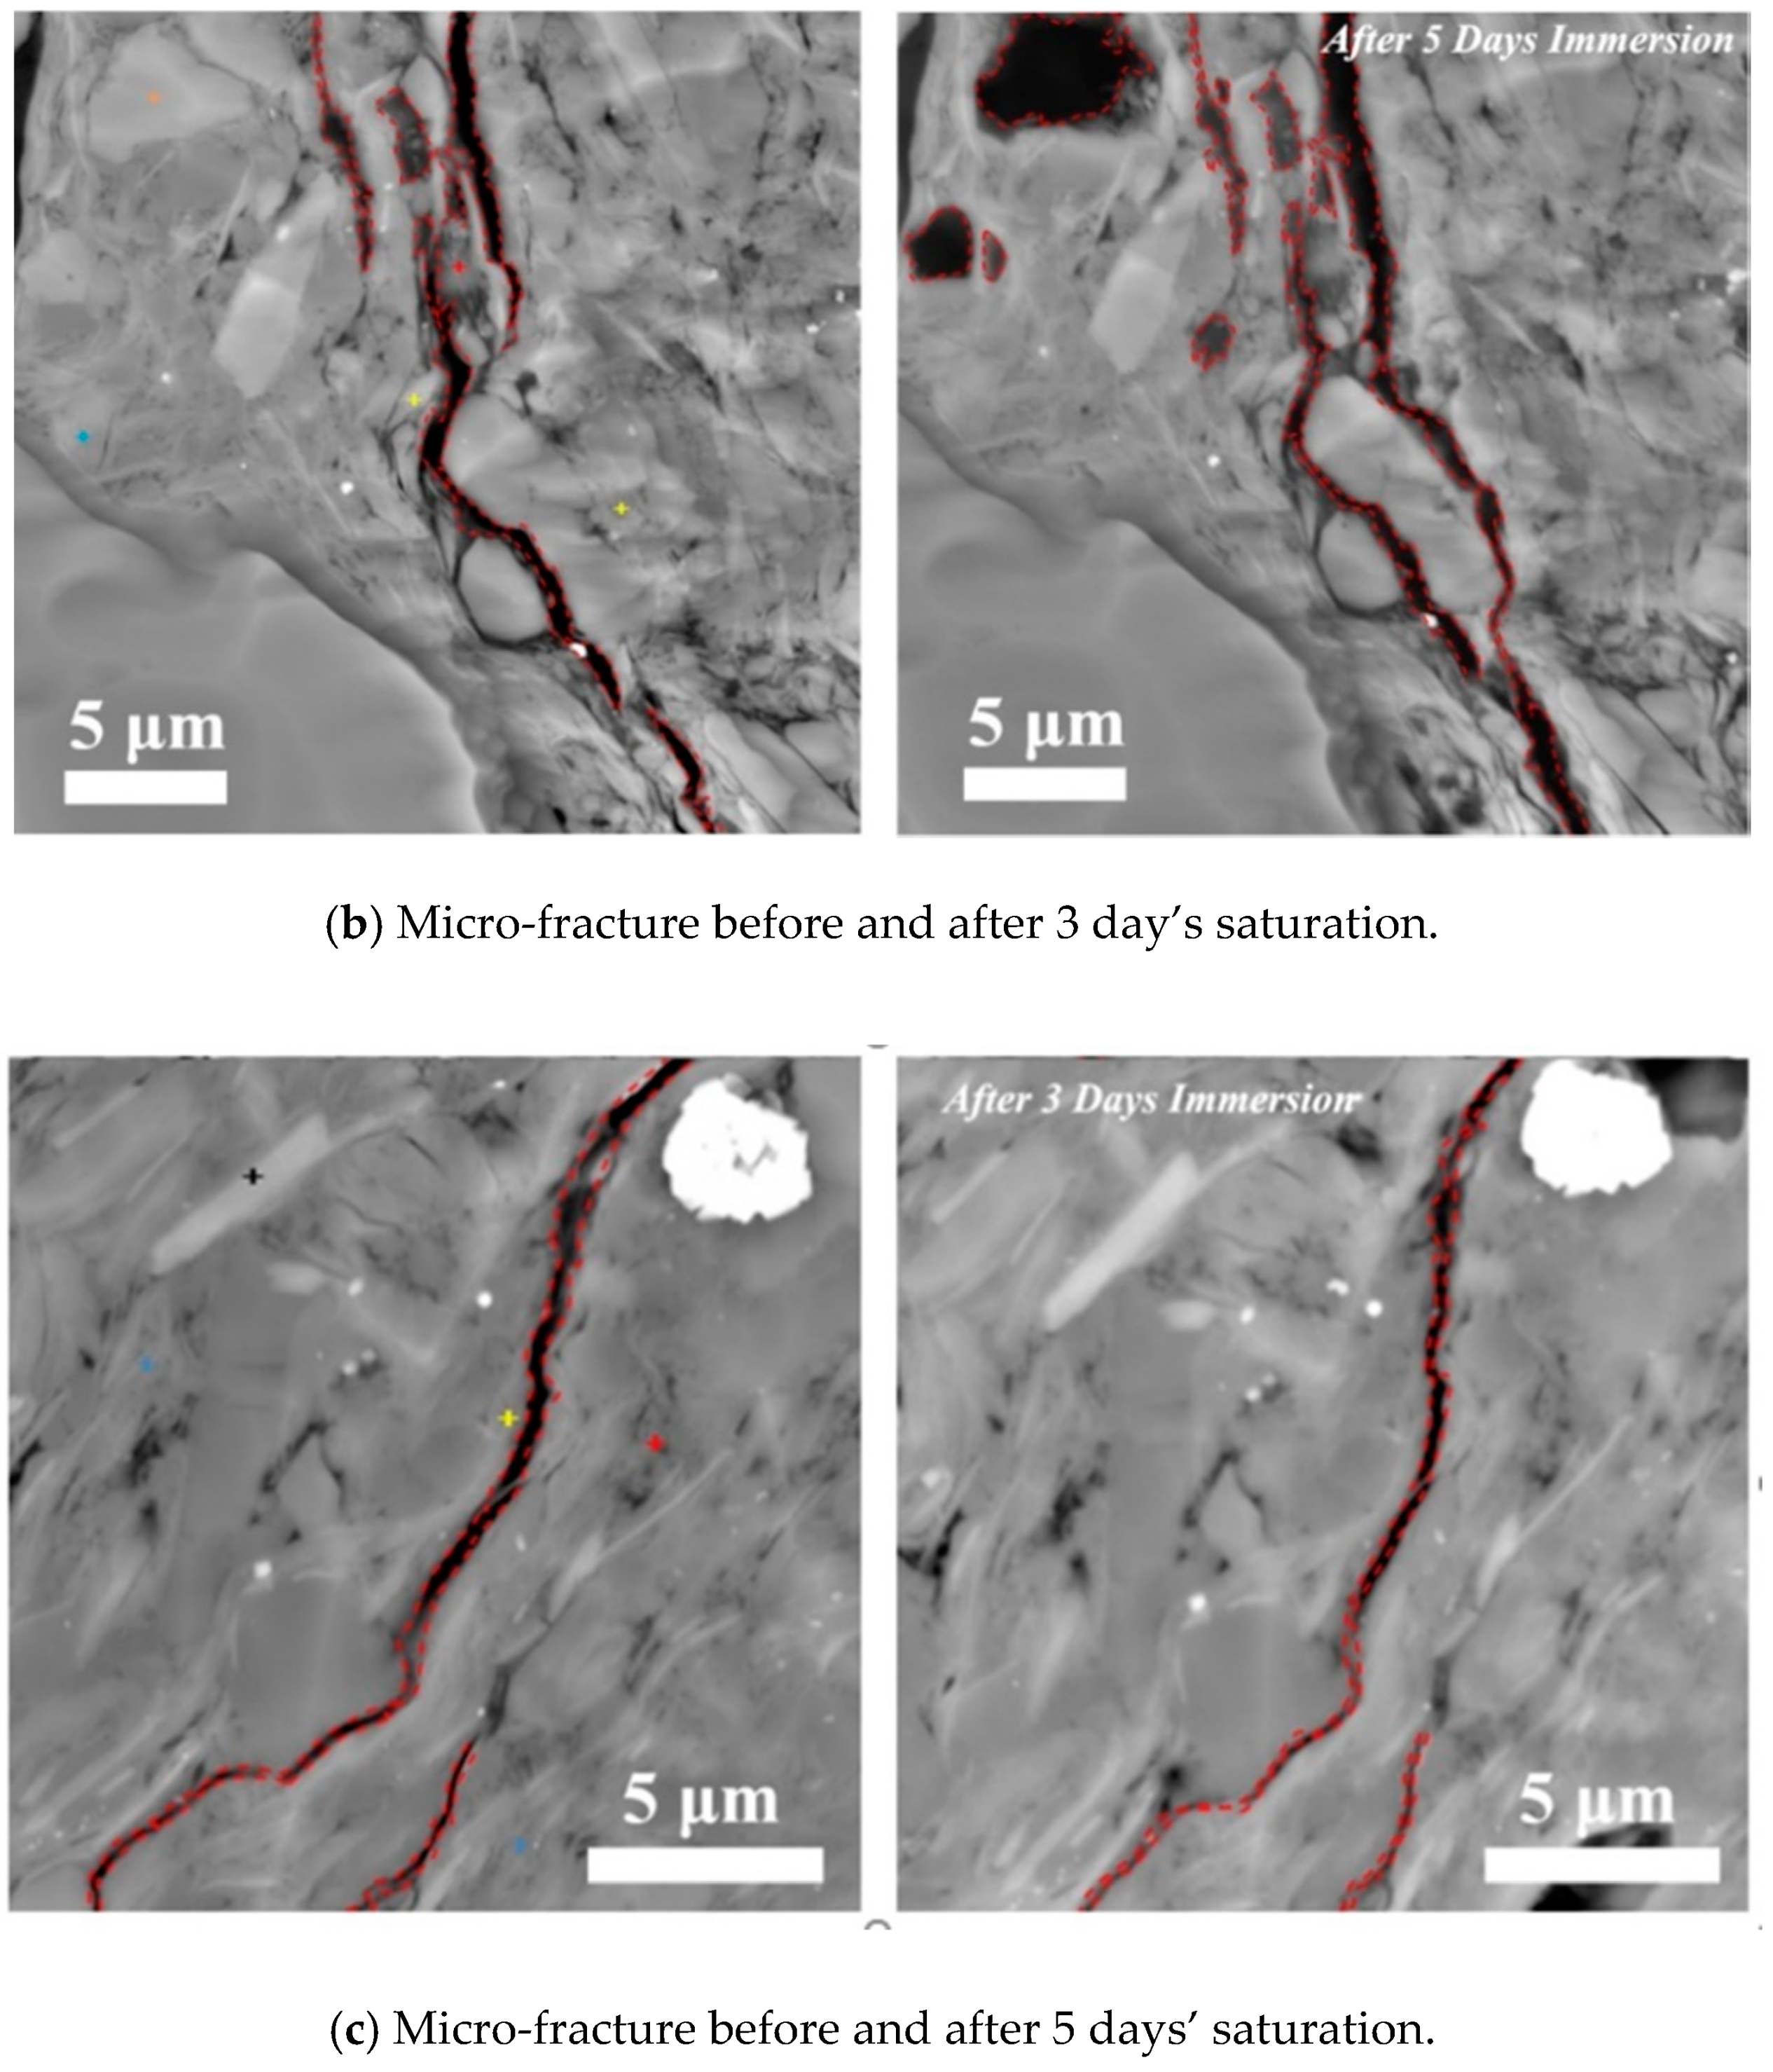
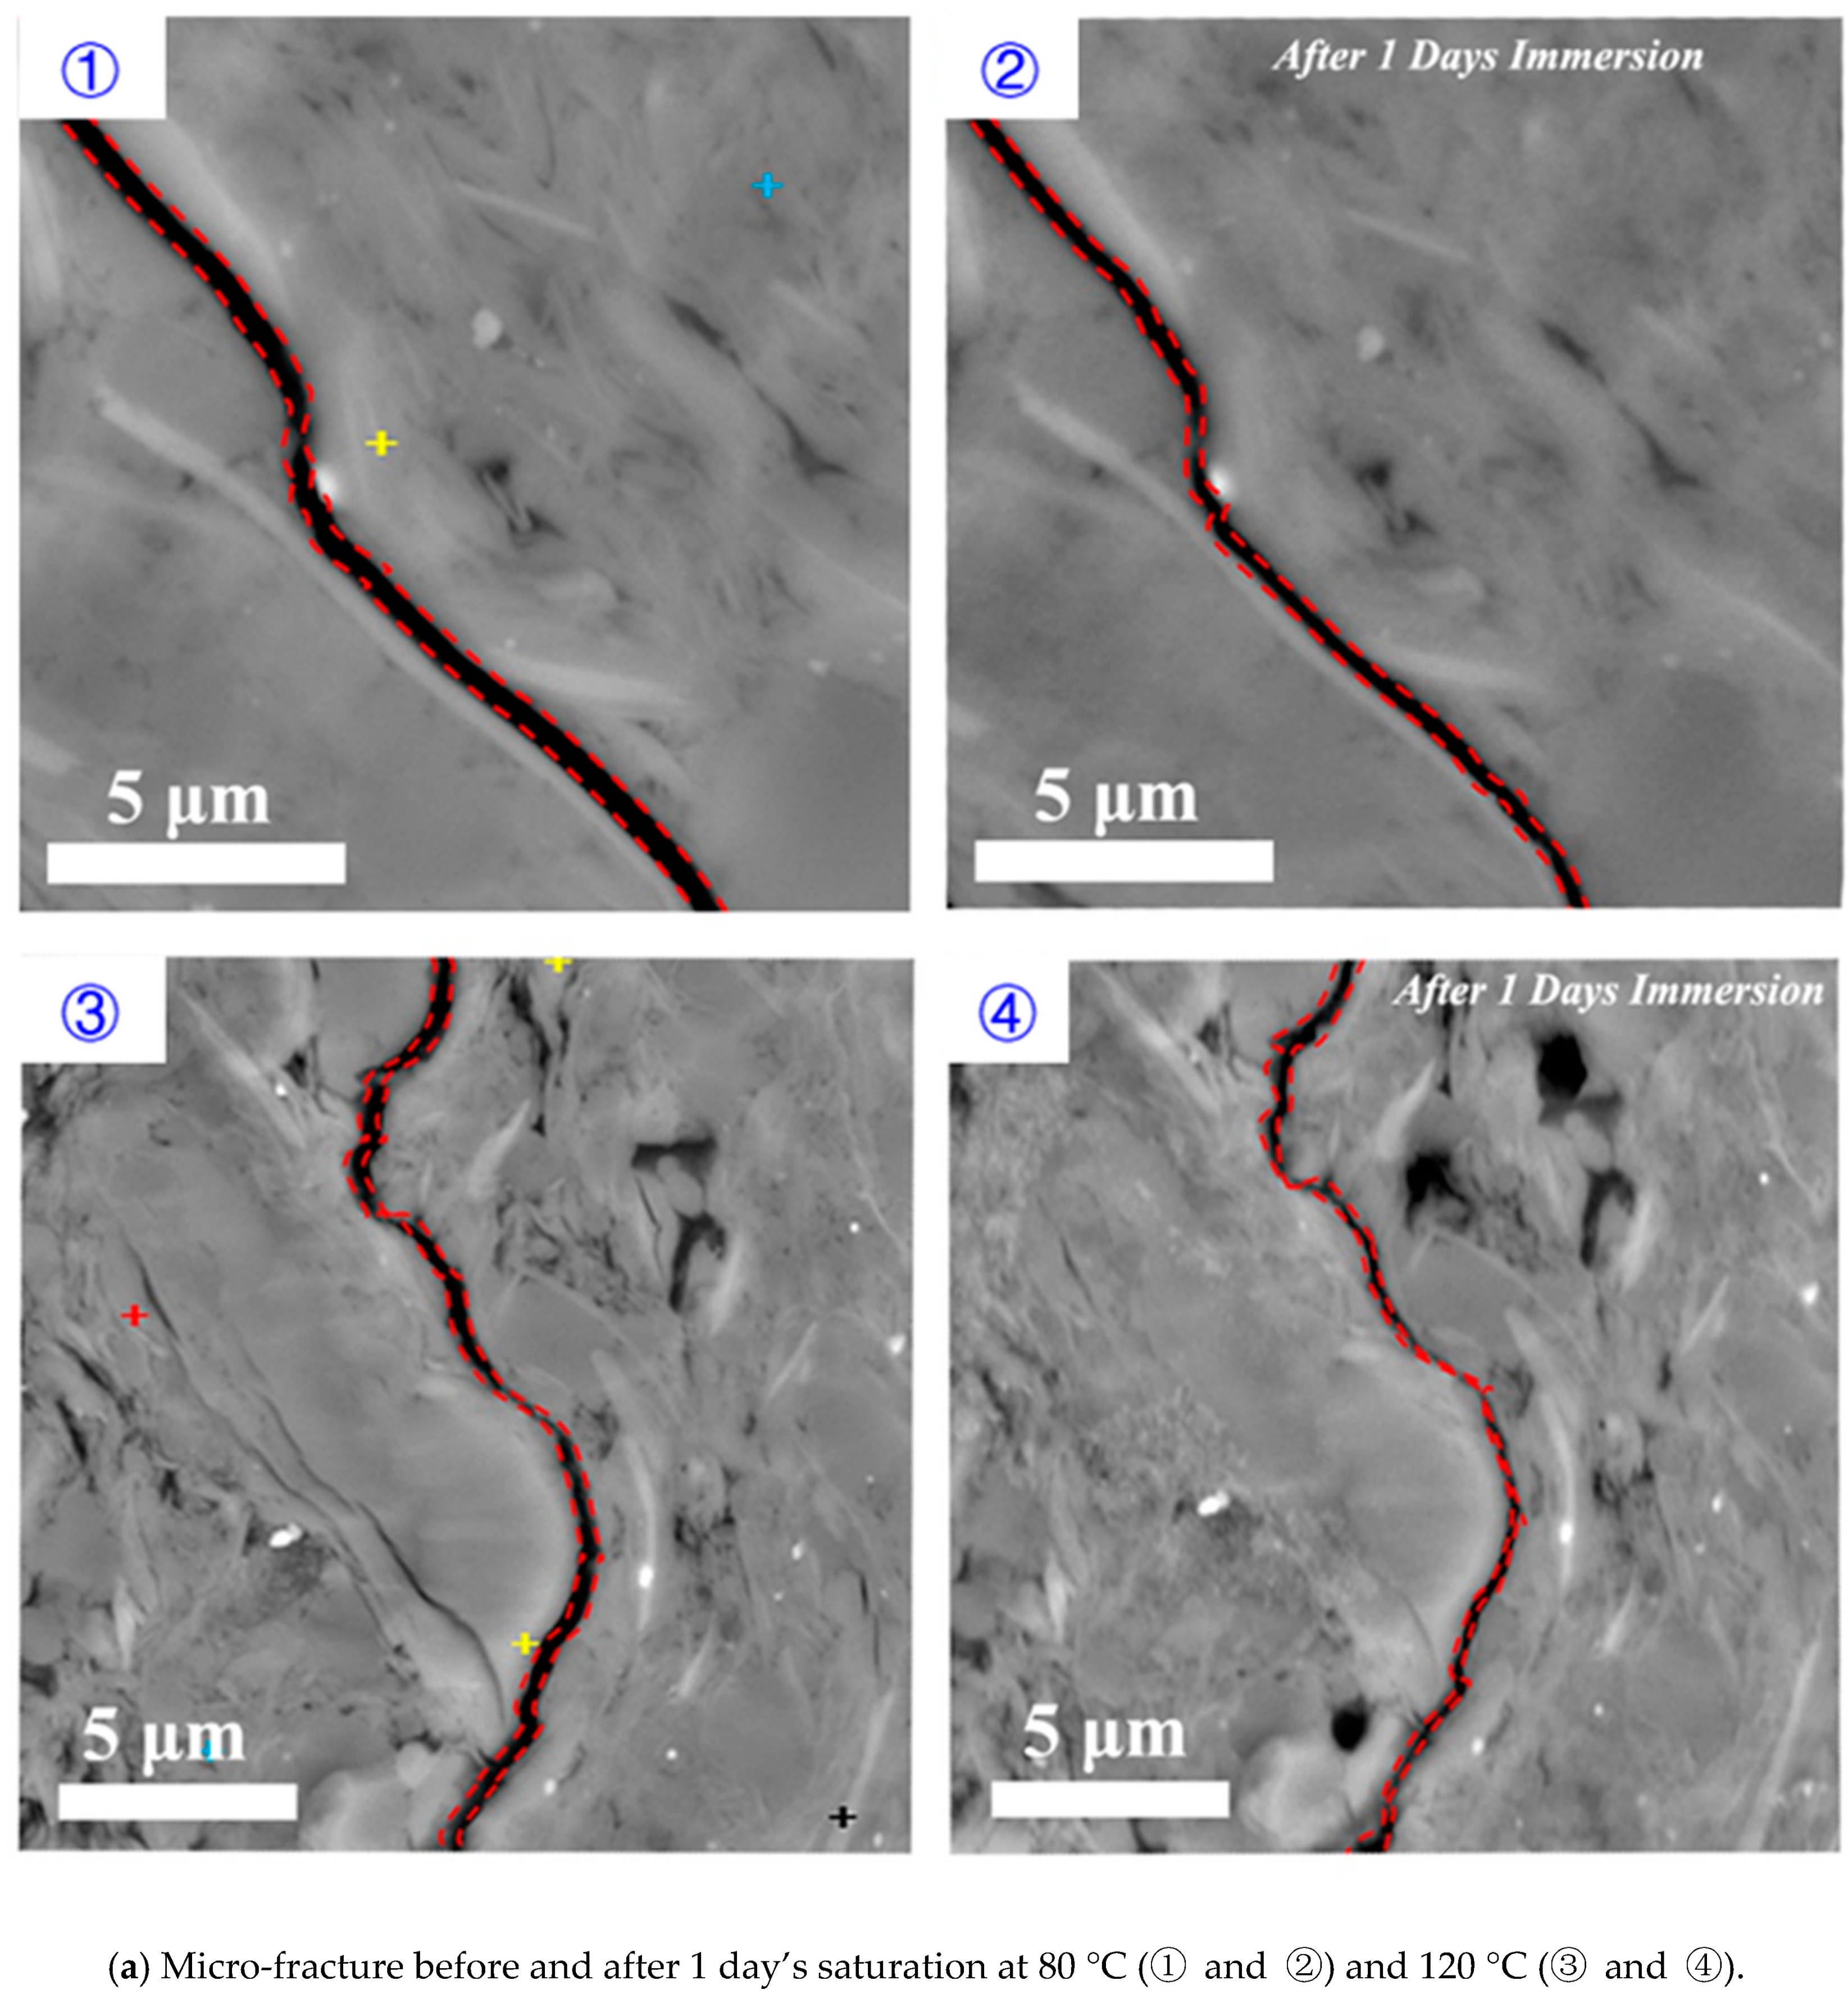
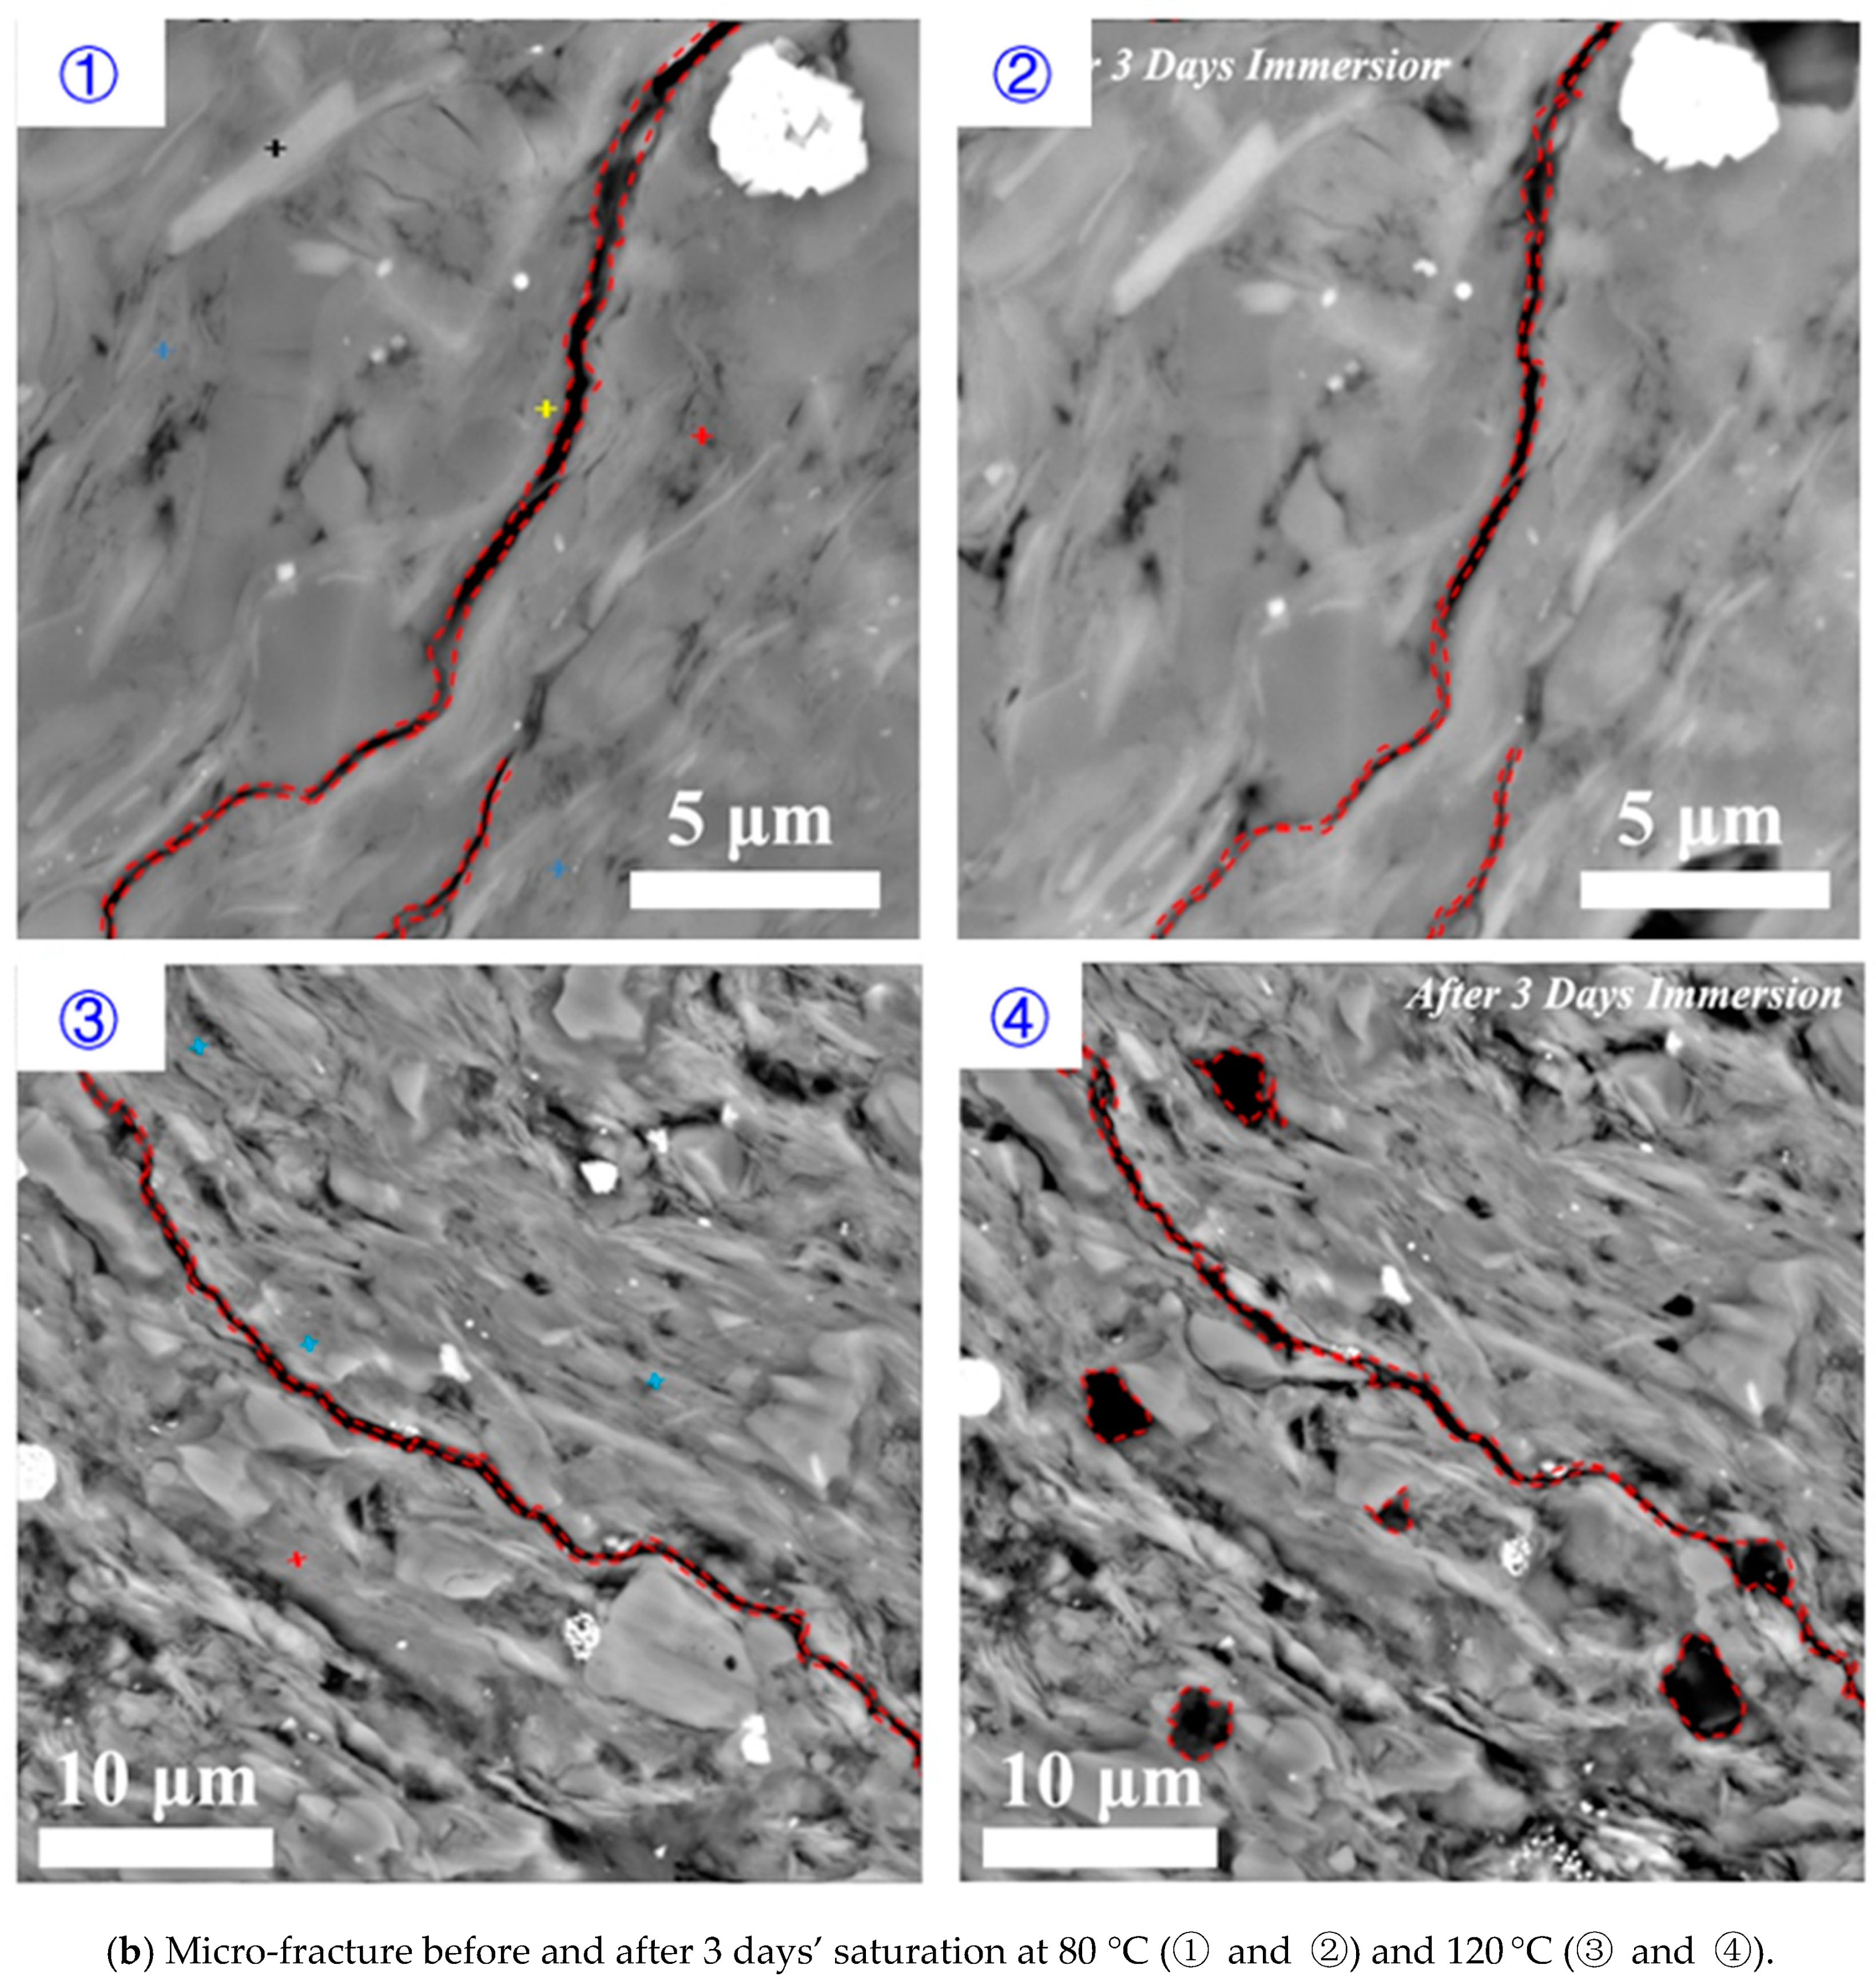
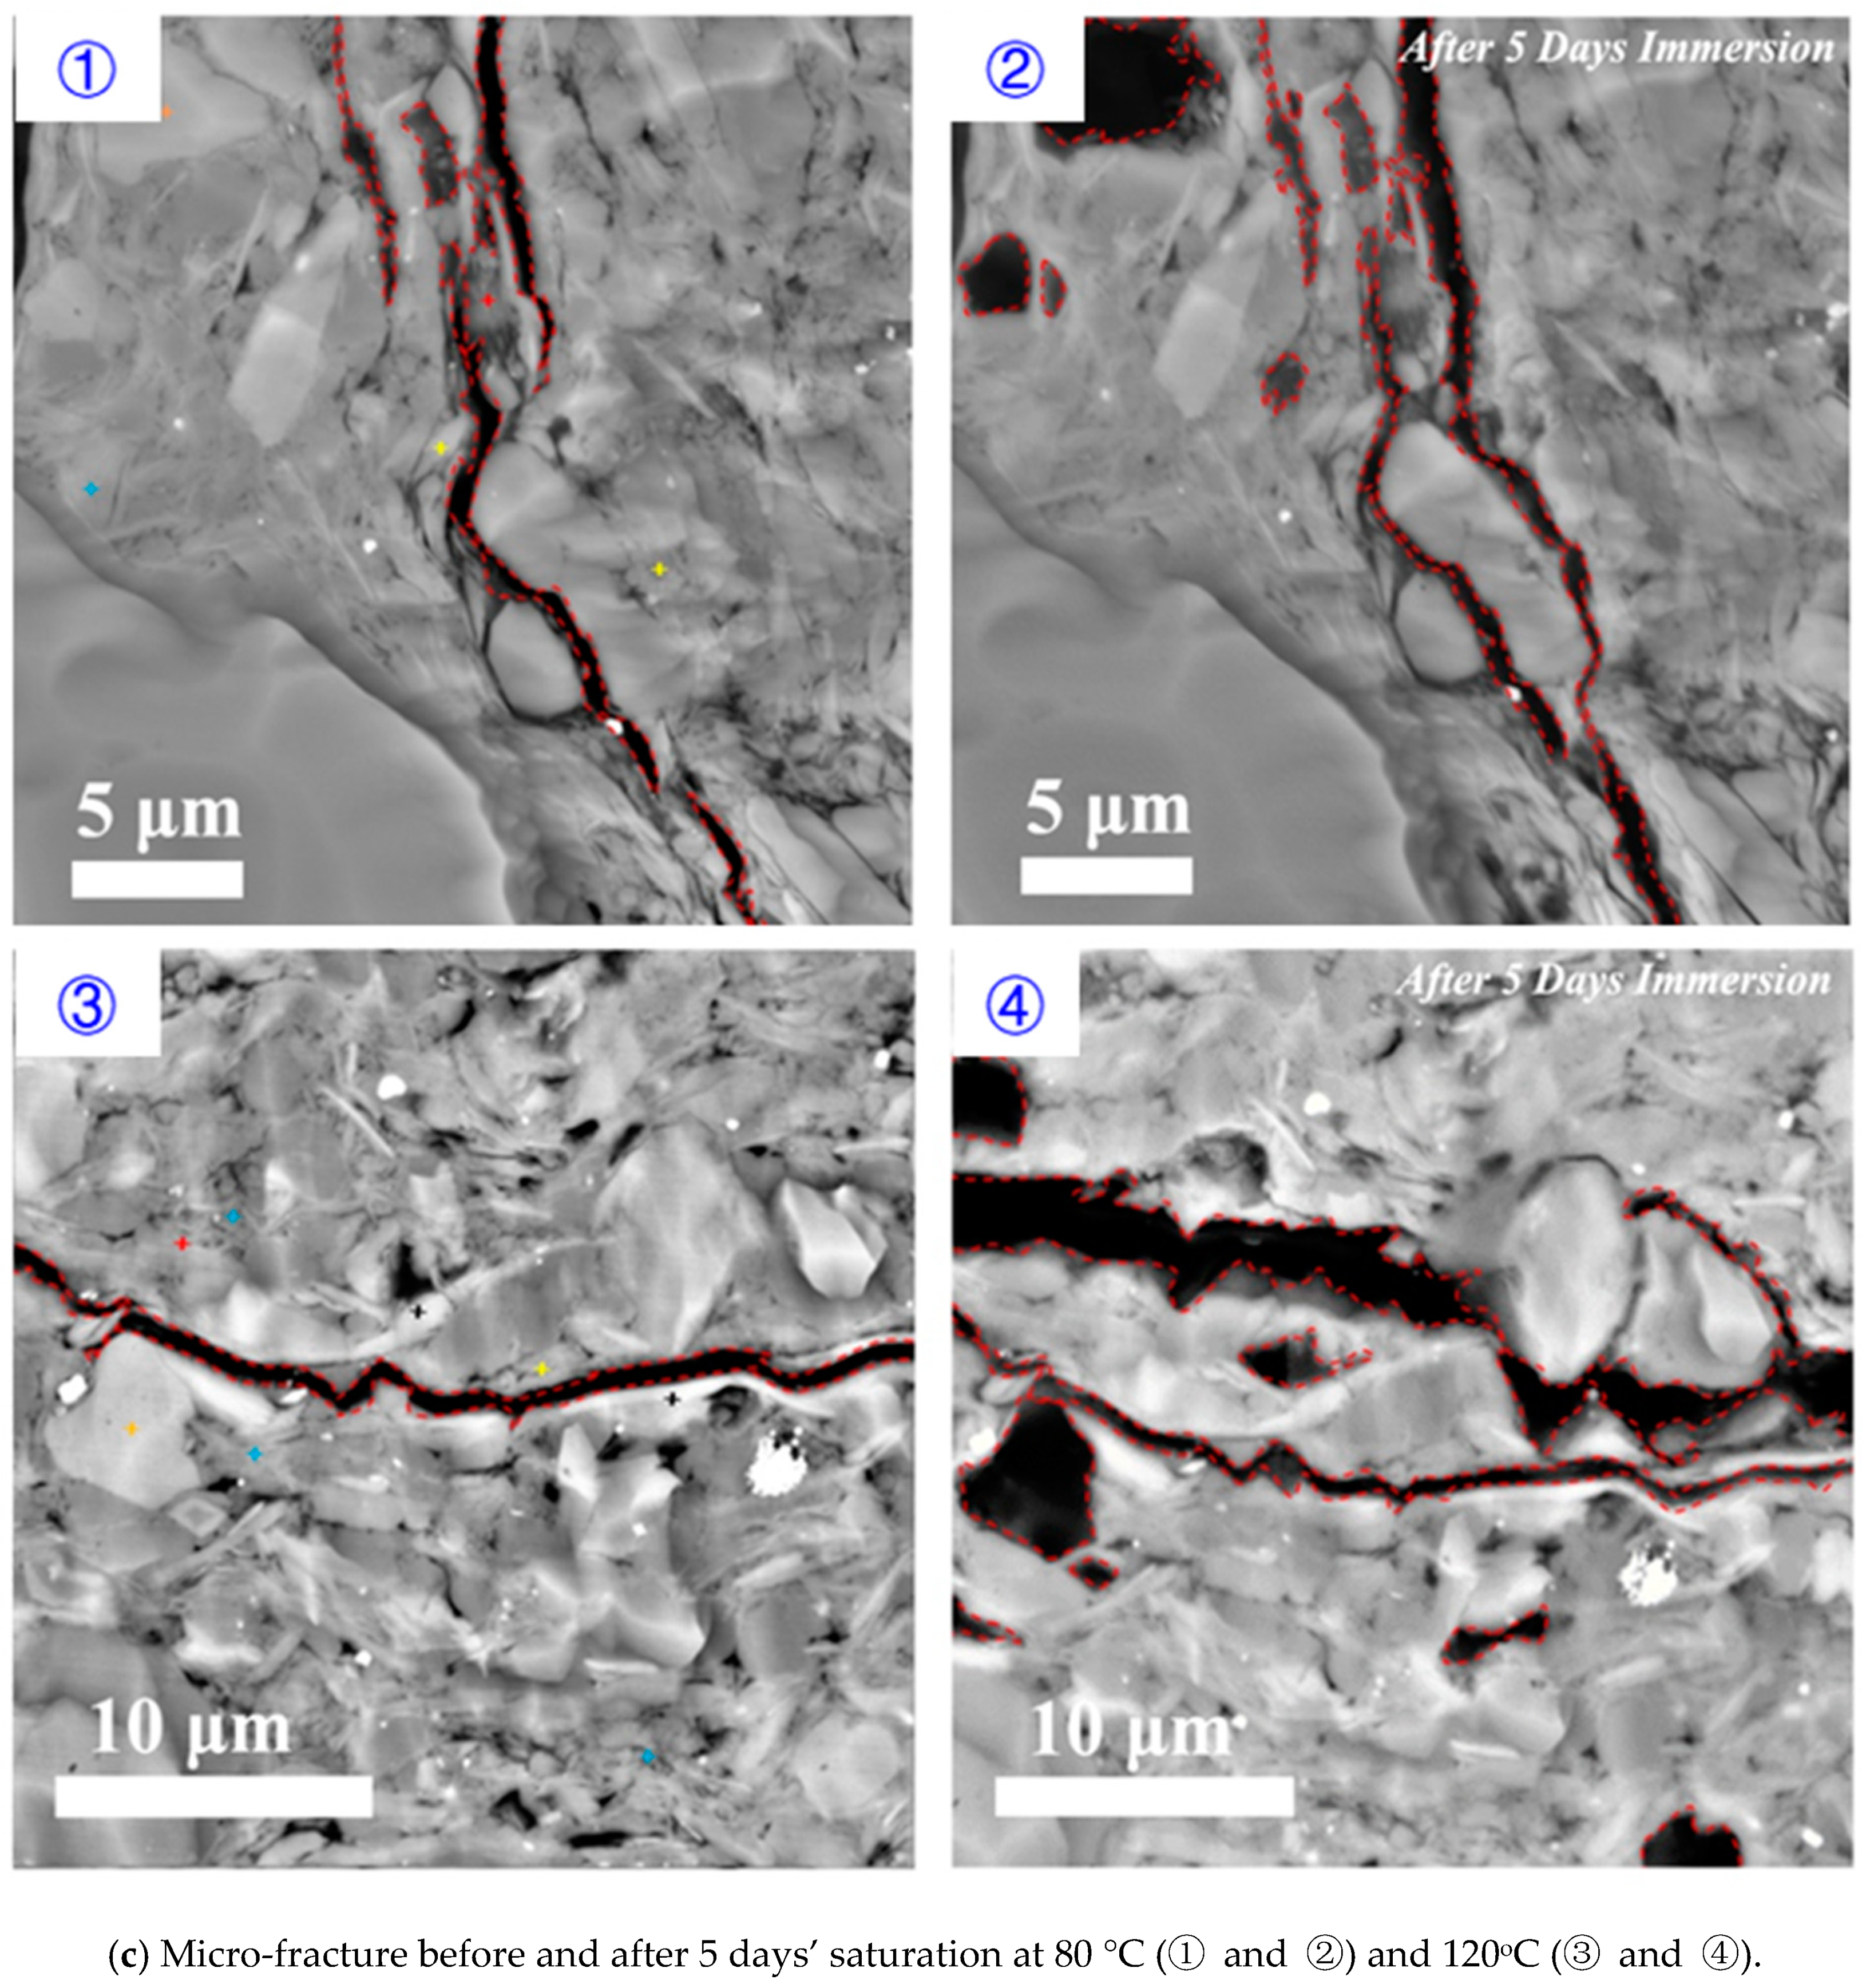
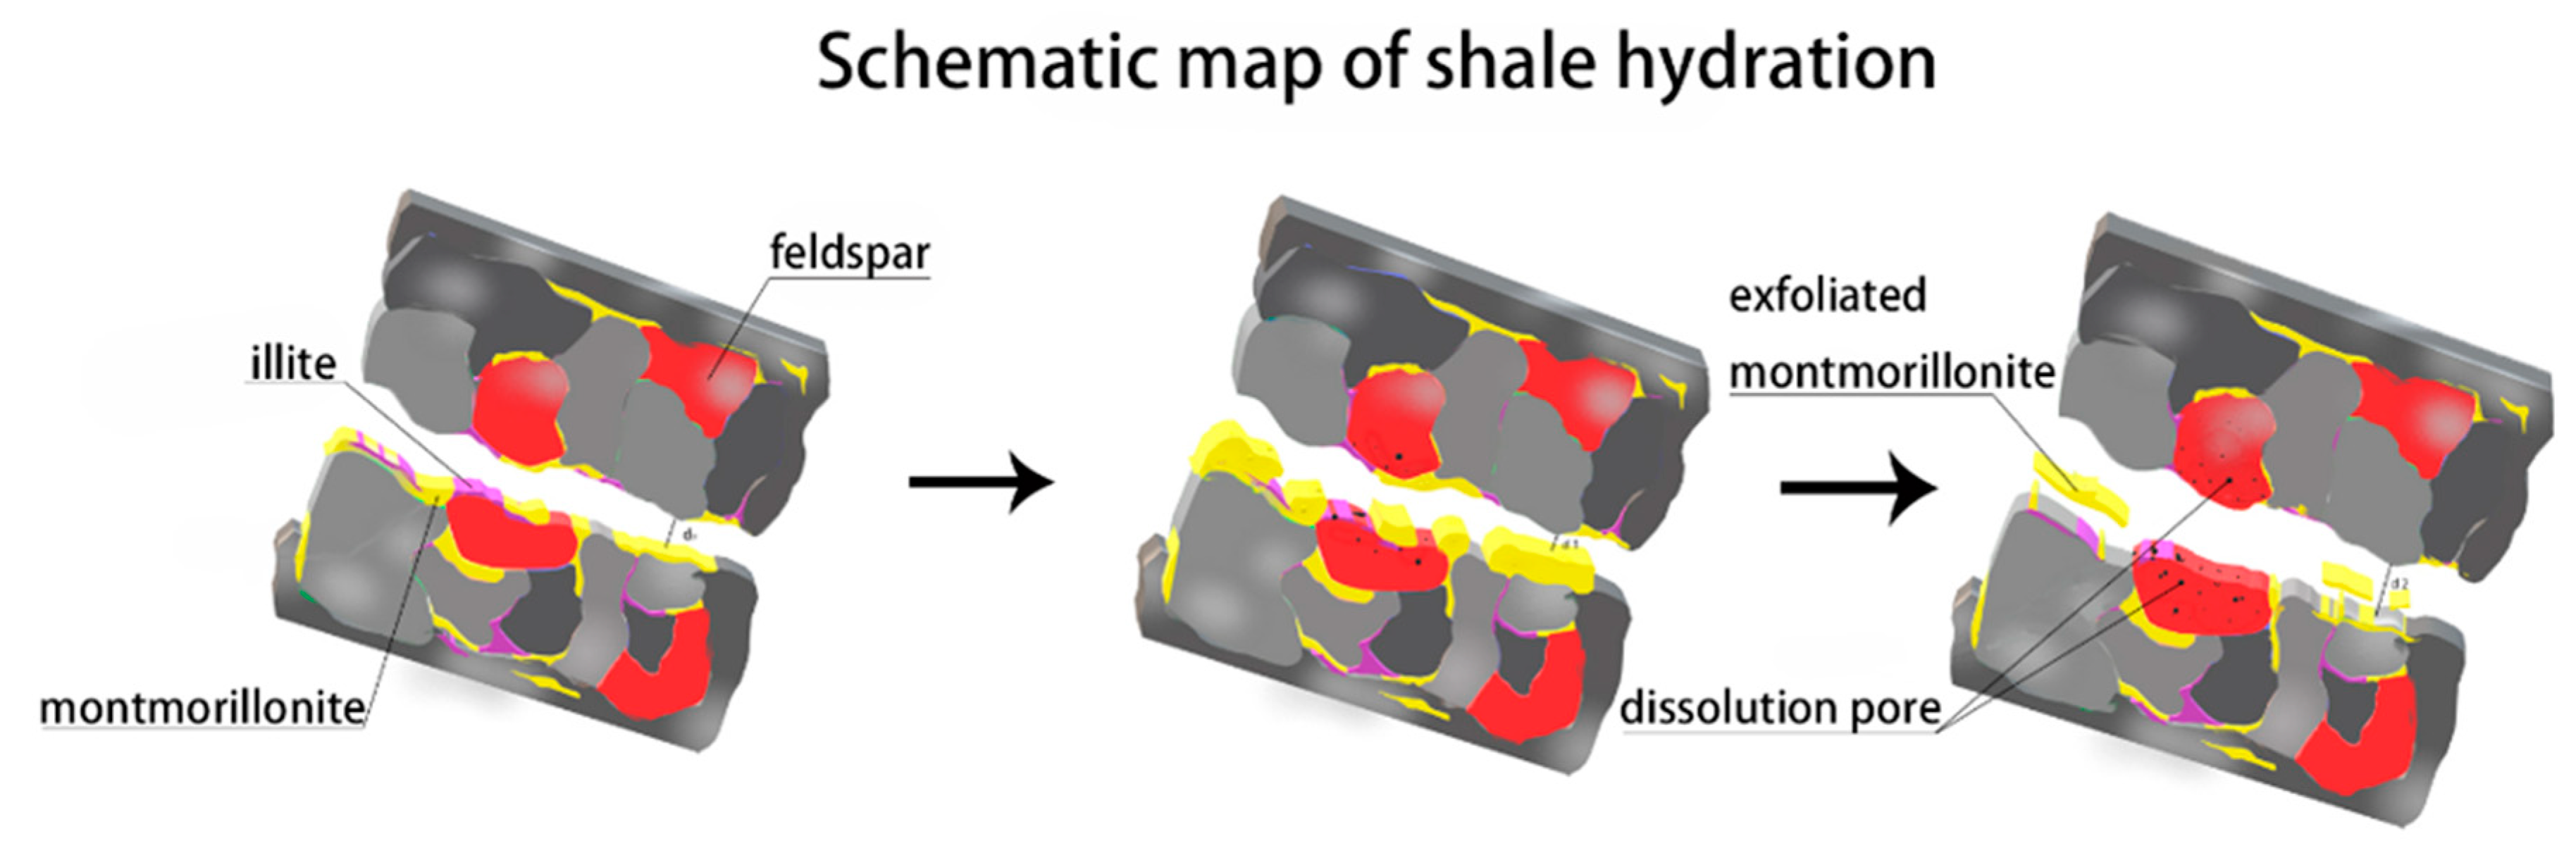
  • Surfaces in parallel to bedding planes govern the micro-fracture initiation and propagation. Upon the contact of fluid and shale samples, clay minerals such as smectite and illite on the surface of pre-existing micro-fracture would swell initially, which would lead micro-fracture to close and heal. Finally, smectite would collapse, thus generating new micro-fracture with a greater width (Figure 11).
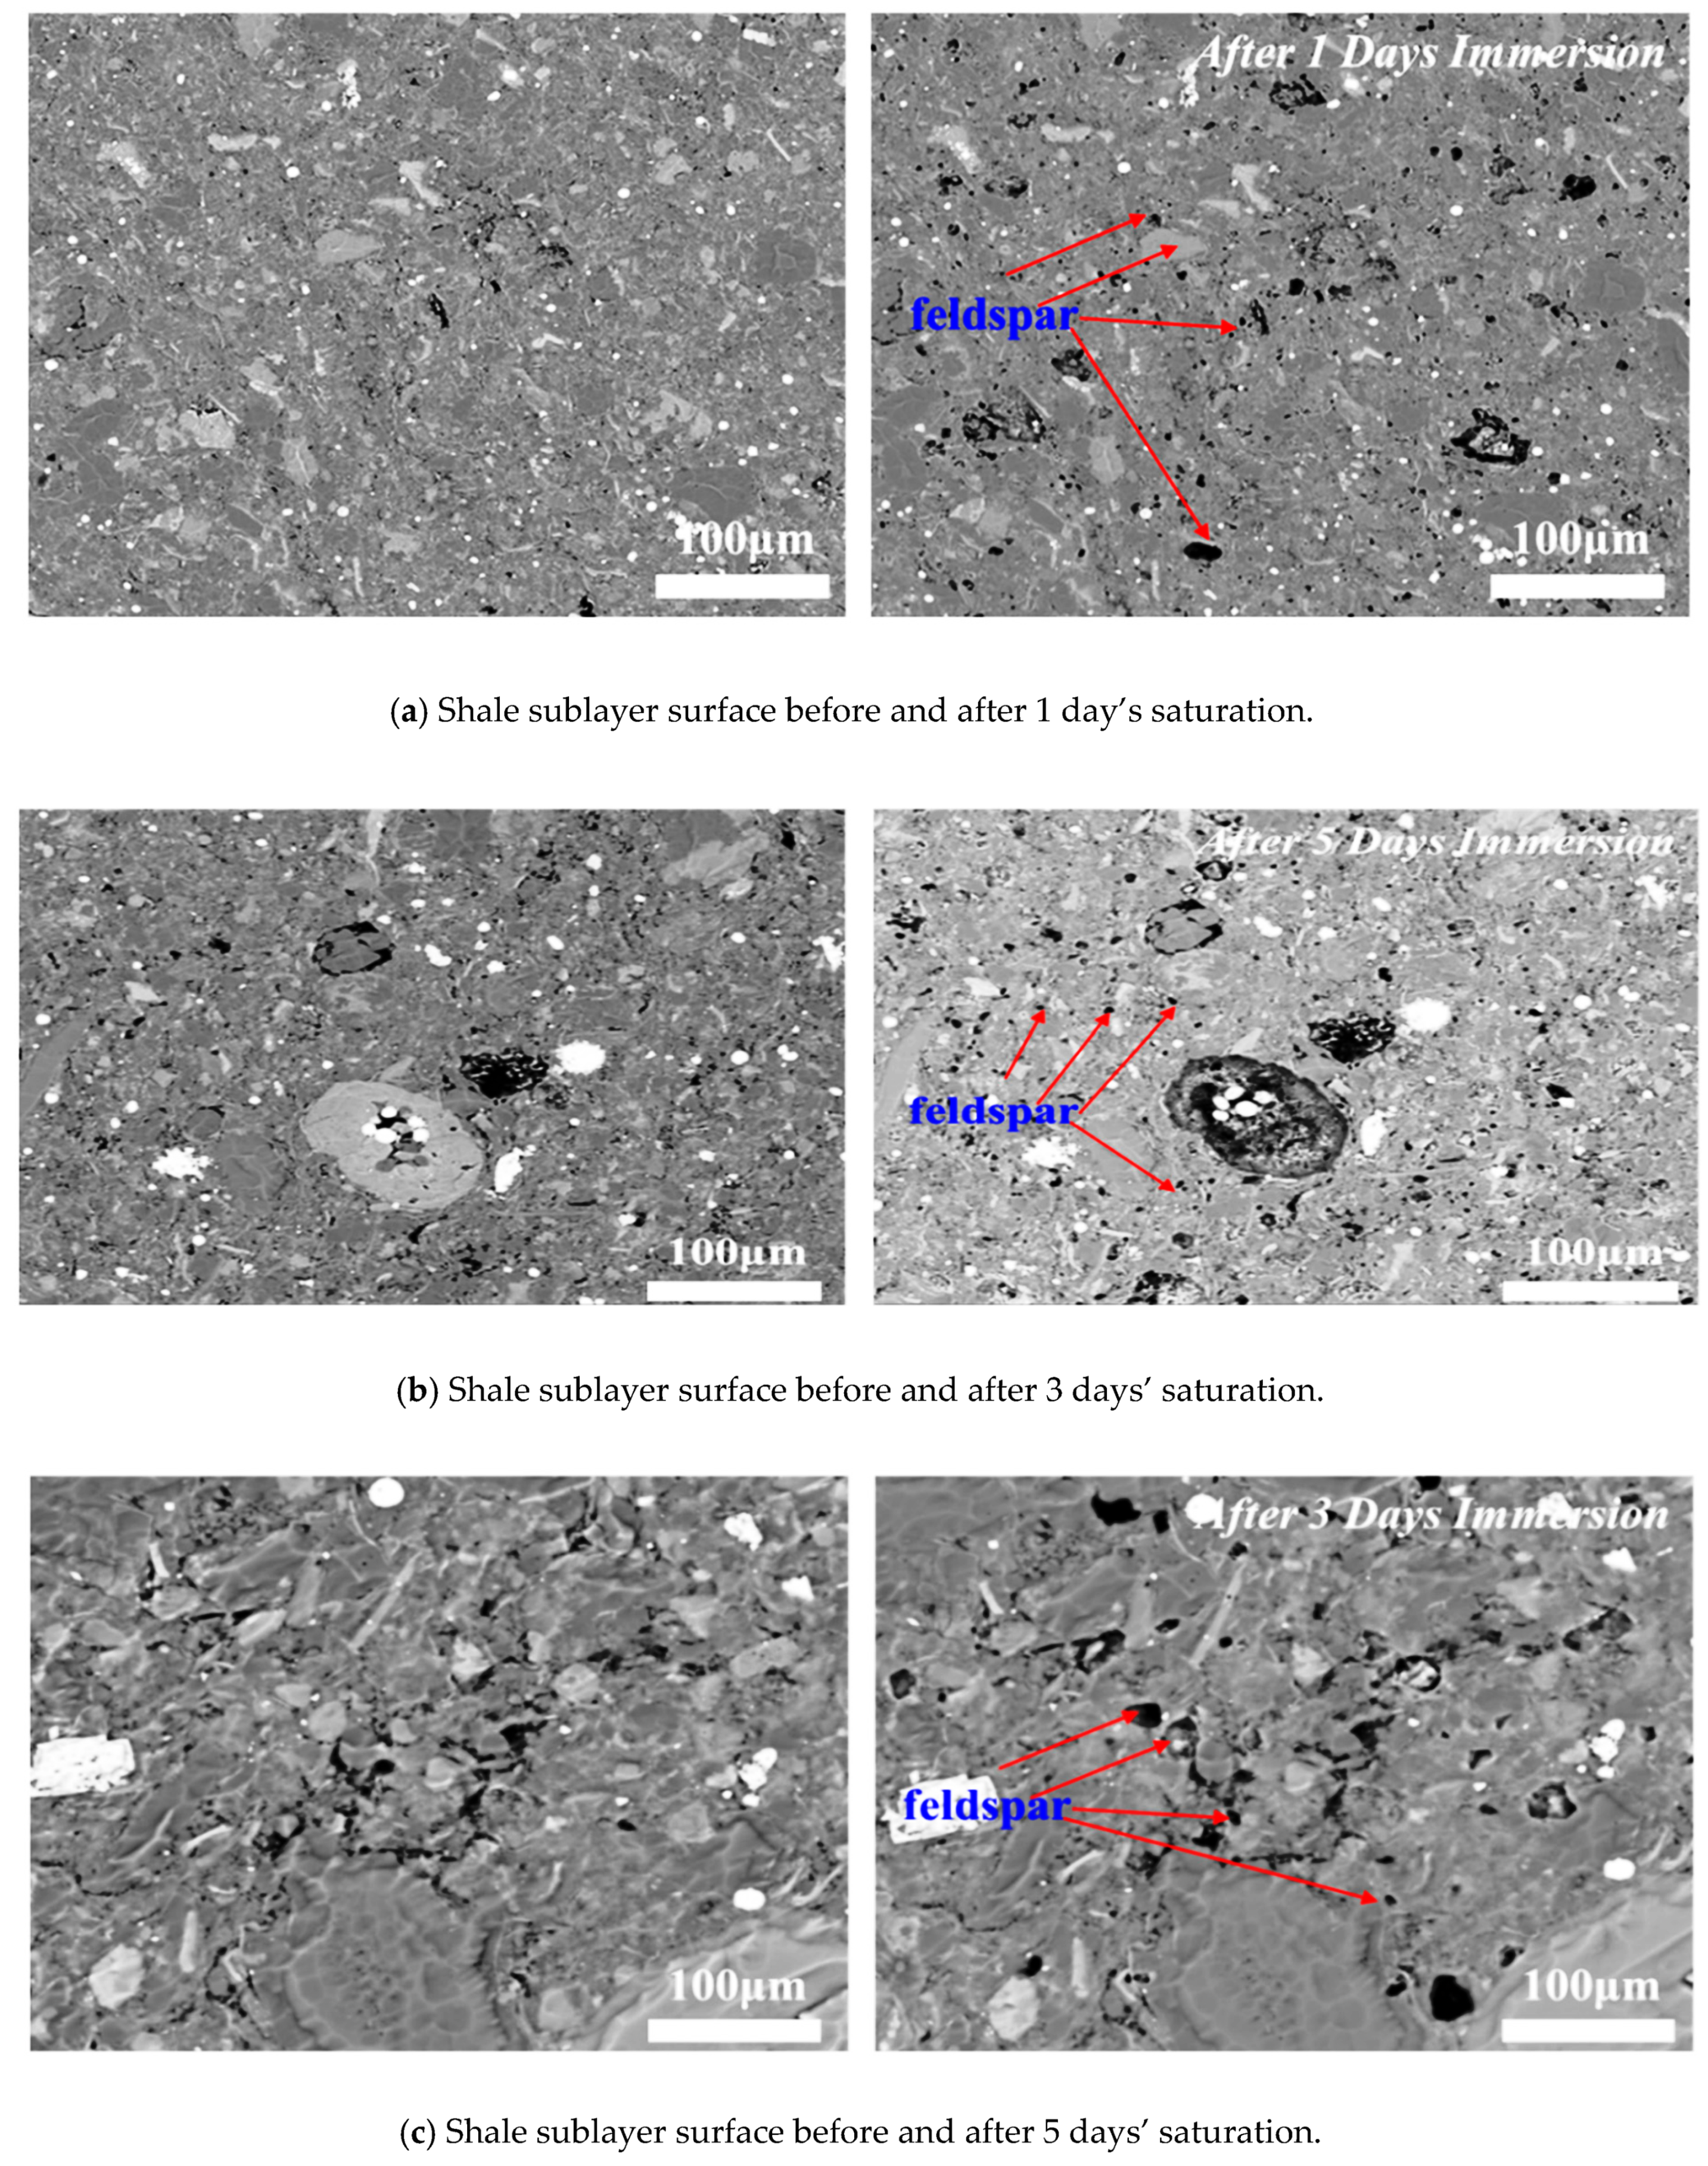
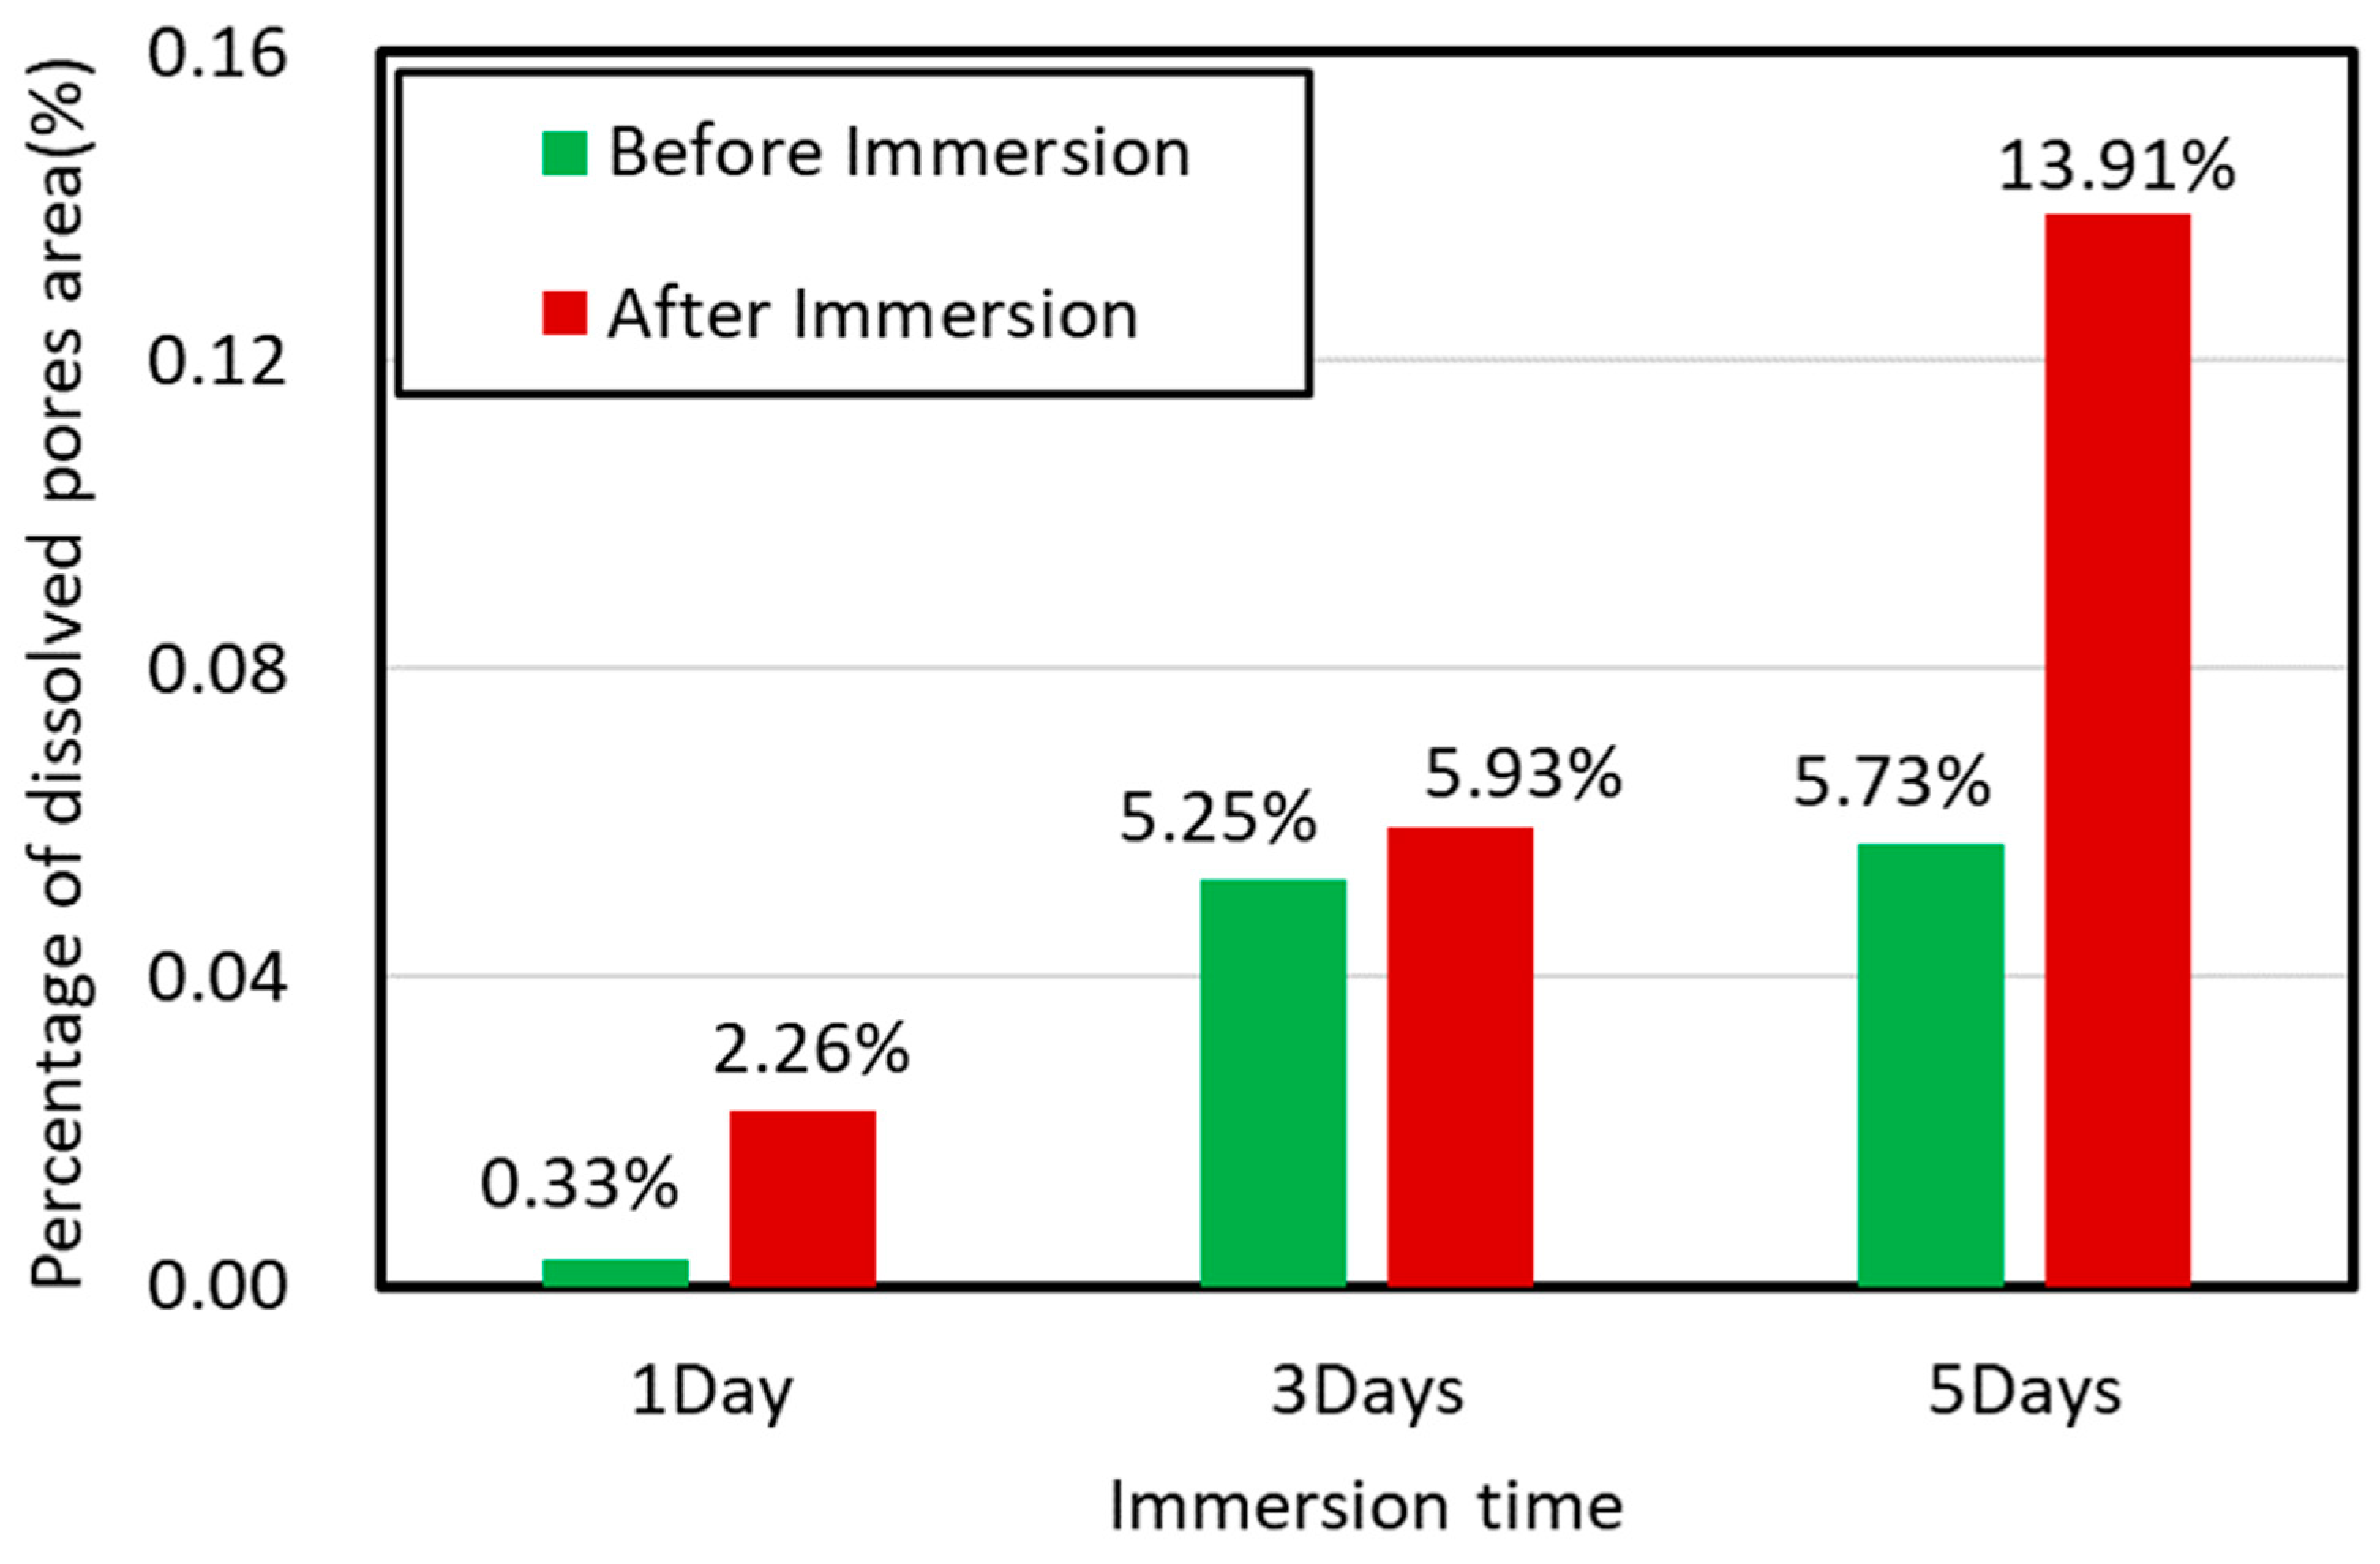
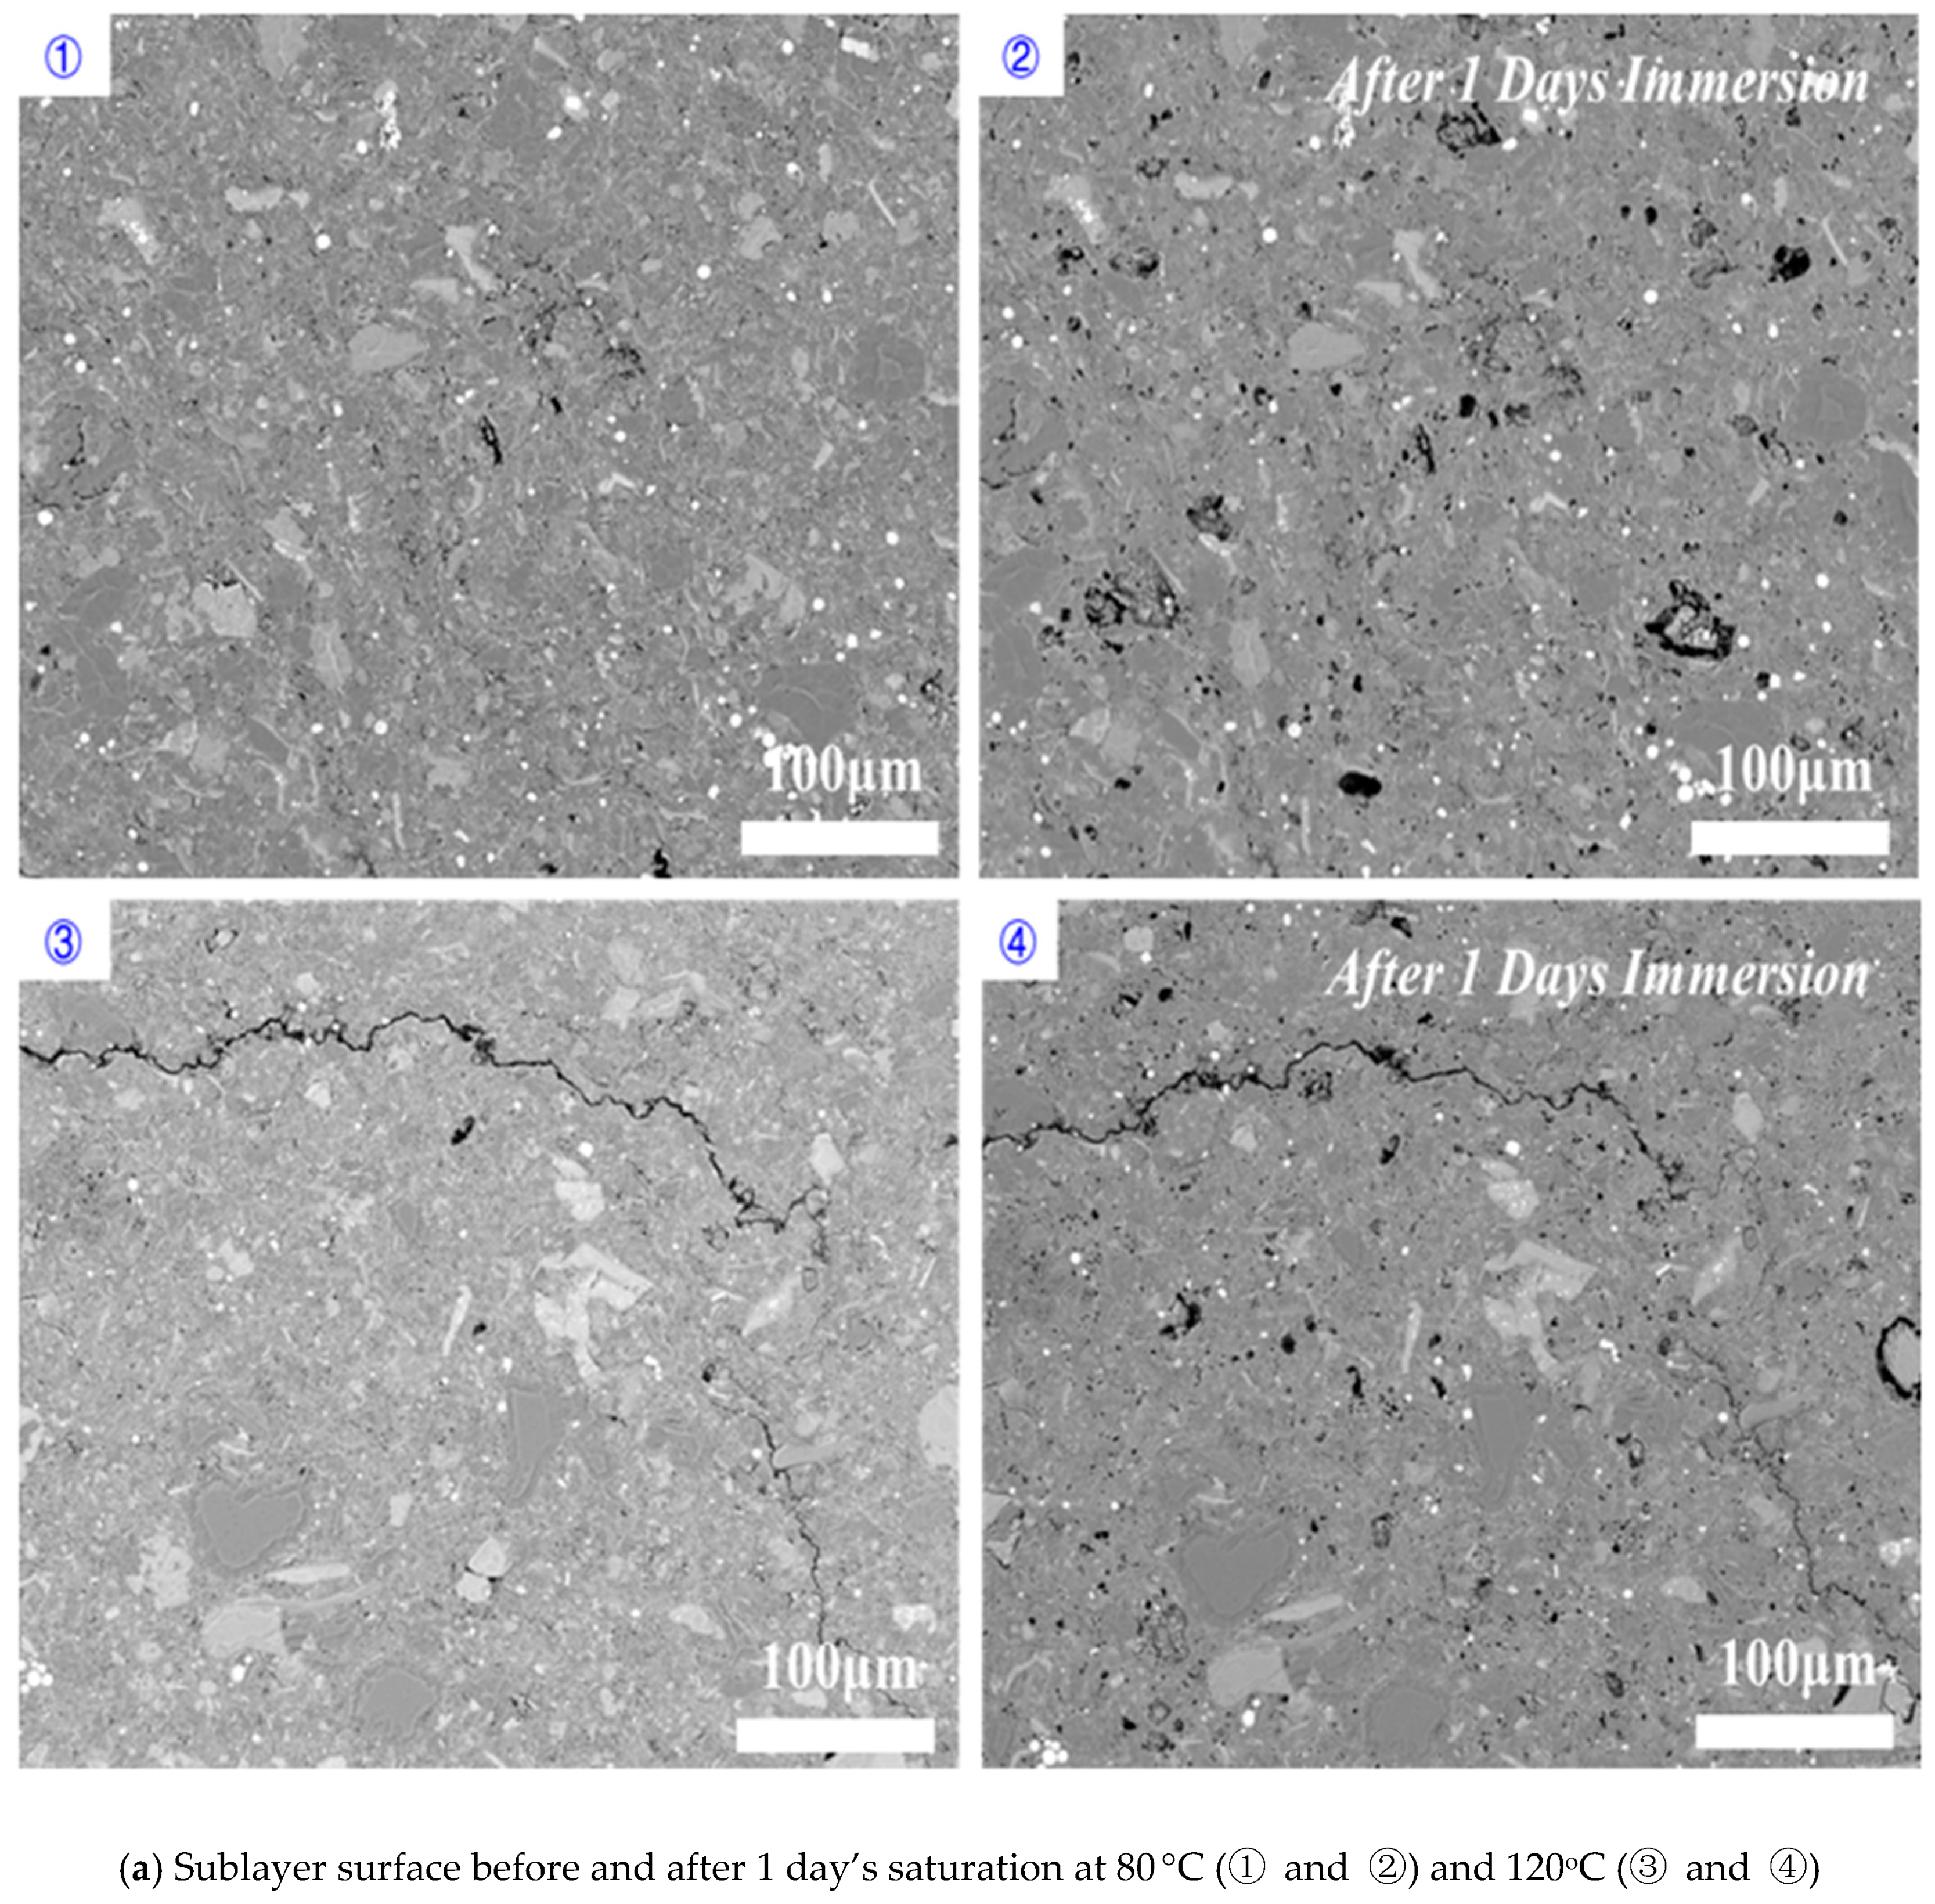
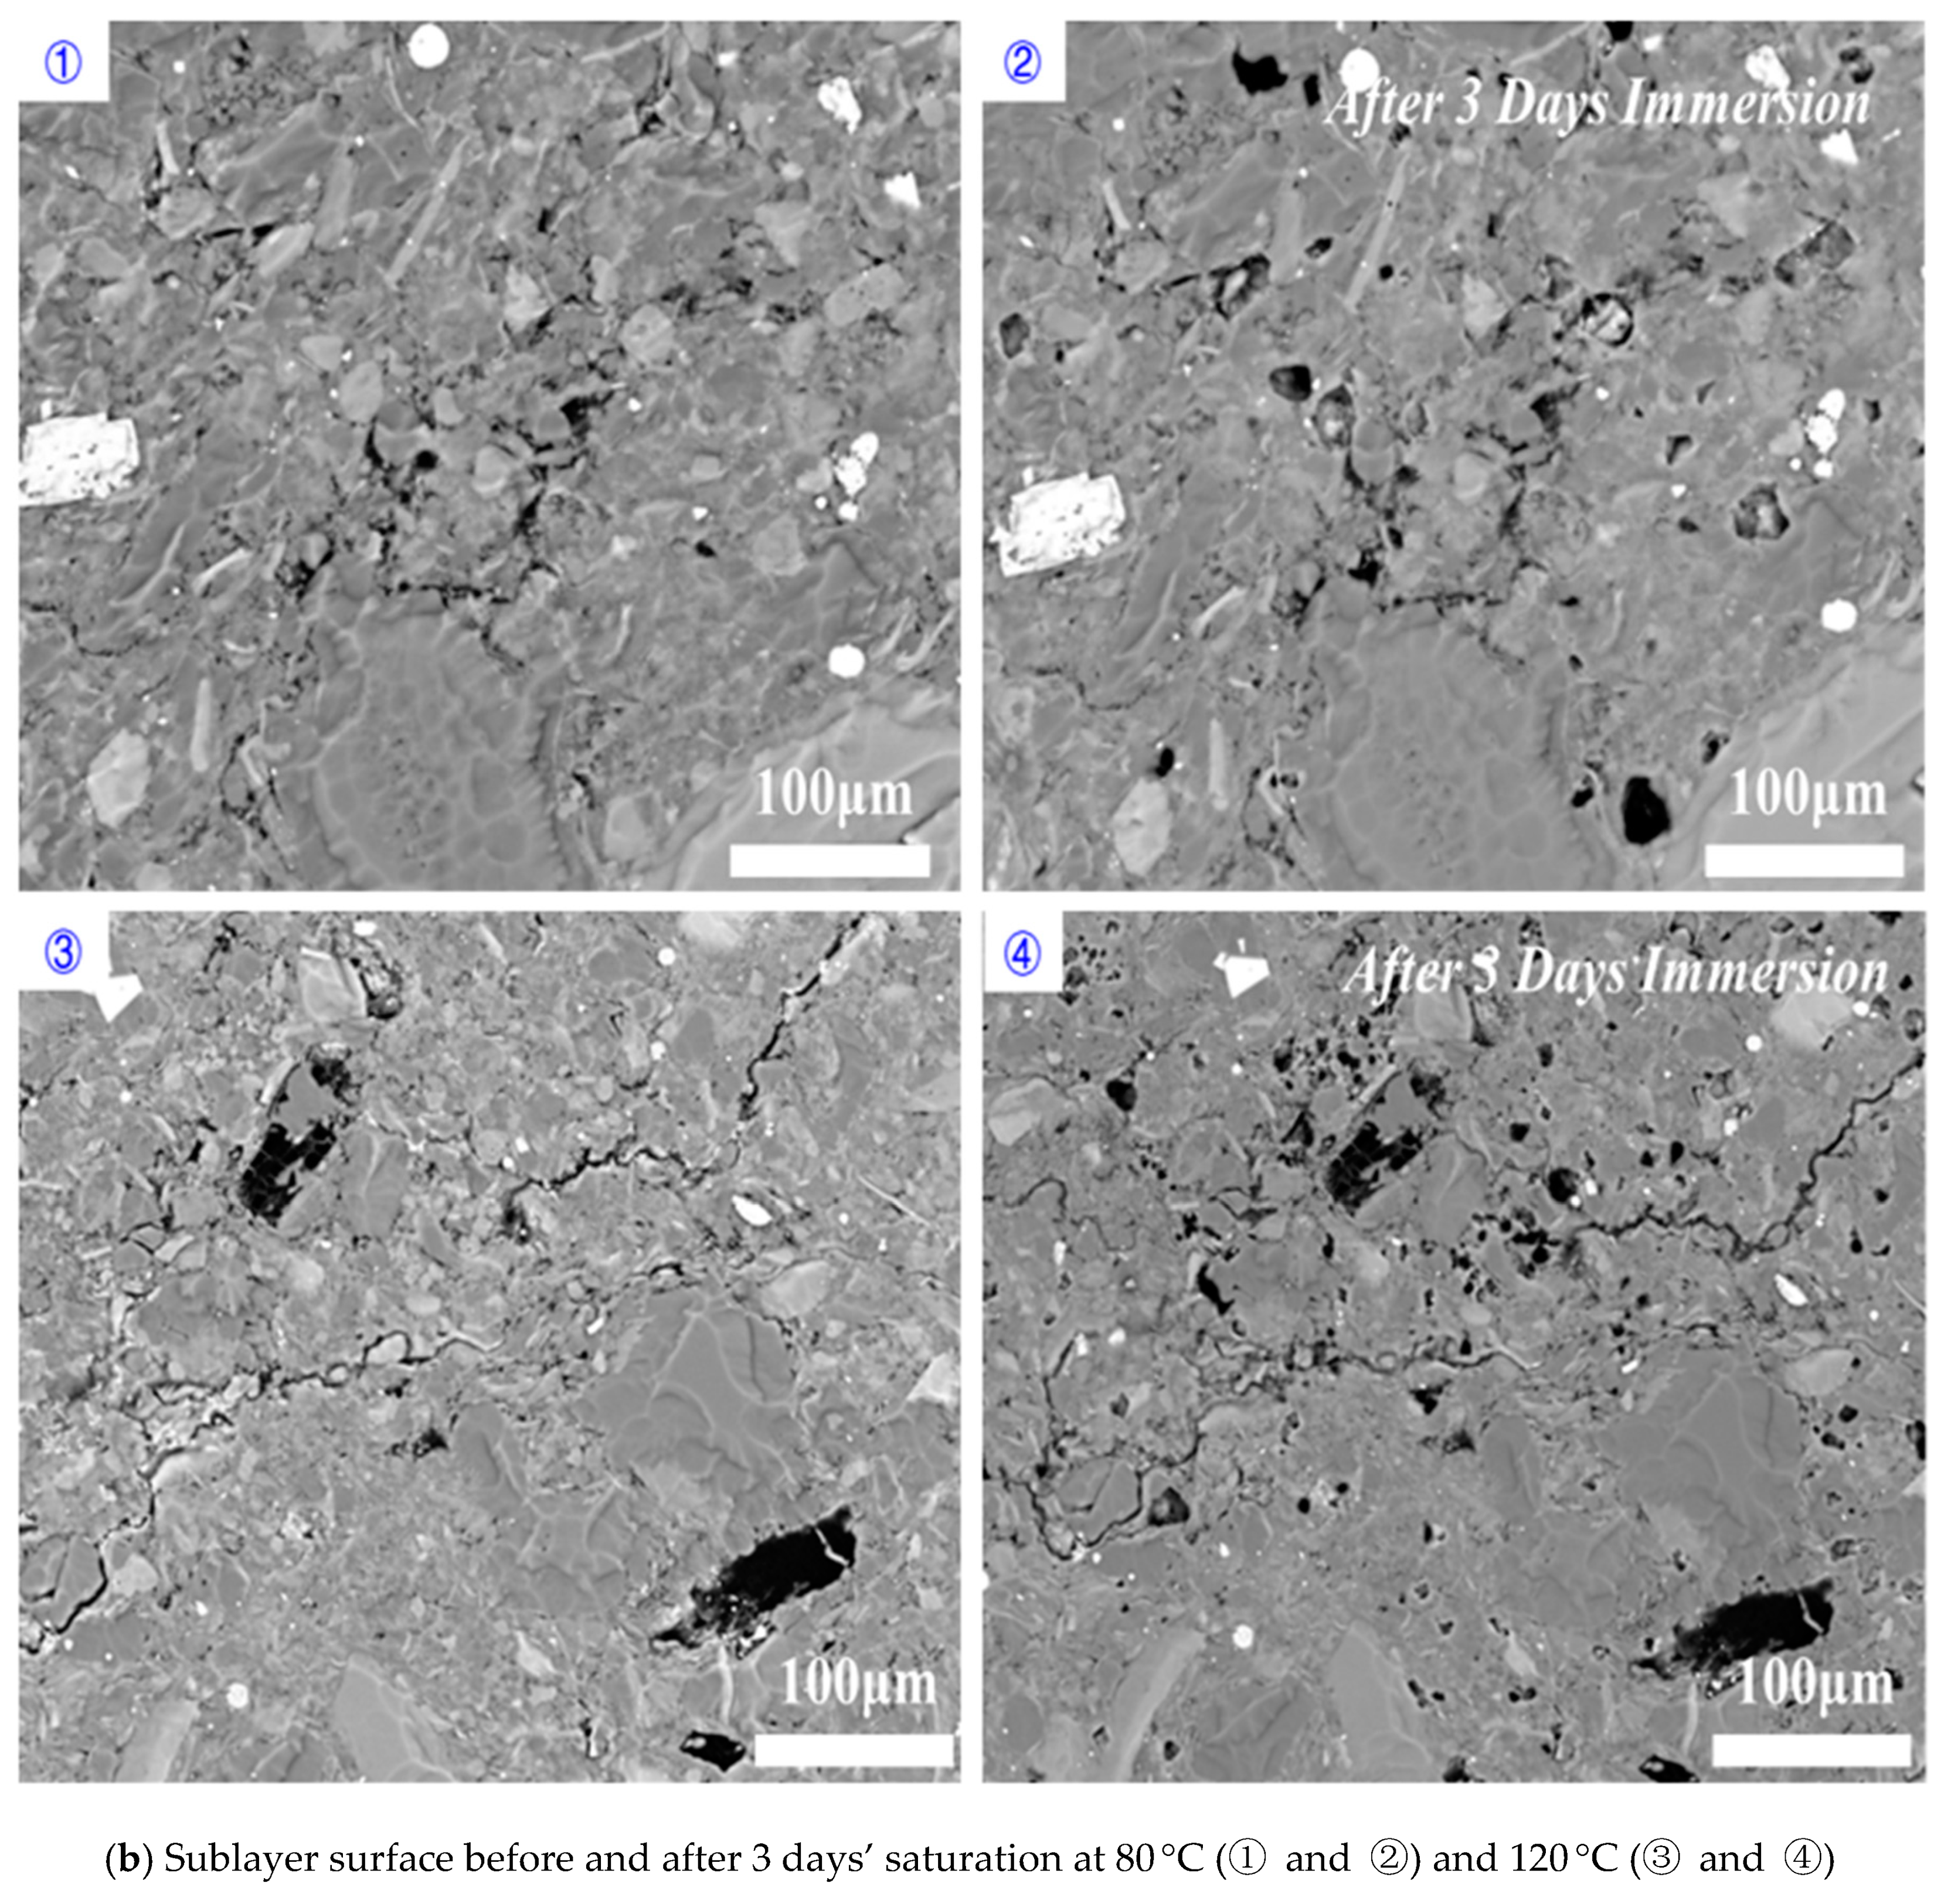
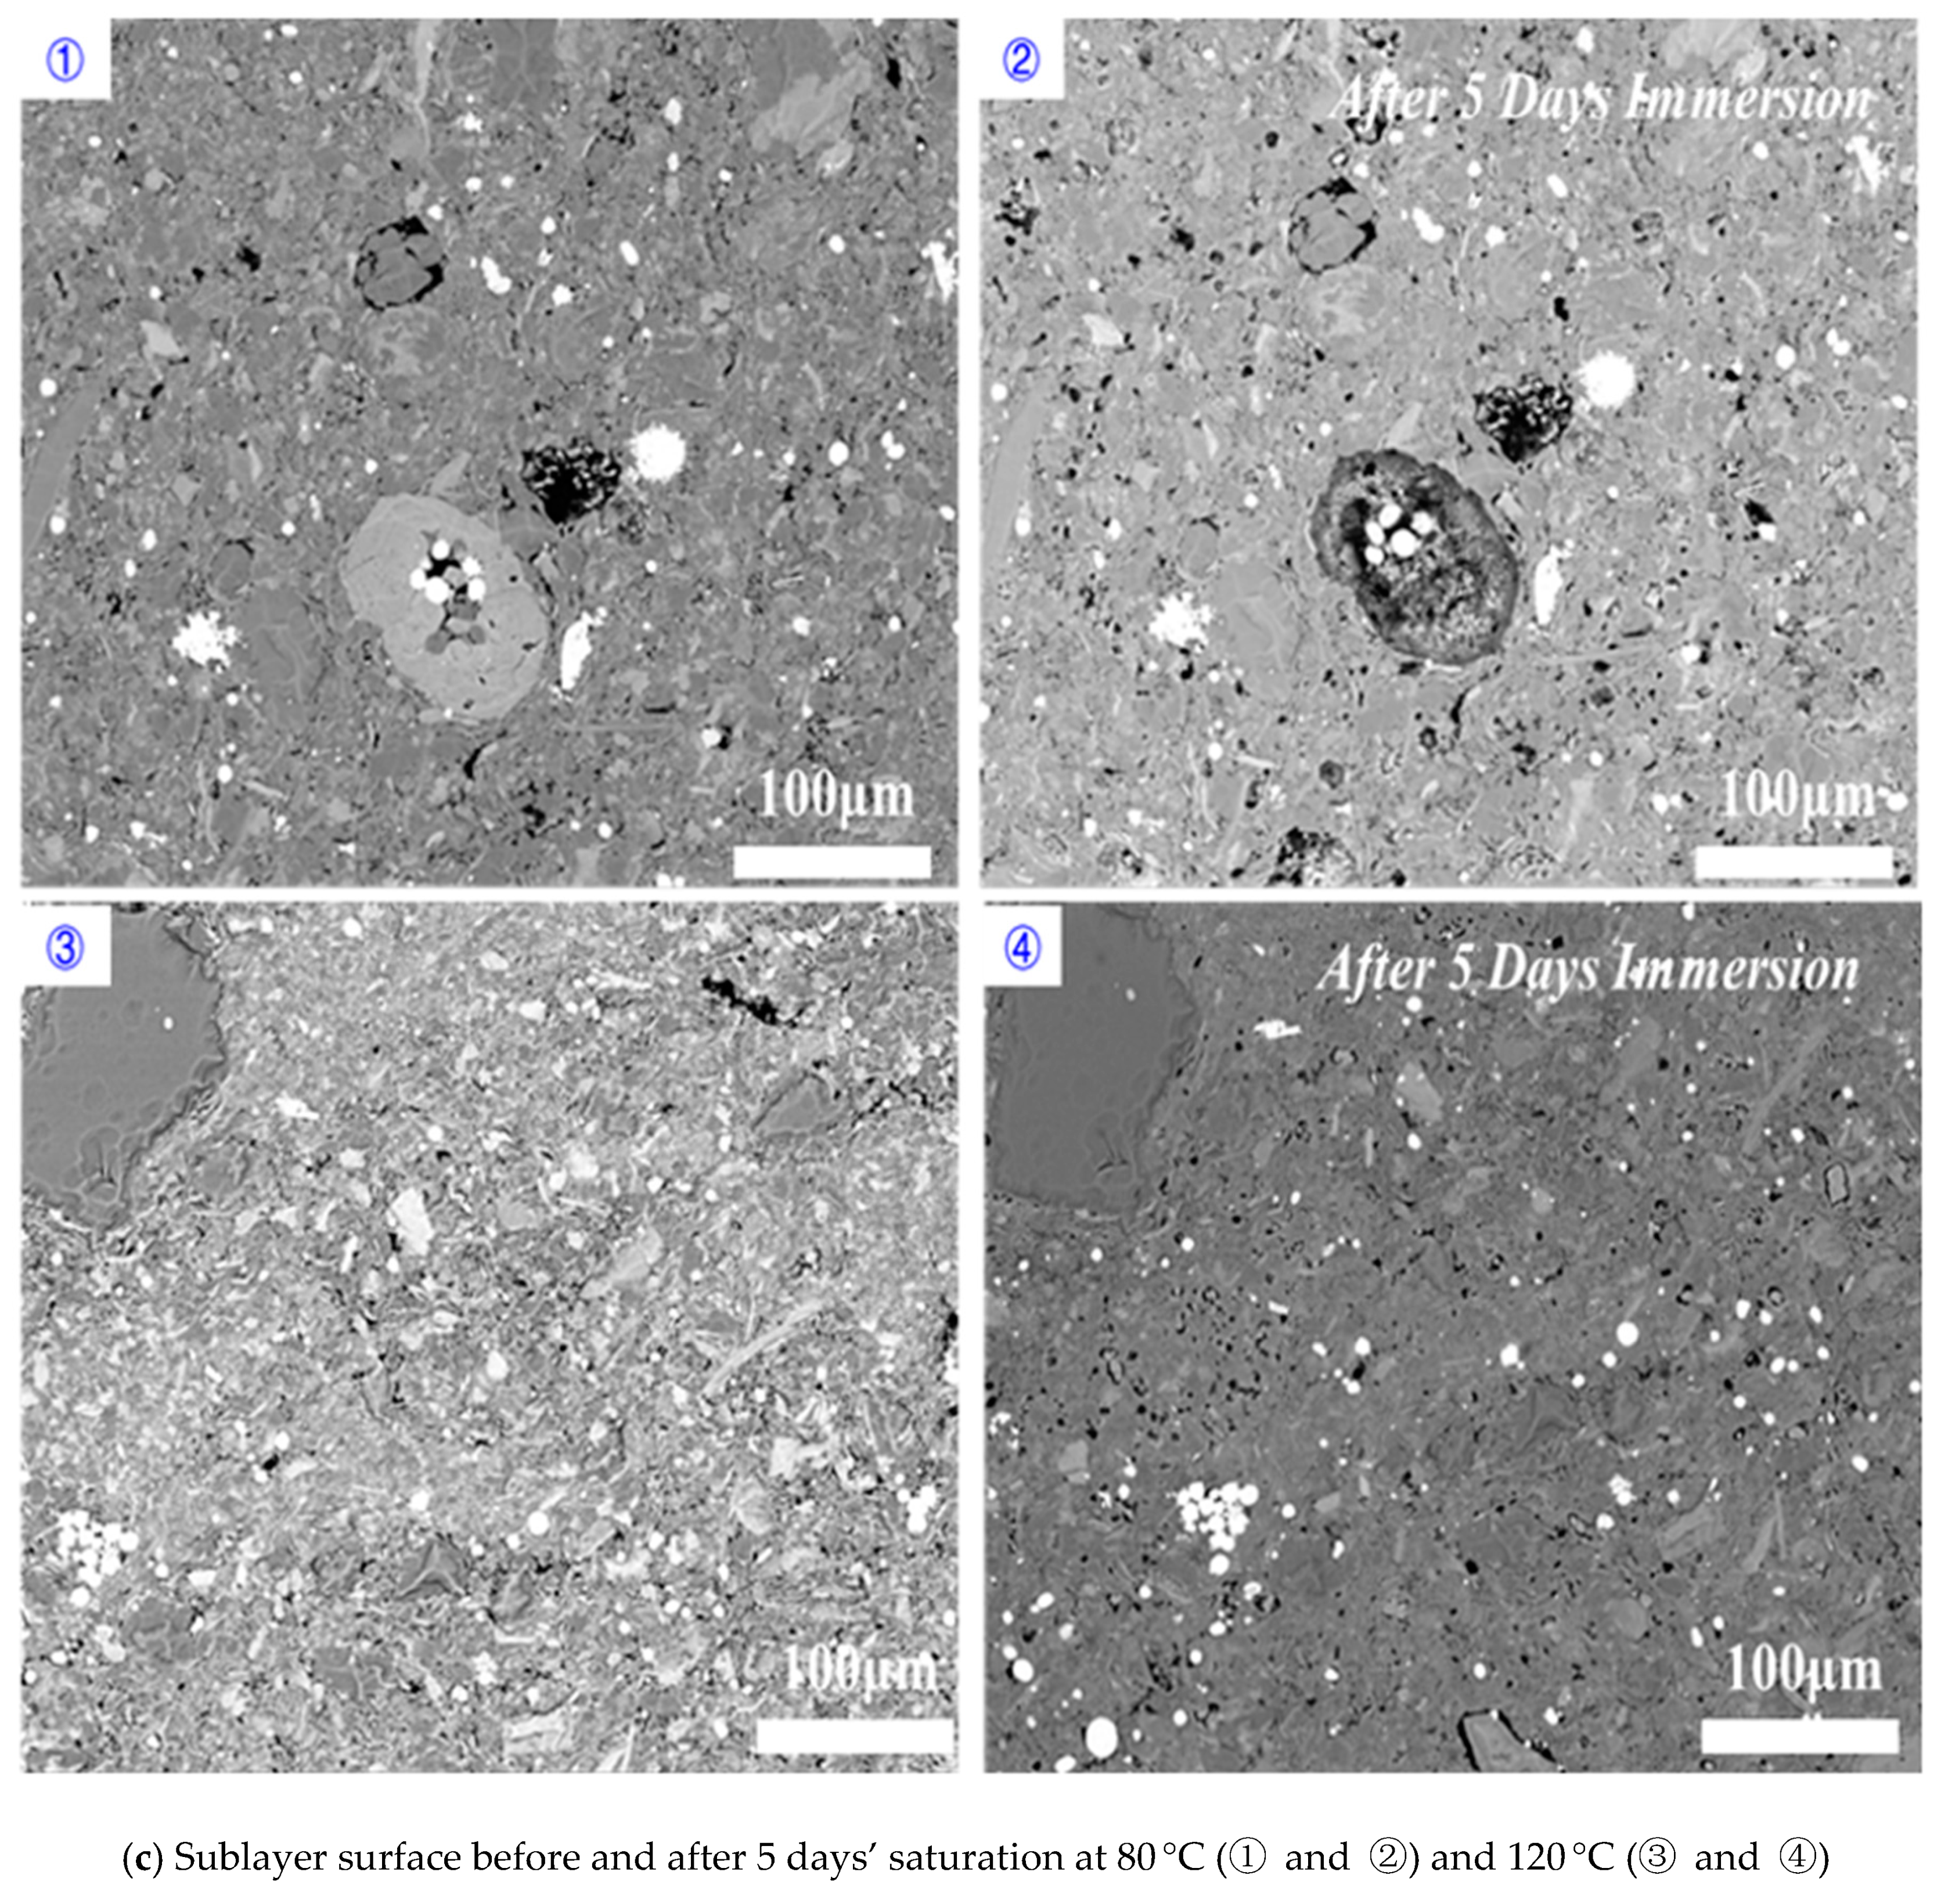
  • Imbibition along the direction perpendicular to bedding planes would contribute the increase of porosity at micro-fracture due to feldspar dissolution (Figure 11).
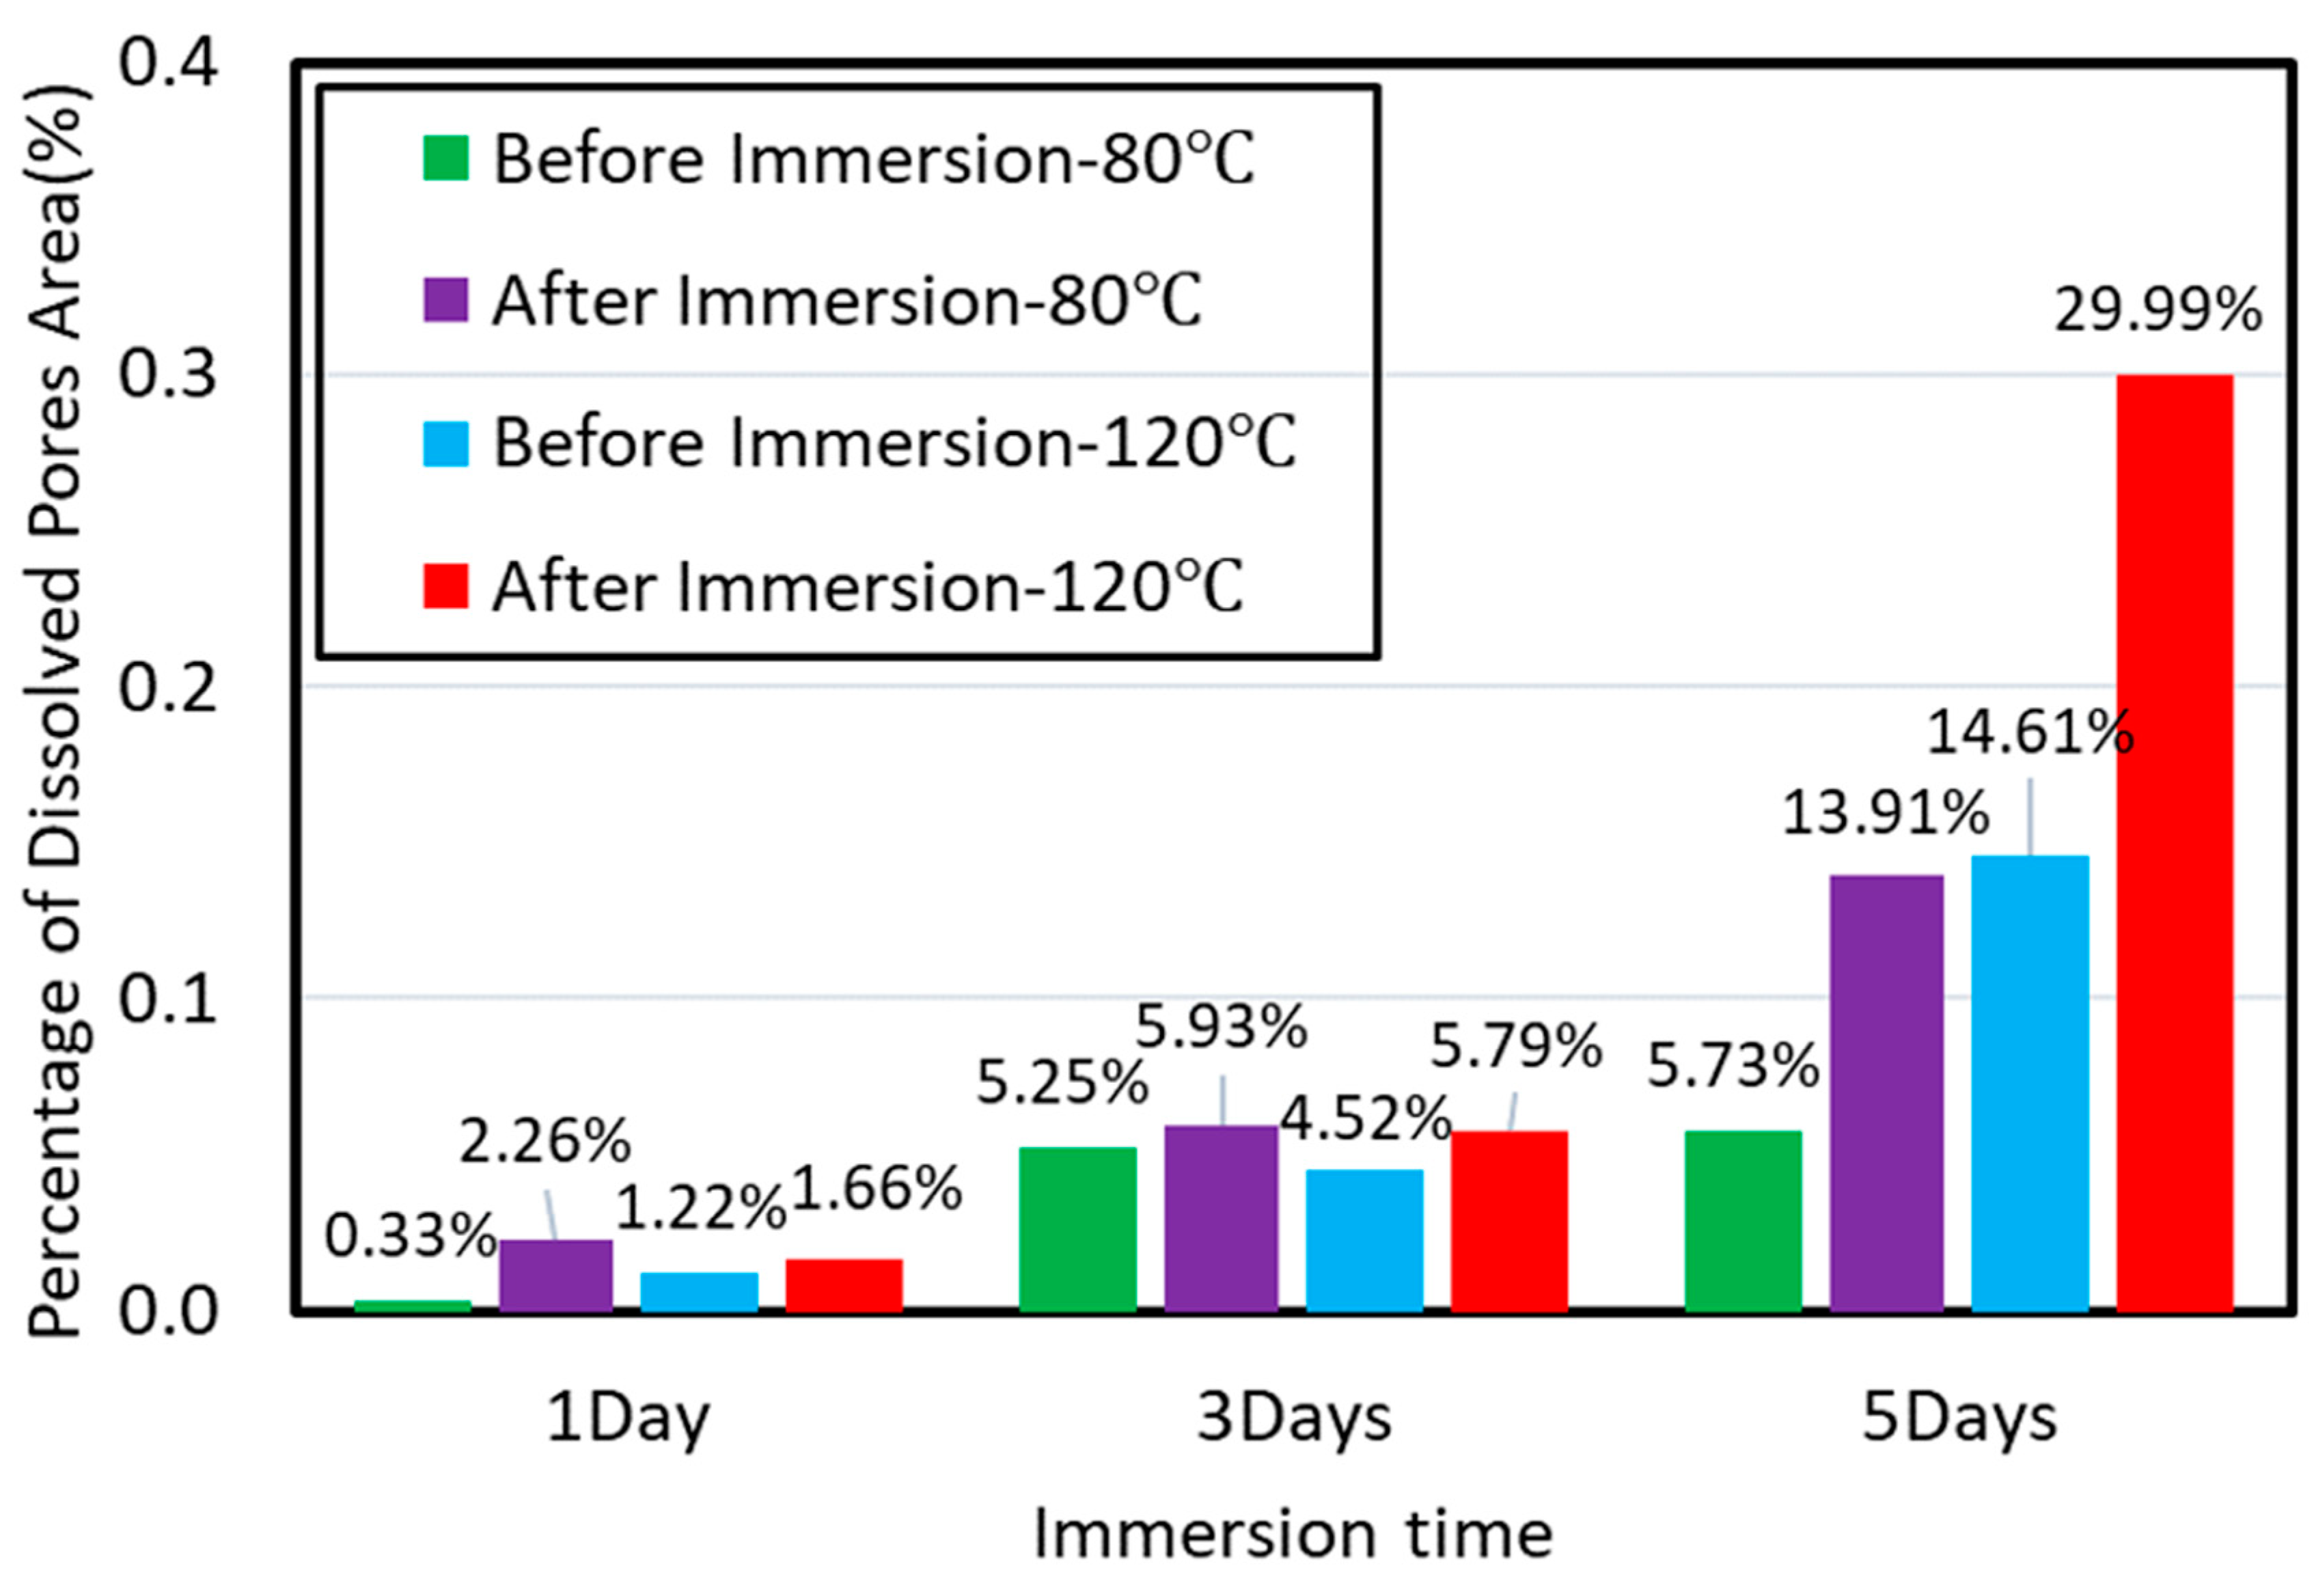
  • Hydration process at both parallel and perpendicular to the bedding planes would be accelerated with increasing reservoir temperature.
Aforementioned shale hydration anisotropy not only explains the imbibition difference parallel and perpendicular to laminations, but also sheds light on how the fluid–rock interaction affects shale strength properties. When drilling fluids enter the shale matrix along the bedding planes or pre-existing micro-fracture, the induced hydrated fractures and dissolved pores likely weaken the rock strength thus impairing the wellbore stability [53,54,55]. Therefore, to prevent the wellbore from collapsing, it is important to enhance the plugging performance of drilling fluids so as to keep the fluids from imbibing into shale sublayers. Most current designs on drilling mud plugging only consider the prevention of fluid flowing into fractures that are parallel to bedding planes [56,57]. Our study indicates that a proper drilling mud should also be able to minimize the feldspar dissolution, which likely occurs at the subsurface perpendicular to bedding planes, thus further weakening shale. Besides, the inhibitive ability of drilling mud should also be accounted for to keep clay minerals, especially the smectite, from swelling [58].

4. Conclusions

A combination of horizontal drilling and multi-stage hydraulic fracturing is an important means for shale gas production [9,16,59,60]. While published work shows that shale hydration would trigger water uptake and wellbore instability due to complex physicochemical processes [54,55], the existing accounts fail to fully acknowledge the significance of shale anisotropy on water uptake and wellbore instability, typically under in situ reservoir temperature and an elevated pressure. Thus, we designed two sets of imbibition experiments using shale samples from Longmaxi Formation in Sichuan Basin, by designing shale substrates in parallel or perpendicular to the bedding planes. All the samples were immersed in distilled water for 1 to 5 days with pressure of 3.5 MPa at either 80 °C or 120 °C. Furthermore, EDS-FE-SEM was used to quantitatively characterize the samples’ topographical and elemental variations before and after hydration.
Results show that shale anisotropy plays a vital role in micro-fracture evolution, and thus water uptake and wellbore stability. In particular, for the shale surface in parallel to the bedding planes, shale hydration initially leads to a close of pre-existing micro-fracture due to the smectite and illite swelling. However, micro-fracture then reopens with a wider fracture width due to the incompatible deformation between smectite and illite. In contrast, for a shale surface perpendicular to the bedding plane, micro-fracture widening was not observed. Rather, shale hydration results in a large amount of dissolved pores on the sublayer surface as a result of feldspar dissolution. Moreover, increasing temperature accelerates the hydration rate and degree, implying that the impact of shale anisotropy would play a greater role in water uptake and wellbore instability with increasing shale reservoir depth. Although a mathematical model relating the heat dissipation to fluid flow and imbibition of water within the system will be investigated as part of future work, our results provide a first look at how shale anisotropy affects water uptake, and underscore the importance of hydration time and temperature on micro-fracture evolution.

Author Contributions

Conceptualization, Y.L., Y.J. and Q.X.; data curation, Y.L.; formal analysis, Y.L., L.Z., Y.J., G.C., J.R. and Q.X.; funding acquisition, Y.L. and Y.J.; investigation, G.C.; Methodology, Y.L., L.Z., H.L. and Q.X.; project administration, Y.L., Y.J. and Q.X.; resources, Y.L., Y.J. and Q.X.; software, Y.L.; Validation, Y.L., L.Z., G.C. and J.R.; writing—original draft, Y.L., L.Z., G.C. and Q.X.; writing—review & editing, Y.L., L.Z., Y.J., H.C.L. and Q.X. All authors revised and approved the publication of the paper.

Funding

This research was funded by the National Natural Science Foundation of China, grant number 51774305, and the Major Projects of the National Natural Science Foundation, grant number 51490651.

Acknowledgments

The authors gratefully acknowledge the constructive comments from John Hooker, three anonymous reviewers and Assistant Editor Allison Wang for the improvements in this work.

Conflicts of Interest

The authors declare no conflict of interest.

References

  1. Melikoglu, M. Shale Gas: Analysis of Its Role in the Global Energy Market. Renew. Sustain. Energy Rev. 2014, 37, 460–468. [Google Scholar] [CrossRef]
  2. EIA, United States Energy Information Administration. Annual Energy Outlook: With Projections to 2040; EIA: Washington, DC, USA, 2013.
  3. EIA, United States Energy Information Administration. Annual Energy Outlook 2011: With Projections to 2035; EIA: Washington, DC, USA, 2011.
  4. Fisher, M.K.; Heinze, J.R.; Harris, C.D.; Davidson, B.M.; Wright, C.A.; Dunn, K.P. Optimizing horizontal completion techniques in the Barnett shale using microseismic fracture mapping. In SPE Annual Technical Conference and Exhibition; Society of Petroleum Engineers: Richardson, TX, USA, 2004. [Google Scholar]
  5. Gale, J.F.; Reed, R.M.; Holder, J. Natural fractures in the Barnett Shale and their importance for hydraulic fracture treatments. AAPG Bull. 2007, 91, 603–622. [Google Scholar] [CrossRef]
  6. Lu, Y.; Zeng, L.; Xie, Q.; Jin, Y.; Hossain, M.M.; Saeedi, A. Analytical modelling of wettability alteration-induced micro-fractures during hydraulic fracturing in tight oil reservoirs. Fuel 2019, 249, 434–440. [Google Scholar] [CrossRef]
  7. Feng, R.; Zhang, Y.; Rezagholilou, A.; Roshan, H.; Sarmadivaleh, M. Brittleness Index: From Conventional to Hydraulic Fracturing Energy Model. Rock Mech. Rock Eng. 2019. [Google Scholar] [CrossRef]
  8. Feng, R.; Chen, R.; Sarmadivaleh, M. A practical fracability evaluation for tight sandstone reservoir with natural interface. APPEA J. 2019, 59, 221–227. [Google Scholar] [CrossRef]
  9. Cheng, Y. Impact of water dynamics in fractures on the performance of hydraulically fractured wells in gas shale reservoirs. In SPE International Symposium and Exhibition on Formation Damage Control; Society of Petroleum Engineers: Richardson, TX, USA, 2010. [Google Scholar]
  10. King, G.E. Hydraulic fracturing 101: What every representative, environmentalist, regulator, reporter, investor, university researcher, neighbor and engineer should know about estimating frac risk and improving frac performance in unconventional gas and oil wells. In SPE Hydraulic Fracturing Technology Conference; Society of Petroleum Engineers: Richardson, TX, USA, 2012. [Google Scholar]
  11. Nicot, J.P.; Scanlon, B.R.; Reedy, R.C.; Costley, R.A. Source and Fate of Hydraulic Fracturing Water in the Barnett Shale: A Historical Perspective. Environ. Sci. Technol. 2014, 48, 2464–2471. [Google Scholar] [CrossRef]
  12. Scanlon, B.R.; Reedy, R.C.; Nicot, J.P. Will water scarcity in semiarid regions limit hydraulic fracturing of shale plays? Environ. Res. Lett. 2014, 9, 124011. [Google Scholar] [CrossRef] [Green Version]
  13. Makhanov, K.; Habibi, A.; Dehghanpour, H.; Kuru, E. Liquid uptake of gas shales: A workflow to estimate water loss during shut-in periods after fracturing operations. J. Unconv. Oil Gas Resour. 2014, 7, 22–32. [Google Scholar] [CrossRef]
  14. Binazadeh, M.; Xu, M.; Zolfaghari, A.; Dehghanpour, H. Effect of electrostatic interactions on water uptake of gas shales: the interplay of solution ionic strength and electrostatic double layer. Energy Fuels 2016, 30, 992–1001. [Google Scholar] [CrossRef]
  15. Ghanbari, E.; Dehghanpour, H. Impact of rock fabric on water imbibition and salt diffusion in gas shales. Int. J. Coal Geol. 2015, 138, 55–67. [Google Scholar] [CrossRef]
  16. Lu, G.; Gordeliy, E.; Prioul, R.; Aidagulov, G.; Bunger, A. Modeling simultaneous initiation and propagation of multiple hydraulic fractures under subcritical conditions. Comput. Geotech. 2018, 104, 196–206. [Google Scholar] [CrossRef]
  17. Roshan, H.; Ehsani, S.; Marjo, C.E.; Andersen, M.S.; Acworth, R.I. Mechanisms of water adsorption into partially saturated fractured shales: An experimental study. Fuel 2015, 159, 628–637. [Google Scholar] [CrossRef]
  18. Fakcharoenphol, P.; Kurtoglu, B.; Kazemi, H.; Charoenwongsa, S.; Wu, Y.S. The effect of osmotic pressure on improve oil recovery from fractured shale formations. In Spe Unconventional Resources Conference; Society of Petroleum Engineers: Richardson, TX, USA, 2014. [Google Scholar]
  19. Bennion, D.B.; Thomas, F.B. Formation damage issues impacting the productivity of low permeability, low initial water saturation gas producing formations. J. Energy Resour. Technol. 2005, 127, 240–247. [Google Scholar] [CrossRef]
  20. Zeng, L.; Chen, Y.; Lu, Y.; Lau, H.C.; Hossain, M.M.; Saeedi, A.; Xie, Q. Interpreting Water Uptake by Shale with Ion Exchange, Surface Complexation, and Disjoining Pressure. Energy Fuels 2019, 33, 8250–8258. [Google Scholar] [CrossRef]
  21. Zeng, L.; Chen, Y.; Hossain, M.M.; Saeedi, A.; Xie, Q. Wettability alteration induced water uptake in shale oil reservoirs: A geochemical interpretation for oil-brine-OM interaction during hydraulic fracturing. Int. J. Coal Geol. 2019, 213, 103277. [Google Scholar] [CrossRef]
  22. Sone, H.; Zoback, M.D. Mechanical properties of shale-gas reservoir rocks—Part 1: Static and dynamic elastic properties and anisotropy. Geophysics 2013, 78, D381–D392. [Google Scholar] [CrossRef]
  23. Zhang, S.; Sheng, J.J. Effect of water imbibition on fracture generation in Mancos shale under isotropic and anisotropic stress conditions. J. Geotech. Geoenviron. Eng. 2017, 144, 04017113. [Google Scholar] [CrossRef]
  24. Makhanov, K.K. An Experimental Study of Spontaneous Imbibition in Horn River Shales. Master’s Thesis, University of Alberta, Edmonton, AB, Canada, 2013. [Google Scholar]
  25. Makhanov, K.; Dehghanpour, H.; Kuru, E. An experimental study of spontaneous imbibition in Horn River shales. In SPE Canadian Unconventional Resources Conference; Society of Petroleum Engineers: Richardson, TX, USA, 2012. [Google Scholar]
  26. Dehghanpour, H.; Lan, Q.; Saeed, Y.; Fei, H.; Qi, Z. Spontaneous imbibition of brine and oil in gas shales: Effect of water adsorption and resulting microfractures. Energy Fuels 2013, 27, 3039–3049. [Google Scholar] [CrossRef]
  27. Roychaudhuri, B.; Tsotsis, T.; Jessen, K. An experimental and numerical investigation of spontaneous imbibition in gas shales. Paper SPE 147652. In Proceedings of the SPE Annual Technical Conference and Exhibition, Denver, CO, USA, 30 October–2 November 2011. [Google Scholar]
  28. Guo, X.; Hu, D.; Li, Y.; Liu, R.; Wang, Q. Geological features and reservoiring mode of shale gas reservoirs in Longmaxi Formation of the Jiaoshiba Area. Acta Geol. Sin. 2014, 88, 1811–1821. [Google Scholar] [CrossRef]
  29. Chen, L.; Lu, Y.; Jiang, S.; Li, J.; Guo, T.; Luo, C. Heterogeneity of the Lower Silurian Longmaxi marine shale in the southeast Sichuan Basin of China. Mar. Pet. Geol. 2015, 65, 232–246. [Google Scholar] [CrossRef]
  30. Jiang, Y.; Chen, L.; Qi, L.; Luo, M.; Chen, X.; Tao, Y.; Wang, Z. Characterization of the Lower Silurian Longmaxi marine shale in Changning area in the south Sichuan Basin, China. Geol. J. 2018, 53, 1656–1664. [Google Scholar] [CrossRef]
  31. Shen, Y.; Ge, H.; Meng, M.; Jiang, Z.; Yang, X. Effect of water imbibition on shale permeability and its influence on gas production. Energy Fuels 2017, 31, 4973–4980. [Google Scholar] [CrossRef]
  32. Akrad, O.M.; Miskimins, J.L.; Prasad, M. The effects of fracturing fluids on shale rock mechanical properties and proppant embedment. In SPE Annual Technical Conference and Exhibition; Society of Petroleum Engineers: Richardson, TX, USA, 2011. [Google Scholar]
  33. Xu, J.; Sonnenberg, S.A. An SEM Study of Porosity in the Organic-Rich Lower Bakken Member and Pronghorn Member, Bakken Formation, Williston Basin. In Proceedings of the Unconventional Resources Technology Conference, Austin, TX, USA, 24–26 July 2017; pp. 3213–3225. [Google Scholar]
  34. Sondergeld, C.H.; Ambrose, R.J.; Rai, C.S.; Moncrieff, J. Micro-structural studies of gas shales. In SPE Unconventional Gas Conference; Society of Petroleum Engineers: Richardson, TX, USA, 2010. [Google Scholar]
  35. Kwon, O.; Kronenberg, A.K.; Gangi, A.F.; Johnson, B.; Herbert, B.E. Permeability of illite-bearing shale: 1. Anisotropy and effects of clay content and loading. J. Geophys. Res. Solid Earth 2004, 109. [Google Scholar] [CrossRef]
  36. Ma, Y.; Zhong, N.; Cheng, L.; Pan, Z.; Dai, N.; Zhang, Y.; Yang, L. Pore structure of the graptolite-derived OM in the Longmaxi Shale, southeastern Upper Yangtze Region, China. Mar. Pet. Geol. 2016, 72, 1–11. [Google Scholar] [CrossRef]
  37. Zou, C.; Yang, Z.; Dai, J.; Dong, D.; Zhang, B.; Wang, Y.; Deng, S.; Huang, J.; Liu, K.; Yang, C.; et al. The characteristics and significance of conventional and unconventional Sinian–Silurian gas systems in the Sichuan Basin, central China. Mar. Pet. Geol. 2015, 64, 386–402. [Google Scholar] [CrossRef]
  38. American Petroleum Institute. Recommended Practice for Field Testing of Water-Based Drilling Fluids, 4th ed.; API: Washington, DC, USA, 2009. [Google Scholar]
  39. Chakraborty, N.; Karpyn, Z.T.; Liu, S.; Yoon, H. Permeability evolution of shale during spontaneous imbibition. J. Nat. Gas Sci. Eng. 2017, 38, 590–596. [Google Scholar] [CrossRef] [Green Version]
  40. Zhou, Z.; Abass, H.; Li, X.; Teklu, T. Experimental investigation of the effect of imbibition on shale permeability during hydraulic fracturing. J. Nat. Gas Sci. Eng. 2016, 29, 413–430. [Google Scholar] [CrossRef]
  41. Paukert Vankeuren, A.N.; Hakala, J.A.; Jarvis, K.; Moore, J.E. Mineral reactions in shale gas reservoirs: Barite scale formation from reusing produced water as hydraulic fracturing fluid. Environ. Sci. Technol. 2017, 51, 9391–9402. [Google Scholar] [CrossRef]
  42. Rahromostaqim, M.; Sahimi, M. Molecular Dynamics Simulation of Hydration and Swelling of Mixed-Layer Clays. J. Phys. Chem. C 2018, 122, 14631–14639. [Google Scholar] [CrossRef]
  43. Chenevert, M.E. Shale alteration by water adsorption. J. Petroleum Technol. 1970, 22, 1–141. [Google Scholar] [CrossRef]
  44. Wang, F.P.; Reed, R.M. Pore networks and fluid flow in gas shales. In SPE Annual Technical Conference and Exhibition; Society of Petroleum Engineers: Richardson, TX, USA, 2009. [Google Scholar]
  45. Heydari, E.; Wade, W.J. Massive recrystallization of low-Mg calcite at high temperatures in hydrocarbon source rocks: Implications for organic acids as factors in diagenesis. AAPG Bull. 2002, 86, 1285–1303. [Google Scholar]
  46. Baruch, E.T.; Kennedy, M.J.; Löhr, S.C.; Dewhurst, D.N. Feldspar dissolution-enhanced porosity in Paleoproterozoic shale reservoir facies from the Barney Creek Formation (McArthur Basin, Australia). AAPG Bull. 2015, 99, 1745–1770. [Google Scholar] [CrossRef]
  47. Land, L.S.; Milliken, K.L. Feldspar diagenesis in the Frio Formation, Brazoria County, Texas Gulf Coast. Geology 1981, 9, 314–318. [Google Scholar] [CrossRef]
  48. Dieterich, M.; Kutchko, B.; Goodman, A. Characterization of Marcellus Shale and Huntersville Chert before and after exposure to hydraulic fracturing fluid via feature relocation using field-emission scanning electron microscopy. Fuel 2016, 182, 227–235. [Google Scholar] [CrossRef] [Green Version]
  49. Ghanizadeh, A.; Clarkson, C.R.; Deglint, H.; Vahedian, A.; Aquino, S.; Wood, J.M. Unpropped/propped fracture permeability and proppant embedment evaluation: A rigorous core-analysis/imaging methodology. In Unconventional Resources Technology Conference, San Antonio, TX, USA, 1–3 August 2016; Society of Exploration Geophysicists: Tulsa, OK, USA; American Association of Petroleum: Washington, DC, USA, 2016. [Google Scholar]
  50. Knauss, K.G.; Wolery, T.J. Dependence of albite dissolution kinetics on pH and time at 25 °C and 70 °C. Geochim. Cosmochim. Acta 1986, 50, 2481–2497. [Google Scholar] [CrossRef]
  51. Wild, B.; Daval, D.; Guyot, F.; Knauss, K.G.; Pollet-Villard, M.; Imfeld, G. pH-dependent control of feldspar dissolution rate by altered surface layers. Chem. Geol. 2016, 442, 148–159. [Google Scholar] [CrossRef] [Green Version]
  52. Gruber, C.; Kutuzov, I.; Ganor, J. The combined effect of temperature and pH on albite dissolution rate under far-from-equilibrium conditions. Geochim. Cosmochim. Acta 2016, 186, 154–167. [Google Scholar] [CrossRef]
  53. Liang, C.; Chen, M.; Jin, Y.; Lu, Y. Wellbore stability model for shale gas reservoir considering the coupling of multi-weakness planes and porous flow. J. Nat. Gas Sci. Eng. 2014, 21, 364–378. [Google Scholar] [CrossRef]
  54. Lu, Y.H.; Chen, M.; Jin, Y.; Zhang, G.Q. A mechanical model of borehole stability for weak plane formation under porous flow. Pet. Sci. Technol. 2012, 30, 1629–1638. [Google Scholar] [CrossRef]
  55. Lu, Y.H.; Chen, M.; Jin, Y.; Ge, W.F.; An, S.; Zhou, Z. Influence of porous flow on wellbore stability for an inclined well with weak plane formation. Pet. Sci. Technol. 2013, 31, 616–624. [Google Scholar] [CrossRef]
  56. Cai, J.; Chenevert, M.E.; Sharma, M.M.; Friedheim, J.E. Decreasing water invasion into Atoka shale using nonmodified silica nanoparticles. SPE Drill. Complet. 2012, 27, 103–112. [Google Scholar] [CrossRef]
  57. Sharma, M.M.; Zhang, R.; Chenevert, M.E.; Ji, L.; Guo, Q.; Friedheim, J. A new family of nanoparticle based drilling fluids. In SPE Annual Technical Conference and Exhibition; Society of Petroleum Engineers: Richardson, TX, USA, 2012. [Google Scholar]
  58. O’Brien, D.E.; Chenevert, M.E. Stabilization of Sensitive Shales Using Inhibited, Potassium-Based Drilling Fluids; Dell Medical School: Austin, TX, USA, 2017. [Google Scholar]
  59. Liu, S.; Wang, J.; He, H.; Wang, H. Mechanism on imbibition of fracturing fluid in nanopore. Nanosci. Nanotech. Lett. 2018, 10, 87–93. [Google Scholar] [CrossRef]
  60. Bello, R.O.; Wattenbarger, R.A. Multi-stage hydraulically fractured horizontal shale gas well rate transient analysis. In North Africa Technical Conference and Exhibition; Society of Petroleum Engineers: Richardson, TX, USA, 2010. [Google Scholar]
Figure 1. Samples from the Longmaxi Formation that were used in immersion tests.
Energies 12 04225 g001
Figure 2. The location of target reservoir samples from the Longmaxi Formation used in this study (from Jiang et al., [30]).
Energies 12 04225 g002
Figure 3. Scanning electron microscopy (SEM) images of Longmaxi shale. (a) The surface is parallel to bedding planes, and (b) the surface is perpendicular to bedding plane.
Energies 12 04225 g003
Figure 4. Experimental setup for shale hydration observation under specific temperature and pressure, (a) shale rock sample, (b) GGS42 high-temperature and high-pressure (HTHP) Filtration Press used for sample immersion, (c) workbench of FEI Qemscan 650F energy-dispersive spectroscopy–field-emission scanning electron microscope (EDS–FESEM), and (d) data acquisition system.
Energies 12 04225 g004
Figure 5. Micro-fracture variations before and after (a) 1 day’s, (b) 3 days’ and (c) 5 days’ saturation with the imbibition parallel to bedding planes at pressure of 3.5 MPa and temperature of 80 °C. The ‘+’ in figure highlights the different ions and mineral, where red is for Mg in smectite, yellow is for Fe in smectite, blue is for illite and brown is for feldspar.
Energies 12 04225 g005aEnergies 12 04225 g005b
Figure 6. Shale sublayer surface variations before and after (a) 1 day’s, (b) 3 days’ and (c) 5 days’ saturation for the imbibition perpendicular to bedding planes at pressure of 3.5 MPa and temperature of 80 °C.
Energies 12 04225 g006
Figure 7. The percentage of dissolved pores area on sample surface varies with time at pressure of 3.5 Mpa and temperature of 80 °C.
Energies 12 04225 g007
Figure 8. Micro-fracture variations before and after (a) 1 day’s, (b) 3 days’ and (c) 5 days’ saturation with the temperature of 80 and 120 °C, respectively.
Energies 12 04225 g008aEnergies 12 04225 g008bEnergies 12 04225 g008c
Figure 9. Shale sublayer surface variations before and after (a) 1 day’s, (b) 3 days’ and (c) 5 days’ saturation for the imbibition perpendicular to bedding planes.
Energies 12 04225 g009aEnergies 12 04225 g009bEnergies 12 04225 g009c
Figure 10. The percentage of dissolved pores area on sample surface varies with time at pressure of 3.5 Mpa and temperature of 80 and 120 °C.
Energies 12 04225 g010
Figure 11. Schematic of the generation of hydrated fractures parallel to shale bedding planes.
Energies 12 04225 g011
Table 1. Organic and inorganic mineral composition of shale samples.
Sampling DepthTOC *Mineral Composition (%)
(m)(%)QuartzFeldsparCalciteDolomitePyriteClay
23211.783111.412.95.11.238.4
23242.8531.75.58.35.93.645
* TOC represents the total organic carbon of the tested samples.
Table 2. Clay minerals composition of shale samples.
Sampling DepthRelative Content of Clay Minerals (%)Mixed-Layer Ratio (%S) **
(m)I/S *ItKCI/S
2321532891012
23244434101212
* I/S: illite/smectite mixed; It: illite; K: kaolinite; C: chlorite. ** %S: Portion of smectite in illite/smectite mixed-layer.
Table 3. Sample information under different saturation time and temperature conditions.
Immersion Time (Day)Test Temperature (°C) *
12080
1YS-01, YS-02YS-07, YS-08
2YS-11, YS-12YS-15, YS-16
3YS-03, YS-04YS-09, YS-10
4YS-13, YS-14YS-17, YS-18
5YS-05, YS-06YS-19, YS-20
* Samples with odd-number imbibe water parallel to the shale bedding planes and even-number imbibe water perpendicular to the bedding planes. All the tests are performed with pressure of 3.5 MPa.

