Article

A Fixed Length Adaptive Moving Average Filter-Based Synchrophasor Measurement Algorithm for P Class PMUs

College of Information and Electrical Engineering, China Agricultural University, 100083 Beijing, China
*
Author to whom correspondence should be addressed.
Energies 2019, 12(21), 4168; https://doi.org/10.3390/en12214168
Submission received: 17 September 2019 / Revised: 23 October 2019 / Accepted: 29 October 2019 / Published: 1 November 2019

Abstract

:
Accurate and fast synchrophasor measurement is the key to the wide applications of PMUs in the system-wide monitoring and reliable operation of smart grid. To address this issue, a fixed length moving average filter-based synchrophasor measurement algorithm for P class phasor measurement units (PMUs) (FA-PSMA) is proposed in this paper. Firstly, a novel fixed length adaptive moving average filter (FAMAF) is proposed. The FAMAF has an adaptive filter capability with a fixed data window length. Then, the FAMAF is applied after a phase-locked loop (PLL) for enhanced disturbance rejection capability under frequency drifts. Finally, a detailed performance assessment is presented to validate the performance of the proposed FA-PSMA. Theoretical analysis and simulation results validate that the proposed FA-PSMA can track the grid frequency and phasor accurately under distorted grid conditions. The response time and measurement accuracy satisfy the requirements specified in IEC/IEEE 60255-118-1.

1. Introduction

Phasor measurement units (PMUs) are widely deployed for power systems network monitoring in real time. Synchrophasor measurement algorithm (SMA) is the core of PMU applications in wide-area measurement systems (WAMS). Fast and robust SMA is expected to become a fundamental task for the monitoring and management of the smart grids [1,2,3,4,5,6].
IEC/IEEE 60255-118-1 [7] has defined two classes PMUs due to their different applications in the power applications, namely M class PMUs and P class PMUs. Accordingly, the SMAs can also be classified into P class (PSMA) and M class (MSMA). PSMA is mainly for the protection applications and MSMA is mainly for the monitoring applications. Compared with the MSMA, the PSMA needs a much faster response, which means a limitation of filters’ data window length in the PSMA structure. Thus, the PSMA should be designed carefully to obtain both a fast dynamic response and a satisfying disturbance rejection capability.
Nowadays, the discrete Fourier Transform (DFT) based PSMAs are commonly used in commercial PMUs. However, the conventional DFT-based algorithms have been proven to be accurate in a variety of power system applications as long as the power grid frequency is close to its nominal value. However, signal significant errors will arise due to the spectral leakage issue of DFT in the presence of frequency deviation [8,9,10]. The efforts that have been proposed to improve the accuracy of DFT-based estimation algorithm under off-nominal frequency conditions [11,12,13,14,15,16,17]. However, the efforts increase the implementation complexity and may slow down the dynamic response.
Many non-DFT-based PSMAs, such as level crossing [18], Kalman filtering [19,20], Newton algorithm [21], adaptive neural network [22], least squares [23,24,25], wavelet [26,27], Taylor algorithm [28,29], and subspace algorithm [30], have been proposed in the literature. However, these methods usually have some disadvantages that limit their applications in synchrophasor measurement situations. For example, the presented methods usually have limited disturbance rejection capability and their measurement accuracy may be unsatisfactory under some conditions, for example, under harmonic condition wherein the power grid frequency deviates from the nominal frequency. Moreover, the presented methods usually have a tradeoff between the dynamic response and steady state accuracy. The improvement of the measurement accuracy is generally at the expense of worse dynamic performance.
To solve these issues, a fixed length adaptive moving average filter-based PSMA (FA-PSMA) is proposed in this paper. The proposed FA-PSMA is based on a fixed length adaptive moving average filter (FAMAF). The FAMAF has a fixed data window length, which is preferred for synchrophasor measurement. The frequency response of the FAMAF can be easily adjusted according to the grid frequency variations. The FAMAF is applied after a phase-locked loop (PLL) to filter the ripples in the outputs of the PLL under frequency drifts. The performance assessment is presented to validate the merit of the proposed FA-PSMA.
The organization of this paper is as follows: The proposed FA-PSMA is introduced in Section 2. The performance assessment is presented in Section 3, and a conclusion is given in Section 4.

2. Materials and Methods

2.1. A Fixed Length Adaptive Moving Average Filter

The moving average filter (MAF) is one of the most popular filters due to its effectiveness and simple implementation [31,32]. A MAF process is defined as
x M A F ( k ) = 1 N w i = k N w + 1 k x ( i ) = 1 N w i = k N w + 1 k x ( i ) h M A F ( k i ) ,
where N w = T w / T s , T w is the data window length of the MAF, T s = 1 / f s , f s is the sample frequency. h M A F ( m ) = [ 1 , 1 , , 1 ] , m = 0 , 1 , , N w 1 . Equation (1) is equivalent to a finite impulse response (FIR) filtering process with the impulse response as h M A F ( m ) . The frequency response of the MAF can be described as
H M A F ( f ) = sin ( π f / f w ) N w sin ( π f / f s ) π f ( T s T w ) ,
where f w = 1 / T w . It can be validated that H M A F ( k f w ) = 0 . It means that the MAF can filter the disturbance at integer multiples of f w .
If the data window length T w (or f w , N w ) in (1–2) is not adapted according to the input signal, the MAF is a non-adaptive MAF (NMAF). The NMAF has fixed filtering capability, and its filtering capability decreases under grid frequency variations.
If the data window length T w (or f w , N w ) in (1–2) is adapted according to the input signal, the MAF is an adaptive MAF (AMAF). The AMAFs have variable frequency response, which can filter disturbances under frequency drifts. The AMAFs and their digital implementations have been studied in [33]. However, the data window length of the AMAFs mentioned in [33] is variable, which makes it difficult to set time stamps for the estimated parameters in synchronized phasor measurement. To address this issue, a fixed length AMAF (FAMAF) is proposed in the following. The FAMAF has adjustable filtering capability with a fixed data window length.
The FAMAF is defined as
x F A M A F ( k ) = 1 N w 2 r { n = 0 N w 1 x ( k n ) r [ x ( k N w + 1 ) + x ( k ) ] } = 1 N w 2 r i = k N w + 1 k x ( i ) h F A M A F ( k i )
where N w = T w / T s , T w is the data window length of the FAMAF. The FAMAF shown in (3) is equivalent to an FIR filtering process with the impulse response as h F A M A F ( m ) = [ 1 r , 1 , , 1 r ] , and m = 0 , 1 , , N w 1 . The transfer function and frequency response of h F A M A F ( m ) can be expressed as
H F A M A F ( z ) = 1 N w [ 1 z N w 1 z 1 r ( 1 + z N w + 1 ) ] ,
H F A M A F ( f ) = 1 N w { sin ( π f / f w ) sin ( π f / f s ) 2 r cos [ π f ( T w T s ) ] } e j π f ( T s T w ) .
It can be validated that if the value of r in (5) is set as
r = sin ( π Δ f w / f w ) sin [ π ( f w + Δ f w ) / f s ] × 2 cos [ π ( f w + Δ f w ) ( T w T s ) ] .
Then,
| H F A M A F [ k ( f w + Δ f w ) ] | = 0 .
Equation (7) means that the FAMAF can filter disturbance components at integer multiples of f w + Δ f w with a fixed data window length T w = 1 / f w . The frequency response of the FAMAF can be adjusted by adjusting the value of r. An example is given in the following to verify the effectiveness of the proposed FAMAF.
Example:
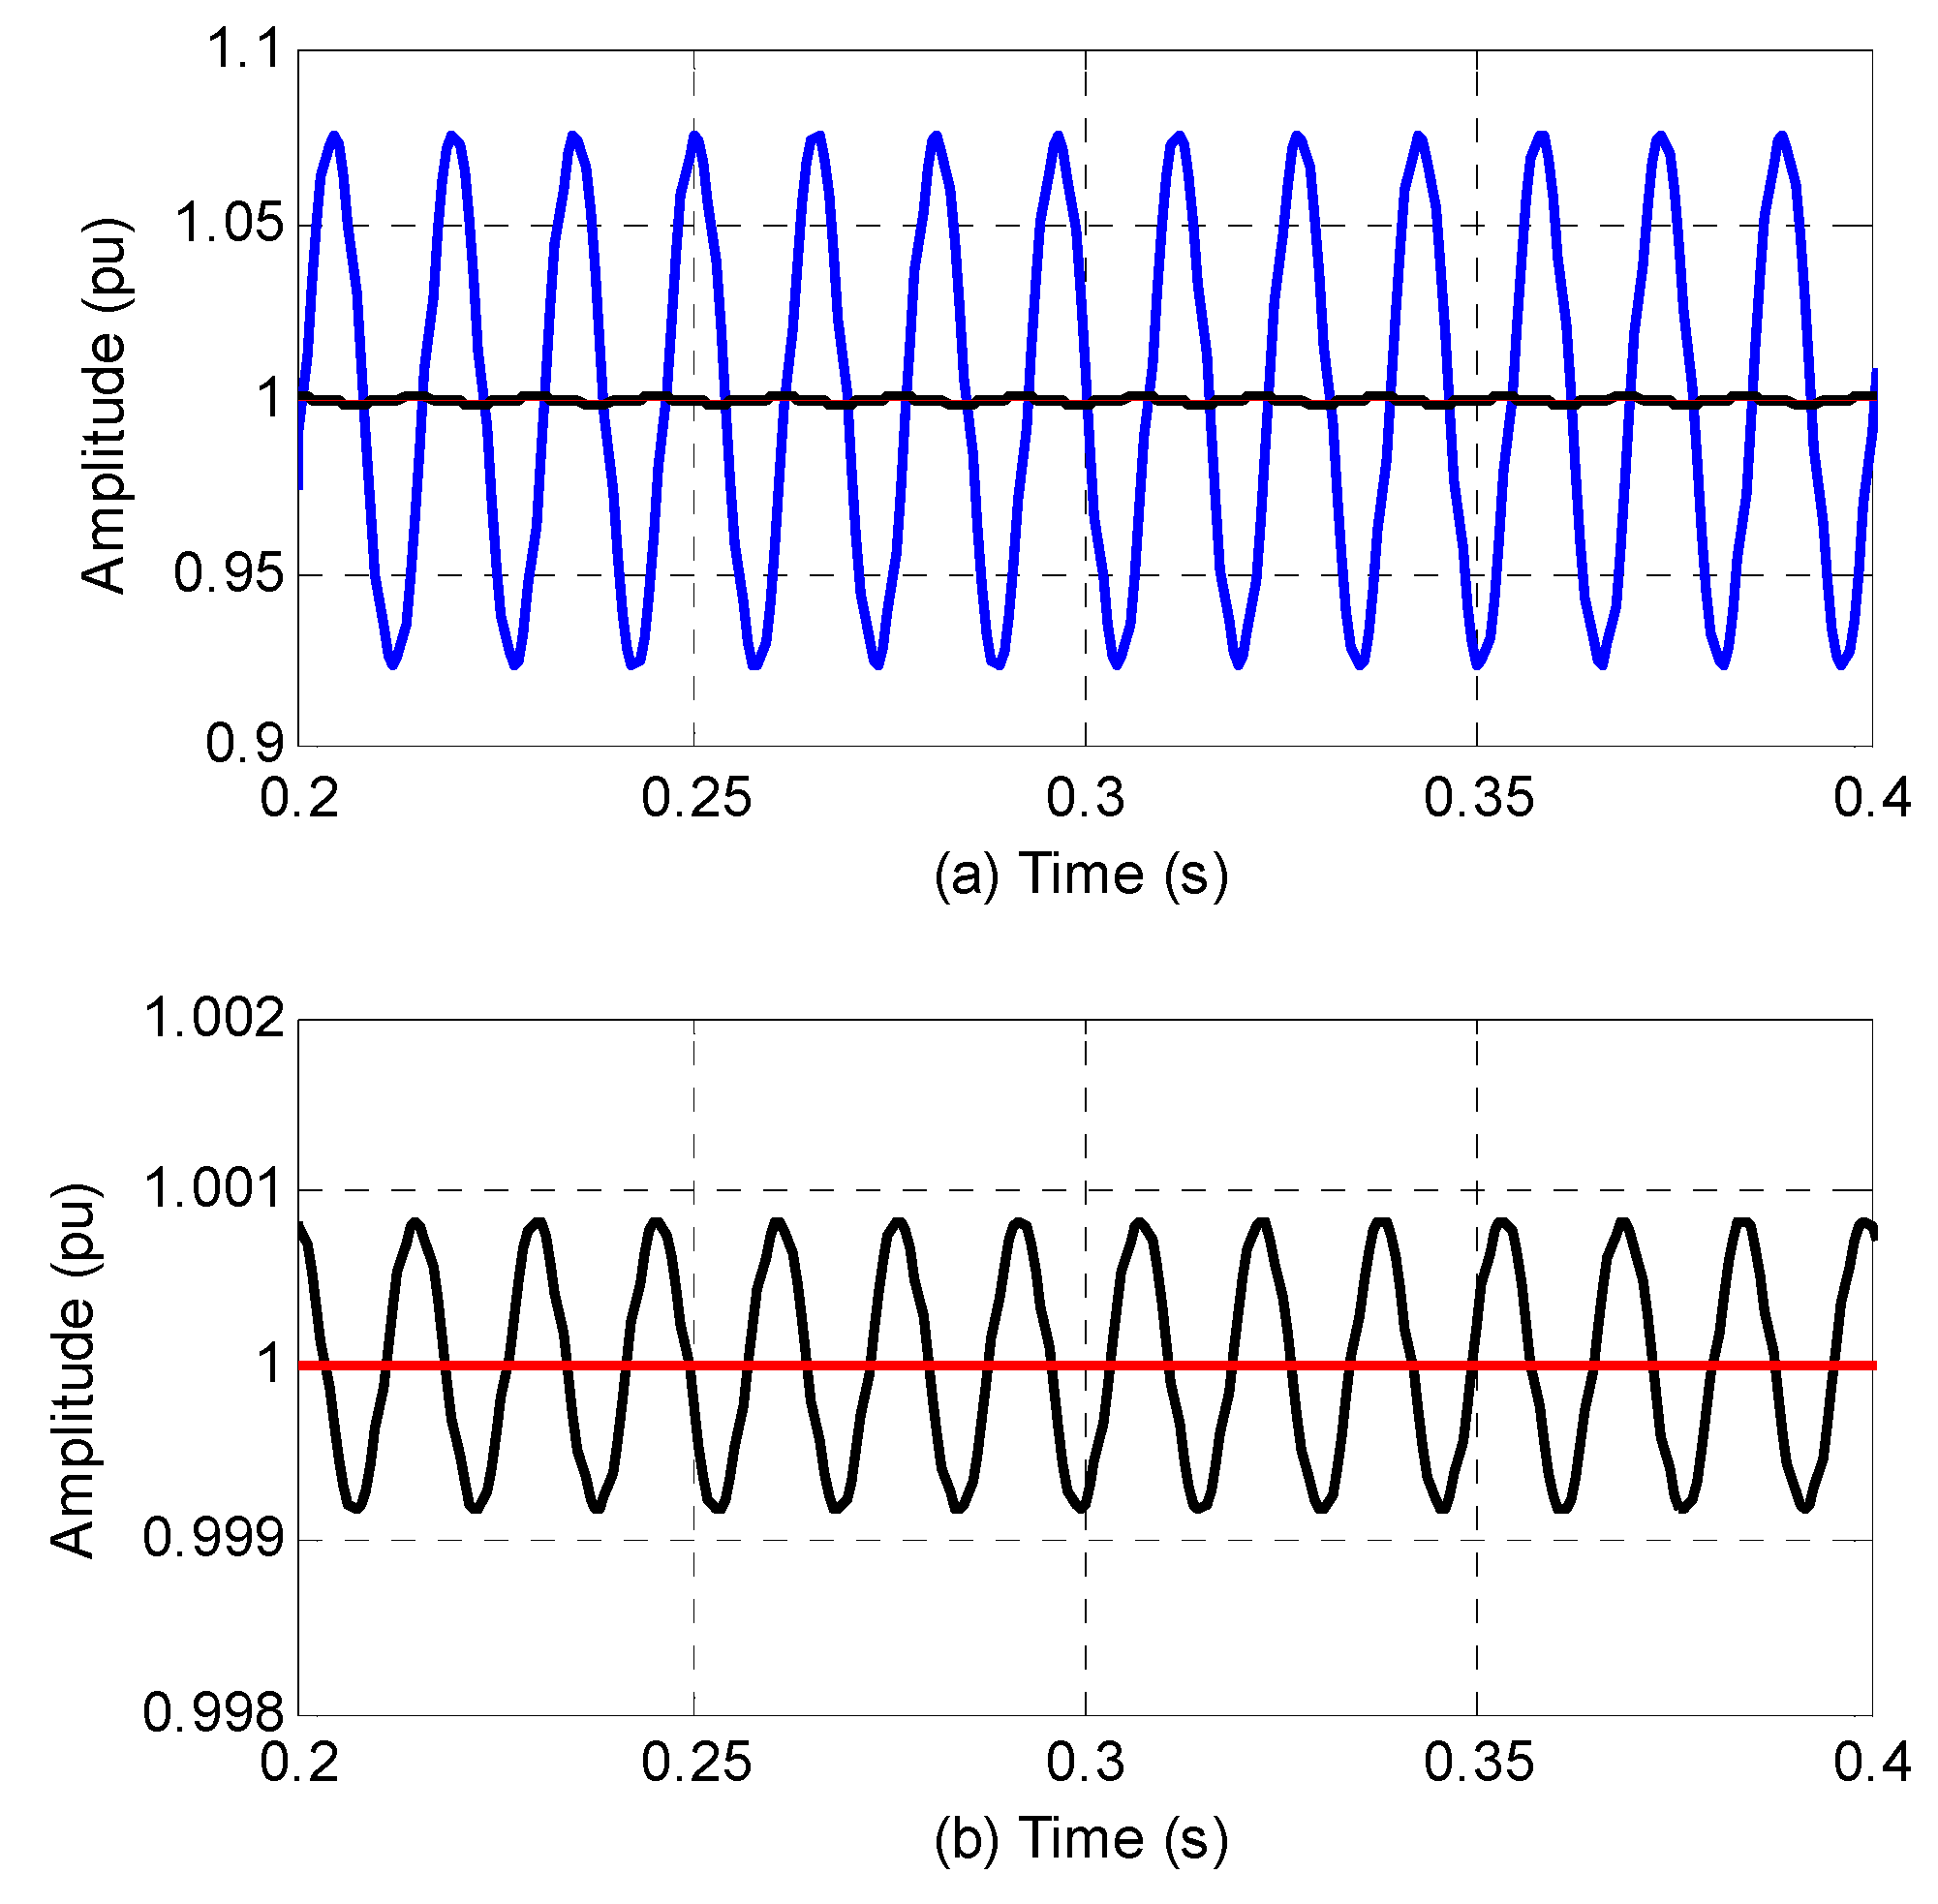
The model of test signal is x ( t ) = 1 + sin ( 2 π 65 t ) , the frequency of the oscillating component is 65 Hz, and the sampling frequency is set as 1.44 kHz. To filter the oscillating component, three filters have been applied. The filters include the NMAF, the FAMAF shown in (3) and the linear interpolation-based AMAF (LIP-AMAF) mentioned in [33]. The data window length of NMAF and FAMAF is fixed at one nominal cycle, or 16.7 ms. The data window length of the LIP-AMAF is adjusted according to the grid frequency as 16.0 ms. The value of r for the FAMAF is 0.9223 referring to (6). The value of Δ for the LIP-AMAF is 0.1538 referring to [33], where Δ is a coefficient that makes the LIP-AMAF frequency adaptive.
The frequency responses of the three filters are shown in Figure 1a, and a zoomed-in view of Figure 1a is shown in Figure 1b. The filtering results are shown in Figure 2a, and a detailed comparison between the LIP-AMAF and the FAMAF is shown in Figure 2b. Figure 1a shows that the three filters have similar magnitude response. Figure 1b shows that the proposed FAMAF has the largest magnitude decay for the oscillating component at 65 Hz. It means that the FAMAF has the best filtering capability for the oscillating component. This has been validated by the filtering results shown in Figure 2. In Figure 2a, the waveforms of LIP-AMAF and FAMAF are almost overlapped. It means that the both of them have excellent filtering capability for the disturbance. A detailed comparison between the two filters is presented in Figure 2b. Figure 2b shows that the FAMAF has higher filtering capability than the LIP-AMAF. What is more, compared with the LIP-AMAF, the FAMAF has a fixed data window length, so it has a fixed response delay, which makes it efficient to set time stamps for the estimated parameters in synchrophasor measurement applications.

2.2. The Proposed FA-PSMA

The structure of the FA-PSMA is shown in Figure 3. There is a PLL in the FA-PSMA structure shown in Figure 3. The detailed structure of the PLL is shown in Figure 4.
In Figure 4, the major part is a type-1 PLL. The type-1 PLL has only one integrator in its control loop and, therefore, has a high stability margin and fast dynamics [34,35,36].
In Figure 4, before the PLL’s control loop, there is a cascade connection of two Park’s transformations with different rotating frequencies (phase angles). The rotating frequency (phase angle) of the first Park’s transformation is f 0 ( θ r f = 2 π f 0 d t , f 0 is the nominal grid frequency). The first Park’s transformation is equivalent to inversely rotating the input voltage vector with the frequency (phase angle) of f 0 ( θ r f ). Thus, the fundamental frequency positive sequence (FFPS) component has been transformed into a quasi-dc term with the frequency (phase angle) as Δ f = f 1 f 0 ( Δ θ = θ 1 θ r f ) after the first Park’s transformation. The rotating frequency (phase angle) of the second Park’s transformation will be approximated to Δ f ( Δ θ while with a constant phase error) due to the effect of the PLL’s control loop.
In Figure 4, the cascade connection of NMAFs is applied as the pre-loop filters to block the disturbances before the PLL’s control loop. In this paper, the data window length of the NMAFs is set as T 0 / 2 , where T 0 is the nominal grid cycle.
The application of NMAFs in the PLL shown in Figure 4 gives forth to amplitude decay in the PLL’s outputs under frequency drifts. Notice that the NMAFs are applied after the first Park’s transformation, the FFPS has been transformed into a quasi-dc term with the frequency as Δ f = f 1 f 0 , thus the amplitude decay caused by one NMAF can be obtained from (2) as
K N M A F = 2 sin ( π Δ f / 2 f 0 ) N 0 sin ( π Δ f / f s ) ,
where N 0 is the number of sample points in one nominal grid cycle. A cascade connection of two NMAFs is applied in the prefiltering stage. Thus, the amplitude decay is ( K N M A F ) 2 , which has been compensated in Figure 4 using K 1 , and K 1 = ( 1 / K N M A F ) 2 .
The NMAFs shown in Figure 4 can block the even-order harmonics after the first Park’s transformation. Notice that the first Park’s transformation is equivalent to inversely rotating the voltage signal with the frequency of f 0 , thus the even-order harmonics after the first Park’s transformation corresponds to the fundamental frequency negative sequence (FFNS) component and odd-order harmonics in the electrical signal. However, the filtering capabilities of the NMAFs may decrease in the presence of frequency drifts. Moreover, the even-order harmonics in the electrical signal cannot be blocked by the NMAFs. The unsatisfactory filtering capability of NMAFs results in ripples in the PLL’s outputs.
To further block the ripples in the PLL’s outputs, the FAMAF-based post filtering strategy is suggested in Figure 3. In this paper, the data window length of the FAMAF is set as T w = ( N 0 + 1 ) / f s , where N 0 is the number of sample points in one nominal cycle. With a fixed data window length, the FAMAFs can effectively filter disturbance in the PLL’s outputs under frequency drifts.
The value of r in the FAMAFs is calculated as follows. The PLL’s output frequency passes through an FAMAF, and a rough frequency estimation f ^ 1 is obtained. The value of f ^ 1 is used to adapt the FAMAFs as shown in Figure 3. The values of r in the FAMAF is calculated using (6) with Δ f w = f ^ 1 f w , where f w = f s / ( N 0 + 1 ) .
The estimation of f ^ 1 has a fast response time. However, it has a decreased accuracy under dynamics. To solve this issue, a more accurate frequency estimation f 1 is presented in Figure 3. f 1 is calculated using the least square fitting method (LSFM) [16] as follows.
f 1 ( k ) = m = 0 L f 1 F m Δ θ ( k m φ f s t e p ) 2 π ,
where Δ θ ( k ) is the phase angles shown in Figure 3 that used to calculate the input frequency. φ f s t e p is the step between two angles, L f is the number of angles used in the LSFM. The values of F m are constant coefficients that can be calculated using the same method adopted in [16]. For example, assume F s = 1.44 kHz, φ f s t e p = N 0 / 4 and L f = 9 , then F 1 = 16 , F 2 = 12 , F 3 = 8 , F 4 = 4 , F 5 = 0 , F 6 = 4 , F 7 = 8 , F 8 = 12 , and F 9 = 16 .
The rate of change of frequency (ROCOF) can be calculated using the LSFM as
R O C O F ( k ) = m = 0 L r f 1 R F m f 1 ( k m φ r f s t e p ) ,
where f 1 ( k ) is the estimated frequency in (9). φ r f s t e p is the step between two frequencies, L r f is the number of frequencies used in the LSFM. The values of R F m are constant coefficients that can be calculated using the similar method to calculate F m [16].
The larger values of φ f s t e p , φ r f s t e p , L f , and L r f means a longer data window length for the estimation of frequency and ROCOF, corresponding to a higher measurement accuracy and slower dynamic response, and vice versa.
In the FA-PSMA structure shown in Figure 3, the FAMAFs are applied after the PLL’s control loop, and the frequency feedback branch for the FAMAF will not affect the stability margin of the PLL’s control loop. Thus a wide bandwidth can be set for the PLL’s control loop for a fast dynamic response. In this paper, k p is set as 0.5 f s .
The FA-PSMA is designed for a three-phase system. It has high disturbance rejection capability for the FFNS component due to the NMAFs-based pre-loop filters. Considering the fact that a single-phase system is an imbalanced three-phase system with large FFNS component, the proposed FA-PSMA can be applied for single-phase applications with v a ( t ) = 2 v ( t ) , v b ( t ) = v c ( t ) = 0 .
The FA-PSMA is a recursive method. The NMAF and FAMAF can be implemented using the recursive method. Thus, the computation burden of FA-PSMA is quite low. Table 1 shows the real multiplication and real addition of each part of the FA-PSMA.
The computation burden of the FA-PSMA method mainly comes from Clark’s Transformation, Park’s Transformation, FAMAF, the calculation of r in FAMAF, PLL and LSFM. Because the iterative method is adopted, the computation burden of the proposed method is greatly reduced. However, for the DFT method, a DFT operation requires a total of N complex multiplications and (N − 1) complex additions, a total of 4N real multiplications and 2(2N − 1) real additions. When N is large, the computation burden is very large.

2.3. Time Stamping of the Estimated Parameters

The proposed FA-PSMA method is a recursive method. To accurately set time stamps for the estimated parameters, the measurement latency of the estimated parameters should be known. The measurement latency of the estimated parameters is mainly caused by the implementation of NMAFs, FAMAFs, PLL’s control loop and LSFM. The measurement latency for the estimations of phase angle, amplitude, frequency and ROCOF is analyzed in the following.
The measurement latency of phase angle measurement is mainly caused by the NMAFs, the FAMAF and the PLL’s control loop. The delay caused by one NMAF (or FAMAF) is ( N w 1 ) / 2 . Two NMAFs and one FAMAF are applied in the phase angle measurement. The delay caused by the NMAFs and FAMAF is ( N 0 1 ) T s . The control loop is a first order system with the time constant as 1 / k p . The settling time is related to the value of 1 / k p . If the value of k p is set as 0.5 f s , the measurement latency caused by the control loop is 2 T s . Thus, the total measurement latency of phase measurement is ( N 0 + 1 ) T s , and the time tag of t ( N 0 + 1 ) T s is used to set the time stamp for the estimated phase angle at time instant t .
The measurement latency of amplitude measurement is mainly caused by the NMAFs and the FAMAF. Two NMAFs and one FAMAF are applied in the amplitude measurement. Thus, the total latency of amplitude measurement is ( N 0 1 ) T s , and the time tag of t ( N 0 1 ) T s is used to set the time stamp for the estimated amplitude at time instant t .
The measurement latency of frequency measurement is mainly caused by the NMAFs, FAMAF, PLL’s control loop and LSFM process shown in (9). Two NMAFs and one FAMAF are applied in frequency measurement. The latency caused by NMAFs, FAMAF and PLL’s control loop is ( N 0 + 1 ) T s . The latency caused by the LSFM process is φ f s t e p ( L f 1 ) 2 T s . Totally, the measurement latency of frequency measurement is [ N 0 + 1 + φ f s t e p ( L f 1 ) 2 ] T s . For example, if φ f s t e p is set as φ f s t e p = N 0 / 4 , L f = 9 , the measurement latency of frequency measurement is ( 2 N 0 + 1 ) T s . Therefore, the time tag of t ( 2 N 0 + 1 ) T s is used to set the time stamp for the estimated frequency at time instant t .
The measurement latency of ROCOF measurement is mainly caused by the frequency measurement and the LSFM. Totally, the measurement latency of ROCOF measurement is [ N 0 + 1 + φ f s t e p ( L f 1 ) 2 + φ r f s t e p ( L r f 1 ) 2 ] T s , and the time tag of t [ N 0 + 1 + φ f s t e p ( L f 1 ) 2 + φ r f s t e p ( L r f 1 ) 2 ] T s is used to set the time stamp for the estimated frequency at time instant t . For example, if the parameters are set as φ f s t e p = N 0 / 4 , φ r f s t e p = N 0 / 4 , L f = 9 , and L r f = 9 , the measurement latency of ROCOF measurement is ( 3 N 0 + 1 ) T s and the time tag of t ( 3 N 0 + 1 ) T s is used to set the time stamp for the estimated ROCOF at time instant t .

2.4. Practical Considerations for the Digital Signal Processor(DSP) Implementation

For the real-time DSP implementation, the rotating angle of the second Park’s transformation ( Δ θ in Figure 4) is a ramp signal that continuously increases. Its value has to be reset after a particular amount of time to avoid data overflow. For example, if Δ θ ( k ) > 2 M π ( M is a large integer, which can be preset), then Δ θ ( k ) is reset as Δ θ ( k ) = Δ θ ( k ) 2 M π to avoid data overflow. The reset process gives forth to a phase jump in Δ θ ( k ) , and results in erroneous phase estimations in Δ θ ( i ) ( i = k , , k + N 0 ) in Figure 3 due to the FAMAF process. To solve this issue, reset the former N 0 values of Δ θ ( i ) ( i = k N 0 , , k 1 ) as Δ θ ( i ) = Δ θ ( i ) 2 M π if there is a reset process in Δ θ ( k ) , and the erroneous phase estimations caused by the reset process can be avoided satisfactorily.

3. Performance Assessment

3.1. Response Time Assessment

The response time of the FA-PSMA is evaluated under step changes. The step changes in amplitude and phase angle can be modeled as
x ( t ) = X m [ 1 + k x f 1 ( t ) ] × cos [ 2 π f 0 t + k a f 1 ( t ) ] ,
where f 1 ( t ) is a unit step function, k x and k a are the magnitudes of step functions in amplitude and phase angle, respectively [7]. The nominal frequency is 60 Hz.
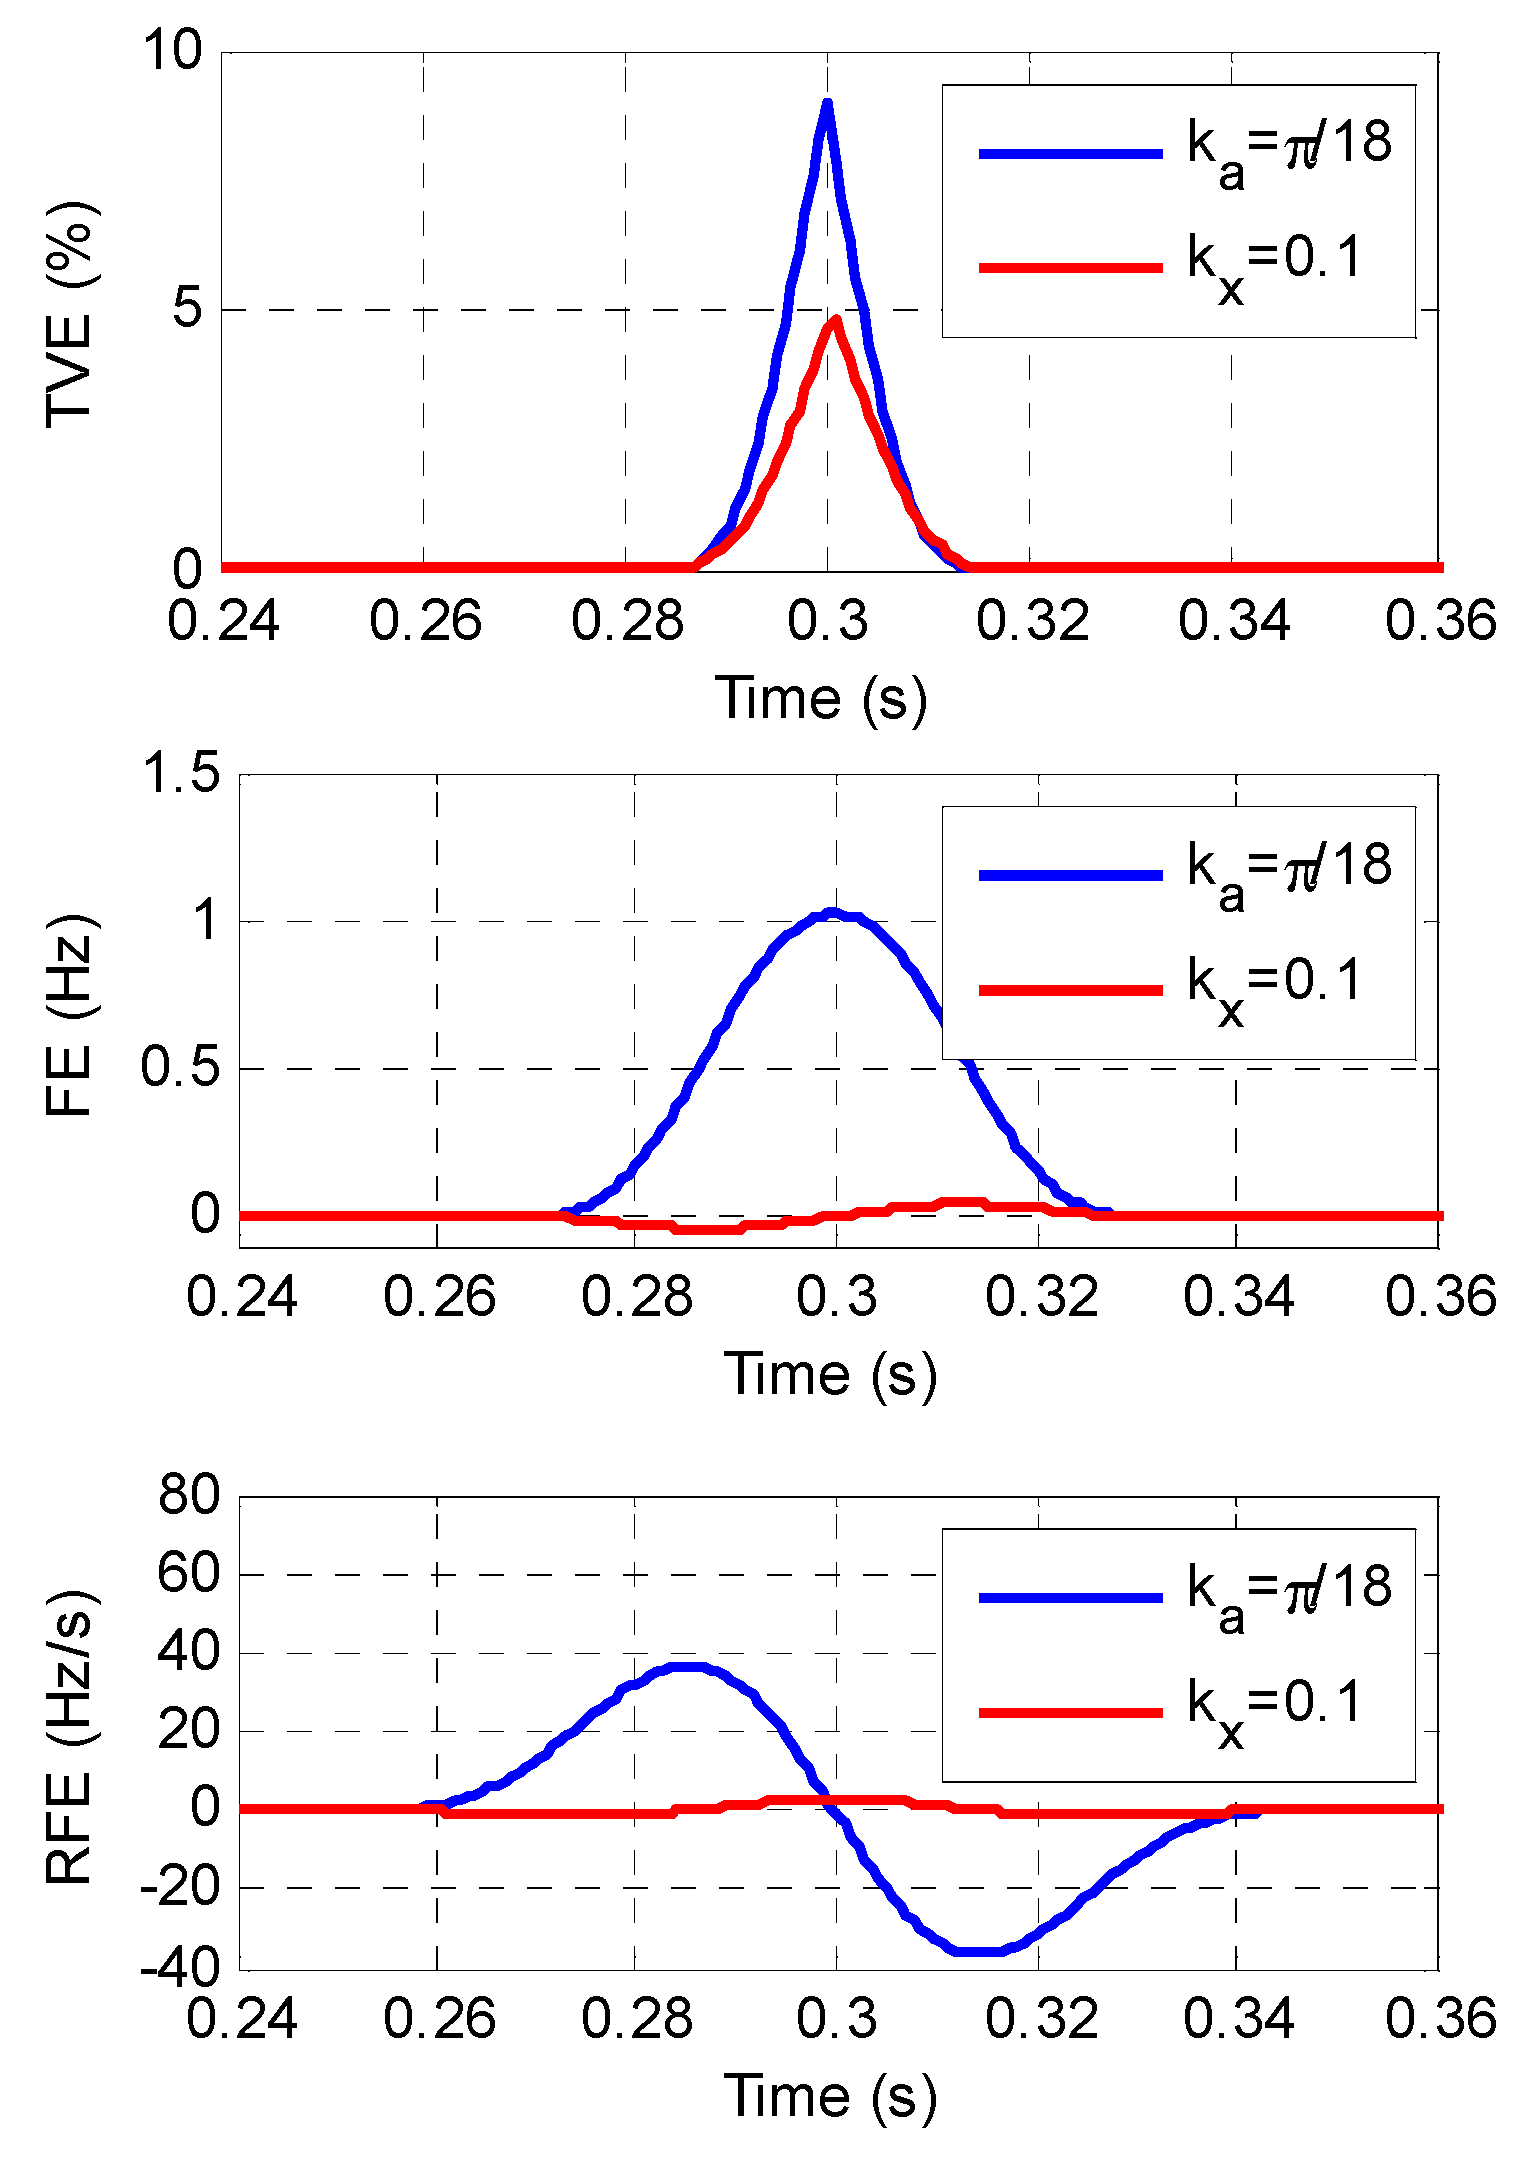
To evaluate the performance of the FA-PSMA under step changes, k x and k a are set to 0.1 and π / 18 individually according to [7]. For the FA-PSMA, the parameters are set as φ f s t e p = N 0 / 4 , φ r f s t e p = N 0 / 4 , L f = 9 , and L r f = 9 . The estimated total vector error (TVE) defined in (12), the frequency error (FE) and the ROCOF error (RFE) are shown in Figure 5.
T V E ( t ) = [ X ^ r ( t ) X r ( t ) ] 2 + [ X ^ i ( t ) X i ( t ) ] 2 [ X r ( t ) + X i ( t ) ] 2 ,
where X r ( t ) and X i ( t ) are real components and imaginary components of theoretical values of the input signal at time t respectively, and X ^ r ( t ) and X ^ i ( t ) are real components and imaginary components of the measured values.
The results are also tabulated in Table 2 as IEC/IEEE 60255-118-1 [7] to represent the response time for TVE, FE and RFE. The required response time in [7] is also shown in Table 2. Figure 5 and Table 2 show that the response time of FA-PSMA satisfies the response requirements specified in [7].

3.2. Measurement Accuracy Assessment

The measurement accuracy of the FA-PSMA is evaluated under various dynamics and distortions. The test conditions are referred to [3,4] as follows.
Case 1 (frequency range test): The reference signal is
x ( t ) = cos ( 2 π f t ) ,
where f = f 0 + Δ f , f 0 is the nominal grid frequency and 2 Δ f 2 .
Case 2 (harmonic distortion test): The reference signal is
x ( t ) = cos ( 2 π f 0 t ) + 0.01 cos ( 2 π h f 0 t ) ,
where h is the order of harmonic varying from 2 to 50.
Case 3 (frequency ramp test): The reference signal is
x ( t ) = cos ( 2 π f t ) ,
where the fundamental frequency varies from 58 Hz to 62 Hz with a ramp rate of 1Hz/s in the duration of 4 seconds.
Case 4 (phase modulation test): The reference signal is
x ( t ) = cos ( θ 1 ) ,
where θ 1 = 2 π f 0 t + k a cos ( 2 π f m t ) , k a = 0.1 , the modulation frequency f m varies from 0.1 to 5 Hz.
Case 5 (amplitude modulation test): The reference signal is
x ( t ) = A 1 cos ( 2 π f 0 t ) ,
where A 1 = 1 + k x cos ( 2 π f m t ) , k x = 0.1 , the modulation frequency f m varies from 0.1 to 5 Hz.
Case 6 (Case 1+Case 2): The reference signal is
x ( t ) = cos ( 2 π f t ) + 0.01 cos ( 2 π h f t ) ,
where harmonic distortion is added into the signal model in (13). h is the order of harmonics varying from 2 to 50.
Case 7 (Case 2 + Case 3): The reference signal is
x ( t ) = cos ( 2 π f t ) + 0.01 cos ( 2 π h f t ) ,
where harmonic distortion is added into the signal model in (15). h is the order of harmonics varying from 2 to 50.
Case 8 (Case 1 + Case 2 + Case 4): The reference signal is
x ( t ) = cos ( θ 1 ) + 0.01 cos ( 2 π h f t ) ,
where the phase modulation is added into the signal model in (18). θ 1 = 2 π f t + k a cos ( 2 π f m t ) , k a = 0.1 , and the modulation frequency f m vary from 0.1 to 5 Hz.
Case 9 (Case 1 + Case 2 + Case 4 + Case 5): The reference signal is
x ( t ) = A 1 cos ( θ 1 ) + 0.01 cos ( 2 π h f t ) ,
where the amplitude modulation is added into the signal model in (20). A 1 = 1 + k x cos ( 2 π f m t ) , k x = 0.1 , and the modulation frequency f m vary from 0.1 to 5 Hz.
Totally, nine test cases are performed. Specially, the proposed method has considered not only the influence of single type of disturbance but also the influence of composite types of disturbances, because the dynamics and distortions in the power grid may occur simultaneously. Among the nine test cases, single type of disturbance specified in the benchmark tests in [7] occurs in cases 1–5, and composite types of disturbances occur simultaneously in cases 6–9. The maximum values of TVE, FE, RFE, magnitude error (ME) and phase error (PE) are presented in Table 3. The specified errors in [7] are also shown in Table 3. For the composite disturbances, the maximum errors specified for single type of disturbance in [7] are shown in Table 3. Table 3 shows that the measurement accuracy of the FA-PSMA satisfies the requirements specified in [7].

3.3. Comparison with the Dynamic Synchrophasor Estimation Algorithm (DPMA), the Clark Transformation-Based DFT Phasor and Frequency Algorithm (CT-DFT), and the Modified Dynamic Synchrophasor Estimationalgorithm (MDSEA)

In Section 3.2, case 4, case 5 and related composite disturbance cases have verified the performance of the proposed method under oscillation to some extent, and the experimental results show that the proposed FA-PSMA can track the grid frequency and phasor accurately under oscillatory conditions.
To further test the performance under oscillatory transients, the proposed FA-PSMA is compared with the DPMA [29], the CT-DFT [16] and the MDSEA [28] under power oscillation conditions. For a fair of comparison, as indicted in [28], the nominal frequency is 50 Hz, and the sampling frequency is 2.4 kHz. Two cases are performed, and experimental results are given in Table 4.
The signal is modeled as
x ( t ) = [ 1 + k x cos ( 2 π f m t ) ] × cos [ 2 π ( f 0 + Δ f ) t + k α cos ( 2 π f m t π ) ] ,
where f m is the modulation frequency ranging from 0.1 Hz to 5 Hz. k x is the amplitude modulation factor, and k a is the phase angle modulation factor.
Case 1 (amplitude oscillation test): k x = 0.1 , and k a = 0 .
Case 2 (phase oscillation test): k x = 0 , and k a = 0.1 .
Test conditions and the measurement accuracy can be obtained in Table 4. Table 4 shows that the FA-PSMA provides the most accurate measurements for the majority of parameters.
Only in case 1, when the fundamental frequency deviates to 45 Hz and 47.5 Hz, the FA-PSMA does not have the highest accuracy in FE. However, the measurement errors (7e-3 Hz and 4e-3 Hz) are much less than the IEEE Standard. Moreover, the FA-PSMA has the highest accuracy in the measurement of TVE and RFE under these conditions.

4. Conclusions

In this paper, a novel implementation of AMAF (FAMAF) is proposed for synchrophasor measurement. The FAMAF has an adjustable frequency response and a fixed data window length. So it is efficient to filter the disturbances under frequency drift for synchrophasor measurement applications. The FAMAF is applied to filter the ripples in the outputs of a type-1 PLL for accurate and fast phasor and frequency measurement. The FA-PSMA has not only a simple structure but also a low computation burden. Specially, the FA-PSMA has considered the influence of composite types of disturbances, which is not considered enough in other methods. Because the dynamics and distortions in the power grid may occur simultaneously, it is necessary to conduct performance assessment under composite disturbances conditions. Theoretical analysis and experimental results validate that the proposed FA-PSMA can track the grid frequency and phasor accurately under distorted grid conditions. The response time and measurement accuracy comply with all the P class requirements specified in IEC/IEEE 60255-118-1.

Author Contributions

Conceptualization, H.X. and M.R.; methodology, H.X.; software, M.R.; validation, M.R. and Y.C.; formal analysis, H.X. and M.R.; investigation, Y.C.; resources, Y.C.; data curation, M.R.; writing—original draft preparation, H.X. and M.R.; writing—review and editing, H.X. and M.R.; visualization, M.R.; supervision, M.R.; project administration, H.X. and M.R.; funding acquisition, H.X.

Funding

This research was funded by National Natural Science Foundation of China, grant number 51477173.

Conflicts of Interest

The authors declare no conflict of interest.

References

  1. Aminifar, F.; Fotuhi-Firuzabad, M.; Safdarian, A.; Davoudi, A.; Shahidehpour, M. Synchrophasor measurement technology in power systems: panorama and state-of-the-art. IEEE Access 2014, 2, 1607–1628. [Google Scholar] [CrossRef]
  2. Phadke, A.G.; Kasztenny, B. Synchronized phasor and frequency measurement under transient conditions. IEEE Trans. Power Deliv. 2009, 24, 89–95. [Google Scholar] [CrossRef]
  3. Hamai, K.E.M.D.; Adamiak, M.; Anderson, S.; Begovic, M.; Benmouyal, G.; Brunello, G.; Burger, J.; Cai, J.Y.; Dickerson, B.; Gharpure, V.; et al. Exploring the IEEE standard C37.118–2005 synchrophasors for power systems. IEEE Trans. Power Deliv. 2008, 23, 1805–1811. [Google Scholar]
  4. De la Ree, J.; Centeno, V.; Thorp, J.S.; Phadke, A.G. Synchronized phasor measurement applications in power systems. IEEE Trans. Smart Grid. 2010, 1, 20–27. [Google Scholar] [CrossRef]
  5. Liu, J.; Tang, J.; Ponci, F.; Monti, A.; Muscas, C.; Pegoraro, P.A. Trade-offs in PMU deployment for state estimation in active distribution grids. IEEE Trans. Smart Grid. 2012, 3, 915–924. [Google Scholar] [CrossRef]
  6. Borghetti, A.; Nucci, C.A.; Paolone, M.; Ciappi, G.; Solari, A. Synchronized phasors monitoring during the islanding maneuver of an active distribution network. IEEE Trans. Smart Grid. 2011, 2, 82–91. [Google Scholar] [CrossRef]
  7. IEC/IEEE 60255-118-1. IEEE/IEC International Standard—Measuring Relays and Protection Equipment—Part 118-1: Synchrophasor for Power Systems—Measurements; IEEE: Piscataway, NJ, USA, 2018. [Google Scholar]
  8. Kamwa, I.; Samantaray, S.R.; Joos, G. Wide frequency range adaptive phasor and frequency PMU algorithms. IEEE Trans. Smart Grid. 2014, 5, 569–579. [Google Scholar] [CrossRef]
  9. Belega, D.; Macii, D.; Petri, D. Fast synchrophasor estimation by means of frequency-domain and time-domain algorithms. IEEE Trans. Instrum. Meas. 2014, 63, 388–401. [Google Scholar] [CrossRef]
  10. De la O Serna, J.A.; Martin, K.E. Improving phasor measurements under power system oscillations. IEEE Trans. Power Syst. 2003, 18, 160–166. [Google Scholar] [CrossRef]
  11. Karimi-Ghartemani, M.; Ooi, B.; Bakhshai, A. Application of enhanced phase-locked loop system to the computation of synchrophasors. IEEE Trans. Power Deliv. 2011, 26, 22–32. [Google Scholar] [CrossRef]
  12. Romano, P.; Paolone, M. Enhanced interpolated-dft for synchrophasor estimation in fpgas: Theory, implementation and validation of a PMU prototype. IEEE Trans. Instrum. Meas. 2014, 63, 2824–2836. [Google Scholar] [CrossRef]
  13. Xia, T.; Liu, Y. Single-phase phase angle measurement in electric power systems. IEEE Trans. Power Syst. 2010, 24, 844–852. [Google Scholar] [CrossRef]
  14. Zeng, B.; Teng, Z.; Cai, Y.; Guo, S.; Qing, B. Harmonic phasor analysis based on improved FFT algorithm. IEEE Trans. Smart Grid. 2011, 2, 51–59. [Google Scholar] [CrossRef]
  15. Macii, D.; Petri, D.; Zorat, A. Accuracy analysis and enhancement of DFT-based synchrophasor estimators in off-nominal conditions. IEEE Trans. Instrum. Meas. 2012, 61, 2653–2664. [Google Scholar] [CrossRef]
  16. Zhan, L.; Liu, Y.; Liu, Y. A clarke transformation-based DFT phasor and frequency algorithm for wide frequency range. IEEE Trans. Smart Grid. 2018, 9, 67–77. [Google Scholar] [CrossRef]
  17. Zhan, L.; Liu, Y.; Culliss, J.; Zhao, J.; Liu, Y. Dynamic single-phase synchronized phase and frequency estimation at the distribution level. IEEE Trans. Smart Grid. 2015, 6, 2013–2022. [Google Scholar] [CrossRef]
  18. Nguyen, C.T.; Srinivasan, K. A new technique for rapid tracking of frequency deviations based on level crossings. IEEE Trans. Power Appar. Syst. 1984, PAS-103, 2230–2236. [Google Scholar] [CrossRef]
  19. Wood, H.C.; Johnson, N.G.; Sachdev, M.S. Kalman filtering applied to power system measurements relaying. IEEE Trans. Power Appar. Syst. 1985, PAS-104, 3565–3573. [Google Scholar] [CrossRef]
  20. Chen, C.I.; Chang, G.W.; Hong, R.C.; Li, H.M. Extended real model of Kalman filter for time-varying harmonics estimation. IEEE Trans. Power Deliv. 2010, 25, 17–26. [Google Scholar] [CrossRef]
  21. Terzija, V.V.; Djuric, M.B.; Kovacevic, B.D. Voltage phasor and local system frequency estimation using Newton type algorithm. IEEE Trans. Power Deliv. 1994, 9, 1368–1374. [Google Scholar] [CrossRef]
  22. Dash, P.K.; Panda, S.K.; Mishra, B.; Swain, D.P. Fast estimation of voltage and current phasors in power networks using an adaptive neural network. IEEE Trans. Power Syst. 1997, 12, 1494–1499. [Google Scholar] [CrossRef]
  23. Kamwa, I.; Grondin, R. Fast adaptive schemes for tracking voltage phasor and local frequency in power transmission and distribution systems. IEEE Trans. Power Deliv. 1992, 7, 789–795. [Google Scholar] [CrossRef]
  24. Sadinezhad, I.; Agelidis, V.G. Real-time power system phasors and harmonics estimation using a new decoupled recursive-least-squares technique for DSP implementation. IEEE Trans. Ind. Electron 2013, 60, 2295–2308. [Google Scholar] [CrossRef]
  25. Vejdan, S.; Sanaye-Pasand, M.; Malik, O.P. Accurate dynamic phasor estimation based on the signal model under off-nominal frequency and oscillations. IEEE Trans. Smart Grid. 2017, 8, 708–719. [Google Scholar] [CrossRef]
  26. Ren, J.; Kezunovic, M. Real-time power system frequency and phasors estimation using recursive wavelet transform. IEEE Trans. Power Deliv. 2011, 26, 1392–1402. [Google Scholar] [CrossRef]
  27. Chauhan, K.; Reddy, M.V.; Sodhi, R. A novel distribution-level phasor estimation algorithm using empirical wavelet transform. IEEE Trans. Ind. Electron 2018, 65, 7984–7995. [Google Scholar] [CrossRef]
  28. Fu, L.; Zhang, J.; Xiong, S.; He, Z.; Mai, R. A modified dynamic synchrophasor estimation algorithm considering frequency deviation. IEEE Trans. Smart Grid. 2017, 8, 640–650. [Google Scholar] [CrossRef]
  29. Mai, R.K.; He, Z.Y.; Fu, L.; Kirby, B.; Bo, Z.Q. A dynamic synchrophasor estimation algorithm for online application. IEEE Trans. Power Deliv. 2010, 25, 570–578. [Google Scholar] [CrossRef]
  30. Banerjee, P.; Srivastava, S.C. A subspace-based dynamic phasor estimator for synchrophasor application. IEEE Trans. Instrum. Meas. 2012, 61, 2436–2445. [Google Scholar] [CrossRef]
  31. Hui, N.; Wang, D.; Li, Y. A novel hybrid filter-based PLL to eliminate effect of input harmonics and DC offset. IEEE Access 2018, 6, 19762–19773. [Google Scholar] [CrossRef]
  32. Freijedo, F.D.; Doval-Gandoy, J.; LÓpez, Ó.; Acha, E. A generic open-loop algorithm for three-phase grid voltage/current synchronization with particular reference to phase, frequency, and amplitude estimation. IEEE Trans. Power Electron 2009, 24, 94–107. [Google Scholar] [CrossRef]
  33. Wang, L.; Jiang, Q.; Long, L.; Zhang, C.; Wei, Y. A novel phase-locked loop based on frequency detector and initial phase angle detector. IEEE Trans. Power Electron 2013, 28, 4538–4549. [Google Scholar] [CrossRef]
  34. Golestan, S.; Freijedo, F.D.; Vidal, A.; Guerrero, J.M.; Doval-Gandoy, J. A quasi-type-1 phase-locked loop structure. IEEE Trans. Power Electron 2014, 29, 6264–6270. [Google Scholar] [CrossRef]
  35. Kanjiya, P.; Khadkikar, V.; Moursi, M.S.E. A novel type-1 frequency-locked loop for fast detection of frequency and phase with improved stability margins. IEEE Trans. Power Electron 2016, 31, 2550–2561. [Google Scholar] [CrossRef]
  36. Li, Y.; Wang, D.; Han, W.; Tan, S.; Guo, X. Performance improvement of quasi-type-1 PLL by using a complex notch filter. IEEE Access 2016, 4, 6272–6282. [Google Scholar] [CrossRef]
Figure 1. (a) Frequency responses of the filters, and (b) a zoomed-in view of frequency responses. (The blue line is for the non-adaptive moving average filter (NMAF), the black line is for the linear interpolation-based moving average filter (LIP-AMAF) and the red line is for the proposed fixed length adaptive moving average filter (FAMAF).).
Energies 12 04168 g001
Figure 2. (a) Filtering results, and (b) a zoomed-in view of filtering results. (The blue line is for the NMAF, the black line is for the LIP-AMAF and the red line is for the FAMAF.).
Energies 12 04168 g002
Figure 3. The basic structure of proposed fixed length adaptive moving average filter-based p class synchrophasor measurement algorithm (FA-PSMA).
Energies 12 04168 g003
Figure 4. The detailed structure of the phase-locked loop (PLL).
Energies 12 04168 g004
Figure 5. The maximum TVE, FE, and RFE under step changes in phase angle and magnitude.
Energies 12 04168 g005
Table 1. The real multiplication and real addition of each part of the FA-PSMA.
ProcessReal MultiplicationReal Addition
Clark’s Transformation64
Park’s Transformation42
FAMAF34
r22
PLL62
LSFM108
Table 2. Response time under step change tests.
ParameterTVE Rsp. (ms)FE Rsp. (ms)RFE Rsp. (ms)
k a = π / 18 145592
k x = 0.1 125290
Std.Req.4090120
Table 3. The maximum measurement errors of FA-PSMA.
CaseMethodsTVE (%)FE (Hz)RFE (Hz/s)PE (degree)ME (pu)
1IEEE Std.15e-30.4N/AN/A
FA-PSMA2e-41e-71e-61e-41e-7
2IEEE Std.15e-30.4N/AN/A
FA-PSMA5e-45e-127e-113e-115e-6
3IEEE Std.10.010.4N/AN/A
FA-PSMA1e-21e-61e-51e-25e-6
4IEEE Std.30.062.3N/AN/A
FA-PSMA0.20.031.50.11e-5
5IEEE Std.30.062.3N/AN/A
FA-PSMA0.21e-41e-54e-42e-3
6IEEE Std.15e-30.4N/AN/A
FA-PSMA6e-42e-64e-51e-45e-6
7IEEE Std.10.010.4N/AN/A
FA-PSMA1e-24e-67e-51e-28e-6
8IEEE Std.30.062.3N/AN/A
FA-PSMA0.180.0261.30.11e-4
9IEEE Std.30.062.3N/AN/A
FA-PSMA0.260.0261.30.11.8e-3
Table 4. Measurement errors of DPMA, CT-DFT, MDSEA, and FA-PSMA under power oscillations.
FrequencyMethodsFE (Hz)RFE (Hz/s)TVE (%)
Case 145 HzDPMA2.0511.3710.02
CT-DFT4.5e-30.571.46
MDSEA8.4e-30.770.73
FA-PSMA7e-30.230.30
47.5 HzDPMA0.471.561.97
CT-DFT3e-30.461.44
MDSEA0.0550.640.78
FA-PSMA4e-30.120.27
50 HzDPMA3e-30.560.70
CT-DFT1.7e-30.391.41
MDSEA3e-30.560.70
FA-PSMA2e-51e-40.26
Case 245 HzDPMA2.2414.4711.12
CT-DFT0.113.401.35
MDSEA0.214.740.66
FA-PSMA0.041.860.29
47.5 HzDPMA0.544.712.29
CT-DFT0.113.311.33
MDSEA0.204.650.72
FA-PSMA0.041.840.27
50 HzDPMA0.204.630.65
CT-DFT0.103.231.30
MDSEA0.204.640.65
FA-PSMA0.041.820.25