Article

Detailed Comparison of the Operational Characteristics of Energy-Conserving HVAC Systems during the Cooling Season

1
Department of Architecture, College of Engineering, Korea University, 145 Anam-Ro, Seongbuk-Gu, Seoul 02841, Korea
2
Department of Living and Built Environment Research, Korea Institute of Civil Engineering and Building Technology, 283 Goyangdae-Ro, Ilsanseo-Gu, Goyang-Si, Gyeonggi-Do 10223, Korea
*
Author to whom correspondence should be addressed.
Energies 2019, 12(21), 4160; https://doi.org/10.3390/en12214160
Submission received: 7 October 2019 / Revised: 25 October 2019 / Accepted: 27 October 2019 / Published: 31 October 2019

Abstract

:
To provide useful information concerning energy-conserving heating, ventilation, and air-conditioning (HVAC) systems, this study used EnergyPlus to analyze in detail their operational characteristics and energy performance. This study also aimed to understand the features of the systems under consideration by investigating the dry-bulb temperature, relative humidity, and airflow rate at major nodes in each system’s schematic. Furthermore, we analyzed the indoor environment created by each HVAC system, as well as examining the cooling energy consumptions and CO2 emissions. The HVAC systems selected for this study are the variable air volume (VAV) commonly used in office buildings (base-case model), constant air volume (CAV), under-floor air distribution (UFAD), and active chilled beam (ACB) with dedicated outdoor air system (DOAS). For the same indoor set-point temperature, the CAV’s supply airflow was the highest, and VAV and UFAD were operated by varying the airflow rate according to the change of the space thermal load. ACB with DOAS was analyzed as being able to perform air conditioning only with the supply airflow constantly fixed at a minimum outdoor air volume. The primary cooling energy was increased by about 23.3% by applying CAV, compared to VAV. When using the UFAD and ACB with DOAS, cooling energy was reduced by 11.3% and 23.1% compared with VAV, respectively.

Graphical Abstract

1. Introduction

1.1. Background and Purpose

Due to global warming, average global temperatures have broken records each year, and abnormal weather phenomena have become more frequent. The Intergovernmental Panel on Climate Change (IPCC) predicts that the average global temperature will rise by 1.4–5.8 °C between 1990 and 2100 [1,2]. In addition, the IPCC has predicted that the frequency and duration of hot and cold periods (heat waves and cold waves) in each region will increase. Also, as temperatures continue to increase due to climate change, heat waves are expected to increase in intensity (e.g., hotter days and nights) and frequency (more frequent heat and cold waves) [3,4,5,6]. The 2015 United Nations Climate Change Conference adopted the Paris Agreement as a response to climate change to conserve energy and reduce greenhouse gases, implementing a plan for a new climate regime post-2020 [7,8,9,10]. In South Korea (henceforth Korea), building energy consumption accounts for 24.8% of the total energy consumption which, when considering current trends for developed countries, has the potential to increase to 40% [11,12]. The key to conserving energy associated with buildings lies in the planning of heating, ventilation, and air-conditioning (HVAC) systems. The energy uses in these systems accounts for a considerable portion approximately 40%–50% of a building’s total energy consumption [13].
An HVAC system is a component that unavoidably consumes energy with the purpose of providing a comfortable human living space. Energy-conserving HVAC systems continue to be studied and installed and can replace conventional HVAC systems to significantly reduce greenhouse gas (GHG) emissions [14,15]. To effectively reduce the energy used in an air-conditioning system, we should understand the characteristics of each system, and analyze each element that consumes energy. In the initial planning stage, an engineer’s experience usually determines the most suitable air conditioning method. However, due to the introduction of various systems, there is a need to develop design alternatives that are based on a more objective evaluation method. Therefore, to obtain useful information for designing and selecting energy-conserving HVAC systems, this study uses the EnergyPlus dynamic simulation program [16] to analyze the operational characteristics and energy performance, and to understand the features of the systems under consideration, by investigating the dry-bulb temperature, relative humidity, and airflow rate of major node points [17] in each system diagram. Furthermore, this study aims to examine the indoor space environment (i.e., zone dry-bulb temperature, relative humidity, and thermal comfort) that is conditioned by each system, as well as the cooling energy consumption, energy conservation contribution, and CO2 emissions of each system.

1.2. Literature Review

The first works that were investigated for the literature review in this study were framework studies that outlined HVAC systems and evaluated their energy consumption.
Pérez-Lombard et al. [13] analyzed the available information concerning building energy consumption, in particular, that related to HVAC systems. They found that office and retail buildings were the most energy-intensive typologies, and typically accounted for over 50% of the total energy consumption for non-domestic buildings. Therefore, they suggest that conservation of the energy consumed by HVAC systems is crucial. Pérez-Lombard et al. [17] also emphasized the complexity and variety of HVAC systems, and presented a consistent framework for energy efficiency analysis. To conduct an energy-efficiency analysis, HVAC systems were analyzed as energy conversion equipment, in which energy carriers are converted into heating and cooling, with a discussion of the HVAC energy consumption process principles. Trčka et al. [18] provided an overview of HVAC system modeling and simulation. They introduced the categorization of tools for HVAC system design and analysis with respect to the problems that require a solution. Furthermore, Trčka et al. [18] summarized the current approaches used for modeling, i.e., (A) HVAC components, (B) HVAC control, and (C) HVAC systems in general. After providing an overview of solution techniques for HVAC system simulation, they made suggestions for the selection of an appropriate HVAC modeling approach that was relative to the simulation objective.
Terrill and Rasmussen [19] presented an in-depth analysis of HVAC systems, and the occupant comfort in two religious facilities. The analysis revealed that the most significant opportunities for energy use reduction occur during the proper maintenance and operation of HVAC equipment and schedules. Temperature setbacks were shown to be an important operational setting that reduced energy use. An accompanying analysis of thermal comfort revealed that temperature setbacks must be coupled with sufficient preconditioning of the space to ensure occupant comfort during intermittent building occupancy. Bellia et al. [20] modeled a modern museum building, and performed simulations to find an HVAC system that was suitable for the Italian climate. Using the dynamic simulation code, and hourly climatic data (TRY), the operating costs of different all-air systems (also with dehumidification by adsorption) were evaluated for exhibition areas and storage spaces, as well as system performance, with respect to controlling the thermal-hygrometric ambient parameters.
Secondly, several previous studies have performed EnergyPlus simulations, which can properly model HVAC operating behavior. Crawley et al. [21,22] have introduced EnergyPlus, a new building energy simulation tool that combines two existing programs, the United States DOE-2 and BLAST. They have also explained that it is possible for EnergyPlus to perform an organic analysis of the thermal behavior that occurs between systems and buildings while properly modeling the organic connections between system components. Therefore, EnergyPlus can perform realistic modeling of HVAC systems by taking interactions between buildings and system into account.
Third, previous studies have also compared the characteristics and energy performance of various HVAC systems. Gustafsson et al. [23] performed dynamic simulations to compare the energy performance of four innovative HVAC systems: (A) mechanical ventilation with heat recovery (MVHR) and a micro heat pump, (B) exhaust ventilation with an exhaust air-to-water heat pump and ventilation radiators, (C) exhaust ventilation with an air-to-water heat pump and ventilation radiators, and (D) exhaust ventilation with an air-to-water heat pump and panel radiators. All systems were tested using a model of a renovated single family house that varied the U-values, climate, and infiltration and ventilation rates. Korolija et al. [24] examined the relationship between the heating and cooling loads of buildings, and the subsequent energy consumption with different HVAC systems. Two common HVAC systems in use throughout UK office buildings, the variable air volume (VAV) system and the fan coil (FC) with a dedicated outdoor air system, were coupled with a typical office building with and without daylight control for both a cellular and open plan. For the two investigated systems, the difference between system demand and building demand varied from over −40% to almost +30% for cooling and from −20% to +15% for heating. Storle et al. [25] compared the cooling and dehumidifying capacities of two-liquid desiccant membrane air-conditioning (M-LDAC) systems installed in an office building in a hot-humid climate (Miami, Florida). The building HVAC system consisted of a radiant cooling system to cover the sensible load and either a 2- or 3-fluid M-LDAC system to meet the latent load. The systems were simulated during the warmest week of the year using the TRNSYS simulation software.
Kim et al. [26] analyzed the energy saving potential of passive chilled beams in various climatic zones. A passive chilled beam model, developed based on full-scale experiments, was used as a system module in an entire building simulation tool to account for the convective and radiative effects from the passive chilled beams. The model was validated with measurements from a field study in an open-plan office equipped with multiple passive chilled beams. Furthermore, in an adjacent identical office space equipped with an air (VAV) system, a parallel field study was conducted to compare the resulting energy consumption between the two systems.
Yu et al. [27] investigated both the VAV and variable refrigerant flow (VRF) systems in five typical office buildings in China, to compare their cooling energy use. Site surveys and field measurements were performed to collect building characteristics and operational data. Measurements of electricity used for cooling were collected based on sub-metering in the five buildings. Ho et al. [28] compared the thermal environment of two air distribution systems in an office setting. Airflow, as well as heat and mass (i.e., water vapor and contaminant gas) transfer at a steady-state condition, were modeled for underfloor air distribution (UFAD) and overhead air distribution (OHAD) systems. The results provided a detailed understanding of air transport and its consequence on thermal comfort and indoor air quality that are beneficial to office building air conditioner design.
Based on these previous studies, we identified the necessity for a realistic simulation of energy-conserving HVAC systems in the Korean climate and performed a detailed analysis of dry-bulb temperature, relative humidity, and airflow rate at node points in HVAC system schematics. Although many studies have been conducted in the United States, Europe, and other parts of the world, studies that reflect the Korean climate and characteristics of Korean buildings are insufficient. Although findings of previous studies in other climate regions of the world can be indirectly applied to the situation in Korea, direct applicability of foreign studies is limited. In addition, although previous studies have been carried out for each system, studies comparing all four systems (constant air volume (CAV), VAV, UFAD, and active chilled beam with dedicated outdoor air system (DOAS)) are rare. Furthermore, it is difficult to find studies analyzing data of primary consumption and CO2 emissions, indoor environment (thermal comfort, zone dry-bulb temperature, zone humidity), and HVAC systems in detail by using a dynamic analysis program. Due to these reasons, we carried out this study.

2. Methods and Theoretical Framework

2.1. Methods and Overall Procedures of the Study

This study aims to evaluate the cooling operation characteristics and energy performance for understanding the characteristics of the HVAC systems, and for properly selecting an energy-conserving HVAC system. Figure 1 summarizes the methods and procedures used to achieve the goals of this study.
First, the dynamic simulation tool EnergyPlus v9.1.0 [16] was used to analyze the characteristics and detailed operating modes of each air-conditioning method, and examine their energy performance. Second, the input class lists of the models were reviewed to examine differences in the models, which reflect each system’s characteristics in the EnergyPlus simulations. Third, the loop, supply side, demand side, and node modeling concepts in EnergyPlus were used to analyze the major nodes (i.e., the dry-bulb temperatures, relative humidity, and airflow rates), and to understand the characteristics of each system in detail. Fourth, the indoor environments (i.e., the zone dry-bulb temperature, relative humidity, and thermal comfort) conditioned by each system were examined; and finally, we performed calculations of the cooling energy consumption (site and primary energy), energy conservation contribution, and CO2 emissions.

2.2. EnergyPlus: An Introduction and Modeling Concepts (Loop and Node)

EnergyPlus is a simulation program that combines the advantages of the DOE-2 and BLAST models, and is used in the US as an authorized simulation program to design new buildings and estimate energy performance [16]. EnergyPlus consists of three basic modules (i.e., the Heat and Mass Balance Simulation Module, Building System Simulation Module, and Simulation Manager Module), and is based on an integrated simulation analysis technique. EnergyPlus is advantageous, because it performs an organic analysis of the thermal behavior that occurs between a system and building, and can properly model the organic connections between system components. Therefore, EnergyPlus is a suitable program for modeling the energy-conserving HVAC systems analyzed in this study. Pérez-Lombard et al. [17] used the energy flow chain concept to understand energy flows, illustrated in Figure 2, which assumes that the HVAC system contains energy-converting equipment that moves useful energy to the space being air-conditioned.
In other words, the energy analysis method assumes that energy-converting equipment moves energy until the moment that cooling or heating is transferred to the indoor space of the building, which is expressed as a chain. HVAC system can be modeled in EnergyPlus as the movement of a heating medium, similar to an energy flow chain. The main point to modeling in EnergyPlus is the loop concept, which refers to the repeated circulation of the heating medium within the loop structure. Air loops are those in which the heating medium repeatedly circulates between a zone’s terminal unit and the air handling unit (AHU). In plant cooling loops (chilled water), the heating medium repeatedly circulates between the chiller and the AHU cooling coil, whereas in plant heating loops (hot water), it circulates between the boiler and the AHU heating coil. In condenser loops, the heating medium repeatedly circulates between the cooling towers and the heat source system.
Figure 3 shows that nodes are the connection points between elements (i.e., the AHU, fans, chillers, boilers, and cooling towers) in the HVAC network which consists of loops [16]. These are the points at which the supply and demand sides are connected in the air, plant, and condenser loops. EnergyPlus can generate and store status data such as the temperature, relative humidity, and airflow rate for the node locations specified in the simulation. Such data can help us understand the characteristics of the energy-conserving HVAC systems used in this study (Figure 9a–d in Section 4).

2.3. Site Energy, Primary Energy Consumption, and CO2 Emissions

Figure 4 shows that the “building energy” concept can be divided into energy demand (Figure 4A) and site energy consumption (Figure 4B).
The energy demand (Figure 4A) is the amount of energy required by a building based only on its architectural conditions, such as the building envelope, and does not include its HVAC systems. In other words, the energy demand component is the energy performance of the building itself. On the other hand, site energy consumption (Figure 4B) is calculated by adding the energy demand (Figure 4A) to the energy loss caused by facility systems. Therefore, to reduce site energy consumption (Figure 4B), we should increase the efficiency to reduce energy loss within the high-performance passive and HVAC systems.
The primary energy consumption and CO2 emissions can be calculated by multiplying the site energy consumption (Figure 4B) by the primary energy and CO2 emissions factors, respectively [29]. The term “primary energy consumption” is defined as the primary energy from fossil fuels that a country must provide to meet a building’s energy demand. The primary energy is determined by multiplying the site energy by the primary energy factor, which includes energy losses due to electricity production and fuel transportation [30,31,32]. The Building Energy Efficiency Certification System (BEECS) [29] in Korea uses different primary energy conversion factors that depend on the energy supply sector, as listed in Table 1 [29]. Therefore, in this study, we calculated the primary energy by multiplying the electric power (2.75) and fuel (e.g., coal, gas, and oil) conversion factors (1.1) with the final energy consumption.
Table 2 lists the Korean CO2 emission factor for each energy supply sector. CO2 emissions, the most important contributor to global warming, can be calculated by multiplying the site energy consumption by the CO2 emissions factor of each energy supply sector. Therefore, this study calculated the CO2 emissions and reduction rates by multiplying the site energy consumption by the electric power CO2 and natural gas (LNG) CO2 emission factors reported by the Korea Energy Agency (KEA) [33] and the IPCC guidelines [34].

3. Simulation Condition for Heating, Ventilation, and Air-Conditioning (HVAC) Analysis

3.1. EnergyPlus Simulation Model and Input Conditions

To improve the reliability of the simulation, a reference building representing the office buildings in Korea is necessary. The United States Department of Energy (DOE) and the European Union’s Energy Performance of Buildings Directive (EPBD) use the reference building concept for simulations. In other words, each country’s standards, climate conditions, standards for the thermal performance of each building part, and the efficiency of building facility elements are presented in a standard model, such that the user can flexibly apply them.
The DOE developed a prototype building and the DOE’s National Renewable Energy Laboratory reports [35] that these models serve as a baseline for comparing and improving the accuracy of energy simulation software. Therefore, this study used the American Society of Heating, Refrigerating and Air-Conditioning Engineers (ASHRAE) 90.1 prototype building model (medium office) [36] as the base model because it contributes to simulation accuracy and convenience. This model reflects current Korean building standards, codes, and the Incheon (Seoul metropolitan area) climate [37,38]. Figure 5 shows the base simulation model.
Table 3 lists the EnergyPlus simulation base model’s building envelope performance conditions, an outline of the air-conditioning and plant system, and detailed input conditions.
For the building envelope conditions, which include the base model’s walls, roof, floor, and windows/doors, this study used the energy-saving design standards [39], which specify the Korean region’s legal standards. For the equipment, lighting load, and occupancy density, we used a report from a survey of existing buildings in Korea conducted by the Ministry of Trade, Industry, and Energy (MOTIE) and the Korea Institute of Civil Engineering and Building Technology (KICT) [40]. For the base air-conditioning system, we used a VAV system, which is commonly used in Korea, and adopted an absorption chiller (cooling coefficient of performance (COP) = 1.0) as the plant system [41]. The region selected for the simulation was the Incheon (Seoul metropolitan area) region in central Korea.

3.2. Validation of the Model

As a final step in the development of the simulation model to be used in the study, a validation process was briefly carried out to ensure that the model could properly predict the thermal load and energy performance. Data by Kim et al. [17] were used for the validation process in this study since their study provides both conditions and results. Similar conditions of internal heat gain, diffuser conditions, and properties of the raised access floor were used in both Kim’s study and this study. Kim et al. [17] and our group have simulated that the primary energy consumption (CAV system model) of Incheon is 464.1 kWh/m2, which corresponds to level 5 in the BEECS [29]. The KEA and Korea Appraisal Board (KAB) [42] database indicates that the average actual primary energy consumptions of general office buildings in Incheon and Jeju is 457–489 kWh/m2a. Thus, in this study, the simulation results (CAV system model) confirmed that the base model’s primary energy consumption (464.1 kWh/m2a) met the 457–489 kWh/m2a range requirement of the KEA and KAB database for primary energy consumption of general office buildings. Primary energy consumption for each system (VAV, UFAD, and active chilled beam) is also the same.

3.3. Climate Analysis of Incheon, Korea

To reflect the effects of global warming on Korea over the past five years, we applied EnergyPlus with the outdoor temperature, humidity, wind velocity, atmospheric pressure, solar radiation, cloud cover, and precipitation data provided by the KMA [37]. We converted the KMA data into an EnergyPlus weather file (EPW) format data [38] for use in the EnergyPlus model. Figure 6 and Table 4 show Incheon’s ASHRAE [43] and Köppen [44] climate zone and location information, as well as the average heating degree days (HDD), cooling degree days (CDD), dry-bulb temperature, and relative humidity [37] over the last five years (2014–2018).
Incheon’s average HDD (18 °C) and CDD (10 °C) over the last five years are 2749 and 2327, respectively. In the ASHRAE climate classifications, Incheon is classified as a 4A (Mixed–Moist) climate zone. Based on the Köppen climate zones, Incheon is classified as Dwa (subarctic climate, cold and dry winter, and hot summer). Its maximum average monthly temperature is 27.7 °C, with an average maximum monthly humidity of 88.1%, which indicates that Incheon has hot and humid summers. The average minimum monthly temperature is −2.4°C, with an average minimum monthly humidity of 46.1%, which indicates that Incheon’s winters are cold and arid.
Due to global warming, global temperatures are steadily increasing. Extreme weather events, such as heat waves, occur frequently throughout the world, and Korea is no exception [8,9,37,45]. Therefore, as a preliminary task, we should accurately analyze average yearly temperature changes during the Korean summer. The average temperatures in the summer for Incheon were analyzed using the Korea Meteorological Administration (KMA) weather data [37] from the 1970 until 2018. Figure 7 shows Incheon’s average temperatures during the summer season (June–August) from 1970 until 2018.
The average summer temperature increased from 23.0 °C between 1970 and 1999 to 23.4 °C between 1980 and 2009, and to 23.7 °C between 1988 and 2018. The average summer temperature also steadily increased to 24.3 °C during the last 10 years (2009–2018) and 24.7 °C in the last 5 years (2014–2018). These characteristics give rise to circumstances during which it is necessary to use energy-conserving HVAC systems in Korea.

3.4. Selection of HVAC System and Simulation Input Conditions

In this study, we selected the energy-conserving HVAC systems based on the results of Kim et al. [15] and Li et al. [46] that investigated trends in building technology through an analysis of current high-performance buildings throughout the world. The VAV system was selected as the base system, which is commonly used in office buildings. The CAV, UFAD, and active chilled beam with DOAS, which have different characteristics and are quite recent technologies, were selected as the conventional HVAC and energy-conserving HVAC systems. Figure 8 shows a schematic layout and the mechanisms of the four HVAC systems.
The VAV system (Figure 8A) changes the airflow based on increases and decreases in the load to control the indoor temperature [47,48]. In other words, the VAV compares the indoor temperature and set-point temperature while controlling the amount of air according to changes in the indoor load. In the VAV system, VAV terminal boxes are installed in each zone, where the amount of airflow is controlled according to a thermal load that matches the set-point temperature.
The CAV system (Figure 8B) is the most basic system of the four air conditioning systems. The CAV system was analyzed for purposes of comparison with the energy-conserving system and the conventional VAV system. The CAV always supplies a fixed amount of air to the indoors and adjusts the temperature via heat exchange in the coils within the air conditioner [49,50]. The UFAD system (Figure 8C) is an air-conditioning method that cools by focusing on the occupied zone, which is the space between the floor surface and a height of approximately 2 m [51,52]. Typical air-conditioning systems, such as the CAV and VAV, are overhead air distribution (OHAD) systems, where the air produced by the AHU is supplied to a room via ceiling ducts and also has exhaust ports located in the ceiling. However, the UFAD system uses the space of an access floor rather than the ceiling as a space to diffuse conditioned air, which is supplied to the room via floor diffusers. The active chilled beam with DOAS (Figure 8D) was proposed in response to problems with existing forced-air conditioning systems, such as large amounts of conditioned airflow, conveyance power, comfort, and hygiene. In this system, the DOAS introduces the minimum airflow required for ventilation, where interior air is used to heat and cool, which is induced through an active chilled beam. When an active chilled beam is combined with the DOAS, the DOAS handles the latent heat load [53,54]. Table 5 lists the simulation input conditions of HVAC systems selected in this study.
Recently constructed office buildings in advanced nations use the UFAD, in which unoccupied zones are not air conditioned and only occupied zones are air conditioned using the access floor [55]. The cooling supply temperature was set with reference to several previous studies, which analyzed the conservational effects of the UFAD system in the Korean climate [56,57,58]. Pressurized diffusers (interior zone: swirl type; perimeter zone: linear bar grille type) were selected as the diffusers, after which we performed the simulations. The active chilled beam system with a DOAS cools and dehumidifies outdoor air. In Korea, there are no clear regulations regarding the operation of active chilled beam systems. Therefore, the heating and cooling water inlet temperature and temperature difference were set with reference to previous studies that verified the conservational effects of active chilled beam systems in a Korean climate [59,60,61], as well as Federation of European Heating, Ventilation and Air-conditioning Associations’ (REHVA) standards [62]. For the active chilled beam with DOAS, we installed the most basic form of a bidirectional diffusion chilled beam. The outdoor air cooled and dehumidified by the DOAS was used as the primary air for the chilled beam [62]. Table S1a–c in the Supplementary Material provide comparison of four HVAC system modeling in the EnergyPlus class list. Table S2a–d in the Supplementary Material provide diagram of four HVAC system layout in the EnergyPlus simulation.

4. EnergyPlus Simulation Results

4.1. System Schematic Diagram of Node Temperature, Humidity, and Airflow Comparison

In Figure 9a–d, the zone’s indoor temperature was set to 26 °C (cooling operation) and we compared in detail the dry-bulb temperature, relative humidity, and airflow rate at the major node points of the system schematics for each HVAC system (8.1 at 2:00 PM). The analysis date was selected as August 1 because it is representative of the general characteristics of summer in Incheon. Due to both the temperature and the humidity being high at 14:00 on August 1, it was selected as the analysis time (32.3 °C, 70.5%). Figure 9a shows the cooling operation in the VAV.
State 1 (Environment: Site Outdoor Air) is the point where outdoor air was introduced, and depicts the status of the outdoor air temperature, humidity, and airflow. Air at a temperature of 32.3 °C and relative humidity of 70.5% was introduced at 1.587kg/s airflow. Here, to calculate the minimum airflow for the standard floor’s ventilation, we used the office building minimum ventilation standard (29 m3/person·h or more) from the Ministry of Land, Infrastructure and Transport (MOLIT) Building Act [63]. The minimum outdoor air inflow amount was calculated as 1.587 kg/s (1600 m2 × 29m3/ person·h × 0.1 person/m2 = 4640 CMH = 1.587 kg/s). State 2 (Air Loop AHU Mixed Air Outlet) was the point where the return air from State 7 (Air Loop AHU Extract Fan Air Outlet) mixed with outdoor air at State 1.
The air of State 2 had a temperature of 28.6 °C, and relative humidity of 59.4%. In the VAV, the airflow changed based on the indoor load and, therefore, the air was supplied at a rate of 3.081kg/s. State 3 (Air Loop Cooling Coil Outlet) was the point at which air passed the cooling coil in the AHU. Here, the air temperature was cooled to 13.7 °C by the cold water in the chiller, with an airflow of 3.081 kg/s, which was identical to the airflow at State 2. State 4 (Air Loop Supply Side Outlet) was the point where the air passed the supply fan, and was discharged. This was the stage before air was supplied to the zone, which had an AHU air discharge temperature of 13.9 °C which is identical to the AHU discharge air temperature set-point. The dehumidified air passed at a relative humidity of 56.1%, and the airflow was 3.081 kg/s. State 5 was air conditioned in the zone, with a conditioned air temperature set to the indoor temperature of 26 °C. At this time, the humidity was 47.7–53.8%. VAV adjusted the airflow and conditions the air to the set-point temperature of 26 °C. The total supplied airflow in the zones was maintained at 3.081 kg/s, which was identical to States 2, 3, and 4. State 6 (Air Loop AHU Extract Fan Air Inlet) was the air that was exhausted outside of the zone, just before the exhaust fan. Air was exhausted at a temperature of 26.0 °C, relative humidity of 52.5%, and airflow rate of 3.081 kg/s.
State 7 (Air Loop AHU Extract Fan Air Outlet) was the state of the air that had passed through the exhaust fan. Due to heat generation associated with the fan, its temperature slightly increased to 26.2 °C, with a relative humidity of 53.5% and airflow of 3.081 kg/s, identical to States 2–6. Finally, State 8 (Air Loop AHU Relief Air Outlet) was the state of the air that was exhausted to the exterior.
The exhausted airflow rate had a rate of 1.587 kg/s, which was identical to the airflow rate at which air was taken in from the exterior at State 1. The temperature was 26.2 °C and humidity was 53.5%, which was identical to State 7. State 9 (CHW Loop: Plant Supply Side Inlet-Outlet) showed the supply and return water temperatures of the chilled water supplied by the absorption chiller to the cooling coil, whose temperatures were 6 °C and 9.8 °C, respectively. Finally, State 10 (Condenser Loop: Plant Supply Side Inlet-Outlet) showed the supply and return water temperatures of the condenser water supplied by the cooling tower to the absorption chiller, whose temperatures were 29 °C and 32.3 °C, respectively.
Figure 9b shows the CAV during cooling operations. State 1 was the outside air conditions. At State 2, the return air temperature was 2.1 °C lower than the VAV system and, therefore, even though the outdoor air had an identical state with the air that was mixed in, the exterior had a temperature of 26.8 °C, which was 1.8 °C lower than in the VAV. The humidity was 61.7%, which was 2.3% higher than in the VAV. In the CAV, the airflow rate maintained a maximum airflow and, therefore, the air was supplied at a rate of 5.072 kg/s, that is, more than the VAV.
State 3, which passes the cooling coil, had a temperature of 13.5 °C and an airflow of 5.072 kg/s. State 4, which passes the supply fan, had a temperature of 14 °C, humidity of 57.8%, and an identical airflow of 5.072 kg/s. Since the indoor discharge temperature was set to 14 °C, similar to the VAV in EnergyPlus, the temperature was maintained at approximately 14 °C and the humidity was dehumidified to 57.8%. State 5 (Zone) shows the condition of the air-conditioned zone. The temperature was conditioned to 23.4–24.5 °C, which was 1.5–2.6 °C below the set indoor temperature of 26 °C. At this time, the humidity was 51.2%–55.4%. Unlike the VAV adjusting the airflow and conditioning the air to the set-point temperature of 26 °C, the CAV conditions the air to a temperature that is lower than the indoor set-point indoor temperature. The air that had an identical condition to the indoor conditioned air was released as exhaust, and passed the return fan, which slightly increased the temperature to 24.1 °C. Since the conditioned indoor air was lower than in the VAV, State 7 was 2.1 °C lower. The airflow at State 8 was exhausted at an identical rate as the minimum outdoor air inflow of 1.587 kg/s, as well as the fact that both the temperature and humidity were identical to State 7.
Figure 9c shows the UFAD system during cooling operations. As State 1’s outdoor air passed State 2’s mixing box, the air changed to a temperature of 29.3 °C, humidity of 58.5%, and airflow of 2.752 kg/s. Since the temperature of State 7’s return air was high, State 2’s temperature was higher than in both the VAV and CAV.
This is because air that had a higher temperature than the set indoor temperature was exhausted to the ceiling plenum due to thermal stratification, which is a typical characteristic of the UFAD. In the UFAD, it is possible to perform air conditioning at higher temperatures than typical air-conditioning systems, which supply air from the ceiling [56,57,58]. Therefore, the AHU discharge air temperature was set to 15 °C, which was higher than both the VAV and CAV. The floor diffuser’s discharge temperature was 17.2 °C, which was approximately 3 °C higher than both the VAV and CAV. This affected reductions in chiller energy, which is discussed in Chapter 5. Since airflow was only conditioned in the occupied zone, airflow was supplied at a rate of 2.752 kg/s, which is 0.329 kg/s lower than the VAV and 2.320 kg/s lower than the CAV. State 5, which was indoor air, was maintained at 26 °C via a lower airflow rate than that used in both the VAV and CAV, with the humidity regulated at a comfortable range of 40%–60%. Through the implementation of thermal stratification via the “room air model” in EnergyPlus, the temperature in the unoccupied zone increased, and the air at State 6 was exhausted at 28.1 °C. Based on this, the temperature of the ventilation/exhaust after passing through the occupied zone was higher in the UFAD than in both the VAV and CAV. If the set cooling temperature was 26 °C, a typical air-conditioning system, which supplies air from the ceiling, must maintain the entire indoor space at 26 °C but the UFAD only maintains the occupied zone at 26 °C, whereas the unoccupied zone can be maintained at above 26 °C. Thus, the UFAD system was able to conserve cooling energy. The air that was exhausted at State 7 passed the return fan, and was divided into a mixing box and relief air at 28.3 °C and 49.6% humidity. At State 8, the air was exhausted at an identical rate to the minimum exterior air inflow (1.587 kg/s).
Figure 9d shows the active chilled beam with DOAS during cooling operations. Normally, an active chilled beam is combined with a DOAS, which cools and dehumidifies outdoor air. The indoor sensible heat load was removed using the chilled beam and the latent heat load was handled by the DOAS. In other words, a conventional air-conditioning system moves a mixture of outdoor air (OA) and return air (RA) through an AHU to perform air conditioning. An active chilled beam with DOAS separates the OA from the air ventilated in the RA, and handles them independently.
Since only OA is introduced and conditioned via the DOAS, State 1 introduced a minimum rate of OA at 1.587 kg/s. At State 2, the air passed through the DOAS heat exchanger, where heat exchange changed the temperature and humidity to 28.5 °C and 57.3%, respectively. The airflow was identical at 1.587 kg/s, which is the minimum OA inflow. The air that passed through State 3’s cooling coil was discharged at 14 °C and 50.6% humidity at State 4. In the zone (State 5), air conditioning occurred at a temperature of 26 °C and relative humidity of 49.6%–51.8%.
Since indoor air was induced in the chilled beam system, the indoor zone can only be conditioned at a lower airflow than in the VAV, CAV, and UFAD, that is, with a minimum OA inflow of 1.587 kg/s. This air was released through the exhaust diffuser and passed the exhaust fan while the air at State 7 (26.1 °C, 51.5%, and 1.587 kg/s) exchanged heat in the heat exchanger. At State 8, unlike the VAV, CAV, and UFAD, the heat exchanged air that was at 29.7 °C and 68.9% was released as exhaust to the outdoor. In addition, the chilled beam increased the cooling effect by moving the primary air, which experienced heat exchange in the DOAS, through the chilled water coil installed in the beam [62]. Since water, which has a higher heat capacity than air, was used to perform heat exchange with indoor air through the water pipe within the chilled beam, it can reduce the conveyance energy produced by the heating medium. State 9–2 was the supply and return water temperatures of the secondary side cold water that supplied the chilled beam through the water pipe, whose temperatures were 15.5 °C and 17.5 °C, respectively. The supply and return water temperatures (State 10) of the condenser water supplied from the cooling tower to the absorption chiller were 29 °C and 30.8 °C, respectively.

4.2. Analysis of the Indoor Temperature and Humidity

Figure 10 shows the outdoor temperature and humidity from 1 to 4 August in Incheon, which was used as a typical cooling period. It is evident that the climate of the cooling season in Incheon, Korea has both high temperatures and humidity. During these four days, the minimum and maximum outdoor temperatures were 24.7 °C and 33.6 °C, respectively, with an average temperature of 28.3 °C. The minimum and maximum relative humidity were 59% and 86%, respectively, with an average relative humidity of 79.9%.
Figure 11 shows the indoor temperature distributions from August 1 to 4 when using the four HVAC systems. The AHU was set to operate from 7 AM to 6 PM, during which the CAV conditioned the air to approximately 2–3 °C lower than the cooling set-point temperature of 26 °C. It is considered that the CAV conditioned the air to this lower temperature than in the other systems because it had the highest airflow supply, as mentioned in Chapter 4.1. The VAV conditioned the air to 23.5–24 °C from 7 AM to 9 AM and then to 26 °C until 6 PM. Unlike the CAV, the VAV changed the airflow based on the interior load as it conditioned the air, which yielded a lower airflow than the CAV. The VAV maintained a set indoor temperature of 26 °C. The UFAD conditioned the air to 24.5–25.5 °C from 7 AM to 9 AM, and then to 26 °C until 6 PM. Since the UFAD basically adopts the VAV to control the airflow, it adjusts the airflow based on the indoor load, and conditions the air at a lower airflow than the CAV system. In addition, since the UFAD only conditions the occupied zone, it conditions the air at a lower airflow than even the VAV. During initial cooling operations, the temperature in the UFAD was higher than in the VAV. Among the three systems, the active chilled beam conditioned the air closest to 26 °C, even during initial operations, with few periods during which the air was conditioned to lower than the cooling set-point temperature, indicating that the indoor set-point temperature was met with the least temperature loss and airflow.
Figure 12 shows the indoor relative humidity distribution from 1 to 4 August when using the four HVAC systems. All four systems satisfied the Korean HVAC thermal comfort standard of 40–70% [64] and ASHRAE’s thermal comfort standard of 30%–60% [65]. During the air-conditioning analysis period, the average relative humidity of the conditioned interior air was 50.9, 54.7, 49.9, and 53.4% for the VAV, CAV, UFAD, and active chilled beam with DOAS, respectively. Each HVAC system had dehumidifying functions within its respective AHU. The active chilled beam with DOAS system maintained a comfortable indoor environment even in Incheon’s high-humidity climate because it processed latent heat and dehumidified it through the heat exchangers.

4.3. Analysis of Airflow Supply

Figure 13a shows the indoor airflow supply (sum of 5 zones) from 1 to 4 August during the operation of the four HVAC systems. Figure 13b shows the airflow divided into the five zones when each system was used during the day on 1 August.
In Figure 13a, the VAV is a method that maintains a constant discharge temperature and controls the airflow according to increases and decrease in the load, which results in airflow variations over time. The airflow changed from a minimum of 1.311 kg/s to a maximum of 3.480 kg/s, exhibiting an increasing airflow pattern after sunrise. In Figure 13b, by analyzing the 5 zones over the course of the day, we observed that the interior and south perimeter zones experienced a high airflow rate, while the north zone experienced a low airflow rate. On the east perimeter zone, where the sun rises in the morning, the airflow increased in the morning based on changes in the solar radiation. In the west perimeter zone, where the sun sets, the airflow increased in the afternoon. On the other hand, the CAV constantly supplied air at a maximum airflow of 5.072 kg/s from 7 AM to 6 PM, without accounting for the space thermal load. The supply airflow during CAV operation was divided into five zones, which indicates that the airflow supply was 1.279, 1.198, 1.070, 0.870, and 0.656 kg/s in the interior, south, east, west, and north perimeter zones, respectively. In the interior and south perimeter zones, the airflow was high, while the north zone had the lowest airflow. The UFAD system also controls the airflow to maintain temperature and, therefore, exhibited the same pattern of changes in the airflow as the VAV. However, since the UFAD only conditions the occupied zone below a height of 2 m from the floor, it conditioned the air with less airflow than the VAV. The airflow changed from a minimum of 1.114 kg/s to a maximum of 2.987 kg/s, resulting in a trend of air conditioning that had the same airflow pattern as the VAV in each of the 5 zones. The active chilled beam with DOAS operates at a constant airflow, and uses indoor induced air, such that by controlling the flow in the beam’s cold water coil, it meets the thermal load. Therefore, the active chilled beam was able to provide conditioned air and maintain the indoor set-point temperature and humidity, despite only conditioning the air with the minimum outside air inflow (1.587 kg/s), using the DOAS. The minimum outside air inflow was 0.460, 0.382, 0.312, 0.259, and 0.174 kg/s in the interior, south, east, west, and north zones, respectively.

4.4. Analysis of Indoor Thermal Comfort

Figure 14 shows the distribution of the predicted mean vote (PMV), which is the thermal comfort index for the cooling period between August 1 and 4 when using the four HVAC systems.
The PMV comfort range is between −0.5 and 0.5, based on ISO Standard 7730 [65,66,67,68]. The PMV during CAV air conditioning from 7 AM to 6 PM had a distribution between −1.27 and −0.90 on August 1, −1.13 and −0.79 on August 2, −1.21 and −0.84 on 3 August, and −1.28 and −0.90 on August 4. Since the CAV conditions the air with the highest airflow of all the systems used in this study, as well as yielding a temperature that was 2–3 °C below the set-point temperature of 26 °C due to the overcooling of the space, the PMV was slightly lower than the other systems and was not within the comfort range between −0.5 and 0.5. During VAV air conditioning, the PMV was within the thermal comfort range between −0.5 and 0.5. The PMV values for the VAV had a distribution between −0.41 and 0.03 on August 1, −0.18 and 0.17 on August 2, −0.39 and 0.17 on August 3, and −0.41 and 0.03 on August 4. These values were higher and lower than the PMV distribution of the CAV and UFAD, respectively. During UFAD air conditioning, the PMV had a distribution between −0.36 and 0.28 on August 1, −0.06 and 0.42 on August 2, −0.28 and 0.42 on August 3, and −0.27 and 0.28 on August 4, which was within the comfort range. Finally, during air conditioning with the active chilled beam with DOAS, the PMV had a distribution between −0.16 and 0.34 on August 1, 0.01 and 0.51 on August 2, −0.24 and 0.51 on August 3, and −0.17 and 0.39 on August 4. Among the four HVAC systems, these PMV values for the active chilled beam were a little high, but were within the comfort range.

5. Analysis of Cooling Energy Consumption and CO2 Emissions

5.1. Cumulative Zone Sensible Cooling

Figure 15 shows the cumulative amount of heat that was removed by each system to cool the indoor to an identical set-point temperature (26 °C) during June, July, and August.
When using the VAV, changes in the airflow, based on increases and decreases in the load, controlled the room temperature, which only removed 29,646 kWh. When using the CAV, the amount of heat removed from the five zones was 37,030 kWh of the heat, i.e., a 24.9% increase. When using the UFAD, the cooling load was reduced because only the occupied zone was maintained at 26 °C while maintaining the unoccupied zone at a higher temperature. In other words, since only the occupied zone was air-conditioned, air conditioning was performed at a lower airflow rate than in the VAV, which reduced the amount of heat removed (27,082 kWh) by 8.7% compared to the VAV. When using the active chilled beam with DOAS, air conditioning was performed using indoor induced air at the DOAS minimum outdoor air inflow, which reduced the amount of heat removed (24,502 kWh) by 17.3%, compared to the VAV. Even though they were set to the same temperature, the amount of indoor heat removed by each system was different, because the systems had different airflow and temperature control methods based on their own characteristics.

5.2. Site and Primary Cooling Energy Consumptions

Figure 16 shows the site and primary cooling energy for each system in June, July, and August. The cooling energy consists of the absorption chiller energy, cooling tower energy, AHU supply and exhaust fan energy, and pump energy (absorption chiller and cooling tower) consumptions.
The energy required for the absorption chiller accounts for most of the site energy, followed sequentially by the fan energy, cooling tower energy, and pump energy. When using the CAV, site cooling energy consumption was increased by 27.6%, compared to the VAV. When using the UFAD, cooling energy was reduced by 10.6%, compared to the VAV, with a 15.4% reduction in the absorption chiller energy, and a 24.4% reduction in fan energy. Since the UFAD supplies air from the floor (task and ambient HVAC), only the occupied zone was air-conditioned, without consideration of the ceiling height. Therefore, the discharge temperature was approximately 3 °C higher than in the VAV. This resulted in a reduction of chiller use and conservation of fan power. However, in buildings that use the UFAD, systems should be designed by taking into account the fact that the energy conservation effect can vary according to the type and installation conditions of the lighting fixtures. When using the active chilled beam with DOAS, cooling energy was reduced by approximately 22.3% compared with the VAV, with 26.6% and 66.7% reductions in the absorption chiller and fan energies, respectively. The active chilled beam with DOAS decouples sensible cooling and ventilation, while cool air conditioning occurred with only the minimum outdoor inflow required for ventilation, which reduced the fan energy. The load that must be handled by the cooling coil was also reduced due to the low airflow rate. Additionally, the cooling energy saving rate was high compared with the other HVAC systems, via the effects of radiation and convection that induced air mixing in the zone. Water, which has a greater heat capacity than air, was also used via the water pipes within the chilled beam to exchange heat with the indoor air. Therefore, the conveyance power could be conserved, due to the heating medium. However, with exposure to the high-temperature and high-humidity climate of Korea, we should consider a control strategy that responds to the latent heat load and condensation, which is necessary in order to carefully review performance in the design and operation stages.
To the right of the site cooling energy in Figure 16, we compare the primary cooling energy. The primary energy is calculated by multiplying by a conversion factor (Table 1) [29] for each nation according to its external energy sources (delivered energy), to apply both power generation and fuel transportation losses to the energy consumption value. As a conversion standard, the electric power (2.75) and fuel (1.1) (i.e., coal, gas, oil, etc.) conversion factors, proposed by the BEECS (Table 1), were used to calculate the primary energy consumption. The fans, pumps, and cooling towers have a higher electrical energy ratio (2.75) than the absorption chiller (1.1), which uses gas. The CAV increased primary cooling energy by 23.3% compared to the CAV, while the UFAD reduced energy consumption by 11.3%, and the active chilled beam with DOAS by 23.1%.

5.3. CO2 Emissions

Figure 17 shows the CO2 emissions and the percent reduction in the CO2 emissions of each system in June, July, and August. The amount of CO2 emissions for each system can be calculated by multiplying the site energy by the CO2 emission factor for each energy source. Therefore, the site energy was multiplied by the electric power CO2 emission factor of 0.4663 kg CO2/kWh and the natural gas (LNG) CO2 emission factor of 0.2031 kg CO2/kWh, as listed in Table 2 of Section 2.3.
When analyzing the CO2 emissions, the CO2 emissions associated with the VAV system were 34,679 kgCO2 while for the CAV system the emissions were 42,400 kgCO2, that is, an increase of 22.3% compared with the VAV. When using the UFAD system, the CO2 emissions were approximately 31,185 kgCO2, i.e., a reduction of 10.1% compared with the VAV. Finally, when using the active chilled beam with DOAS, the CO2 emissions were 27,124 kgCO2, which is a reduction of 21.8% compared to the VAV.

6. Conclusions and Discussions

6.1. Summary and Conclusions

This study used the EnergyPlus dynamic simulation program to analyze in detail the operational characteristics and energy performance, and to understand the features of the HVAC systems under consideration, by investigating the dry-bulb temperature, relative humidity, thermal comfort, and airflow rate at major nodes. Furthermore, we analyzed the cooling energy consumption, energy reduction contribution, and CO2 emissions. The conclusions that can be drawn from this study are as follows:
(1)
We analyzed the changes in the average annual summer temperature in Incheon (Seoul metropolitan area), Korea. The results indicated that the temperature is increasing and abnormal climate events, such as heat waves, are occurring more frequently. These characteristics give rise to circumstances during which it is necessary to use energy-conserving HVAC systems in Korea.
(2)
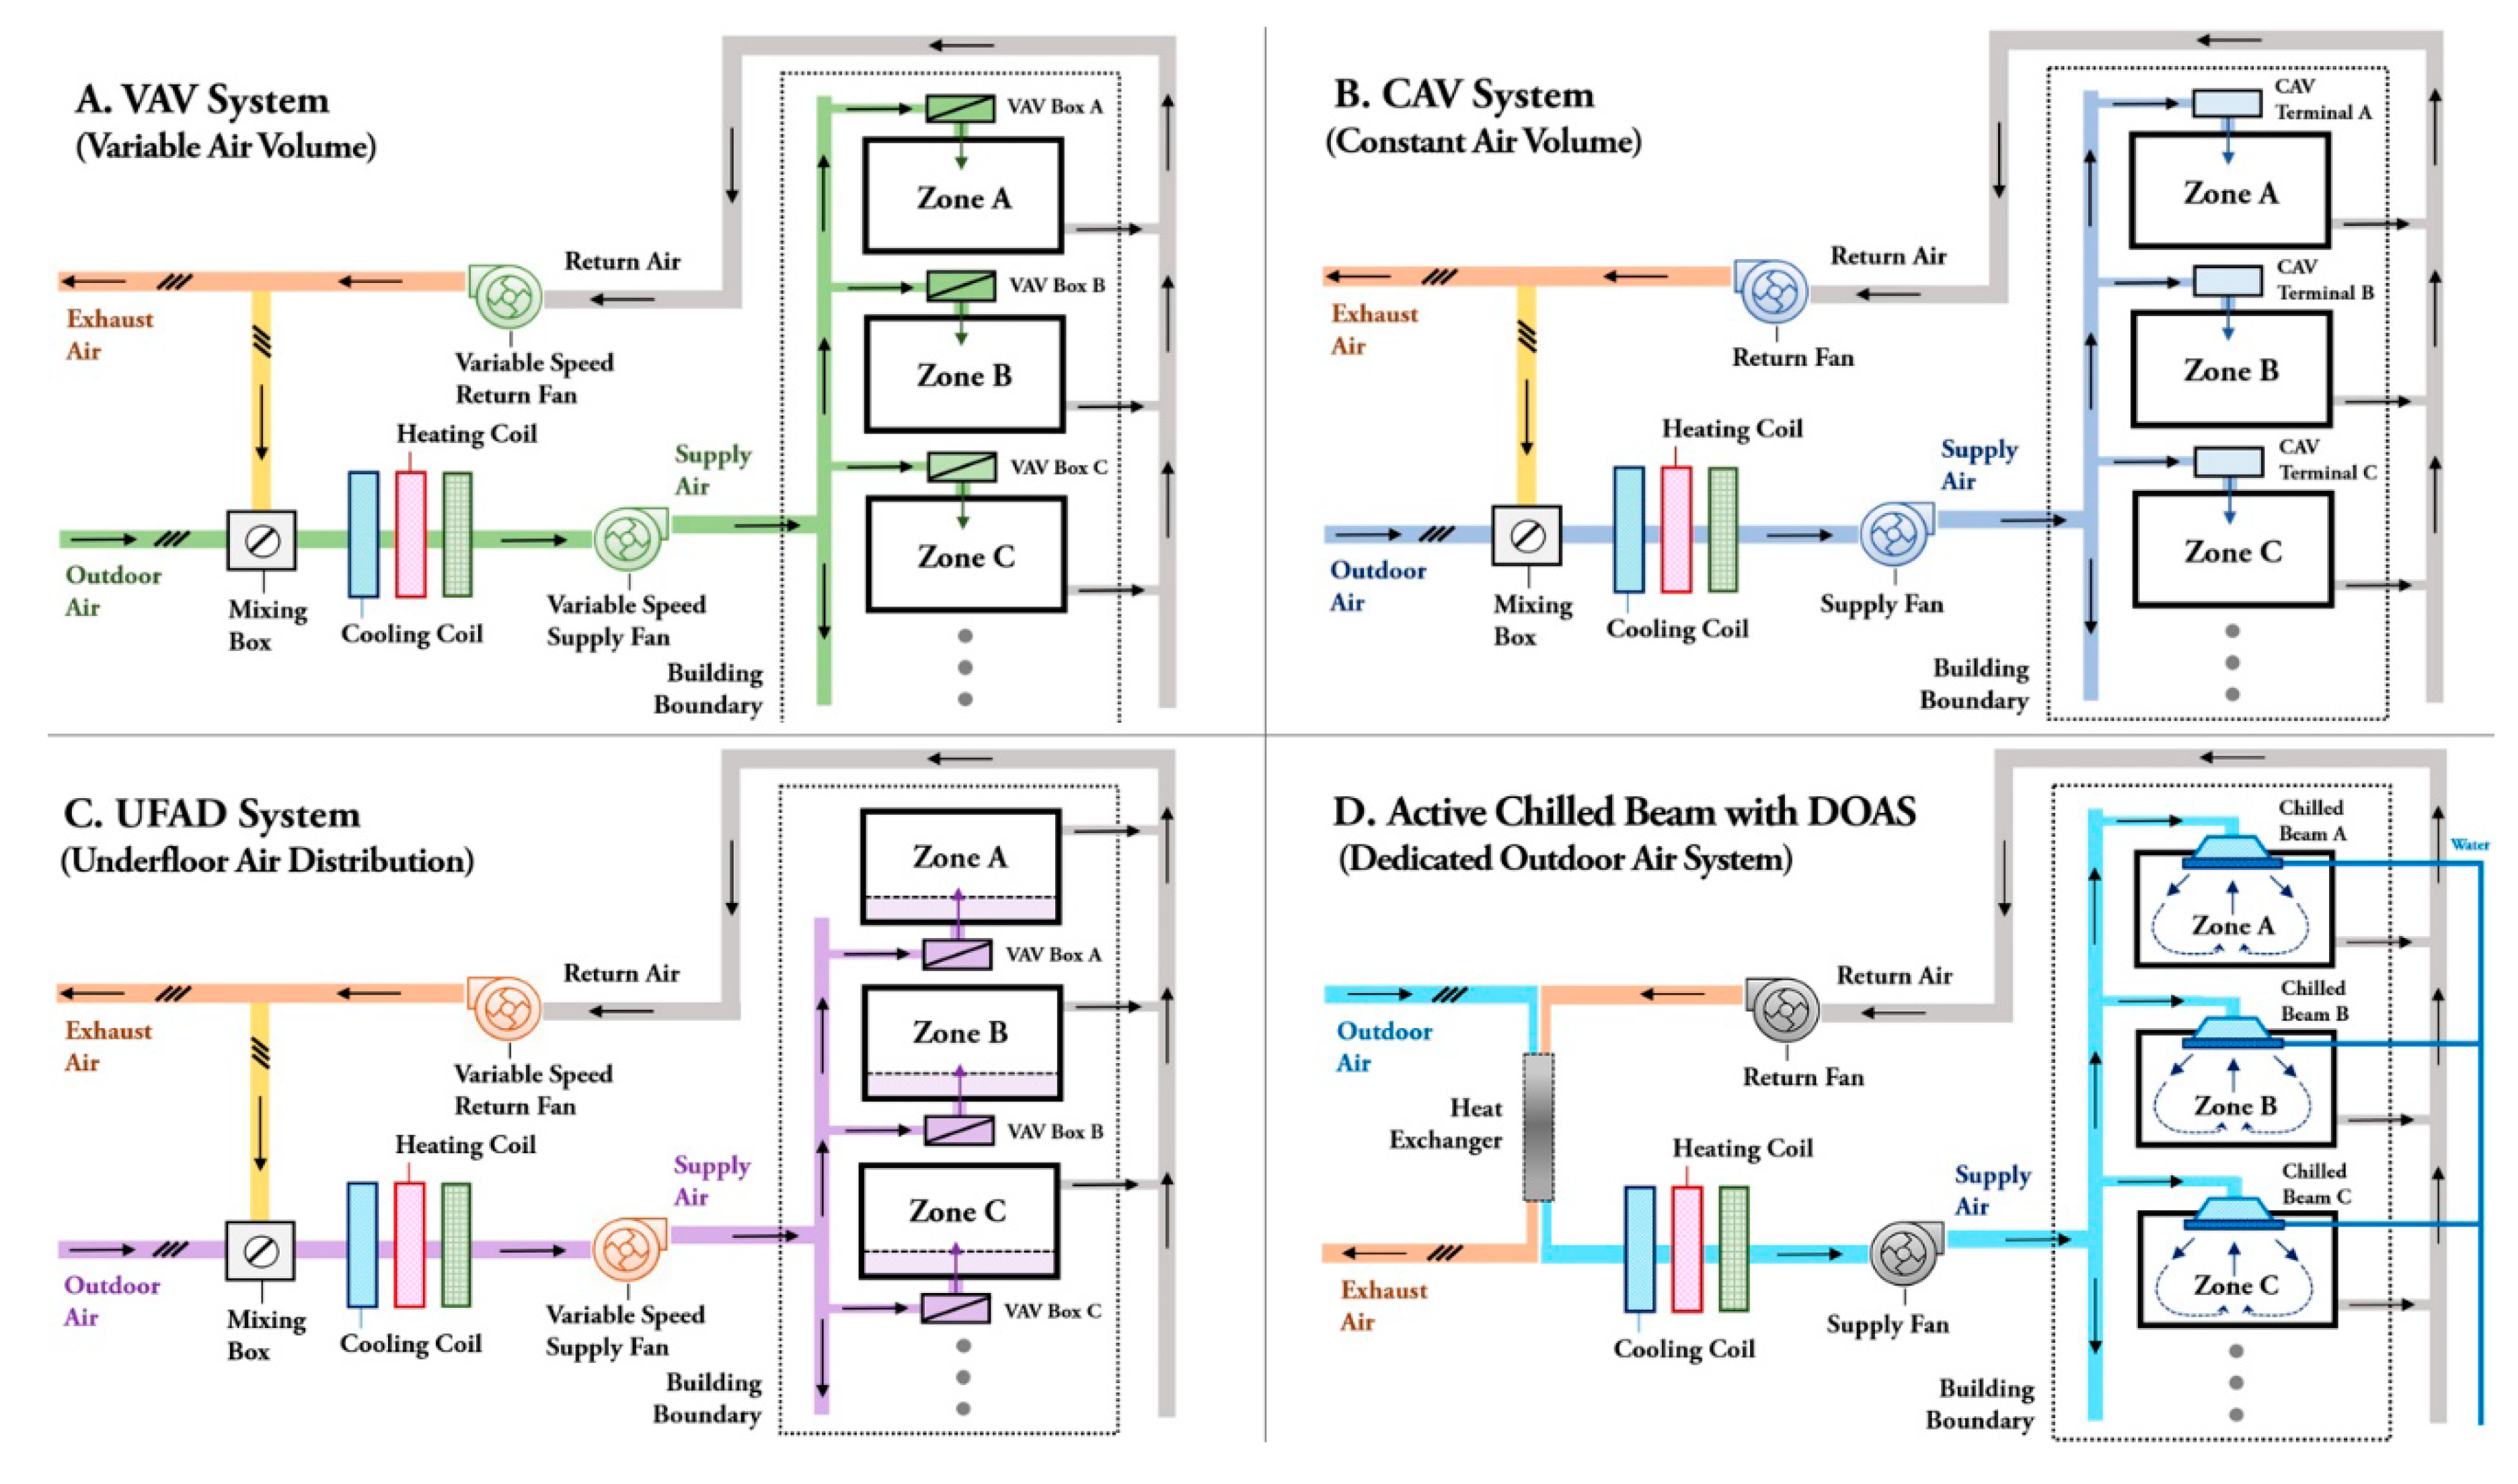
Each energy-conserving HVAC system has a different modeling configuration in EnergyPlus, according to its air-conditioning concept. In the VAV, the terminal unit was modeled as an “Air Terminal Single Duct: VAV Reheat”. In the CAV, the air loop terminal unit was modeled as an “Air Terminal Single Duct: Constant Volume: Reheat”. In the VAV, the fans were modeled as “Fan: Variable Volume”. In the CAV, they were modeled as “Fan: Constant Volume”. The UFAD was modeled as “Room air model Type” and “Room Air Setting: Underfloor Air Distribution” to implement floor diffusion and thermal stratification. For the active chilled beam with DOAS, “Air Terminal Single Duct: Cooled Beam” and “Heat Exchanger Air to Air: Sensible and Latent” were used to implement the beam’s induced air condition features, as well as the features of the DOAS, which entails the introduction of only outdoor air.
(3)
The dry-bulb temperature, relative humidity, and airflow rates were compared at the major nodes (10 node points) in the schematic of each HVAC system (8.1 at 2:00 PM). Even though the indoor temperature was set to be identical among each HVAC system, the node status analysis results show that the airflow supply rates were different according to each air-conditioning concept, as well as showing changes in the air temperature and humidity based on the airflow rates.
(4)
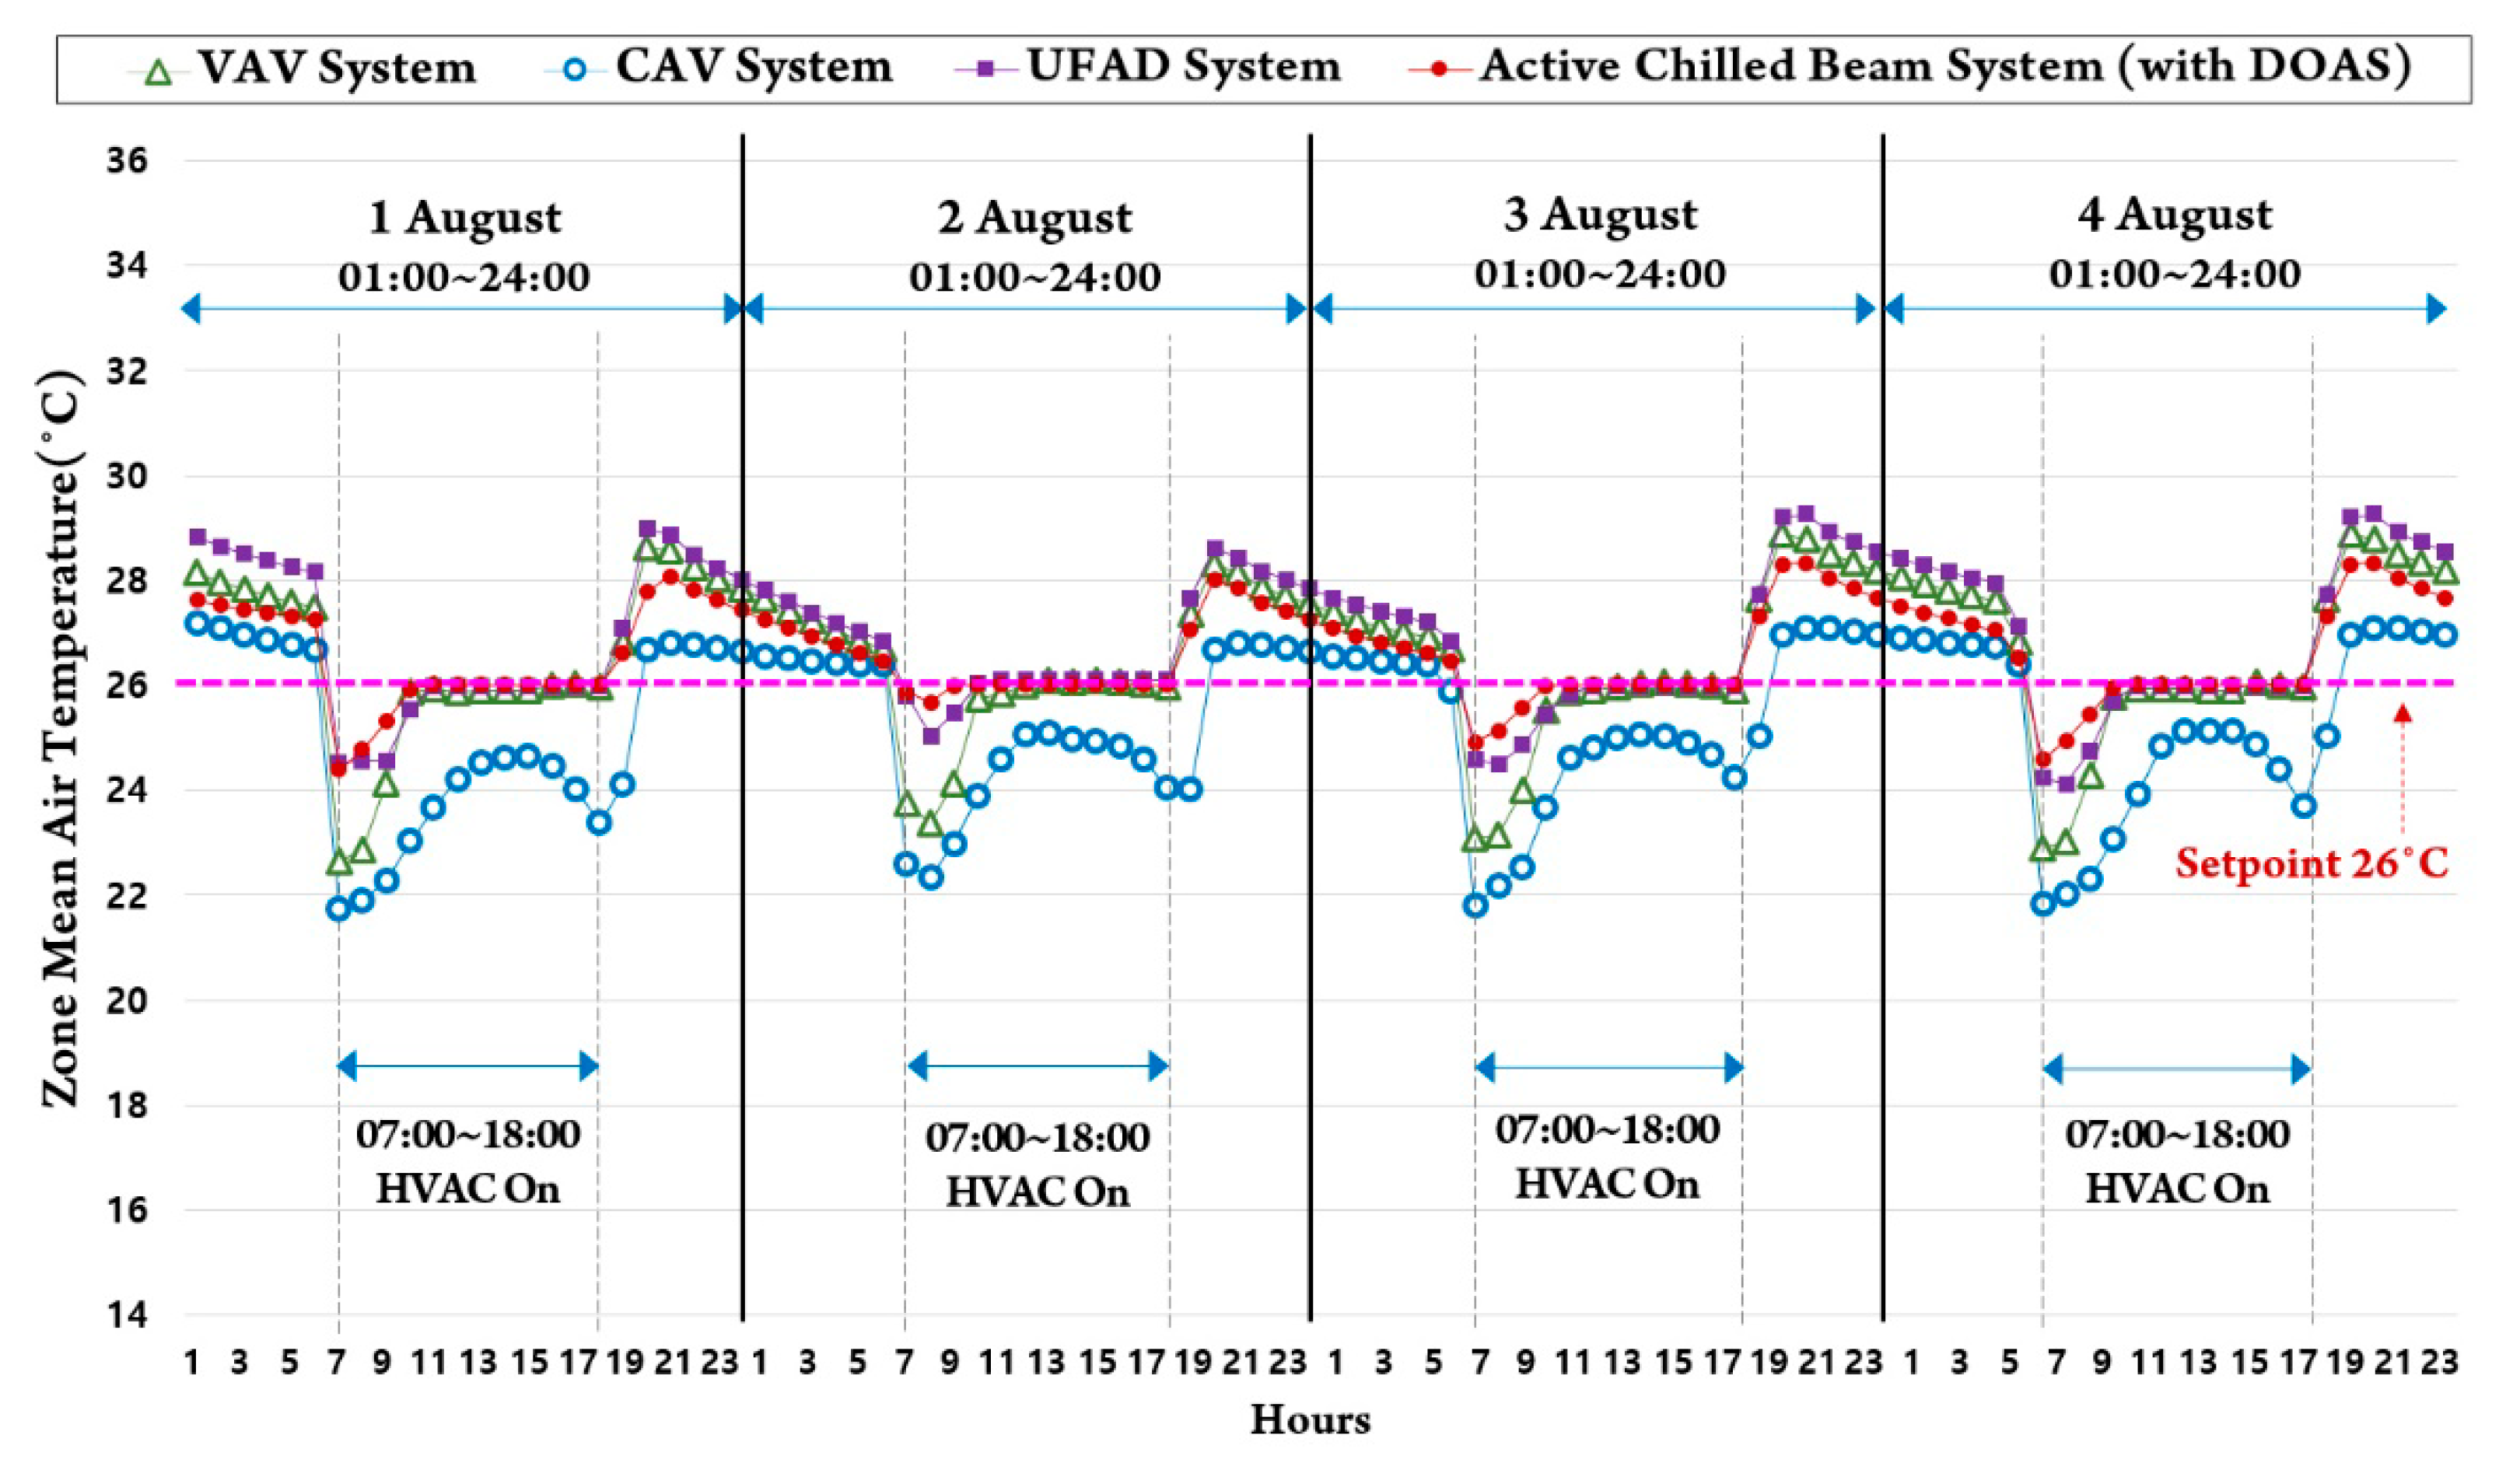
When the HVAC systems were used in the summer with high temperature and humidity, although the VAV, UFAD, and active chilled beam with DOAS matched the cooling set-point temperature of 26 °C, their initial indoor temperature distributions were slightly different. The CAV used a maximum airflow and conditioned the air to approximately 2–3 °C below the cooling set-point of 26 °C. All four systems have dehumidification functions in their AHUs. Since the active chilled beam with the DOAS handles latent heat and performs dehumidification via heat exchangers, this system conforms to the Korean and the ASHRAE thermal comfort standard. When we analyzed the indoor thermal comfort, the CAV had a slightly lower PMV than other systems at −1.27 to −0.90 due to the overcooling by excessive air flow and, accordingly, a lower indoor temperature than 26 °C. Therefore, the CAV was unable to conform to the thermal comfort range from −0.5 to 0.5.
(5)
The VAV maintained a constant indoor temperature, and controlled the airflow rate at 1.311–3.480 kg/s, according to the space thermal load. On the other hand, the CAV supplied air constantly at a maximum airflow of 5.072 kg/s during the air-conditioning period. The UFAD also controlled the airflow to maintain set-point temperature and, therefore, showed the same changes in airflow pattern as the VAV. However, since the UFAD only conditions air in the occupied zone, it used a lower airflow rate of 1.114–2.987 kg/s than the VAV. The active chilled beam with the DOAS operates using a constant airflow method, whose load response is achieved by controlling the flow in the beam’s chilled water coil. Therefore, the active chilled beam with DOAS was able to maintain the cooling set-point temperature and humidity, despite only conditioning air with a minimum outdoor air inflow of 1.587 kg/s.
(6)
Even though the same set-point temperatures were set, the amount of indoor heat removed by each system was different, because each system had different airflow and temperature control methods, based on their specific characteristics. The CAV constantly supplied air at a maximum airflow, which was capable of increasing the amount of removed heat by 24.9%, compared to the VAV. When using the UFAD, the amount of heat removed was reduced by 8.7%, compared with the VAV. When using the active chilled beam with DOAS, the beam’s indoor induced air at the DOAS minimum outdoor air inflow initiated air conditioning, which was capable of reducing the amount of heat removed by 17.3%, compared with the VAV.
(7)
Primary cooling energy, which takes into account electric power and fuel conversion factors, was increased by 23.3% when using CAV, compared to VAV. When using UFAD, the energy was reduced by 11.3%, whereas the active chilled beam with DOAS reduced the energy by 23.1%, compared to VAV. CO2 emission reduction rates were similar to the cooling energy saving rates; CO2 emissions when using CAV increased by 22.3%, compared to VAV. When using UFAD and active chilled beam, emissions were reduced by 10.1% and 21.8%, respectively, compared to VAV.

6.2. Limitation of Research and Future Work

Implementing the cooling mechanisms and understanding the energy conservation principles of each HVAC system in certain climate conditions is important for energy efficiency in future high-performance buildings. This study selected a reference model and performed evaluations of each energy-conserving HVAC system by focusing on its cooling mechanism, indoor environment, energy consumption, and CO2 emissions.
However, future studies must also analyze energy reduction rates that occur when these systems are combined with other plant systems or renewable energy technology. Future studies will also need to analyze cooling seasons and heating mechanisms within each system. In addition, economic analyses that consider energy costs needed to be performed in the future.
There are only simulation results through EnergyPlus in this study. Experimental study was not performed when four systems were applied in the actual building. Therefore, we need to discuss the results of the actual system operation through experimental study along with simulation data in a future study. Since there is no study that compares all four systems in various climates, we need to review the simulation data by applying it in different climates. However, data analyzed in this study showed similar results as those of Cho et al. [69] and Kim et al. [14] who studied various energy-saving systems in the Korean climate.

Supplementary Materials

The following are available online at https://www.mdpi.com/1996-1073/12/21/4160/s1: Figure S1a. Comparison of CAV and VAV modeling in the EnergyPlus class list, Figure S1b. Comparison of CAV and UFAD modeling in the EnergyPlus class list, Figure S1c. Comparison of CAV and active chilled beam with DOAS modeling in the EnergyPlus class list, Figure S2a. Diagram of the CAV system layout in the EnergyPlus simulation (scalable vector graphics (SVG) of the CAV system), Figure S2b. Diagram of the VAV system layout in the EnergyPlus simulation (scalable vector graphics (SVG) of the VAV system), Figure S2c. Diagram of the UFAD system layout in the EnergyPlus simulation (scalable vector graphics (SVG) of the UFAD system), and Figure S2d. Diagram of the ACB with DOAS layout in the EnergyPlus simulation (scalable vector graphics (SVG) of the ACB with DOAS).

Author Contributions

C.-H.K. performed the simulation and data analysis and wrote this paper based on the obtained results with the help of S.-E.L. and K.-H.L. K.-S.K. led and supervised this study. All of the authors have contributed for collecting ideas and concepts presented in the paper.

Funding

This research was supported by a grant (19AUDP-B079104-06) from Architecture and Urban Development Research Program funded by Ministry of Land, Infrastructure and Transport of Korean government.

Conflicts of Interest

The authors declare no conflict of interest.

Abbreviations

The following abbreviations are used in this manuscript:
ACBActive Chilled Beam
ACHAir Change per Hour
AHUAir Handling Unit
ALTAltitude
ASHRAEAmerican Society of Heating, Refrigerating and Air-Conditioning Engineers
BEECSBuilding Energy Efficiency Certification System
CAVConstant Air Volume
CDDCooling Degree Day
DOASDedicated Outdoor Air System
DOEU.S. Department of Energy
EPBDEnergy Performance of Buildings Directive
EPWEnergyPlus Weather File
FCFan Coil
GHGGreenhouse Gas
HVACHeating, Ventilation, and Air-Conditioning
HDDHeating Degree Day
IPCCIntergovernmental Panel on Climate Change
KEAKorea Energy Agency
KICTKorea Institute of Civil Engineering and Building Technology
KMAKorea Meteorological Administration
LDACLiquid Desiccant Membrane Air-conditioning
LNGNatural Gas
MOTIEKorea Ministry of Trade, Industry and Energy
MVHRMechanical Ventilation with Heat Recovery
OHADOverhead Air Distribution
PMVPredicted Mean Vote
REHVAFederation of European Heating, Ventilation and Air Conditioning Associations
SHGCSolar Heat Gain Coefficient
TRYTest Reference Year
UFADUnderfloor Air Distribution
VAVVariable Air Volume
VLTVisible Light Transmittance
VRFVariable Refrigerant Flow

References

  1. Edenhofer, O.R.; Pichs-Madruga, Y.; Sokona, E.; Farahani, S.; Kadner, K.; Seyboth, A.; Adler, I.; Baum, S.; Brunner, P.; Eickemeier, B.; et al. Climate Change 2014 Mitigation of Climate Change; Working Group III Contribution to the Fifth Assessment Report of IPCC; UNEP: Geneva, Switzerland, 2015; ISBN 978-92-9169-142-5. [Google Scholar]
  2. The Core Writing Team of IPCC; Pachauri, R.K.; Meyer, L. Synthesis Report IPCC Climate Change 2014 Synthesis Report; Intergovernmental Panel on Climate Change (IPCC): Geneva, Switzerland, 2015; ISBN 978-92-9169-143-2. [Google Scholar]
  3. Oleson, K.W.; Anderson, G.B.; Jones, B.; McGinnis, S.A.; Sanderson, B. Avoided climate impacts of urban and rural heat and cold waves over the US using large climate model ensembles for RCP 8.5 and RCP 4.5. Clim. Chang. 2018, 146, 377–392. [Google Scholar] [CrossRef] [PubMed]
  4. Lhotka, O.; Kyselý, J.; Farda, A. Climate change scenarios of heat waves in Central Europe and their uncertainties. Theor. Appl. Climatol. 2017, 131, 1043–1054. [Google Scholar] [CrossRef]
  5. Ceccherini, G.; Russo, S.; Ameztoy, I.; Romero, C.P.; Carmona-Moreno, C. Magnitude and frequency of heat and cold waves in recent decades: The case of South America. Nat. Hazards Earth Syst. Sci. 2016, 16, 821–831. [Google Scholar] [CrossRef]
  6. Luo, X.; Zhang, Y. The linkage between upper-level jet streams over East Asia and East Asian winter monsoon variability. J. Clim. 2015, 28, 9013–9028. [Google Scholar] [CrossRef]
  7. International Energy Agency (IEA). Key World Energy Statistics; International Energy Agency (IEA): Paris, France, 2017; ISBN 978-92-64-27807-3. [Google Scholar]
  8. Briner, G.; Prag, A. Establishing and Understanding Post-2020 Climate Change Mitigation Commitments; International Energy Agency: Paris, France, 2013. [Google Scholar] [CrossRef]
  9. Tavoni, M.; Kriegler, E.; Riahi, K.; Van Vuuren, D.P.; Aboumahboub, T.; Bowen, A.; Campiglio, E.; Kober, T.; Jewell, J.; Luderer, G.; et al. Post-2020 climate agreements in the major economies assessed in the light of global models. Nat. Clim. Chang. 2015, 5, 119. [Google Scholar] [CrossRef]
  10. Höhne, N.; Fekete, H.; den Elzen, M.G.; Hof, A.F.; Kuramochi, T. Assessing the ambition of post-2020 climate targets: A comprehensive framework. Clim. Policy 2018, 18, 425–441. [Google Scholar] [CrossRef]
  11. Zhao, H.X.; Magoulès, F. A review on the prediction of building energy consumption. Renew. Sustain. Energy Rev. 2012, 16, 3586–3592. [Google Scholar] [CrossRef]
  12. The International Energy Agency (IEA). Modernising Building Energy Codes to Secure Our Global Energy Future; IEA: Paris, France, 2013. [Google Scholar]
  13. Pérez-Lombard, L.; Ortiz, J.; Pout, C. A review on buildings energy consumption information. Energy Build. 2008, 40, 394–398. [Google Scholar] [CrossRef]
  14. Kim, C.H.; Lee, S.E.; Kim, K.S. Analysis of Energy Saving Potential in High-Performance Building Technologies under Korean Climatic Conditions. Energies 2018, 11, 884. [Google Scholar] [CrossRef]
  15. Kim, C.H.; Lee, S.E.; Kim, K.S. Comprehensive Analysis of Energy Consumption Rate and New Technology Trend in High-Performance Buildings related with Different Climatic Zones; Architectural Institute of Korea: Seoul, Korea, 2018; Volume 34. [Google Scholar] [CrossRef]
  16. U.S. Department of Energy (DOE). EnergyPlus Engineering Reference (Version 9.1.0 Documentation; Building Technologies Program); U.S. Department of Energy: Washington, DC, USA, 2017.
  17. Perez-Lombard, L.; Ortiz, J.; Maestre, I.R. The map of energy flow in HVAC systems. Appl. Energy 2011, 88, 5020–5031. [Google Scholar] [CrossRef]
  18. Trčka, M.; Hensen, J.L. Overview of HVAC system simulation. Autom. Constr. 2010, 19, 93–99. [Google Scholar] [CrossRef] [Green Version]
  19. Terrill, T.J.; Rasmussen, B.P. An evaluation of HVAC energy usage and occupant comfort in religious facilities. Energy Build. 2016, 128, 224–235. [Google Scholar] [CrossRef]
  20. Bellia, L.; Capozzoli, A.; Mazzei, P.; Minichiello, F. A comparison of HVAC systems for artwork conservation. Int. J. Refrig. 2007, 30, 1439–1451. [Google Scholar] [CrossRef]
  21. Crawley, D.B.; Lawrie, L.K.; Winkelmann, F.C.; Buhl, W.F.; Huang, Y.J.; Pedersen, C.O.; Glazer, J. EnergyPlus: Creating a new-generation building energy simulation program. Energy Build. 2001, 33, 319–331. [Google Scholar] [CrossRef]
  22. Crawley, D.B.; Lawrie, L.K.; Pedersen, C.O.; Winkelmann, F.C. Energy plus: Energy simulation program. ASHRAE J. 2000, 42, 49–56. [Google Scholar]
  23. Gustafsson, M.; Dermentzis, G.; Myhren, J.A.; Bales, C.; Ochs, F.; Holmberg, S.; Feist, W. Energy performance comparison of three innovative HVAC systems for renovation through dynamic simulation. Energy Build. 2014, 82, 512–519. [Google Scholar] [CrossRef] [Green Version]
  24. Korolija, I.; Marjanovic-Halburd, L.; Zhang, Y.; Hanby, V.I. Influence of building parameters and HVAC systems coupling on building energy performance. Energy Build. 2011, 43, 1247–1253. [Google Scholar] [CrossRef]
  25. Storle, D.; Abdel-Salam, M.R.; Simonson, C.J. Energy performance comparison of a 3-fluid and 2-fluid liquid desiccant membrane air-conditioning systems in an office building. Energy 2019, 176, 437–456. [Google Scholar] [CrossRef]
  26. Kim, J.; Tzempelikos, A.; Braun, J.E. Energy savings potential of passive chilled beams vs air systems in various US climatic zones with different system configurations. Energy Build. 2019, 186, 244–260. [Google Scholar] [CrossRef]
  27. Yu, X.; Yan, D.; Sun, K.; Hong, T.; Zhu, D. Comparative study of the cooling energy performance of variable refrigerant flow systems and variable air volume systems in office buildings. Appl. Energy 2016, 183, 725–736. [Google Scholar] [CrossRef] [Green Version]
  28. Ho, S.H.; Rosario, L.; Rahman, M.M. Comparison of underfloor and overhead air distribution systems in an office environment. Build. Environ. 2011, 46, 1415–1427. [Google Scholar] [CrossRef]
  29. Ministry of Land, Infrastructure and Transport. Building Energy Efficiency Certification System of Korea. 2017. Available online: http://www.molit.go.kr/USR/I0204/m_45/dtl.jsp?idx=14790 (accessed on 25 October 2019).
  30. Schicktanz, M.D.; Wapler, J.; Henning, H.M. Primary energy and economic analysis of combined heating, cooling and power systems. Energy 2011, 36, 575–585. [Google Scholar] [CrossRef]
  31. Gustafsson, M.; Thygesen, R.; Karlsson, B.; Ödlund, L. Rev-Changes in Primary Energy Use and CO2 Emissions—An Impact Assessment for a Building with Focus on the Swedish Proposal for Nearly Zero Energy Buildings. Energies 2017, 10, 978. [Google Scholar] [CrossRef]
  32. International Energy Agency (IEA). CO2 Emissions from Fuel Combustion Highlights, 2017th ed.; IEA: Paris, France, 2017; ISBN 978-92-64-27818-9. [Google Scholar]
  33. Korea Energy Agency (KEA). Carbon Neutral Program Guideline; KEA: Gyeonggi-Do, Korea, 2017. [Google Scholar]
  34. Intergovernmental Panel on Climate Change (IPCC). IPCC Guidelines for National Greenhouse Gas Inventories Volume 2 Energy; IPCC: Geneva, Switzerland, 2007. [Google Scholar]
  35. Deru, M.; Field, K.; Studer, D.; Benne, K.; Griffith, B.; Torcellini, P.; Liu, B.; Halverson, M.; Winiarski, D.; Rosenberg, M.; et al. U.S. Department of Energy Commercial Reference Building Models of the National Building Stock; National Renewable Energy Laboratory (NREL): Denver, CO, USA, 2011.
  36. U.S. Department of Energy (DOE). DOE Reference Commercial Buildings Report; Prototype Building Model Package. Available online: https://www.energycodes.gov/development/commercial/prototype_ models (accessed on 25 October 2019).
  37. Korea Meteorological Administration (KMA). National Climate Data Center, Weather Data Release Portal. Available online: https://data.kma.go.kr/cmmn/main.do (accessed on 25 October 2019).
  38. EnergyPlus. EnergyPlusWeather Data. Available online: https://energyplus.net/weather/ (accessed on 25 October 2019).
  39. Ministry of Land, Infrastructure and Transport (MOLIT); Korea Energy Agency (KEA). Building Energy Saving Design Standards of Korea; KEA: Gyeonggi-Do, Korea, 2017.
  40. Ministry of Trade, Industry and Energy (MOTIE); Korea Institute of Civil Engineering and Building Technology (KICT). The Study of the Development of Energy Performance Assessment Method and Policy in Buildings; KICT: Gyeonggi-Do, Korea, 2017.
  41. Korea Energy Agency (KEA); Korea Institute of Civil Engineering and Building Technology (KICT). Establishing Data Base of Building Energy Design Situation and Developing High Efficiency Building Design Guideline; KEA: Gyeonggi-Do, Korea, 2017. [Google Scholar]
  42. Korea Energy Agency (KEA); Korea Appraisal Board (KAB). Development of Building Energy Integrated Support System for the Spread of Low-Energy Building Workshop; Korea Energy Agency and Korea Appraisal Board DB: Gyeonggi-Do, Korea, 2016. [Google Scholar]
  43. American Society of Heating, Refrigerating and Air-Conditioning Engineers (ASHRAE). ASHRAE 90.1-2010 International Climate Zone Definitions; ASHRAE: Atlanta, GA, USA, 2012; Available online: http://www.builtenvironments.com/International_Climate_Zones.pdf (accessed on 25 October 2019).
  44. Kottek, M.; Grieser, J.; Beck, C.; Rudolf, B.; Rubel, F. World Map of the Köppen-Geiger climate classification updated. Meteorol. Z. 2006, 15, 259–263. [Google Scholar] [CrossRef]
  45. Korea Meteorological Administration (KMA). 2017 Abnormal Climate Report; KMA: Seoul, Korea, 2017; ISBN 11-1360000-000705-01. Available online: http://www.climate.go.kr/home/bbs/list.php?code=93&bname=abnormal (accessed on 25 October 2019).
  46. Li, C.; Hong, T.; Yan, D. An insight into actual energy use and its drivers in high-performance buildings. Appl. Energy 2014, 131, 394–410. [Google Scholar] [CrossRef] [Green Version]
  47. Aynur, T.N.; Hwang, Y.; Radermacher, R. Simulation of a VAV air conditioning system in an existing building for the cooling mode. Energy Build. 2009, 41, 922–929. [Google Scholar] [CrossRef]
  48. Yang, X.B.; Jin, X.Q.; Du, Z.M.; Fan, B.; Chai, X.F. Evaluation of four control strategies for building VAV air-conditioning systems. Energy Build. 2011, 43, 414–422. [Google Scholar] [CrossRef]
  49. Ma, H.; Du, N.; Yu, S.; Lu, W.; Zhang, Z.; Deng, N.; Li, C. Analysis of typical public building energy consumption in northern China. Energy Build. 2017, 136, 139–150. [Google Scholar] [CrossRef]
  50. Chen, H.; Lee, W.L.; Wang, X. Energy assessment of office buildings in China using China building energy codes and LEED 2.2. Energy Build. 2015, 86, 514–524. [Google Scholar] [CrossRef]
  51. Schiavon, S.; Lee, K.H.; Bauman, F.; Webster, T. Simplified calculation method for design cooling loads in underfloor air distribution (UFAD) systems. Energy Build. 2011, 43, 517–528. [Google Scholar] [CrossRef] [Green Version]
  52. Lee, K.H.; Schiavon, S.; Bauman, F.; Webster, T. Thermal decay in underfloor air distribution (UFAD) systems: Fundamentals and influence on system performance. Appl. Energy 2012, 91, 197–207. [Google Scholar] [CrossRef] [Green Version]
  53. Ahmed, K.; Kurnitski, J.; Sormunen, P. Demand controlled ventilation indoor climate and energy performance in a high performance building with air flow rate controlled chilled beams. Energy Build. 2015, 109, 115–126. [Google Scholar] [CrossRef]
  54. Chen, C.; Cai, W.; Wang, Y.; Lin, C. Performance comparison of heat exchangers with different circuitry arrangements for active chilled beam applications. Energy Build. 2014, 79, 164–172. [Google Scholar] [CrossRef]
  55. Pasut, W.; Bauman, F.; De Carli, M. The use of ducts to improve the control of supply air temperature rise in UFAD systems: CFD and lab study. Appl. Energy 2014, 134, 490–498. [Google Scholar] [CrossRef]
  56. Lee, K.H.; Kim, S.M.; Yoon, J.H. Supply air temperature impact in underfloor air distribution systems under Korean climatic conditions: Energy, humidity and comfort. Energy Build. 2013, 58, 363–371. [Google Scholar] [CrossRef]
  57. Yu, K.H.; Yoon, S.H.; Jung, H.K.; Kim, K.H.; Song, K.D. Influence of lighting loads upon thermal comfort under CBAD and UFAD systems. Energies 2015, 8, 6079–6097. [Google Scholar] [CrossRef]
  58. Korea Hanmi Publishing Company. Monthly Journal of Equipment Technology; Korea Hanmi Publishing Company: Seoul, Korea, 2013. [Google Scholar]
  59. Rhee, K.N.; Shin, M.S.; Choi, S.H. Thermal uniformity in an open plan room with an active chilled beam system and conventional air distribution systems. Energy Build. 2015, 93, 236–248. [Google Scholar] [CrossRef]
  60. Rhee, K.N.; Choi, S.H.; Kim, C.H. Comparative evaluation of the thermal uniformity in a space with active chilled beam and conventional air conditioning systems. J. Archit. Inst. Korea Plan. Des. 2014, 30, 199–206. [Google Scholar] [CrossRef]
  61. Kim, C.H.; Lee, S.E.; Yu, K.H.; Kim, K.S. An analysis of the energy performance and thermal comfort in an office building with active chilled beam system. In Proceedings of the SAREK 2016 Summer Annual Conference, Pyeongchang, Korea, 22–24 June 2016; The Society of Air-Conditioning and Refrigerating Engineers of Korea (SAREK): Seoul, Korea, 2016. [Google Scholar]
  62. Virta, M.; Butler, D.; Graslund, J.; Hogeling, J.; Kristiansen, E.L.; Reinikainen, M.; Svensson, G. Chilled Beam Application Guidebook; Federation of European Heating, Ventilation and Air-conditioning Associations (REHVA): Brussels, Belgium, 2006; ISBN 978-2960046830. [Google Scholar]
  63. Ministry of Land, Infrastructure and Transport. Building Act. Indoor Air Quality Control in Public-Use Facilities, etc. Act; Wholly Amended by Act No. 6911; Ministry of Land, Infrastructure and Transport: Sejong, Korea, 2016.
  64. Ministry of Land, Infrastructure and Transport. Building Act. Facilities of Buildings; Wholly Amended by Act Act No.14792, 18; Partial Amendment; Ministry of Land, Infrastructure and Transport: Sejong, Korea, 2017.
  65. International Organization for Standardization. ISO 7730:2005, Ergonomics of the Thermal Environment—Analytical Determination and Interpretation of Thermal Comfort using Calculation of the PMV and PPD Indices and Local Thermal Comfort Criteria; International Organization for Standardization (ISO): Geneva, Switzerland, 2005. [Google Scholar]
  66. ANSI/ASHRAE Standard 55-2010. Thermal Environmental Conditions for Human Occupancy; MASHRAE: Atlanta, GA, USA, 2011. [Google Scholar]
  67. Djongyang, N.; Tchinda, R.; Njomo, D. Thermal comfort: A review paper. Renew. Sustain. Energy Rev. 2010, 14, 2626–2640. [Google Scholar] [CrossRef]
  68. Kim, C.H.; Kim, K.S. Evaluation of thermal and visual environment for the glazing and shading device in an office building with installed of venetian blind. Korea Inst. Ecol. Archit. Environ. 2015, 15, 101–109. [Google Scholar] [CrossRef]
  69. Cho, J.K.; Shin, S.H.; Kim, J.H.; Hong, H.K. Development of an energy evaluation methodology to make multiple predictions of the HVAC&R system energy demand for office buildings. Energy Build. 2014, 80, 169–183. [Google Scholar] [CrossRef]
Figure 1. Diagram of the methods and procedures used in this study.
Energies 12 04160 g001
Figure 2. Heating, ventilation, and air-conditioning (HVAC) system thermal chain in the cooling and heating mode [17].
Energies 12 04160 g002
Figure 3. The EnergyPlus node point concept.
Energies 12 04160 g003
Figure 4. Site, primary energy consumption, and building CO2 emissions.
Energies 12 04160 g004
Figure 5. The EnergyPlus simulation model.
Energies 12 04160 g005
Figure 6. Average monthly outdoor air temperature and relative humidity of Incheon, Korea.
Energies 12 04160 g006
Figure 7. Changes in Incheon’s average summer temperatures (1970–2018).
Energies 12 04160 g007
Figure 8. Schematic layout of the HVAC systems: (A) variable air volume (VAV) system, (B) constant air volume (CAV) system, (C) underfloor air distribution (UFAD) system, and (D) active chilled beam with dedicated outdoor air system (DOAS).
Energies 12 04160 g008
Figure 9. (a) Analysis of node conditions in the VAV system network (1 August). (b) Analysis of node conditions in the CAV system network (1 August). (c) Analysis of node conditions in the UFAD system network (1 August). (d) Analysis of node conditions in the ACB with DOAS network (1 August).
Energies 12 04160 g009aEnergies 12 04160 g009b
Figure 10. Outdoor temperature and relative humidity in Incheon (1–4 August).
Energies 12 04160 g010
Figure 11. Analysis of mean zone air temperature when applying the four HVAC systems (1–4 August).
Energies 12 04160 g011
Figure 12. Analysis of zone air relative humidity when applying the four HVAC systems (1–4 August).
Energies 12 04160 g012
Figure 13. (a) Analysis of the total supply airflow rate (1–4 August). (b) Analysis of the supply airflow rate in the five zones (1 August).
Energies 12 04160 g013
Figure 14. Analysis of the thermal comfort during the operation of the four HVAC systems.
Energies 12 04160 g014
Figure 15. Analysis of the cumulative zone sensible cooling when operating the four HVAC systems.
Energies 12 04160 g015
Figure 16. Site-cooling energy, primary-cooling energy, and energy-saving potential in each HVAC system.
Energies 12 04160 g016
Figure 17. CO2 emissions and the reduction potential of each HVAC system.
Energies 12 04160 g017
Table 1. Primary energy factors in Korea.
Energy Supply SectorPrimary Energy Factors in Korea
Fuel (Coal, Gas, and Oil)1.1
Electricity power2.75
District heating0.728
District cooling0.937
Table 2. CO2 emission factors according to the energy supply sector.
Energy Supply SectorCO2 Emission Factors (kg CO2/TJ)CO2 Emission Factors (kg CO2/kWh)
Electric power129,6310.4663
LNG (liquefied natural gas)56,4670.2031
Gas/diesel oil72,6000.2612
Kerosene71,5000.2572
District heating34,2770.1233
Table 3. Properties of the base simulation model.
DivisionSpecifications of Base Model
UsageOffice Building
Floor Area and Direction1650 m² (50 m × 33 m × 11.7 m) & South
Simulation ProgramEnergyPlus v9.1.0 (dynamic simulation tool)
Base Model EnvelopeU-Value of Wall and DoorsIncheon 0.26 W/m2·K and 1.5 W/m2·K
(The Korean energy-saving design standards)
U-Value of FloorIncheon 0.22 W/m2·K
(The Korean energy-saving design standards)
U-Value of RoofIncheon 0.15 W/m2·K
(The Korean energy-saving design standards)
Glazing Type
(Low–E 6T + 12A + 6° CL)
Double Low–E Pane Glazing (U-value = 1.5 W/m2·K,
Solar Heat Gain Coefficient (SHGC) = 0.458, VLT = 0.698)
(The Korean energy-saving design standards)
Base Model SystemTerminal UnitVAV Unit
AHU Fan typeVariable Speed Fan
Set point Temp and Relative HumidityCooling Temp. 20 °C, Relative Humidity 40–60%
(The Korean energy-saving design standards)
Cooling Operation ScheduleCooling Operation (June–August): 07:00–18:00 (26.0 °C)
Plant SystemAbsorption Chiller (Cooling COP 1.0)
Pump Type & EfficiencyVariable Speed Pump, 0.6 (Design)
Lighting & Equipment Occupancy density12 W/m², 11 W/m², 0.1–0.2 person/m²
(The Korean energy–saving design standards,
The MOTIE and KICT report)
Infiltration3.0 ACH50
(The Korean energy-saving design standards)
ScheduleWeekday: 08:00–18:00, Weekend: Off
(The Korean energy-saving design standards)
People Metabolic117 W/person, 1.1 met (Office Work: Typing)
(ASHRAE Handbook Fundamentals (2009))
Clothing Value0.5 (Summer)
(ASHRAE Standard 55–2004)
Air Velocity0.1 m/s
(ASHRAE Standard 55–2004)
Weather DataIncheon (4A, Dwa), Korea
Table 4. Detailed climate characteristics of Incheon, Korea.
RegionsASHRAE ClimateKöppen ClimateLatitude N(°)
/Longitude E(°)
Outdoor Air Temperature (Average Monthly) Min./Avg./Max (°C)Relative Humidity (Average Monthly) Min./Avg./Max (%)HDD (18 °C)CDD (10 °C)
Incheon4A (Mixed–Moist)Dwa37.45/126.70−2.4/12.8/27.746.1/69.1/88.127492327
Table 5. Set of simulation variables.
ItemPassive Systems (Envelope)Active Systems (HVAC)
Wall, Floor, and Roof (U–Value)Glazing and Solar Shading SystemsEnvelope InfiltrationAir Conditioning SystemsPlant Systems
VAV System (Base)Incheon Standard
Wall 0.26 W/m²·K
Floor 0.22 W/m²·K
Roof 0.15 W/m²·K
Double Low–E
(No Blind)
(U–Value 1.5 W/m2·K,
SHGC 0.458, VLT 0.698)
3.0 ACH50VAV SystemAbsorption Chiller
(Cooling COP 1.0)
Terminal Unit: VAV
AHU fan type
: Variable air volume
Control logic
: Dual maximum control logic
Fan efficiency: 75%
(Motor efficiency: 90%)
Damper heating
action: Reverse
Fan pressure
: 1100 (SA), 700 Pa(RA)
Maximum air flow (Heating)
: 50% of max cooling air flow /
Minimum air flow: 20% of max cooling air flow
CAV
System
Incheon
Standard
Wall 0.26 W/m²·K
Floor 0.22 W/m²·K
Roof 0.15 W/m²·K
Double Low–E
(No Blind)
(U–Value 1.5 W/m2·K,
SHGC 0.458, VLT 0.698)
3.0 ACH50CAV SystemAbsorption Chiller
(Cooling COP 1.0)
Terminal Unit: CAV
AHU fan type
: Constant air volume
Fan efficiency: 75%
(Motor efficiency: 90%)
Fan Pressure
: 1100 (SA), 700 Pa(RA)
Constant minimum
airflow fraction: 1.0
UFAD
System
Incheon
Standard
Wall 0.26 W/m²·K
Floor 0.22 W/m²·K
Roof 0.15 W/m²·K
Double Low–E
(No Blind)
(U–Value 1.5 W/m2·K,
SHGC 0.458, VLT 0.698)
3.0 ACH50UFAD SystemAbsorption Chiller
(Cooling COP 1.0)
Cooling SAT: 16–18°C
Diffuser: Swirl type
(Core zone, n=242)
Linear bar grille type (Perimeter zone, n=21–24)
Fan pressure
: 1100 (SA), 700 Pa(RA)
Transition height: 1.7m
Thermal comfort height: 1.2m
Constant minimum
airflow fraction: 0.3
Active Chilled Beam with
DOAS
Active Chilled Beam
with DOAS
Chilled beam type: Active
Entering water temperature Cooling: 15–17°C
Mean coil temperature to room design temperature
difference: 2–4°C,
Coil surface area per coil length: 5.422m²/m
Chilled beam tube
inside and outside diameter: 0.0114, 0.0159
Leaving pipe inside
diameter: 0.0145m

