Gas Permeability and Production Potential of Marine Hydrate Deposits in South China Sea


Abstract
:
1. Introduction
2. Experiments
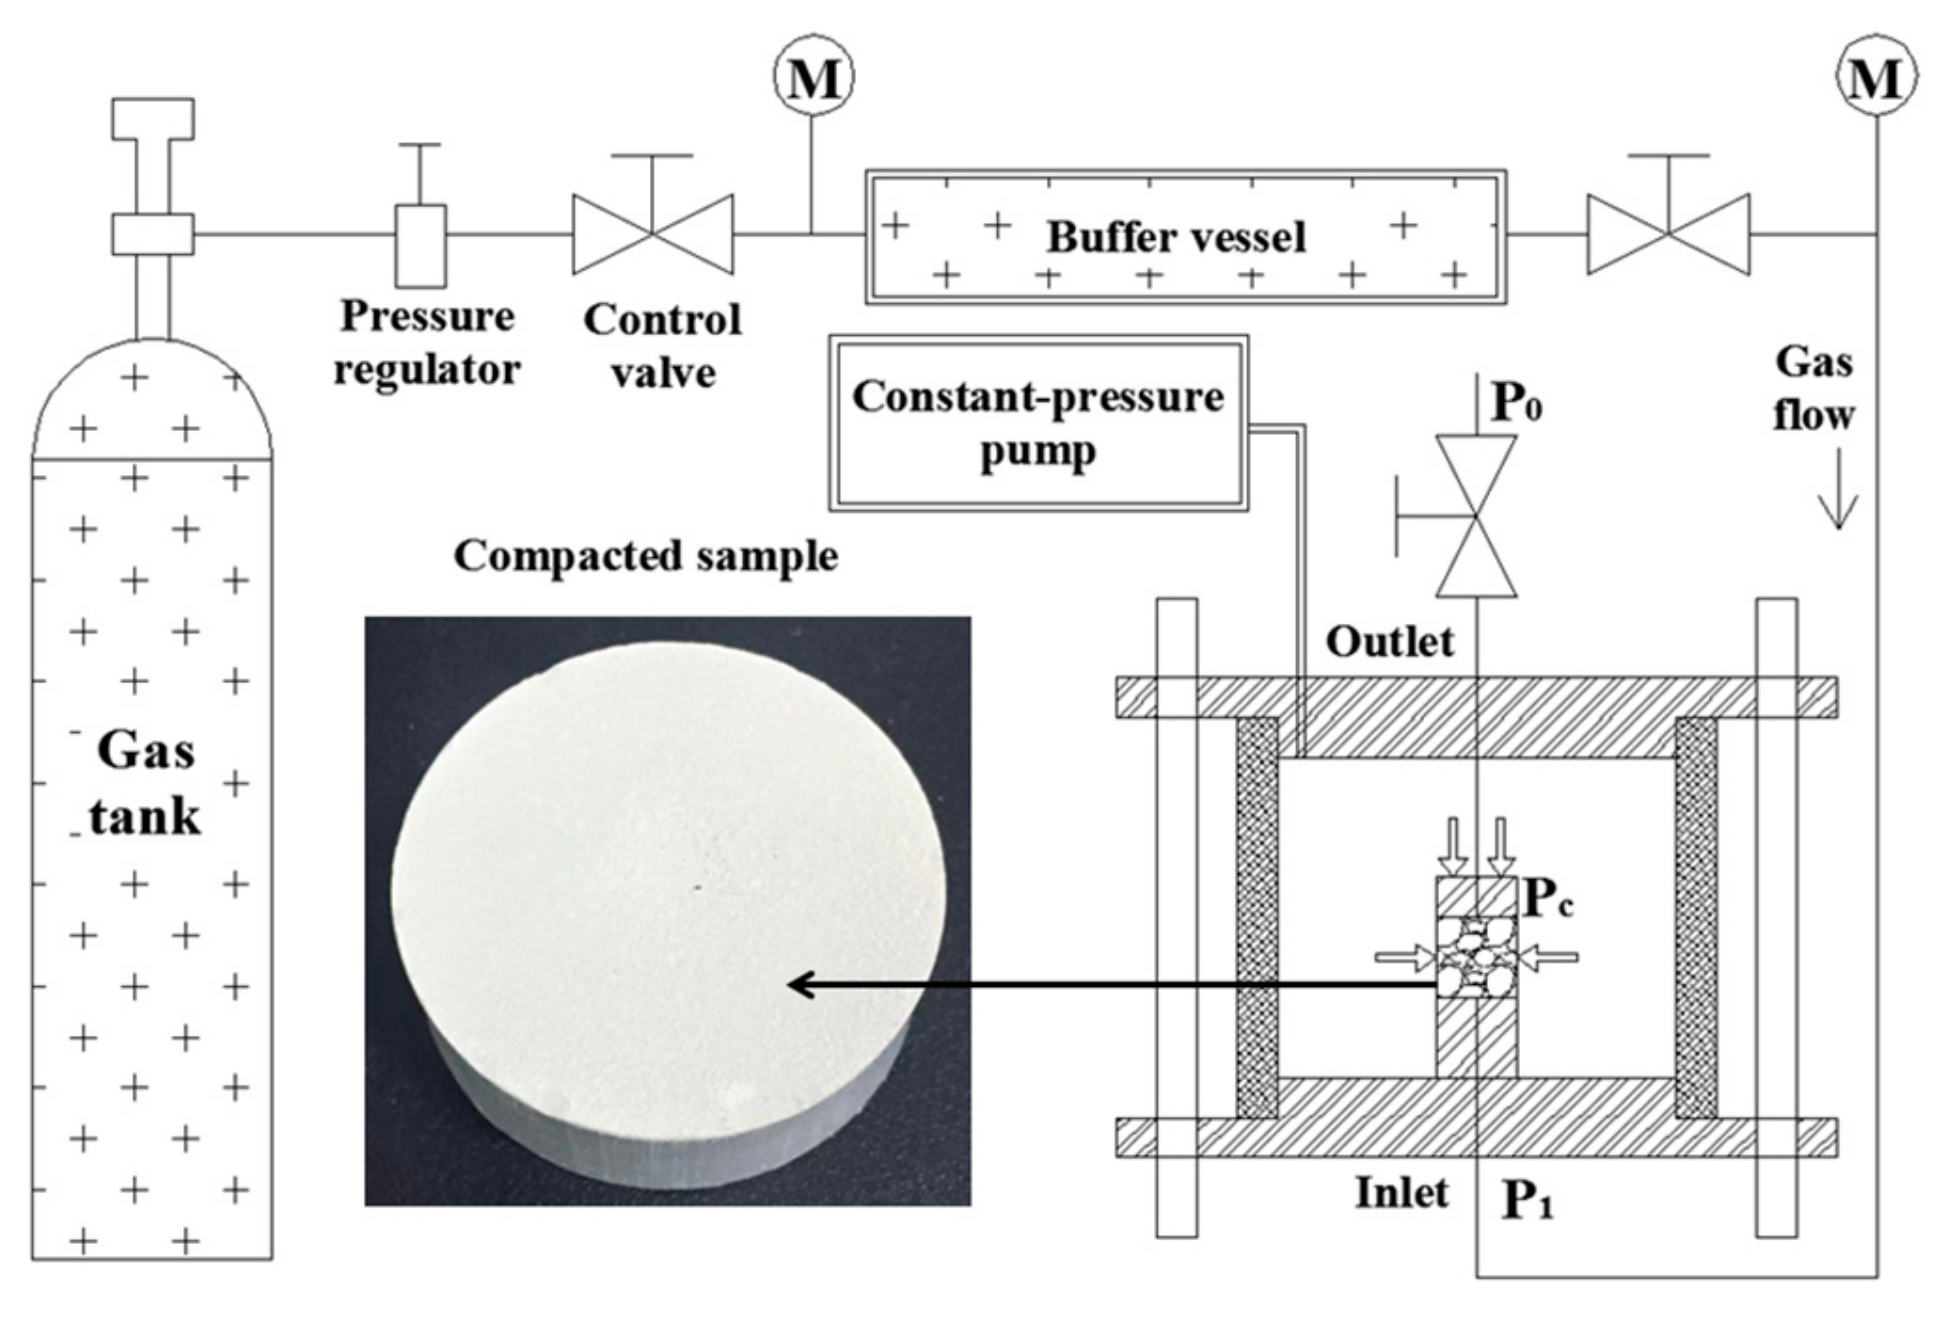
2.1. Apparatus
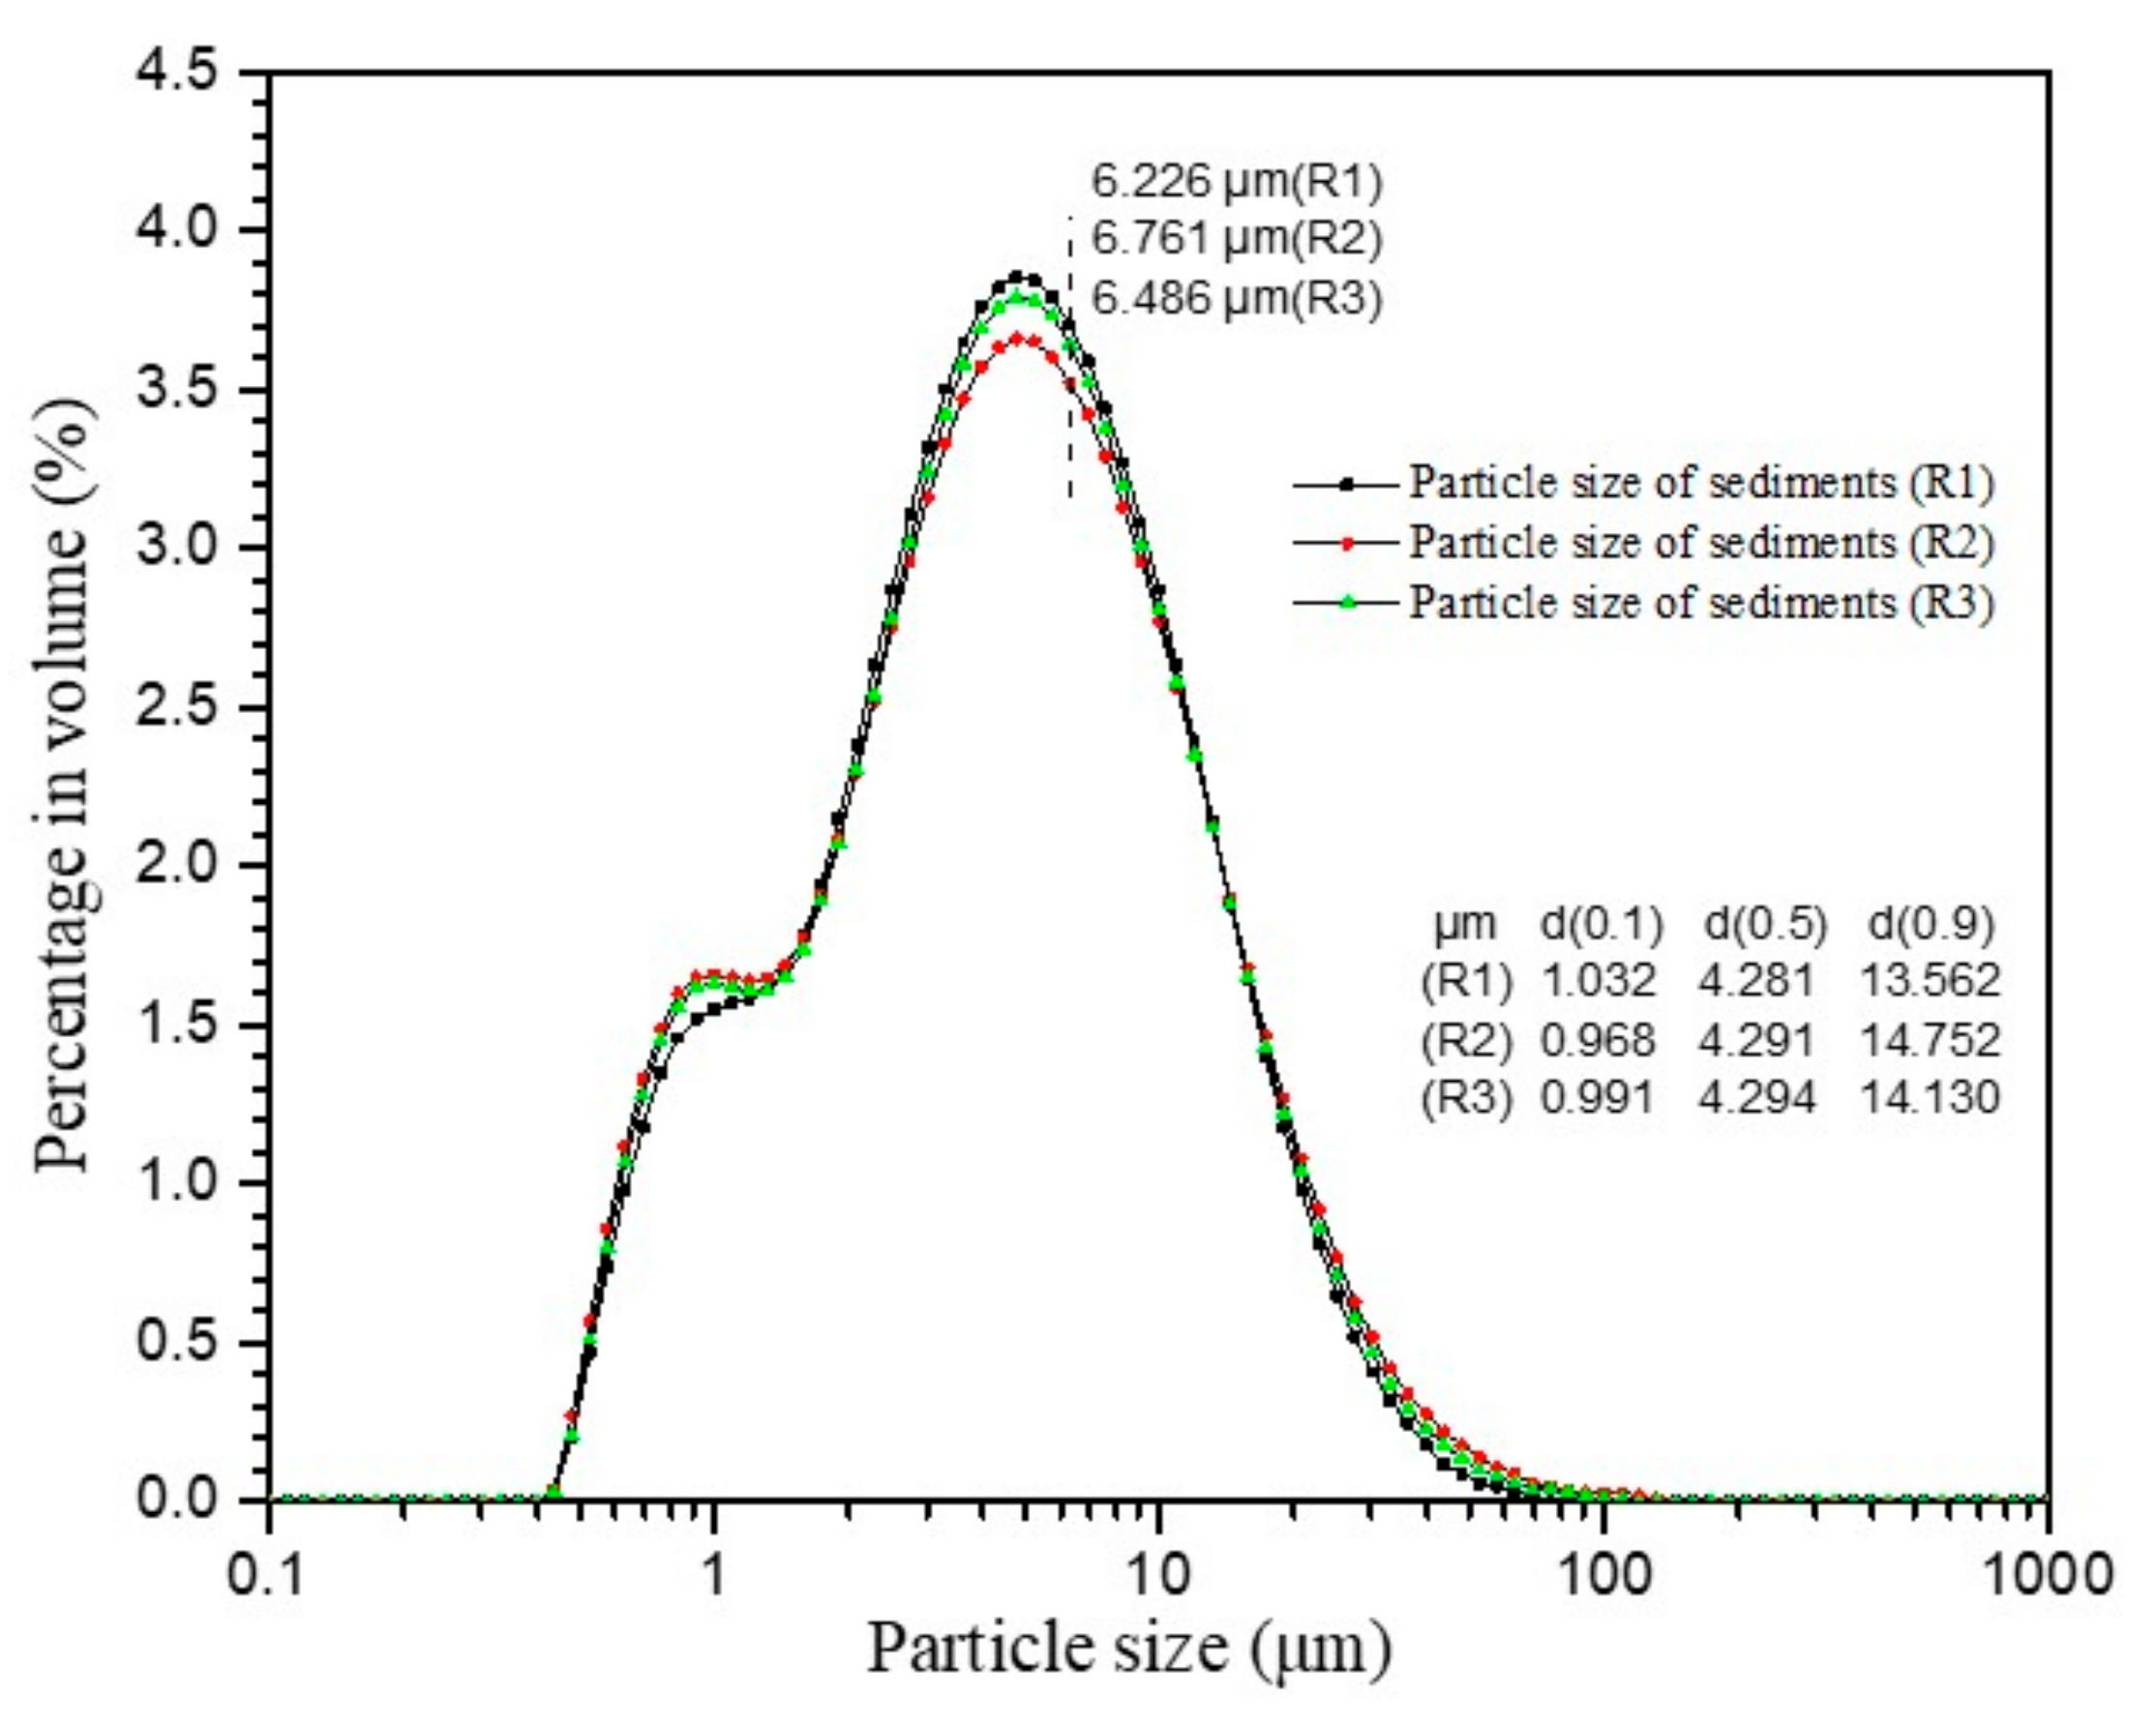
2.2. Materials and Sample Preparation
2.3. Method to Measure Gas Permeability
2.4. The Effective Gas Permeability Results
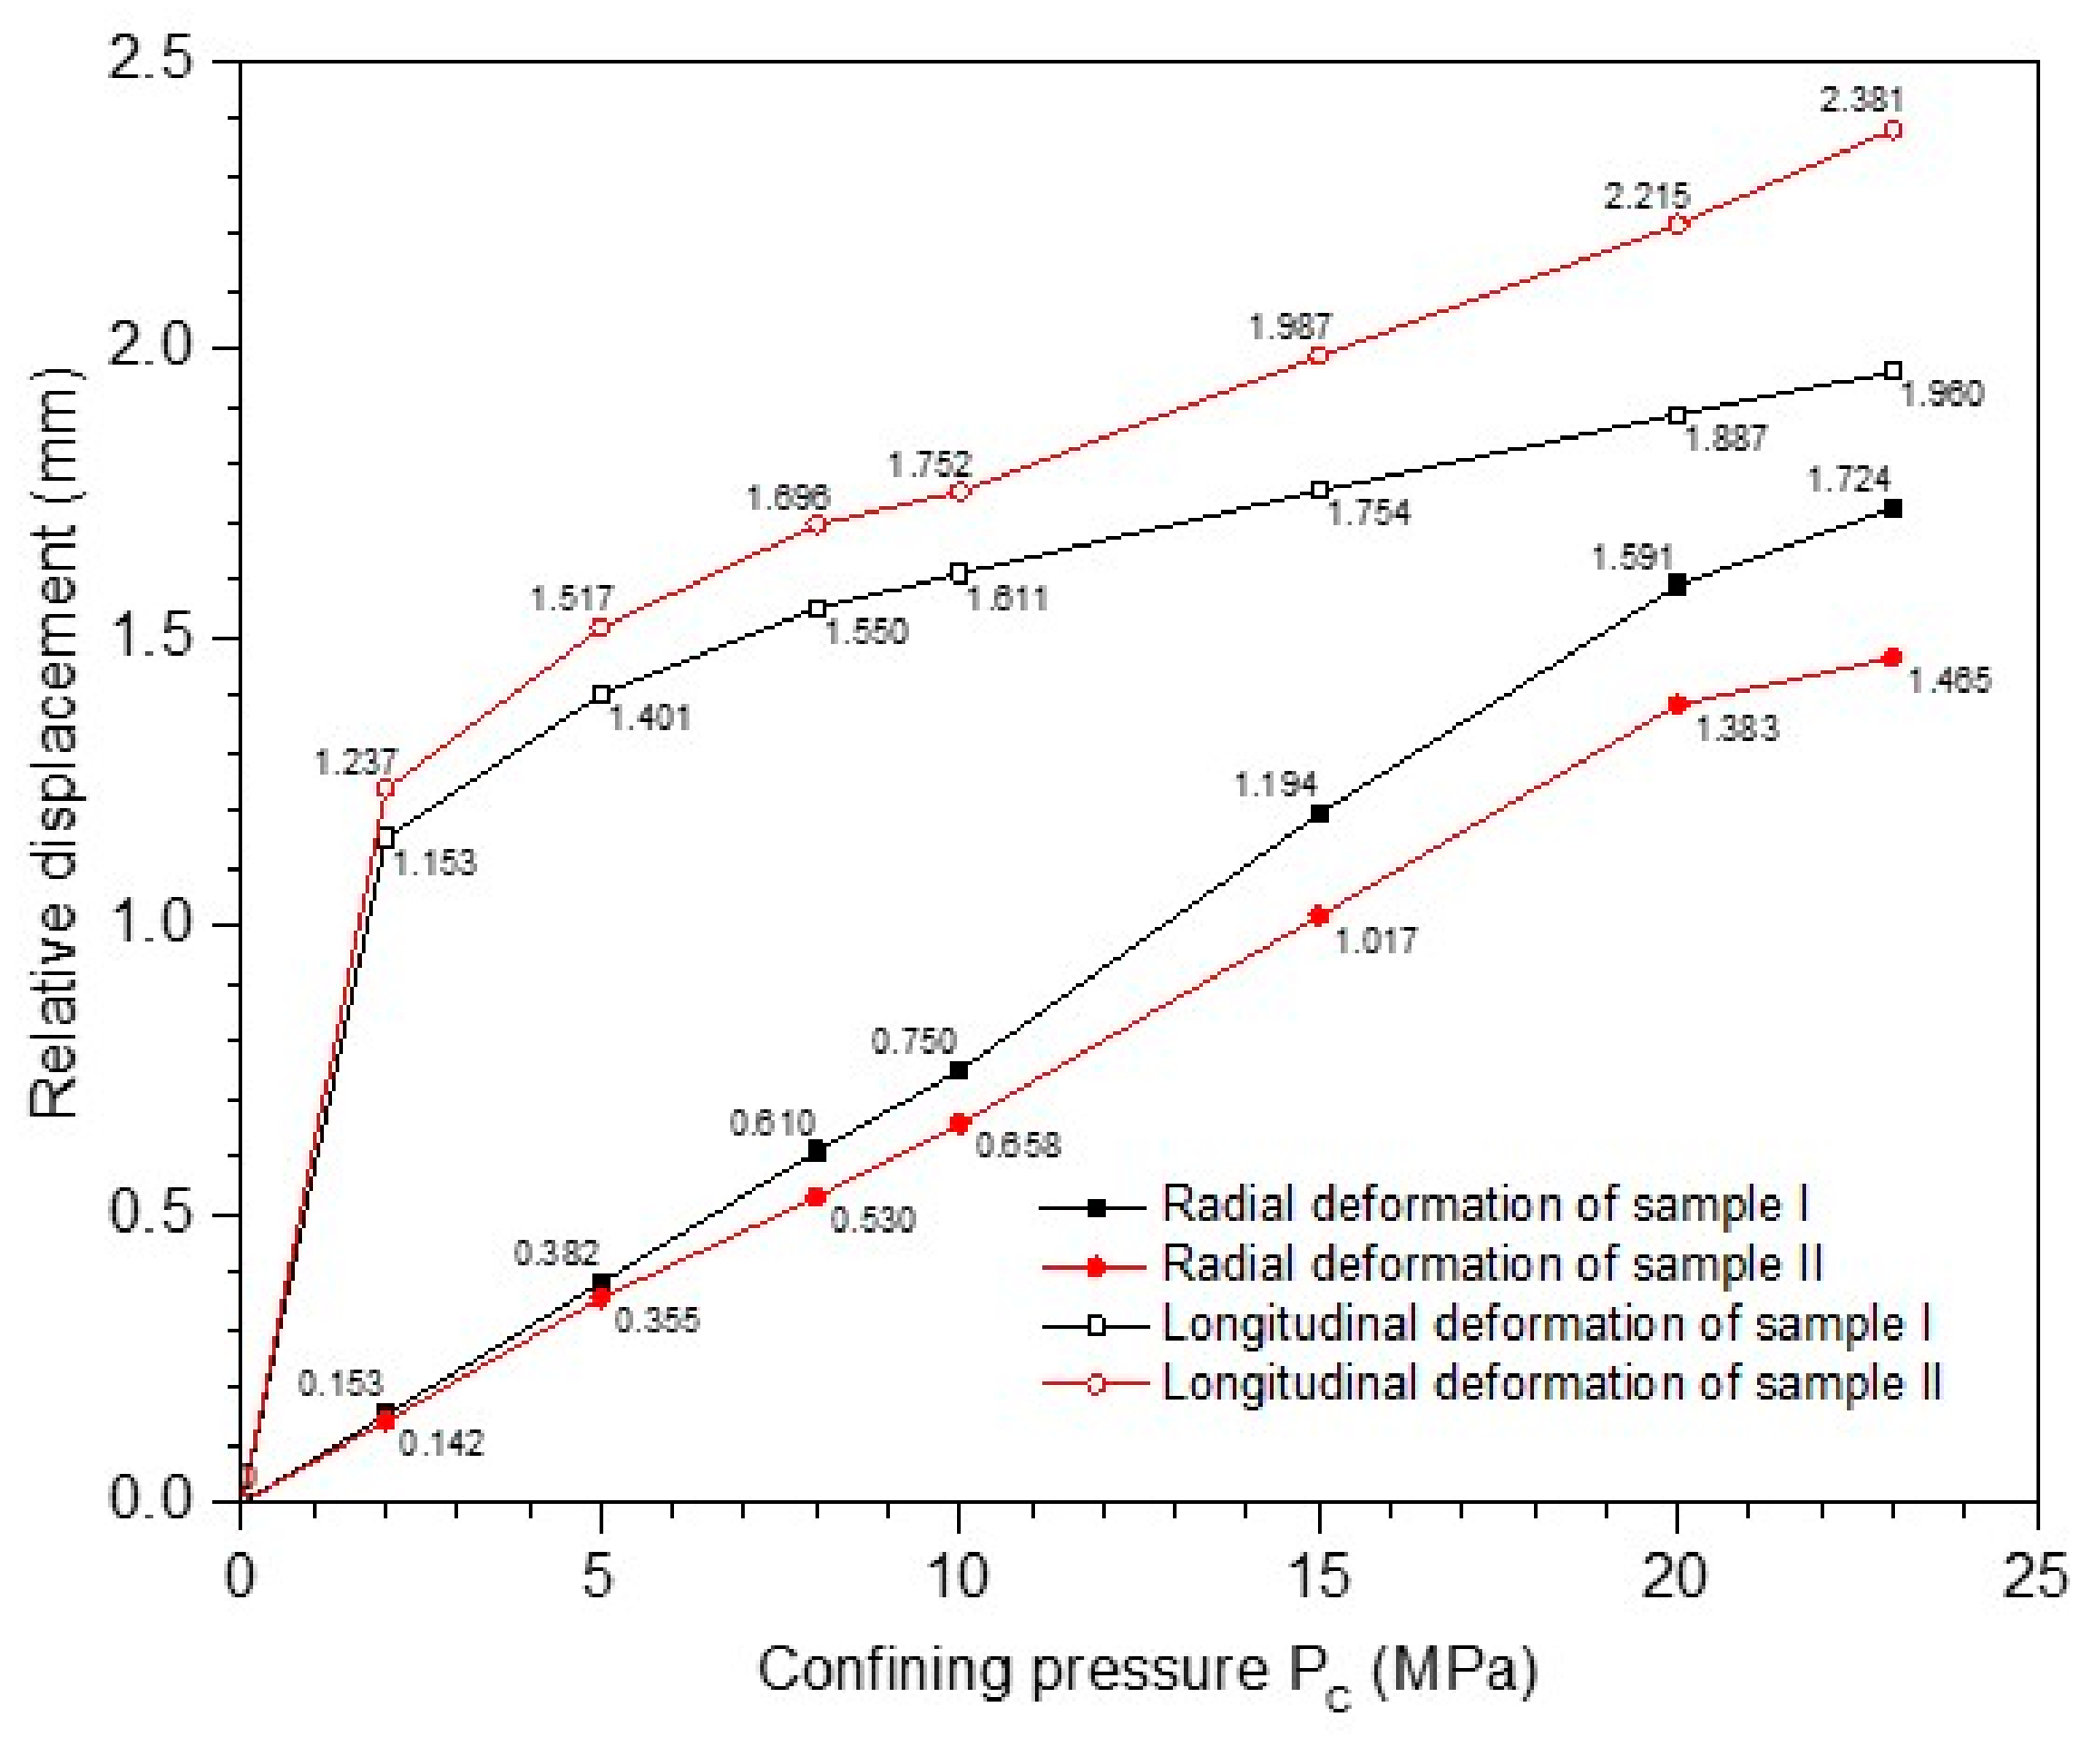
2.4.1. The Relative Displacement
2.4.2. The Variation of Inlet Pressure during the Experiment
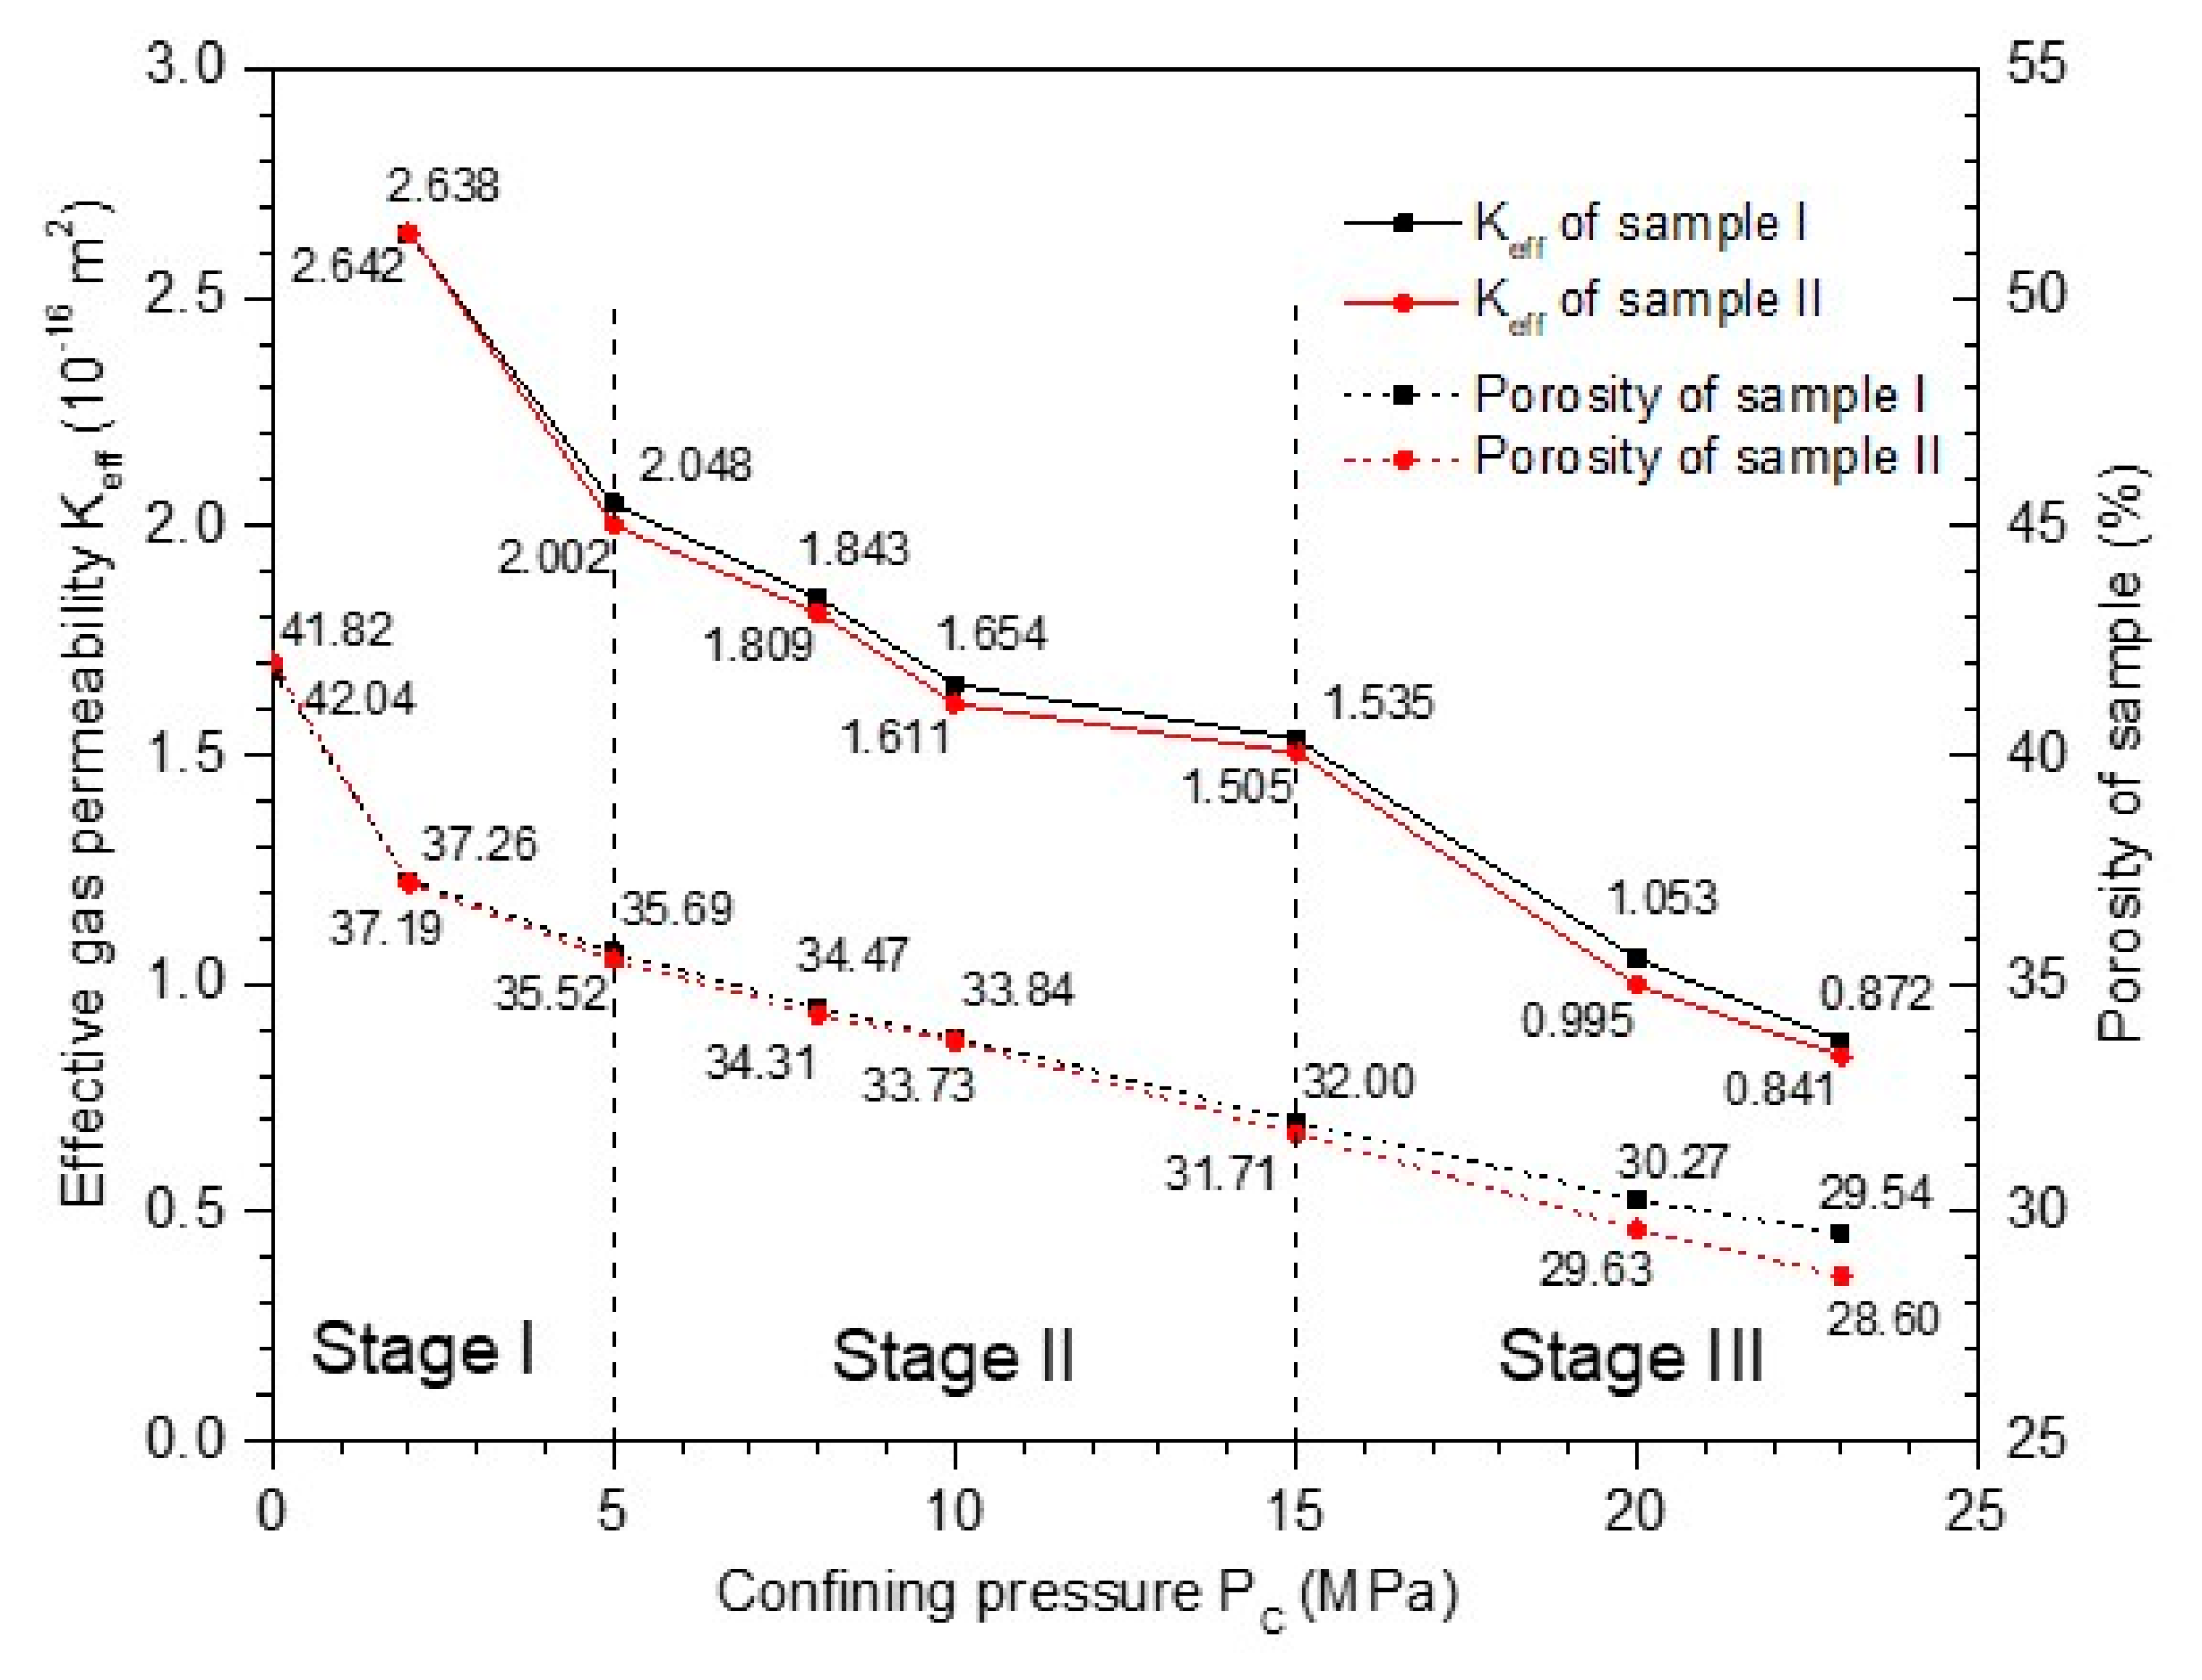
2.4.3. The Effective Gas Permeability and Corresponding Porosity Changes
2.4.4. The Revision of Kozeny–Carman Equation
3. Numerical Models and Simulation Approach
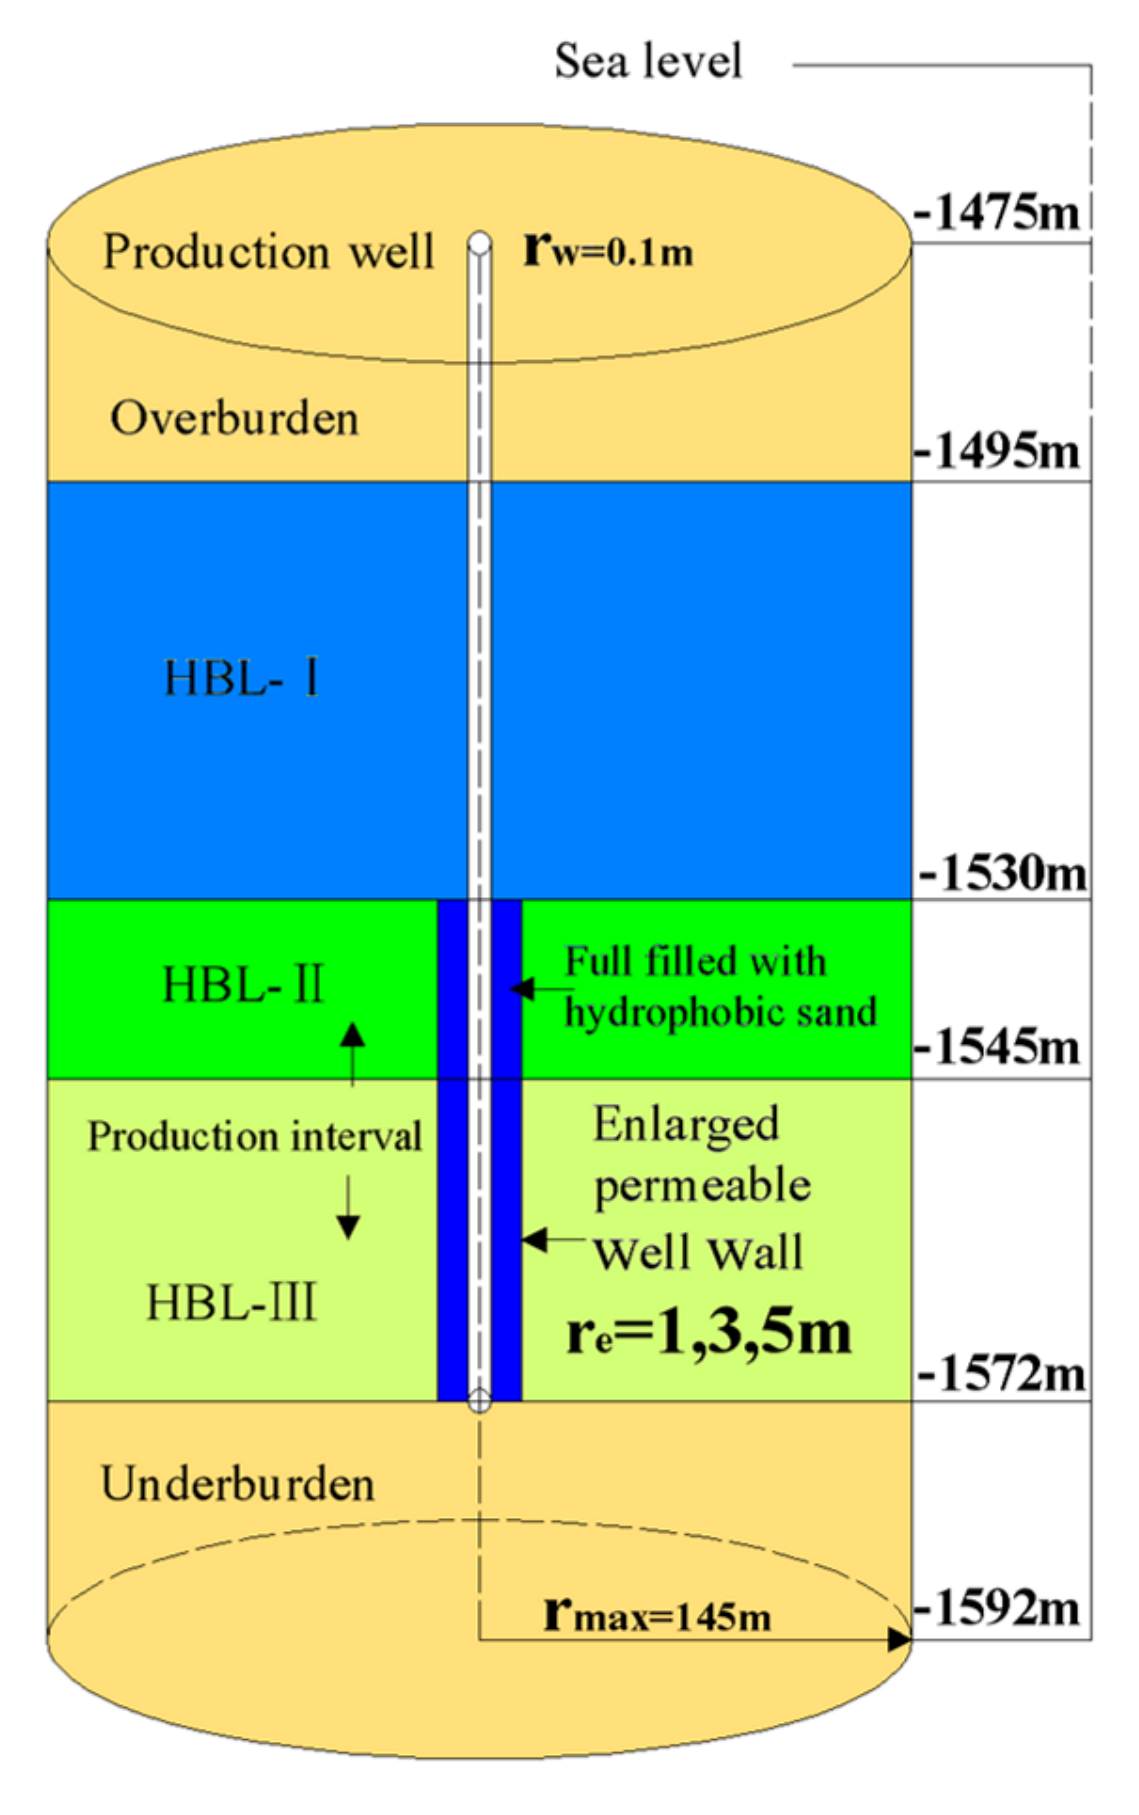
3.1. Geometry and Well Design
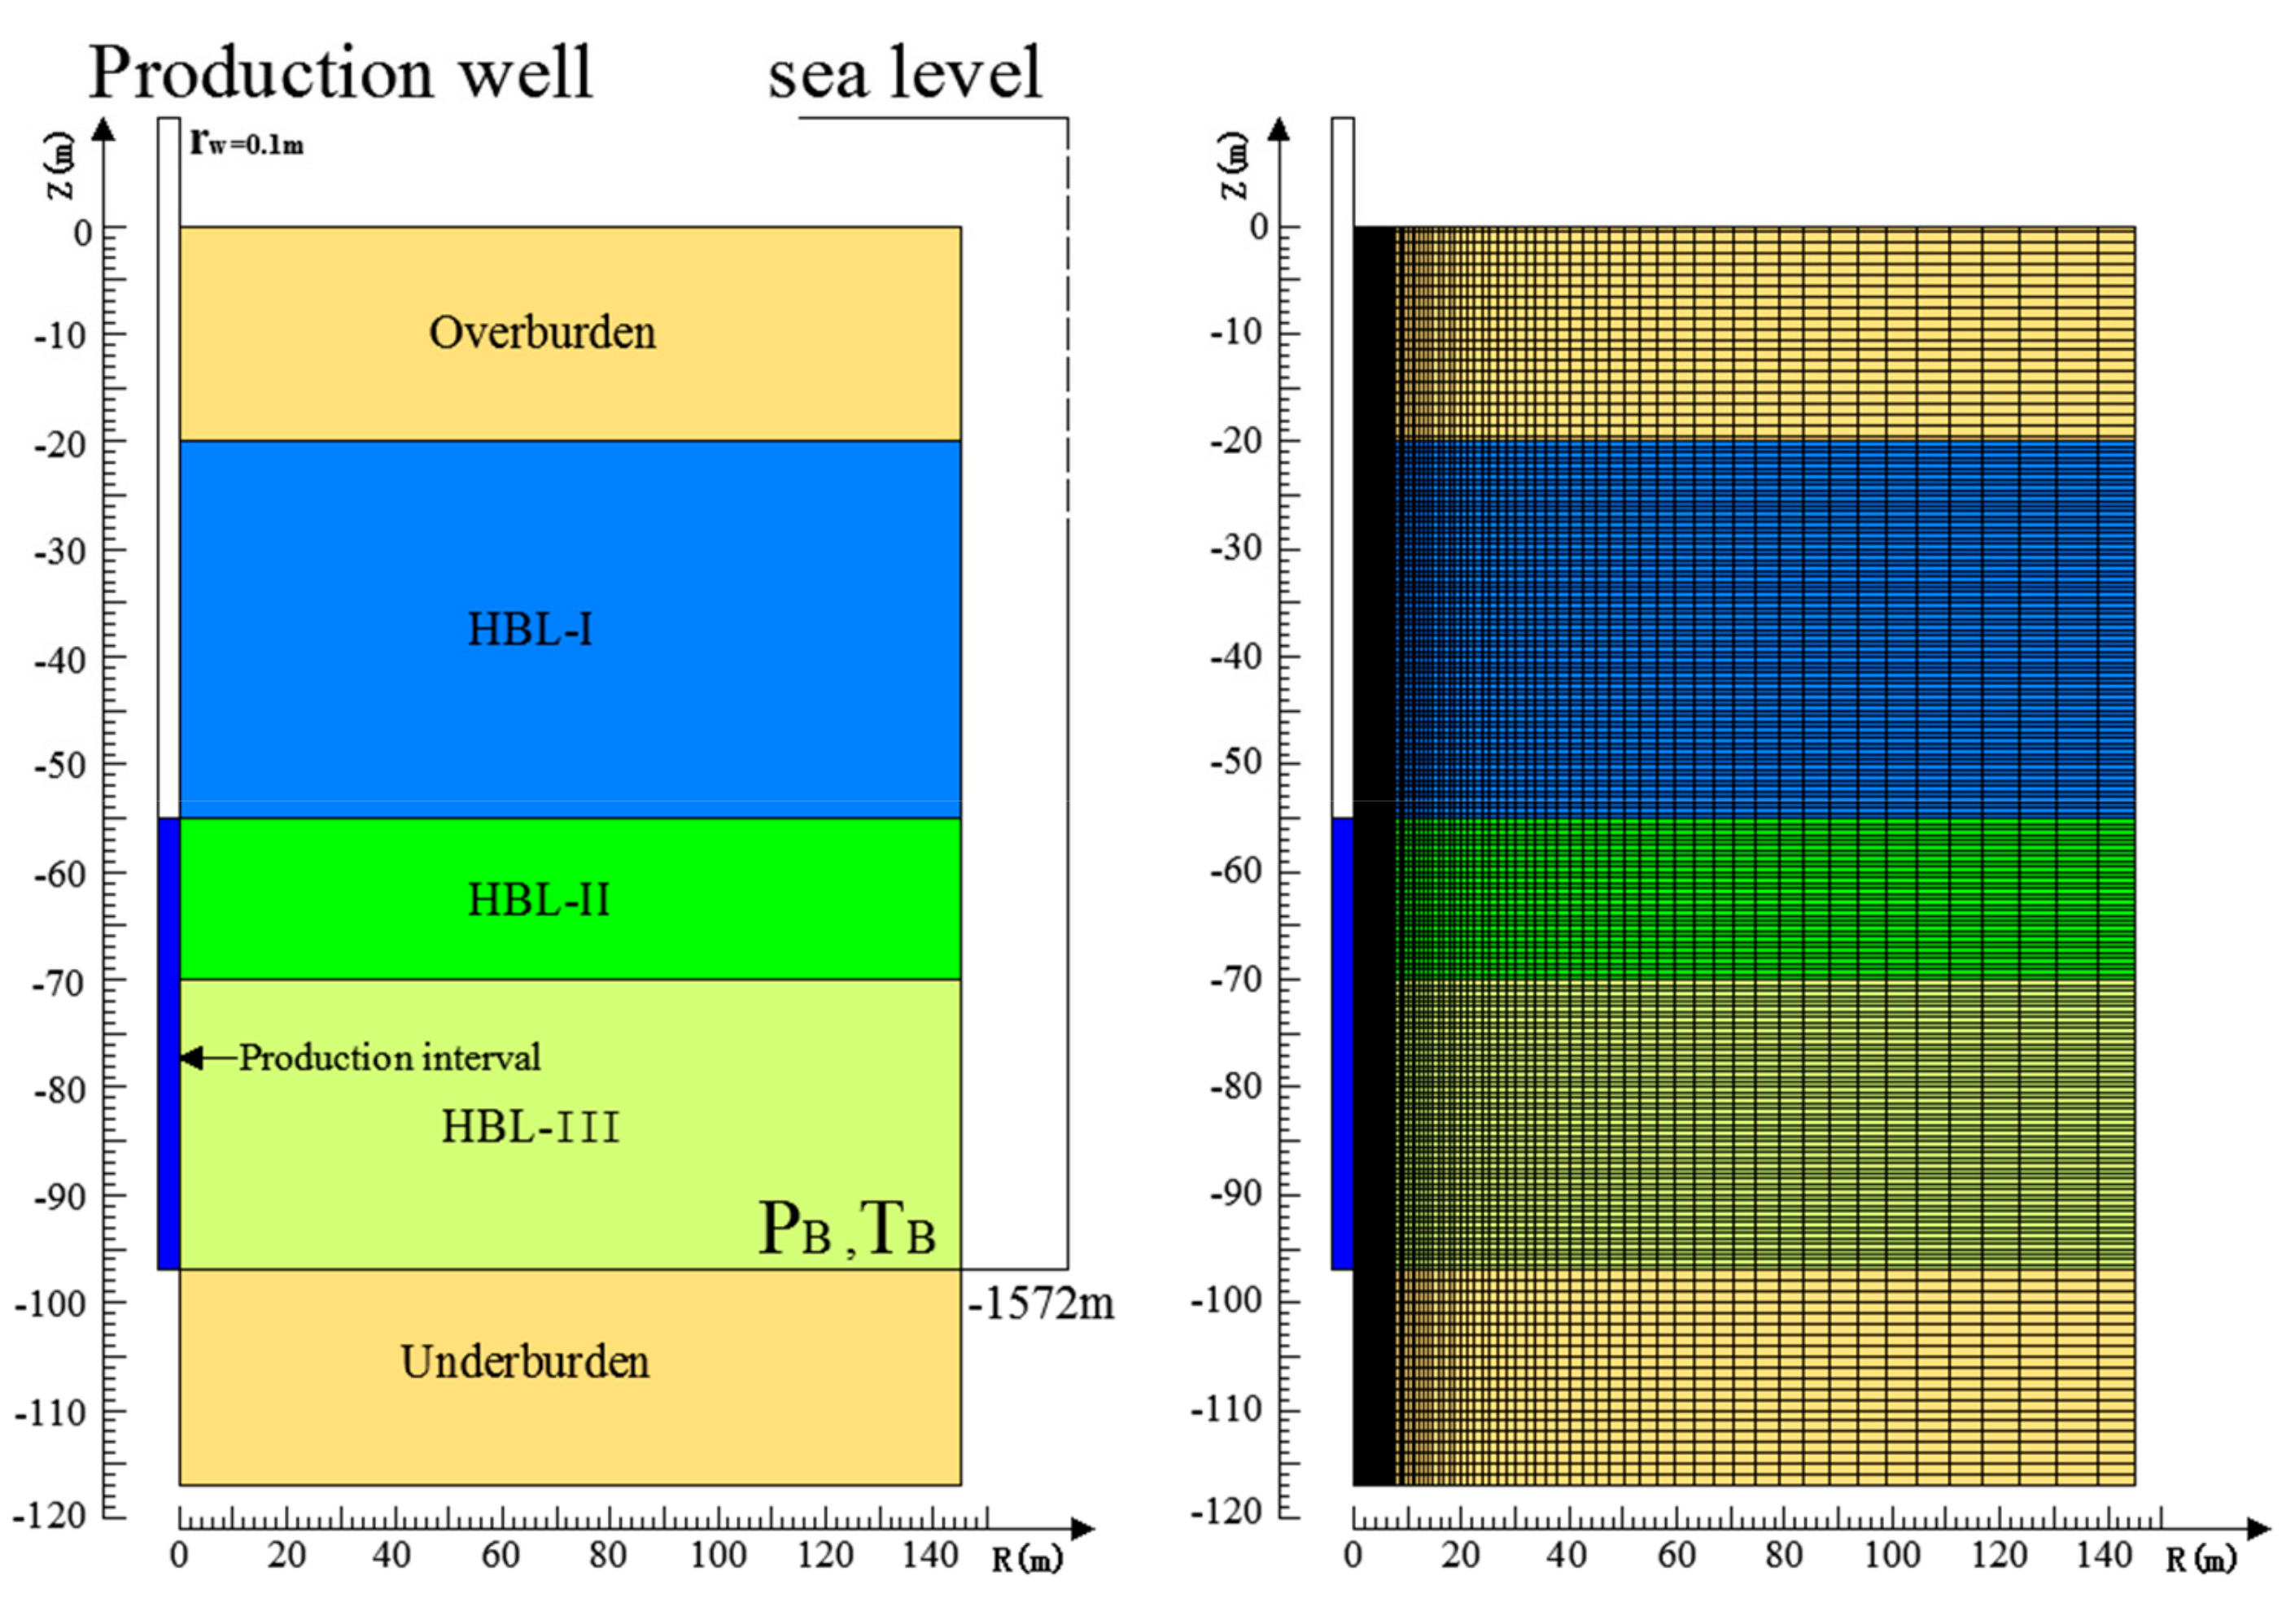
3.2. Domain Discretization, System Properties, and Initial Conditions
4. Simulation Results
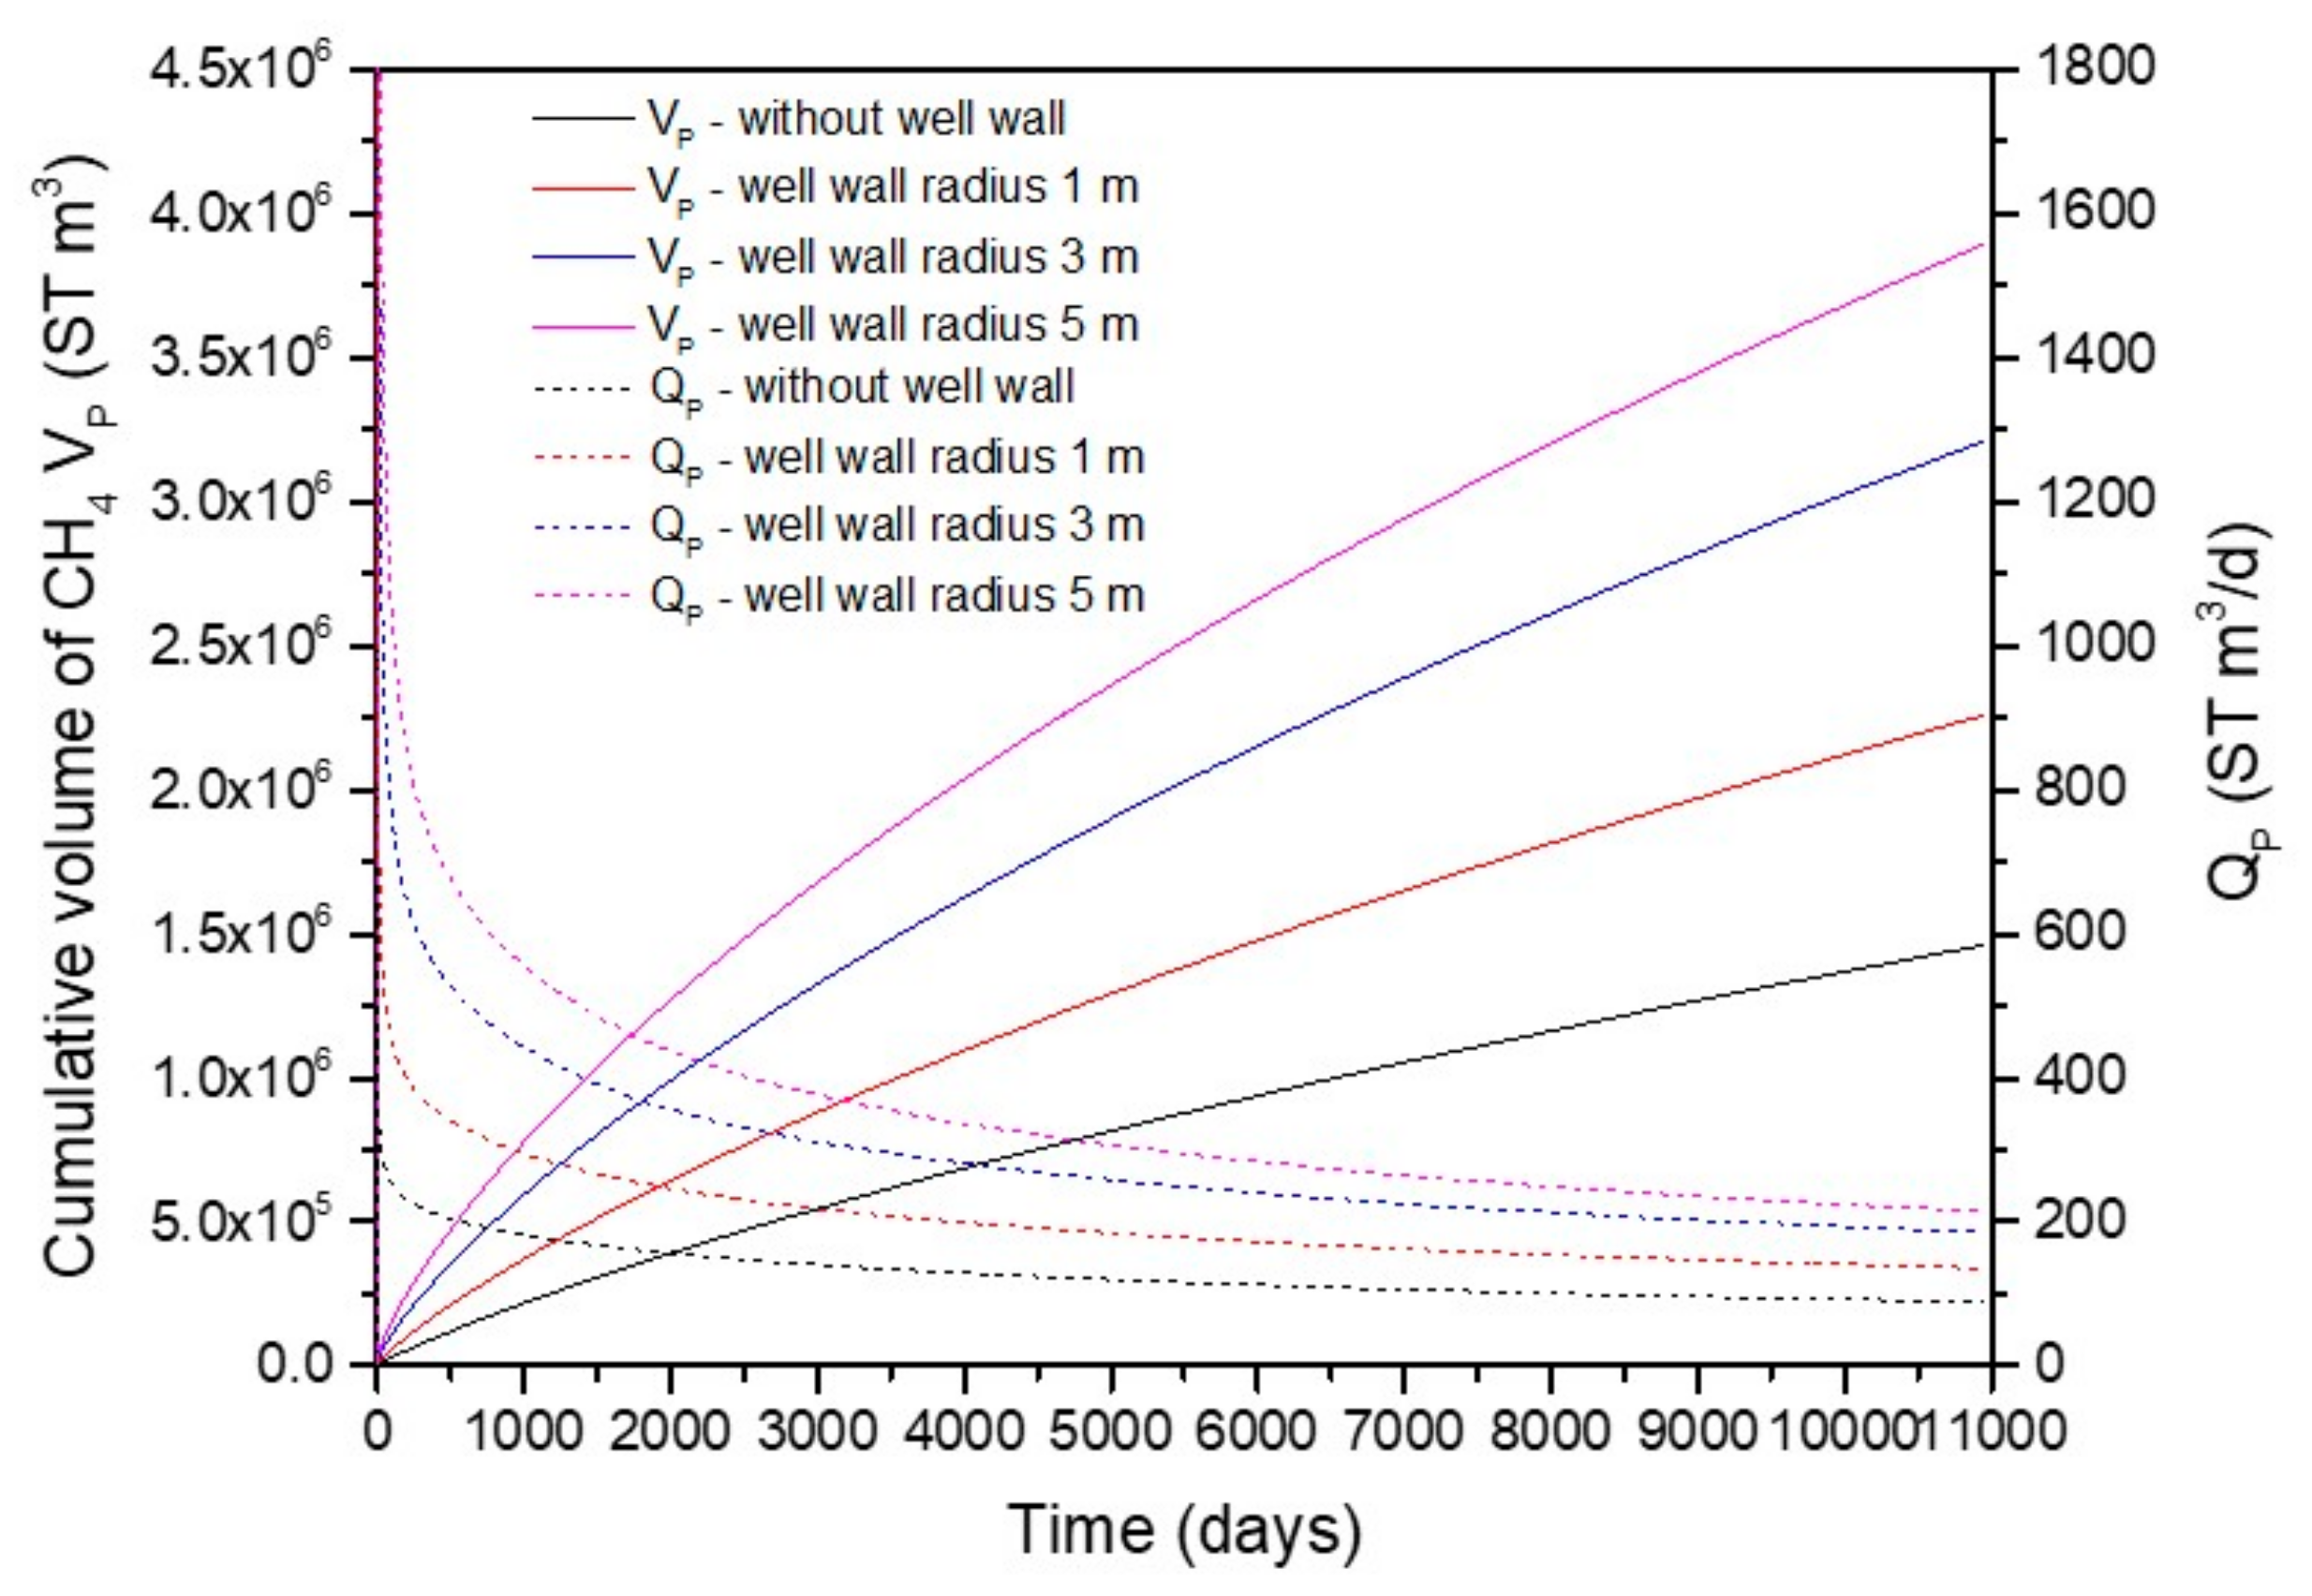
4.1. Gas Production
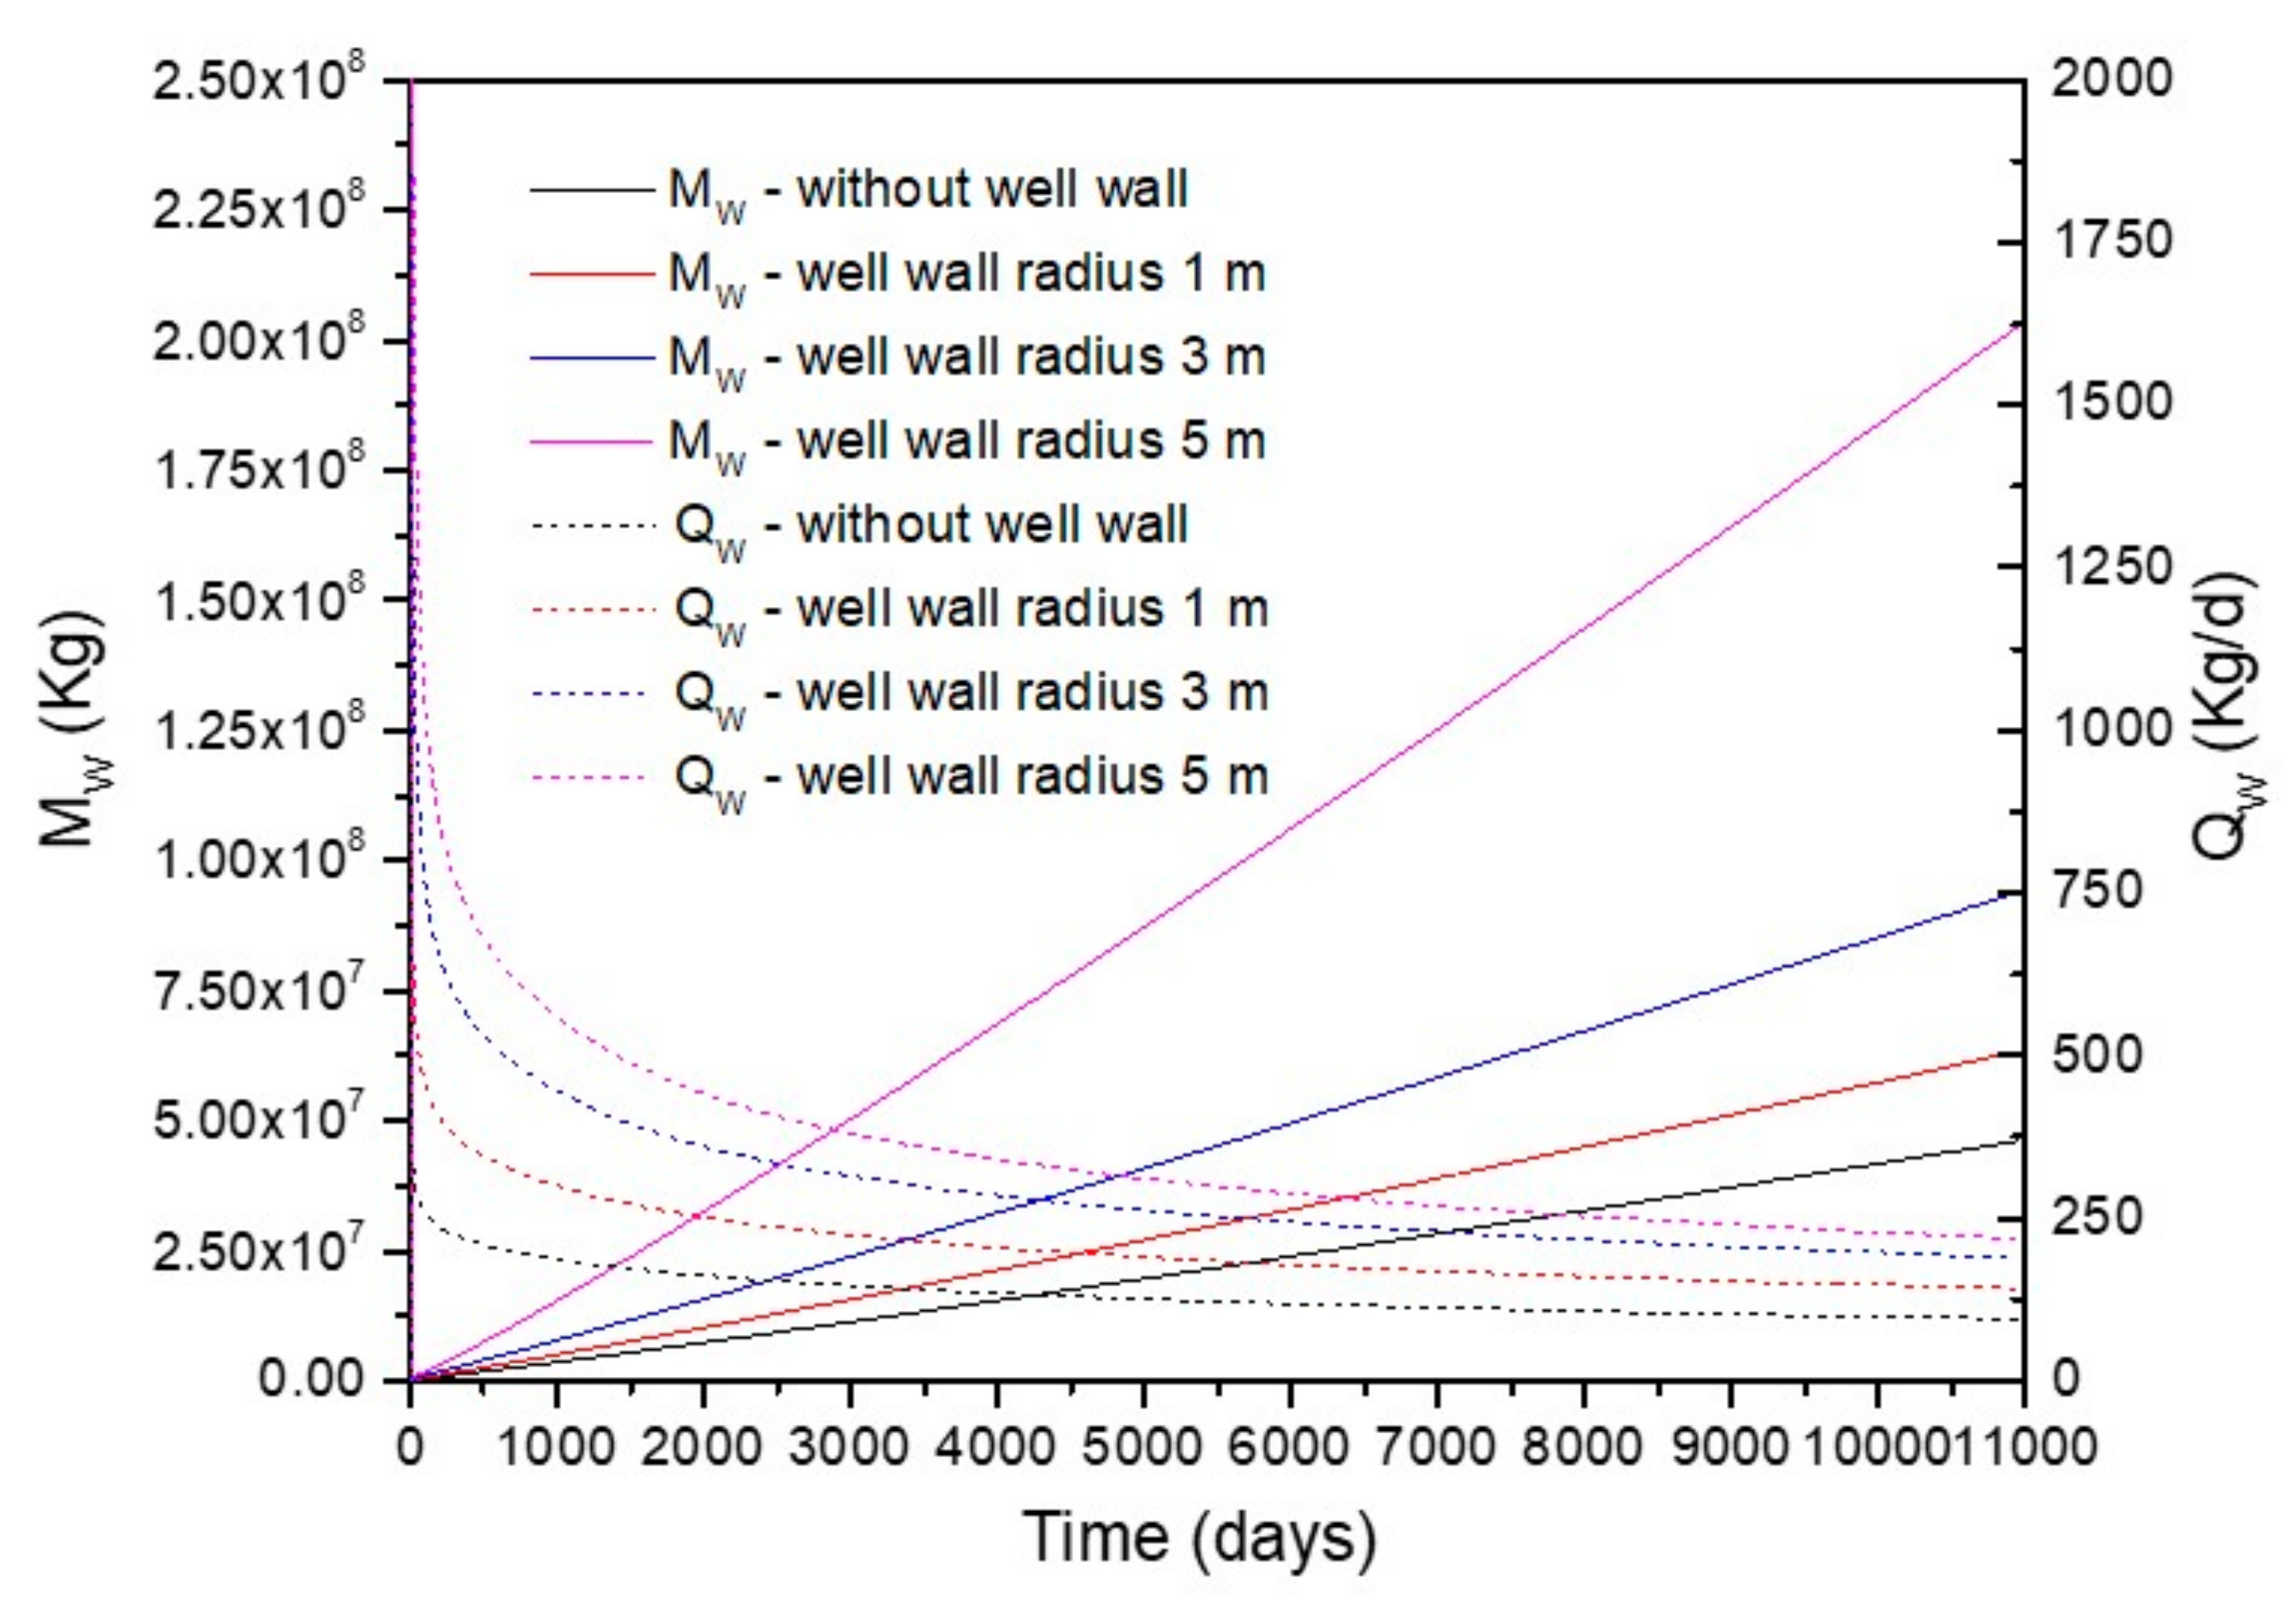
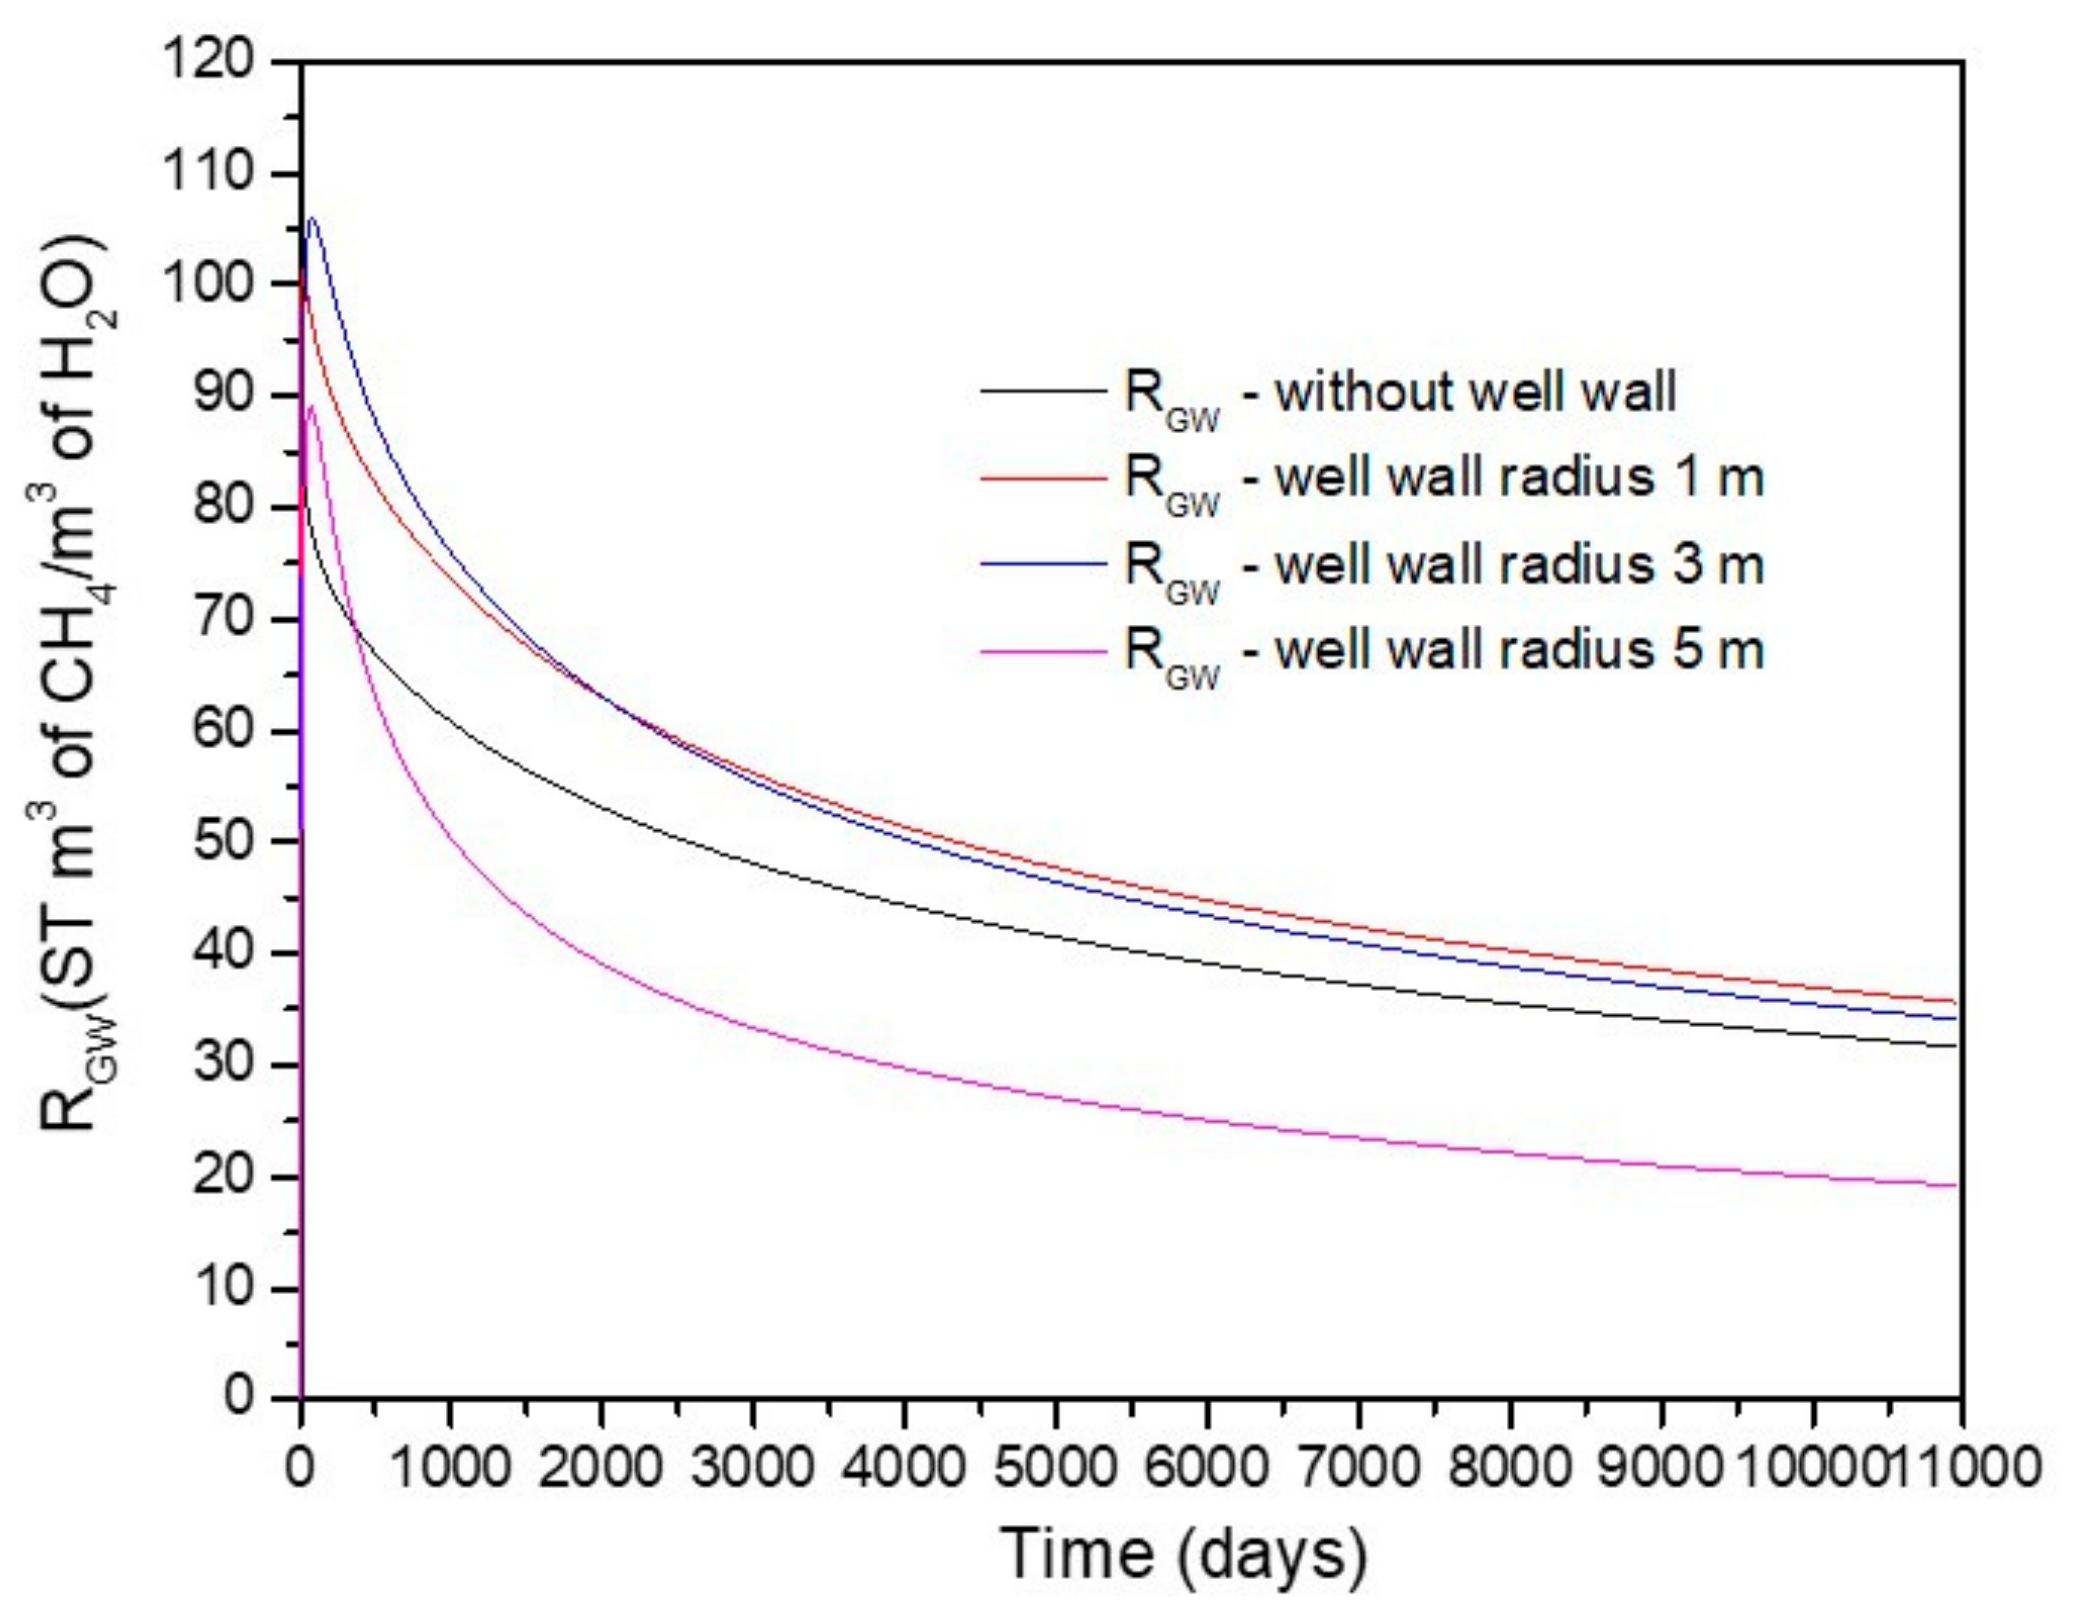
4.2. Water Production and Gas-to-Water Ratio
4.3. Spatial Distributions of Characteristic Parameters
4.3.1. Spatial Distributions of SH
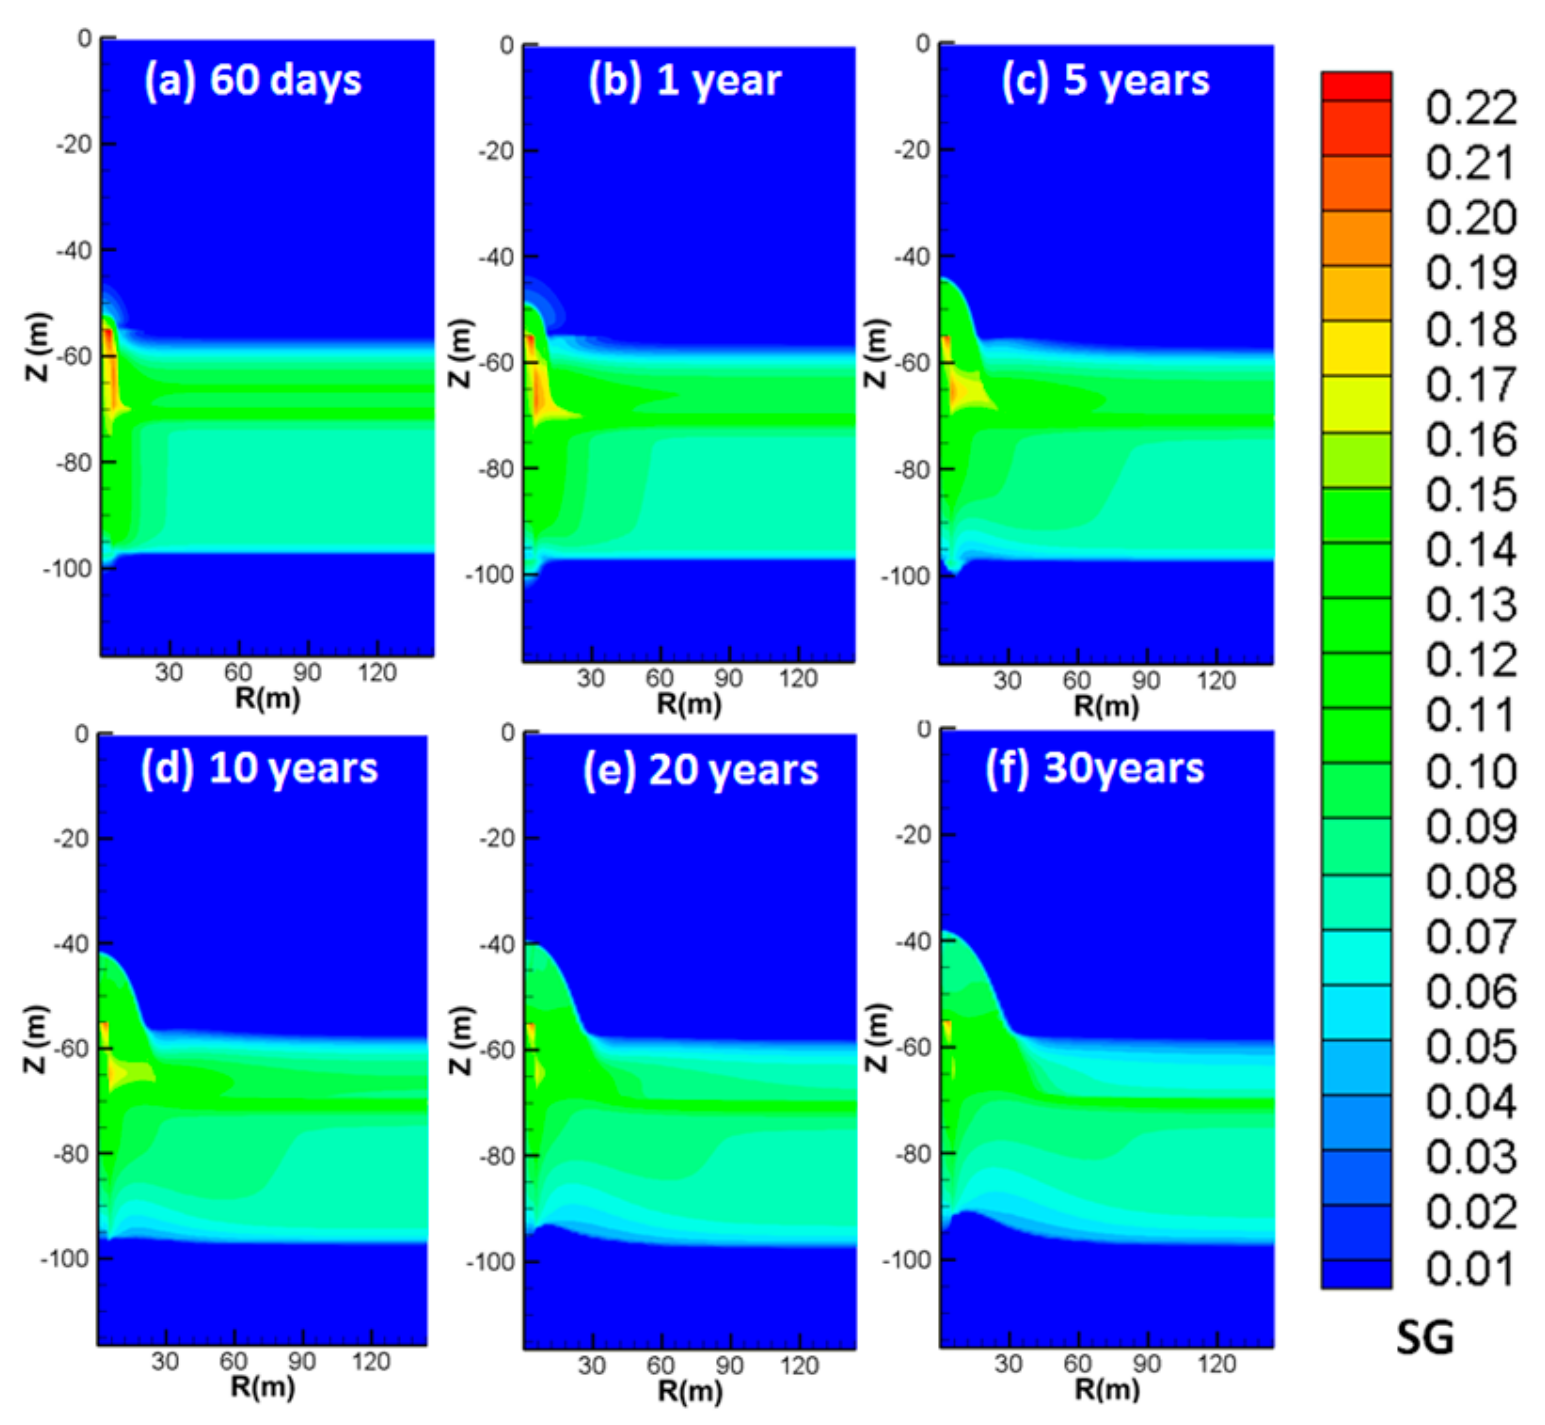
4.3.2. Spatial Distributions of SG
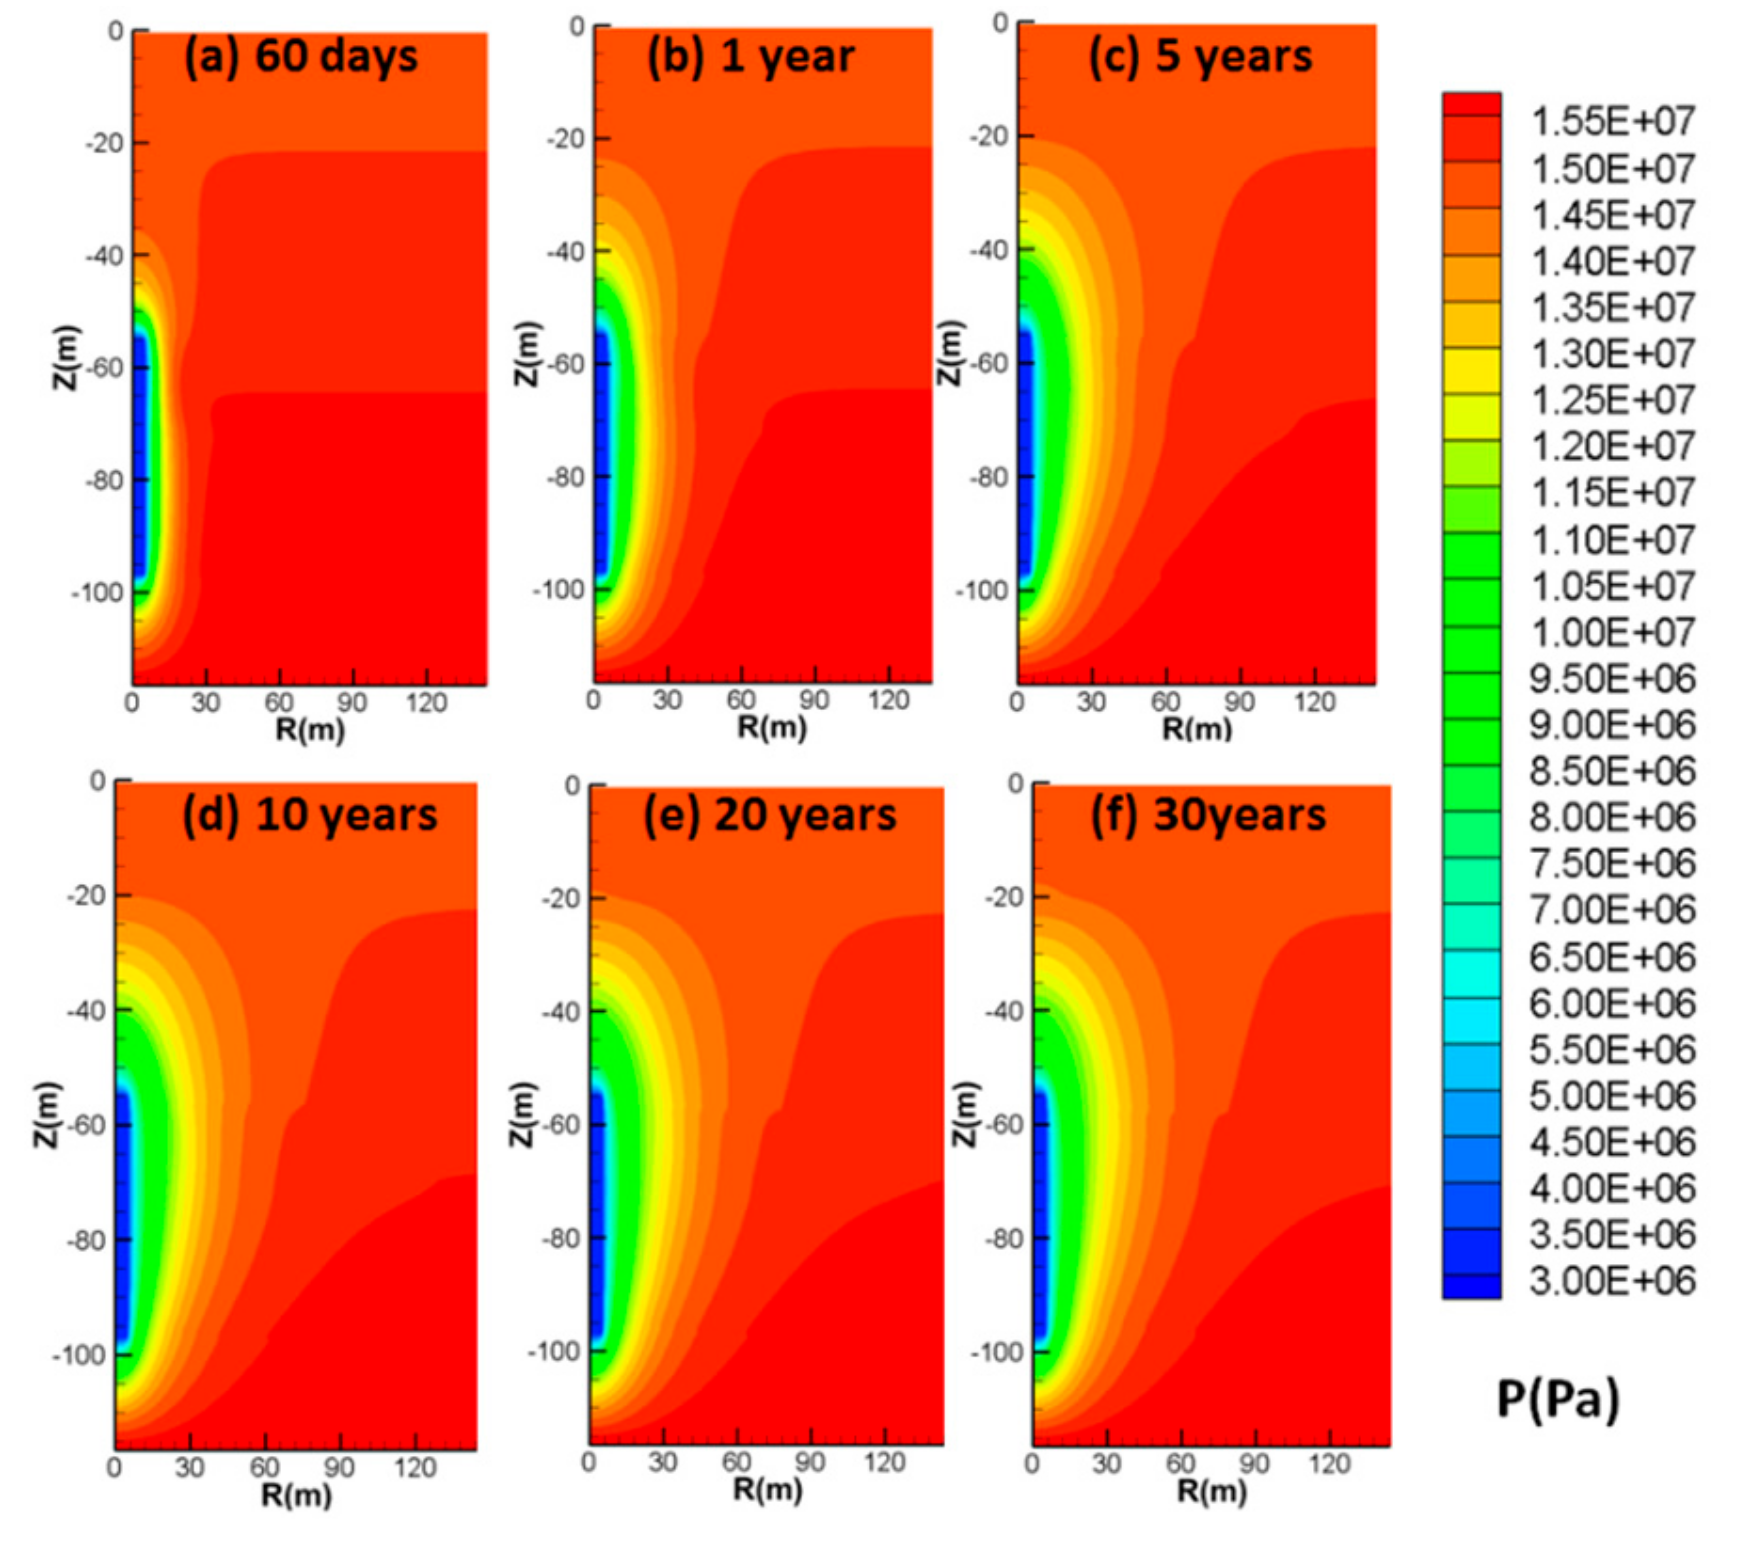
4.3.3. Spatial Distributions of P
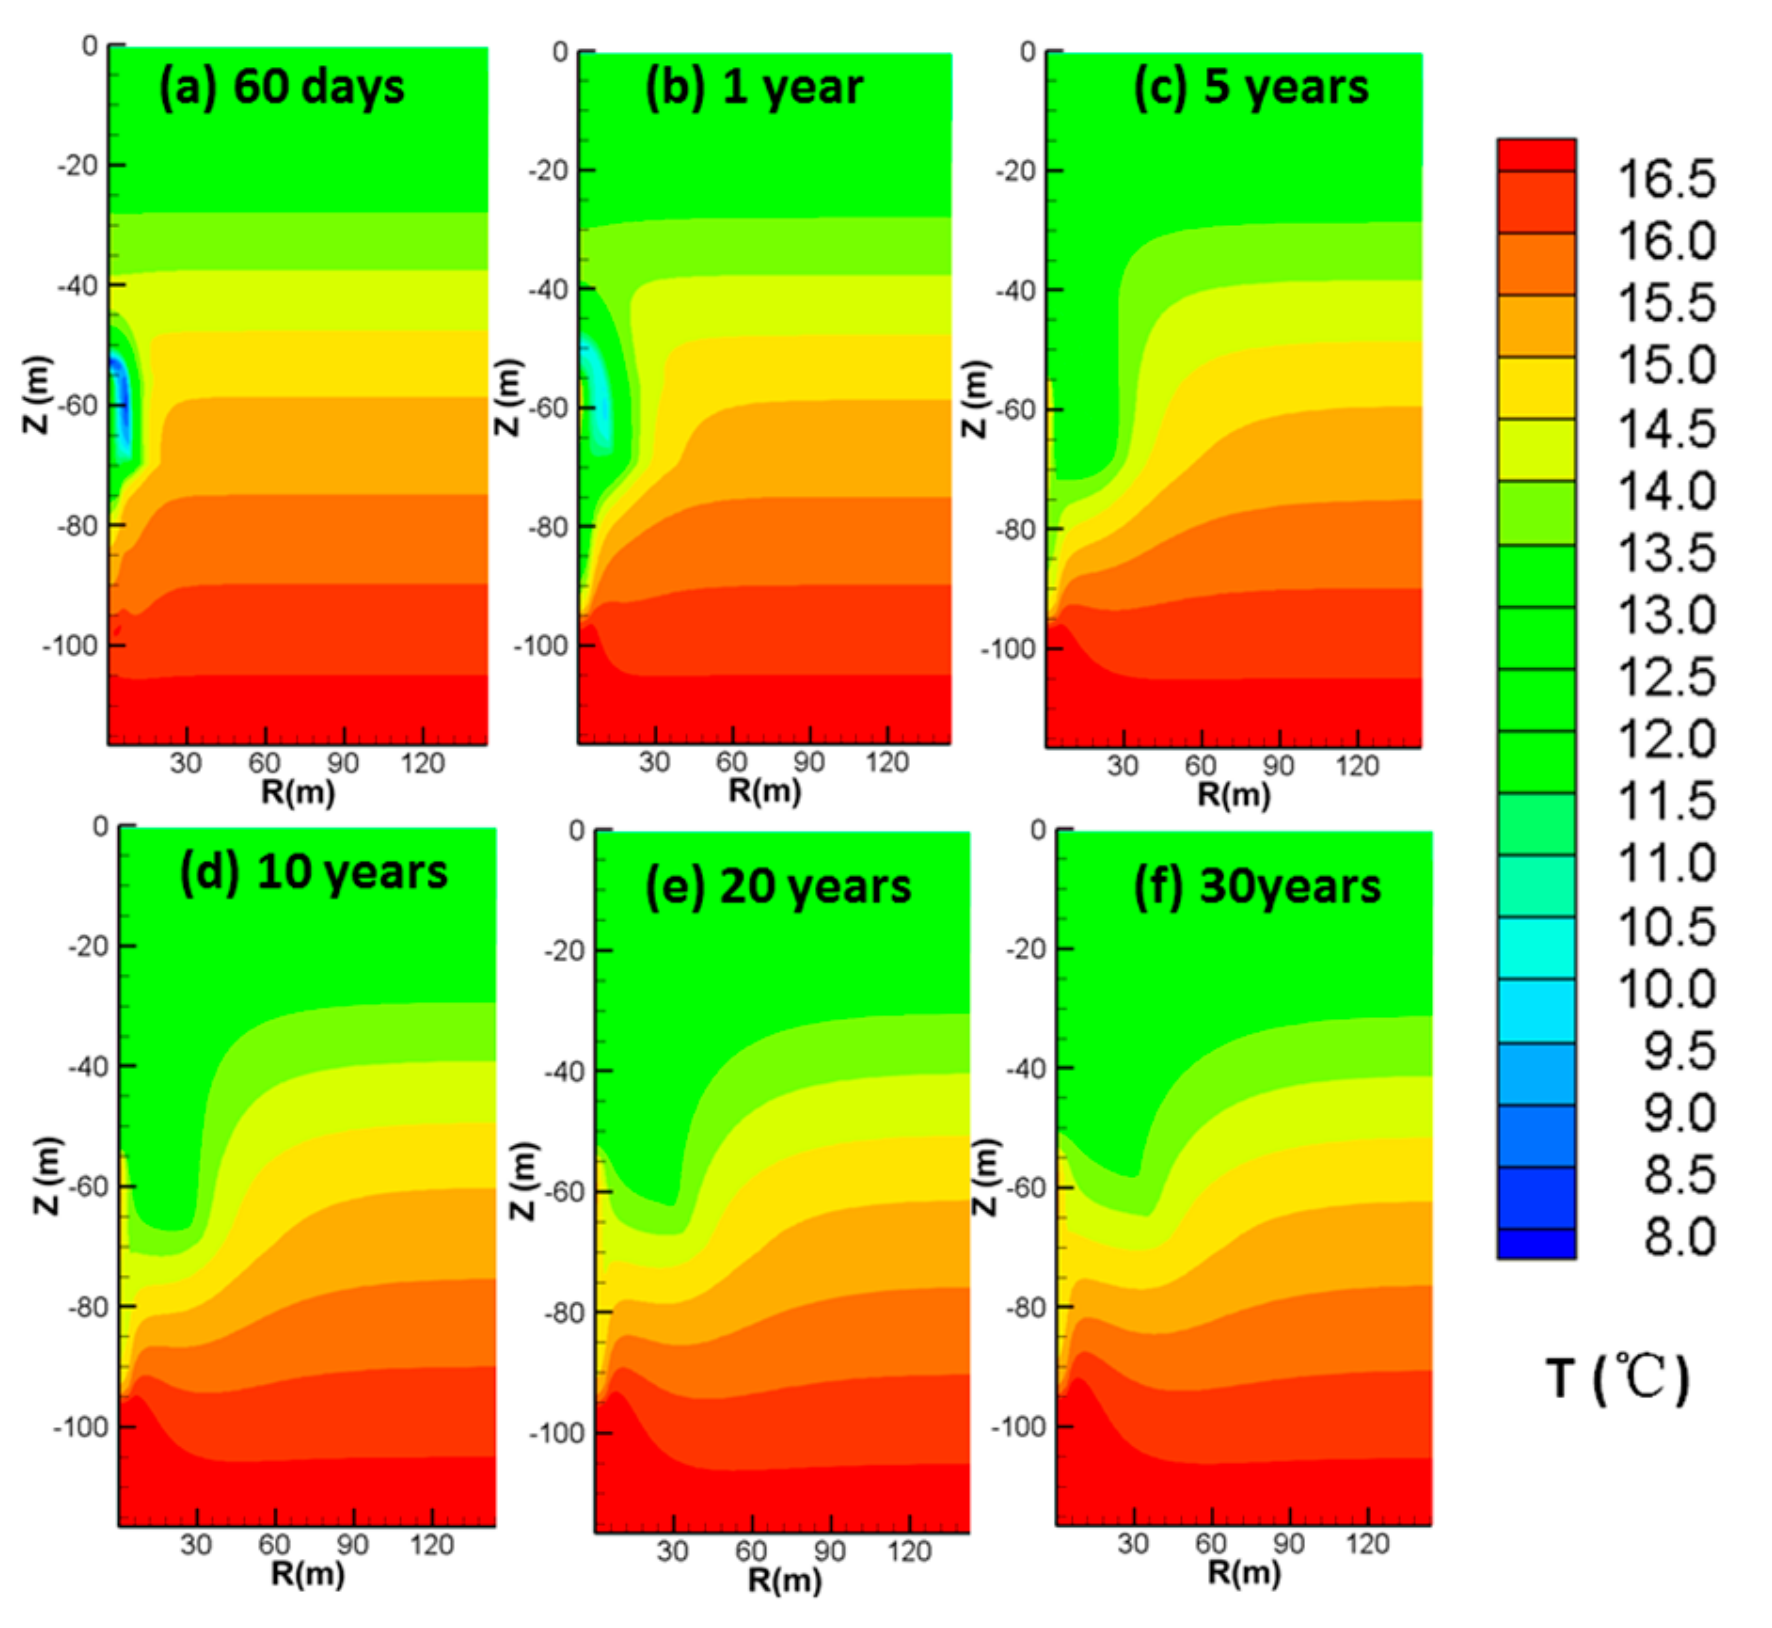
4.3.4. Spatial Distributions of T
5. Conclusions
Author Contributions
Funding
Acknowledgments
Conflicts of Interest
Nomenclature
| G | thermal gradient within the frozen layer (°C/m) |
| k | intrinsic permeability (m2) |
| keff | effective permeability (m2) |
| krA | aqueous relative permeability (m2) |
| krG | gas relative permeability (m2) |
| kΘC | thermal conductivity (W/m/K) |
| kΘRD | thermal conductivity of dry porous medium (W/m/K) |
| kΘRW | thermal conductivity of fully saturated porous medium (W/m/K) |
| P | pressure (Pa) |
| PB | initial pressure at base of HBL (Pa) |
| P0 | atmosphere pressure (Pa) |
| PW | pressure at the well (Pa) |
| ΔPW | driving force of depressurization, PW0−PW (Pa) |
| VP | cumulative volume of produced CH4 (ST m3) |
| MW | cumulative mass of produced water (kg) |
| QP | volumetric rate of methane production at the well (ST m3/d) |
| QW | water mass production rate at the well (kg/d) |
| RGW | gas–to–water production ratio (ST m3 of CH4/m3 of H2O) |
| R, Z | cylindrical coordinates (m) |
| ΔR | discretization along the R−axis (m) |
| ΔZ | discretization along the Z−axis (m) |
| rmax | maximum radius of the simulation domain (m) |
| rw | production well radius (m) |
| re | radius of the permeable well wall (m) |
| S | phase saturation |
| t | time (days) |
| T | temperature (°C) |
| TB | initial temperature at the base of HBL (°C) |
| XS | salinity |
| ΔHc | combustion enthalpy of produced methane (J) |
| Φ | porosity |
| λ | van Genuchten exponent—Table 1 |
| Subscripts and superscripts | |
| 0 | denotes initial state |
| A | aqueous phase |
| B | base of HBL |
| cap | capillary |
| G | gas phase |
| H | solid hydrate phase |
| IrA | irreducible aqueous phase |
| irG | irreducible gas |
| n | permeability reduction exponent—Table 1 |
| nG | gas permeability reduction exponent—Table 1 |
| OB | overburden |
| UB | underburden |
| W | well |
References
- Sloan, E.D.; Koh, C.A. Clathrate Hydrates of Natural Gases, 3rd ed.; CRC Press: Boca Raton, FL, USA, 2007. [Google Scholar]
- Konno, Y.; Fujii, T.; Sato, A.; Akamine, K.; Naiki, M.; Masuda, Y.; Yamamoto, K.; Nagao, J. Key findings of the world’s first offshore methane hydrate production test off the coast of Japan: Toward future commercial production. Energy Fuels 2017, 31, 2607–2616. [Google Scholar] [CrossRef]
- Makogon, Y.F.; Holditch, S.A.; Makogon, T.Y. Natural gas-hydrates—A potential energy source for the 21st Century. J. Petrol. Sci. Eng. 2007, 56, 14–31. [Google Scholar] [CrossRef]
- Makogon, Y.F. Natural gas hydrates—A promising source of energy. J. Nat. Gas. Sci. Eng. 2010, 2, 49–59. [Google Scholar] [CrossRef]
- Chong, Z.R.; Yang, S.H.B.; Babu, P.; Linga, P.; Li, X.S. Review of natural gas hydrates as an energy resource: Prospects and challenges. Appl. Energy 2016, 162, 1633–1652. [Google Scholar] [CrossRef]
- Moridis, G.J.; Reagan, M.I.; Kim, S.J.; Seol, Y.; Zhang, K. Evaluation of the gas production potential of marine hydrate deposits in the Ulleung Basin of the Korean East Sea. SPE J. 2009, 14, 759–781. [Google Scholar] [CrossRef]
- Moridis, G.J.; Kowalsky, M.B.; Pruess, K. Depressurization-induced gas production from class 1 hydrate deposits. SPE Reserv. Eval. Eng. 2007, 10, 458–481. [Google Scholar] [CrossRef]
- Li, B.; Li, X.S.; Li, G.; Feng, J.C.; Wang, Y. Depressurization induced gas production from hydrate deposits with low gas saturation in a pilot-scale hydrate simulator. Appl. Energy 2014, 129, 274–286. [Google Scholar] [CrossRef]
- Ahmadi, G.; Ji, C.A.; Smith, D.H. Production of natural gas from methane hydrate by a constant downhole pressure well. Energy Convers. Manag. 2007, 48, 2053–2068. [Google Scholar] [CrossRef]
- Li, G.; Moridis, G.J.; Zhang, K.; Li, X.S. The use of huff and puff method in a single horizontal well in gas production from marine gas hydrate deposits in the Shenhu Area of South China Sea. J. Petrol. Sci. Eng. 2011, 77, 49–68. [Google Scholar] [CrossRef]
- Li, X.S.; Li, B.; Li, G.; Yang, B. Numerical simulation of gas production potential from permafrost hydrate deposits by huff and puff method in a single horizontal well in Qilian Mountain, Qinghai province. Energy 2012, 40, 59–75. [Google Scholar] [CrossRef]
- Li, S.; Zhang, L.; Jiang, X.; Li, X. Hot-brine injection for the dissociation of natural gas hydrates. Pet. Sci. Technol. 2013, 31, 1320–1326. [Google Scholar] [CrossRef]
- Li, G.; Li, X.S.; Tang, L.G.; Zhang, Y. Experimental investigation of production behavior of methane hydrate under ethylene glycol stimulation in unconsolidated sediment. Energy Fuels 2007, 21, 3388–3393. [Google Scholar] [CrossRef]
- Yuan, Q.; Sun, C.Y.; Yang, X.; Ma, P.C.; Ma, Z.W.; Li, Q.P. Gas production from methane-hydrate-bearing sands by ethylene glycol injection using a three-dimensional reactor. Energy Fuels 2011, 25, 3108–3115. [Google Scholar] [CrossRef]
- Lee, J. Experimental study on the dissociation behavior and productivity of gas hydrate by brine injection scheme in porous rock. Energy Fuels 2010, 24, 456–463. [Google Scholar] [CrossRef]
- Ota, M.; Morohashi, K.; Abe, Y.; Watanabe, M.; Smith, R.L.; Inomata, H. Replacement of CH4 in the hydrate by use of liquid CO2. Energy Convers. Manag. 2005, 46, 1680–1691. [Google Scholar] [CrossRef]
- Brewer, P.G.; Peltzer, E.T.; Walz, P.M.; Coward, E.K.; Stern, L.A.; Kirby, S.H. Deep-sea field test of the CH4 hydrate to CO2 hydrate spontaneous conversion hypothesis. Energy Fuels 2014, 28, 7061–7069. [Google Scholar] [CrossRef]
- Ors, O.; Sinayuc, C. An experimental study on the CO2-CH4 swap process between gaseous CO2 and CH4 hydrate in porous media. J. Petrol. Sci. Eng. 2014, 119, 156–162. [Google Scholar] [CrossRef]
- Li, X.S.; Yang, B.; Li, G.; Li, B.; Zhang, Y.; Chen, Z.Y. Experimental study on gas production from methane hydrate in porous media by huff and puff method in Pilot-Scale Hydrate Simulator. Fuel 2012, 94, 486–494. [Google Scholar] [CrossRef]
- Li, B.; Li, G.; Li, X.S.; Chen, Z.Y.; Zhang, Y. The use of heat-assisted antigravity drainage method in the two horizontal wells in gas production from the Qilian Mountain permafrost hydrate deposits. J. Petrol. Sci. Eng. 2014, 120, 141–153. [Google Scholar] [CrossRef]
- Li, B.; Li, X.S.; Li, G.; Chen, Z.Y. Evaluation of gas production from Qilian Mountain permafrost hydrate deposits in two-spot horizontal well system. Cold Reg. Sci. Technol. 2015, 109, 87–98. [Google Scholar] [CrossRef]
- Li, G.; Moridis, G.J.; Zhang, K.N.; Li, X.S. Evaluation of gas production potential from marine gas hydrate deposits in Shenhu area of South China Sea. Energy Fuels 2010, 24, 6018–6033. [Google Scholar] [CrossRef]
- Dana, E.; Skoczylas, F. Gas relative permeability and pore structure of sandstones. Int. J. Rock. Mech. Min. 1999, 36, 613–625. [Google Scholar] [CrossRef]
- Davy, C.A.; Skoczylas, F.; Lebon, P.; Dubois, T. Gas migration properties through a bentonite/argillite interface. Appl. Clay. Sci. 2009, 42, 639–648. [Google Scholar] [CrossRef]
- Wang, Y.; Feng, J.C.; Li, X.S.; Zhang, Y.; Li, G. Large scale experimental evaluation to methane hydrate dissociation below quadruple point in sandy sediment. Appl. Energy 2016, 162, 372–381. [Google Scholar] [CrossRef]
- Minagawa, H.; Ohmura, R.; Kamata, Y.; Ebinuma, T.; Narita, H.; Masuda, Y. Water permeability measurements of gas hydrate-bearing sediments. In Proceedings of the Fifth International Conference on Gas Hydrates, Trondheim, Norway, 13–16 June 2005. [Google Scholar]
- Masuda, Y.; Naganawa, S.; Ando, S.; Sato, K. Numerical calculation of gas production performance from reservoirs containing natural gas hydrates. SPE J. 1997, 29, 201–210. [Google Scholar]
- Konno, Y.; Yoneda, J.; Egawa, K.; Ito, T.; Jin, Y.; Kida, M. Permeability of sediment cores from methane hydrate deposit in the Eastern Nankai Trough. Mar. Petrol. Geol. 2015, 66, 487–495. [Google Scholar] [CrossRef]
- Li, J.F.; Ye, J.L.; Qin, X.W.; Qiu, H.J.; Wu, N.Y.; Lu, H.L.; Xie, W.W.; Lu, J.A.; Peng, F.; Lu, C.; et al. The first offshore natural gas hydrate production test in South China Sea. China Geol. 2018, 1, 5–16. [Google Scholar] [CrossRef]
- Liu, Z.F.; Colin, C.; Li, X.J.; Zhao, Y.L.; Tuo, S.T.; Chen, Z.; Siringan, F.P.; Liu, J.T.; Huang, C.Y.; You, C.F.; et al. Clay mineral distribution in surface sediments of the northeastern South China Sea and surrounding fluvial drainage basins: Source and transport. Mar. Geol. 2010, 277, 48–60. [Google Scholar] [CrossRef]
- Liu, J.F.; Skoczylas, F.; Talandier, J. Gas permeability of a compacted bentonite-sand mixture: Coupled effects of water content, dry density, and confining pressure. Can. Geotech. J. 2015, 52, 1159–1167. [Google Scholar] [CrossRef]
- Liu, J.F.; Song, Y.; Skoczylas, F.; Liu, J. Gas migration through water-saturated bentonite-sand mixtures, COx argillite, and their interfaces. Can. Geotech. J. 2016, 53, 60–71. [Google Scholar] [CrossRef]
- Liu, J.F.; Skoczylas, F.; Liu, J. Experimental research on water retention and gas permeability of compacted bentonite/sand mixtures. Soils Found. 2014, 54, 1027–1038. [Google Scholar] [CrossRef]
- Yang, S.X.; Liang, J.Q.; Lu, J.A.; Qu, C.W.; Liu, B. New understandings on the characteristics and controlling factors of gas hydrate reservoirs in the Shenhu area on the northern slope of the South China Sea. Front. Earth Sci. 2017, 24, 1–14. [Google Scholar]
- Zhang, J.M.; Li, X.S.; Chen, Z.Y.; Li, Q.P.; Li, G.; Lv, T. Numerical simulation of the improved gas production from low permeability hydrate reservoirs by using an enlarged highly permeable well wall. J. Petrol. Sci. Eng. 2019, 183, 106404. [Google Scholar] [CrossRef]
- Loosveldt, H.; Lafhaj, Z.; Skoczylas, F. Experimental study of gas and liquid permeability of a mortar. Cem. Concr. Res. 2002, 32, 1357–1363. [Google Scholar] [CrossRef]
- Xu, P.; Yu, B.M. Developing a new form of permeability and Kozeny-Carman constant for homogeneous porous media by means of fractal geometry. Adv. Water Resour. 2008, 31, 74–81. [Google Scholar] [CrossRef]
- Carman, P.C. Permeability of saturated sands, soils and clays. J. Agric. Sci. 1939, 29, 262–273. [Google Scholar] [CrossRef]
- Carman, P.C. Fluid flow through granular beds. Chem. Eng. Res. Des. 1997, 75, S32–S48. [Google Scholar] [CrossRef]
- Li, X.S.; Wang, Y.; Duan, L.P.; Li, G.; Zhang, Y.; Huang, N.S. Experimental investigation into methane hydrate production during three-dimensional thermal huff and puff. Appl. Energy 2012, 94, 48–57. [Google Scholar] [CrossRef]
- van Genuchten, M.T. A closed-form equation for predicting the hydraulic conductivity of unsaturated soils. Soil Sci. Soc. Am. J. 1980, 44, 892–898. [Google Scholar] [CrossRef]


| Parameter | Value |
|---|---|
| Thickness of OB and UB | 20.0 m |
| Thickness of HBL–I, II and III | 35.0, 15, and 27 m |
| Distance of production interval | 42.0 m |
| Position of HBL–III below the sea level | 1572 m |
| Initial pressure PB | 15.8 MPa |
| Initial temperature TB | 289.38 K |
| Initial saturation in the HBL–I | SH = 0.34, SA = 0.66, SG = 0.60 |
| Initial saturation in the HBL–II | SH = 0.31, SA = 0.612, SG = 0.078 |
| Initial saturation in the HBL–III | SH = 0.00, SA = 0.922, SG = 0.078 |
| Gas composition | 100% CH4 |
| Geothermal gradient G | 0.045 K/m |
| Water salinity | 3.05% |
| Intrinsic permeability of HBL, OB, UB (kx = ky = kz) | 1.53× 10⁻¹⁶ m2 |
| Permeability inside the well | 5×10⁻⁹ m2 (5000 D) |
| Permeability inside enlarged permeable well | 5×10⁻¹² m2 (0.5 D) |
| Porosity f of OB and UB | 0.35 and 0.32 |
| Porosity f of HBL–I, II and III | 0.35, 0.33 and 0.32 |
| Wet thermal conductivity kΘRW | 3.1 W/m/K |
| Dry thermal conductivity kΘRD | 1.0 W/m/K |
| Composite thermal conductivity Model [7] | |
| Capillary pressure model [41] | |
| SirA | 0.30 |
| SirG | 0.05 |
| λ | 0.45 |
| P0 | 105 Pa |
| Relative permeability Model [7] | |
| n | 5.0 |
| nG | 3.5 |
© 2019 by the authors. Licensee MDPI, Basel, Switzerland. This article is an open access article distributed under the terms and conditions of the Creative Commons Attribution (CC BY) license (http://creativecommons.org/licenses/by/4.0/).
Share and Cite
Shen, P.; Li, G.; Liu, J.; Li, X.; Zhang, J. Gas Permeability and Production Potential of Marine Hydrate Deposits in South China Sea. Energies 2019, 12, 4117. https://doi.org/10.3390/en12214117
Shen P, Li G, Liu J, Li X, Zhang J. Gas Permeability and Production Potential of Marine Hydrate Deposits in South China Sea. Energies. 2019; 12(21):4117. https://doi.org/10.3390/en12214117
Chicago/Turabian StyleShen, Pengfei, Gang Li, Jiangfeng Liu, Xiaosen Li, and Jinming Zhang. 2019. "Gas Permeability and Production Potential of Marine Hydrate Deposits in South China Sea" Energies 12, no. 21: 4117. https://doi.org/10.3390/en12214117
APA StyleShen, P., Li, G., Liu, J., Li, X., & Zhang, J. (2019). Gas Permeability and Production Potential of Marine Hydrate Deposits in South China Sea. Energies, 12(21), 4117. https://doi.org/10.3390/en12214117