Geothermal Energy for Sustainable Food Production in Canada’s Remote Northern Communities


 , , and
Abstract
:1. Introduction
- ▪
- A small-scale geothermal power plant (20 kW) at Meager Mountain in British Columbia; This project was not linked to the grid and has since been left in a predevelopment stage.
- ▪
- An abandoned deep geothermal project (~2.5 km) based on fluids in sediments on the University of Regina campus for direct heating (both space and water) applications.
- ▪
- A geothermal project in Springhill, Nova Scotia, based on heat recovery from flooded underground mines.
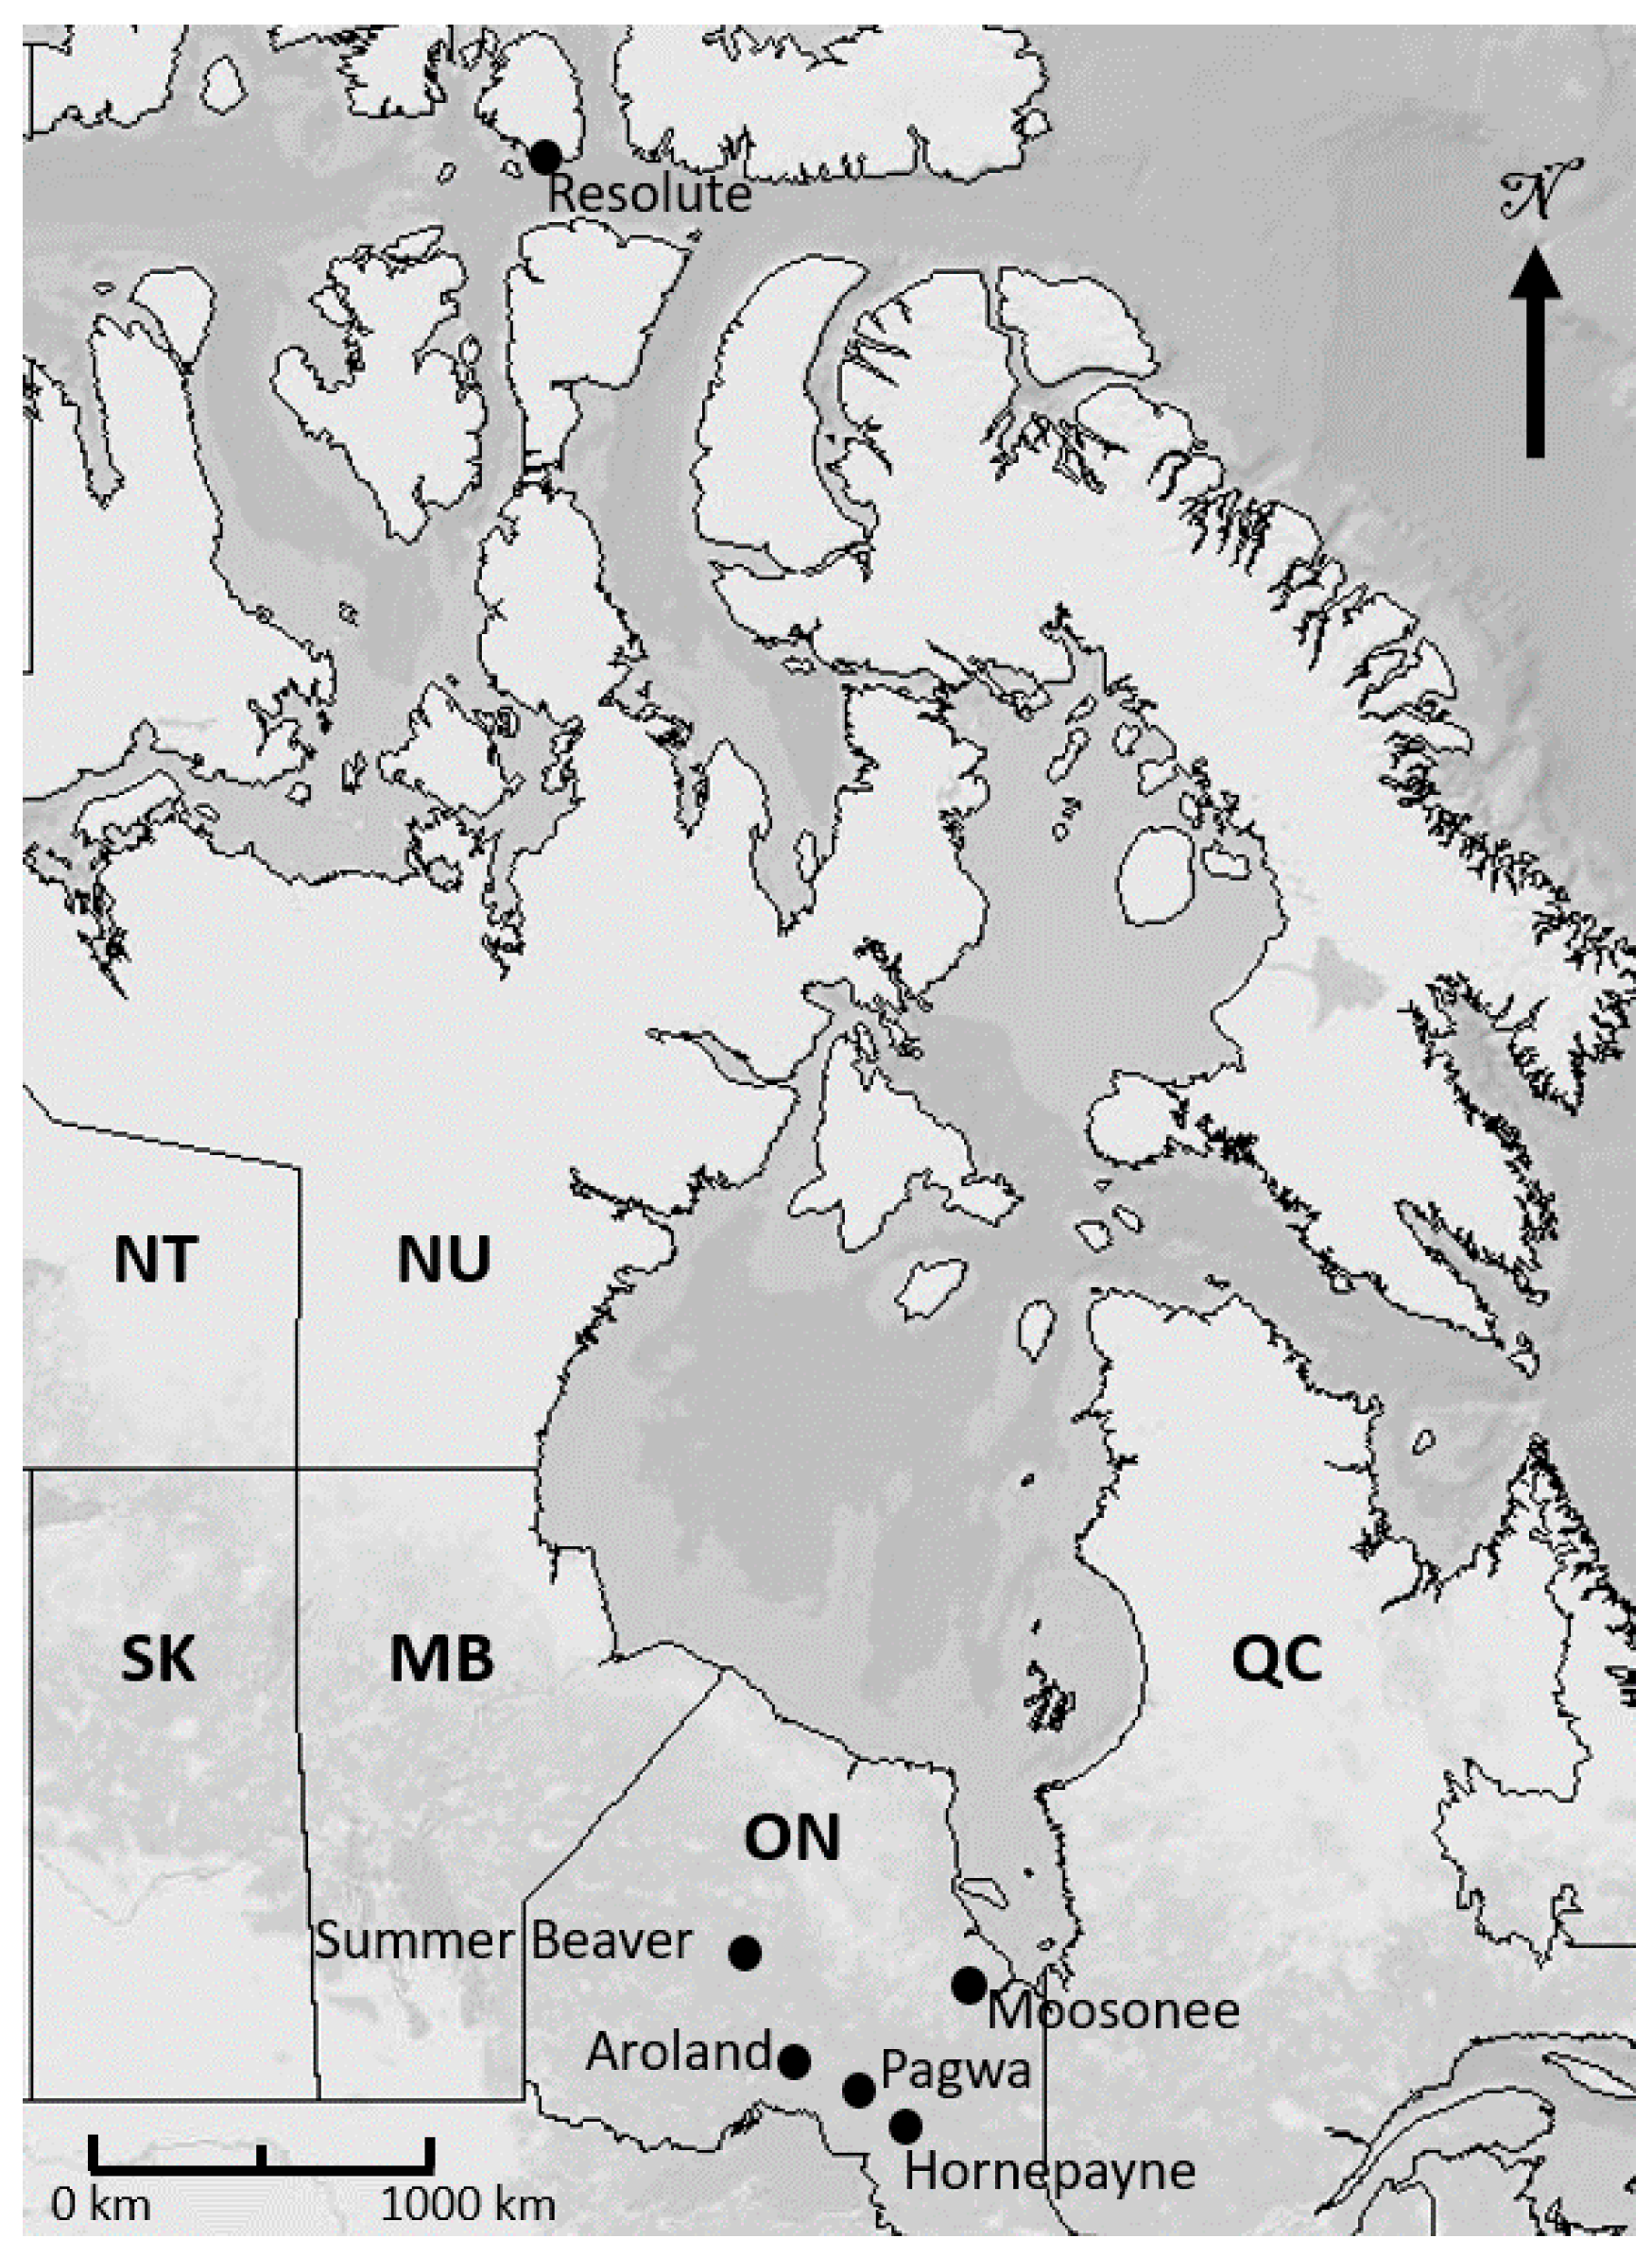
2. Study Locale
3. Methodology
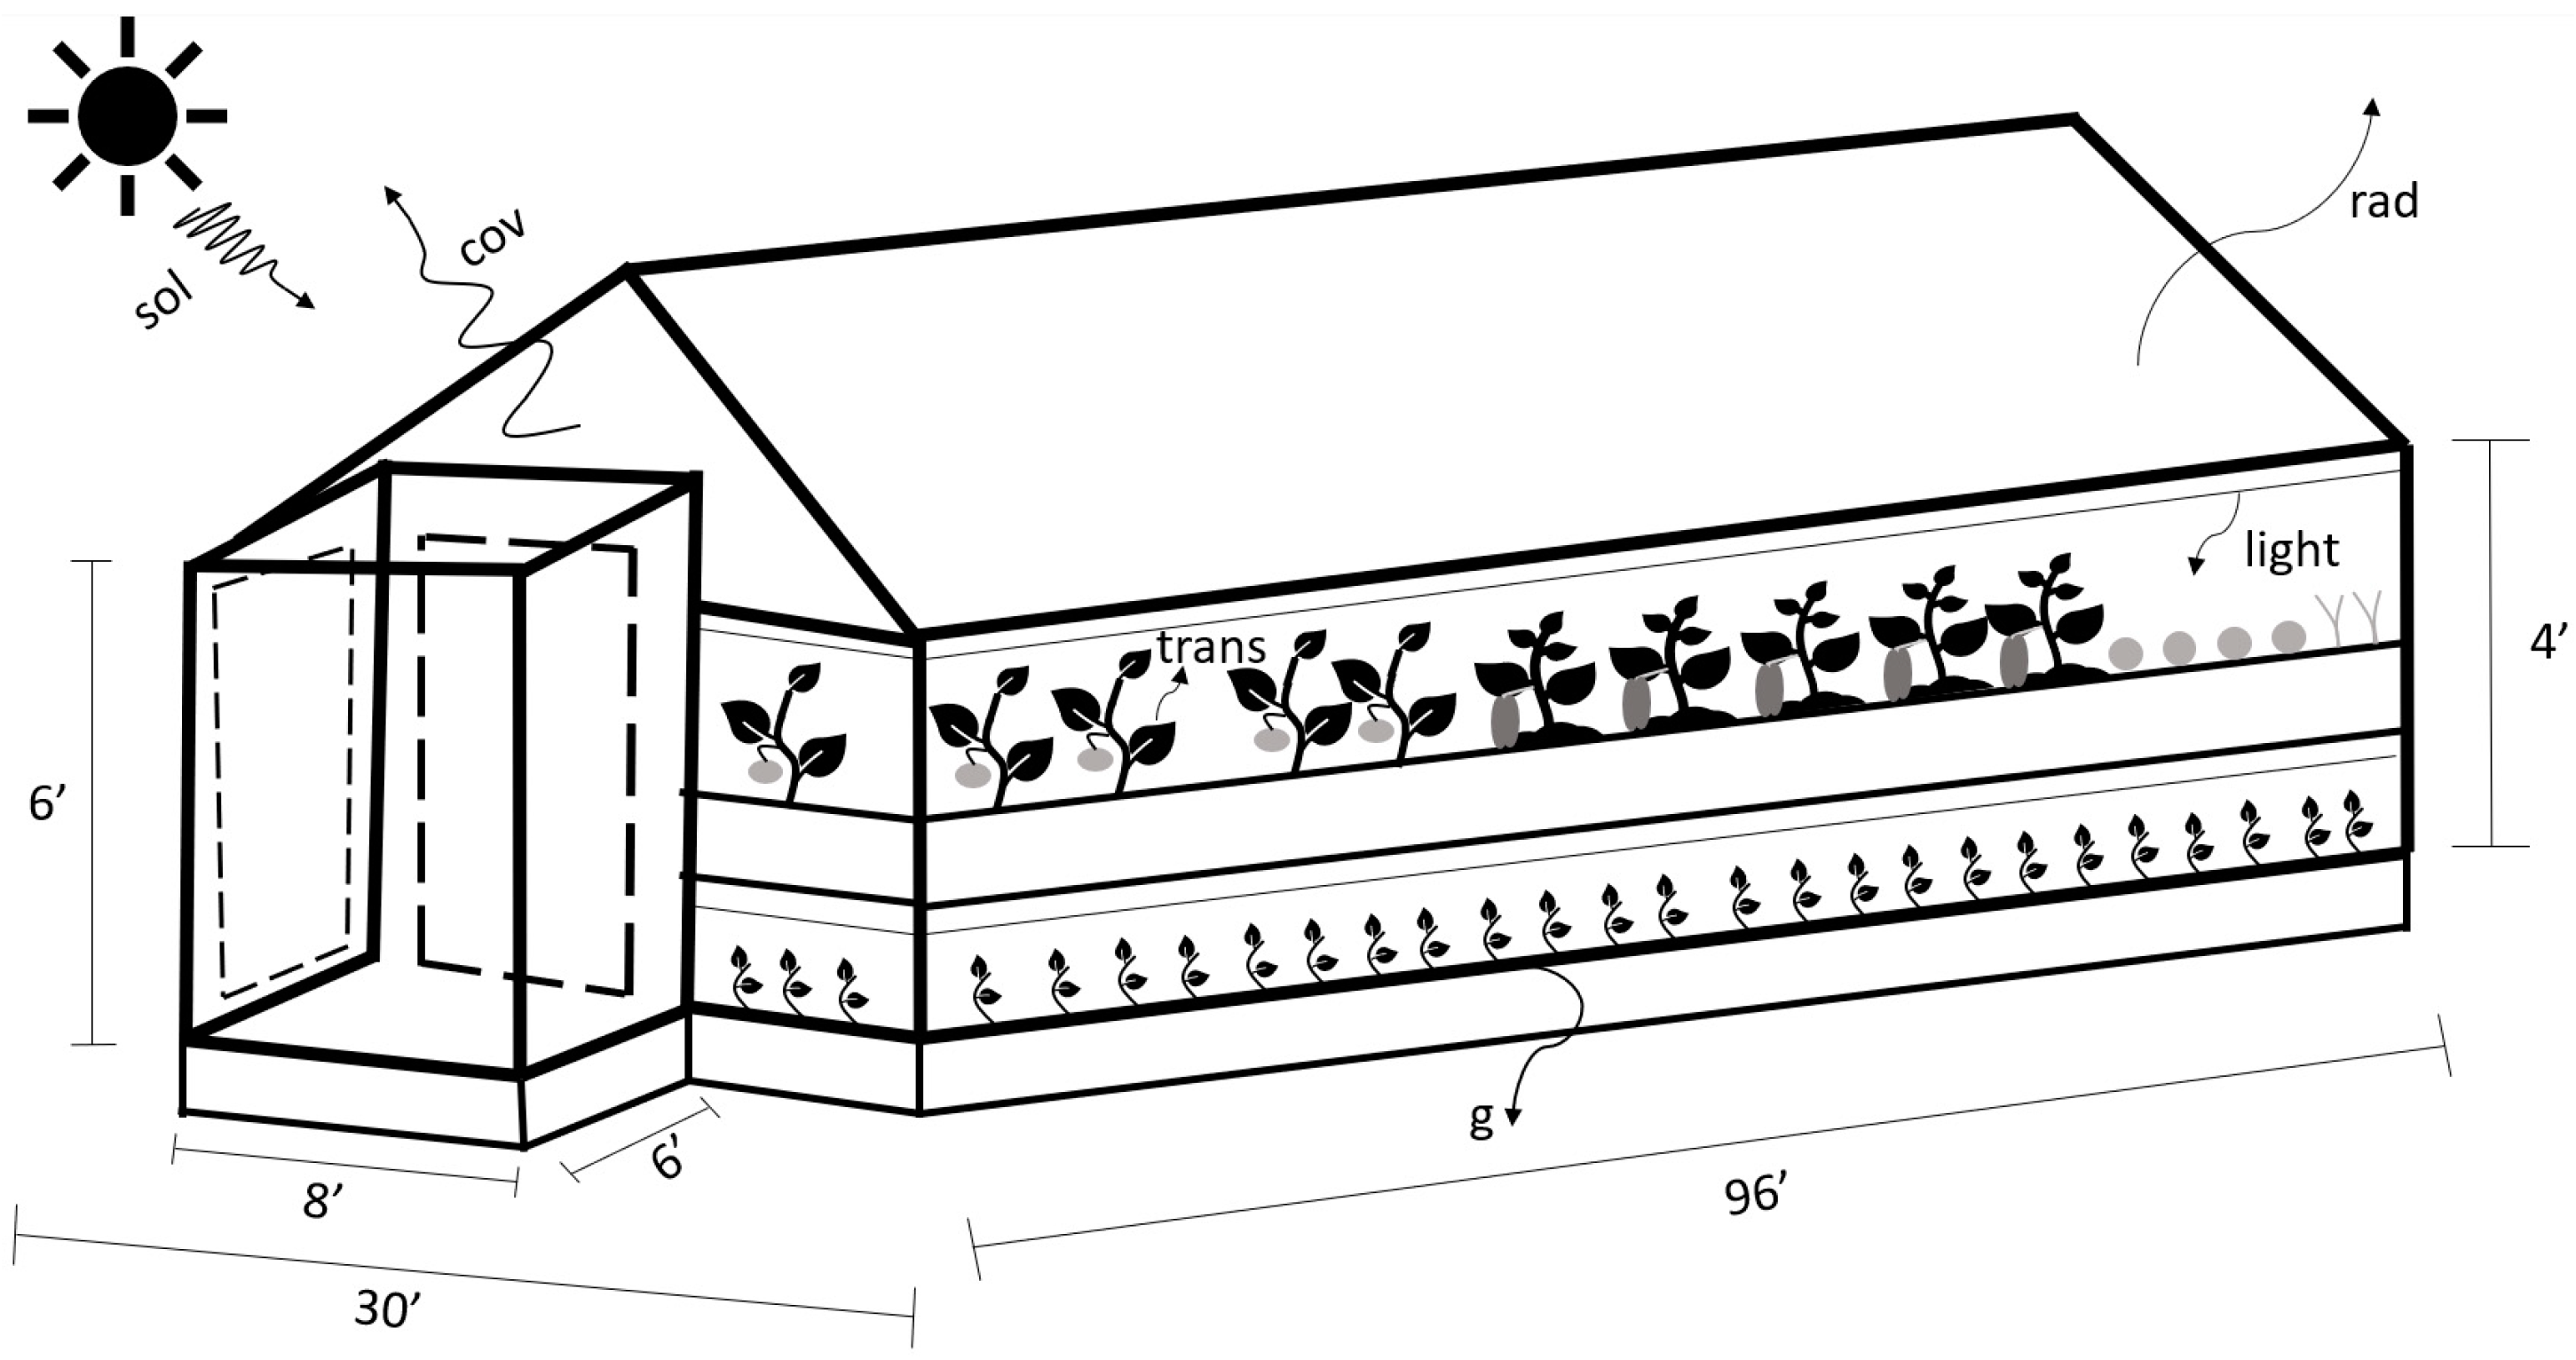
3.1. Building and Vegetable Optimization
3.2. Heating Demand Calculations
3.3. Geothermal Supply Estimation
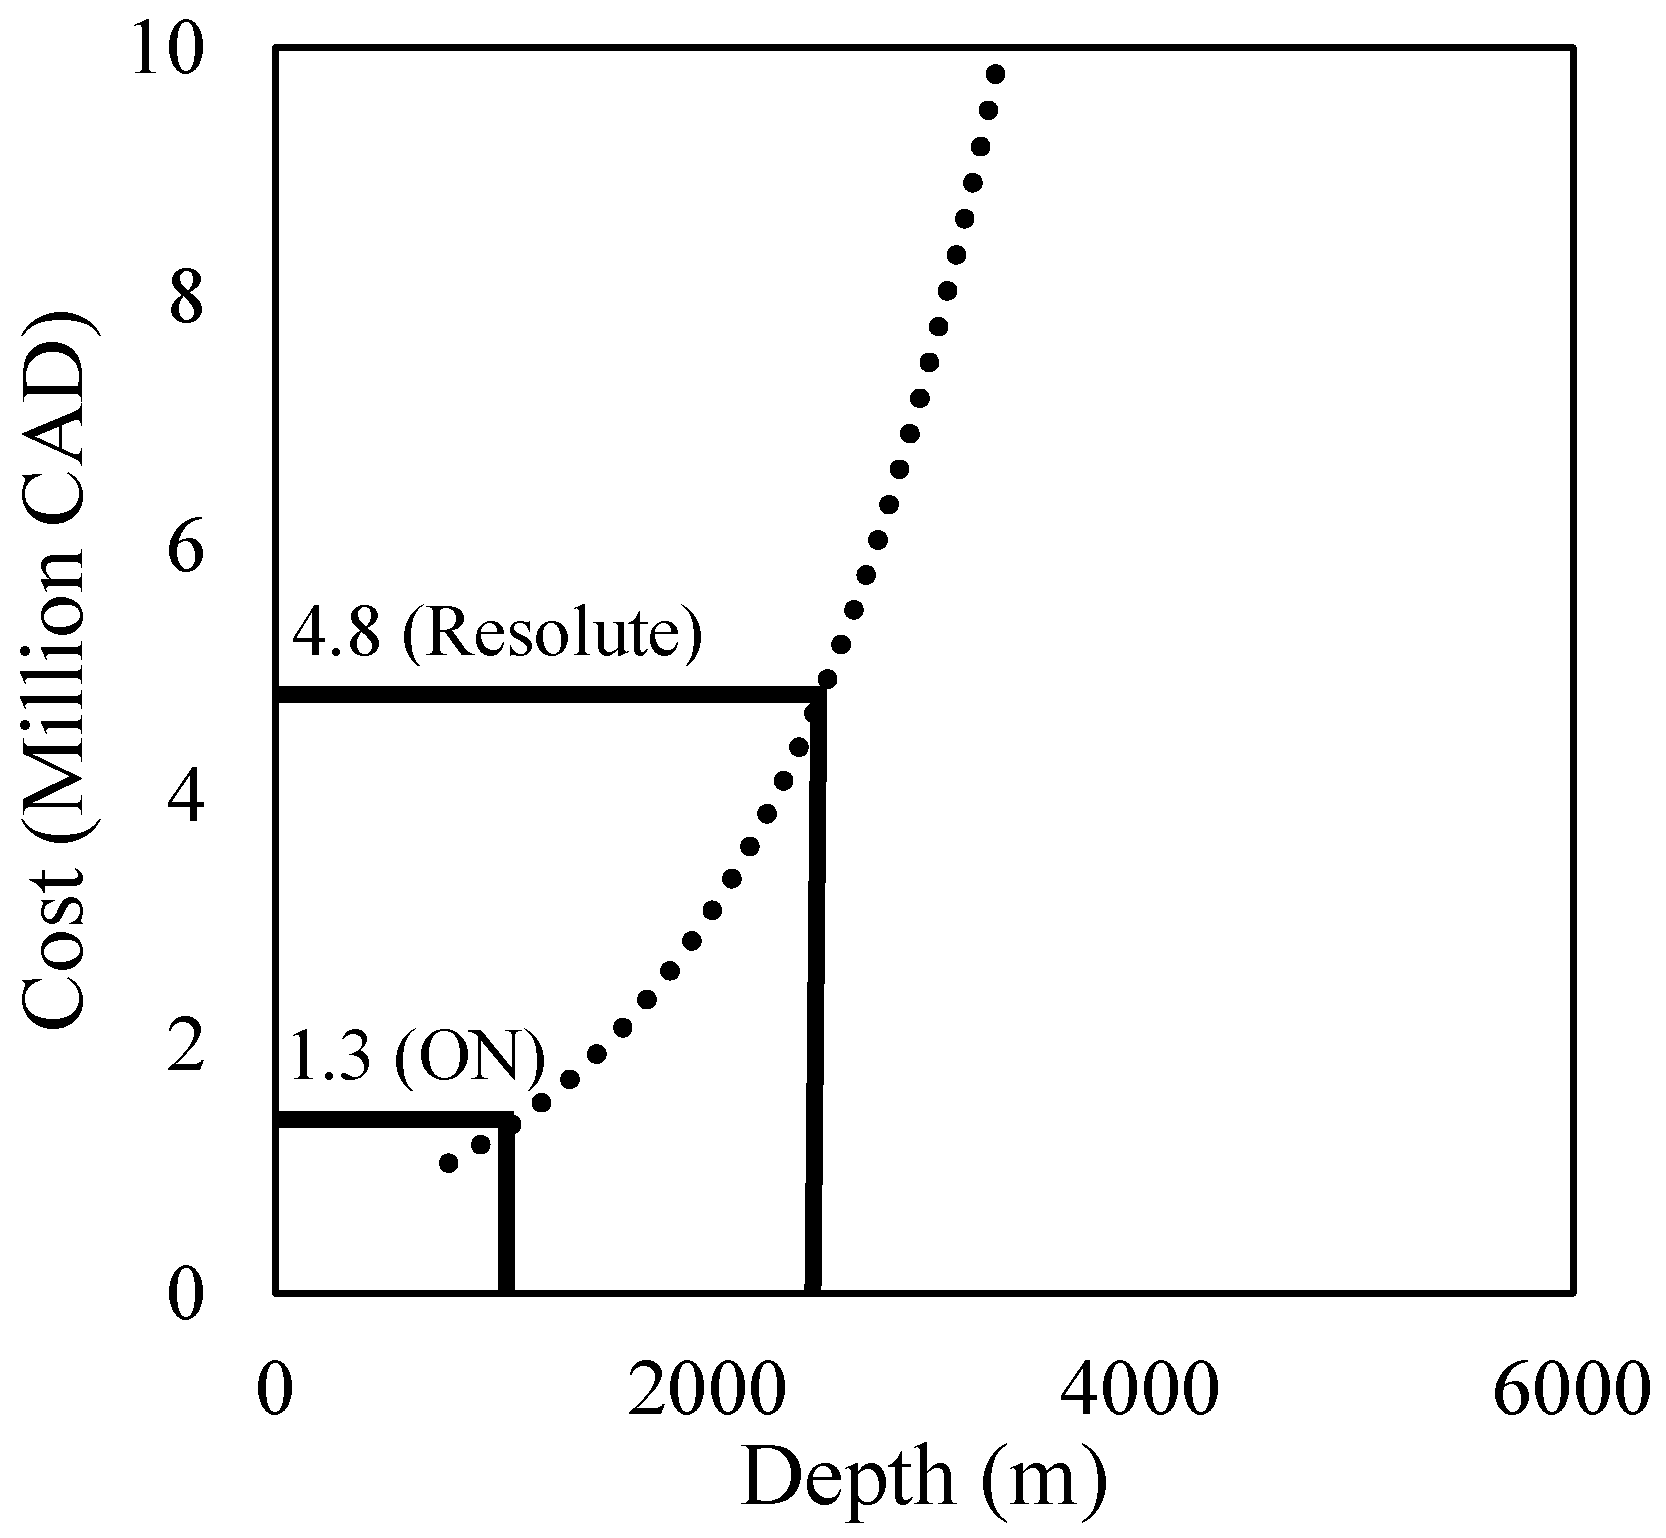
Borehole Length Estimation
4. Results and Discussion
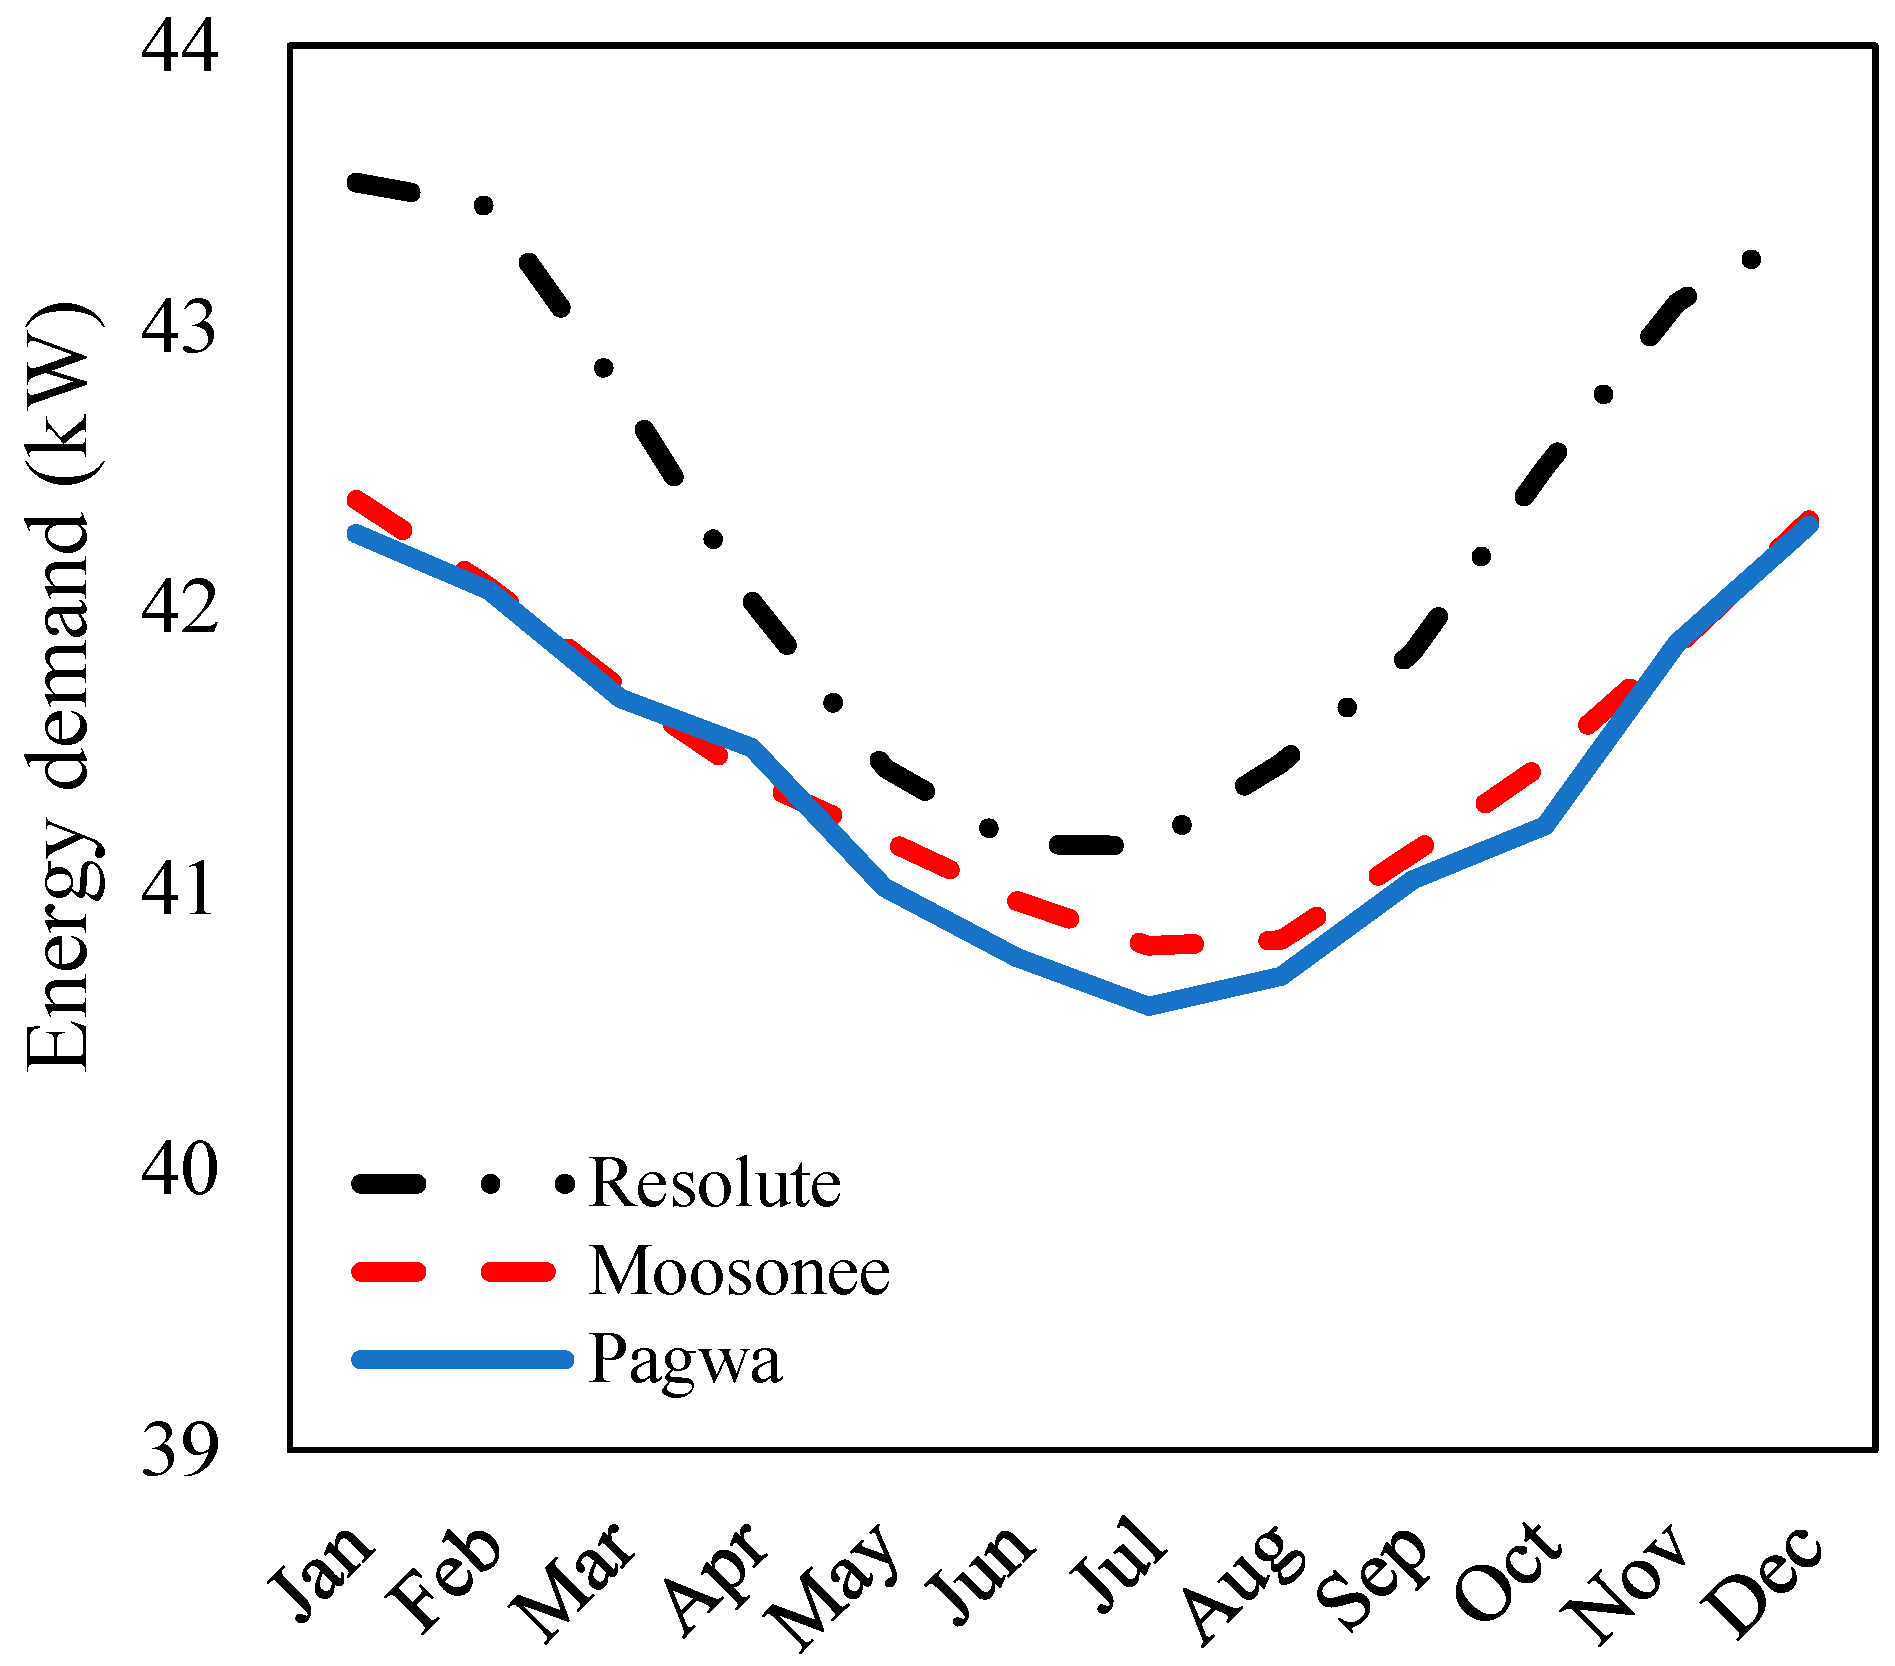
4.1. Comparison between Localities
4.2. Additional Infrastructure
4.3. Economic Considerations
4.3.1. Capital Costs
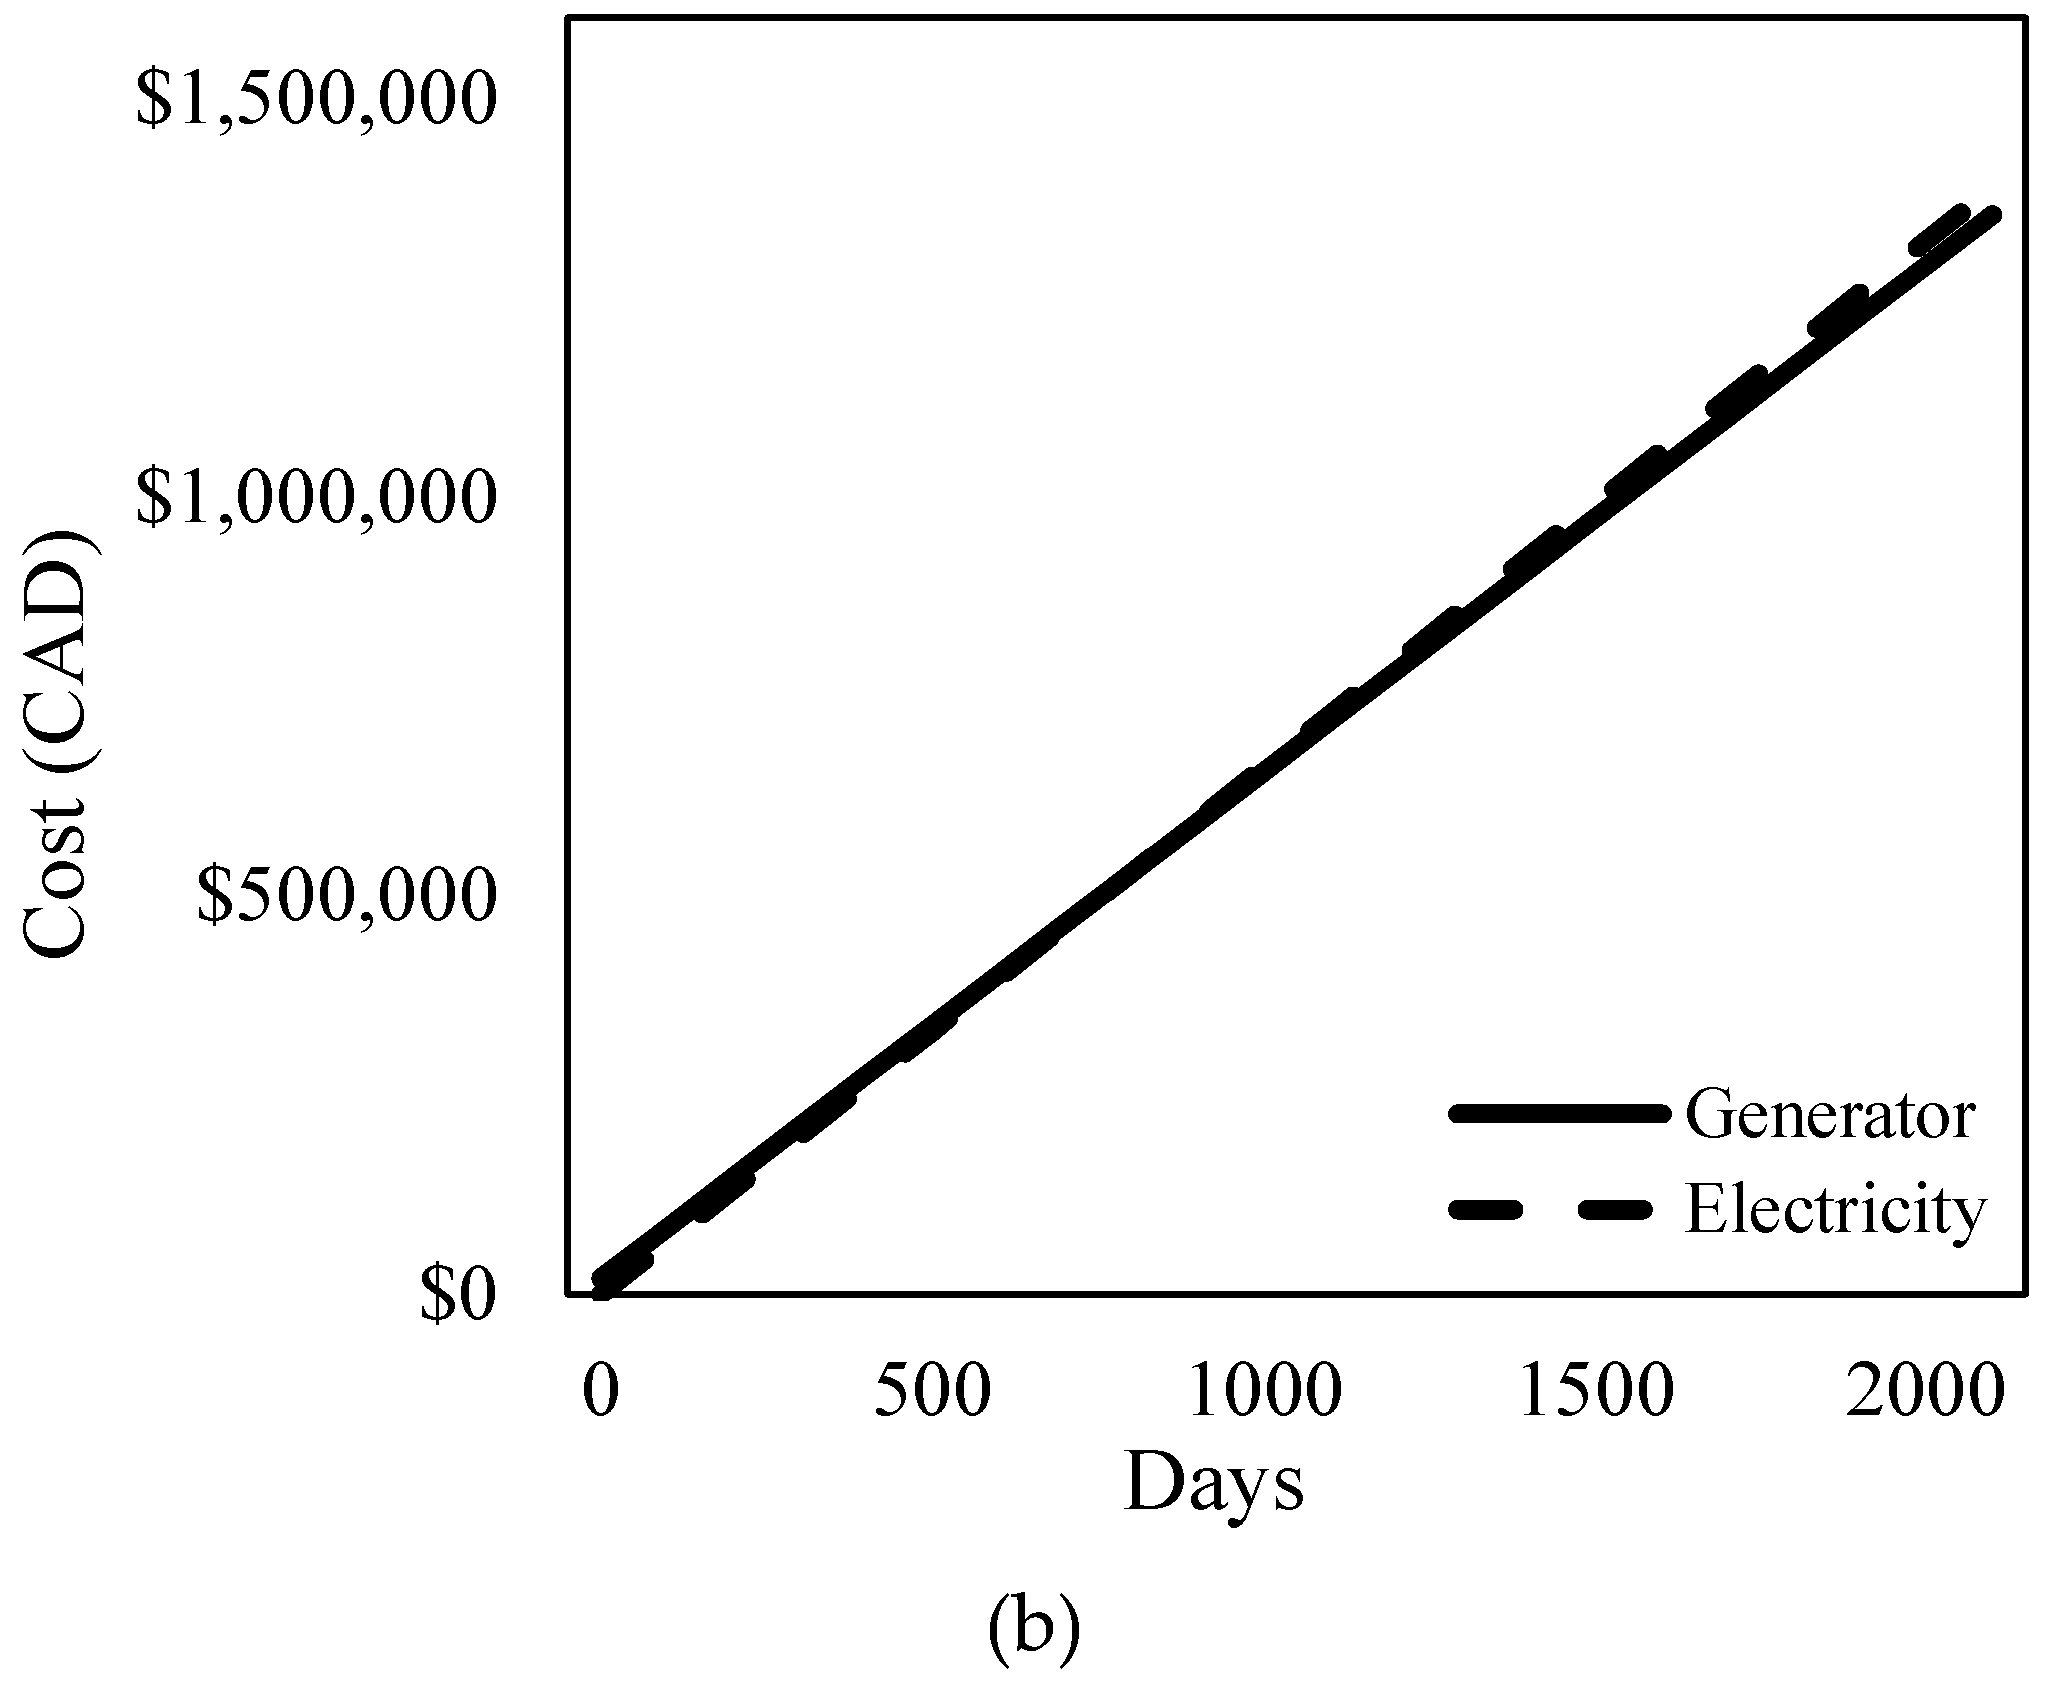
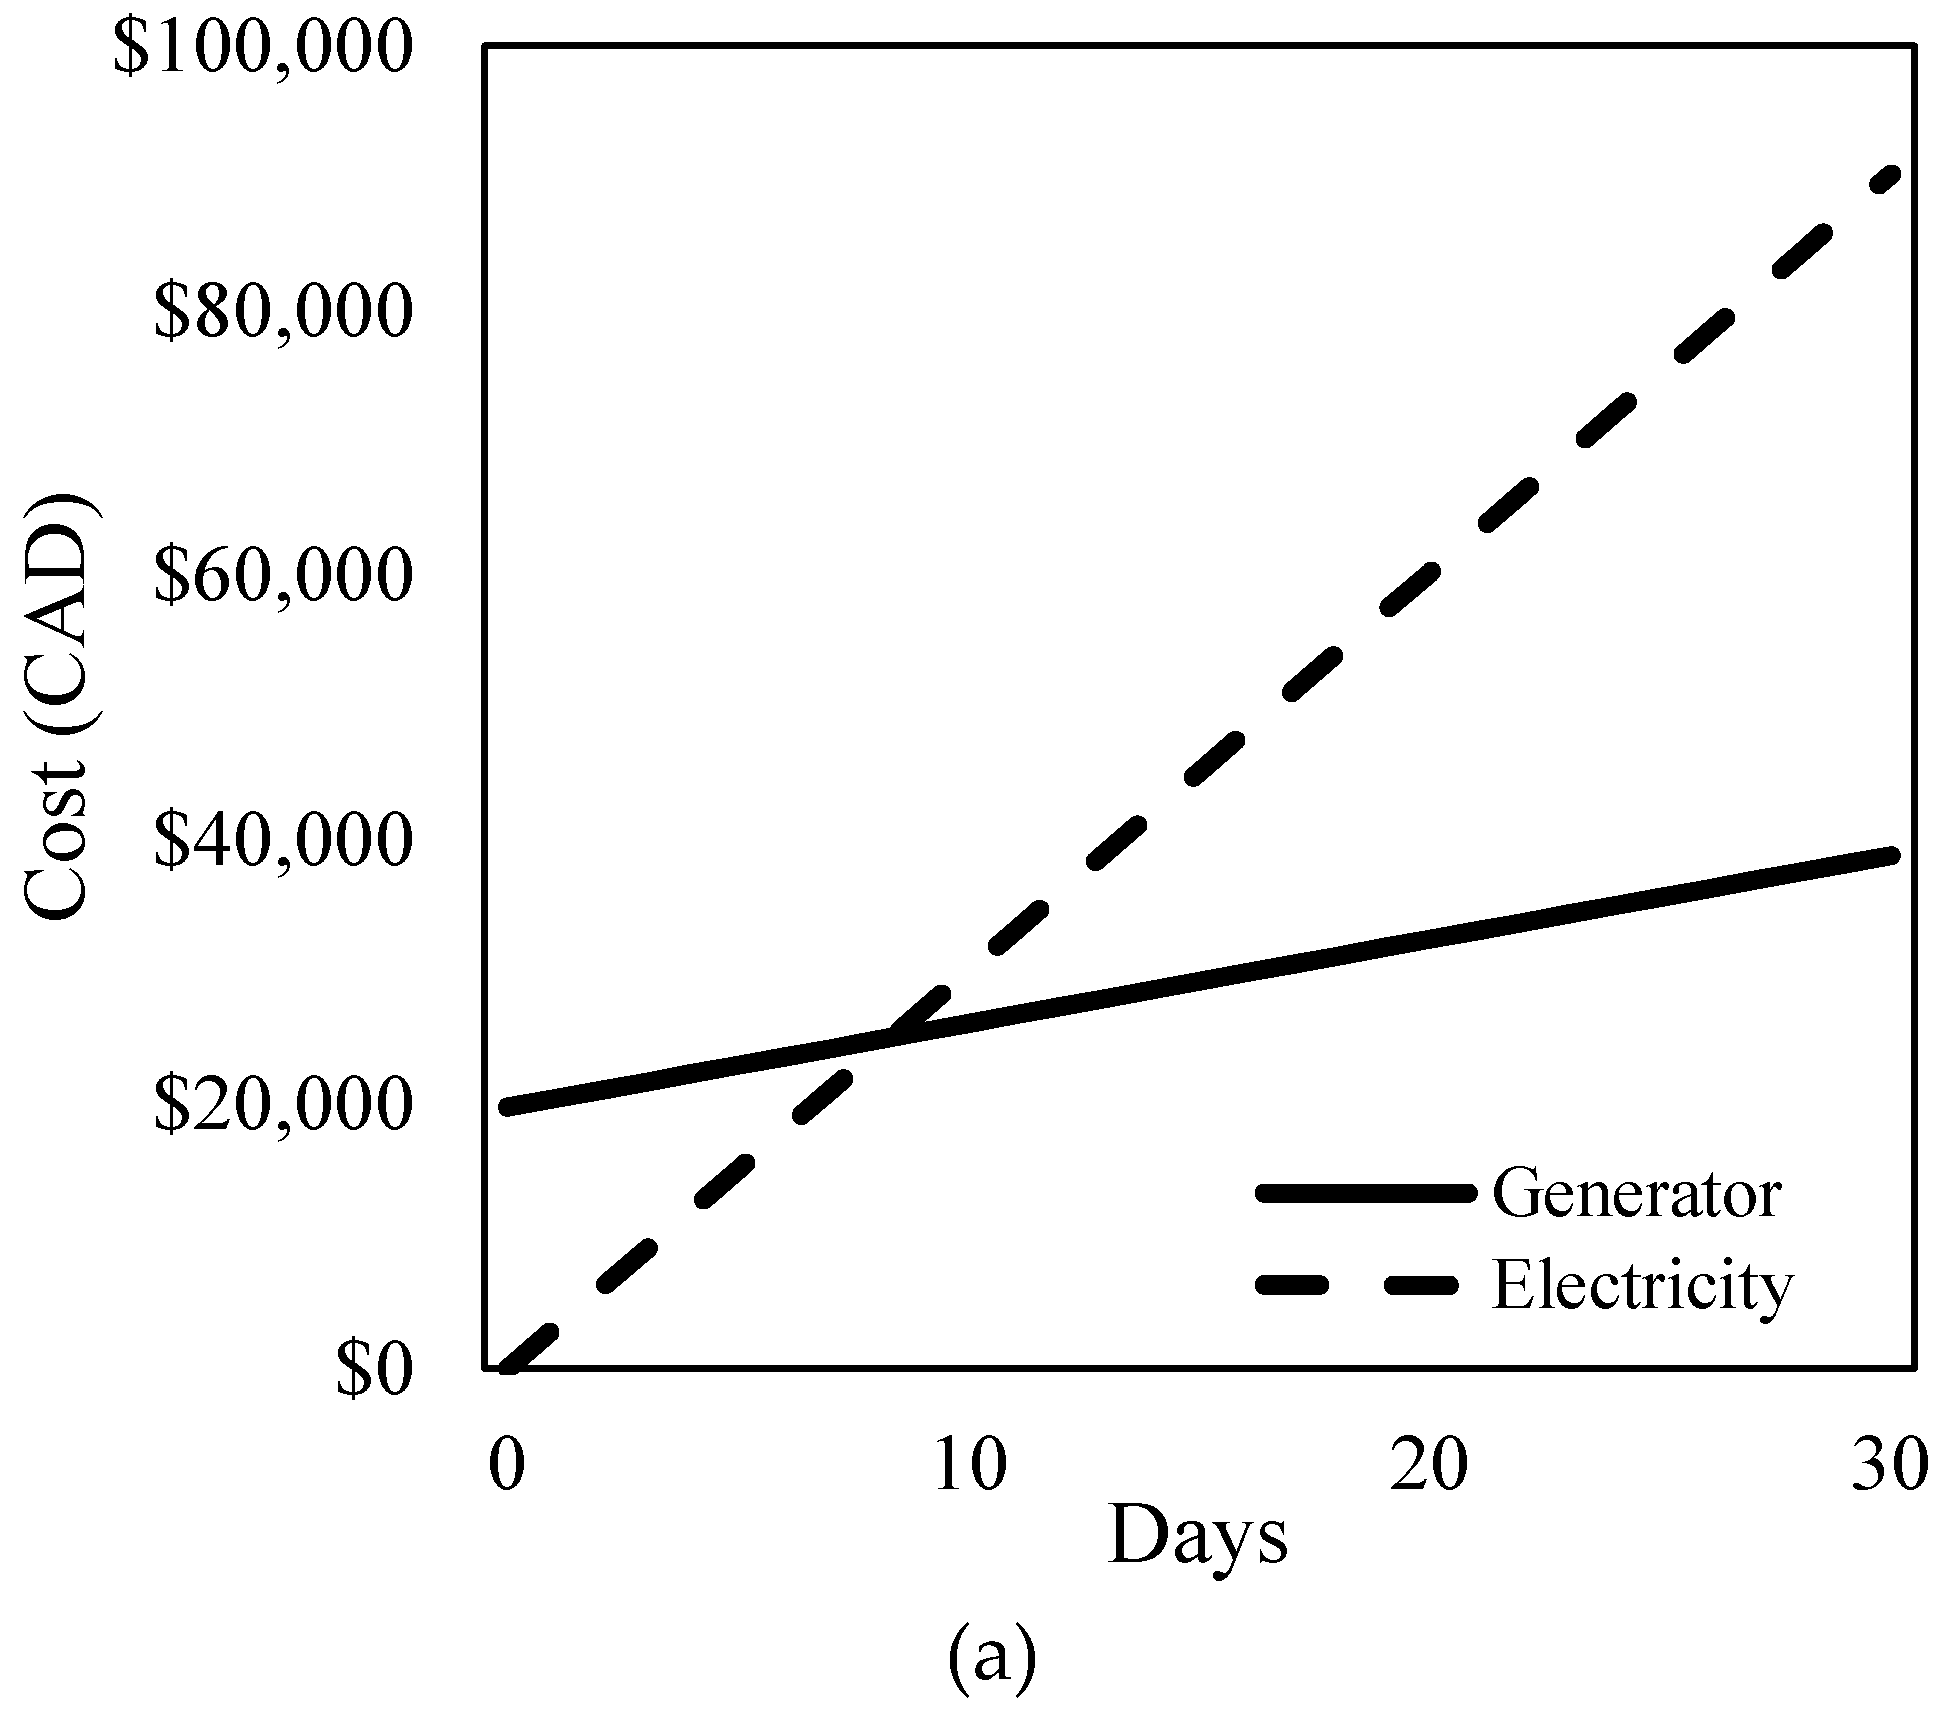
4.3.2. Operational Costs
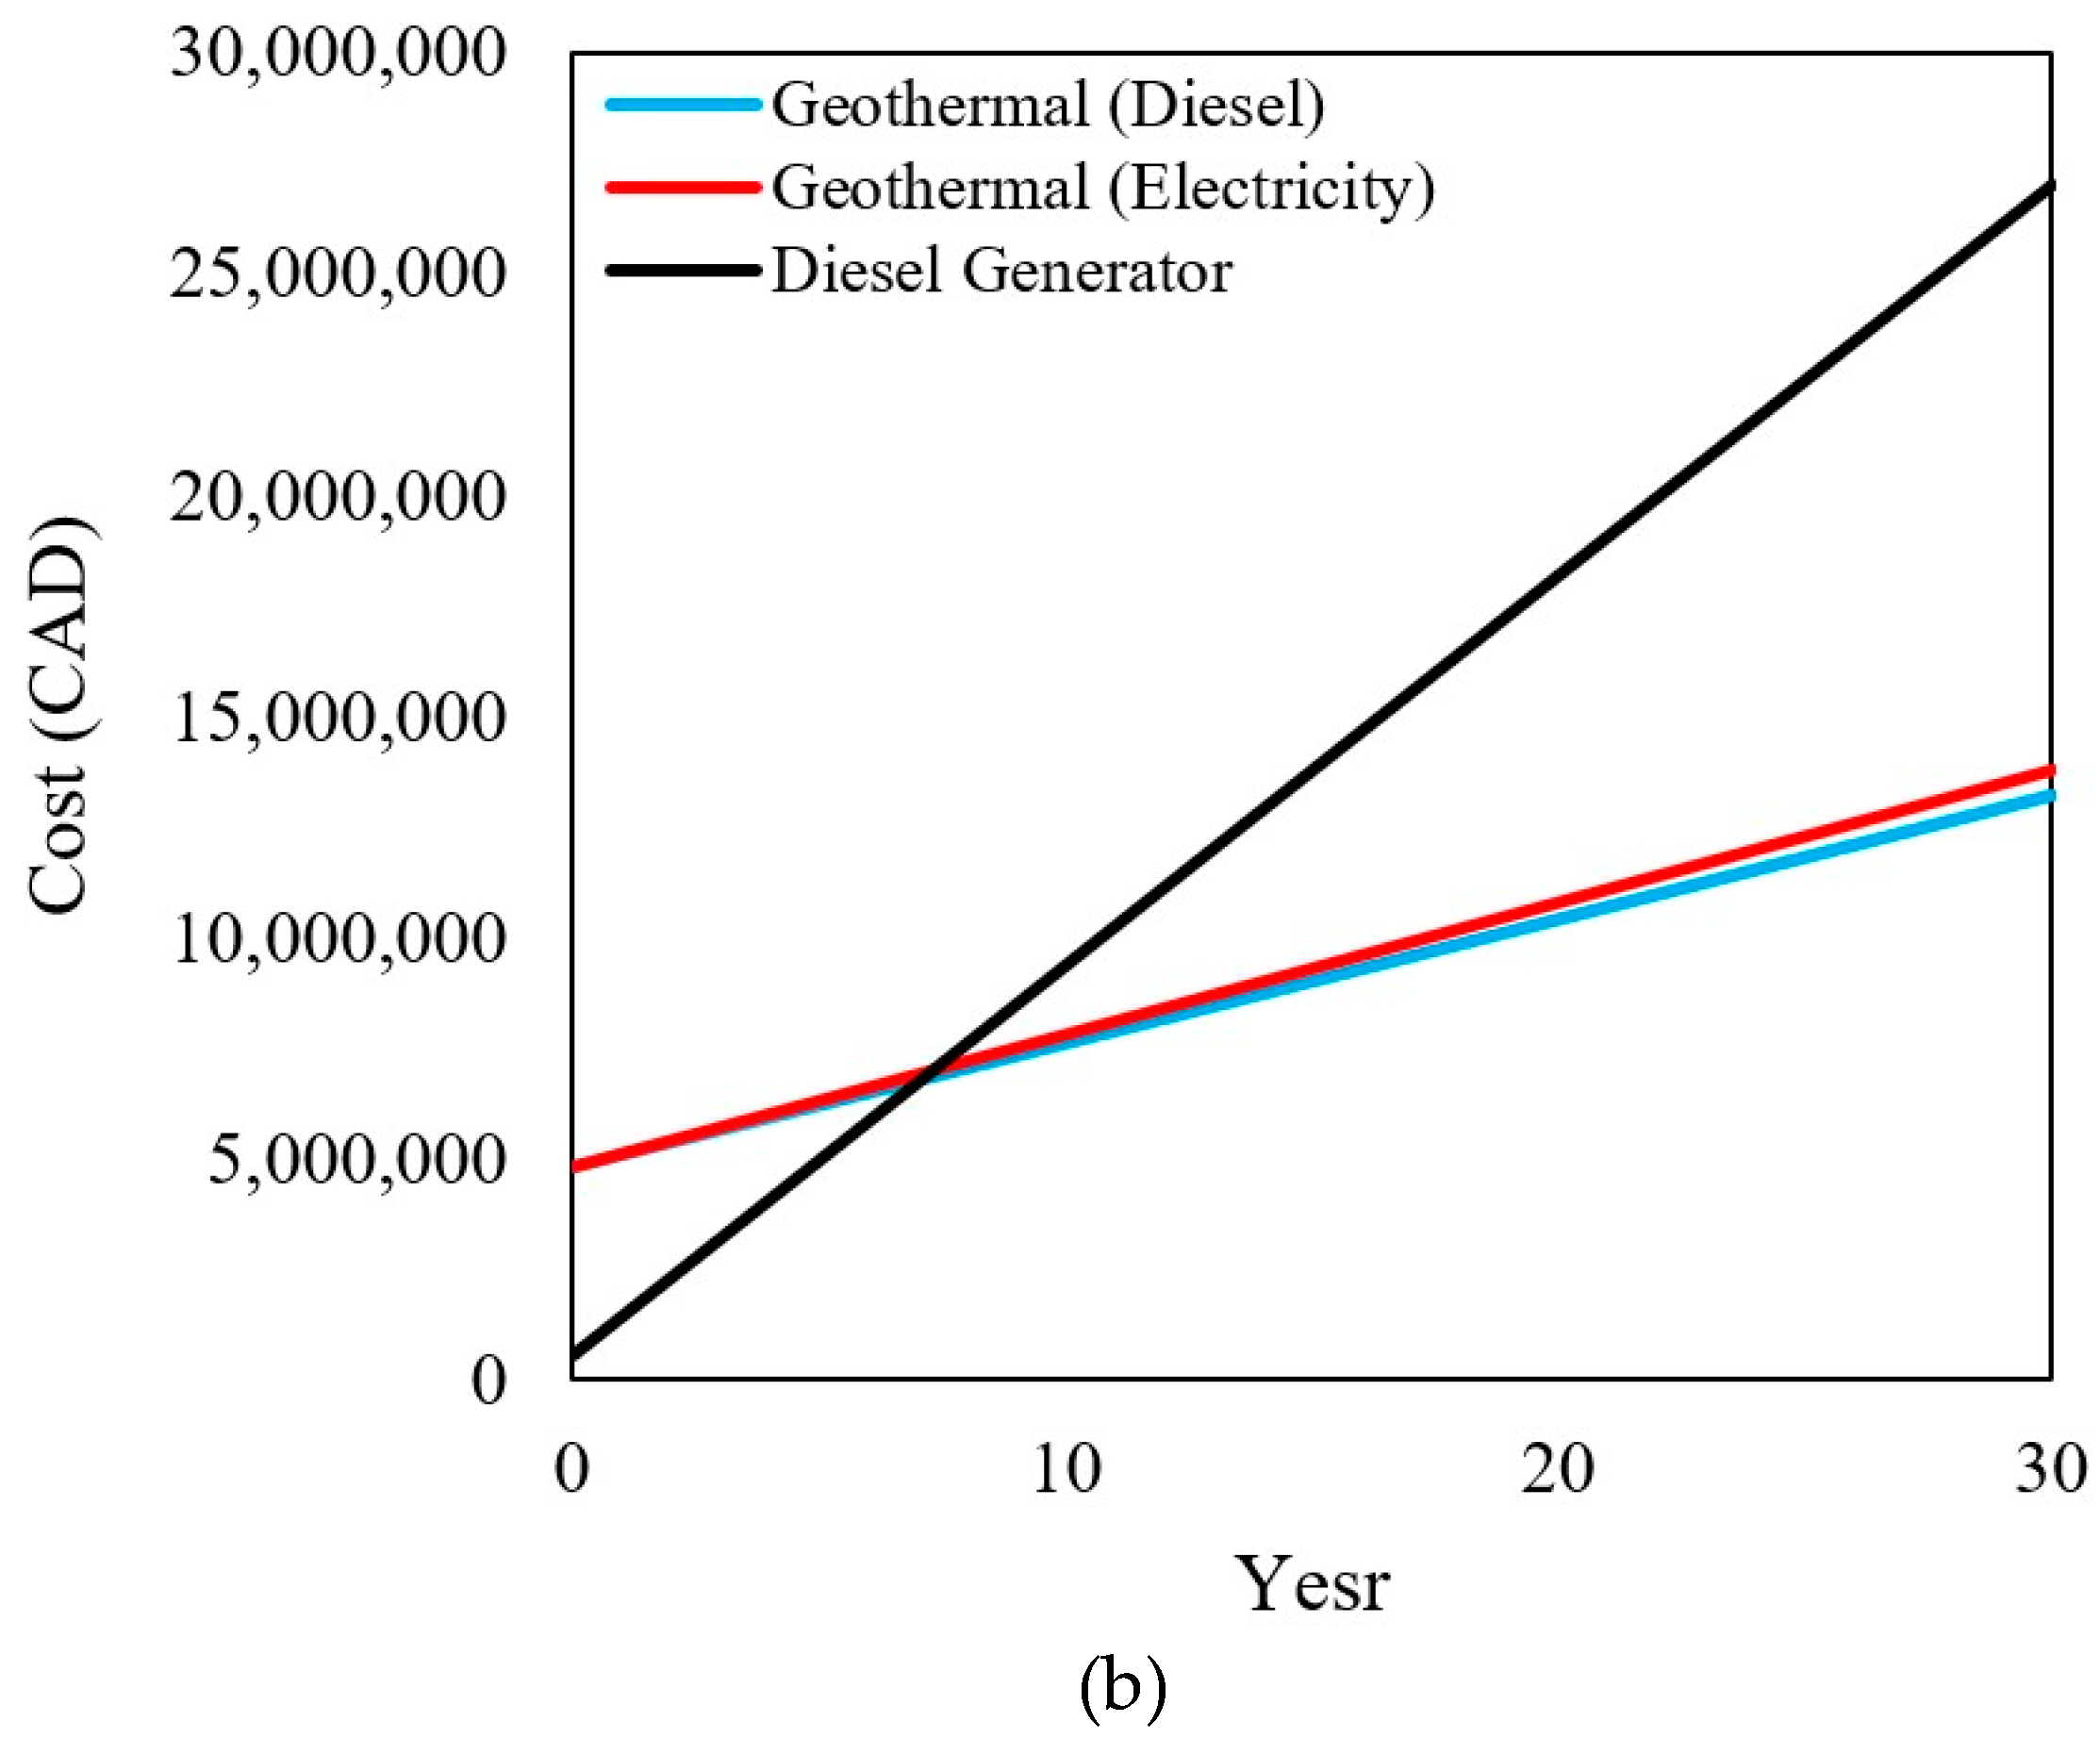
4.3.3. Comparison of Different Energy Production Systems
4.4. SWOT Analysis
- Strengths:Unlimited geothermal resources accessible (in principle, but may require more drill holes).Advances in technology development and availability (deep and shallow).Substantial economic benefits for end users.Help for indigenous communities in remote regions.Improving food security in remote regions.Increasing public health of indigenous communities.Minor environmental issues.
- Weaknesses:High initial investment costs.Inadequate geological studies and economic assessments.
- Opportunities:Increase government support.Reduced costs because of technological development and local food products.More financial support for using geothermal energy.
- Threats:Price of fossil fuels, especially in the use of diesel generators.Lack of executive promotion policy towards geothermal energy.
4.5. Climate Change
4.6. Public Health
5. Conclusions
Nomenclature
| CA | Cover area, m2 |
| Cp | Specific heat capacity, J/kgK |
| Ir | Solar insolation, kWh/m2/day |
| k | Thermal conductivity, W/mK |
| LAI | Leaf area index, m2/m2 |
| PA | Plant area, m2 |
| Pl | Power of lighting, W |
| Pvalue | Ratio of cover area to surface area, - |
| Q | Thermal energy rate, W |
| R | Thermal resistance, Km2/W |
| r | Radius, m |
| RH | Relative humidity, % |
| SA | Surface area, m2 |
| TA | Soil area, m2 |
| T | Temperature, °C |
| Volumetric flow rate, m3/s | |
| Greek symbols | |
| ε | Emissivity, - |
| η | Efficiency, - |
| σ | Stefan–Boltzmann constant, W/m2K4 |
| τ | Transmissivity, - |
| Subscripts | |
| amb | ambient |
| cov | cover |
| g | ground |
| gh | greenhouse |
| i | inner |
| l | leaf |
| light | lighting |
| o | outer |
| p | pipe |
| pla | plants |
| R | rock |
| rad | radiation |
| sol | solar |
| tot | total |
| trans | transpiration |
| w | water |
Abbreviations
| ASB | Arctic Sedimentary Basin |
| CAD | Canadian Dollars |
| CS | Canadian Shield |
| EPS | Expanded Polystyrene |
| GESs | Geothermal Energy Systems |
| GHG | Greenhouse Gas |
| GHPs | Geothermal Heat Pumps |
| GSHPs | Ground Source Heat Pumps |
| ON | Ontario |
| OSB | Oriented Strand Board |
| NU | Nunavut |
| SPF | Seasonal Performance Factor |
Author Contributions
Funding
Conflicts of Interest
References
- Bahadori, M.N.; Dehghani-Sanij, A.R. Wind Towers: Architecture, Climate and Sustainability; Sayigh, A.A.M., Ed.; Springer: Basel, Switzerland, 2014. [Google Scholar]
- Dehghani-Sanij, A.R. Cisterns: Sustainable Development, Architecture and Energy; Sayigh, A.A.M., Ed.; River Publishers: Aalborg, Denmark, 2016. [Google Scholar]
- Dehghani-Sanij, A.R.; Tharumalingam, E.; Dusseault, M.B.; Fraser, R. Study of energy storage systems and environmental challenges of batteries. Renew. Sustain. Energy Rev. 2019, 104, 192–208. [Google Scholar] [CrossRef]
- Duchin, F. Population change, lifestyle, and technology: How much difference can they make? Popul. Dev. Rev. 1996, 22, 321–330. [Google Scholar] [CrossRef]
- Dudley, B.; Dale, S. BP Energy Outlook—2018 Edition; Economics: London, UK, 2018; 124p. [Google Scholar]
- Mardiana, A.; Riffat, S.B. Building energy consumption and carbon dioxide emissions: Threat to climate change. J. Earth Sci. Clim. Chang. 2015, S3:001. [Google Scholar] [CrossRef]
- Campbell-Lendrum, D.; Corvalán, C. Climate change and developing-country cities: Implications for environmental health and equity. J. Urban Health 2007, 84, 09–117. [Google Scholar] [CrossRef] [PubMed]
- Dehghani-Sanij, A.R.; Soltani, M.; Raahemifar, K. A new design of wind tower for passive ventilation in buildings to reduce energy consumption in windy regions. Renew. Sustain. Energy Rev. 2015, 42, 182–195. [Google Scholar] [CrossRef]
- Dehghani-Sanij, A.R.; Khani, M.R.; Zhang, B.; Narimannejad, S.; Mohammadnia, M. Water quality analysis of underground reservoirs in hot and arid regions. J. Appl. Environ. Biol. Sci. 2016, 6, 149–161. [Google Scholar]
- Hanjra, M.A.; Qureshi, M.E. Global water crisis and future food security in an era of climate change. Food Policy 2010, 35, 365–377. [Google Scholar] [CrossRef]
- Razavi, M.; Dehghani-Sanij, A.R.; Khani, M.R.; Dehghani, M.R. Comparing meshless local Petrov-Galerkin and artificial neural networks methods for modeling heat transfer in cisterns. Renew. Sustain. Energy Rev. 2015, 43, 521–529. [Google Scholar] [CrossRef]
- Soltani, M.; Dehghani-Sanij, A.R.; Sayadnia, A.; Kashkooli, F.M.; Gharali, K.; Mahbaz, S.B.; Dusseault, M.B. Investigation of airflow patterns in a new design of wind tower with a wetted surface. Energies 2018, 11, 1100. [Google Scholar] [CrossRef]
- Htut, A.Y.; Shrestha, S.; Nitivattananon, V.; Kawasaki, A. Forecasting climate change scenarios in the Bago River Basin, Myanmar. J. Earth Sci. Clim. Chang. 2014, 5, 228. [Google Scholar] [CrossRef]
- Khajuria, A.; Ravindranath, N.H. Climate change vulnerability assessment: Approaches DPSIR framework and vulnerability index. J. Earth Sci. Clim. Chang. 2012, 3, 109. [Google Scholar] [CrossRef]
- Berkovsky, B.M. Energy for Tomorrow’s World; The United Nations, Educational, Scientific and Cultural Organization: Paris, France, 1978; pp. 5–7. [Google Scholar]
- Chow, J.; Kopp, R.J.; Portney, P.R. Energy resources and global development. Science 2003, 302, 1528–1531. [Google Scholar] [CrossRef] [PubMed]
- Burkea, M.J.; Stephens, J.C. Political power and renewable energy futures: A critical review. Energy Res. Soc. Sci. 2018, 35, 78–93. [Google Scholar] [CrossRef]
- Dehghani-Sanij, M.R. Review of the book ‘Wind Towers: Architecture, Climate and Sustainability’. Int. J. Ambient Energy 2018. [Google Scholar] [CrossRef]
- Dehghani-Sanij, A.R.; Dehghani, S.R.; Naterer, G.F.; Muzychka, Y.S. Marine icing phenomena on vessels and offshore structures: Prediction and analysis. Ocean Eng. 2017, 143, 1–23. [Google Scholar] [CrossRef]
- Dehghani-Sanij, A.R.; Dehghani, S.R.; Naterer, G.F.; Muzychka, Y.S. Sea spray icing phenomena on marine vessels and offshore structures: Review and formulation. Ocean Eng. 2017, 132, 25–39. [Google Scholar] [CrossRef]
- Narimannejad, S. Review of the book ‘Cisterns: Sustainable development, architecture and energy’. Int. J. Ambient Energy 2018. [Google Scholar] [CrossRef]
- Soltani, M.; Kashkooli, F.M.; Dehghani-Sanij, A.R.; Kazemi, A.R.; Bordbar, N.; Farshchi, M.J.; Elmi, M.; Gharali, K.; Dusseault, M.B. A comprehensive study of geothermal heating and cooling systems. Sustain. Cities Soc. 2019, 44, 793–818. [Google Scholar] [CrossRef]
- Soltani, M.; Kashkooli, F.M.; Dehghani-Sanij, A.R.; Nokhosteen, A.; Ahmadi-Joughi, A.; Gharali, K.; Mahbaz, S.B.; Dusseault, M.B. A comprehensive review of geothermal energy evolution and development. Int. J. Green Energy 2019, 16, 971–1009. [Google Scholar] [CrossRef]
- Kazemi, A.R.; Mahbaz, S.B.; Dehghani-Sanij, A.R.; Dusseault, M.B.; Fraser, R. Performance evaluation of an enhanced geothermal system (EGS) in the Western Canada Sedimentary Basin. Renew. Sustain. Energy Rev. 2019, 113, 109278. [Google Scholar] [CrossRef]
- Moss, R.H. The next generation of scenarios for climate change research and assessment. Nature 2010, 463, 747–756. [Google Scholar] [CrossRef] [PubMed]
- IEA. CO2 Emissions from Fuel Combustion (Highlights), 2013 ed.; The International Energy Agency (IEA): Paris, France, 2013. [Google Scholar]
- Nejat, P.; Jomehzadeh, F.; Taheri, M.M.; Gohari, M.; Majid, M.Z.A. A global review of energy consumption, CO2 emissions and policy in the residential sector (with an overview of the top ten CO2 emitting countries). Renew. Sustain. Energy Rev. 2015, 43, 843–862. [Google Scholar] [CrossRef]
- Boden, T.; Andres, B. Global CO2 Emissions from Fossil-Fuel Burning, Cement Manufacture, and Gas Flaring: 1751–2013 Oak Ridge; Tennesse Carbon Dioxide Information Analysis Centre; Oak Ridge National Laboratory: Oak Ridge, TN, USA, 2016. [Google Scholar]
- Smith, K.; Barden, J.; Martin, P.; Kearney, D.; Murphy, E. International Energy Outlook 2013; Energy Information Administration: Washington, DC, USA, 2013. [Google Scholar]
- Heard, B.P.; Brook, B.W.; Wigley, T.M.L.; Bradshaw, C.J.A. Burden of proof: A comprehensive review of the feasibility of 100% renewable-electricity systems. Renew. Sustain. Energy Rev. 2017, 76, 1122–1133. [Google Scholar] [CrossRef]
- Hou, J.; Cao, M.; Liu, P. Development and utilization of geothermal energy in China: Current practices and future strategies. Renew. Energy 2018, 125, 401–412. [Google Scholar] [CrossRef]
- Kljajić, M.V.; Anđelković, A.S.; Hasik, V.; Munćan, V.M.; Bilec, M. Shallow geothermal energy integration in district heating system: An example from Serbia. Renew. Energy 2018. [Google Scholar] [CrossRef]
- Lund, J.W. Characteristics, development and utilization of geothermal resources. Geo Heat Cent. Q Bull. 2007, 28, 1–9. [Google Scholar]
- Grasby, S.E.; Allen, D.M.; Bell, S.; Chen, Z.; Ferguson, G.; Jessop, A.; Kelman, M.; Ko, M.; Majorowicz, J.; Moore, M.; et al. Geothermal Energy Resource Potential of Canada; open file 6914 (The GSC Report); Geological survey of Canada: Ottawa, ON, Canada, 2012. [Google Scholar] [CrossRef]
- Ahamed, M.S.; Guo, H.; Taylor, L.; Tanino, K. Heating demand and economic feasibility analysis for year-round vegetable production in Canadian Prairies greenhouses. Inf. Process. Agric. 2018, 6, 81–90. [Google Scholar] [CrossRef]
- Andrews, R.; Pearce, J.M. Environmental and economic assessment of a greenhouse waste heat exchange. J. Clean. Prod. 2011, 19, 1446–1454. [Google Scholar] [CrossRef] [Green Version]
- Aye, L.; Fuller, R.J.; Canal, A. Evaluation of a heat pump system for greenhouse heating. Int. J. Therm. Sci. 2010, 49, 202–208. [Google Scholar] [CrossRef] [Green Version]
- Golzar, F.; Heeren, N.; Hellweg, S.; Roshandel, R. A novel integrated framework to evaluate greenhouse energy demand and crop yield production. Renew. Sustain. Energy Rev. 2018, 96, 487–501. [Google Scholar] [CrossRef]
- Shen, Y.; Wei, R.; Xu, L. Energy consumption prediction of a greenhouse and optimization of daily average temperature. Energies 2018, 11, 65. [Google Scholar] [CrossRef]
- Boughanmi, H.; Lazaar, M.; Guizani, A. A performance of a heat pump system connected a new conic helicoidal geothermal heat exchanger for a greenhouse heating in the north of Tunisia. Sol. Energy 2018, 171, 343–353. [Google Scholar] [CrossRef]
- Kim, H.K.; Ao, S.I.; Amouzegar, M.A. Transactions on Engineering Technologies: Special Issue of the World Congress on Engineering and Computer Science 2013; Springer: Amsterdam, The Netherlands, 2014. [Google Scholar]
- Noorollahi, Y.; Bigdelou, P.; Pourfayaz, F.; Yousefi, H. Numerical modeling and economic analysis of a ground source heat pump for supplying energy for a greenhouse in Alborz province, Iran. J. Clean. Prod. 2016, 131, 145–154. [Google Scholar] [CrossRef]
- Russo, G.; Anifantis, A.S.; Verdiani, G.; Mugnozza, G.S. Environmental analysis of geothermal heat pump and LPG greenhouse heating systems. Biosyst. Eng. 2014, 127, 11–23. [Google Scholar] [CrossRef]
- Dutch Ministry of Agriculture, Nature and Food Quality. Manure—A valuable resource. Wageningen Livestock Research, Governments of the Netherlands, Second print. 2019. Available online: https://library.wur.nl/ WebQuery/wurpubs/fulltext/498084 (accessed on 15 October 2019).
- Kaag, S. About the Netherlands. Minister of Foreign Trade and Development Cooperation, Governments of the Netherlands. 2018. Available online: https://investinholland.com/wp-content/uploads/2019/06/ 2182_CU_TheNetherlandsCompared_2018_clickable.pdf (accessed on 15 October 2019).
- Slenders, H.L.A.; Bakker, L.; Bardos, P.; Verburg, R.; Alphenaar, A.; Darmendrail, D.; Nadebaum, P. There are more than three reasons to consider sustainable remediation, a dutch perspective hans. Remediation 2017, 27, 77–97. [Google Scholar] [CrossRef]
- Van Heekeren, E.V.; Koenders, M. The Netherlands country update on geothermal energy. In Proceedings of the World Geothermal Congress 2010, Bali, Indonesia, 25–29 April 2010. [Google Scholar]
- Melanie Provoost, M.; Albeda, L.; Godschalk, B.; Benno van der erff, B.; Schoof, F. Geothermal energy use, country update for the Netherlands. In Proceedings of the European Geothermal Congress 2019, Den Haag, The Netherlands, 11–14 June 2019. [Google Scholar]
- Godschalk, M.S.; Bakema, G. 20,000 ATES Systems in the Netherlands in 2020—Major step towards a sustainable energy supply. In Proceedings of the 11th International EFFSTOCK 2009—Thermal Energy Storage for Efficiency and Sustainability, Stockholm, Sweden, 14–17 June 2009. [Google Scholar]
- Aresti, L.; Christodoulides, P.; Florides, G. A review of the design aspects of ground heat exchangers. Renew. Sustain. Energy Rev. 2018, 92, 757–773. [Google Scholar] [CrossRef]
- Cao, S.J.; Kong, X.R.; Deng, Y.; Zhang, W.; Yang, L.; Ye, Z.P. Investigation on thermal performance of steel heat exchanger for ground source heat pump systems using full-scale experiments and numerical simulations. Appl. Therm. Eng. 2017, 115, 91–98. [Google Scholar] [CrossRef]
- Luo, J.; Rohn, J.; Xiang, W.; Bertermann, D.; Blum, P. A review of ground investigations for ground source heat pump (GSHP) systems. Energy Build. 2016, 117, 160–175. [Google Scholar] [CrossRef]
- Majorowicz, J.; Grasby, S.E. Geothermal energy for Northern Canada: Is it economical? Nat. Resour. Res. 2014, 23, 159–173. [Google Scholar] [CrossRef]
- Fang, L.; Diao, N.; Fang, Z.; Zhu, K.; Zhang, W. Study on the efficiency of single and double U-tube heat exchangers. Procedia Eng. 2017, 205, 4045–4051. [Google Scholar] [CrossRef]
- Lucia, U.; Simonetti, M.; Chiesa, G.; Grisolia, G. Ground-source pump system for heating and cooling: Review and thermodynamic approach. Renew. Sustain. Energy Rev. 2017, 70, 867–874. [Google Scholar] [CrossRef]
- Council of Canadian Academies (CCA). Aboriginal Food Security in Northern Canada: An Assessment of the State of Knowledge, Expert Panel on the State of Knowledge of Food Security in Northern Canada; The Council of Canadian Academies: Ottawa, ON, Canada, 2014. [Google Scholar]
- Pacey, A.; Cao, Z.; Sobol, I. Food insecurity among Inuit preschoolers: Nunavut Inuit Child Health Survey, 2007–2008. CMAJ 2010, 182, 243–248. [Google Scholar] [CrossRef]
- Misener, A.D. Heat flow and depth of permafrost at Resolute Bay, Cornwallis Island, N.W.T., Canada. Am. Geophys. Union 1955, 36, 1055–1060. [Google Scholar] [CrossRef]
- Statistics Canada (SC). Census Profile, 2016 Census, Resolute, Nunavut, 2016. Available online: https://www12.statcan.gc.ca/census-recensement/2016/dp-pd/prof/details/page.cfm?Lang=E&Geo1= CSD&Code1=6204022&Geo2=PR&Code2=62&Data=Count&SearchText=Resolute&SearchType=Begins& SearchPR=01&B1=All&GeoLevel=PR&GeoCode=6204022&TABID=1 (accessed on 21 August 2019).
- The Weather Network (WN). Available online: https://www.theweathernetwork.com/ca (accessed on 21 August 2019).
- Chan, H.M.; Fediuk, K.; Hamilton, S.; Rostas, L.; Caughey, A.; Kuhnlein, H.; Egeland, G.; Loring, E. Food security in Nunavut, Canada: Barriers and recommendations. Int. J. Circumpolar Health 2006, 65, 416–431. [Google Scholar] [CrossRef]
- Statistics Canada (SC). Data Tables, 2016 Census. Available online: https://www12.statcan.gc.ca/census-recensement/2016/dp-pd/dt-td/Rp-eng.cfm?LANG=E&APATH= 3&DETAIL=0&DIM=0&FL=A&FREE=0&GC=0&GID=0&GK=0&GRP=1&PID=110523&PRID=10& PTYPE=109445&S=0&SHOWALL=0&SUB=0&Temporal=2017&THEME=122&VID=0&VNAMEE= &VNAMEF (accessed on 21 August 2019).
- Statistics Canada (SC). Household Income in Canada: Key Results from the 2016 Census. Available online: https://www150.statcan.gc.ca/n1/daily-quotidien/170913/dq170913a-eng.htm (accessed on 21 August 2019).
- Ontario Hydro (OH). Electricity Rates by Province. 2013. Available online: http://www.ontario-hydro.com/ electricity-rates-by-province (accessed on 21 August 2019).
- Qulliq Energy Corporation (QEC). Customer Rates. Available online: https://www.qec.nu.ca/customer-care/accounts-and-billing/customer-rates (accessed on 21 August 2019).
- Chiefs of Ontario (CO). Ontario Region Report on the Adult, Youth and Children Living in First Nations Communities, First Nations Regional Health Survey (RHS), Phase 2 (2008/10), Ontario Region Final Report. 2012. Available online: https://fnigc.ca/sites/default/files/docs/first_nations_ regional_health_survey_rhs_phase_2_08-10_ontario_region_final_report_12nov01v8.pdf (accessed on 21 August 2019).
- Ford, J.D.; Pearce, T.; Duerden, F.; Furgal, C.; Smit, B. Climate change policy responses for Canada’s Inuit population: The importance of and opportunities for adaptation. Glob. Environ. Chang. 2010, 20, 177–191. [Google Scholar] [CrossRef]
- Statistics Canada (SC). Health Statistics Division, Health Reports, Catalogue no. 82-003-XIE, Vol. 12, No. 4, Canada. 2001. Available online: https://www150.statcan.gc.ca/n1/en/pub/82-003-x/82-003-x2000004-eng.pdf? st=tdhhx_2G (accessed on 21 August 2019).
- Wolever, T.M.S.; Hamad, S.; Gittelsohn, J.; Hanley, A.J.G.; Logan, A.; Harris, S.B.; Zinman, B. Nutrient intake and food use in an Ojibwa-Cree community in Northern Ontario assessed by 24h dietary recall. Nutr. Res. 1997, 17, 603–618. [Google Scholar] [CrossRef]
- AutoCAD 2018; Autodesk Inc.: San Rafael, CA, USA.
- Allemann, L.; Young, B. Vegetable Production in a Nutshell; Department of Agriculture and Rural Development: KwaZulu-Natal, South Africa, 2005; pp. 1–34. [Google Scholar]
- Berger, M.; Worlitschek, J. A novel approach for estimating residential space heating demand. Energy 2018, 159, 294–301. [Google Scholar] [CrossRef]
- Hahn, D.W.; Ozisik, M.N. Heat Conduction, 3rd ed.; Wiley: New York, NY, USA, 2012. [Google Scholar]
- SolexxTM. Solexx Greenhouses. Available online: http://www.solexx.com/solexx-faq.html (accessed on 21 August 2019).
- Gates, D. Transpiration and energy exchange. Q. Rev. Biol. 1966, 41, 353–364. [Google Scholar] [CrossRef]
- Katsoulas, N.; Kittitas, C. Greenhouse crop transpiration modelling. In Evapotranspiration—From Measurements to Agricultural and Environmental Applications; 2009; pp. 312–328. [Google Scholar] [CrossRef]
- Tew, R.K. Relations between transpiration, leaf temperatures, and some environmental factors. Master’s Thesis, Utah State University, Logan, UT, USA, 1962; p. 2788. Available online: https://digitalcommons.usu.edu/etd/2788 (accessed on 21 August 2019).
- Atlantic Provinces Advisory Committee on Vegetable Crops (APACVC); Atlantic Provinces Agricultural Services Coordinating Committee (Canada). Vegetable Crops Production Guide for the Atlantic Provinces; Atlantic Provinces Agriculture Services Co-ordinating Committee: Ottawa, ON, Canada, 1998. [Google Scholar]
- Bodolan, C.; Brătucu, G. Heat and light requirements of vegetable plants. In Proceedings of the 5th International Conference Computational Mechanics and Virtual Engineering, COMEC (2013), Brasov, Romania, 24–25 October 2013; pp. 361–364. [Google Scholar]
- Olfati, J.A.; Shabani, H. An estimation of individual leaf area in cabbage and broccoli using non-destructive methods. J. Agric. Sci. Technol. 2010, 12, 627–632. [Google Scholar]
- Canakci, M.; Emekli, N.; Bilgin, S.; Caglayan, N. Heating requirement and its costs in greenhouse structures: A case study for Mediterranean region of Turkey. Renew. Sustain. Energy Rev. 2013, 24, 483–490. [Google Scholar] [CrossRef]
- Natural Resources Canada (NRC). Photovoltaic and Solar Resource Maps. 2017. Available online: https://www.nrcan.gc.ca/18366 (accessed on 21 August 2019).
- Neu, O.; Oxizidis, S.; Flynn, D.; Pallonetto, F.; Finn, D. High resolution space–time data: Methodology for residential building simulation modelling. In Proceedings of the BS2013: 13th Conference of International Building Performance Simulation Association, Chambéry, France, 25–28 August 2013; pp. 2428–2435. [Google Scholar]
- Nardelli, A.; Deuschle, E.; de Azevedo, L.D.; Pessoa, J.L.N.; Ghisi, E. Assessment of light emitting diodes technology for general lighting: A critical review. Renew. Sustain. Energy Rev. 2017, 75, 368–379. [Google Scholar] [CrossRef]
- Minnick, M.; Hickson, C.; Rowe, T. Nunavut Geothermal Feasibility Study; Topical Report RSI-2828; NU, Canada, 2018. [Google Scholar]
- Rolandone, F.; Jaupart, C.; Mareschal, J.C.; Gariépy, C.; Bienfait, G.; Carbonne, C.; Lapointe, R. Surface heat flow, crustal temperatures and mantle heat flow in the Proterozoic Trans-Hudson Orogen, Canadian Shield. JGR Solid Earth 2002, 107, ETG 7-1–ETG 7-19. [Google Scholar] [CrossRef]
- Acuña, J.; Palm, B. Local conduction heat transfer in U-pipe borehole heat exchangers. In Proceedings of the COMSOL Conference, Milan, Italy; 2009. [Google Scholar]
- Carrier. Carrier Heat Pumps. 2019. Available online: https://www.carrier.com/residential/en/ca/ products/geothermal-heat-pumps (accessed on 21 August 2019).
- Therodore, L. Heat Transfer Applications for the Practicing Engineer; Wiley: New York, NY, USA, 2011. [Google Scholar]
- Government of Canada (GC). Eating Well with Canada’s Food Guide. 2011. Available online: https://www.canada.ca/content/dam/hc-sc/migration/hc-sc/fn-an/alt_formats/hpfb-dgpsa/pdf/food-guide-aliment/print_eatwell_bienmang-eng.pdf (accessed on 21 August 2019).
- Irrigation Direct Canada (IDC). ¼ Drip Emitter Tubing (Soaker Hose). 2019. Available online: https://www.irrigationdirect.ca/1-4-Drip-Emitter-Tubing-Soaker-Hose (accessed on 21 August 2019).
- O’Connor, N.; Mehta, K. Modes of greenhouse water savings. Procedia Eng. 2016, 159, 259–266. [Google Scholar] [CrossRef]
- Irrigation Direct Canada (IDC). 727972, Leader Ecojet 110 ½ HP 1, 115 Volt, 960 GPH. 2019. Available online: https://www.irrigationdirect.ca/727972-leader-ecojet-120-1-2-hp-1-115-volt-960-gph-lead 7279741.html (accessed on 21 August 2019).
- Uline. IBC Tank, 330 Gallon. 2019. Available online: https://www.uline.ca/Product/Detail/H-4420/Tanks/IBC-Tank-330-Gallon?pricode=YD853&gadtype=pla&id=H-4420&gclid= CjwKCAiA99vhBRBnEiwAwpk-uHuU791cFJ9BwhSD_3eqdyhkKyArspyRiQvTssb6cOb_ E3yuGafBuBoCNhkQAvD_BwE&gclsrc=aw.ds (accessed on 21 August 2019).
- Triton Power Corporation (TPC). Subsidary of American Generators Corporation, Maimi, FL. 2019. Available online: https://www.americasgenerators.com/uploads/docs/100%20kW%20Perkins% 20Diesel%20 Generator% 20Set%20-%20Non%20EPA%20TP-P100-T1-60.pdf (accessed on 21 August 2019).
- Fluence. Lighting Costs. 2019. Available online: https://fluence.science/store/ray-series/ray66. and https://2xuwao2gok1v2wn2em9n5ys8-wpengine.netdna-ssl.com/wp-content/uploads/2017/03/ RAY_User_Guide-3.7.17.pdf (accessed on 21 August 2019).
- Greenhouse Megastore (GHM). Greenhouse Frame Costs. 2019. Available online: https://www.greenhousemegastore.com/structures/high-tunnels-hoop-houses/fieldpro-gable-high-tunnel?returnurl=%2Fstructures%2Fhigh-tunnels-hoop-houses%2F (accessed on 21 August 2019).
- Wayfair. Solexx Cover Price. 2019. Available online: https://www.wayfair.ca/brand/bnd/solexx-b665.html (accessed on 21 August 2019).
- Sealift Rates for 2018 Season. Eason, Nunavut. 2018. Available online: https://neas.cawp-contentuploadsfreight_nunavut.pdf (accessed on 21 August 2019).
- Heidinger, P. Integral modeling and financial impact of the geothermal situation and power plant at Soultz-sous-Forêts. Comptes Rendus Geosci. 2010, 342, 626–635. [Google Scholar] [CrossRef]
- Ontario Hydro (OH). Ontario Hydro Rates. 2019. Available online: http://www.ontario-hydro.com/current-rates (accessed on 21 August 2019).
- Government of Nunavut (GON). 2017. Nunavut Food Price Survey: Price Comparisions Per Kilogram and Litre. 2017. Available online: https://www.gov.nu.ca/sites/default/files/2017_nunavut_ food_price_survey_price_comparisons_per_kilogram_and_litre_report_1.pdf (accessed on 21 August 2019).
- U.S Food and Drug Administrations (USFDA). Vegetables Nutrition Facts. 2008. Available online: https://www.fda.gov/files/food/published/Nutrition-Information-for-Raw-Vegetables---Small-PDF-poster.pdf (accessed on 21 August 2019).
- Government of Nunavut (GON). Petroleum Products Division, Retail Price List. 2019. Available online: https://www.gov.nu.ca/sites/default/files/retail_price_list_1-jul-19_carbon_tax_0.Pdf (accessed on 21 August 2019).
- Touchette, Y.; Gass, P.; Echeverría, D. Costing Energy and Fossil Fuel Subsidies in Nunavut: A mapping exercise, IISD Report, 2017 International Institute for Sustainable Development, WWF-Canada. 2017. Available online: http://assets.wwf.ca/downloads/costing_fossil_fuel_subsidies_in_nunavut.pdf (accessed on 21 August 2019).
- Mahbaz, M.B.; Dehghani-Sanij, A.R.; Dusseault, M.B.; Nathwani, J.S. Enhanced, Integrated Geothermal System for Sustainable Development of Canada’s Northern Communities. In Sustainable Energy Technologies and Assessments; 2019; (under review). [Google Scholar]
- Dehghani-Sanij, A.R.; Mahbaz, S.B.; Dusseault, M.B. Feasibility study of enhanced geothermal Energy secondary application for agricultural production in Canadian Northern territories. In Proceedings of the 46th Annual Yellowknife Geoscience Forum Abstracts, Northwest Territories Geological Survey, Yellowknife, NT, Canada; 2018. [Google Scholar]
- Isa, N.M.; Das, H.S.; Tan, C.W.; Yatim, A.H.M.; Lau, K.Y. A techno-economic assessment of a combined heat and power photovoltaic/fuel cell/battery energy system in Malaysia hospital. Energy 2016, 112, 75–90. [Google Scholar] [CrossRef]
- Cary, R. The Future of Gas Power, Critical Market and Technology Issues; A Green Alliance briefing: London, UK, 2012. [Google Scholar]
- Gringarten, A.C.; Sauty, J.P. A theoretical study of heat extraction from aquifers with uniform regional flow. J. Geophys. Res. 1975, 80, 4956–4962. [Google Scholar] [CrossRef]
- Lippmann, M.J.; Tsang, C.F. Ground-water use for cooling: Associated aquifer temperature changes. Ground Water 1980, 18, 452–458. [Google Scholar] [CrossRef]
- Wellmann, J.F.; Horowitz, F.G.; Schill, E.; Regenauer-Lieb, K. Towards incorporating uncertainty of structural data in 3D geological inversion. Tectonophysics 2010, 490, 141–151. [Google Scholar] [CrossRef]
- Ragnarsson, Á. Geothermal development in Iceland 2010–2014. In Proceedings of the World Geothermal Congress 2015, Melbourne, Australia, 19–25 April 2015. [Google Scholar]
- Madsen, D.Ø. SWOT Analysis: A Management Fashion Perspective. Int. J. Bus. Res. 2016, 16, 39–56. [Google Scholar] [CrossRef]
- Andrijanovits, A.; Hoimoja, H.; Vinnikov, D. Comparative review of long-term energy storage technologies for renewable energy systems. Electron. Electr. Eng. 2012, 2, 21–26. [Google Scholar] [CrossRef]
- MacDonald, J.P.; Harper, S.L.; Willox, A.C.; Edge, V.L. Rigolet inuit community government. A necessary voice: Climate change and lived experiences of youth in Rigolet, Nunatsiavut, Canada. Glob. Environ. Chang. 2013, 23, 360–371. [Google Scholar] [CrossRef]
- Ford, J.D.; Macdonald, J.P.; Huet, C.; Statham, S.; MacRury, A. Food policy in the Canadian North: Is there a role for country food markets? Soc. Sci. Med. 2016, 152, 35–40. [Google Scholar] [CrossRef] [PubMed]
- Lysenko, D.; Schott, S. Food security and wildlife management in Nunavut. Ecol. Econ. 2019, 156, 360–374. [Google Scholar] [CrossRef]
- Ford, J.D.; Beaumier, M. Feeding the family during times of stress: Experience and determinants of food insecurity in an Inuit community. Geogr. J. 2011, 177, 44–61. [Google Scholar] [CrossRef] [PubMed]
- Lowitt, K.; Johnston-Weiser, D.; Lauzon, R.; Hickey, G.M. On food security and access to fish in the Saugeen Ojibway Nation, Lake Huron, Canada. J. Great Lakes Res. 2018, 44, 174–183. [Google Scholar] [CrossRef]
- Reading, J. Confronting the growing crisis of cardiovascular disease and heart health among aboriginal peoples in Canada. Can. J. Cardiol. 2015, 31, 1077–1080. [Google Scholar] [CrossRef]
- Tobe, S.W.; Maar, M.; Roy, M.A.; Warburton, D.E.R. Preventing cardiovascular and renal disease in Canada’s aboriginal populations. Can. J. Cardiol. 2015, 31, 1124–1129. [Google Scholar] [CrossRef]


| Shape | Pvalue |
|---|---|
| Pentagonal Prism | 1.56 |
| Geodesic Dome | 2 |
| Triangular Prism | 0.66 |
| Square-based Pyramid | 2.3 |
| Rectangular Prism | 2.86 |
| Plant | Area (m2) Per Plant | Yield Per m2 | Yield Per Plant |
|---|---|---|---|
| Tomato | 0.58 | 33.78 | 19.59 |
| Cucumber | 0.1089 | 21.02 | 2.89 |
| Pepper | 0.09 | 20.27 | 1.82 |
| Spinach | 0.04 | 50 | 2.0 |
| Cabbage | 0.16 | 71.43 | 11.4288 |
| Broccoli | 0.2025 | 8.38 | 1.70 |
| Onion | 0.0317 | 20.27 | 0.64 |
| Carrots | 0.016 | 38.46 | 0.62 |
| Plant | # of Plants | % of Total Plants | Servings |
|---|---|---|---|
| Tomato | 250 | 25 | 4898 |
| Cucumber | 0 | 0 | 0 |
| Pepper | 300 | 30 | 547 |
| Spinach | 0 | 0 | 0 |
| Cabbage | 250 | 25 | 2857 |
| Broccoli | 0 | 0 | 0 |
| Onion | 200 | 20 | 129 |
| Carrots | 0 | 0 | 0 |
| Total | 1000 | 100 | 8431 |
| Plant | LAI (m2/m2) | TA (m2) |
|---|---|---|
| Tomato | 3 | 0.58 |
| Cucumber | 3.5 | 0.1089 |
| Pepper | 5 | 0.9 |
| Spinach | 0.9 | 0.04 |
| Cabbage | 1.15 | 0.16 |
| Broccoli | 0.97 | 0.2025 |
| Onions | 2 | 0.0317 |
| Carrots | 0.9 | 0.016 |
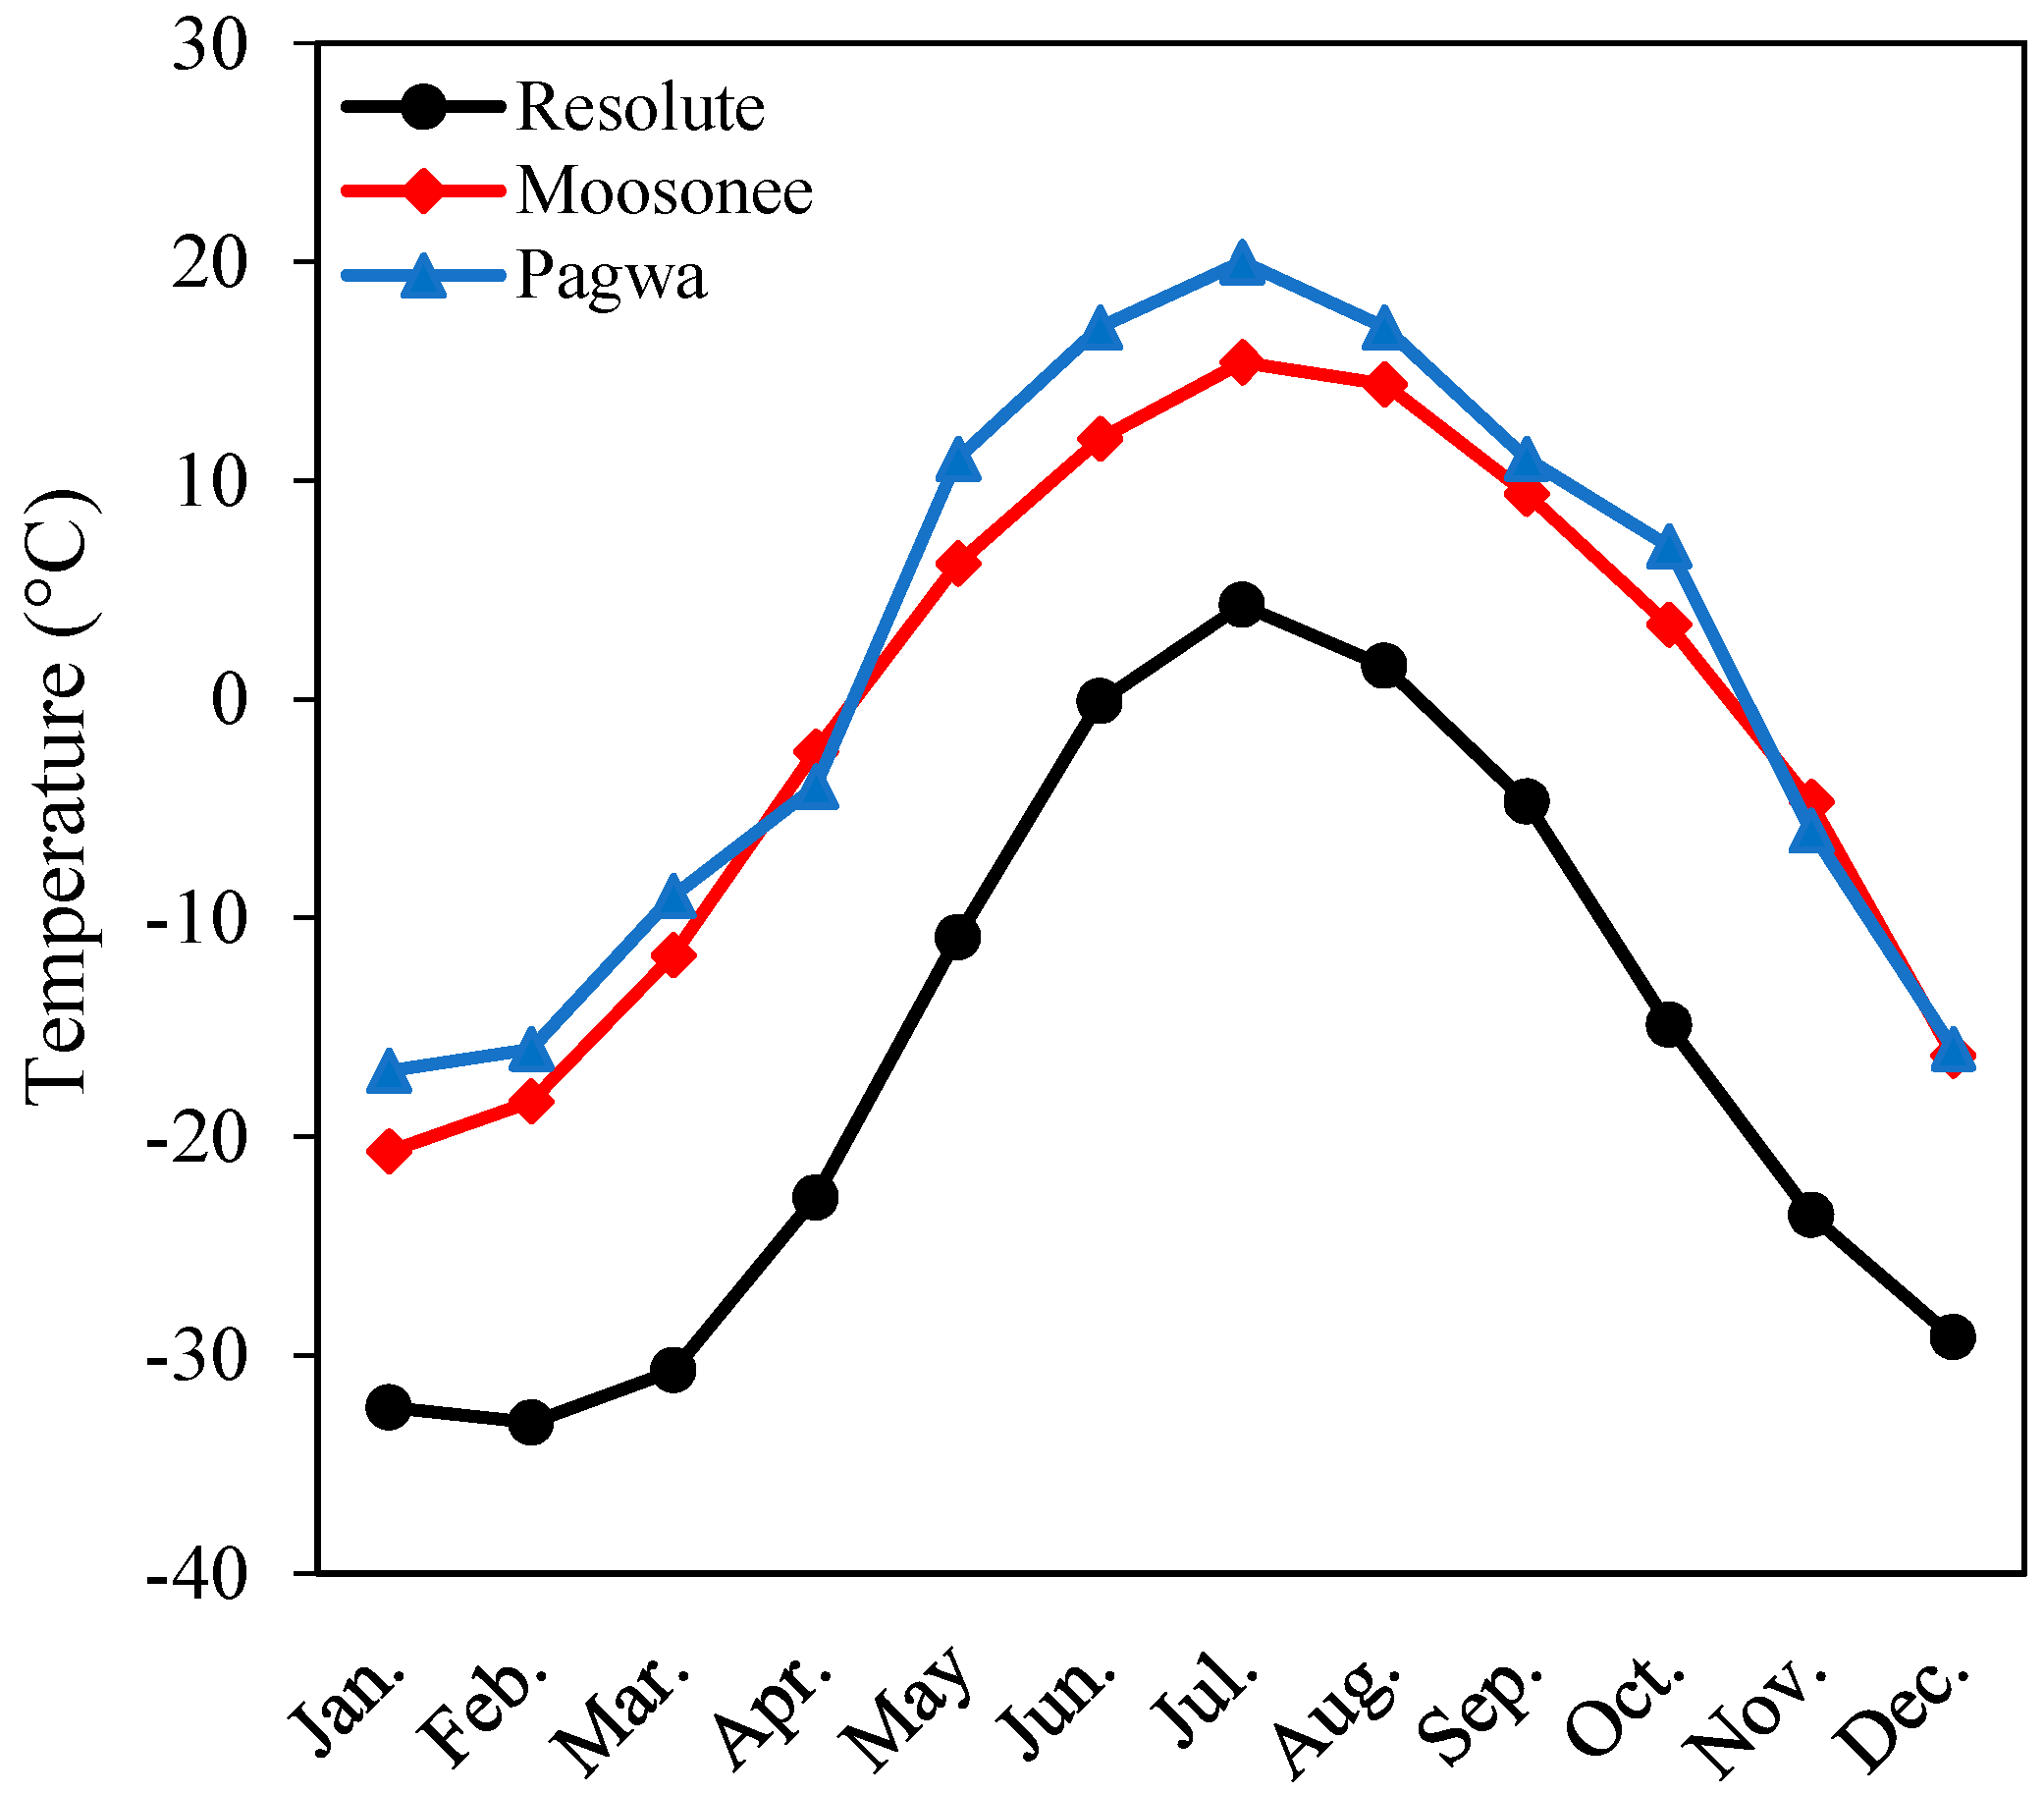
| Jan. | Feb. | Mar. | Apr. | May | Jun. | Jul. | Aug. | Sept. | Oct. | Nov. | Dec. | |
|---|---|---|---|---|---|---|---|---|---|---|---|---|
| Resolute | 0 | 0.16 | 1.35 | 3.91 | 6.22 | 6.48 | 5.11 | 2.93 | 1.36 | 0.33 | 0.01 | 0 |
| Moosonee | 1.13 | 2.18 | 3.58 | 4.87 | 5.46 | 5.75 | 5.44 | 4.47 | 2.97 | 1.71 | 0.96 | 0.83 |
| Pagwa (Caramat) | 1.24 | 2.23 | 3.58 | 4.86 | 5.55 | 5.82 | 5.76 | 4.75 | 3.18 | 1.89 | 1.09 | 0.94 |
| Capacity (kW) | Power input (kW) | Price (CAD) |
|---|---|---|
| 17 | 5 | 5700 |
| 30.5 | 10 | 25,000 |
| 60 | 15 | 50,000 |
| 73 | 18 | 65,000 |
| 87 | 25 | 75,000 |
| 107 | 27 | 100,000 |
| 122 | 30 | 125,000 |
| ON | 700 m | 800 m | 900 m | 1000 m | 1100 m |
|---|---|---|---|---|---|
| Ground T (°C) | 17.5 | 20.0 | 22.5 | 25.0 | 27.5 |
| Water T (°C) | 5.8 | 6.5 | 7.1 | 7.9 | 8.5 |
| Resolute | 1900 m | 2100 m | 2300 m | 2500 m |
|---|---|---|---|---|
| Ground T (°C) | 25.5 | 59.5 | 66.5 | 73.5 |
| Water T (°C) | 13.6 | 15.5 | 17.4 | 19.2 |
| Code | Greenhouse | Servings |
|---|---|---|
| A | 1 × 48′ × 30′ | 12,384 |
| B | 3 × 48′ × 30′ | 37,152 |
| C | 1 × 96′ × 30′ | 25,293 |
| D | 3 × 96′ × 30′ | 75,879 |
| Resolute | Moosonee | Pagwa | Summer Beaver | Aroland | Hornepayne | |
|---|---|---|---|---|---|---|
| Population (in 2016) | 198 | 1481 | 2865 | 382 | 366 | 980 |
| Yearly servings | 578,160 | 4,380,000 | 8,365,800 | 1,115,440 | 1,068,720 | 2,861,600 |
| % Satisfied (A) | 2.1 | 0.3 | 0.15 | 1.1 | 1.2 | 0.4 |
| % Satisfied (B) | 6.4 | 0.8 | 0.4 | 3.3 | 3.5 | 1.3 |
| % Satisfied (C) | 4.4 | 0.6 | 0.3 | 2.3 | 2.4 | 0.9 |
| % Satisfied (D) | 13.1 | 1.5 | 0.9 | 6.8 | 7.1 | 2.7 |
| Power (kW) | Cost (CAD) |
|---|---|
| 35 | 17,000 |
| 45 | 18,000 |
| 100 | 19,750 |
| 150 | 23,300 |
| 300 | 51,500 |
| Item | 1 Greenhouse | 3 Greenhouses |
|---|---|---|
| 96′ × 30′ frame | $5300 | $15,900 |
| 20′ sealift containers | $12,400 | $37,200 |
| SolexxTM double layering | $27,200 | $81,600 |
| RAY66 LED grow lights | $48,880 | $146,640 |
| Subfloor | $6322 | $18,966 |
| 1/2′′ OSB | $1620 | $4860 |
| 1.5′′ EPS | 2070.0 | $6210 |
| Linoleum tile | $2736 | $8208 |
| 2′′× 10′′× 12′ | $504 | $1512 |
| 2′′× 6′′× 12′ | $2250 | $6750 |
| 3 Doors | $750 | $2250 |
| Water pump | $345 | $1035 |
| Irrigation hose | $115 | $345 |
| Heating ducts | $530 | $1590 |
| Water tank | $682 | $2046 |
| Building costs | $111,704 | $335,112 |
| Max. Energy consumption (kW) | 43.5 | 88.7 |
| Geothermal Heated | ||
| Boreholes | $4,800,000 | $14,400,000 |
| Pumps | $50,000 | $100,000 |
| 1 × 60 kW | 1 × 10⁷ kW | |
| Generator | $18,000 | $23,300 |
| Total cost | $4,979,704 | $14,854,862 |
| Energy input needed | 35.6 | 91.8 |
| SPF * | 2.8 | 3.2 |
| Item | 1 Greenhouse | 3 Greenhouses |
|---|---|---|
| 96′ × 30′ frame | $5300 | $15,900 |
| SolexxTM double layering | $27,200 | $81,600 |
| RAY66 LED grow lights | $48,880 | $146,640 |
| Subflooring | $6322 | $18,966 |
| 1/2′′ OSB | $1620 | $4860 |
| 1.5′′ EPS | $2070 | $6210 |
| Linoleum tile | $2736 | $8208 |
| 2′′× 10′′× 12′ | $504 | $1512 |
| 2′′× 6′′× 12′ | $2250 | $6750 |
| 3 Doors | $750 | $2250 |
| Water pump | $345 | $1035 |
| Irrigation hose | $115 | $345 |
| Heating Ducts | $530 | $1590 |
| Water tank | $682 | $2046 |
| Building costs | $99,304 | $297,912 |
| Servings | 24,765 | 74,295 |
| Max. Energy consumption (kW) | 42.5 | 86.7 |
| Geothermal Heated | ||
| Boreholes | $1,300,000 | $5,200,000 |
| Pumps | $50,000 | $100,000 |
| 1 × 60 kW | 1*107 kW | |
| Generator | $18,000 | $23,300 |
| Total cost | $1,467,304 | $5,617,662 |
| Energy input needed | 35.6 | 91.8 |
| SPF | 2.9 | 3.3 |
| 1 Greenhouse | 3 Greenhouses | Location | |
|---|---|---|---|
| Diesel for generator (L/hr) | 7.5 | 23 | |
| Water for vegetables (L/day) | 7.4 | 177.5 | |
| Diesel (daily) | 207 CAD | 635 CAD | Resolute |
| Electricity (daily) | 820 CAD | 3,010 CAD | |
| Yearly cost (diesel) | 75,555 CAD | 231,702 CAD | |
| Yearly cost (electricity) | 299,300 CAD | 897,900 CAD | |
| Cost per serving | 3 CAD | 3 CAD | |
| Diesel (daily) | 207 CAD | 635 CAD | Ontario |
| Electricity (daily) | 238 CAD | 660 CAD | |
| Yearly cost (diesel) | 75,555 CAD | 231,702 CAD | |
| Yearly cost (electricity) | 86,870 CAD | 260,610 CAD | |
| Cost per serving | 3 CAD | 3 CAD |
© 2019 by the authors. Licensee MDPI, Basel, Switzerland. This article is an open access article distributed under the terms and conditions of the Creative Commons Attribution (CC BY) license (http://creativecommons.org/licenses/by/4.0/).
Share and Cite
Kinney, C.; Dehghani-Sanij, A.; Mahbaz, S.; Dusseault, M.B.; Nathwani, J.S.; Fraser, R.A. Geothermal Energy for Sustainable Food Production in Canada’s Remote Northern Communities. Energies 2019, 12, 4058. https://doi.org/10.3390/en12214058
Kinney C, Dehghani-Sanij A, Mahbaz S, Dusseault MB, Nathwani JS, Fraser RA. Geothermal Energy for Sustainable Food Production in Canada’s Remote Northern Communities. Energies. 2019; 12(21):4058. https://doi.org/10.3390/en12214058
Chicago/Turabian StyleKinney, Carson, Alireza Dehghani-Sanij, SeyedBijan Mahbaz, Maurice B. Dusseault, Jatin S. Nathwani, and Roydon A. Fraser. 2019. "Geothermal Energy for Sustainable Food Production in Canada’s Remote Northern Communities" Energies 12, no. 21: 4058. https://doi.org/10.3390/en12214058