Feasibility Study of Fluctuating Wind Pressure around High-Rise Buildings as a Potential Energy-Harvesting Source


Abstract
1. Introduction
2. Experimental Study of Wind Pressure Around High-Rise Buildings
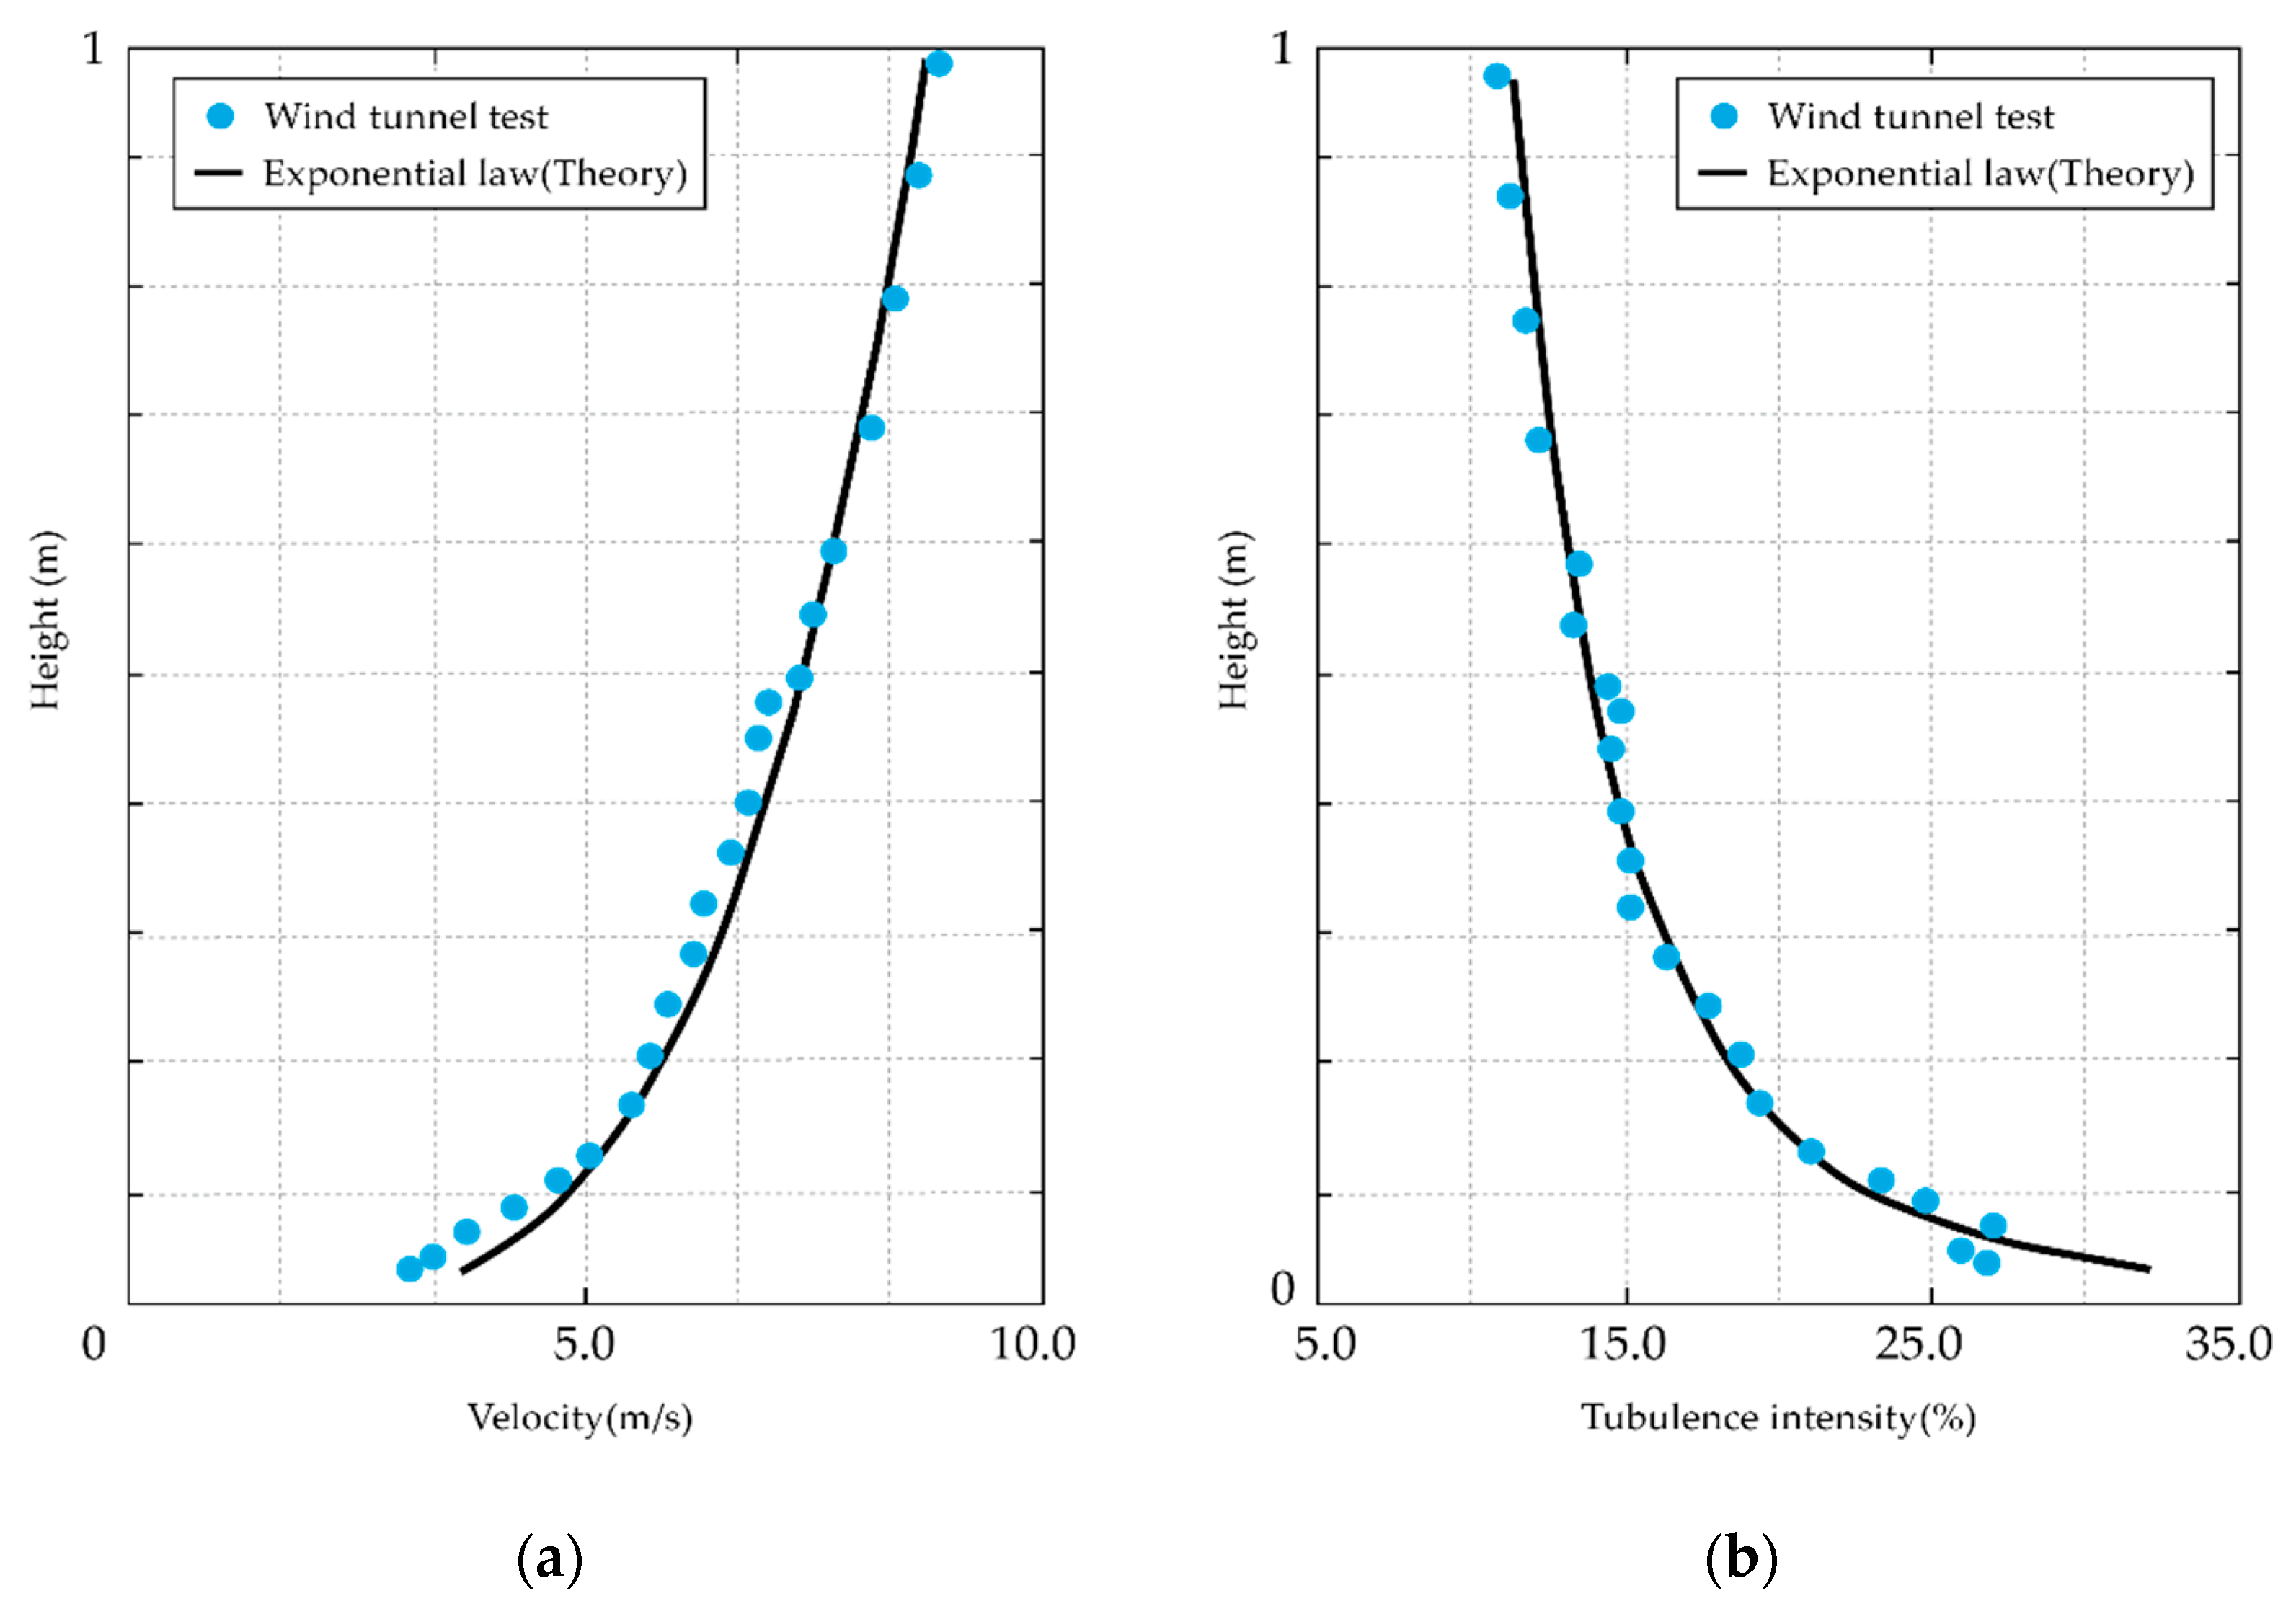
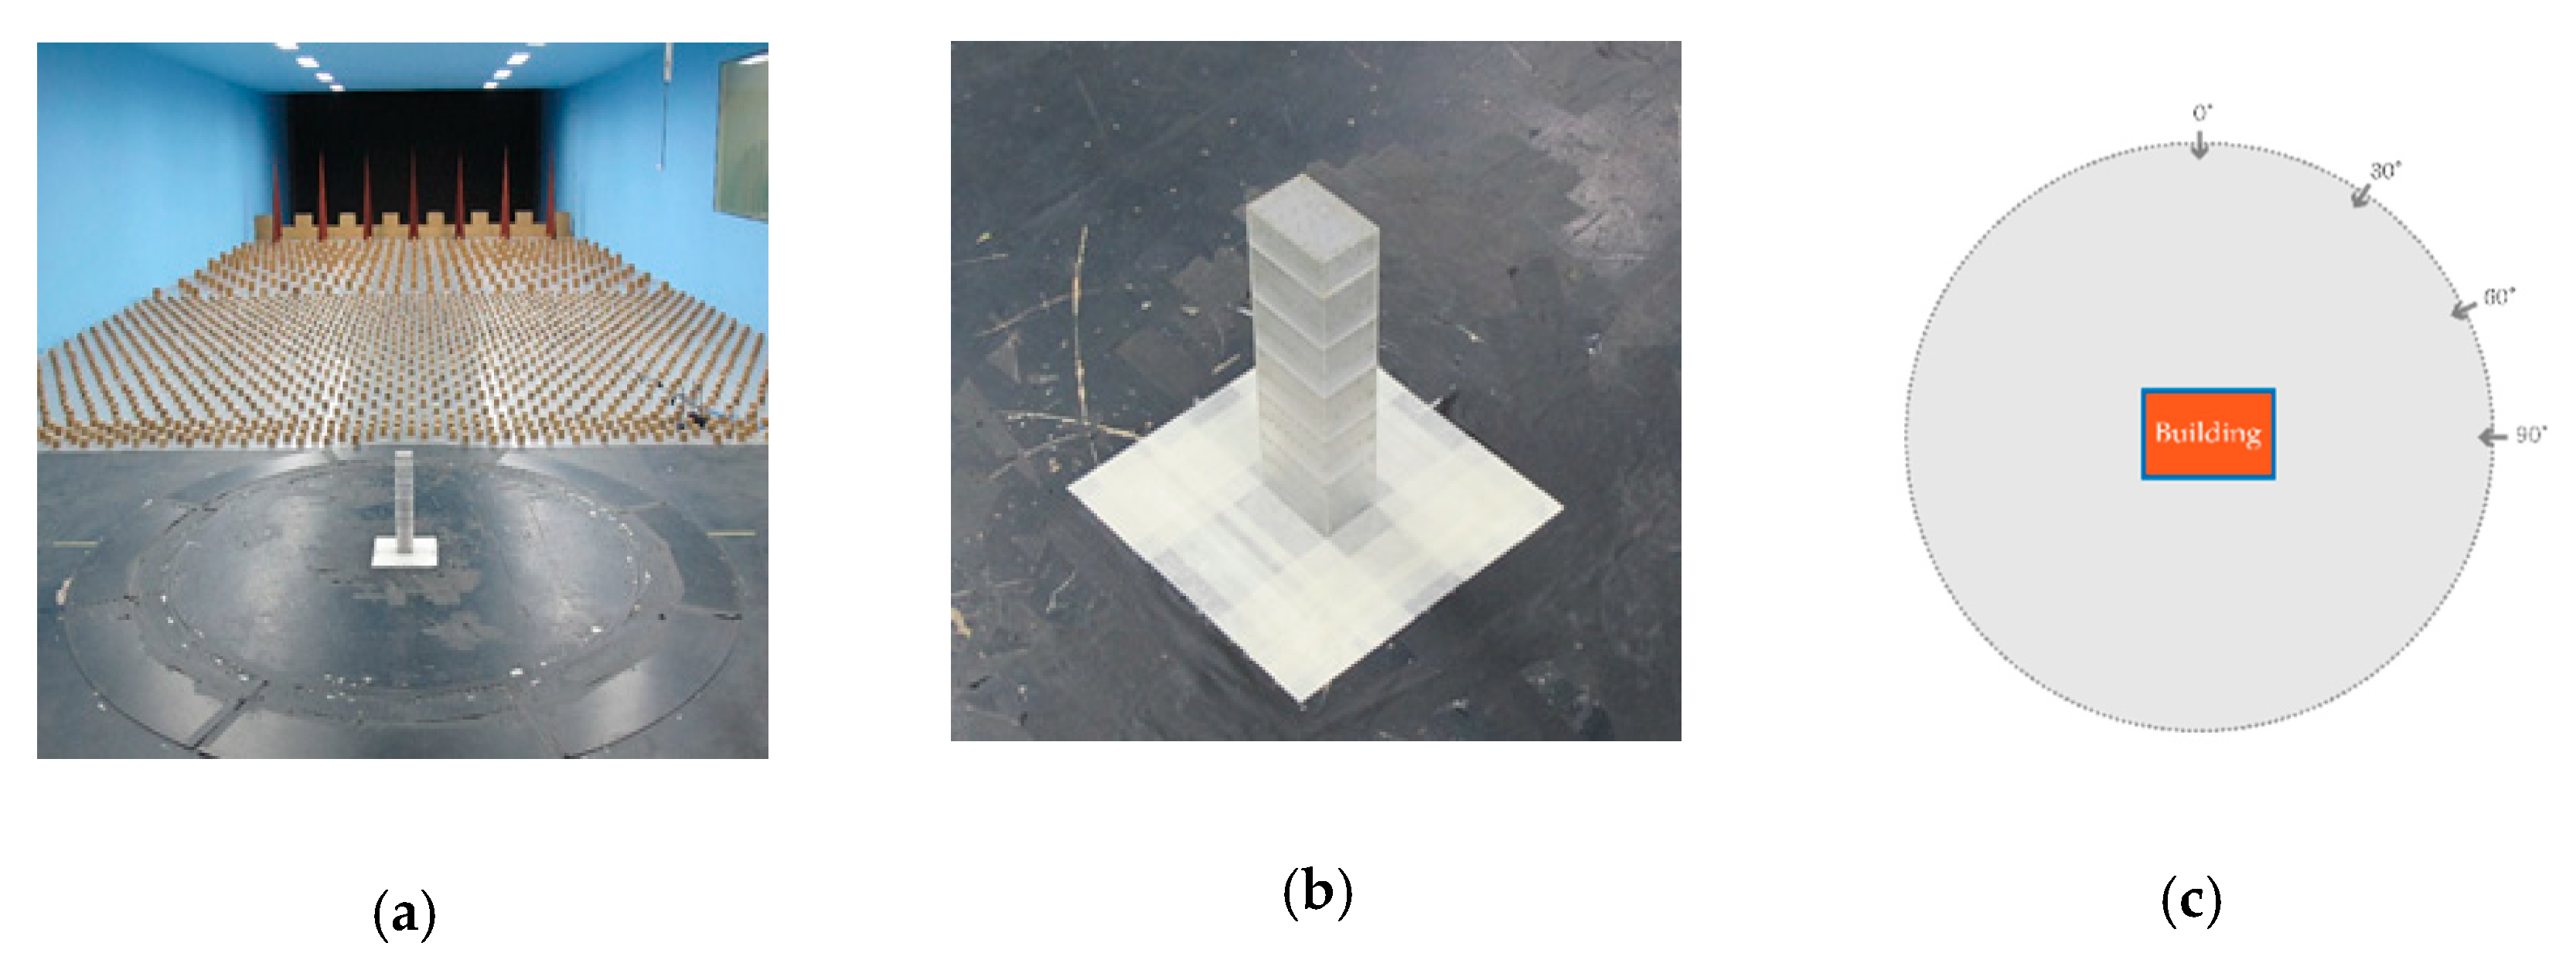
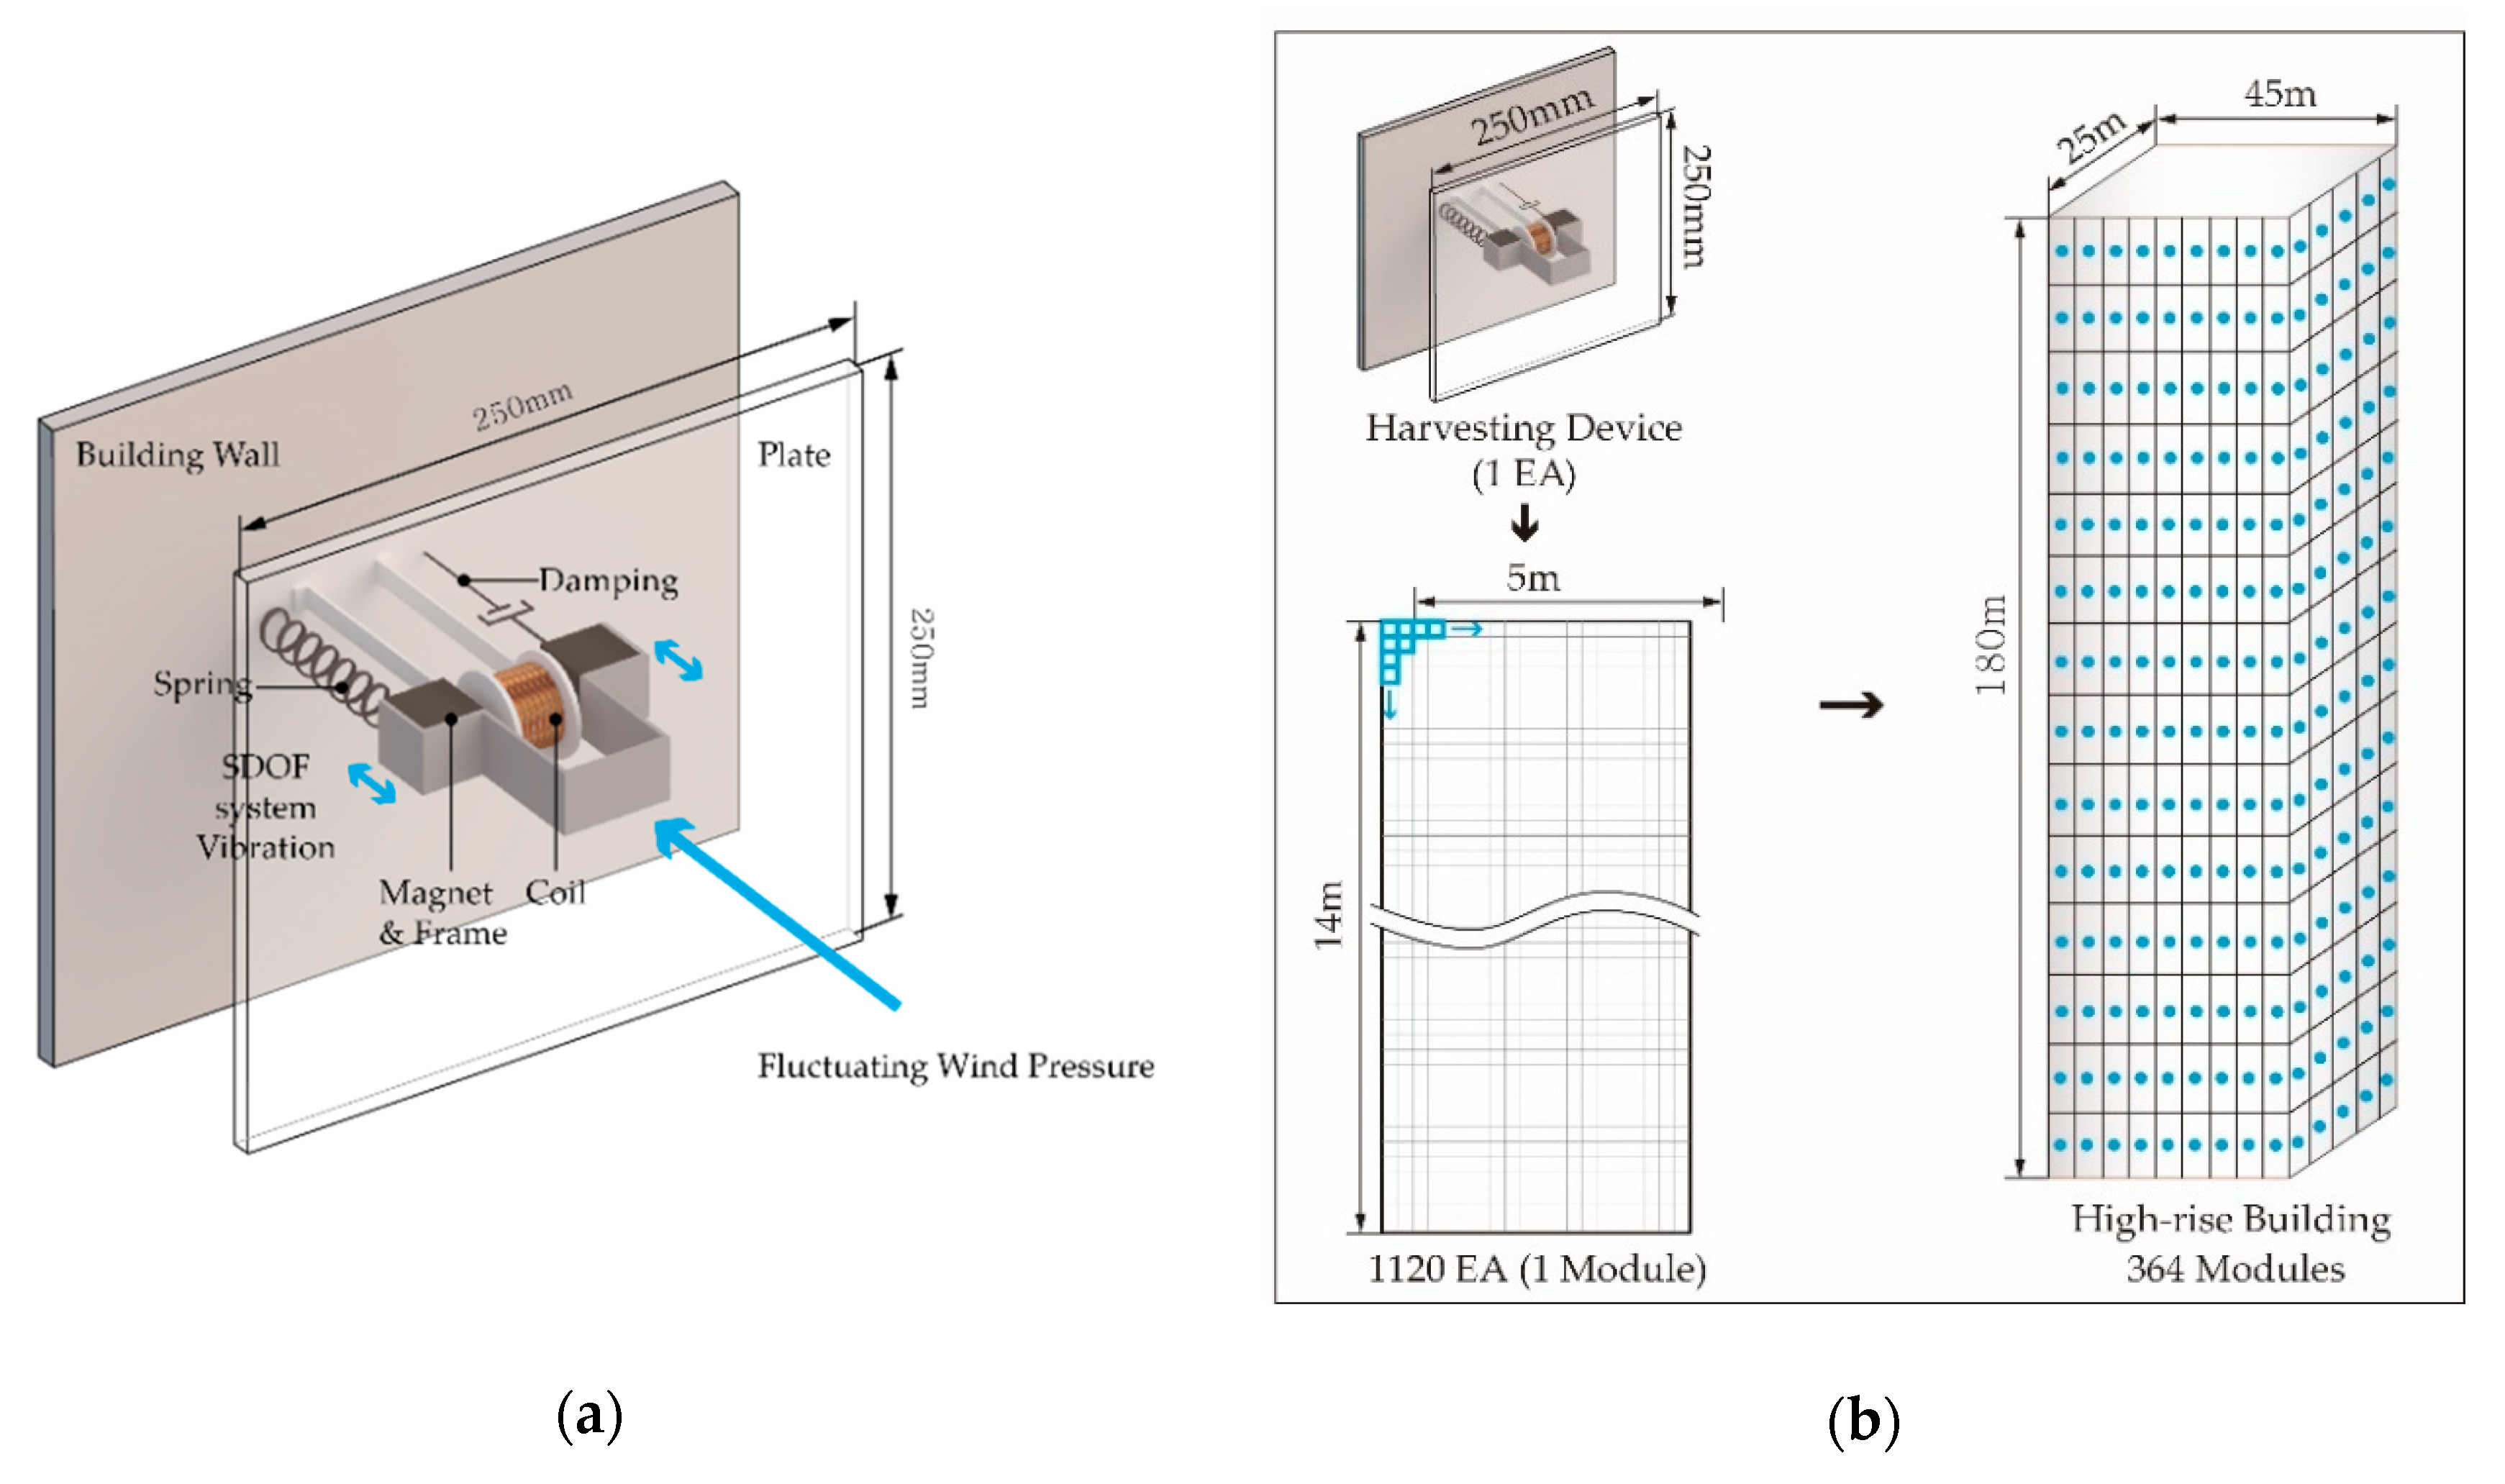
2.1. Experimental Setting
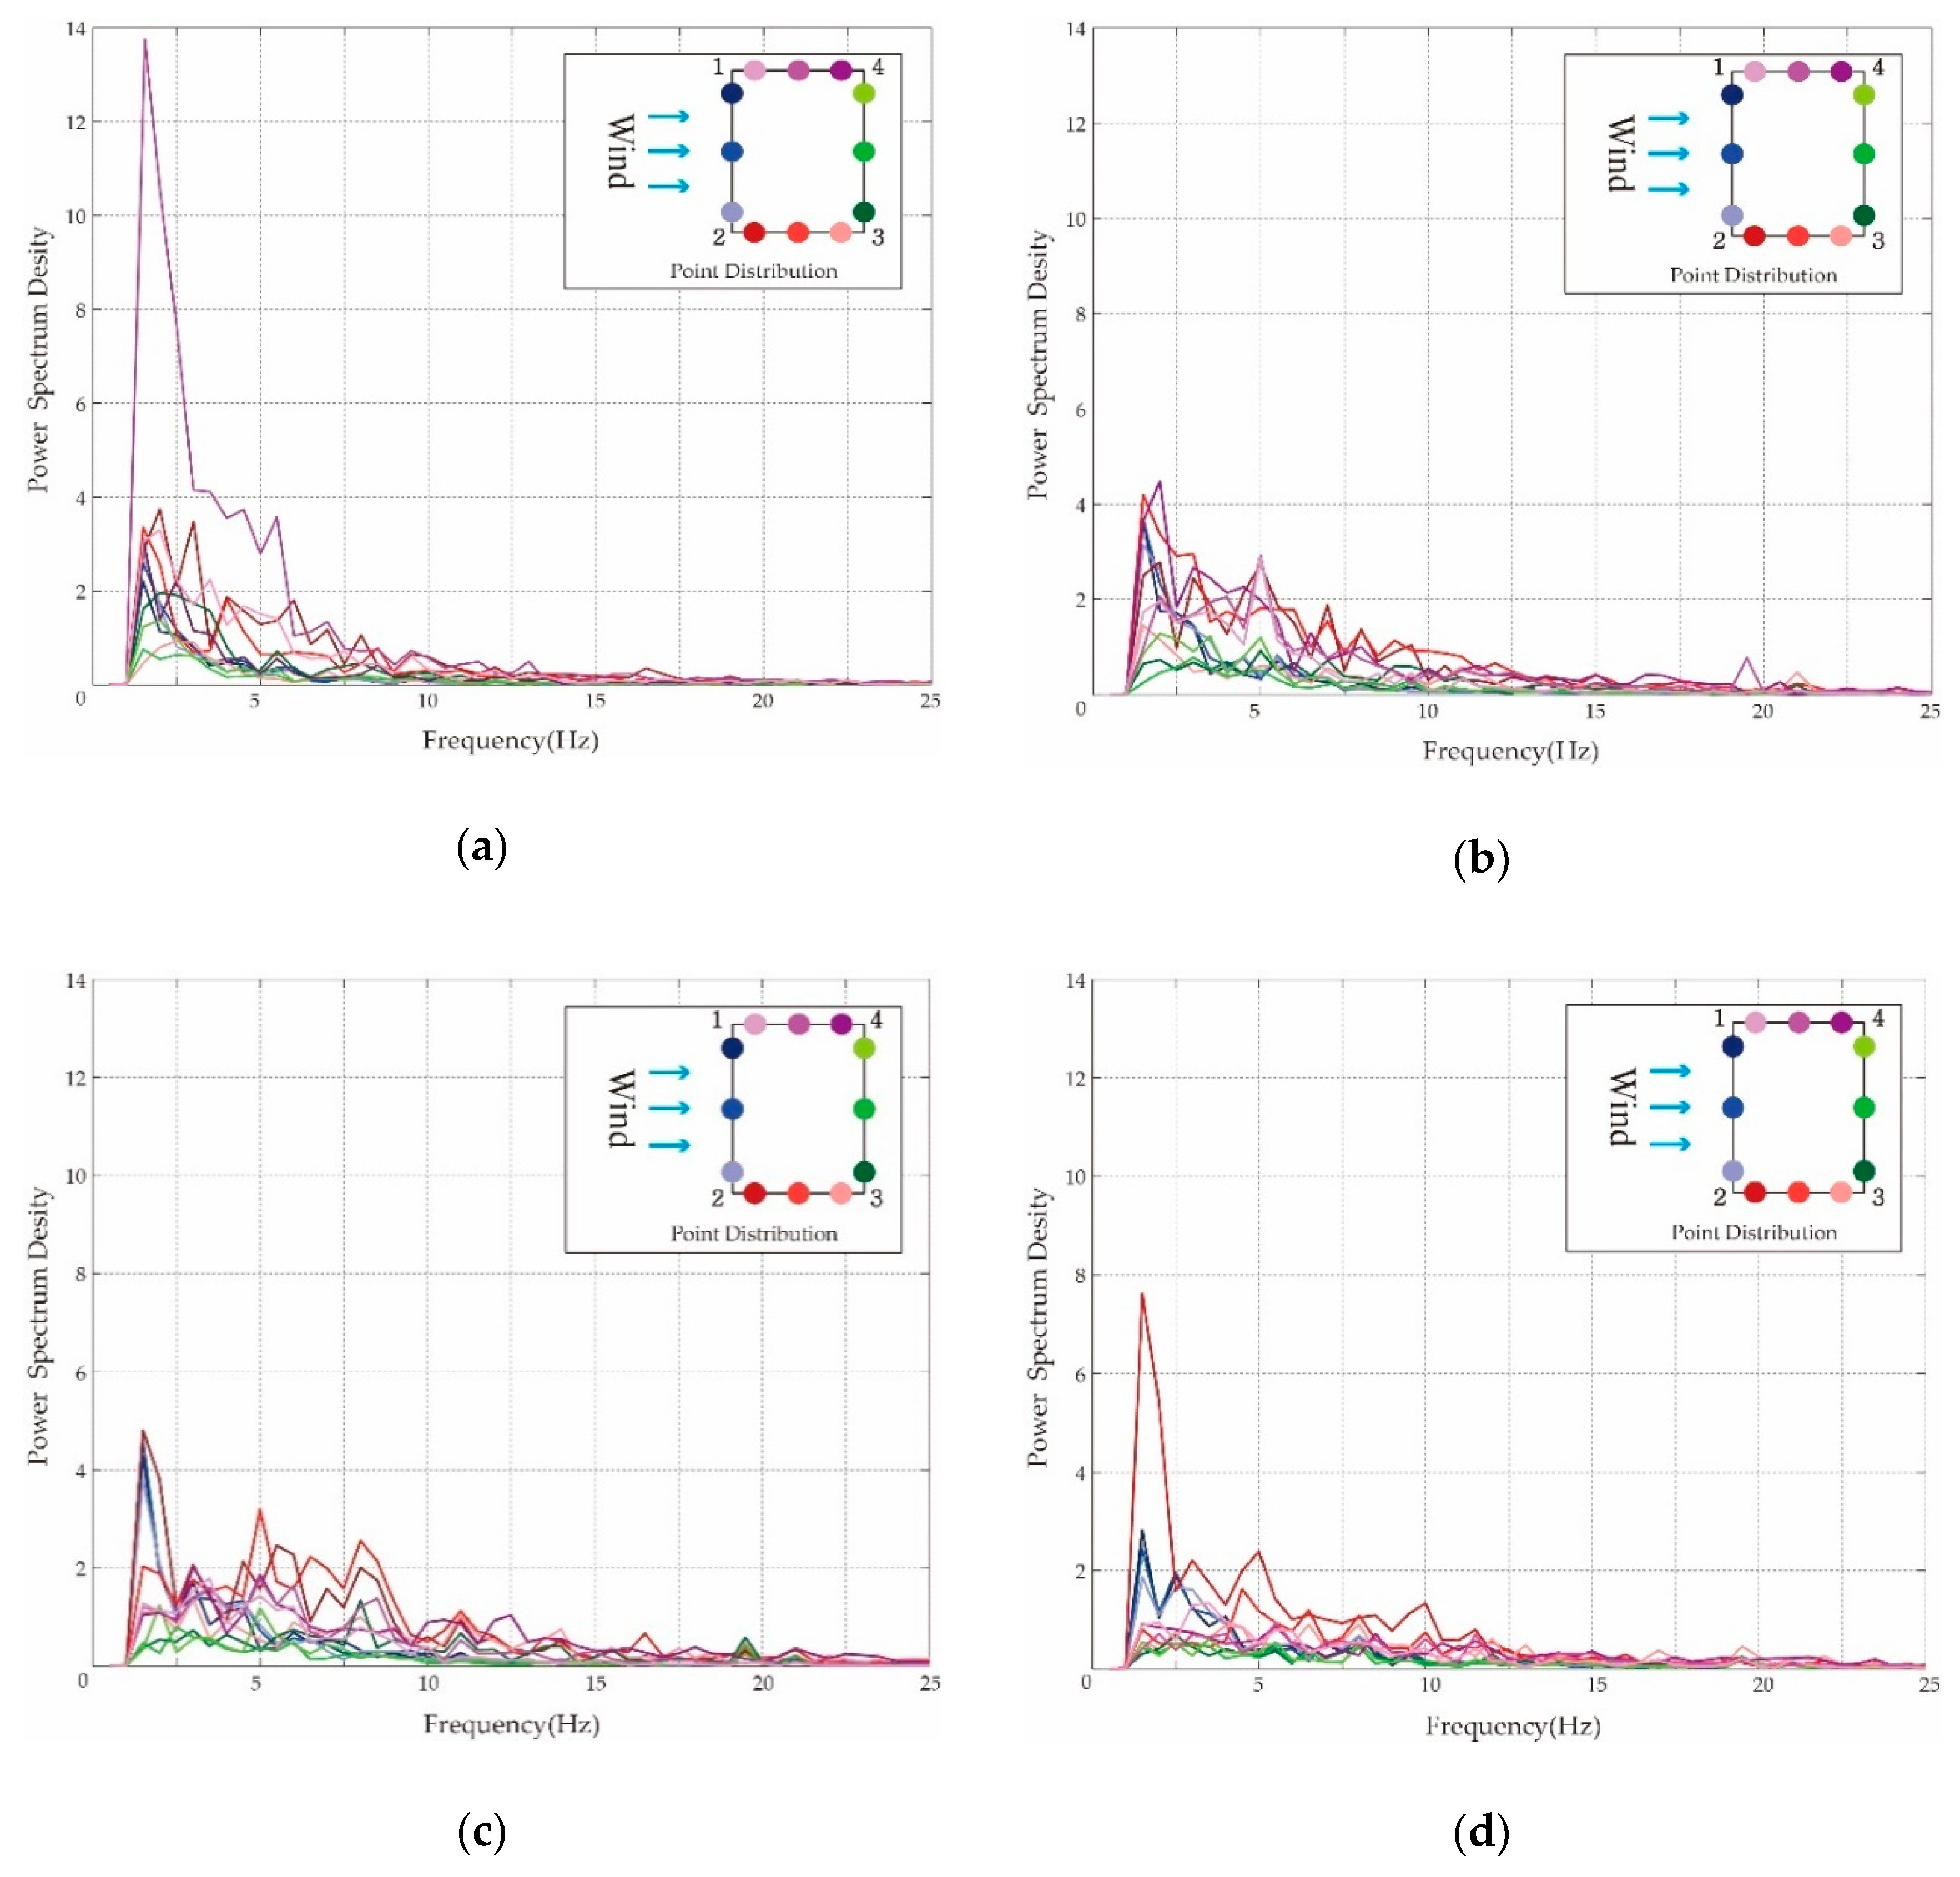
2.2. Experimental Results
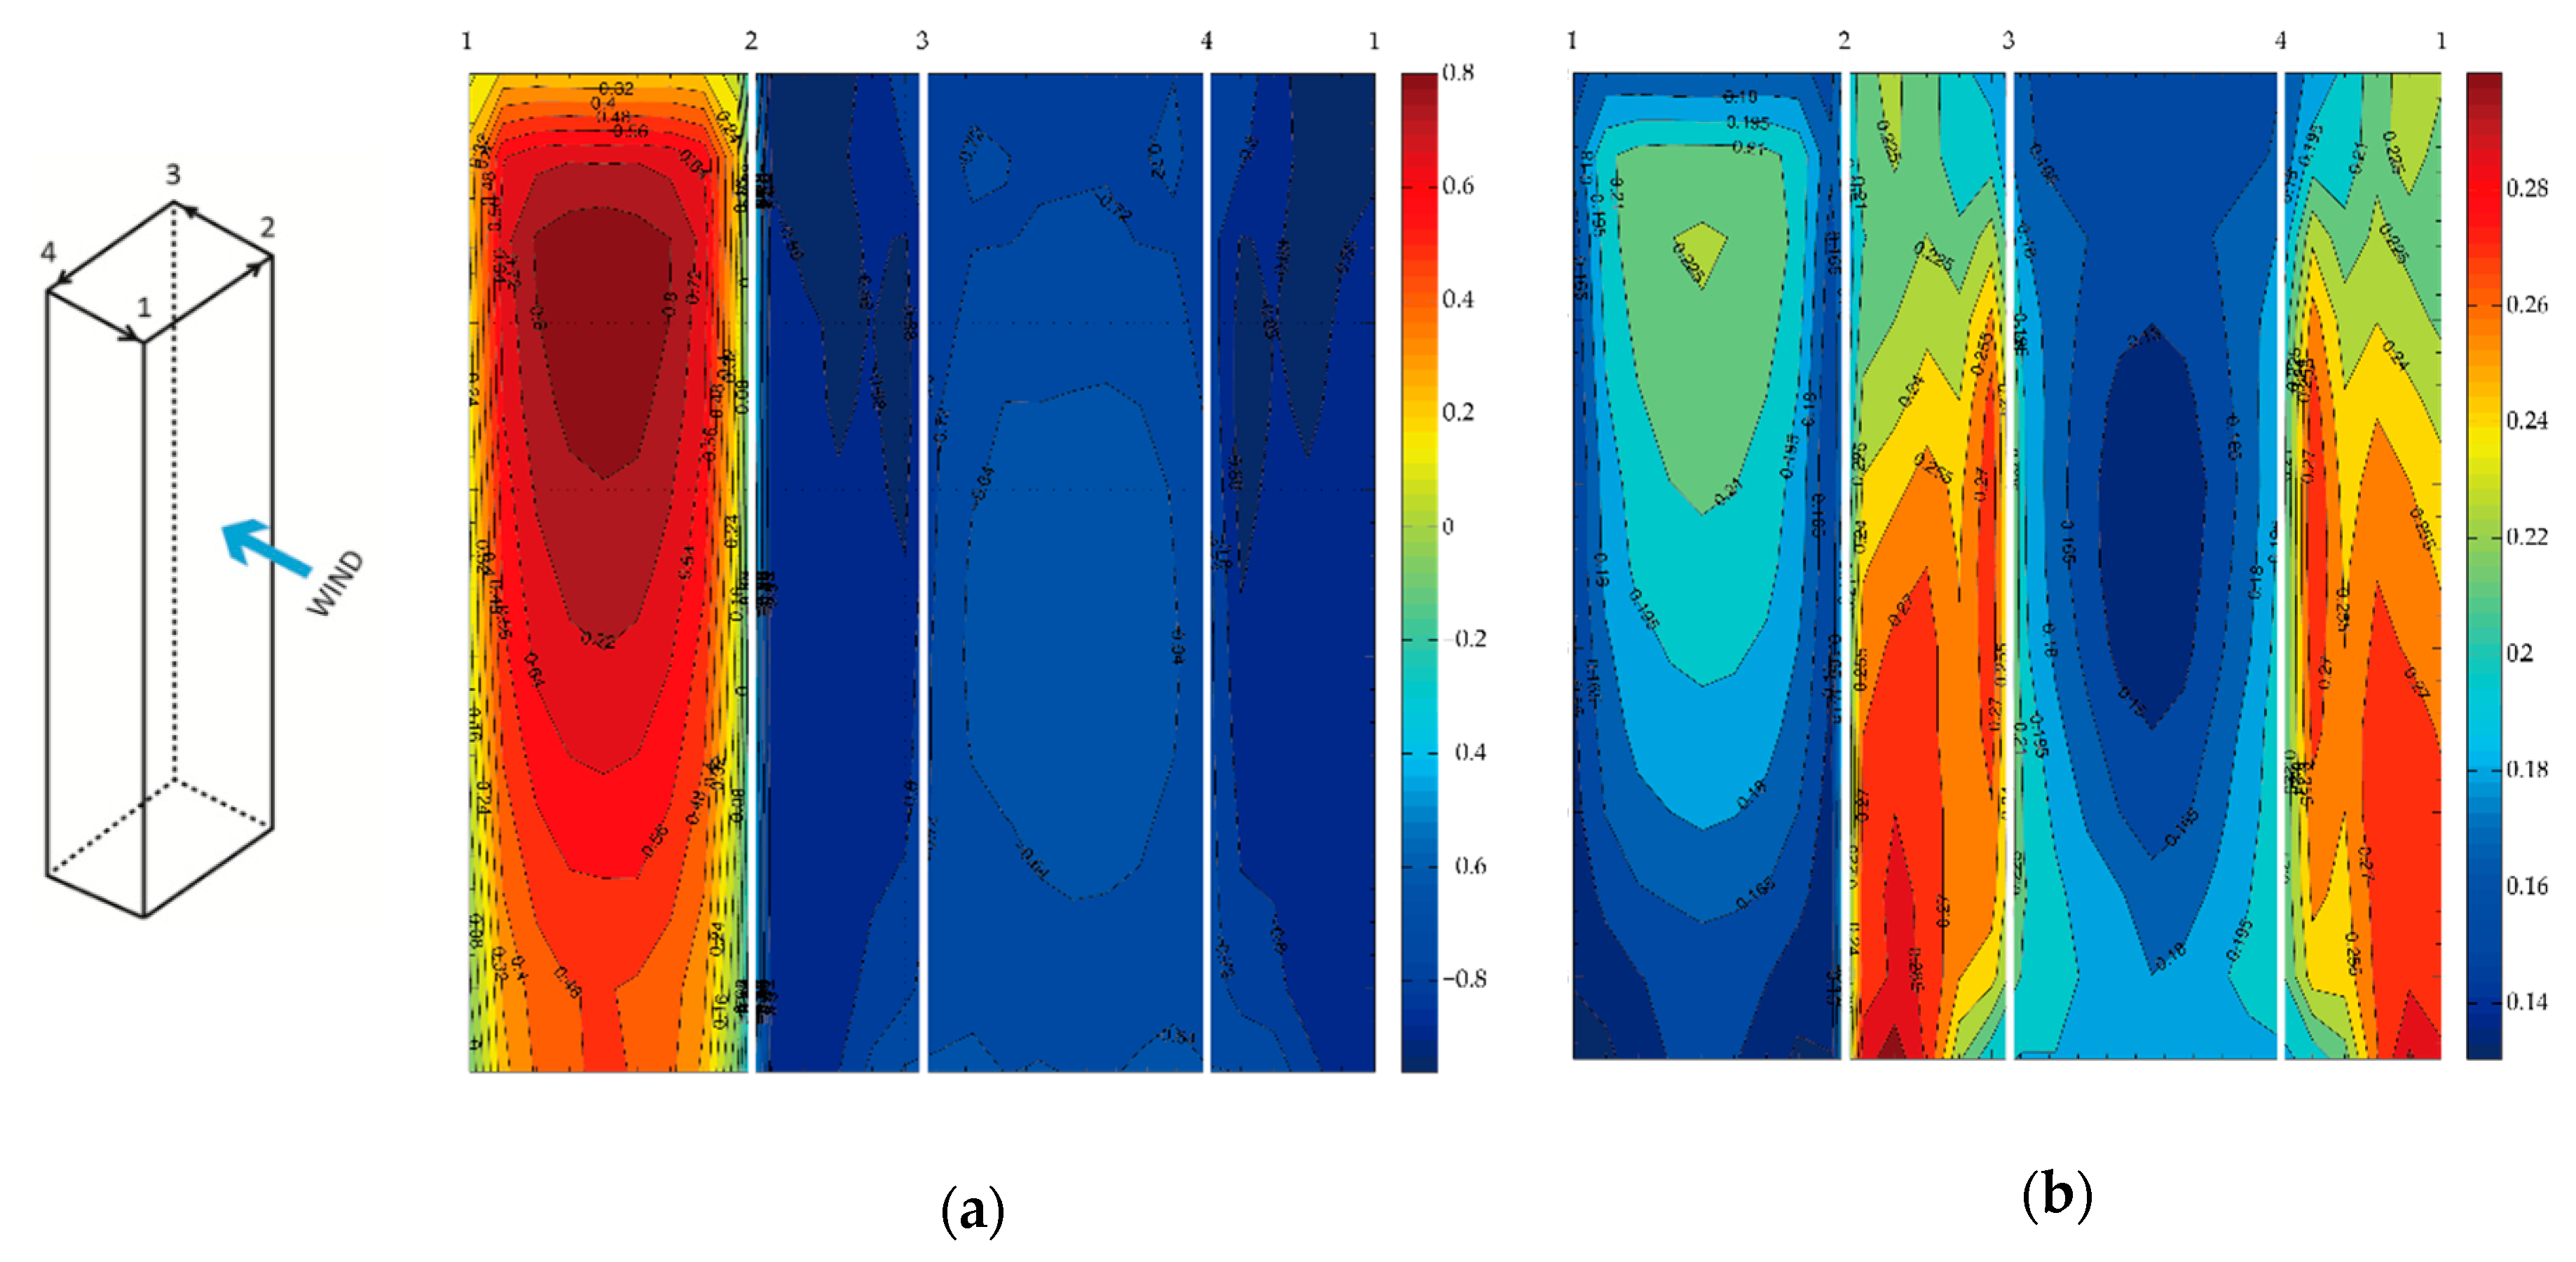
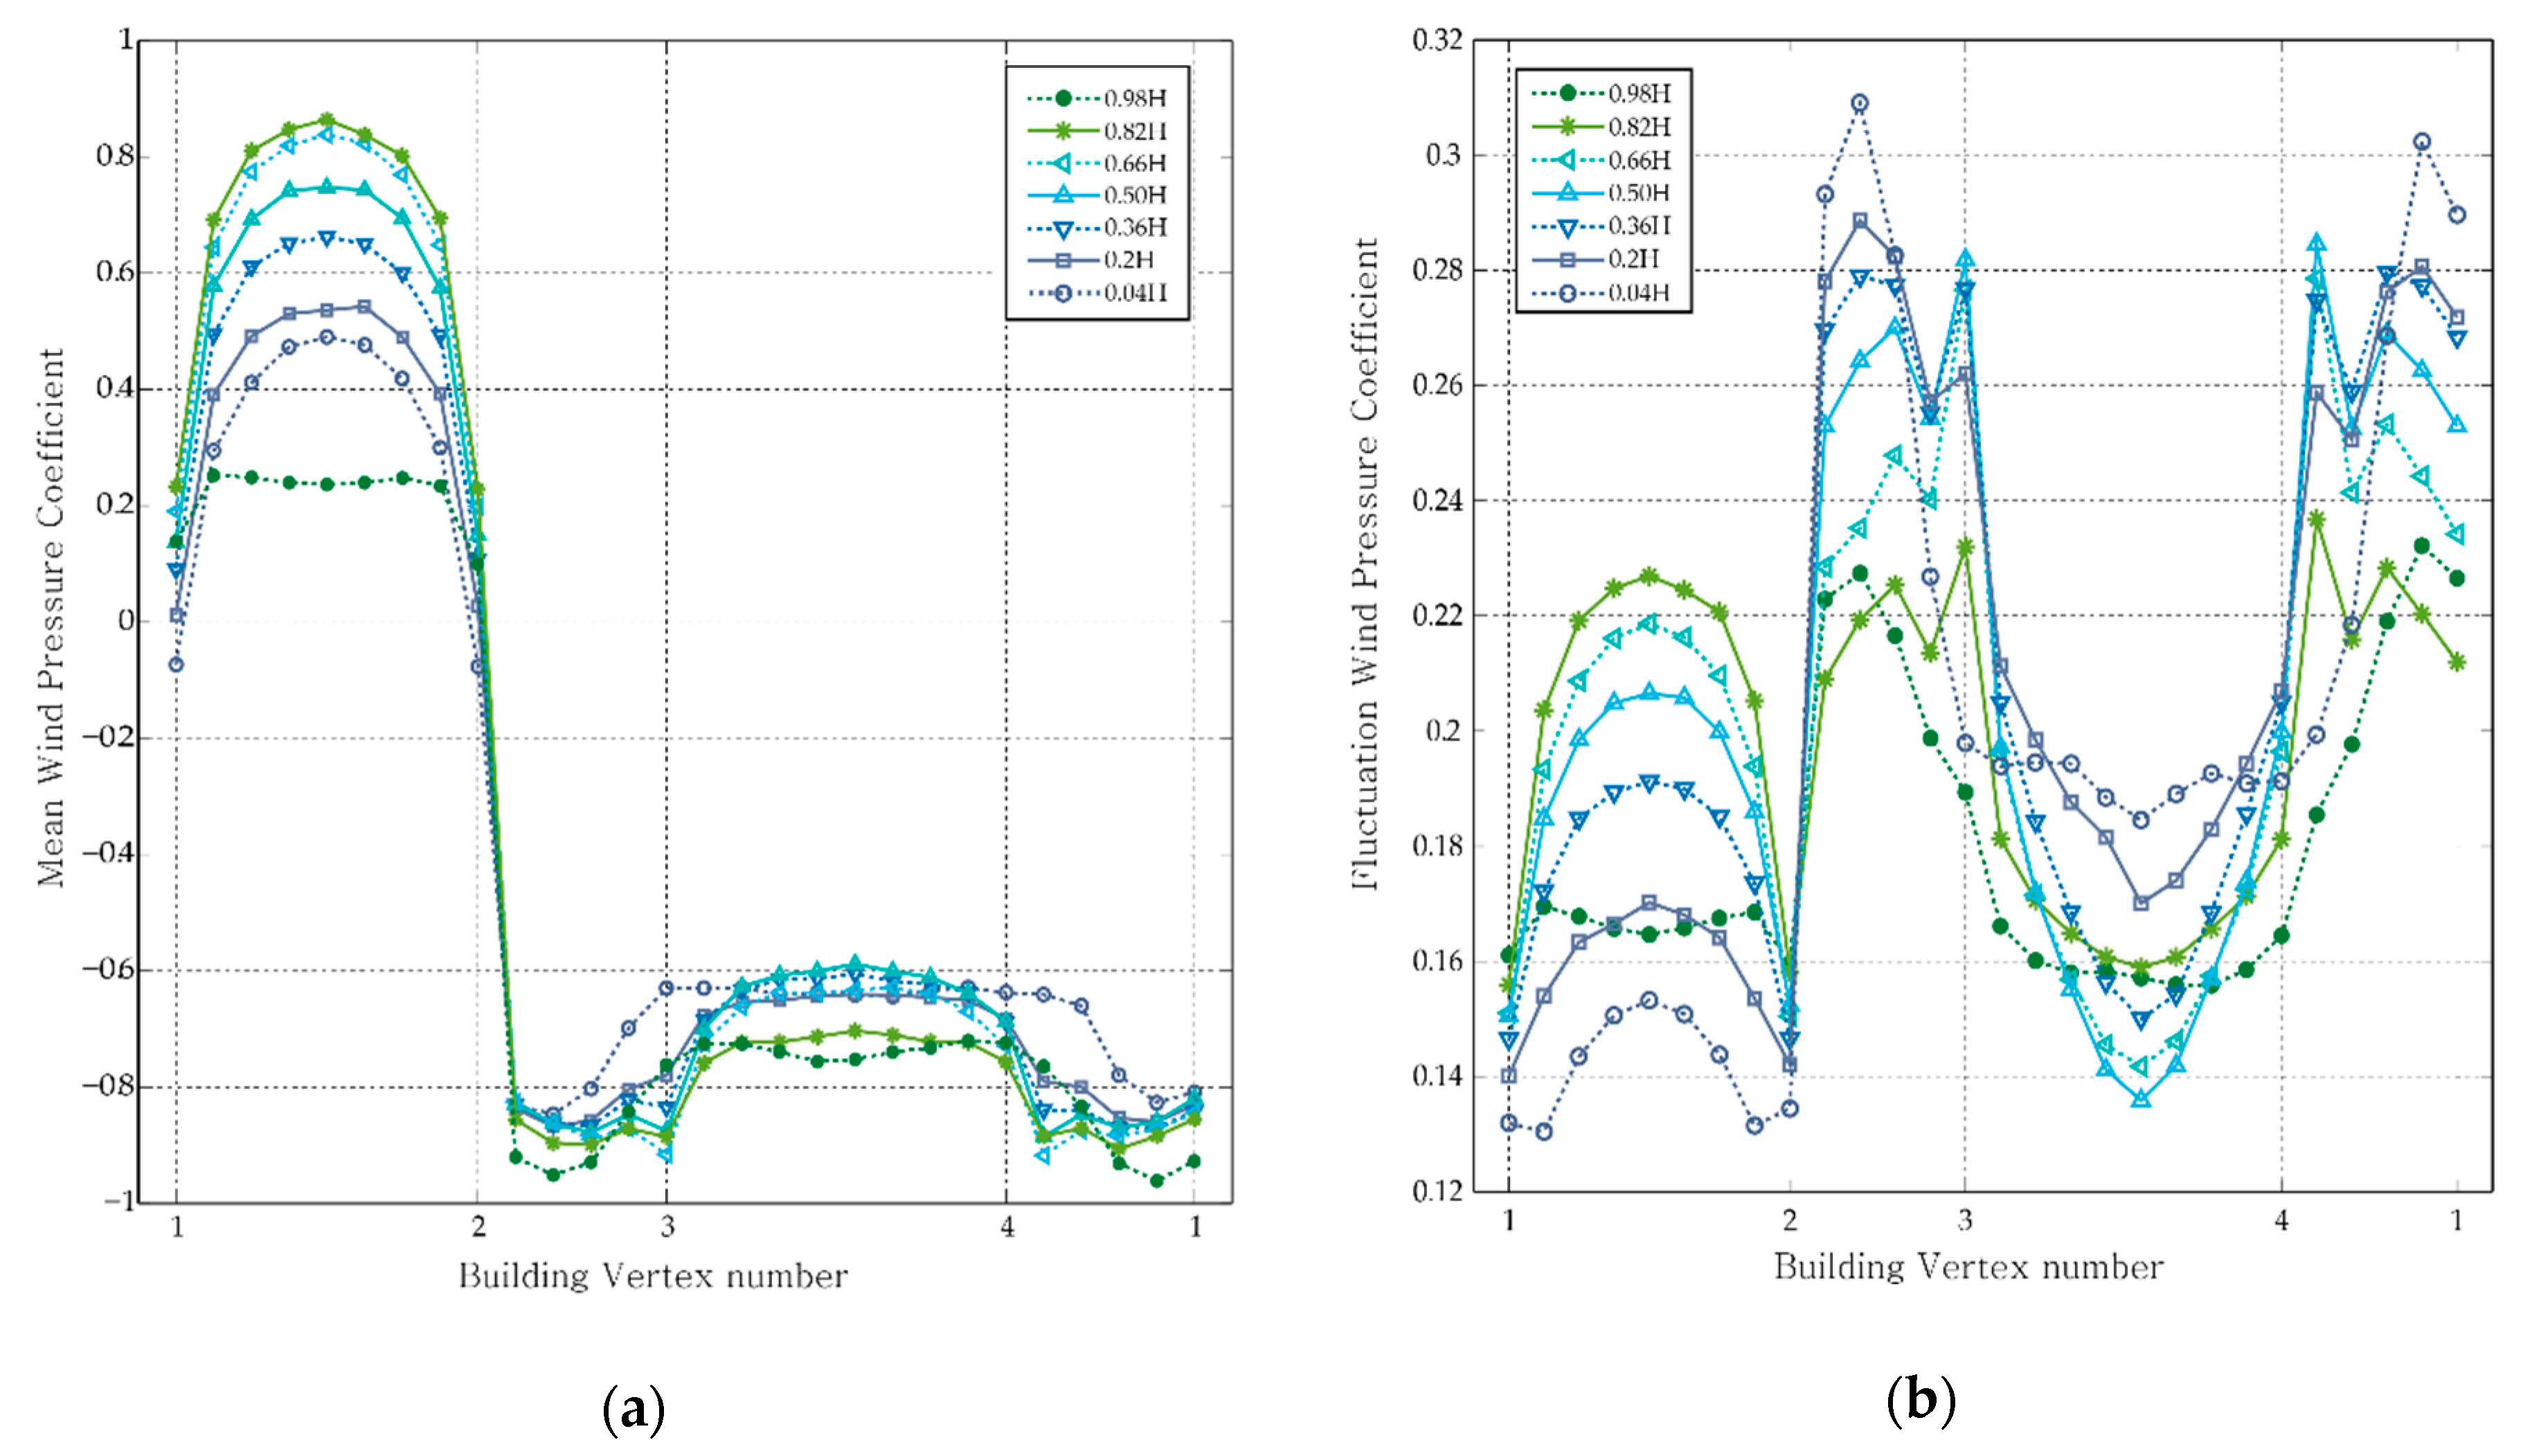
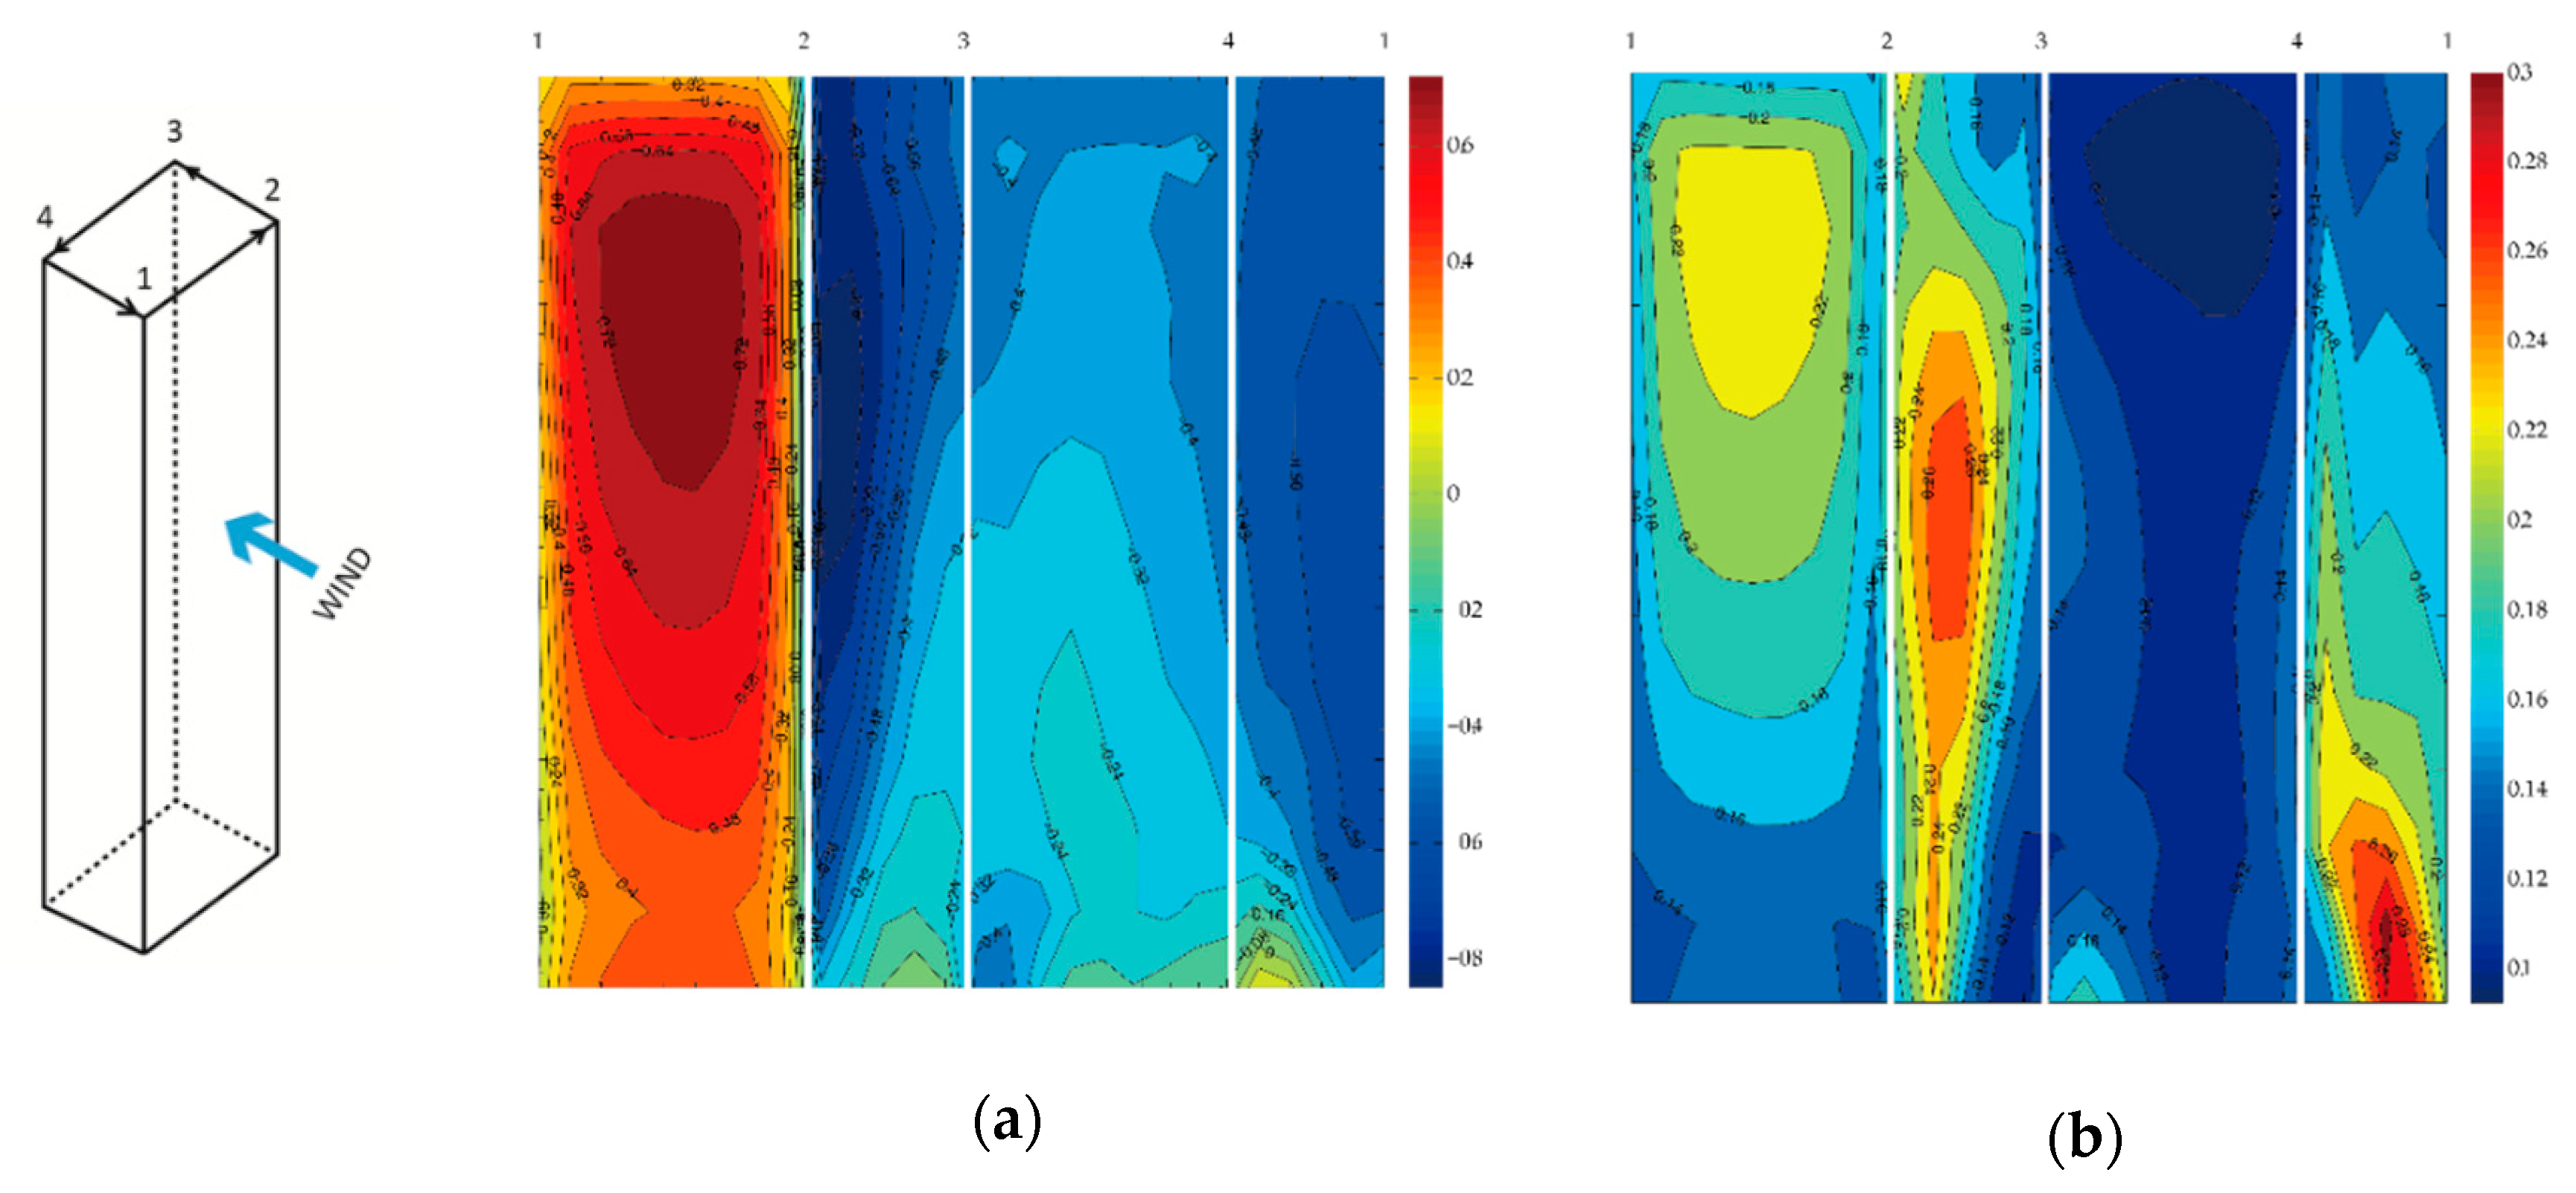
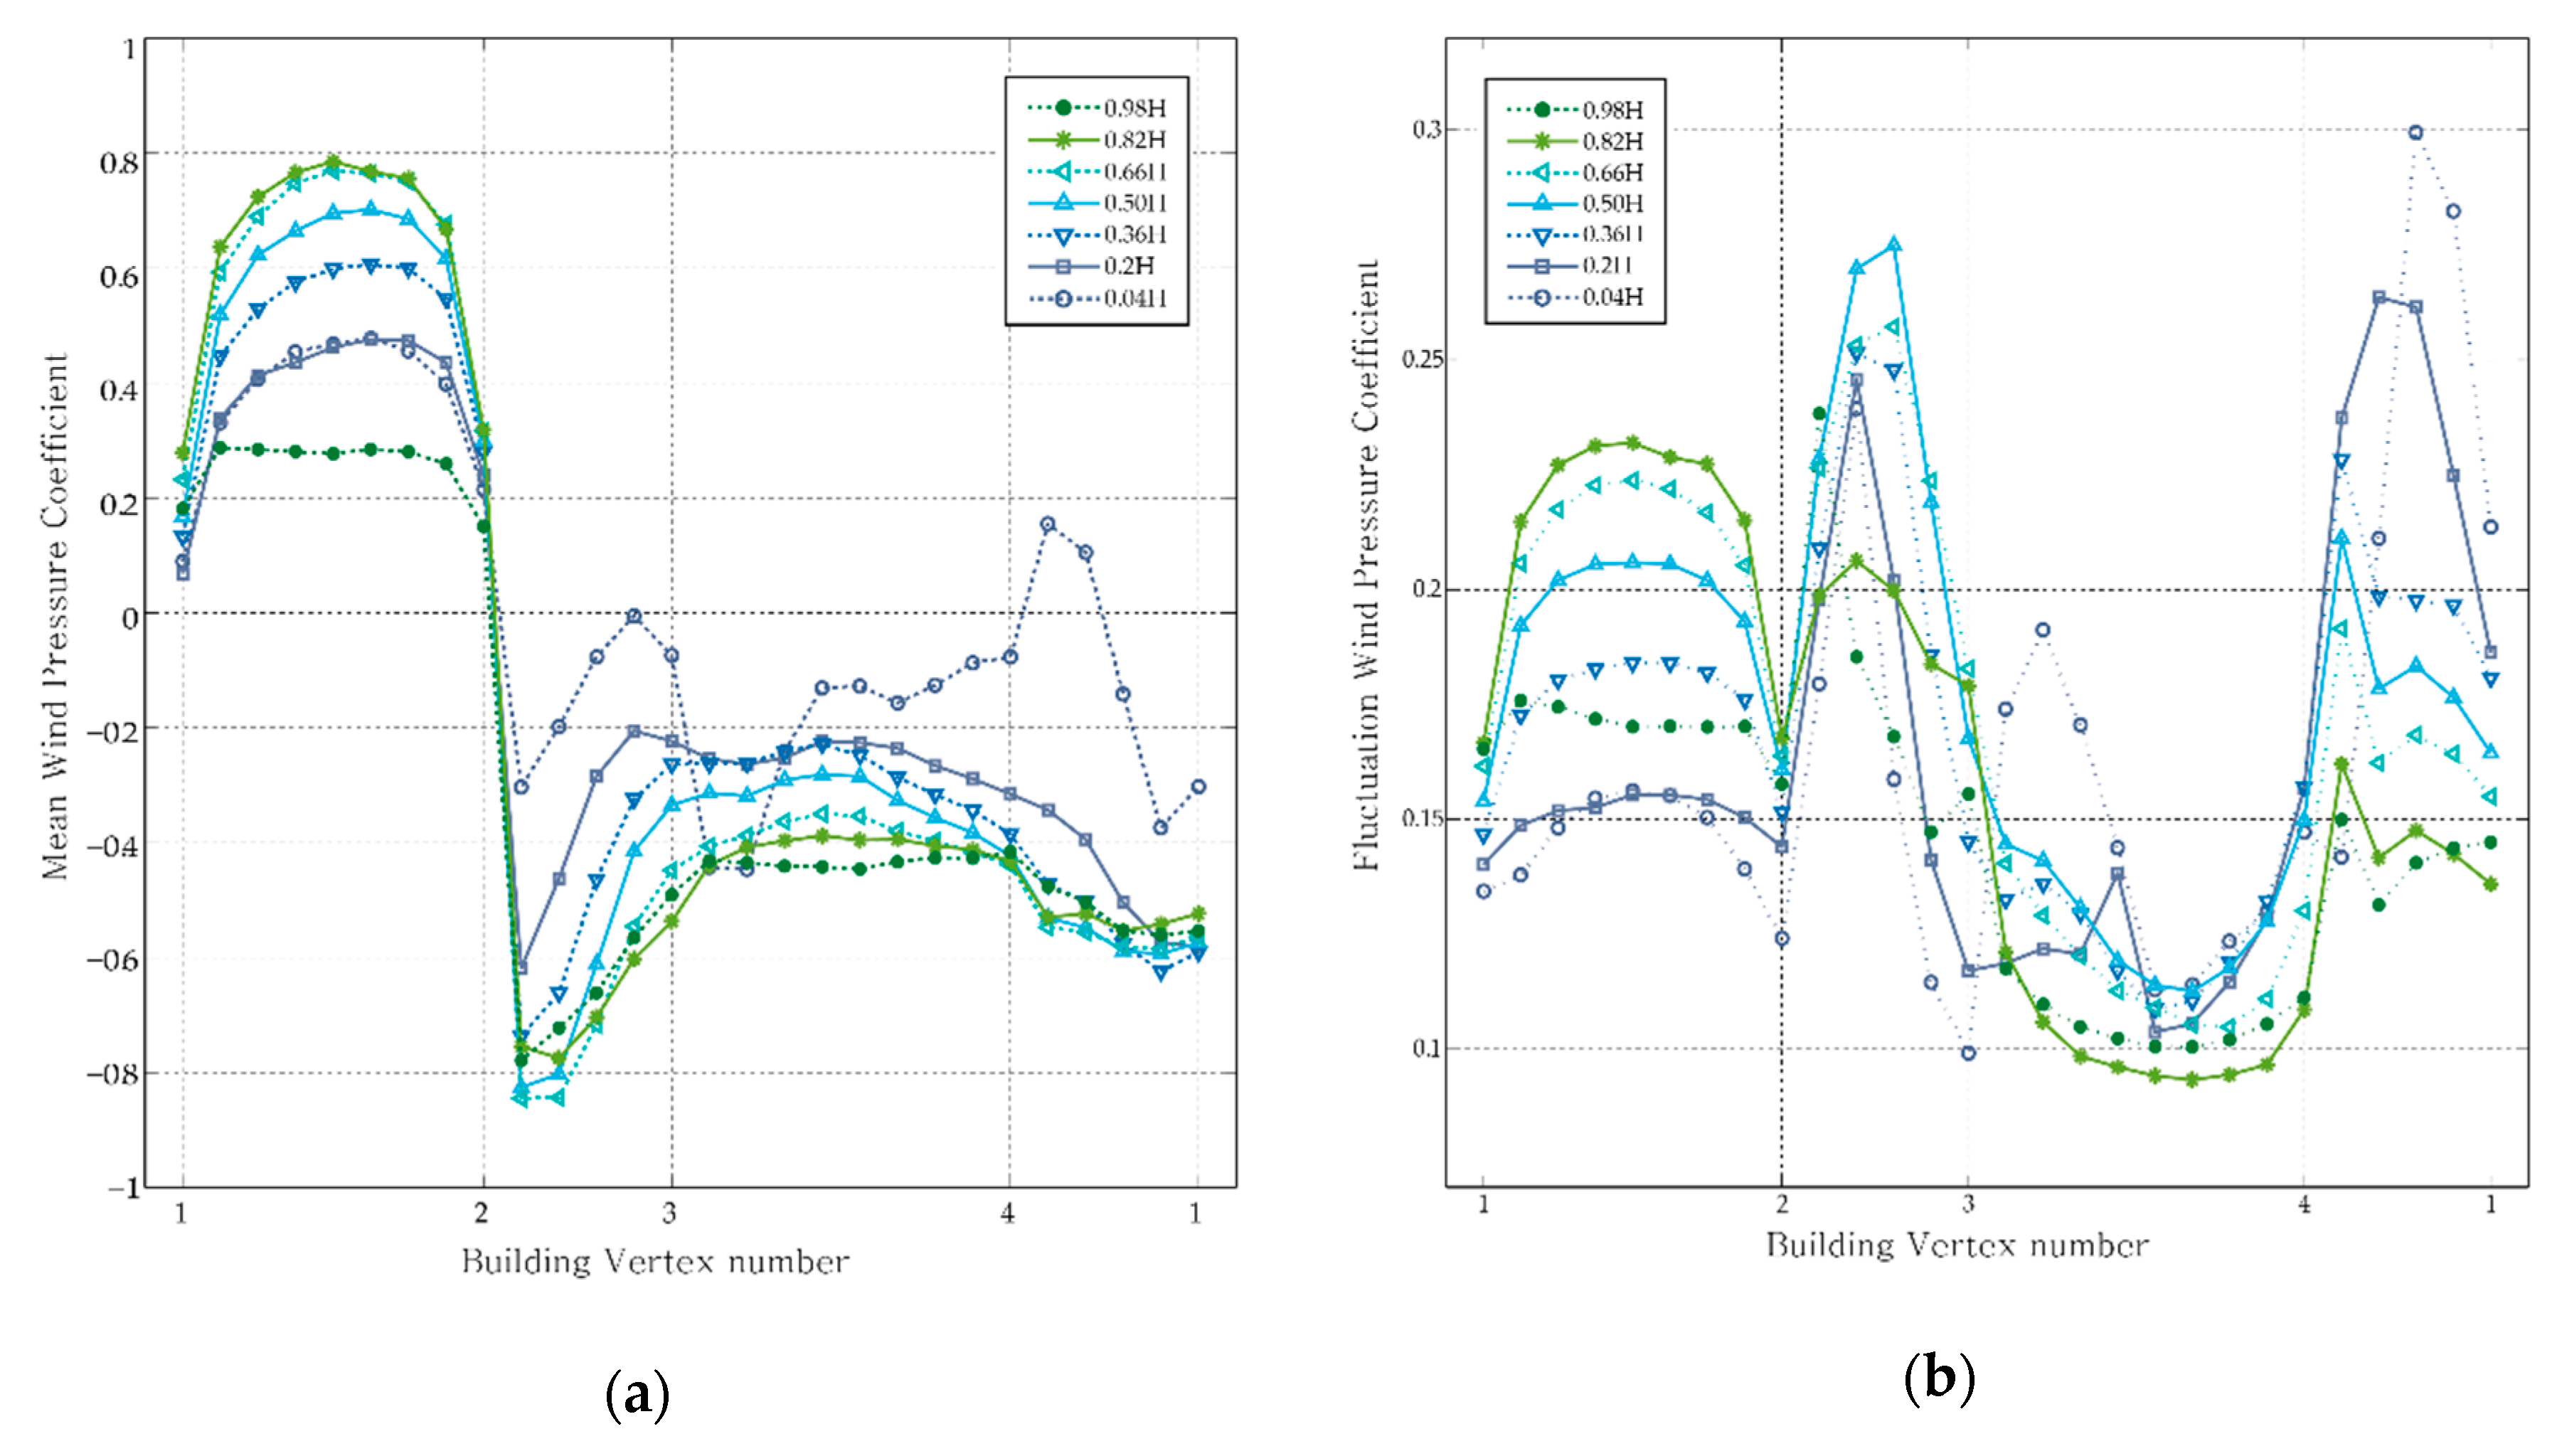
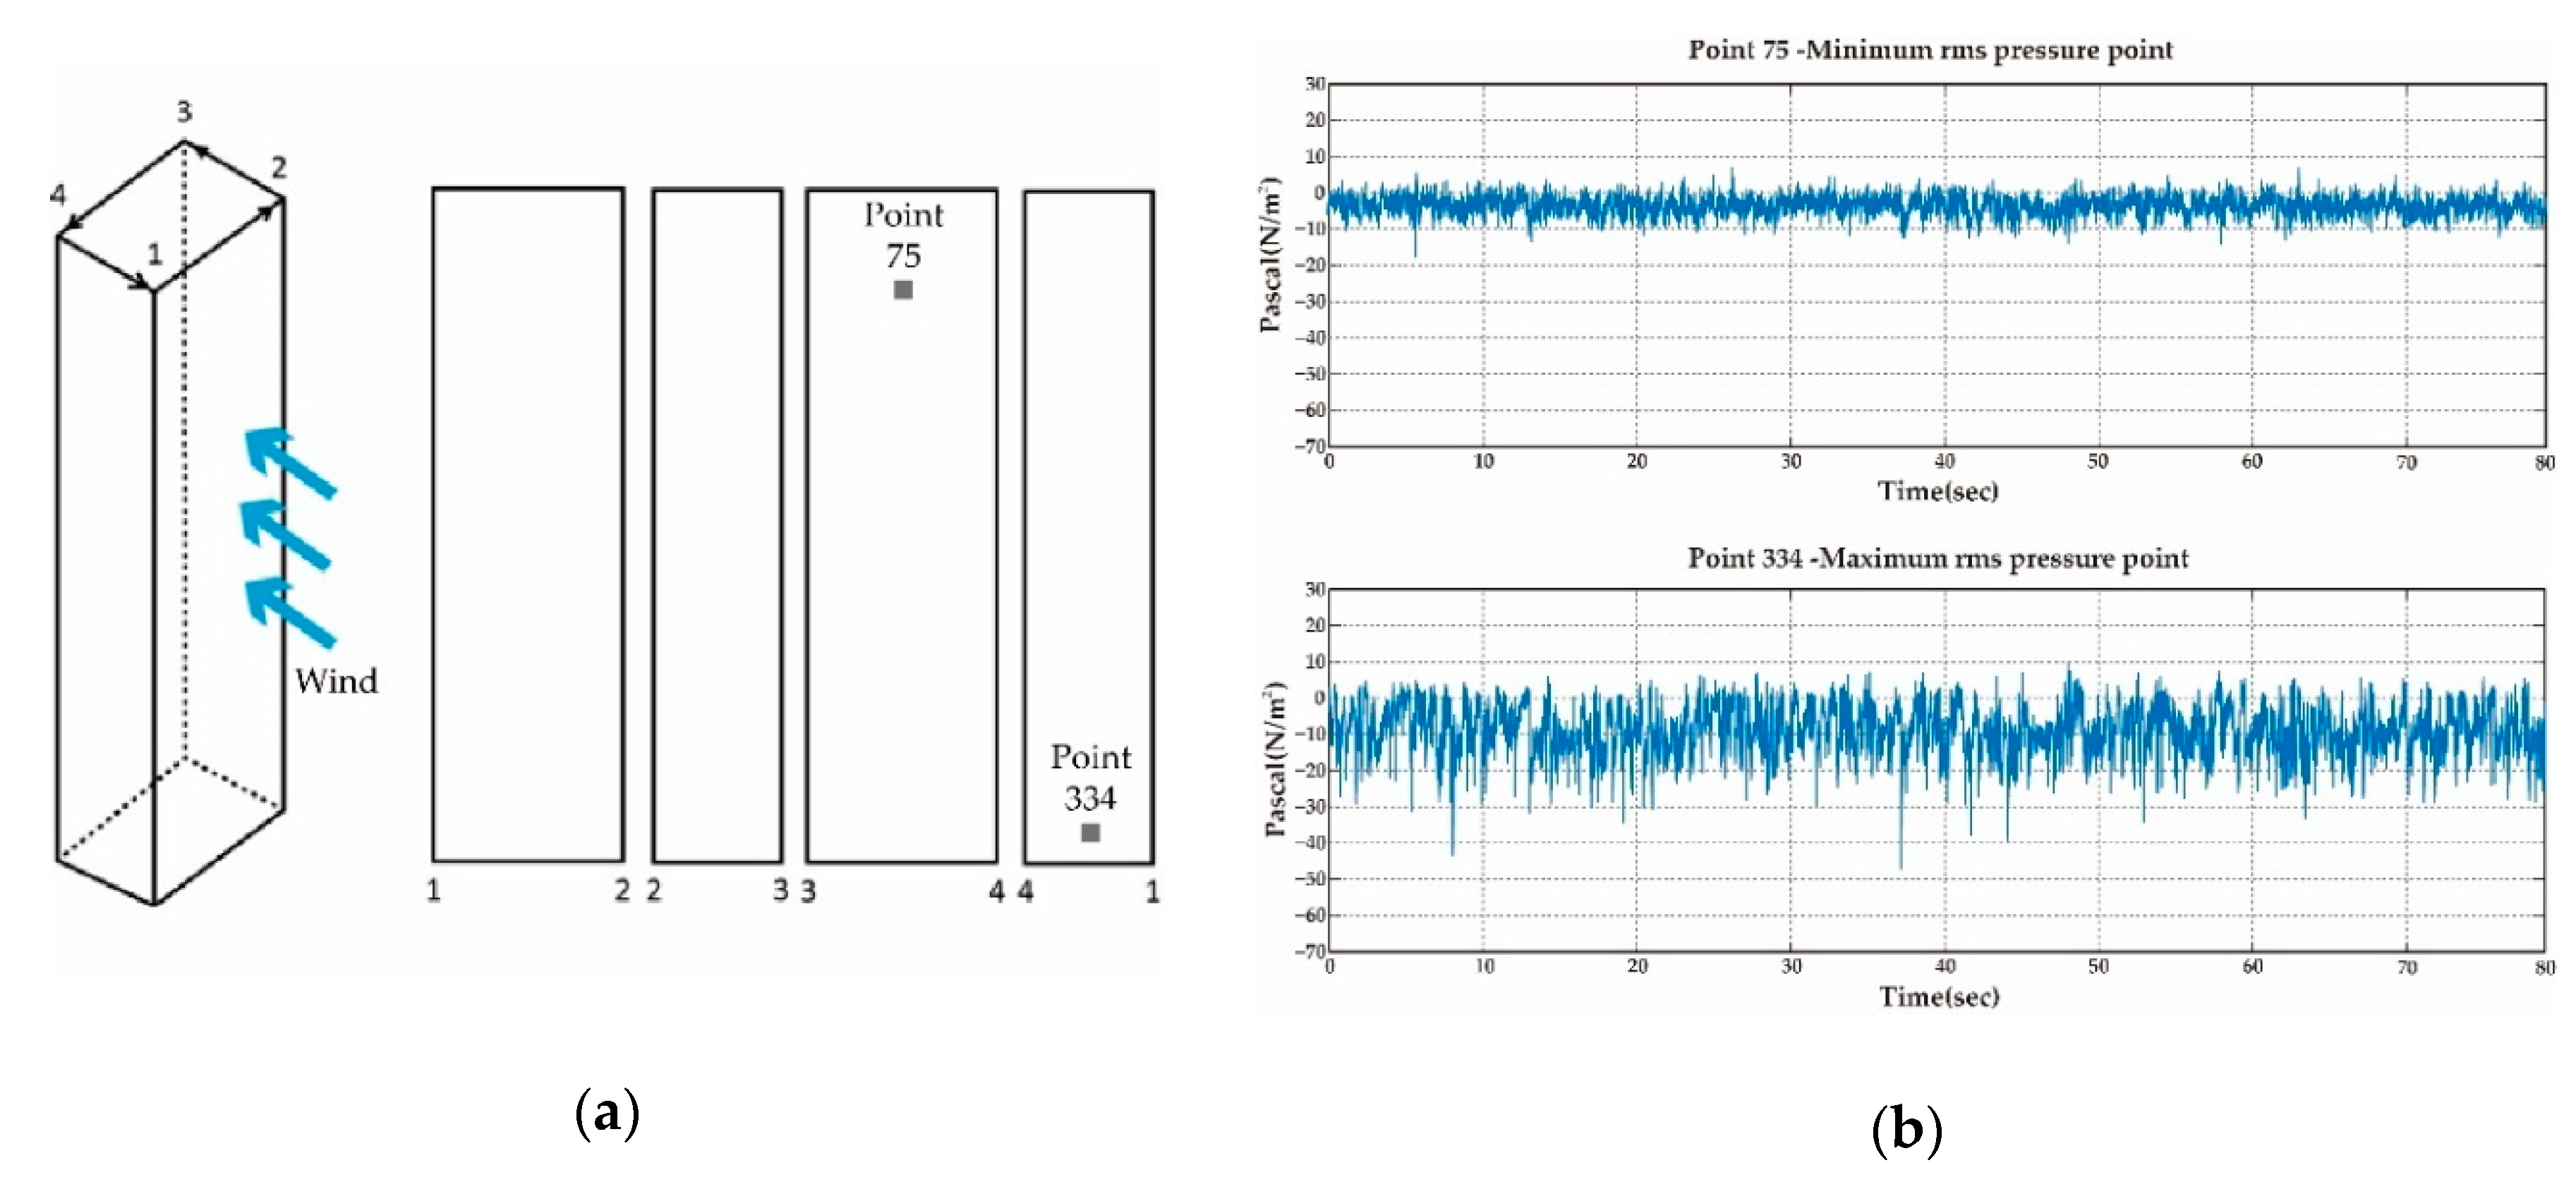
2.2.1. Experimental Results for the High-Rise Building without Surrounding Buildings
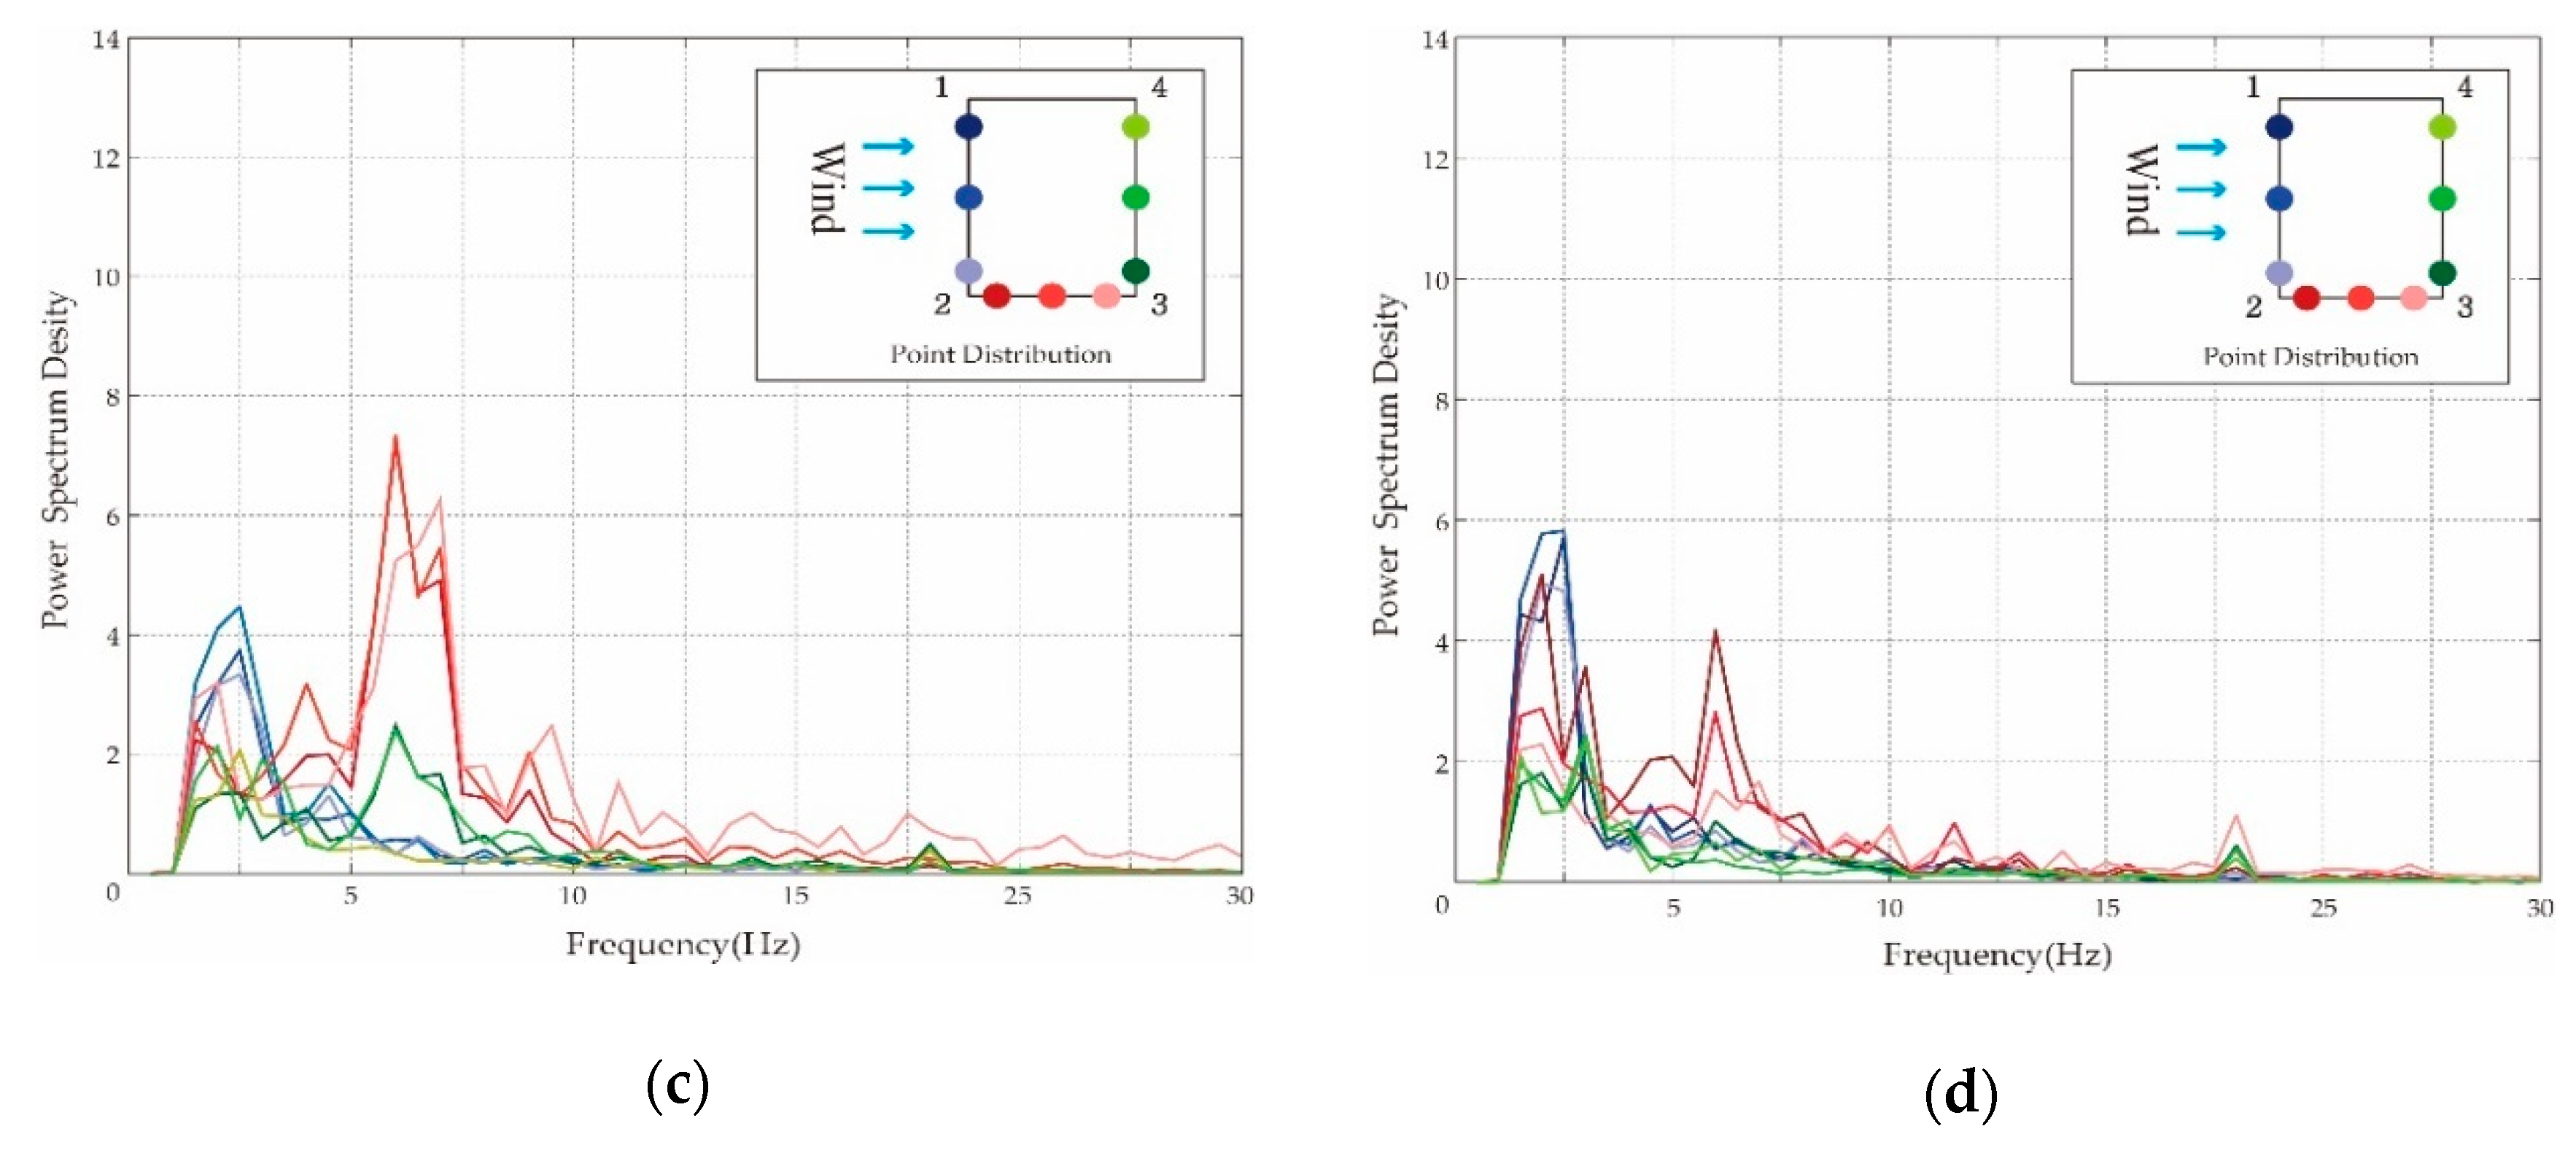
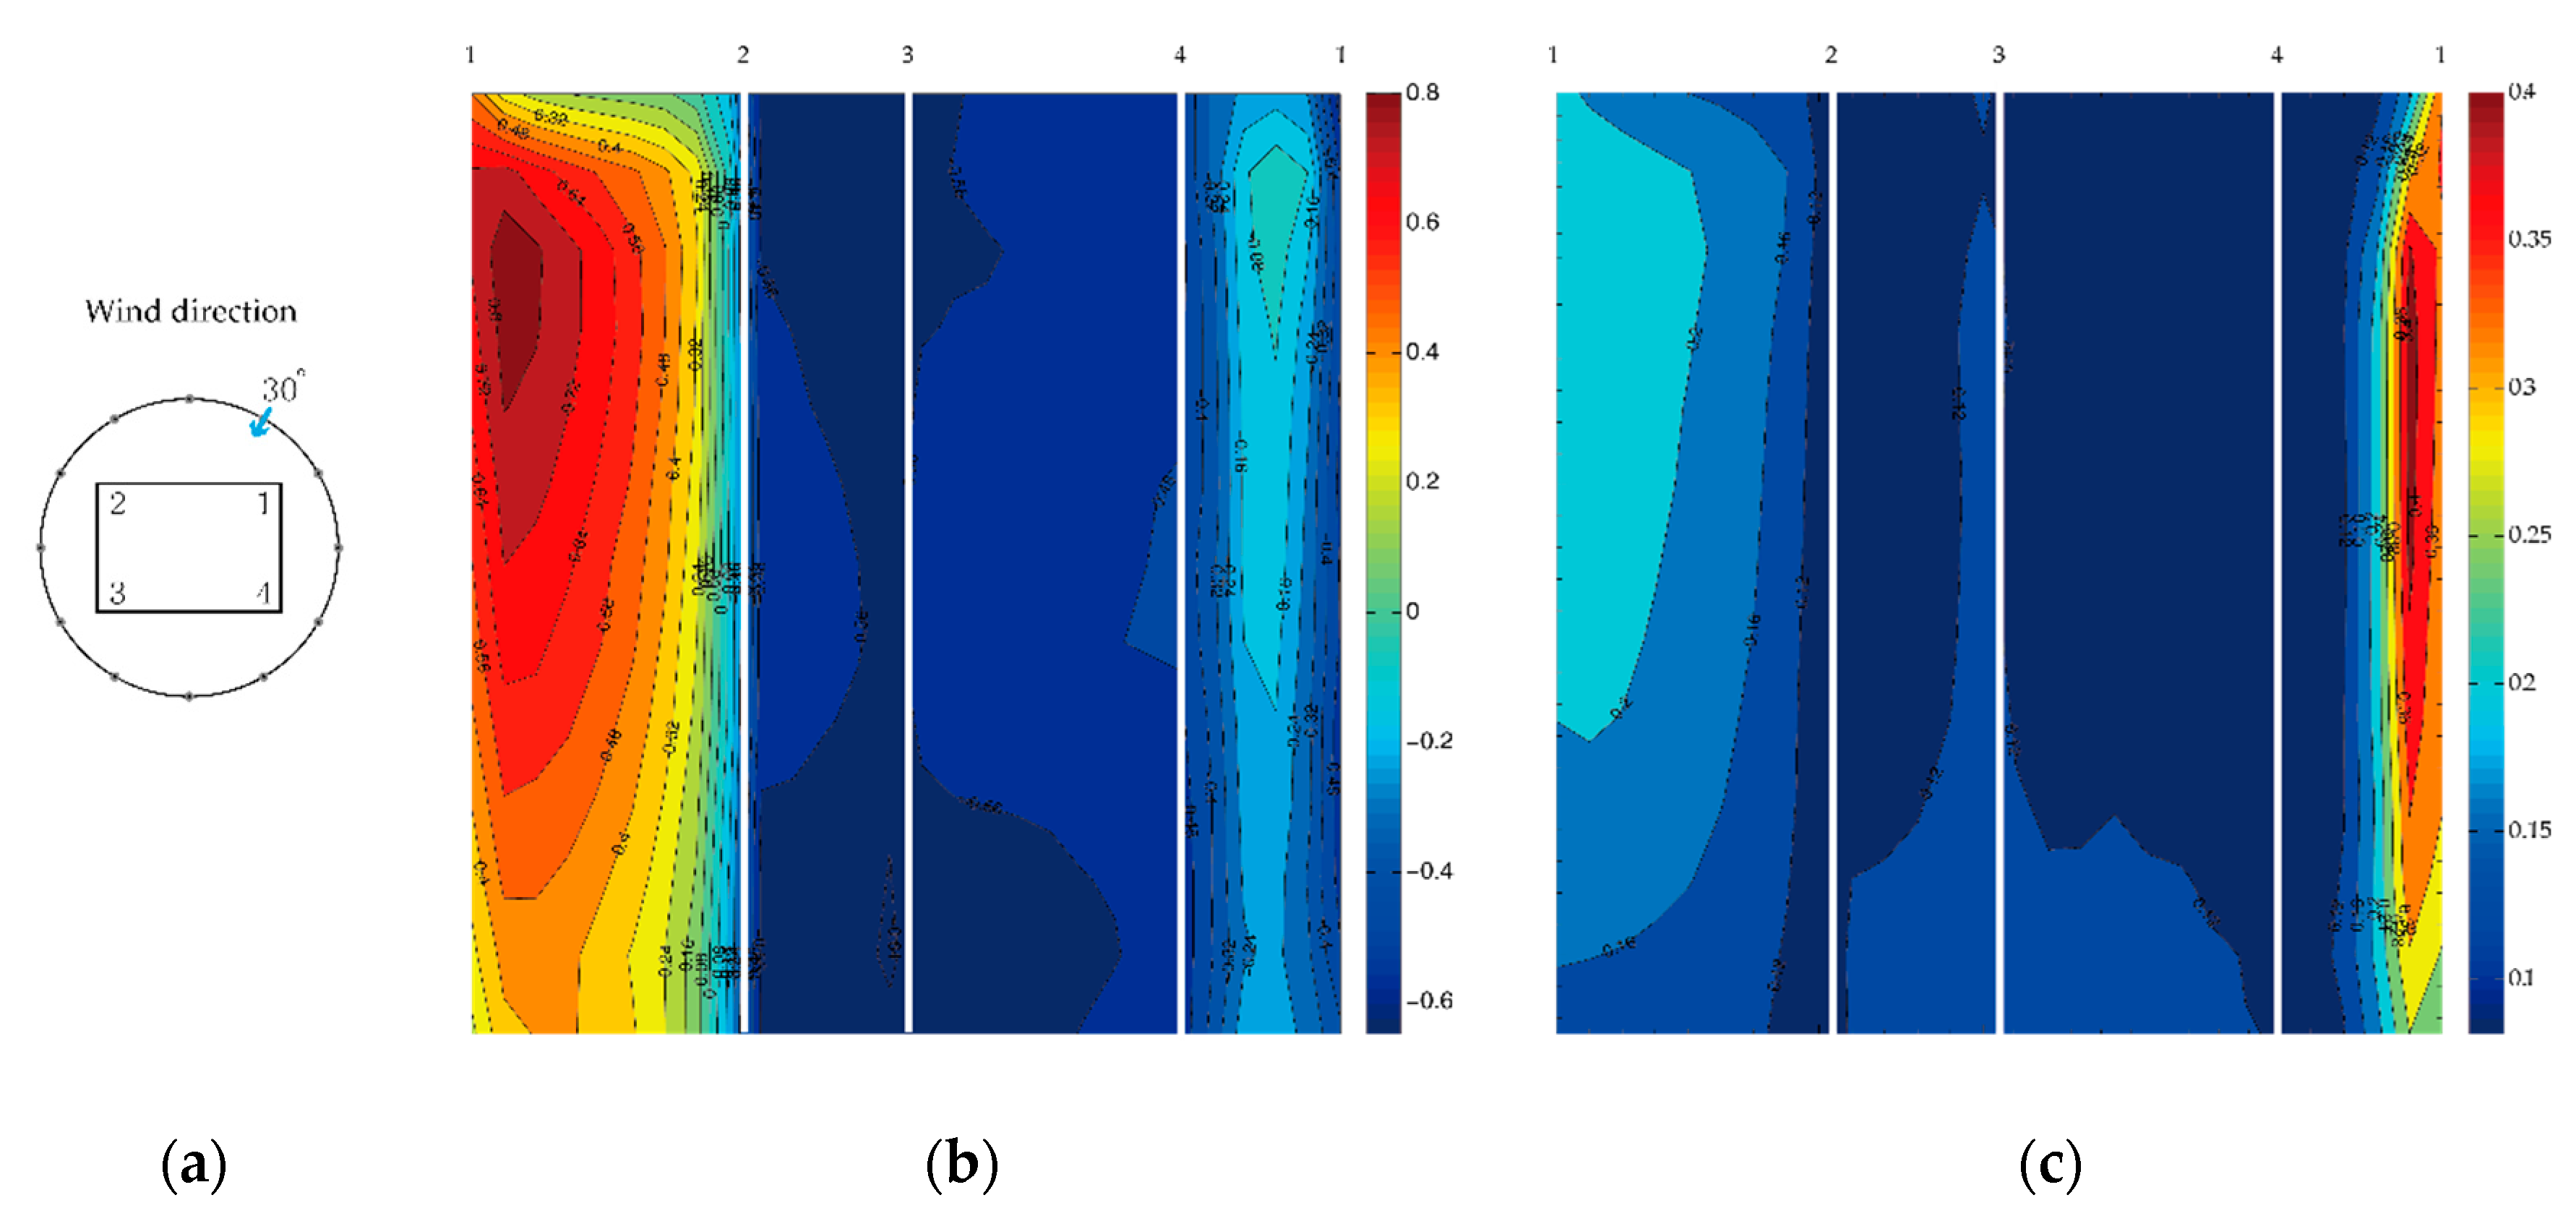
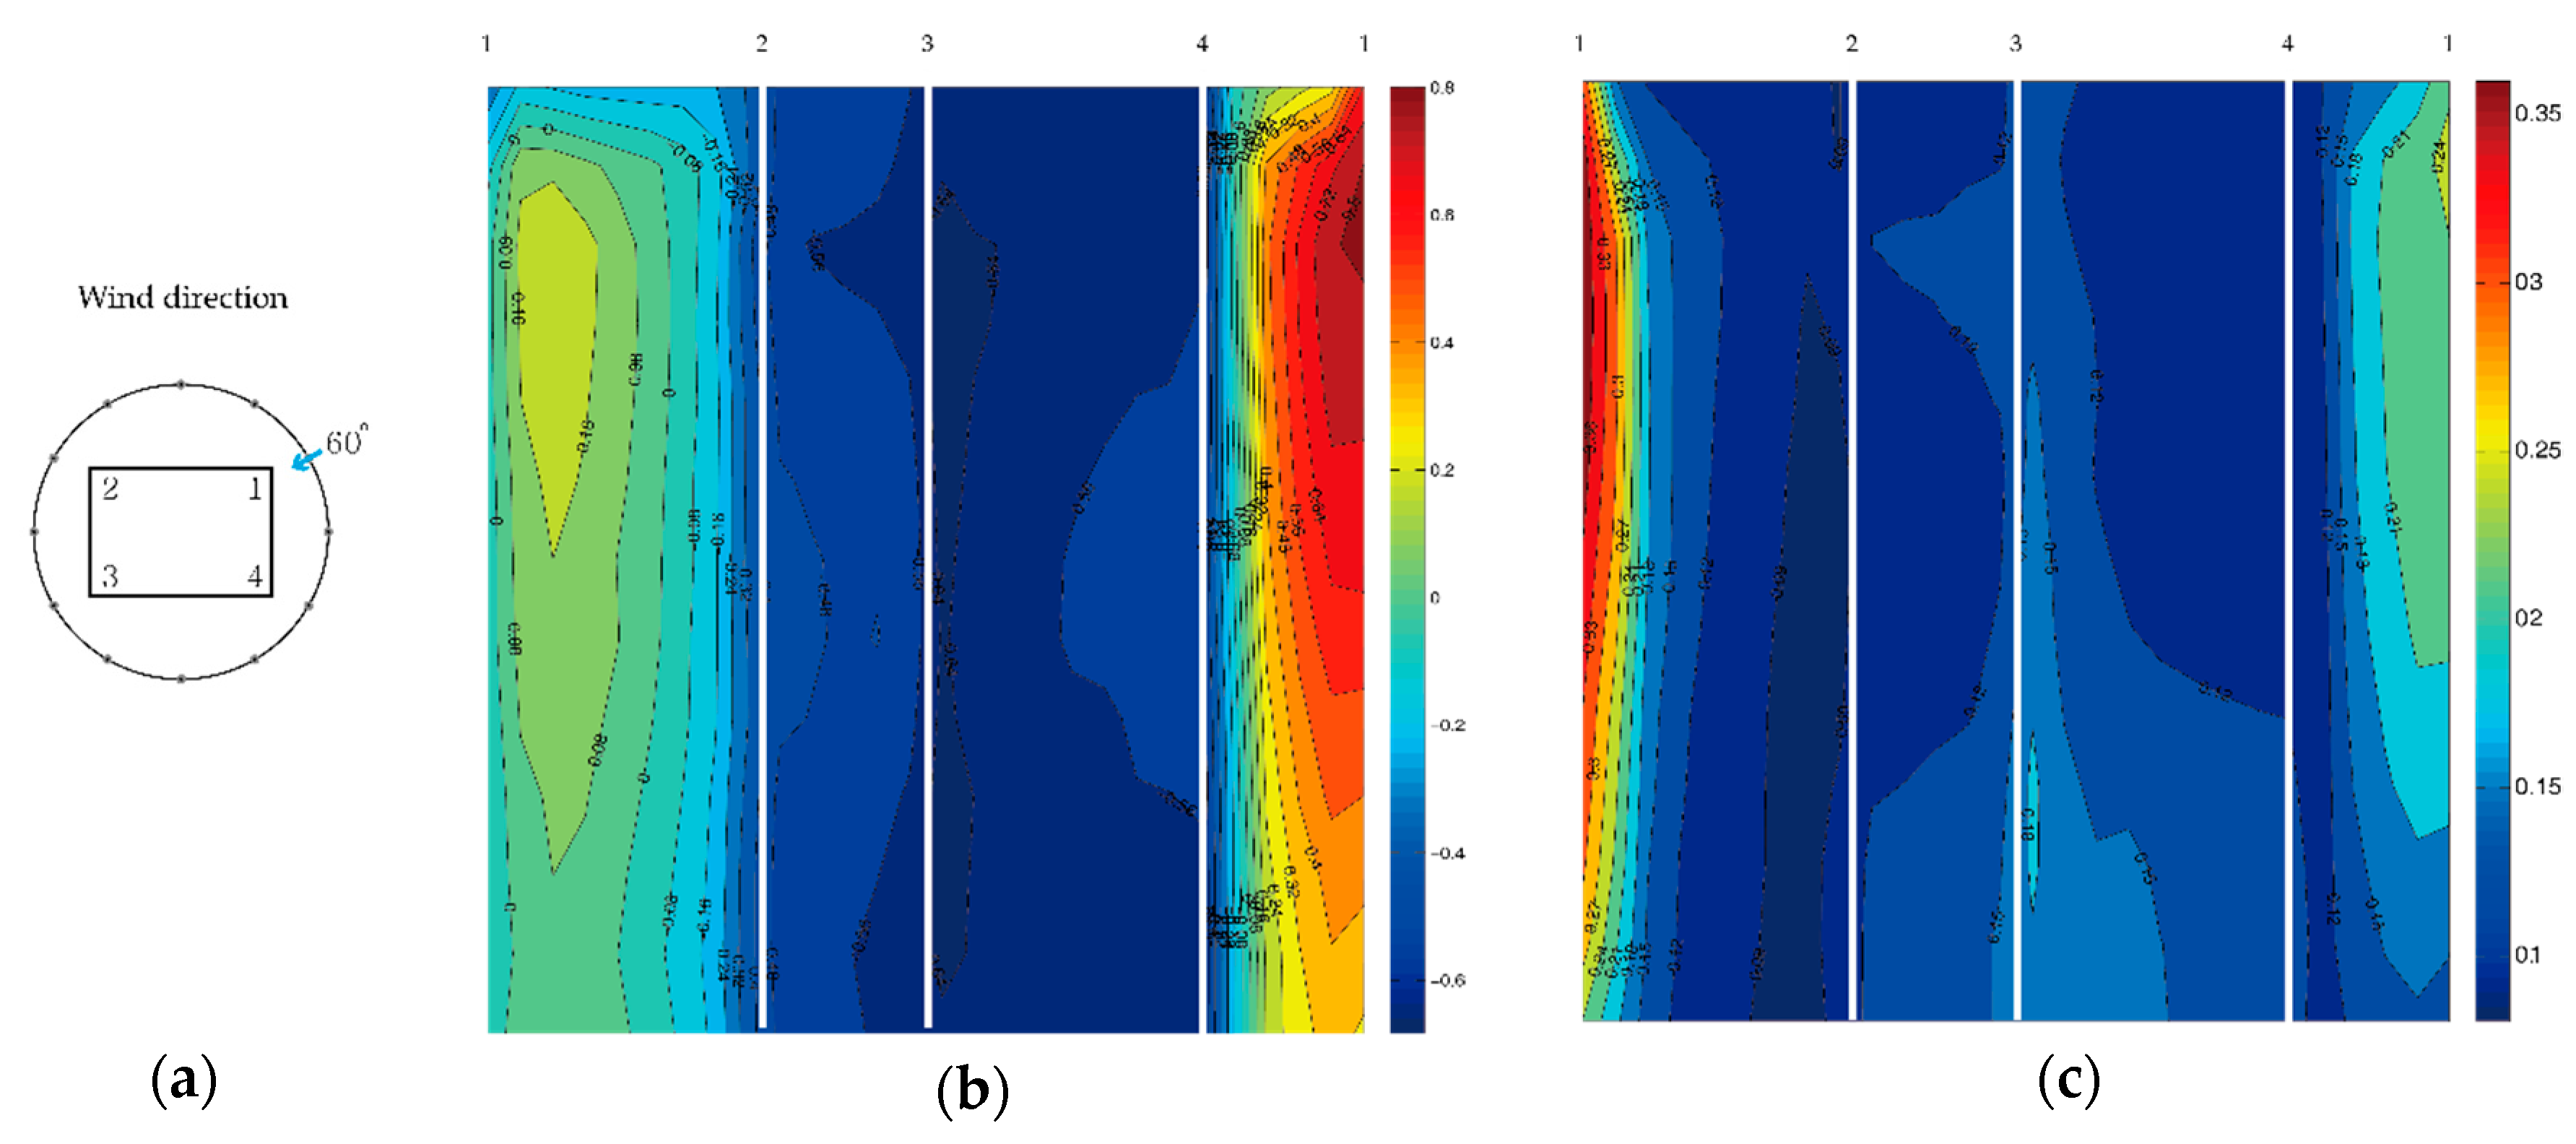
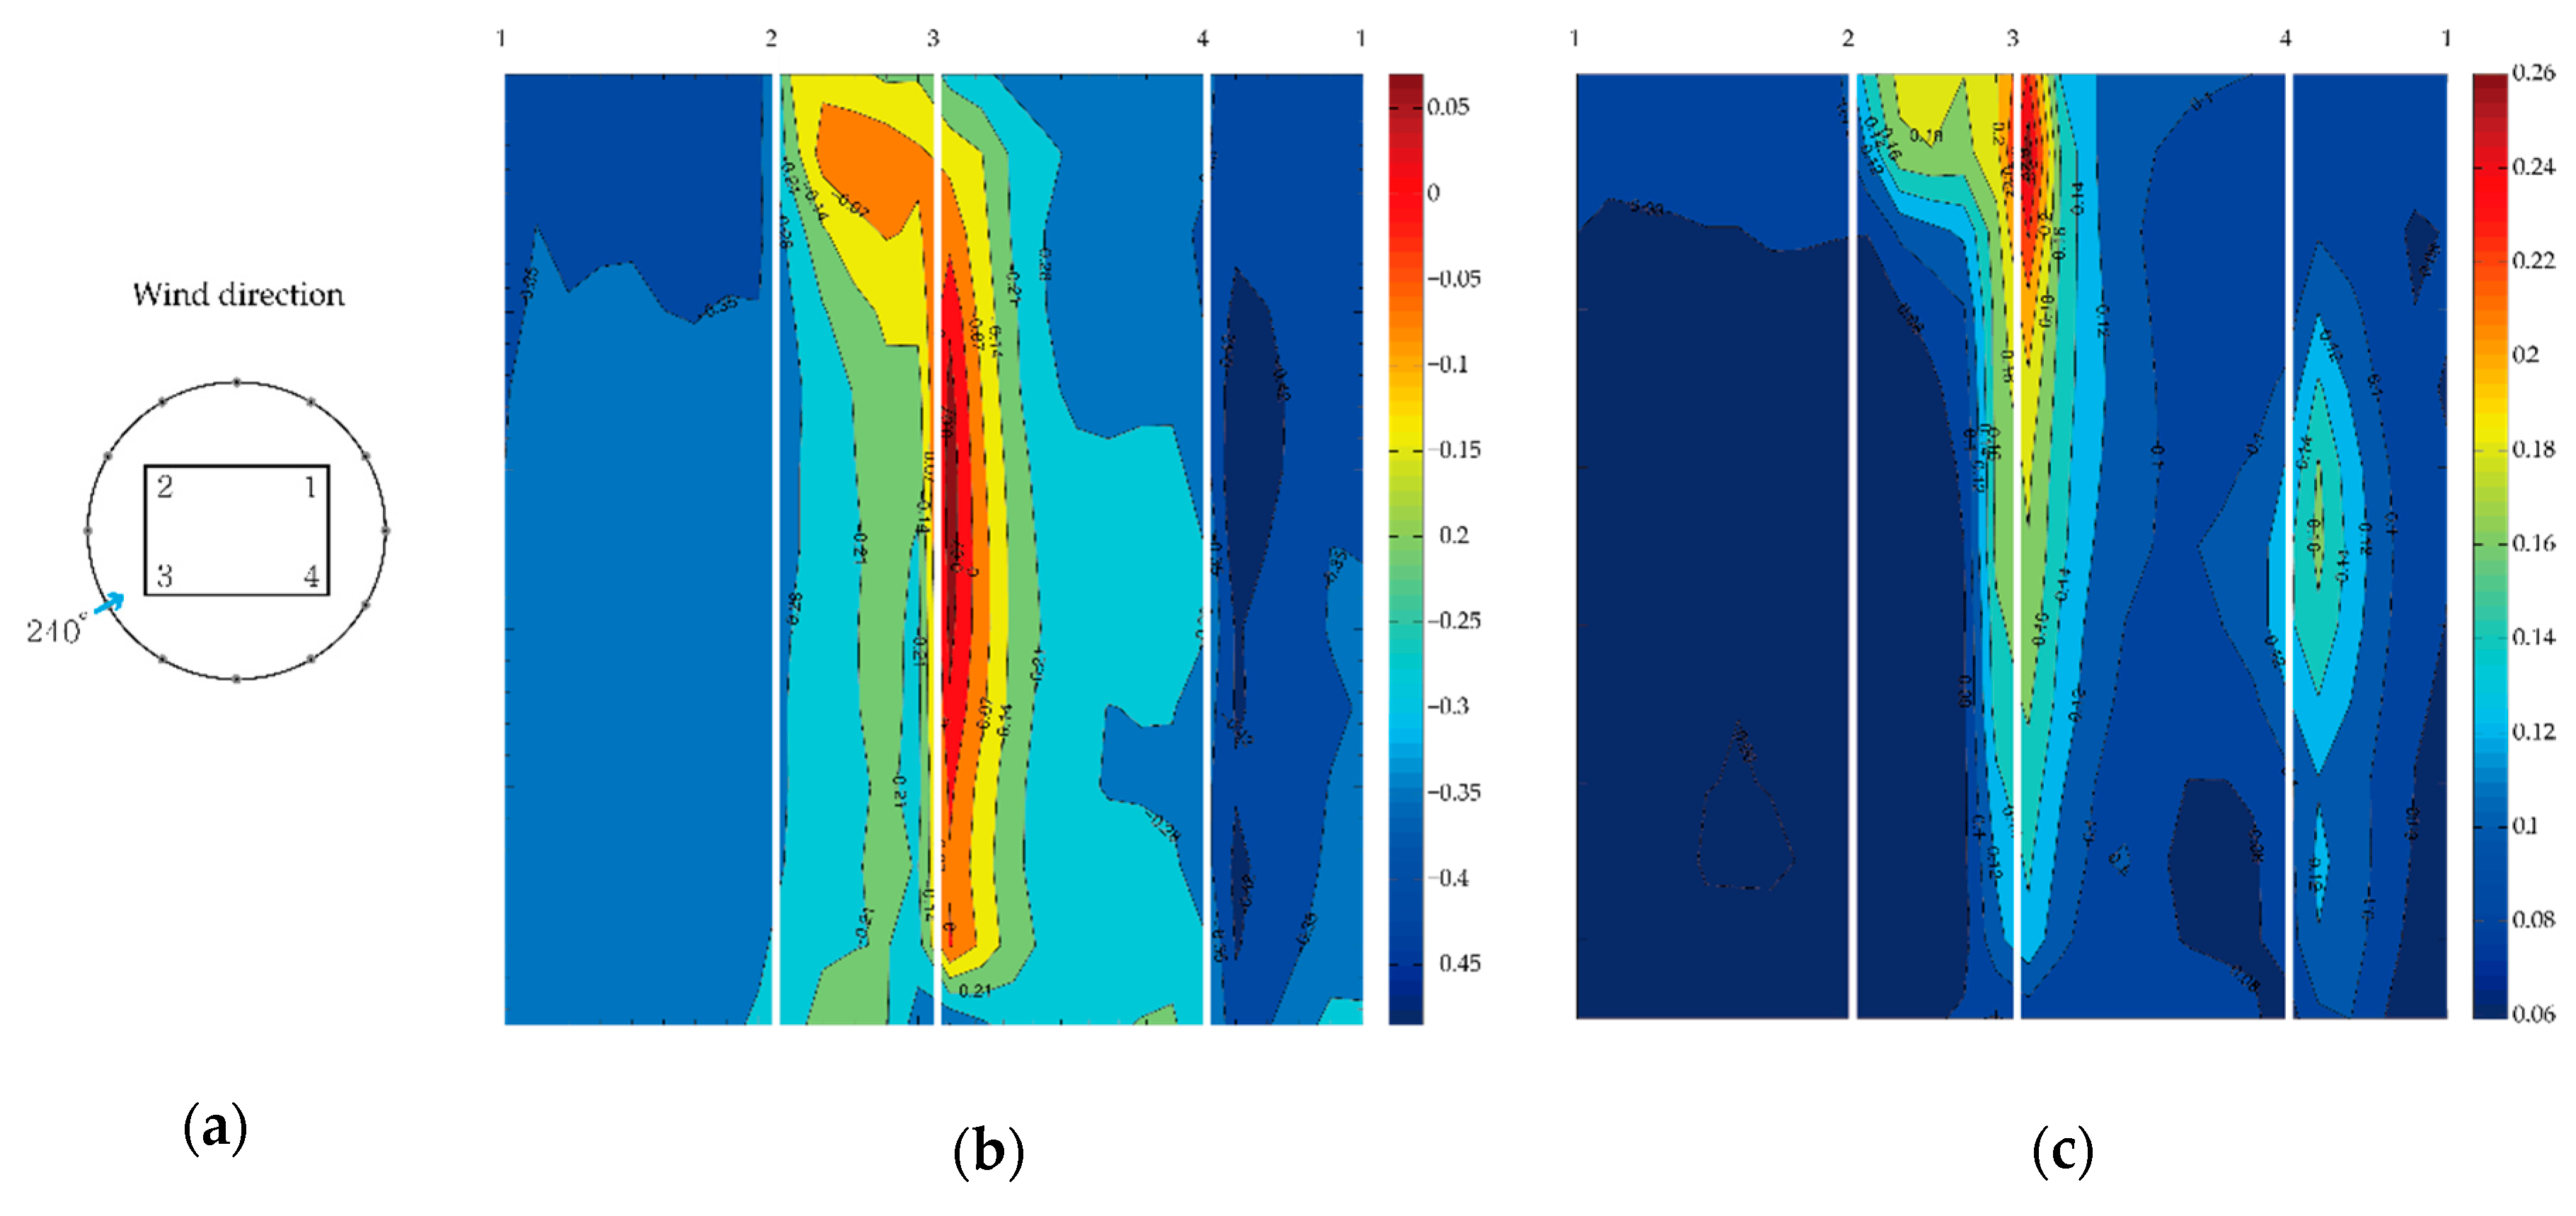
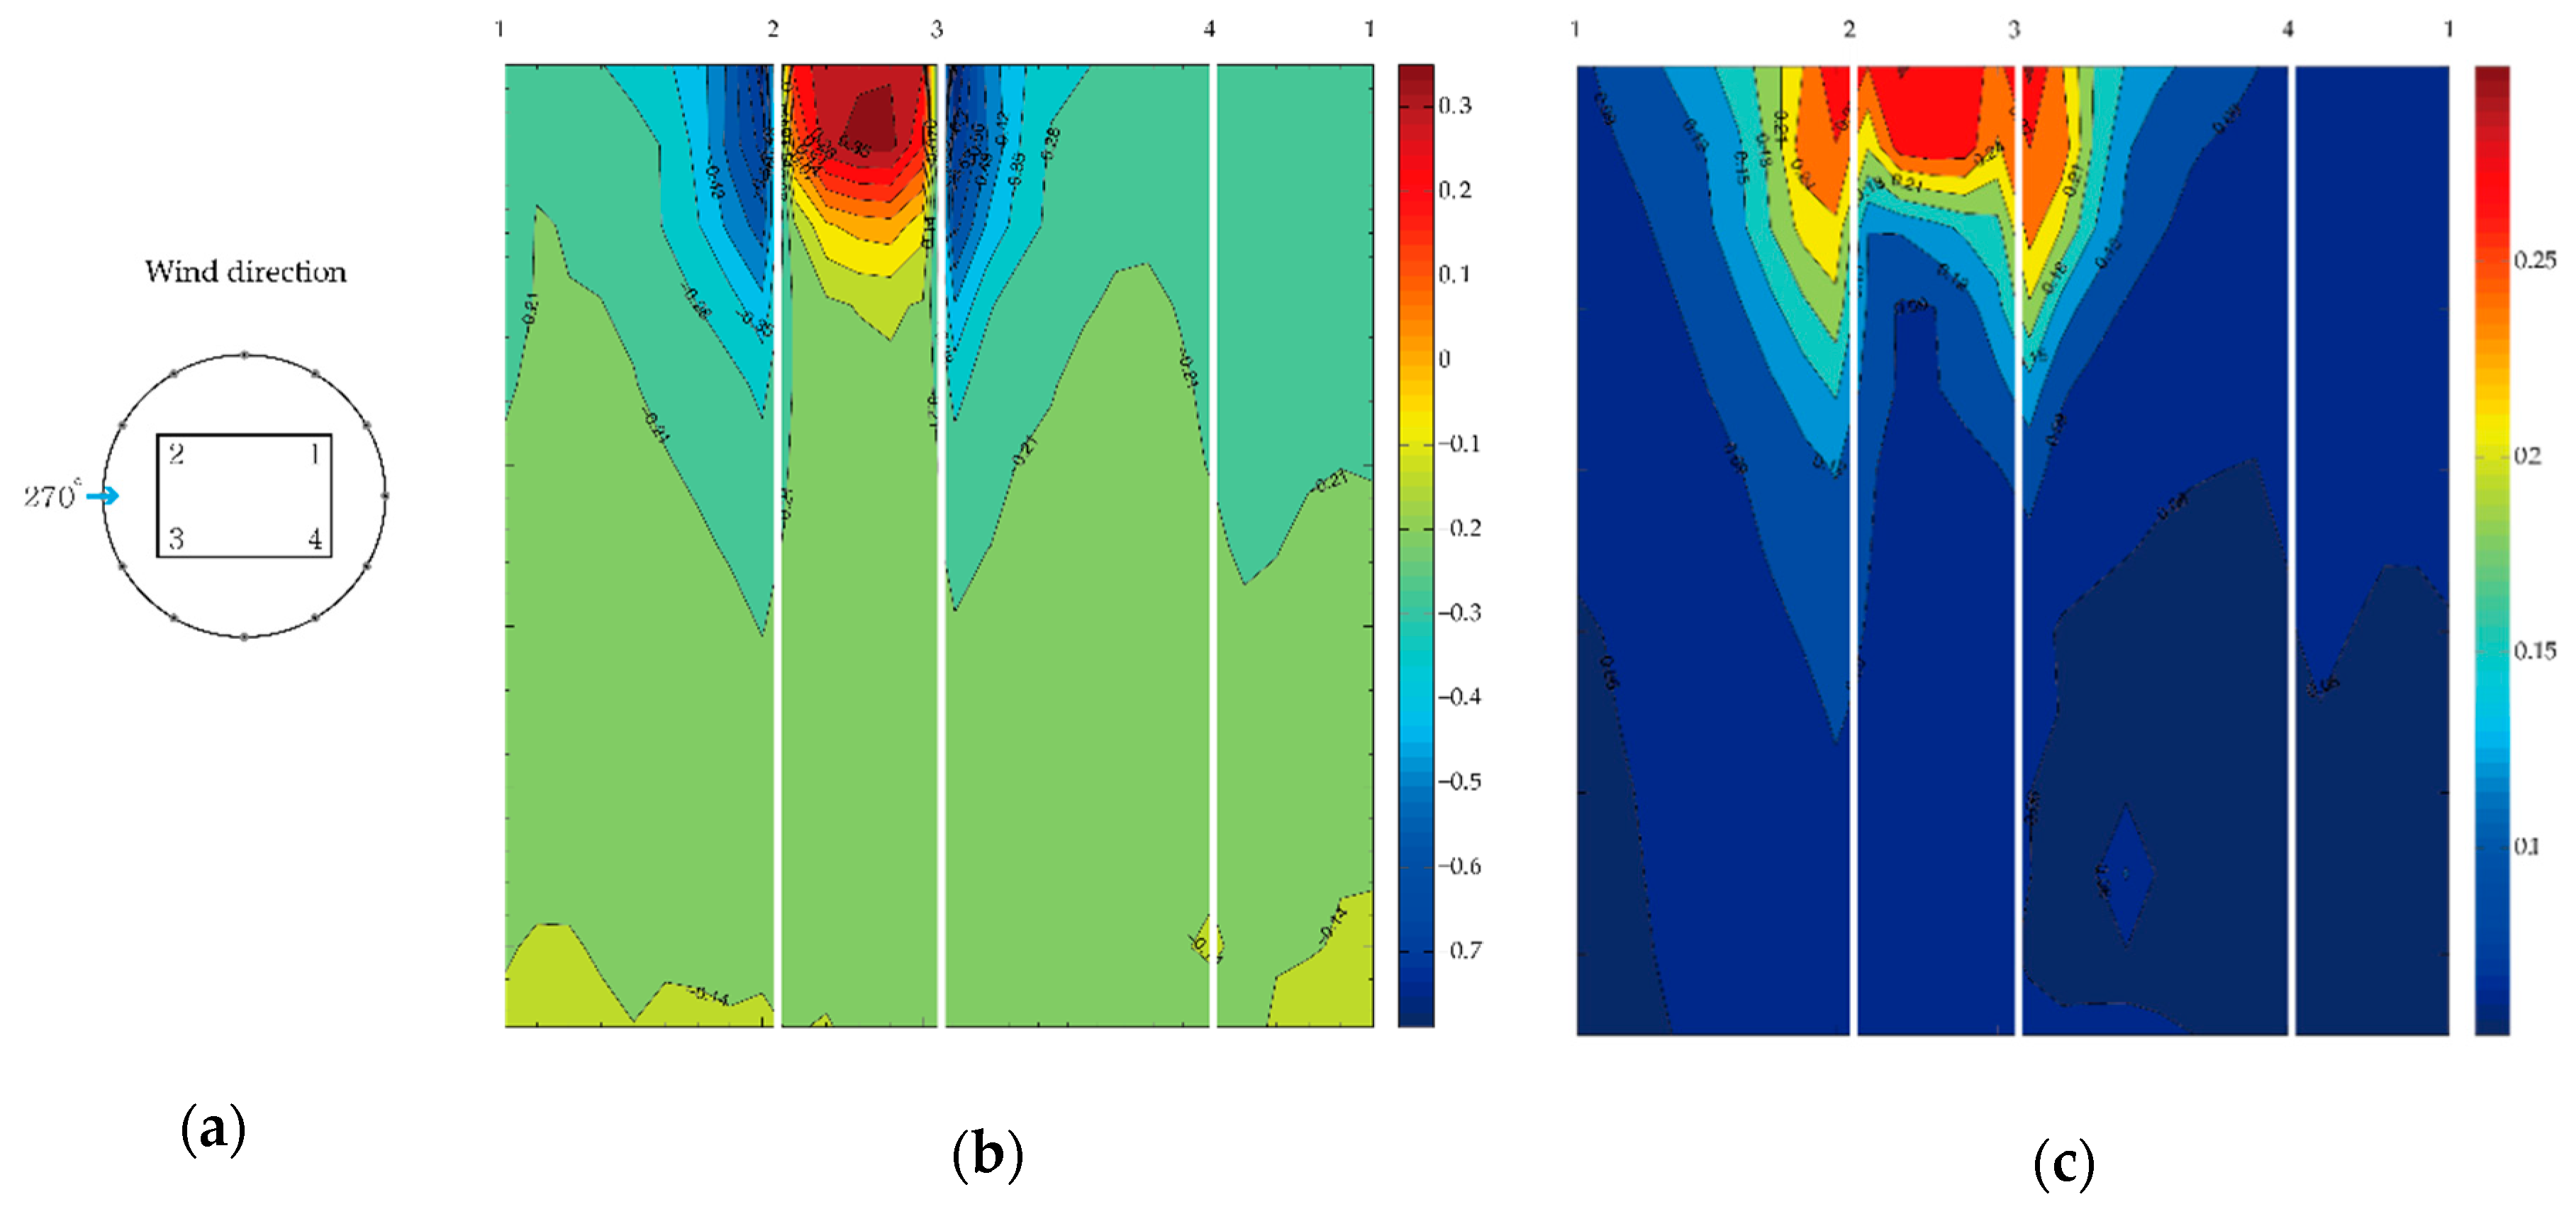
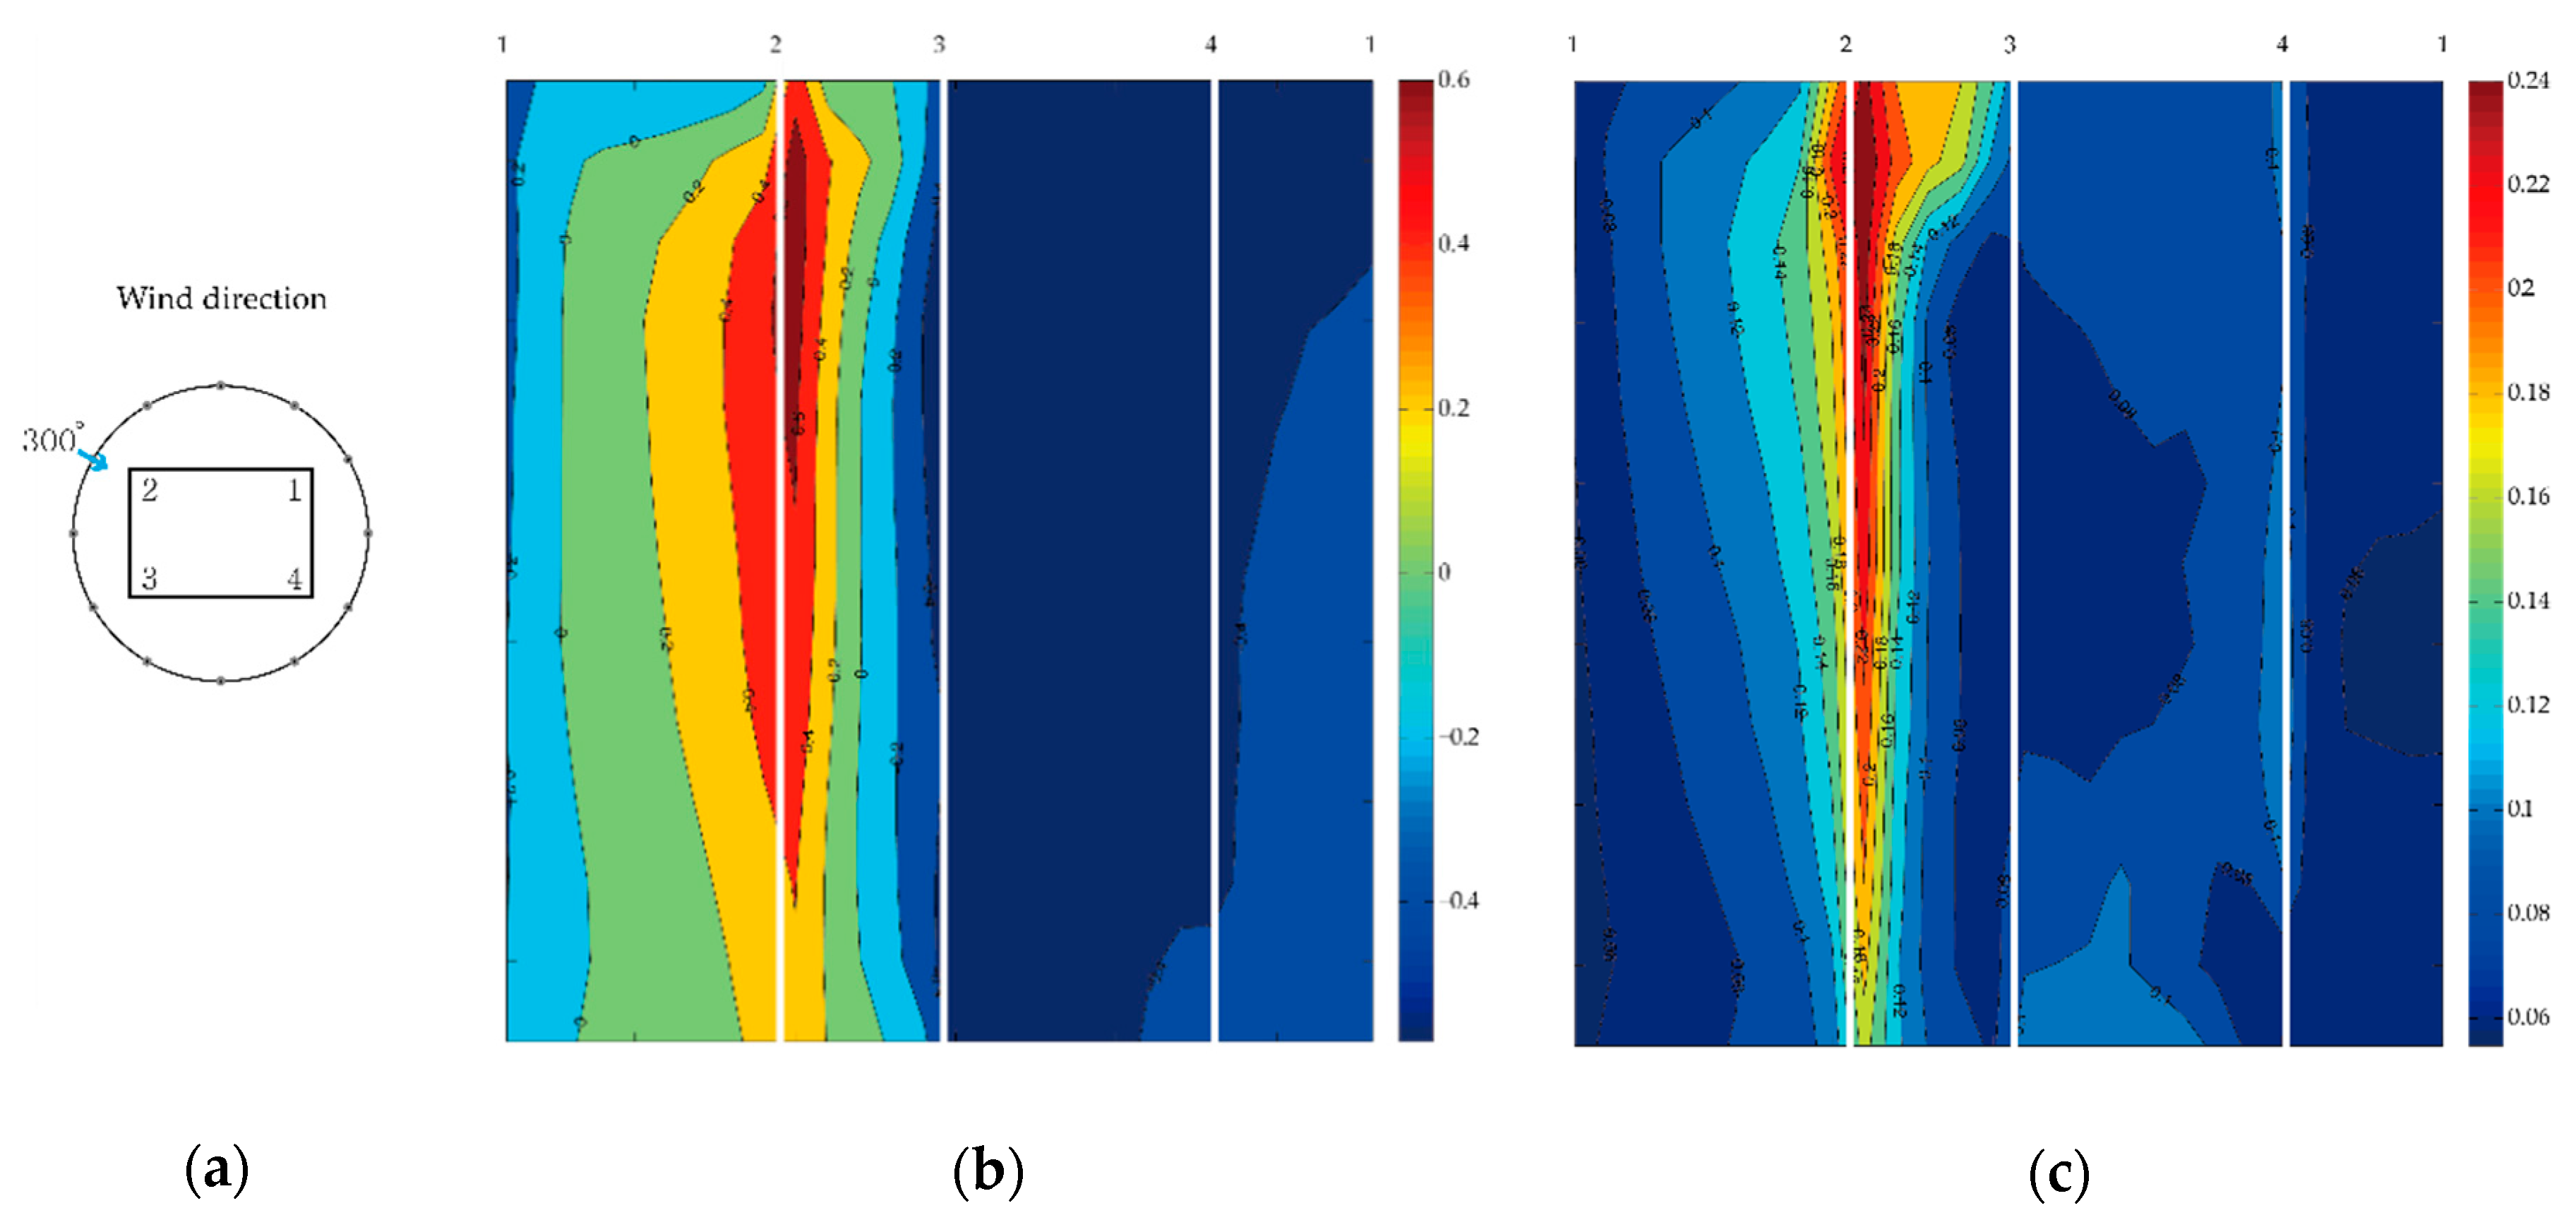
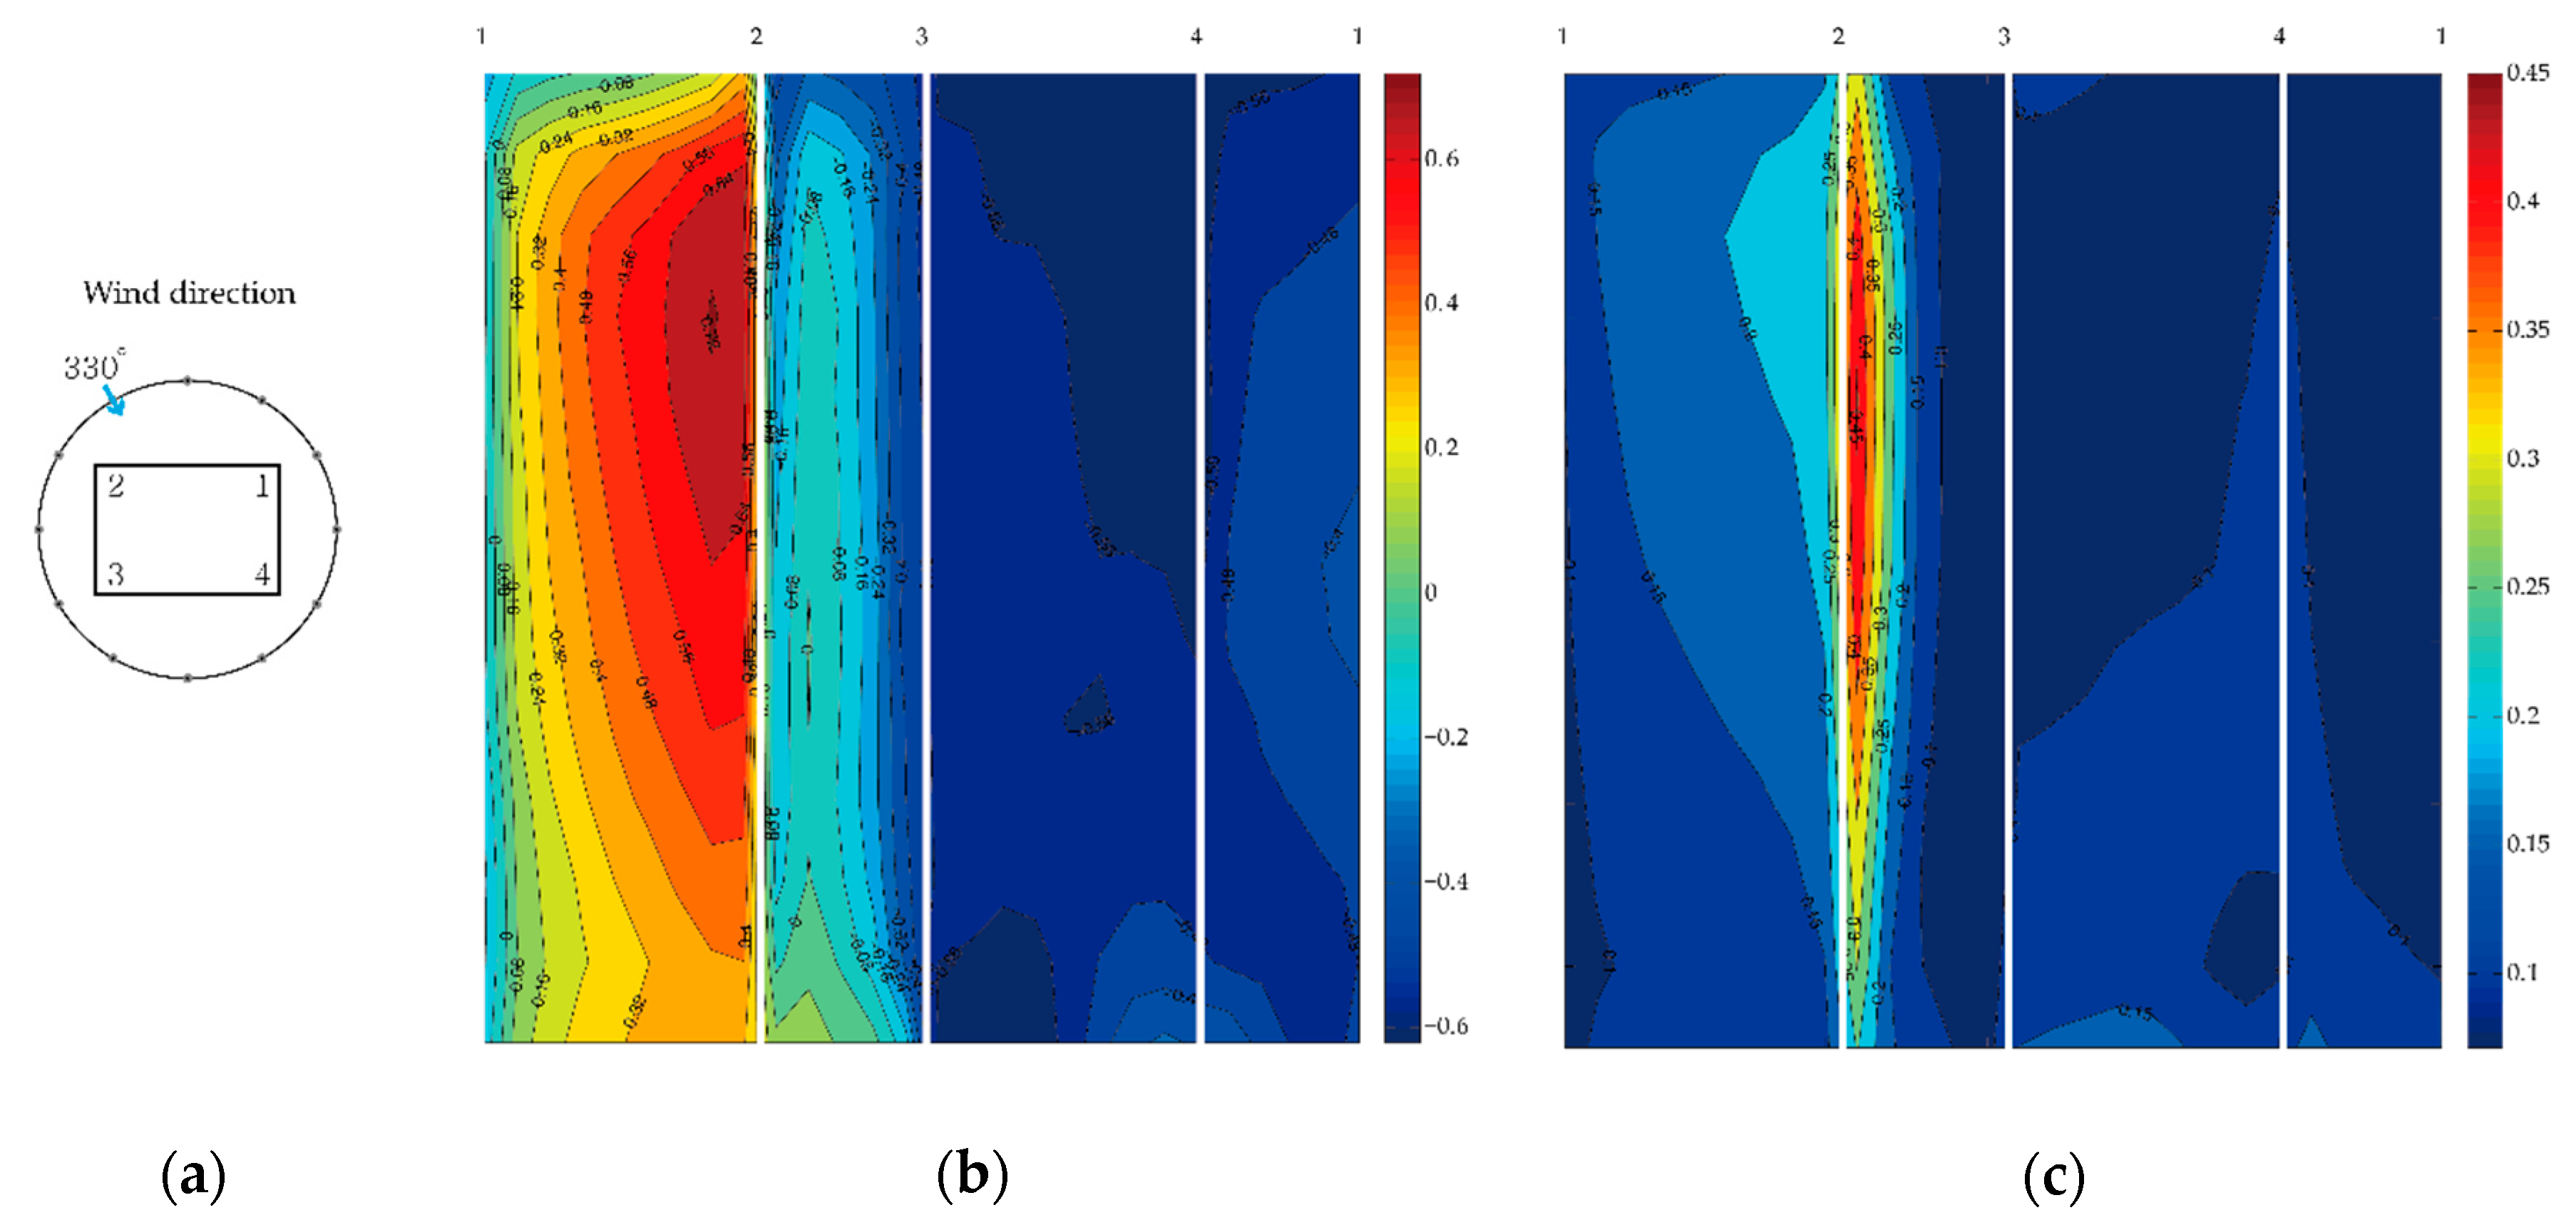
2.2.2. Experimental Results for the High-Rise Building in the Urban Environment
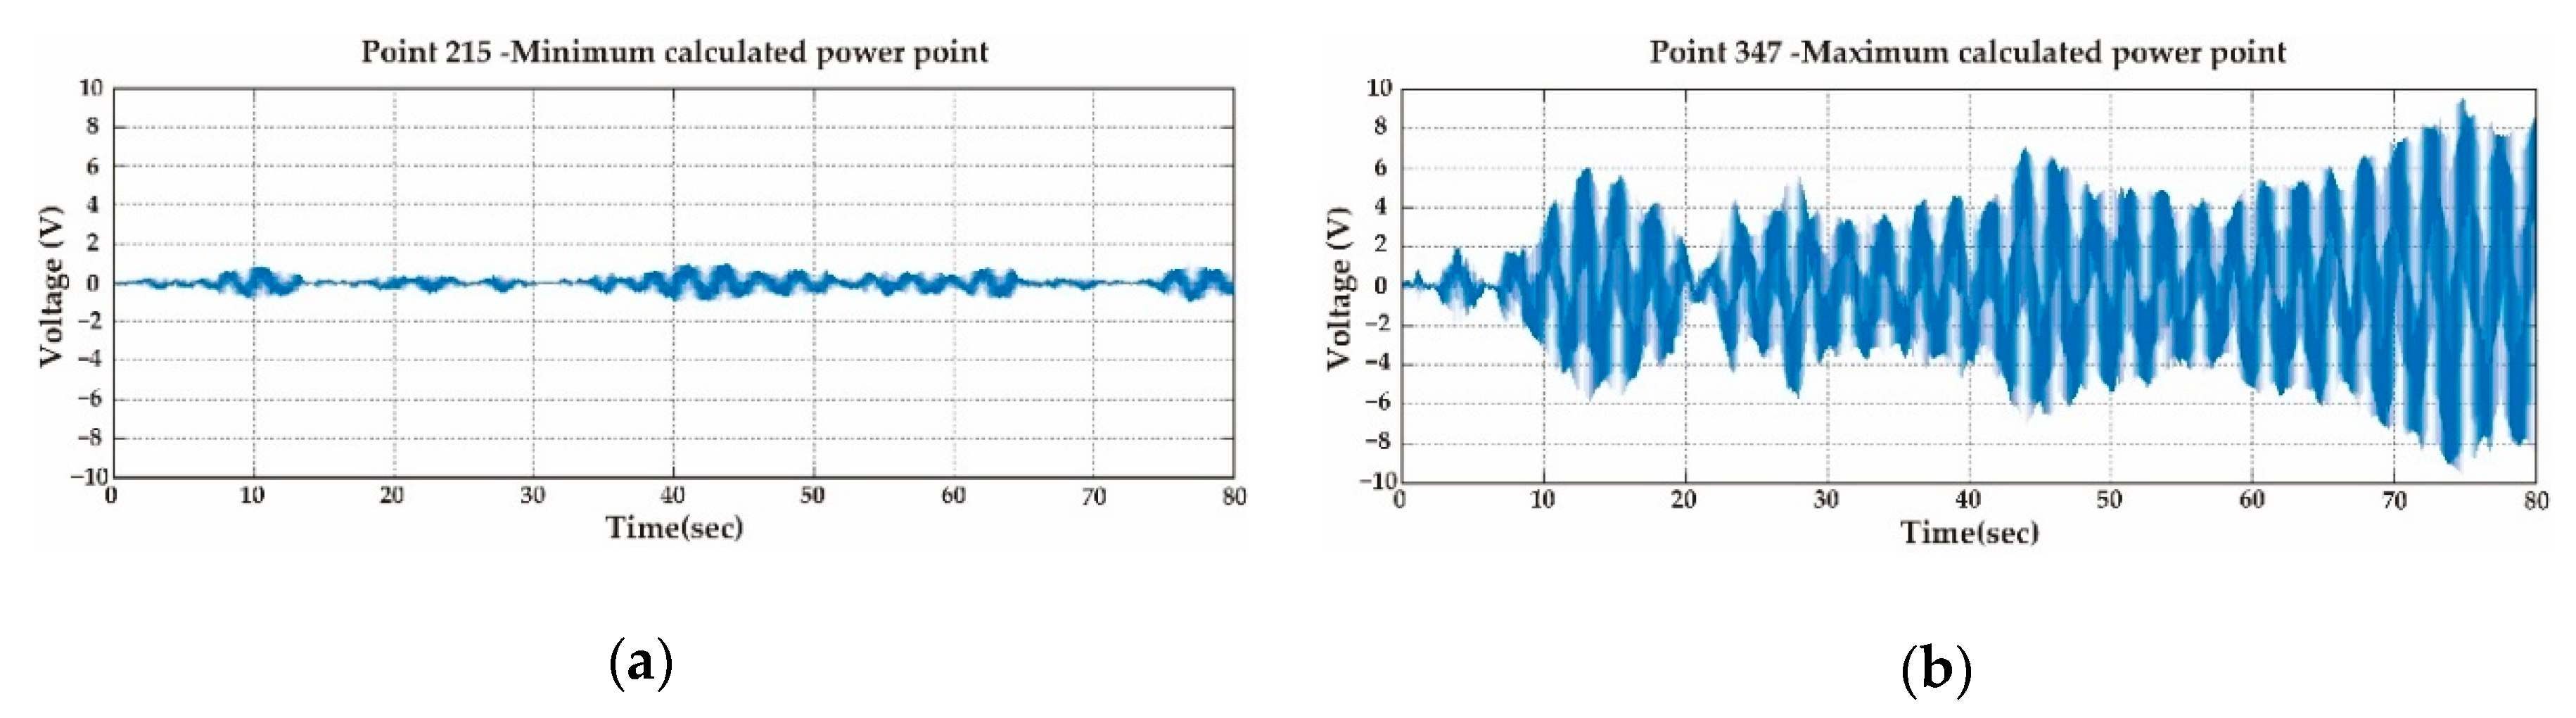
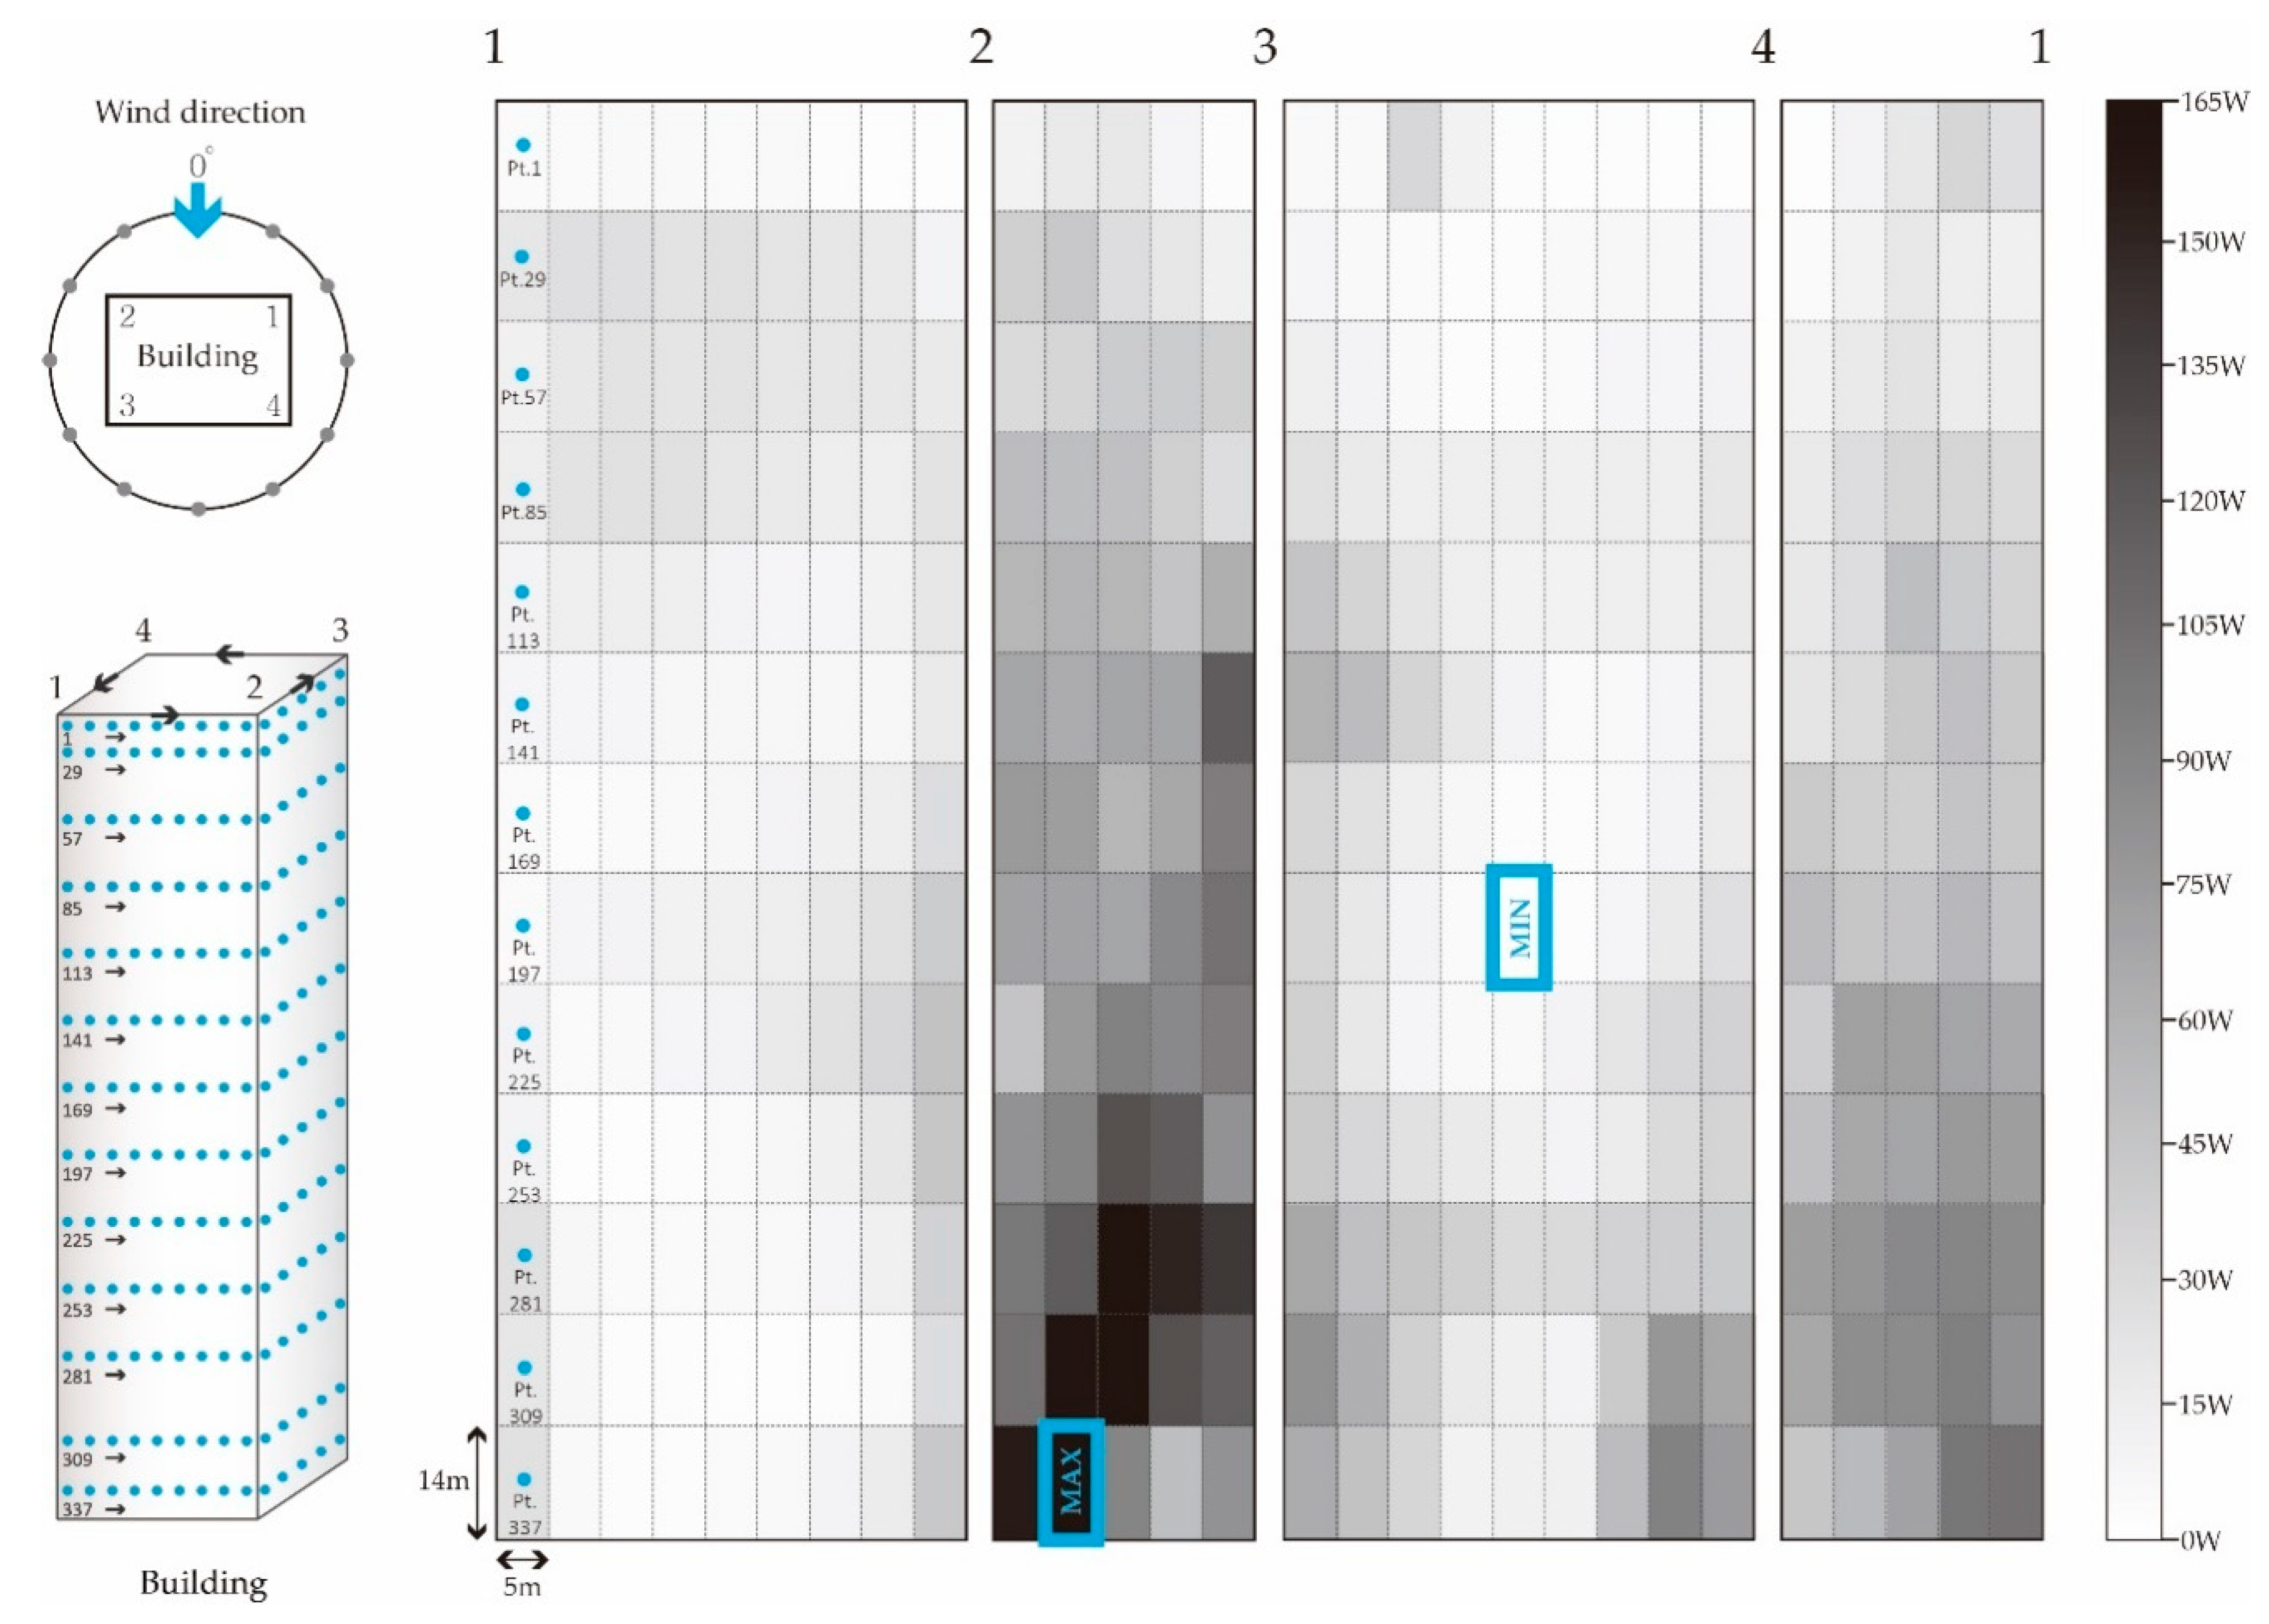
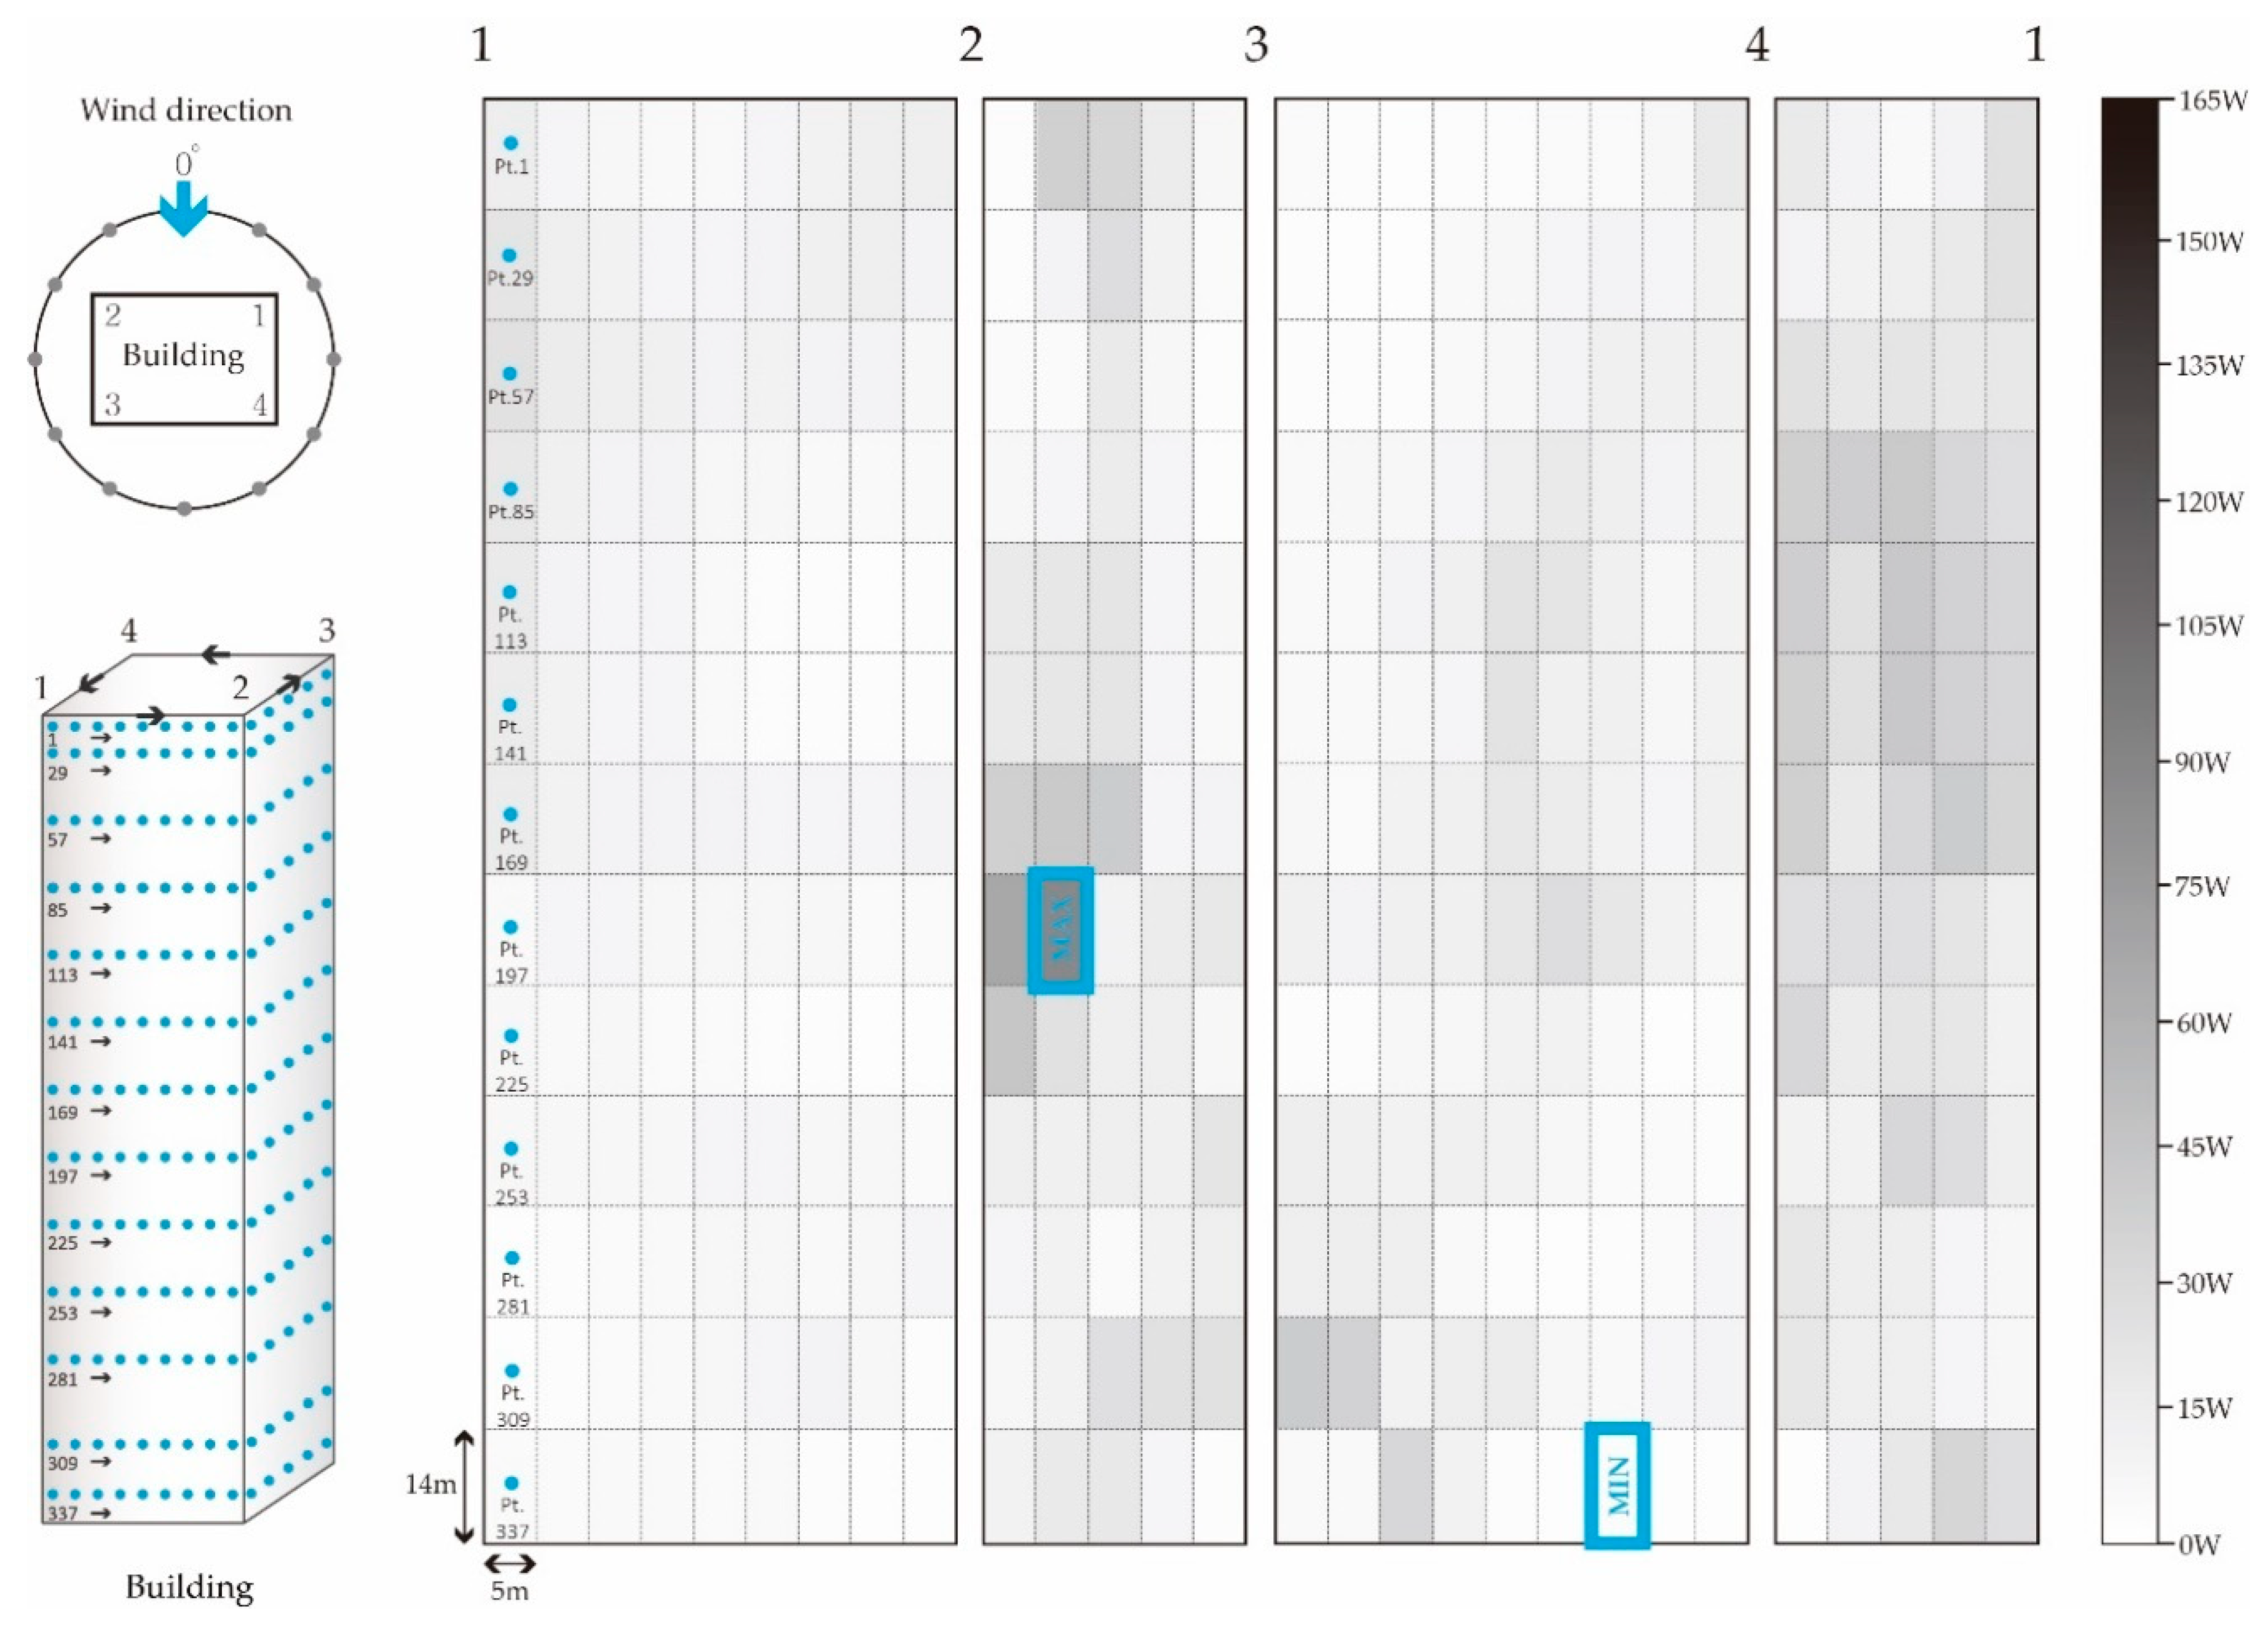
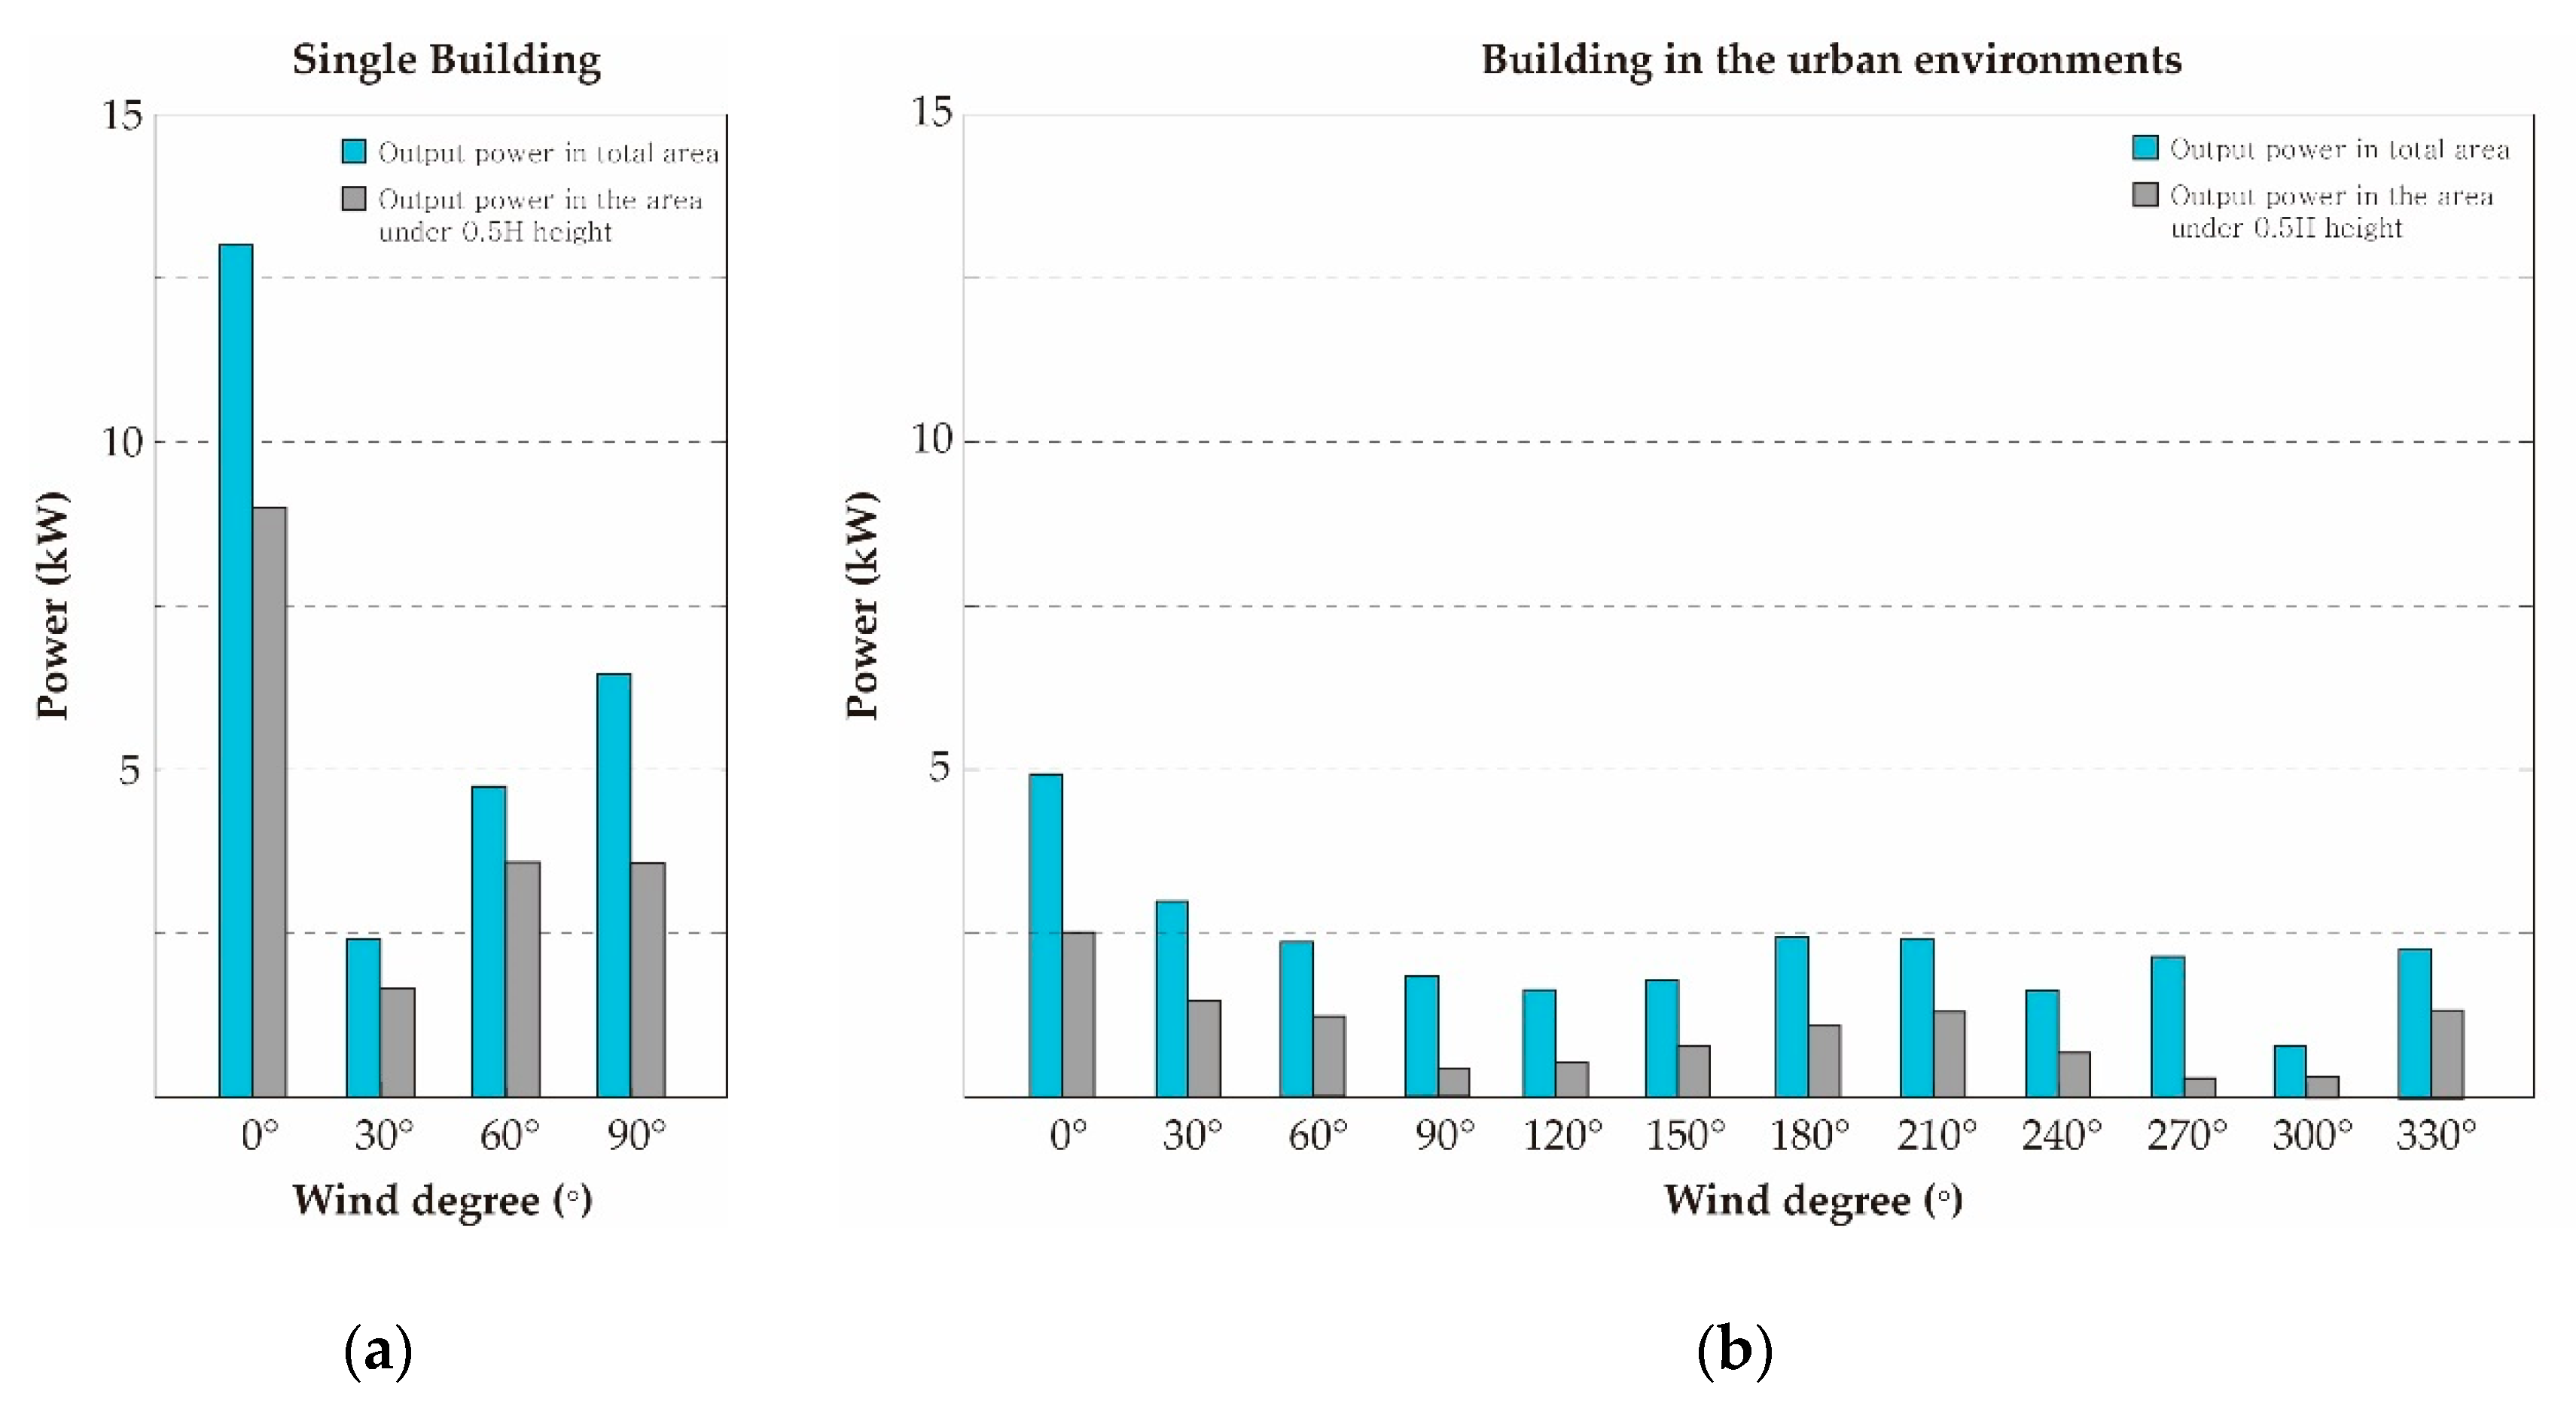
3. Feasibility Study of Fluctuating Wind Pressure around the High-Rise Building
4. Conclusions
- High-rise building without surrounding buildings
- High-rise building in the urban environment
Author Contributions
Acknowledgments
Conflicts of Interest
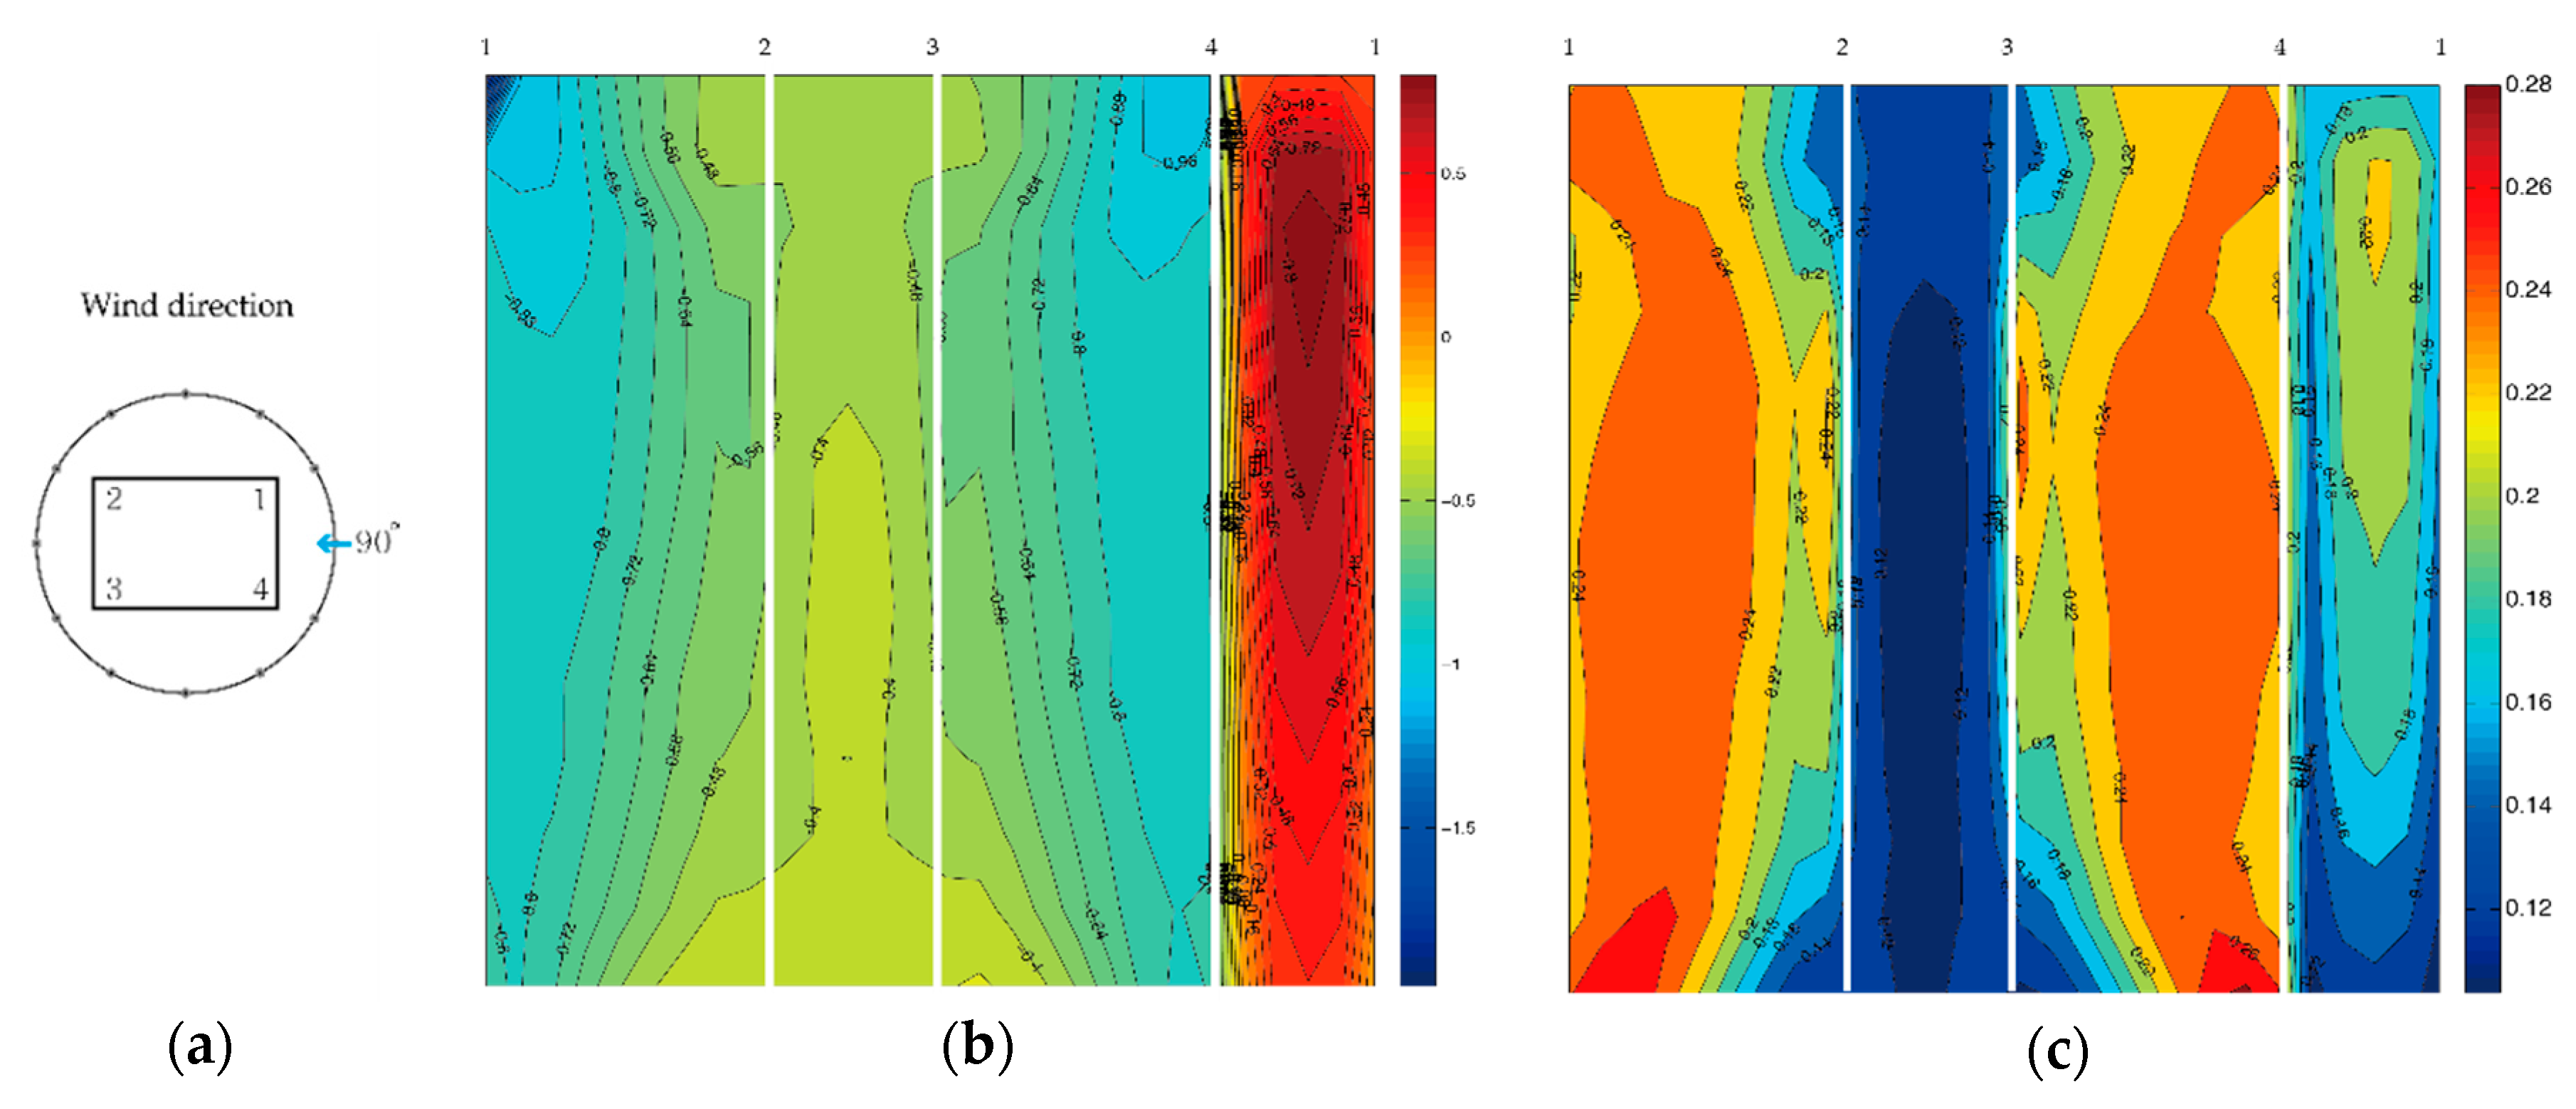
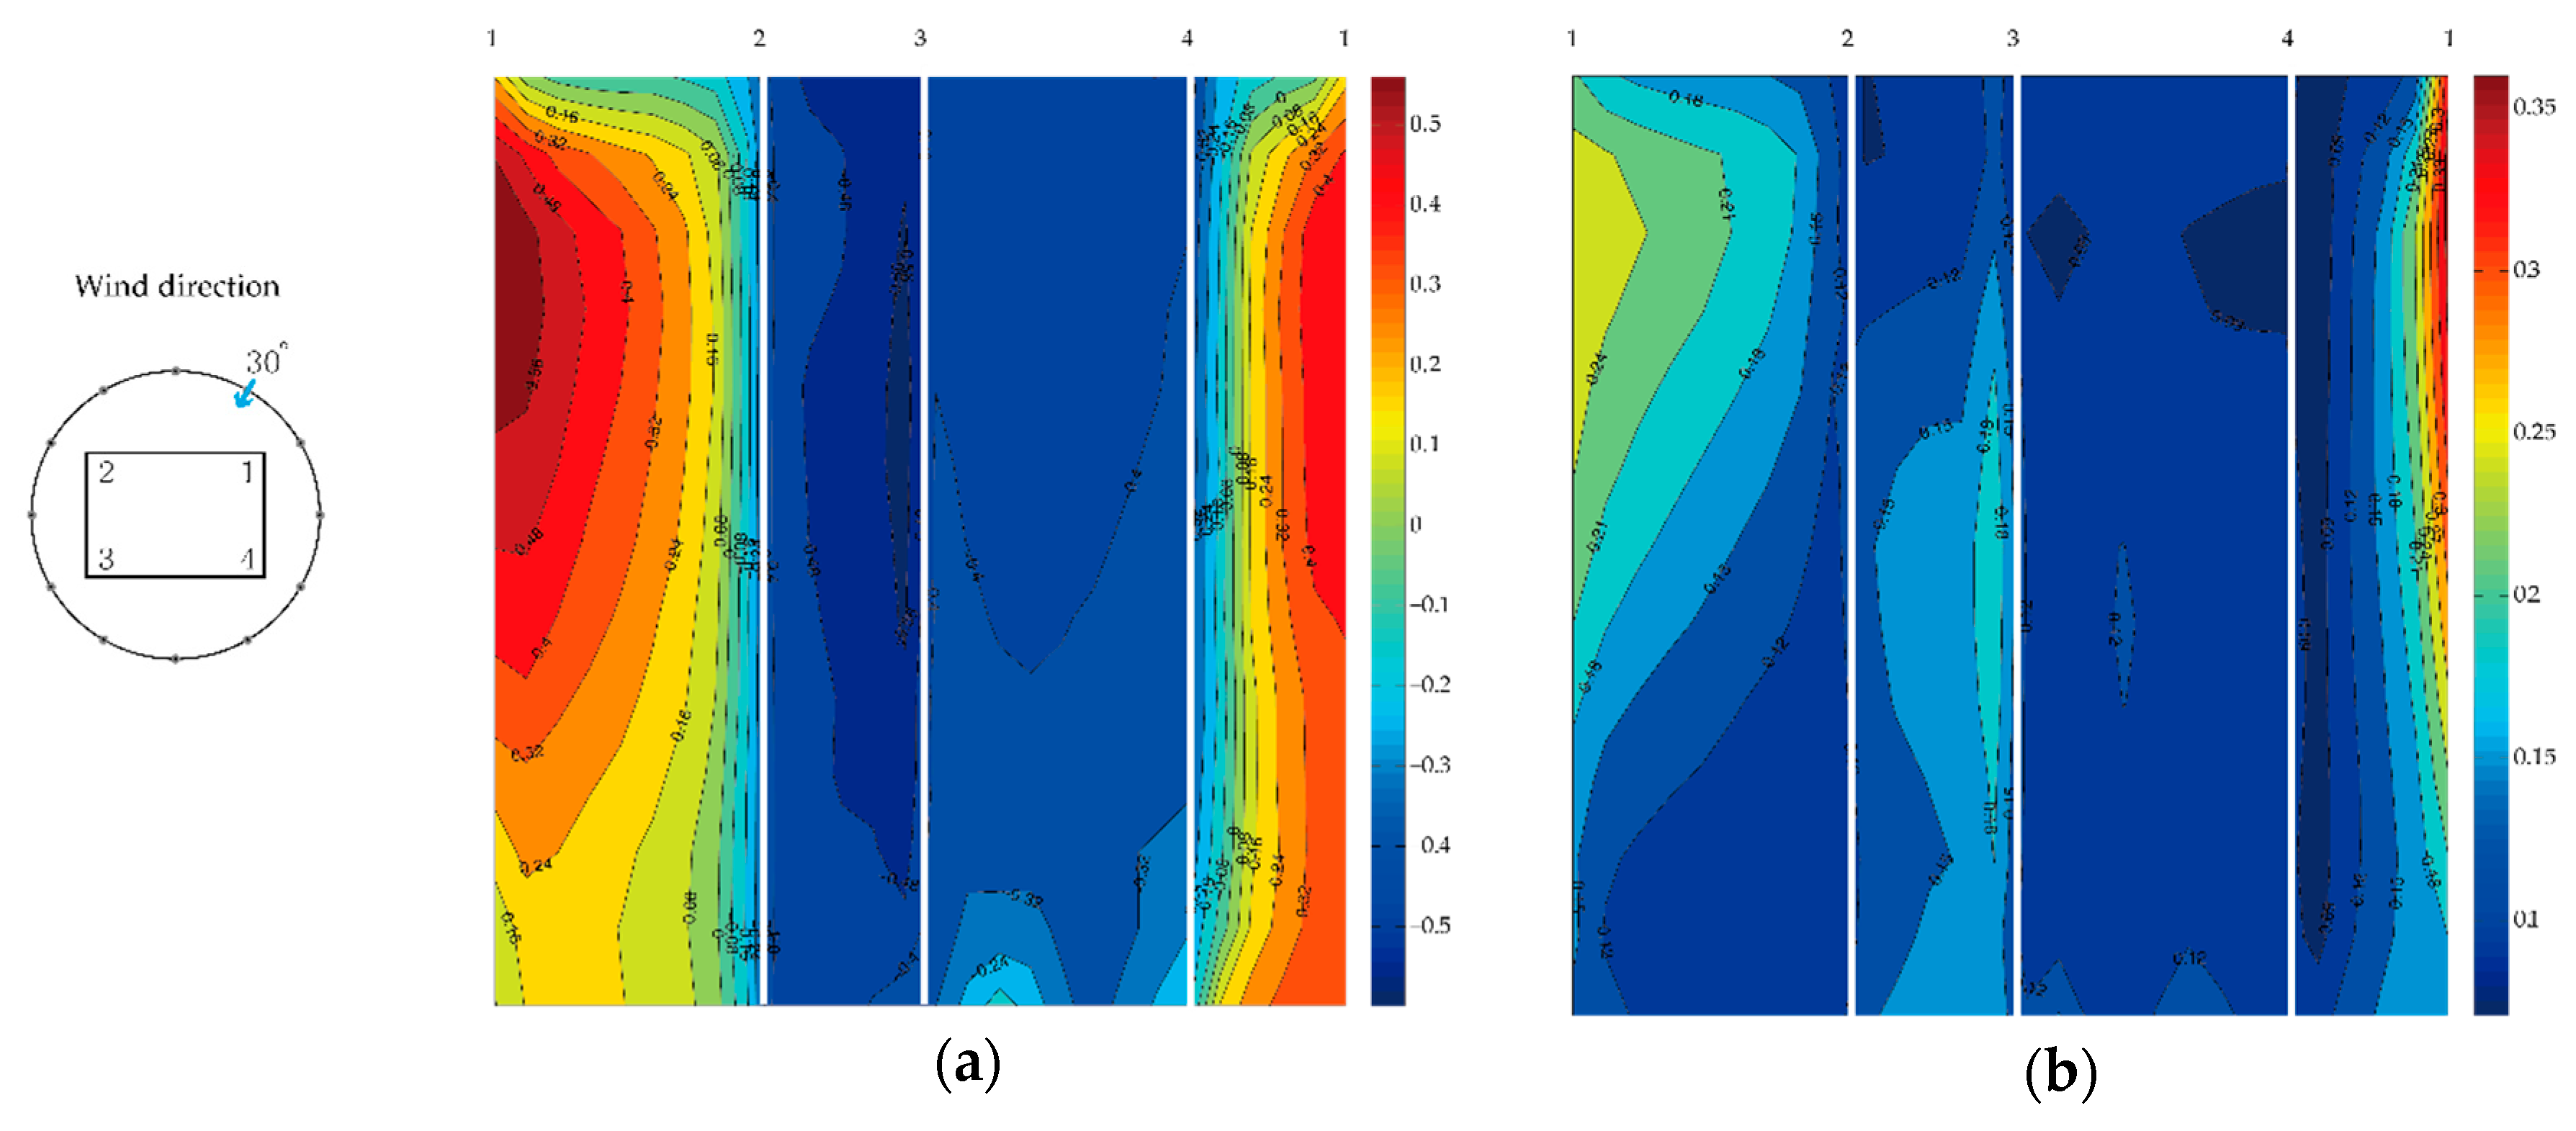
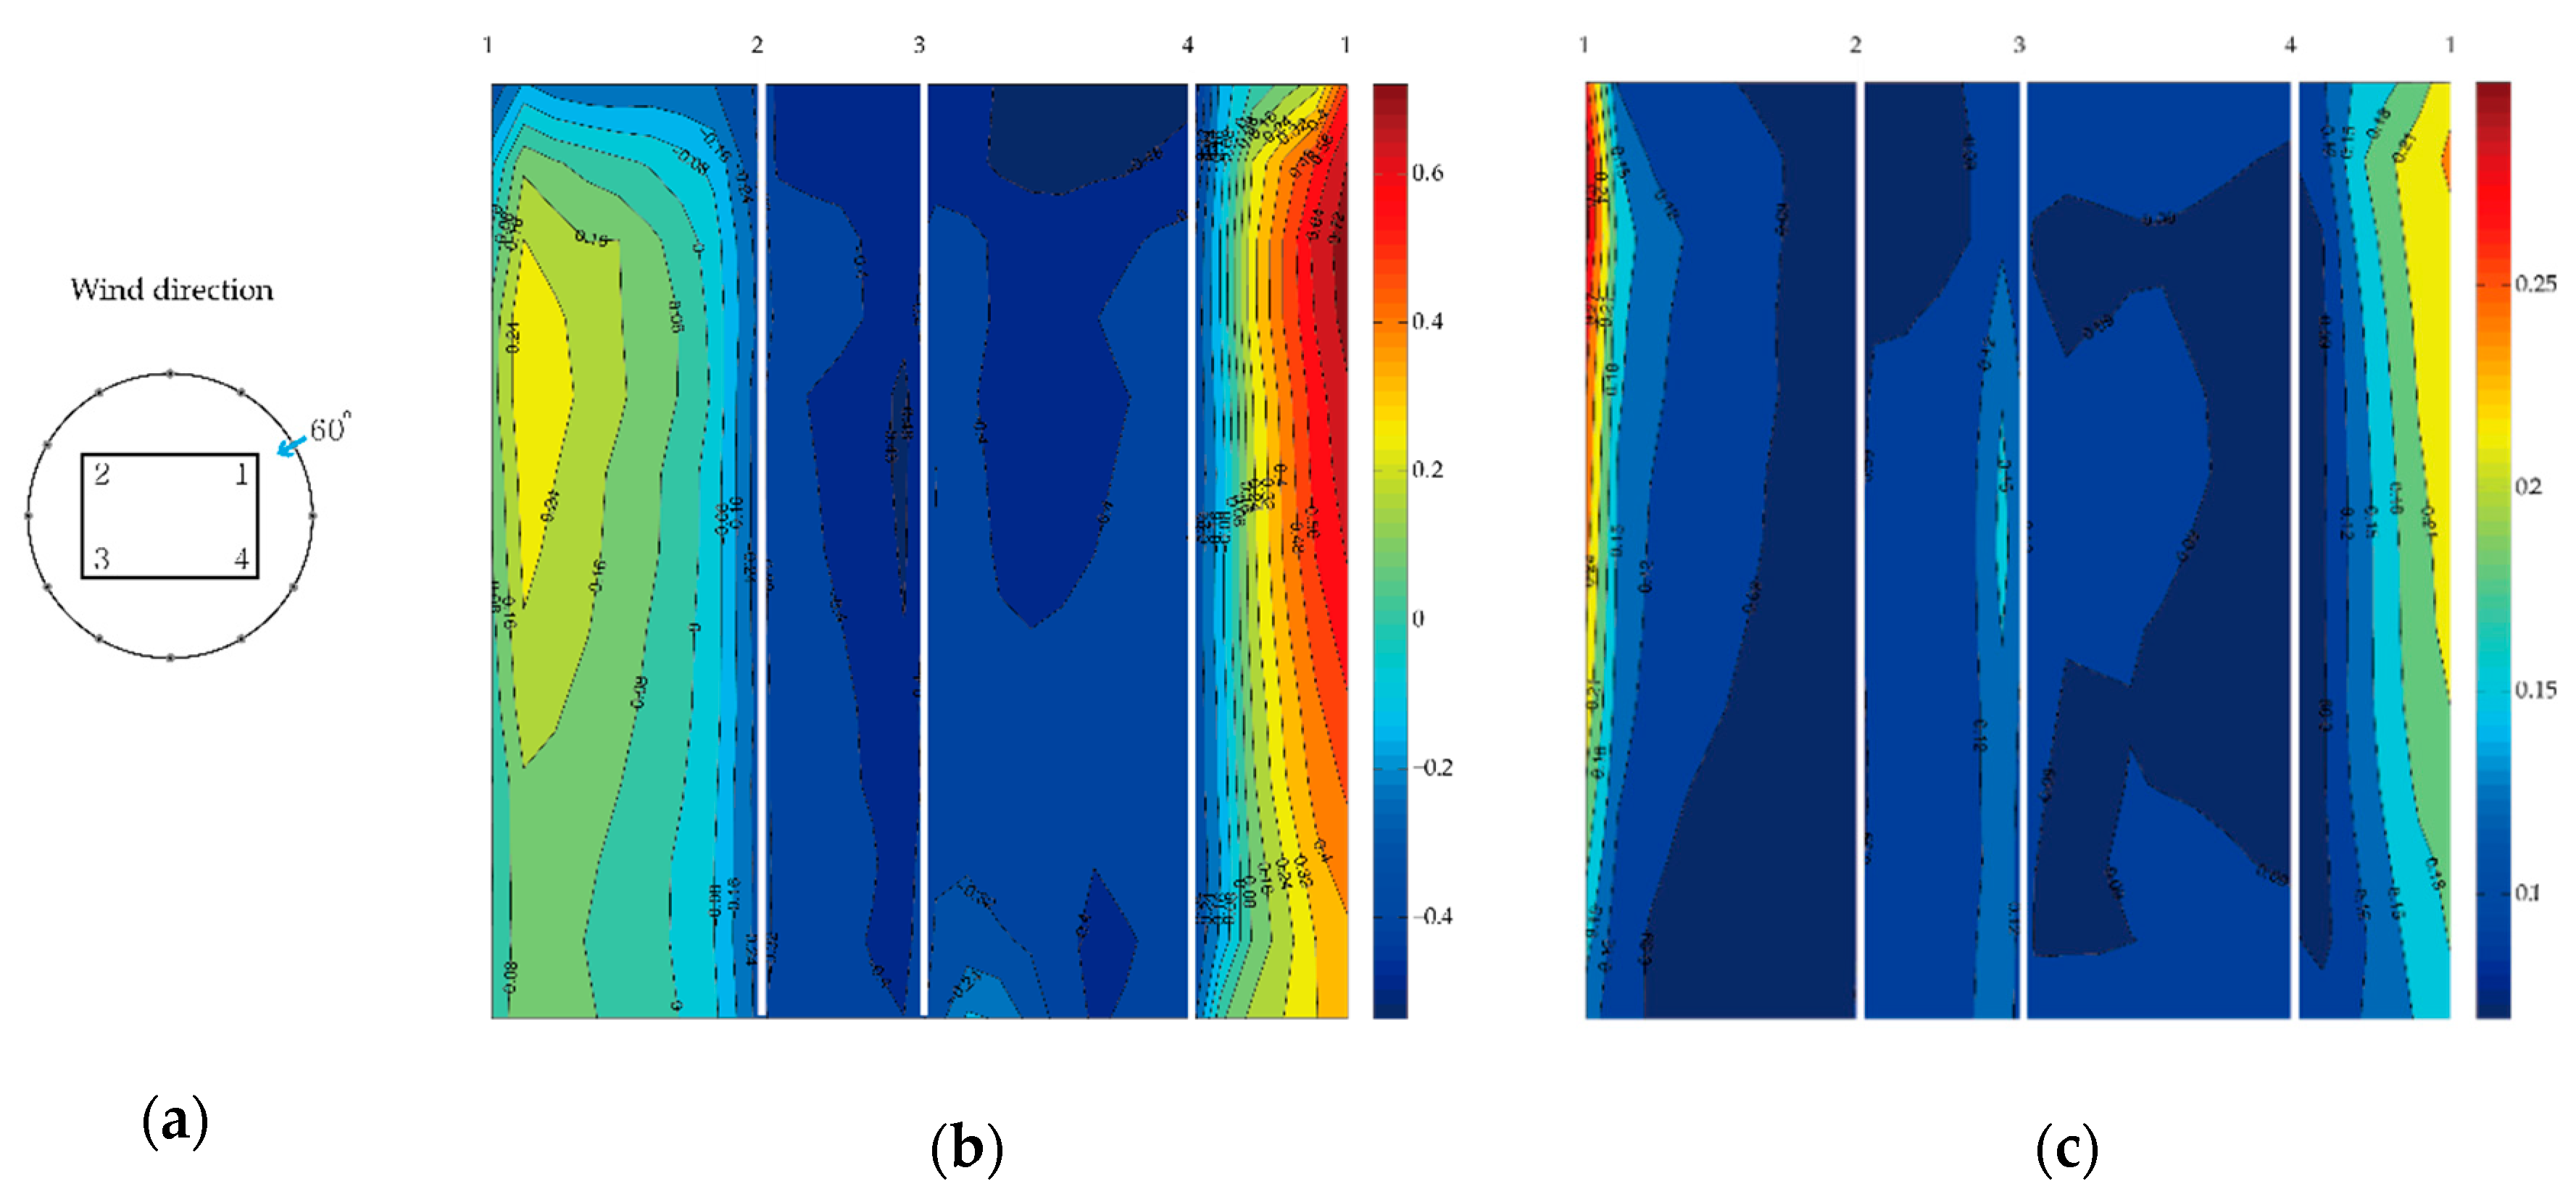
Appendix A. Pressure Distribution on the High-Rise Building without Surrounding Buildings


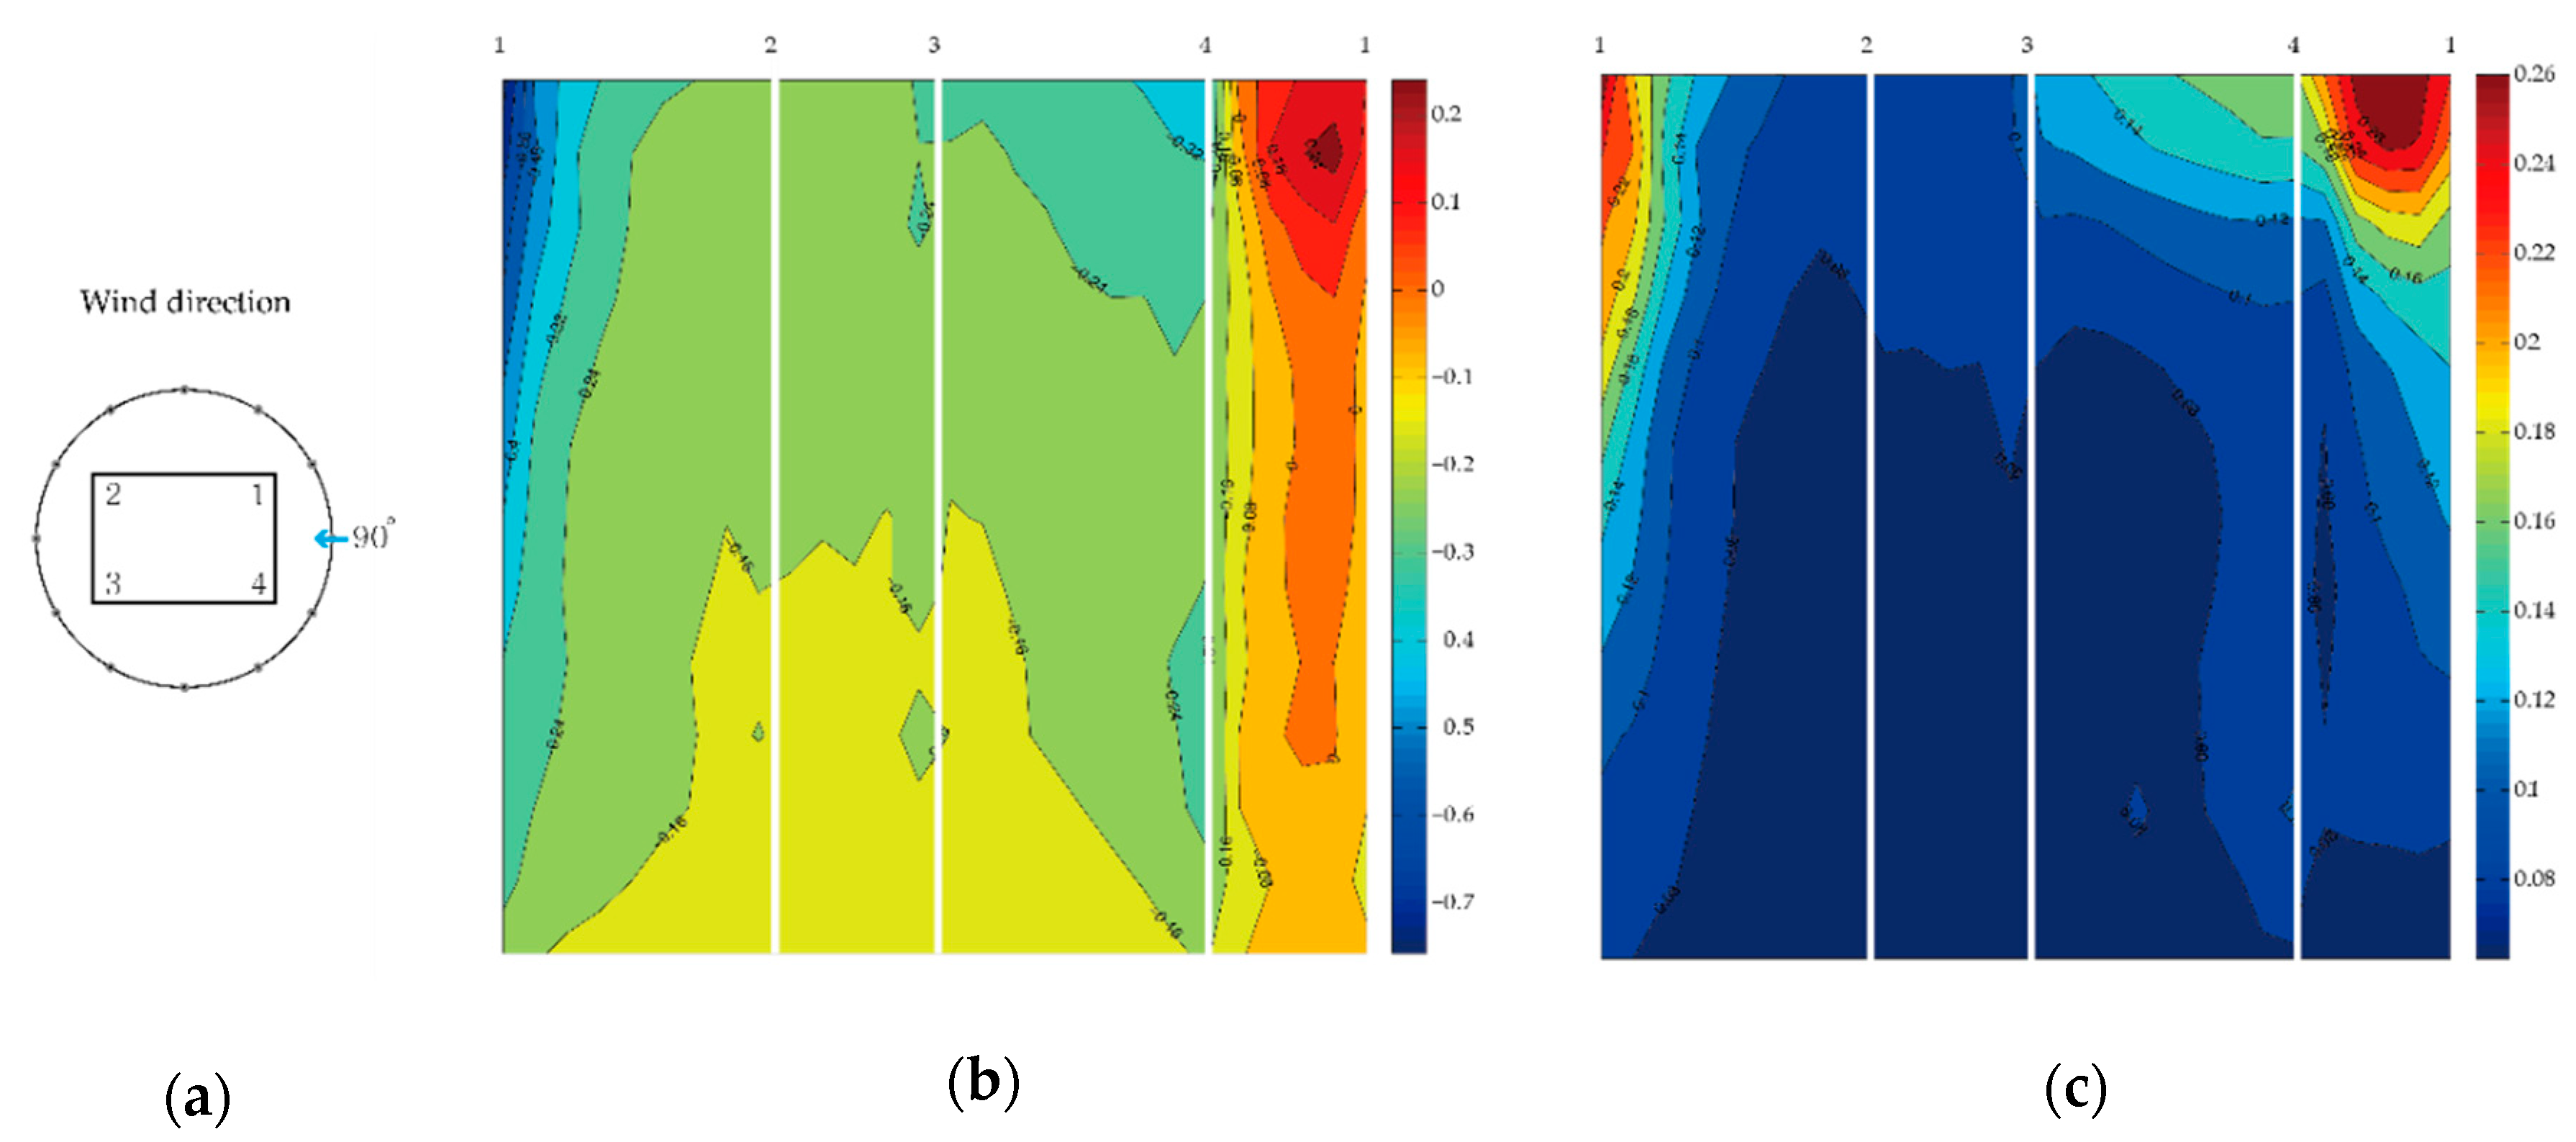
Appendix B. Pressure Distribution of the High-Rise Building in the Urban Environment


References
- Jain, P. Wind Energy Engineering; McGraw-Hill: New York, NY, USA, 2011; p. 330. [Google Scholar]
- De Alencar, D.B.; Affonso, C.D.; de Oliveir, R.C.L.; Rodriguez, J.L.M.; Leite, J.C.; Reston, J.C. Different Models for Forecasting Wind Power Generation: Case Study. Energies 2017, 10, 1976. [Google Scholar] [CrossRef]
- Manwell, J.F.; McGowan, J.G.; Rogers, A.L. Wind Energy Explained: Theory, Design and Application; John Wiley & Sons: Hoboken, NJ, USA, 2010. [Google Scholar]
- Campbell, N. Wind Energy for the Built Environment (Project WEB): Assessment of Wind Energy Utilisation Potential in Moderately Windy Built-up Areas; BDSP: London, UK, 2001. [Google Scholar]
- Smith, R.F.; Killa, S. Bahrain world trade center (BWTC): The first large-scale integration of wind turbines in a building. Struct. Des. Tall Spec. Bulid. 2007, 16, 429–439. [Google Scholar] [CrossRef]
- Al-Kodmany, M.K. Green towers and iconic design: Cases from three continents. Int. J. Archit. Res. ArchNet-IJAR 2014, 8, 11–28. [Google Scholar] [CrossRef]
- Cowan, D. Strata SE1, London—Propelling sustainable regeneration. Proc. Inst. Civ. Eng. 2010, 163, 56–63. [Google Scholar] [CrossRef]
- Pitteloud, J.; Gsänger, S. Small Wind World Report Summary; World Wind Energy Association (WWEA): Bonn, Germany, 2017. [Google Scholar]
- McTavish, S.; Feszty, D.; Sankar, T. Steady and rotating computational fluid dynamics simulations of a novel vertical axis wind turbine for small-scale power generation. Renew. Energy 2012, 41, 171–179. [Google Scholar] [CrossRef]
- Abdalrahman, G.; Melek, W.; Lien, F.S. Pitch angle control for a small-scale Darrieus vertical axis wind turbine with straight blades (H-Type VAWT). Renew. Energy 2017, 114, 1353–1362. [Google Scholar] [CrossRef]
- Jin, X.; Wang, Y.M.; Ju, W.B.; He, J.; Xie, S.Y. Investigation into parameter influence of upstream deflector on vertical axis wind turbines output power via three-dimensional CFD simulation. Renew. Energy 2018, 115, 41–53. [Google Scholar] [CrossRef]
- Sharpe, T.; Proven, G. Crossflex: Concept and early development of a true building integrated wind turbine. Energy Build. 2010, 42, 2365–2375. [Google Scholar] [CrossRef]
- Chong, W.T.; Poh, S.C.; Fazlizan, A.; Pan, K.C. Vertical axis wind turbine with omni-directional-guide-vane for urban high-rise buildings. J. Cent. South Univ. 2012, 19, 727–732. [Google Scholar] [CrossRef]
- Tjiu, W.; Marnoto, T.; Mat, S.; Ruslan, M.H.; Sopian, K. Darrieus vertical axis wind turbine for power generation I: Assessment of Darrieus VAWT configurations. Renew. Energy 2015, 75, 50–67. [Google Scholar] [CrossRef]
- Bayoumi, M.; Fink, D.; Hausladen, G. Extending the feasibility of high-rise façade augmented wind turbines. Energy Build. 2013, 60, 12–19. [Google Scholar] [CrossRef]
- Park, J.; Jung, H.-J.; Lee, S.-W.; Park, J. A new building-integrated wind turbine system utilizing the building. Energies 2015, 8, 11846–11870. [Google Scholar] [CrossRef]
- Hassanli, S.; Kwok, K.C.; Zhao, M. Performance assessment of a special Double Skin Façade system for wind energy harvesting and a case study. J. Wind Eng. Ind. Aerodyn. 2018, 175, 292–304. [Google Scholar] [CrossRef]
- Meng, F.Q.; He, B.J.; Zhu, J.; Zhao, D.X.; Darko, A.; Zhao, Z.Q. Sensitivity analysis of wind pressure coefficients on CAARC standard tall buildings in CFD simulations. J. Build. Eng. 2018, 16, 146–158. [Google Scholar] [CrossRef]
- Zhao, D.X.; He, B.J. Effects of architectural shapes on surface wind pressure distribution: Case studies of oval-shaped tall buildings. J. Build. Eng. 2017, 12, 219–228. [Google Scholar] [CrossRef]
- Kim, Y. Pressure fluctuations on a tall building with square cross-section. In Proceedings of the International Symposium 1st Wind and Structures for the 21st Century, Cheju, Korea, 26–28 January 2000; pp. 393–406. [Google Scholar]
- Scanivalve Corporation. ZOC 33/64Px—Electronic Pressure Scanning Module, Instruction and Service Manual; Scanivalve Corporation: Liberty Lake, WA, USA, 2003. [Google Scholar]
- Cao, B.C.; Sarkar, P.P. Time-Domain Aeroelastic Loads and Response of Flexible Bridges in Gusty Wind: Prediction and Experimental Validation. J. Eng. Mech. 2013, 139, 359–366. [Google Scholar] [CrossRef]
- Jakobsen, J.B.; Andersen, T.L.; Macdonald, J.H.G.; Nikitas, N.; Larose, G.L.; Savage, M.G.; McAuliffe, B.R. Wind-induced response and excitation characteristics of an inclined cable model in the critical Reynolds number range. J. Wind Eng. Ind. Aerodyn. 2012, 110, 100–112. [Google Scholar] [CrossRef]
- Mishra, A.R.; James, D.L.; Letchford, C.W. Physical simulation of a single-celled tornado-like vortex, Part B: Wind loading on a cubical model. J. Wind Eng. Ind. Aerodyn. 2008, 96, 1258–1273. [Google Scholar] [CrossRef]
- Pindado, S.; Meseguer, J.; Franchini, S. Influence of an upstream building on the wind-induced mean suction on the flat roof of a low-rise building. J. Wind Eng. Ind. Aerodyn. 2011, 99, 889–893. [Google Scholar] [CrossRef]
- Stull, R.B. An Introduction to Boundary Layer Meteorology; Springer Science & Business Media: Berlin, Germany, 2012; Volume 13. [Google Scholar]
- Touma, J.S. Dependence of the wind profile power law on stability for various locations. J. Air Pollut. Control Assoc. 1977, 27, 863–866. [Google Scholar] [CrossRef]
- Counihan, J. Adiabatic atmospheric boundary layers: A review and analysis of data from the period 1880–1972. Atmos. Environ. 1975, 9, 871–905. [Google Scholar] [CrossRef]
- Hsu, S.; Meindl, E.A.; Gilhousen, D.B. Determining the power-law wind-profile exponent under near-neutral stability conditions at sea. J. Appl. Meteorol. 1994, 33, 757–765. [Google Scholar] [CrossRef]
- Ougiya, N.; Kanda, M. Simulation of wind force acting on super-high-rise building in passing typhoon. Procedia Eng. 2017, 199, 3139–3144. [Google Scholar] [CrossRef]
- Sun, X.; Liu, H.; Su, N.; Wu, Y. Investigation on wind tunnel tests of the Kilometer skyscraper. Eng. Struct. 2017, 148, 340–356. [Google Scholar] [CrossRef]
- Clancy, L.J. Aerodynamics; Pitman Publishing: London, UK, 1978. [Google Scholar]
- Munson, B.R.; Okiishi, T.H.; Rothmayer, A.P.; Huebsch, W.W. Fundamentals of Fluid Mechanics; John Wiley & Sons: Hoboken, NJ, USA, 2014. [Google Scholar]
- Okuda, Y.; Tanike, Y. On the flow and pressure field around a three dimensional prism (Part 2). Disaster Prev. Res. Inst. Annu. B 1990, 33, 297–308. [Google Scholar]
- Geurts, C.P.W. Wind-Induced Pressure Fluctuations on Building Facades; Technische Universiteit Eindhoven: Eindhoven, The Netherlands, 1997. [Google Scholar]
- Mendis, P.; Ngo, T.; Haritos, N.; Hira, A.; Samali, B.; Cheung, J. Wind loading on tall buildings. Electron. J. Struct. Eng. 2007, 7, 41–54. [Google Scholar]
- Jamil, M.; Parsa, S.; Majidi, M. Wind Power Statistics and an Evaluation of Wind Energy Density. Renew. Energy 1995, 6, 623–628. [Google Scholar] [CrossRef]
- Yildiz, F. Potential Ambient Energy-Harvesting Sources and Techniques. J. Technol. Stud. 2009, 35, 40–48. [Google Scholar] [CrossRef]
- Elvin, N.G.; Elvin, A.A. An experimentally validated electromagnetic energy harvester. J. Sound Vib. 2011, 330, 2314–2324. [Google Scholar] [CrossRef]
- Hendijanizadeh, M.; Sharkh, S.M.; Elliott, S.J.; Moshrefi-Torbati, M. Output power and efficiency of electromagnetic energy harvesting systems with constrained range of motion. Smart Mater. Struct. 2013, 22, 125009. [Google Scholar] [CrossRef]


| Inputs (Px) | Full Scale Ranges | Accuracy | Full Scale Output | Scan Rate |
|---|---|---|---|---|
| 64Px, 1.067 mm outer diameter tubulation | ±2.5, ±5, ±7, ±17, ±35, ±100, ±350 kPa | 7 kPa: ±0.12% full scale 15 kPa: ±0.10% full scale 35 to 350 kPa: ±0.08% full scale | Standard: ±2.5 Vdc Optional: ±5 Vdc, ±10 Vdc | 45 kHz |
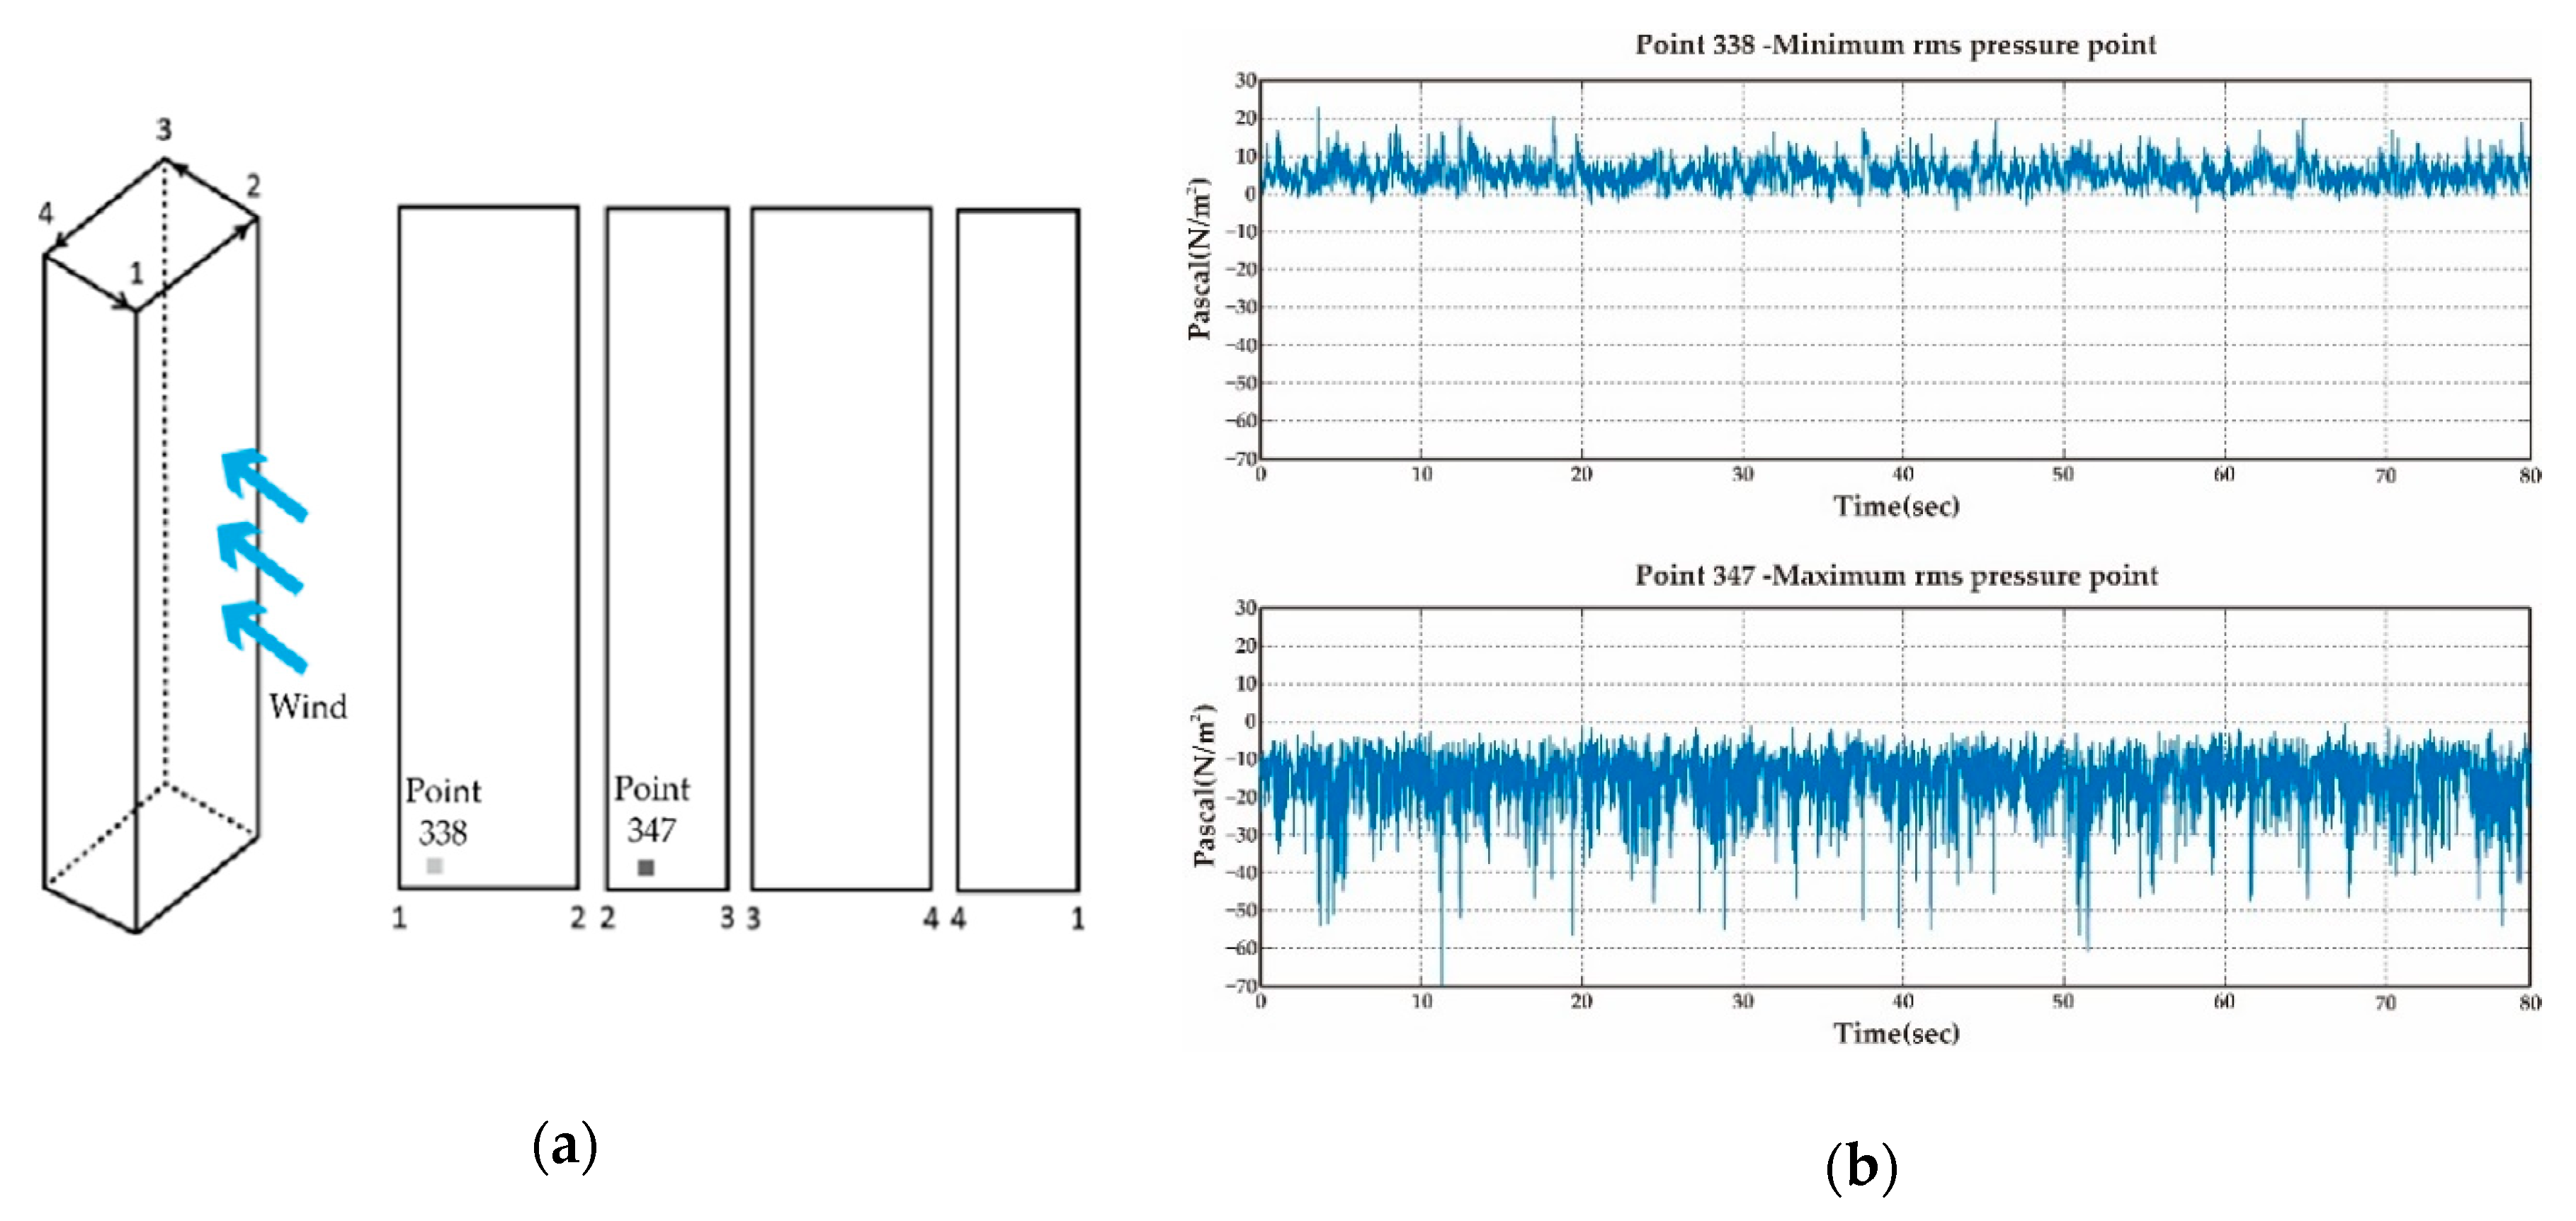
| Pressure Point | Max Value (Pa) | Min Value (Pa) | RMS Value (Pa) |
|---|---|---|---|
| Point 338 (minimum) | 22.94 | −4.68 | 6.25 |
| Point 347 (maximum) | −0.55 | −69.31 | 17.33 |
| Pressure Point | Max Value (Pa) | Min Value (Pa) | RMS Value (Pa) |
|---|---|---|---|
| Point 75 (Minimum) | 2.154 | −19.75 | 7.63 |
| Point 334 (Maximum) | 11.57 | −47.52 | 10.44 |
| Spring Stiffness | Damping Ratio | |||
|---|---|---|---|---|
| 250 × 250 × 6 | 825 | 710 | 2900 | 0.02 |
| Turns of Coil | |||||
|---|---|---|---|---|---|
| 30 × 30 × 30 | 65 | 0.265 | 0.45 | 1380 | 10.56 |
| Case | Maximum Voltage (V) | RMS Voltage (V) | Power Considering 50% Efficiency of the Device (W) |
|---|---|---|---|
| Minimum calculated power point (point 215) | 1.0156 | 0.3397 | 0.0013 |
| Maximum calculated power point (point 347) | 9.5867 | 3.5233 | 0.1469 |
| Case | Maximum Voltage (V) | RMS Voltage (V) | Power Considering 50% Efficiency of the Device (W) |
|---|---|---|---|
| Minimum calculated power point (point 357) | 0.7898 | 0.2473 | 0.0007 |
| Maximum calculated power point (point 207) | 6.1765 | 2.5636 | 0.0778 |
| Case | Produced Power in the Entire Area (W) | Maximum Power Per Single Module (W) | Minimum Power Per Single Module (W) |
|---|---|---|---|
| Case I: without surrounding buildings | 13,002.39 | 164.58 | 1.525 |
| Case II: in the urban environment | 4963.26 | 87.13 | 0.81 |
© 2019 by the authors. Licensee MDPI, Basel, Switzerland. This article is an open access article distributed under the terms and conditions of the Creative Commons Attribution (CC BY) license (http://creativecommons.org/licenses/by/4.0/).
Share and Cite
Park, J.-C.; Kim, I.-H.; Jung, H.-J. Feasibility Study of Fluctuating Wind Pressure around High-Rise Buildings as a Potential Energy-Harvesting Source. Energies 2019, 12, 4032. https://doi.org/10.3390/en12214032
Park J-C, Kim I-H, Jung H-J. Feasibility Study of Fluctuating Wind Pressure around High-Rise Buildings as a Potential Energy-Harvesting Source. Energies. 2019; 12(21):4032. https://doi.org/10.3390/en12214032
Chicago/Turabian StylePark, Jae-Chan, In-Ho Kim, and Hyung-Jo Jung. 2019. "Feasibility Study of Fluctuating Wind Pressure around High-Rise Buildings as a Potential Energy-Harvesting Source" Energies 12, no. 21: 4032. https://doi.org/10.3390/en12214032
APA StylePark, J.-C., Kim, I.-H., & Jung, H.-J. (2019). Feasibility Study of Fluctuating Wind Pressure around High-Rise Buildings as a Potential Energy-Harvesting Source. Energies, 12(21), 4032. https://doi.org/10.3390/en12214032