Comparative Study on Parameter Identification Methods for Dual-Polarization Lithium-Ion Equivalent Circuit Model


 ,
, 
 , ,
, , 

Abstract

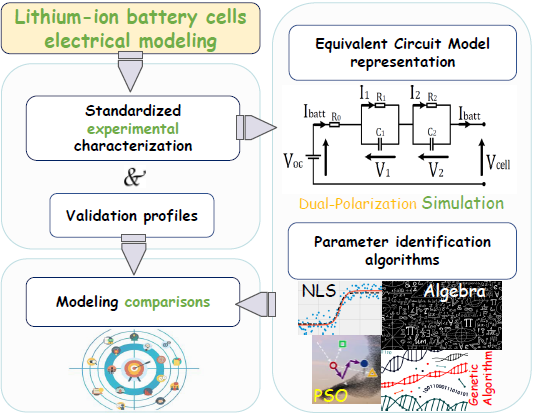
1. Introduction
- Generic-based or data-based empirical models,
- Electrochemical impedance spectroscopy (EIS)-based models,
- Static and dynamic equivalent electrical circuit models (ECM) and
- Electrochemical and physics-based models.
- An experimental characterization and electrical modeling of the Li-ions with three different parameter identification methods,
- A comprehensive comparison among the parameter identification methods from previous studies,
- Analyses on the impedance behavior of the cells in time and frequency domain and estimation on the power capabilities of the cells.
2. Experimental Setup
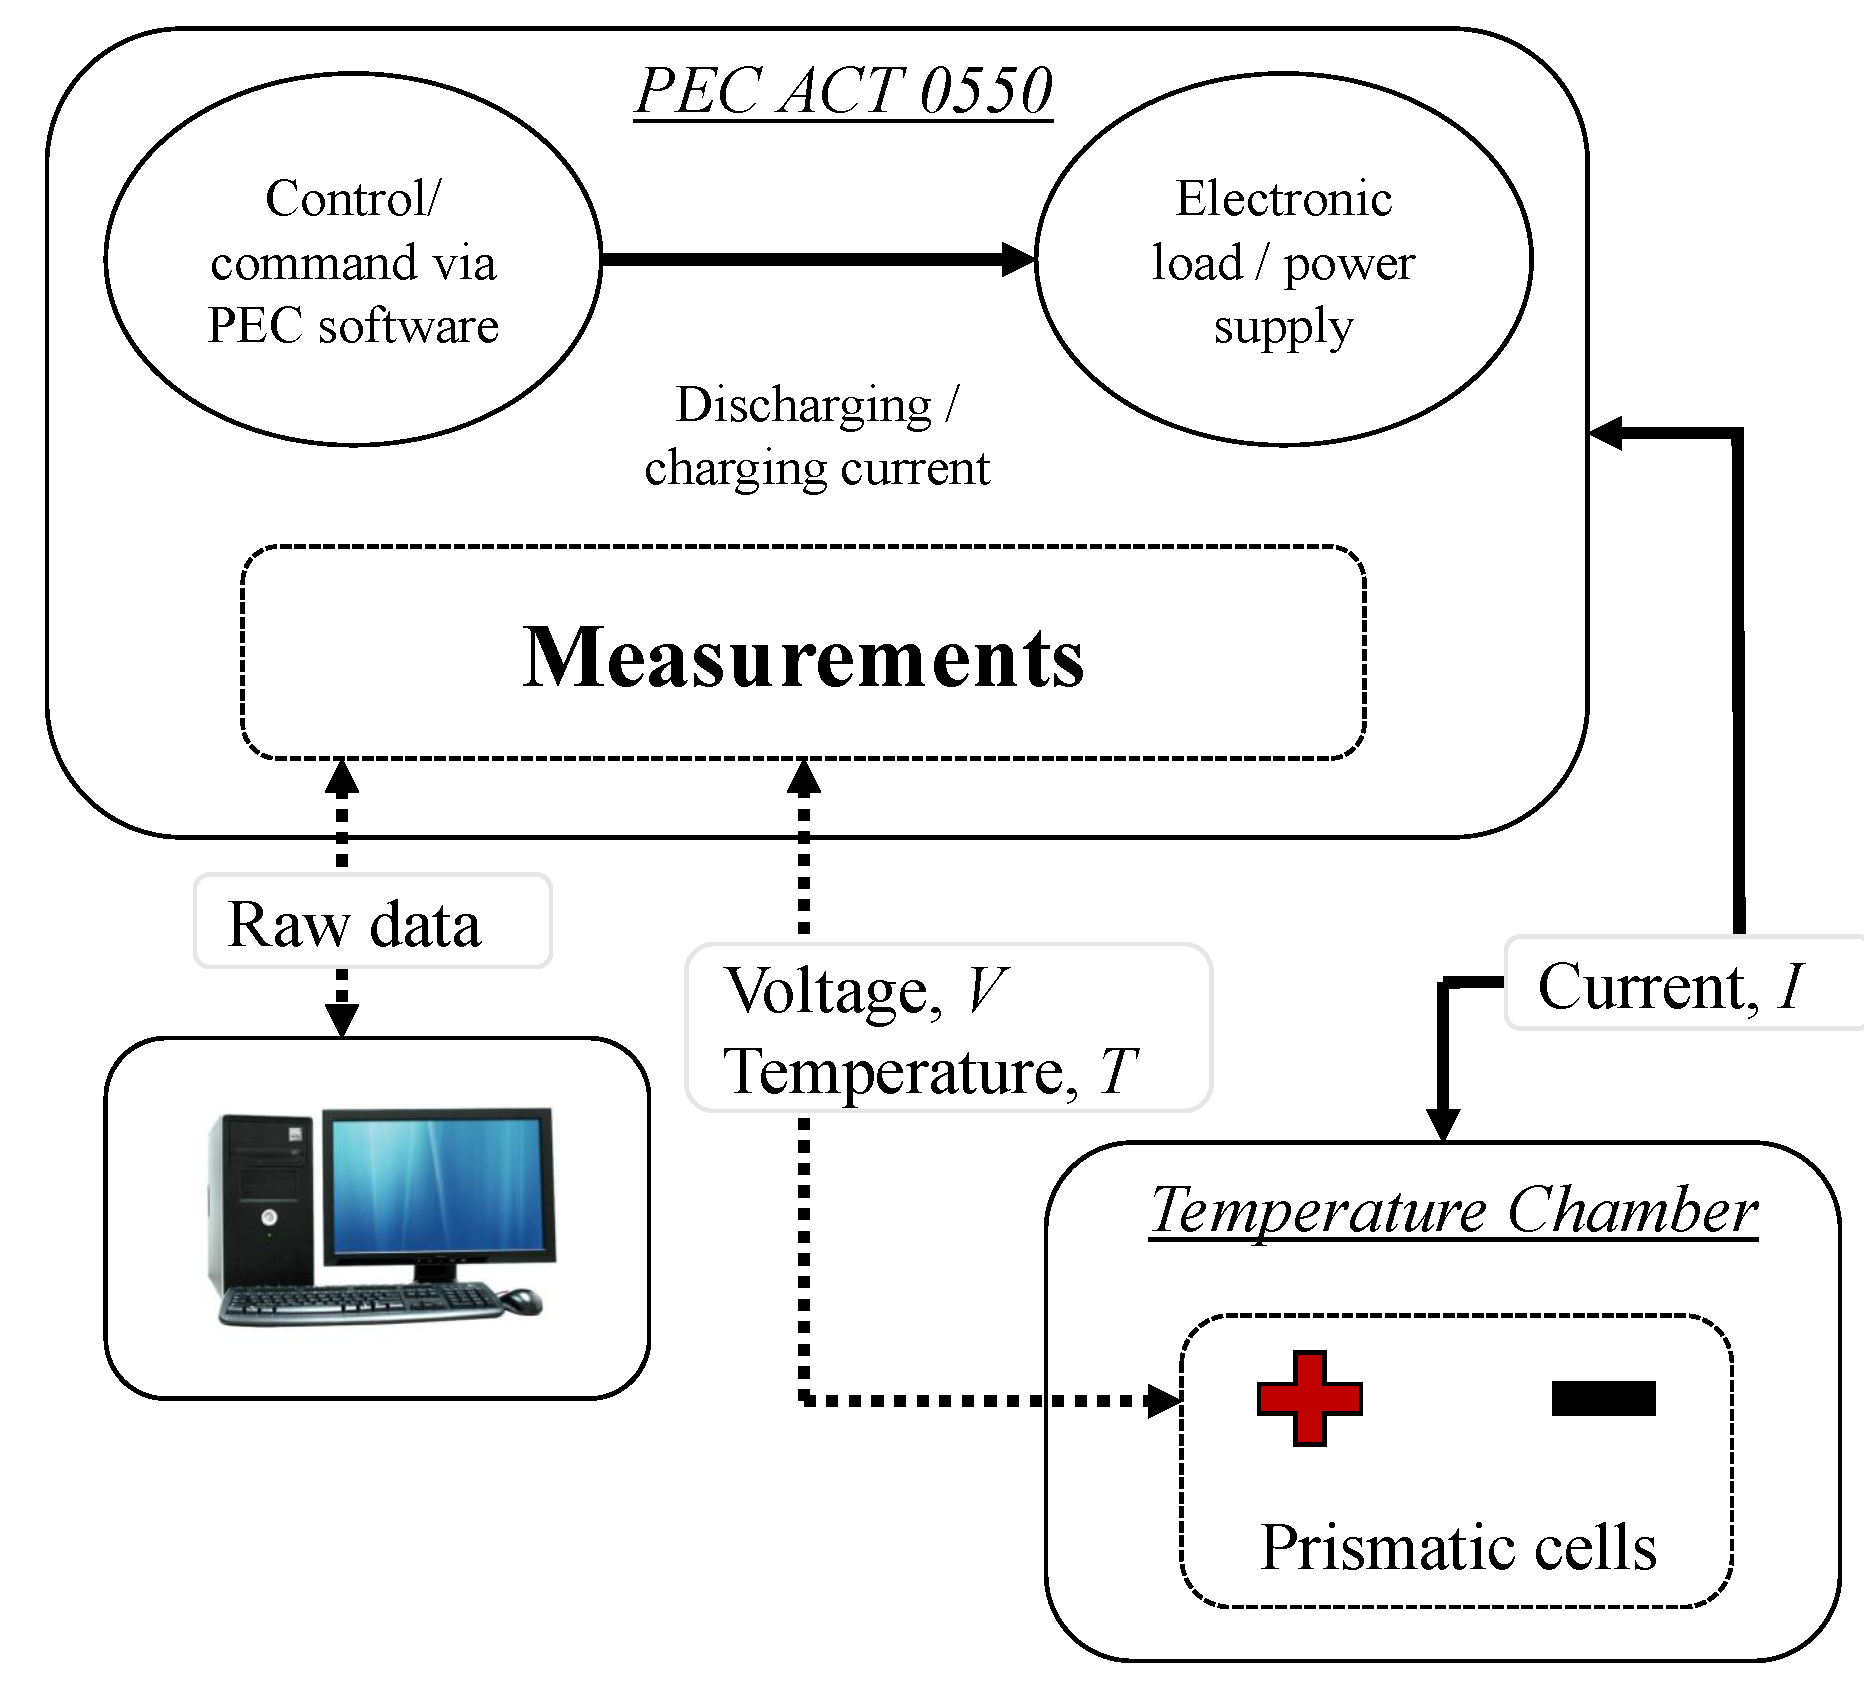
2.1. Test Bench Description
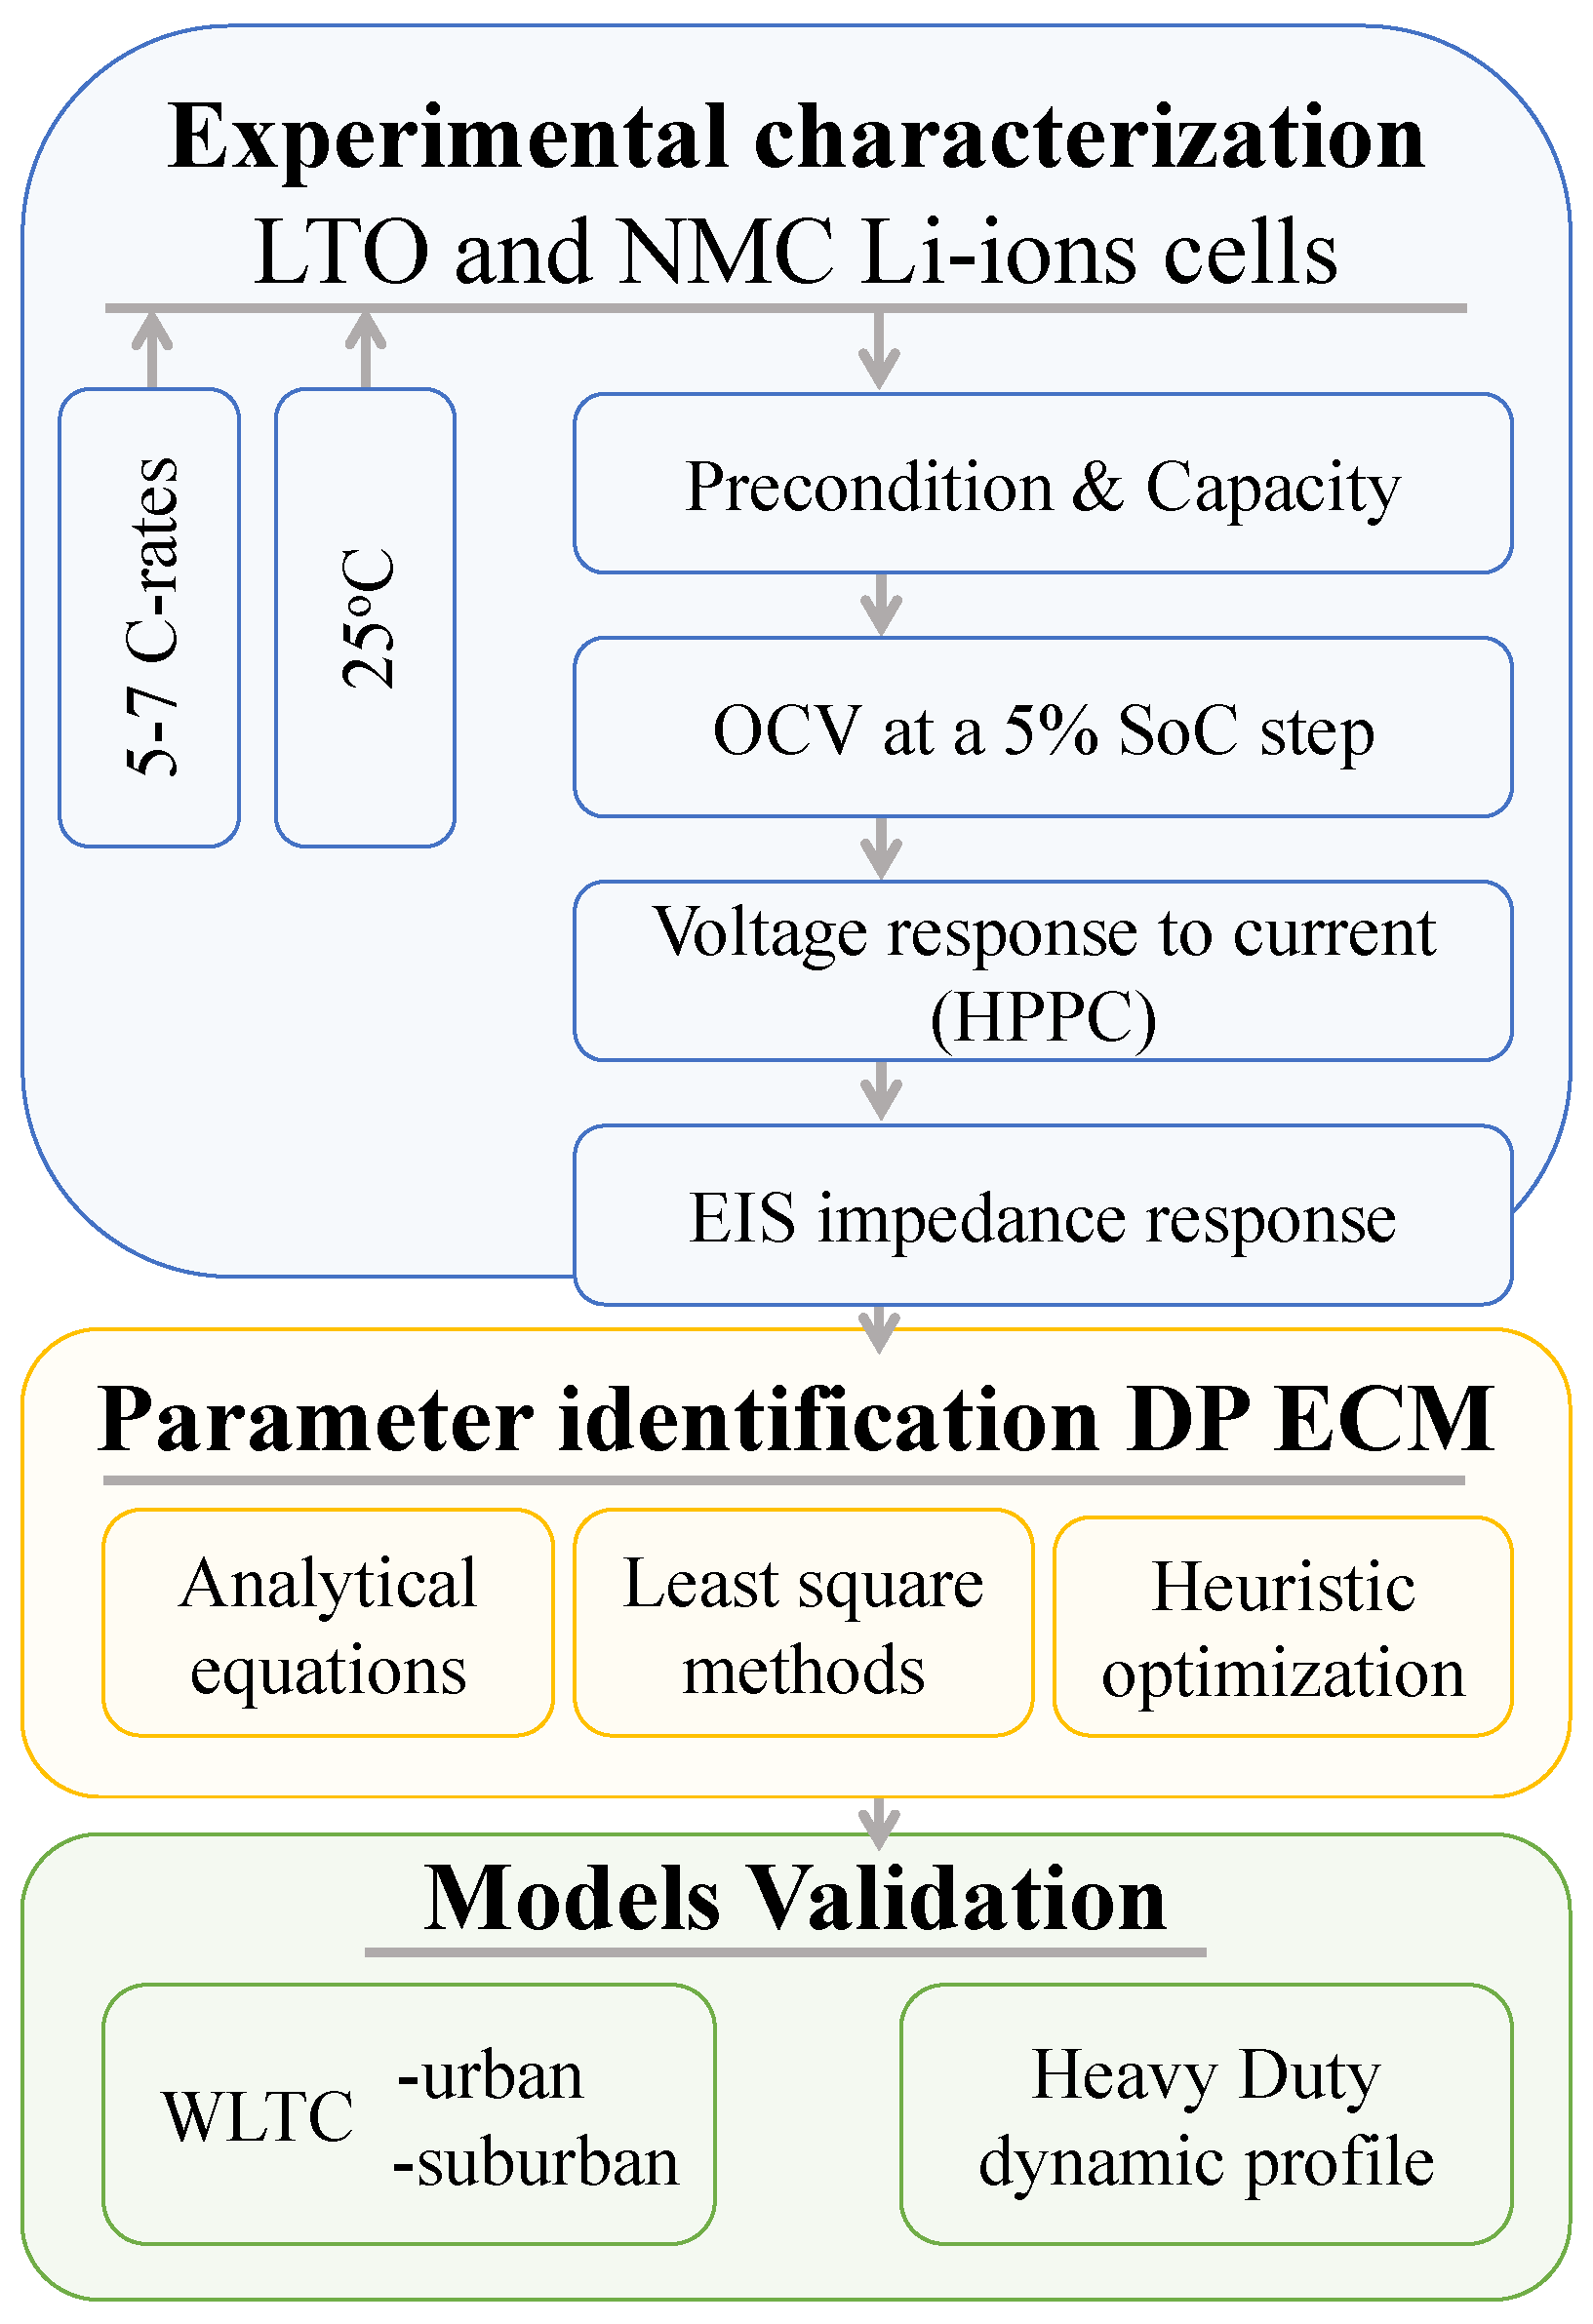
2.2. Experimental Process
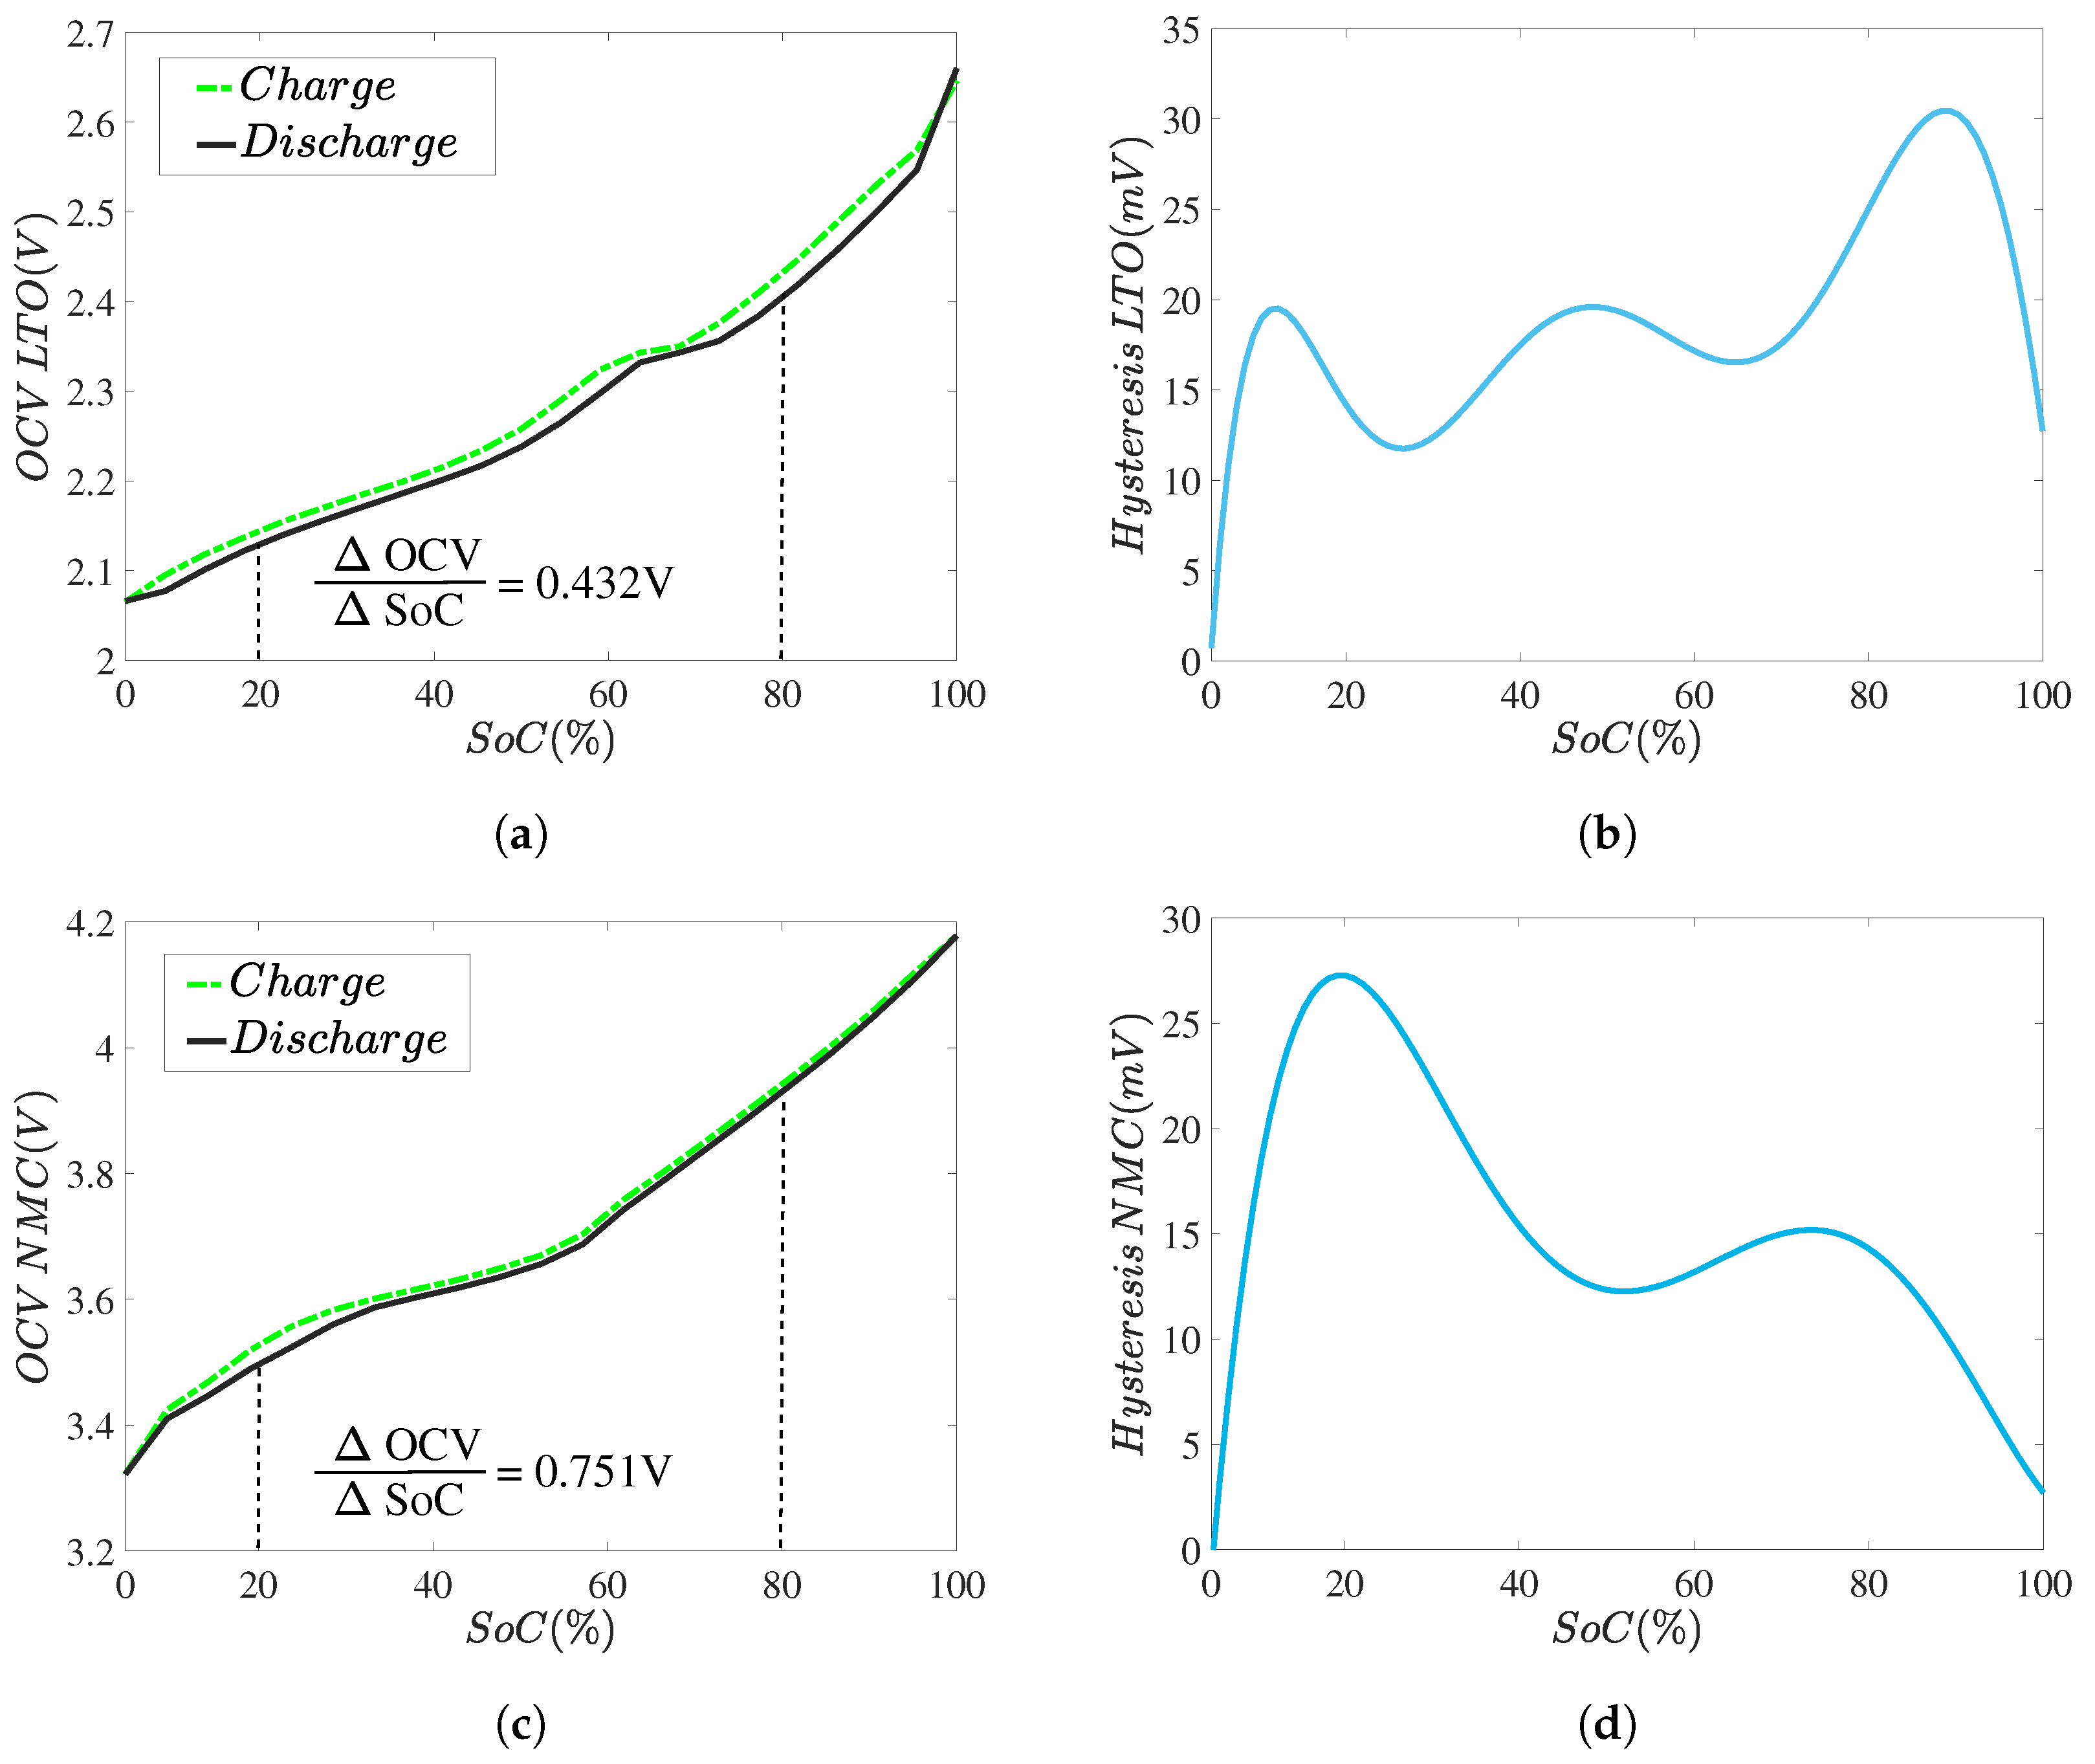
2.2.1. Open Circuit Voltage Test
2.2.2. Voltage Response to Current Test
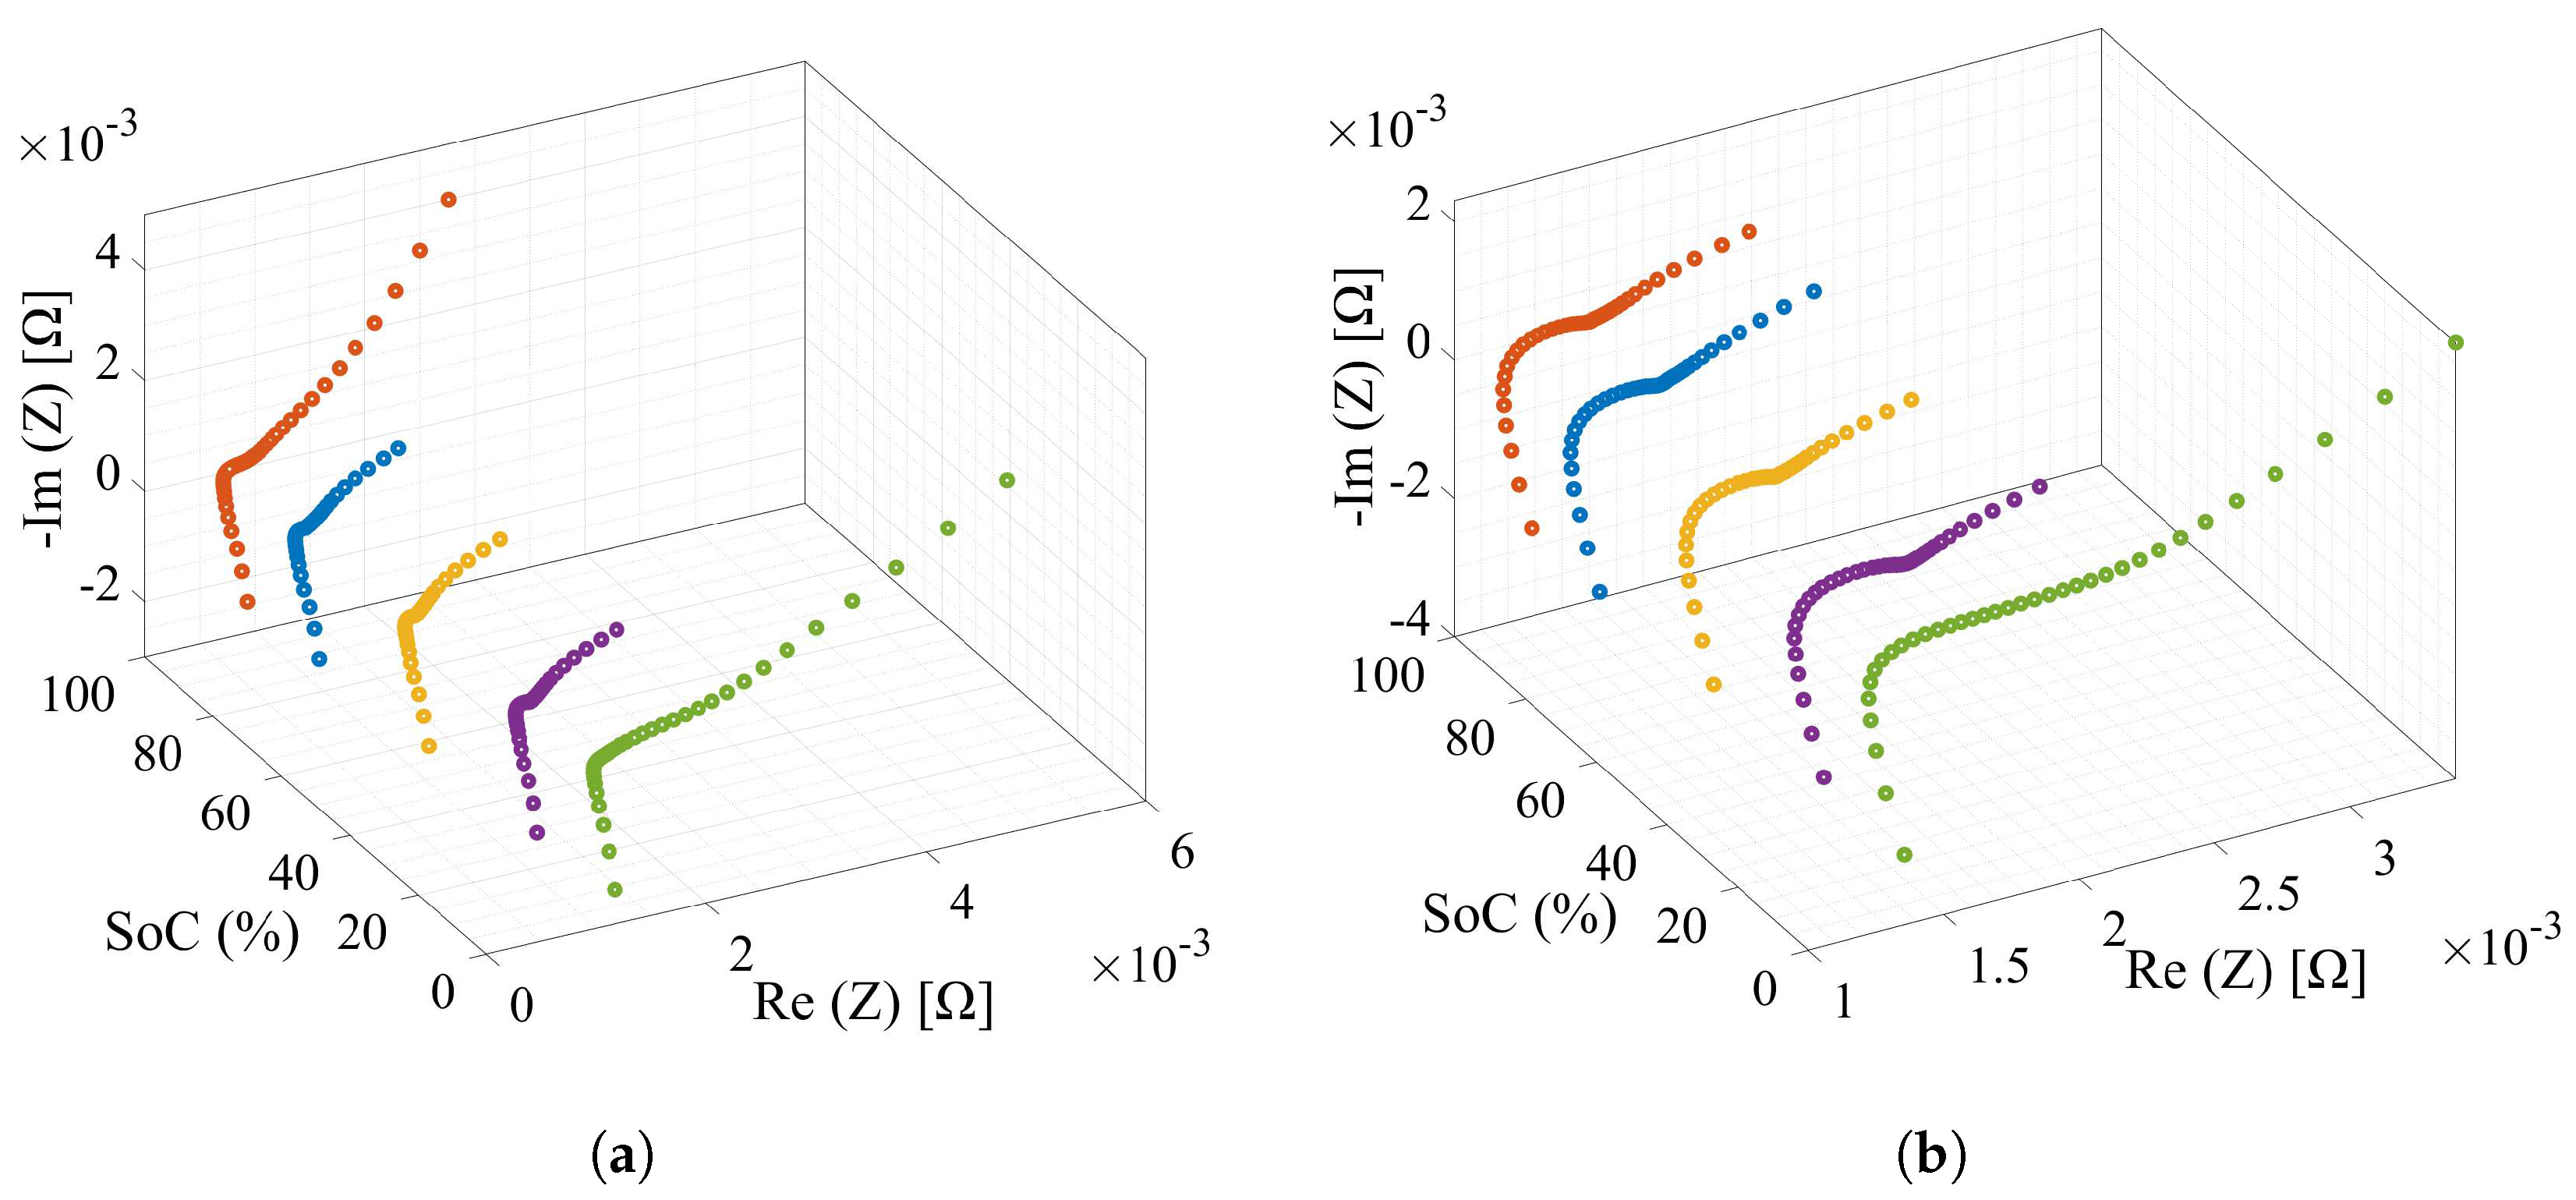
2.2.3. Impedance Response to Frequency Test
2.2.4. Capacity Test
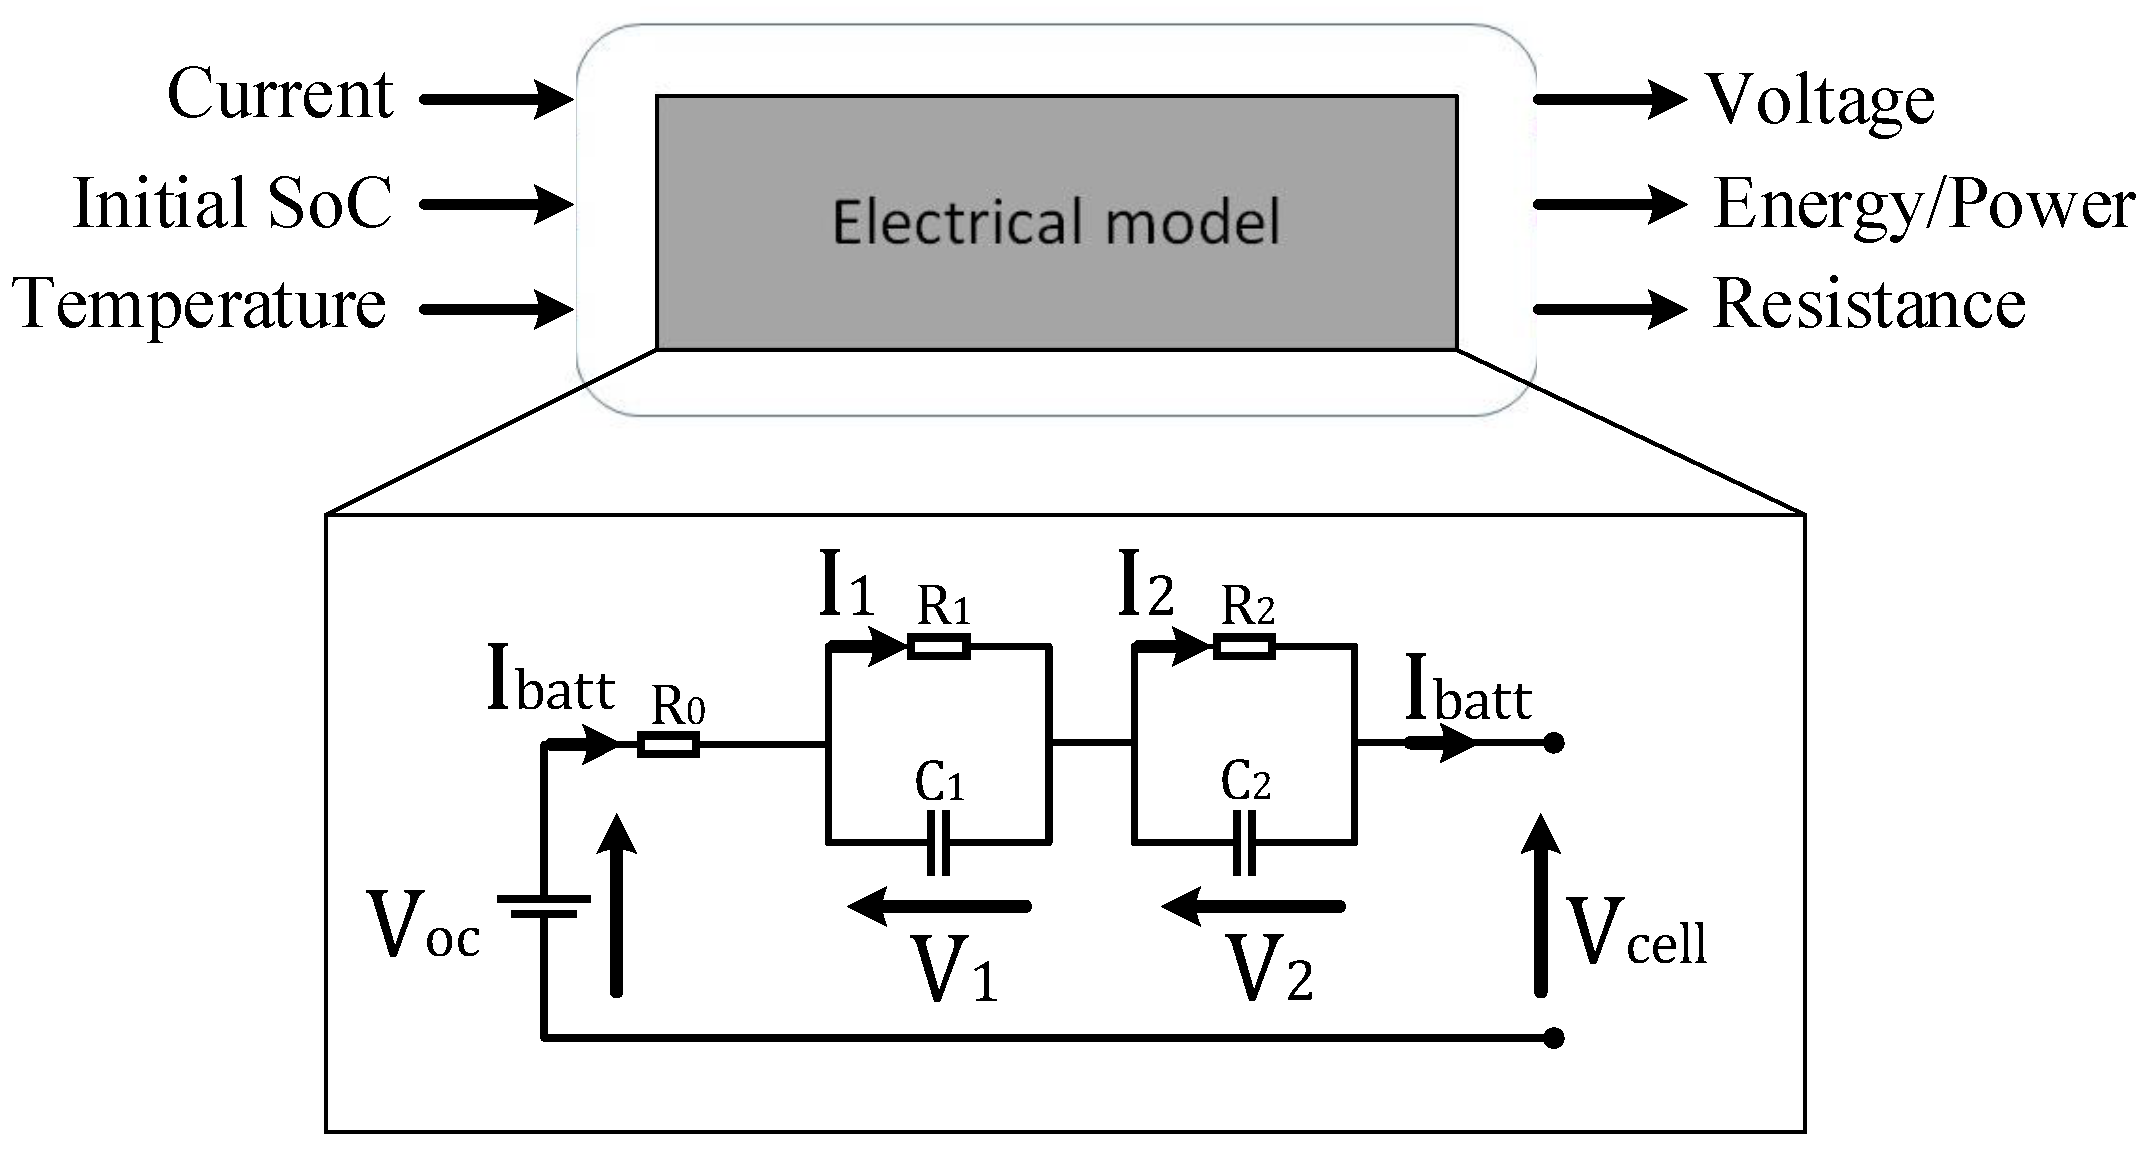
3. Model Development
3.1. In Discrete-Time Domain
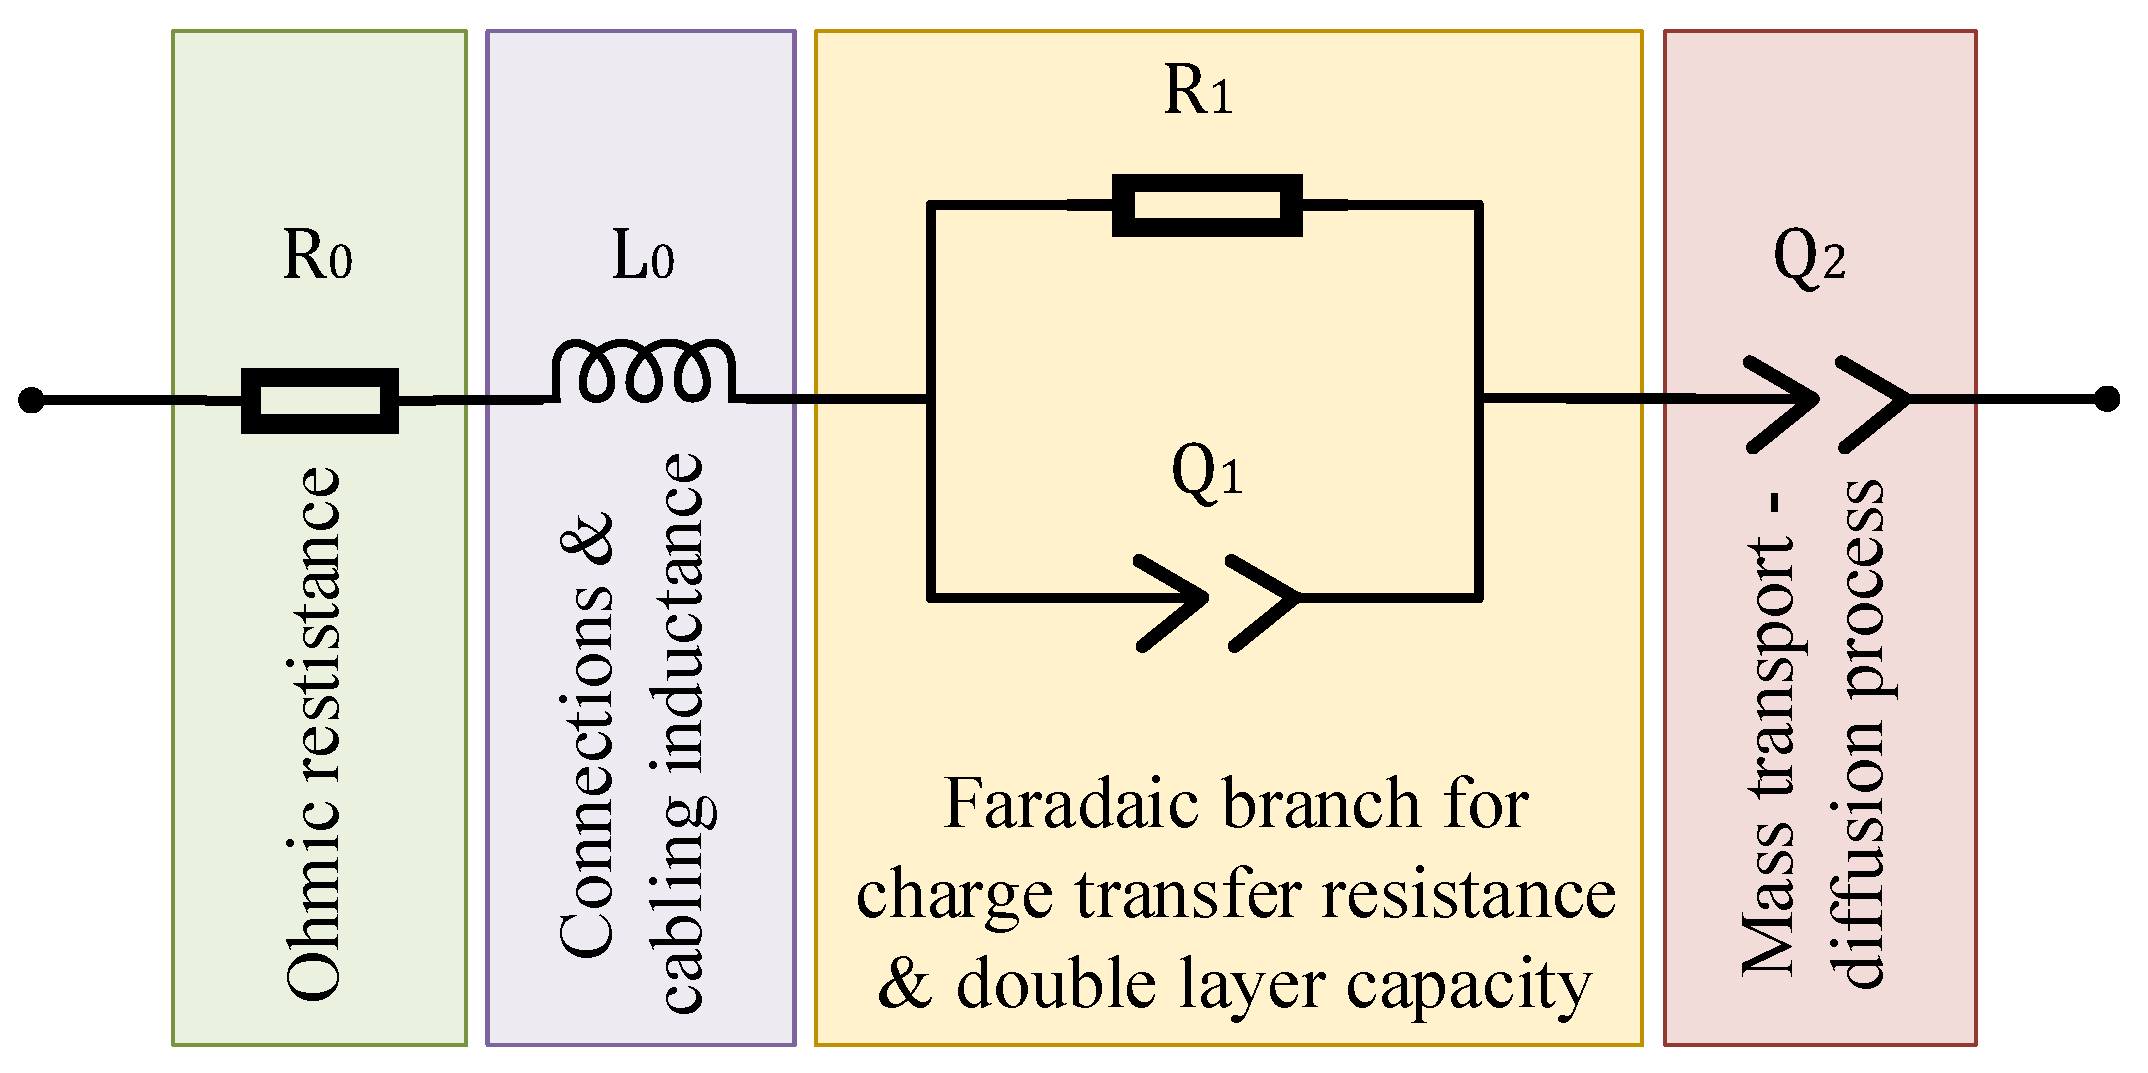
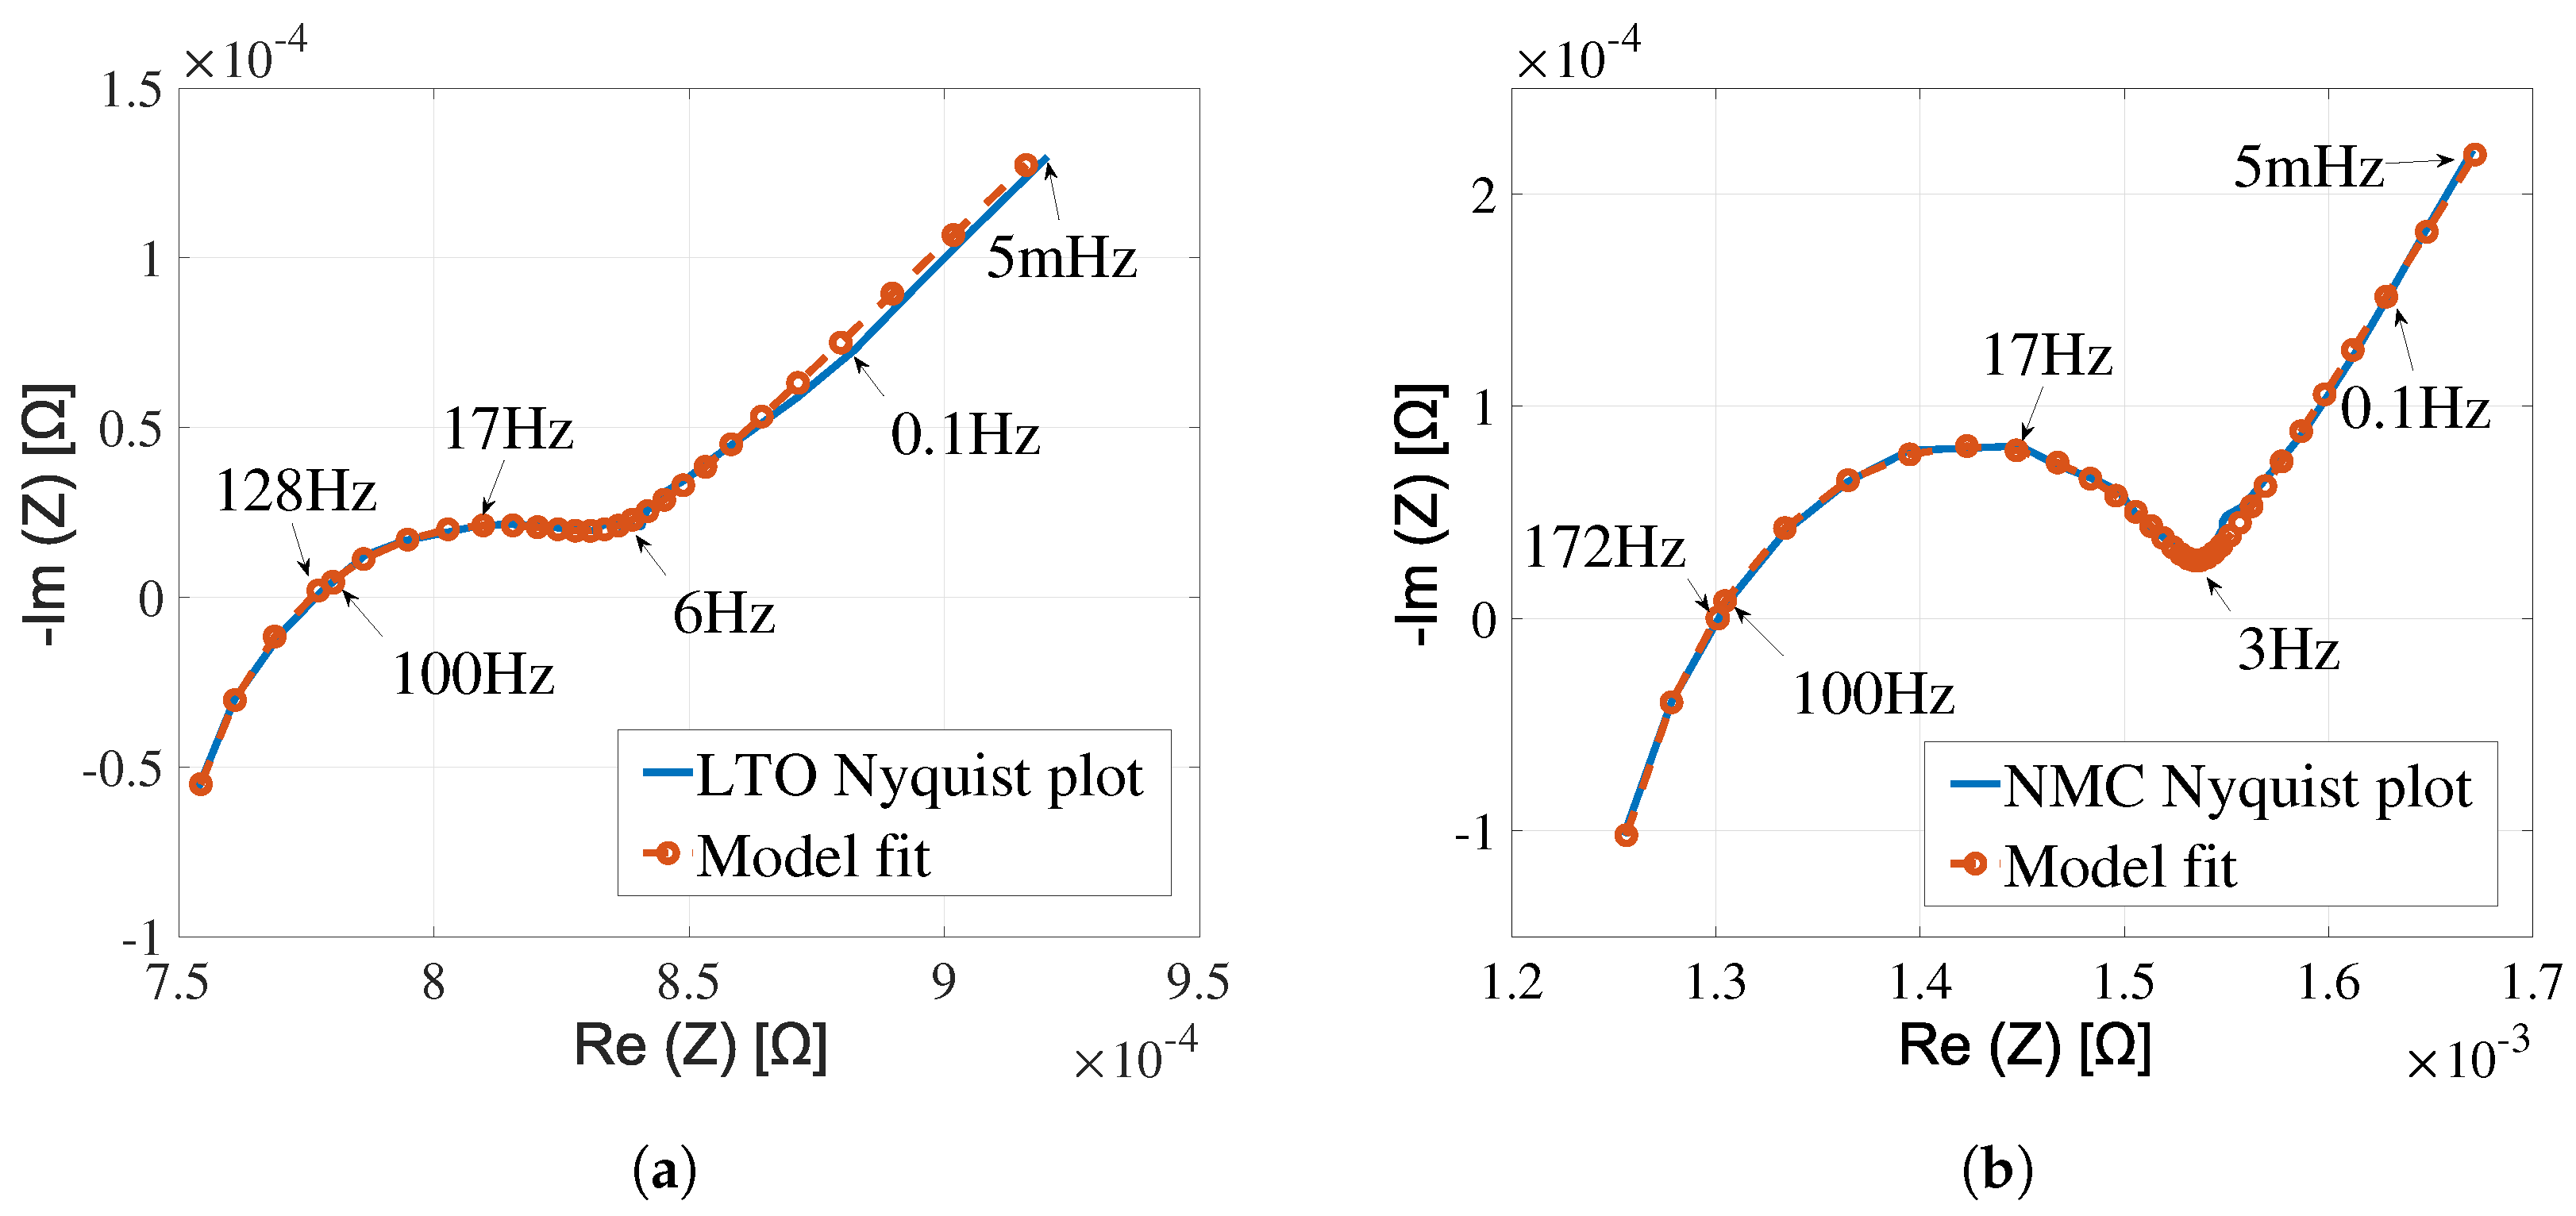
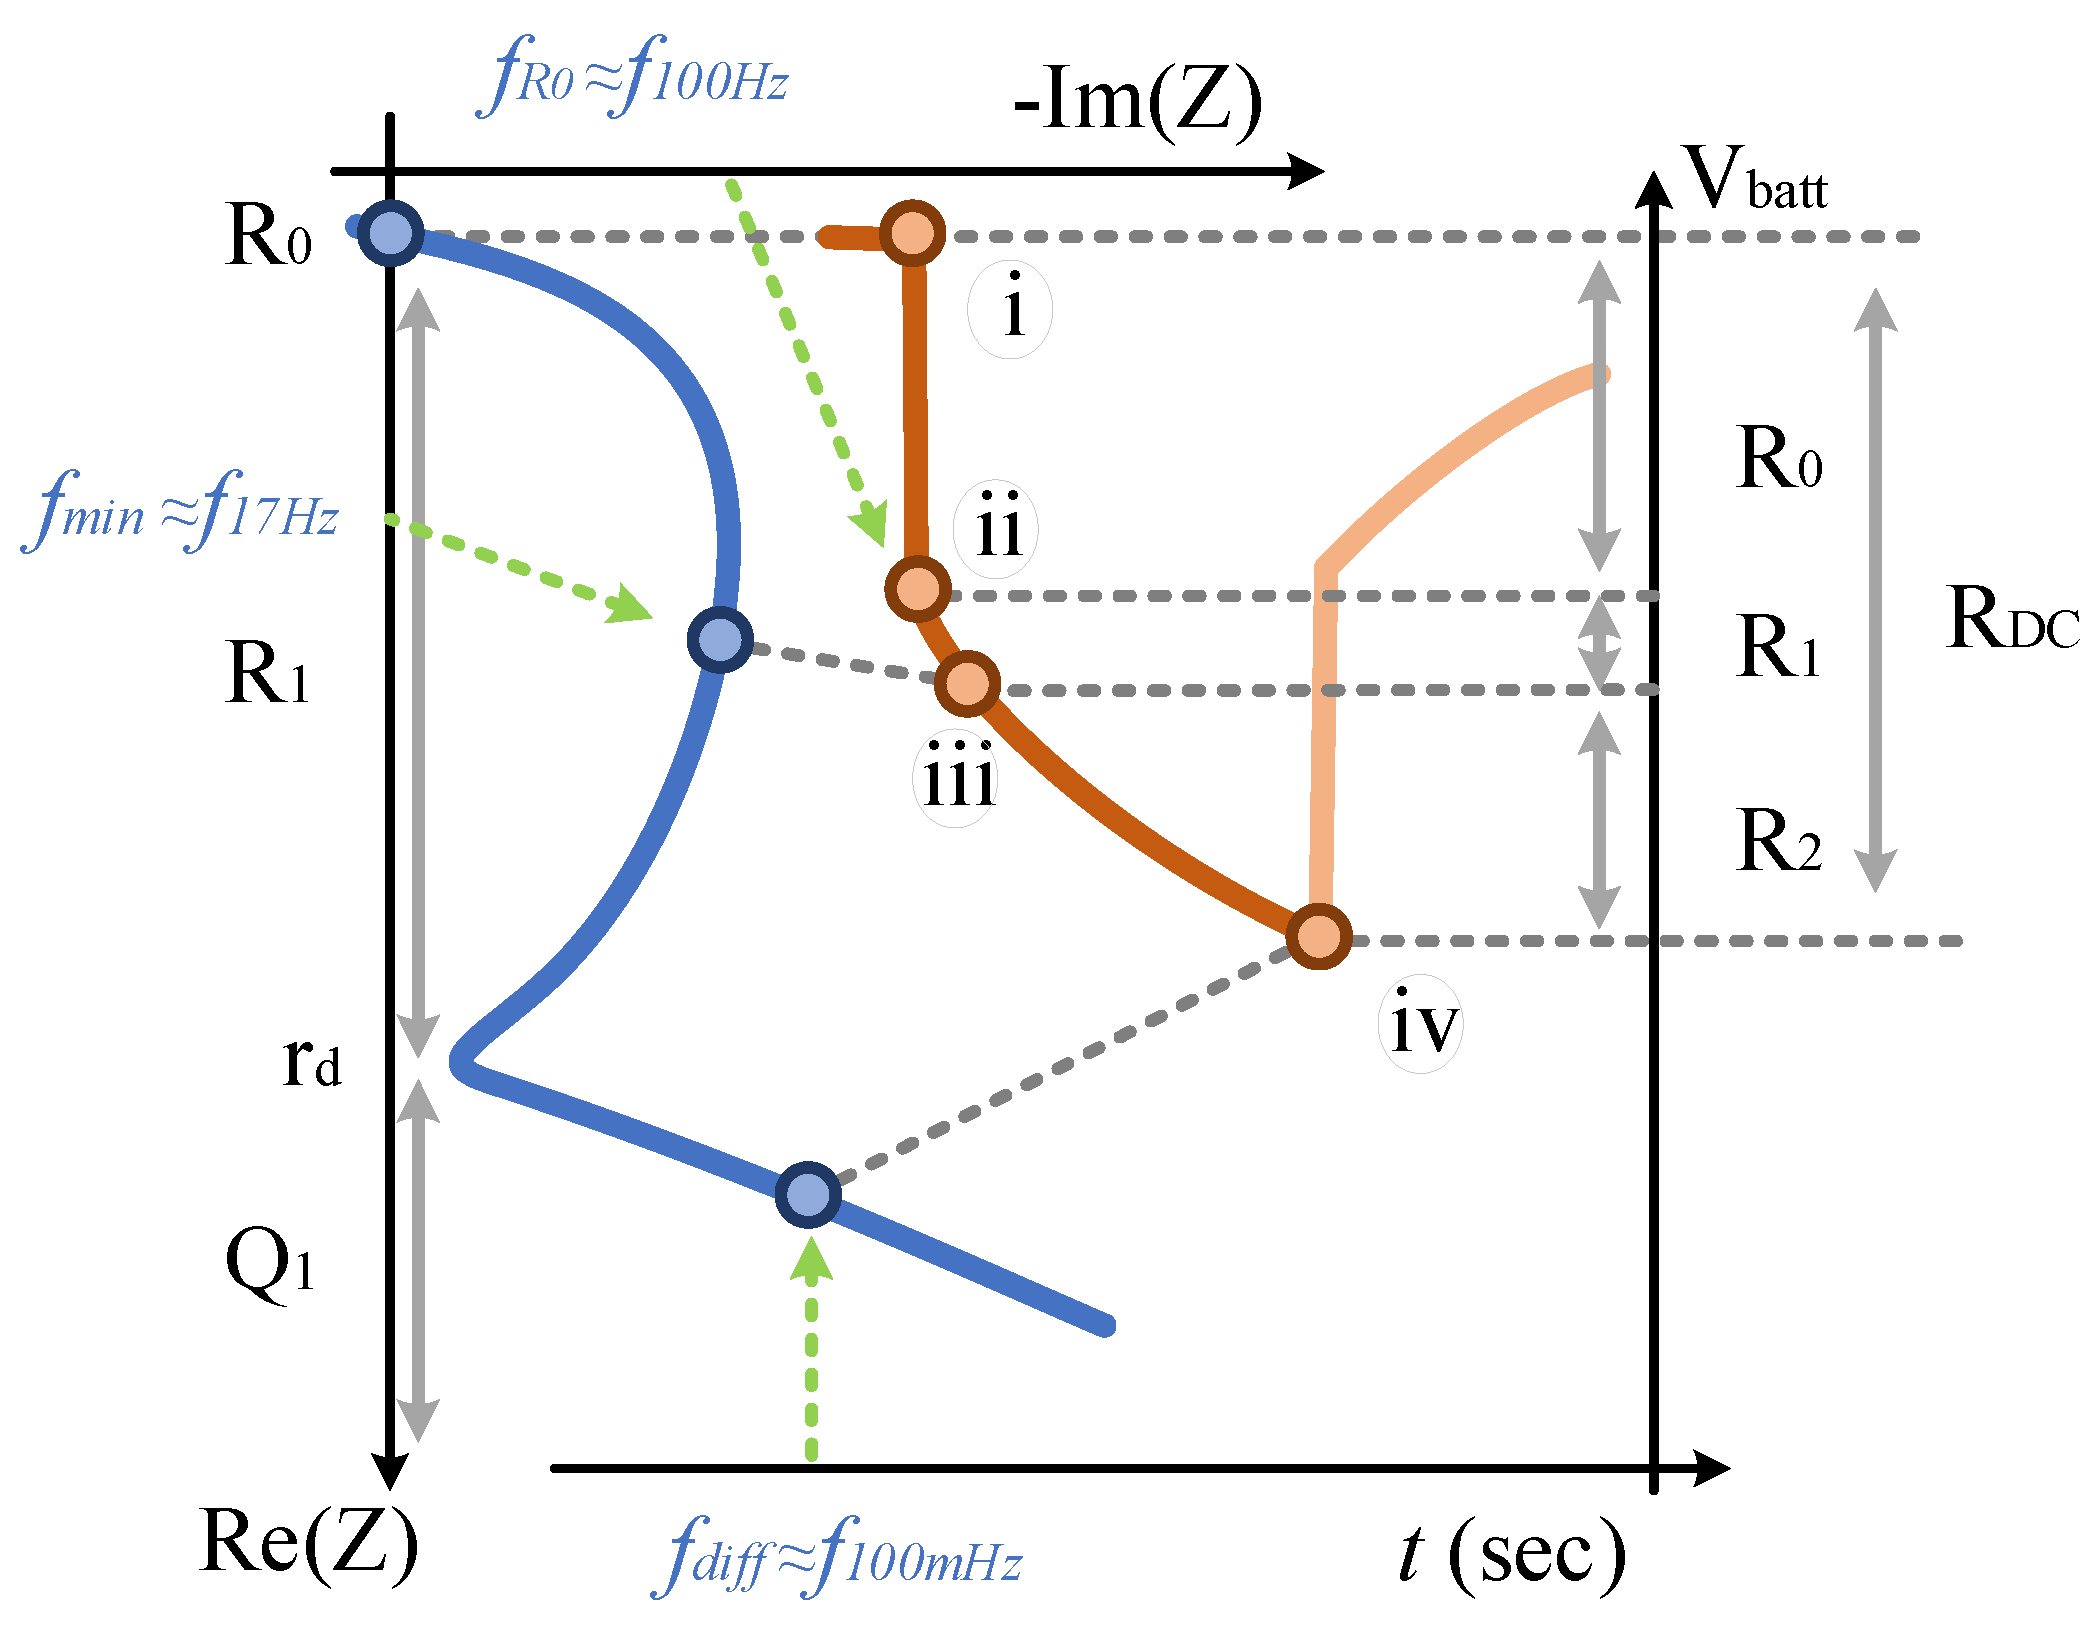
3.2. In Frequency Domain
3.2.1. Ohmic Resistance
3.2.2. Charge-Transfer and Total Resistance
3.2.3. Diffusion Resistance
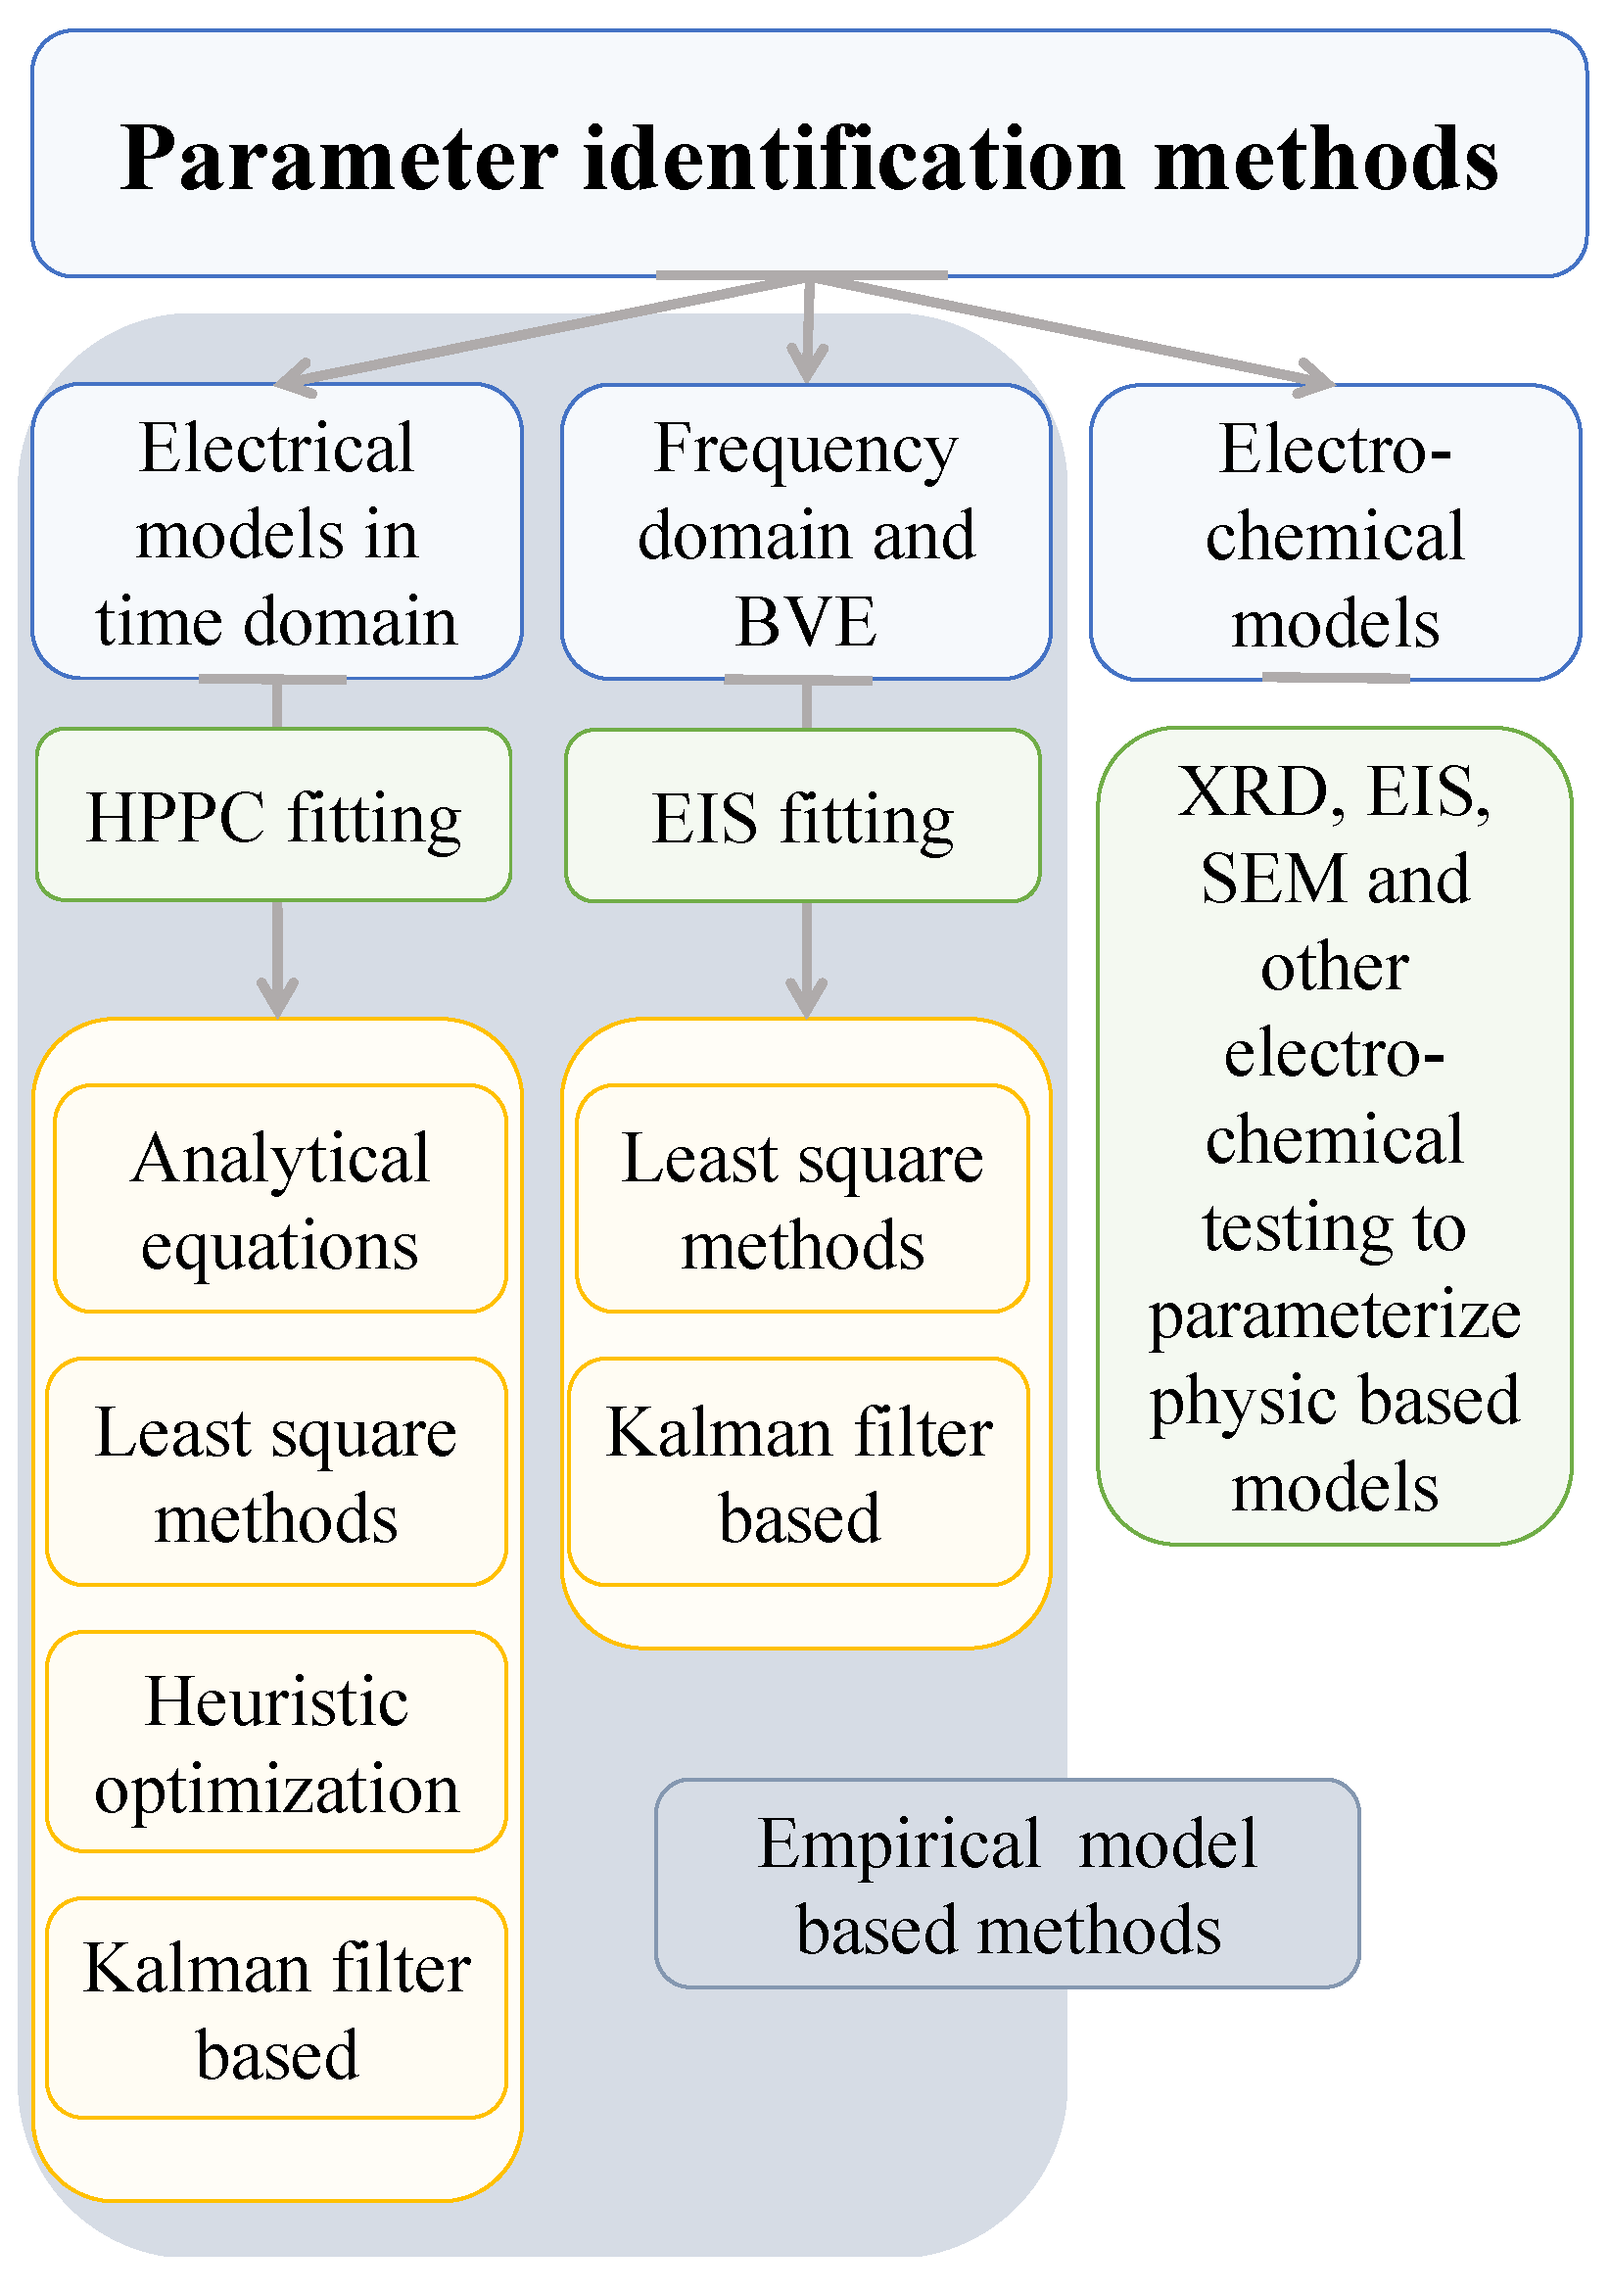
4. Review of the Most Frequently Used Identification Methods
- Analytical equations,
- Least-square-based methods,
- Heuristic optimization algorithms,
- Impedance spectroscopy methods and
- Kalman or adaptive filters and observer-based methods.
4.1. Parameter Extraction with Analytical Equations
4.2. Parameter Extraction with Least-Square Methods
4.3. Parameter Extraction with Heuristic Optimization
4.4. Parameter Extraction with Impedance Spectroscopy
4.5. Parameter Extraction with Kalman Filters Based Techniques
5. Results, Validations and Discussions
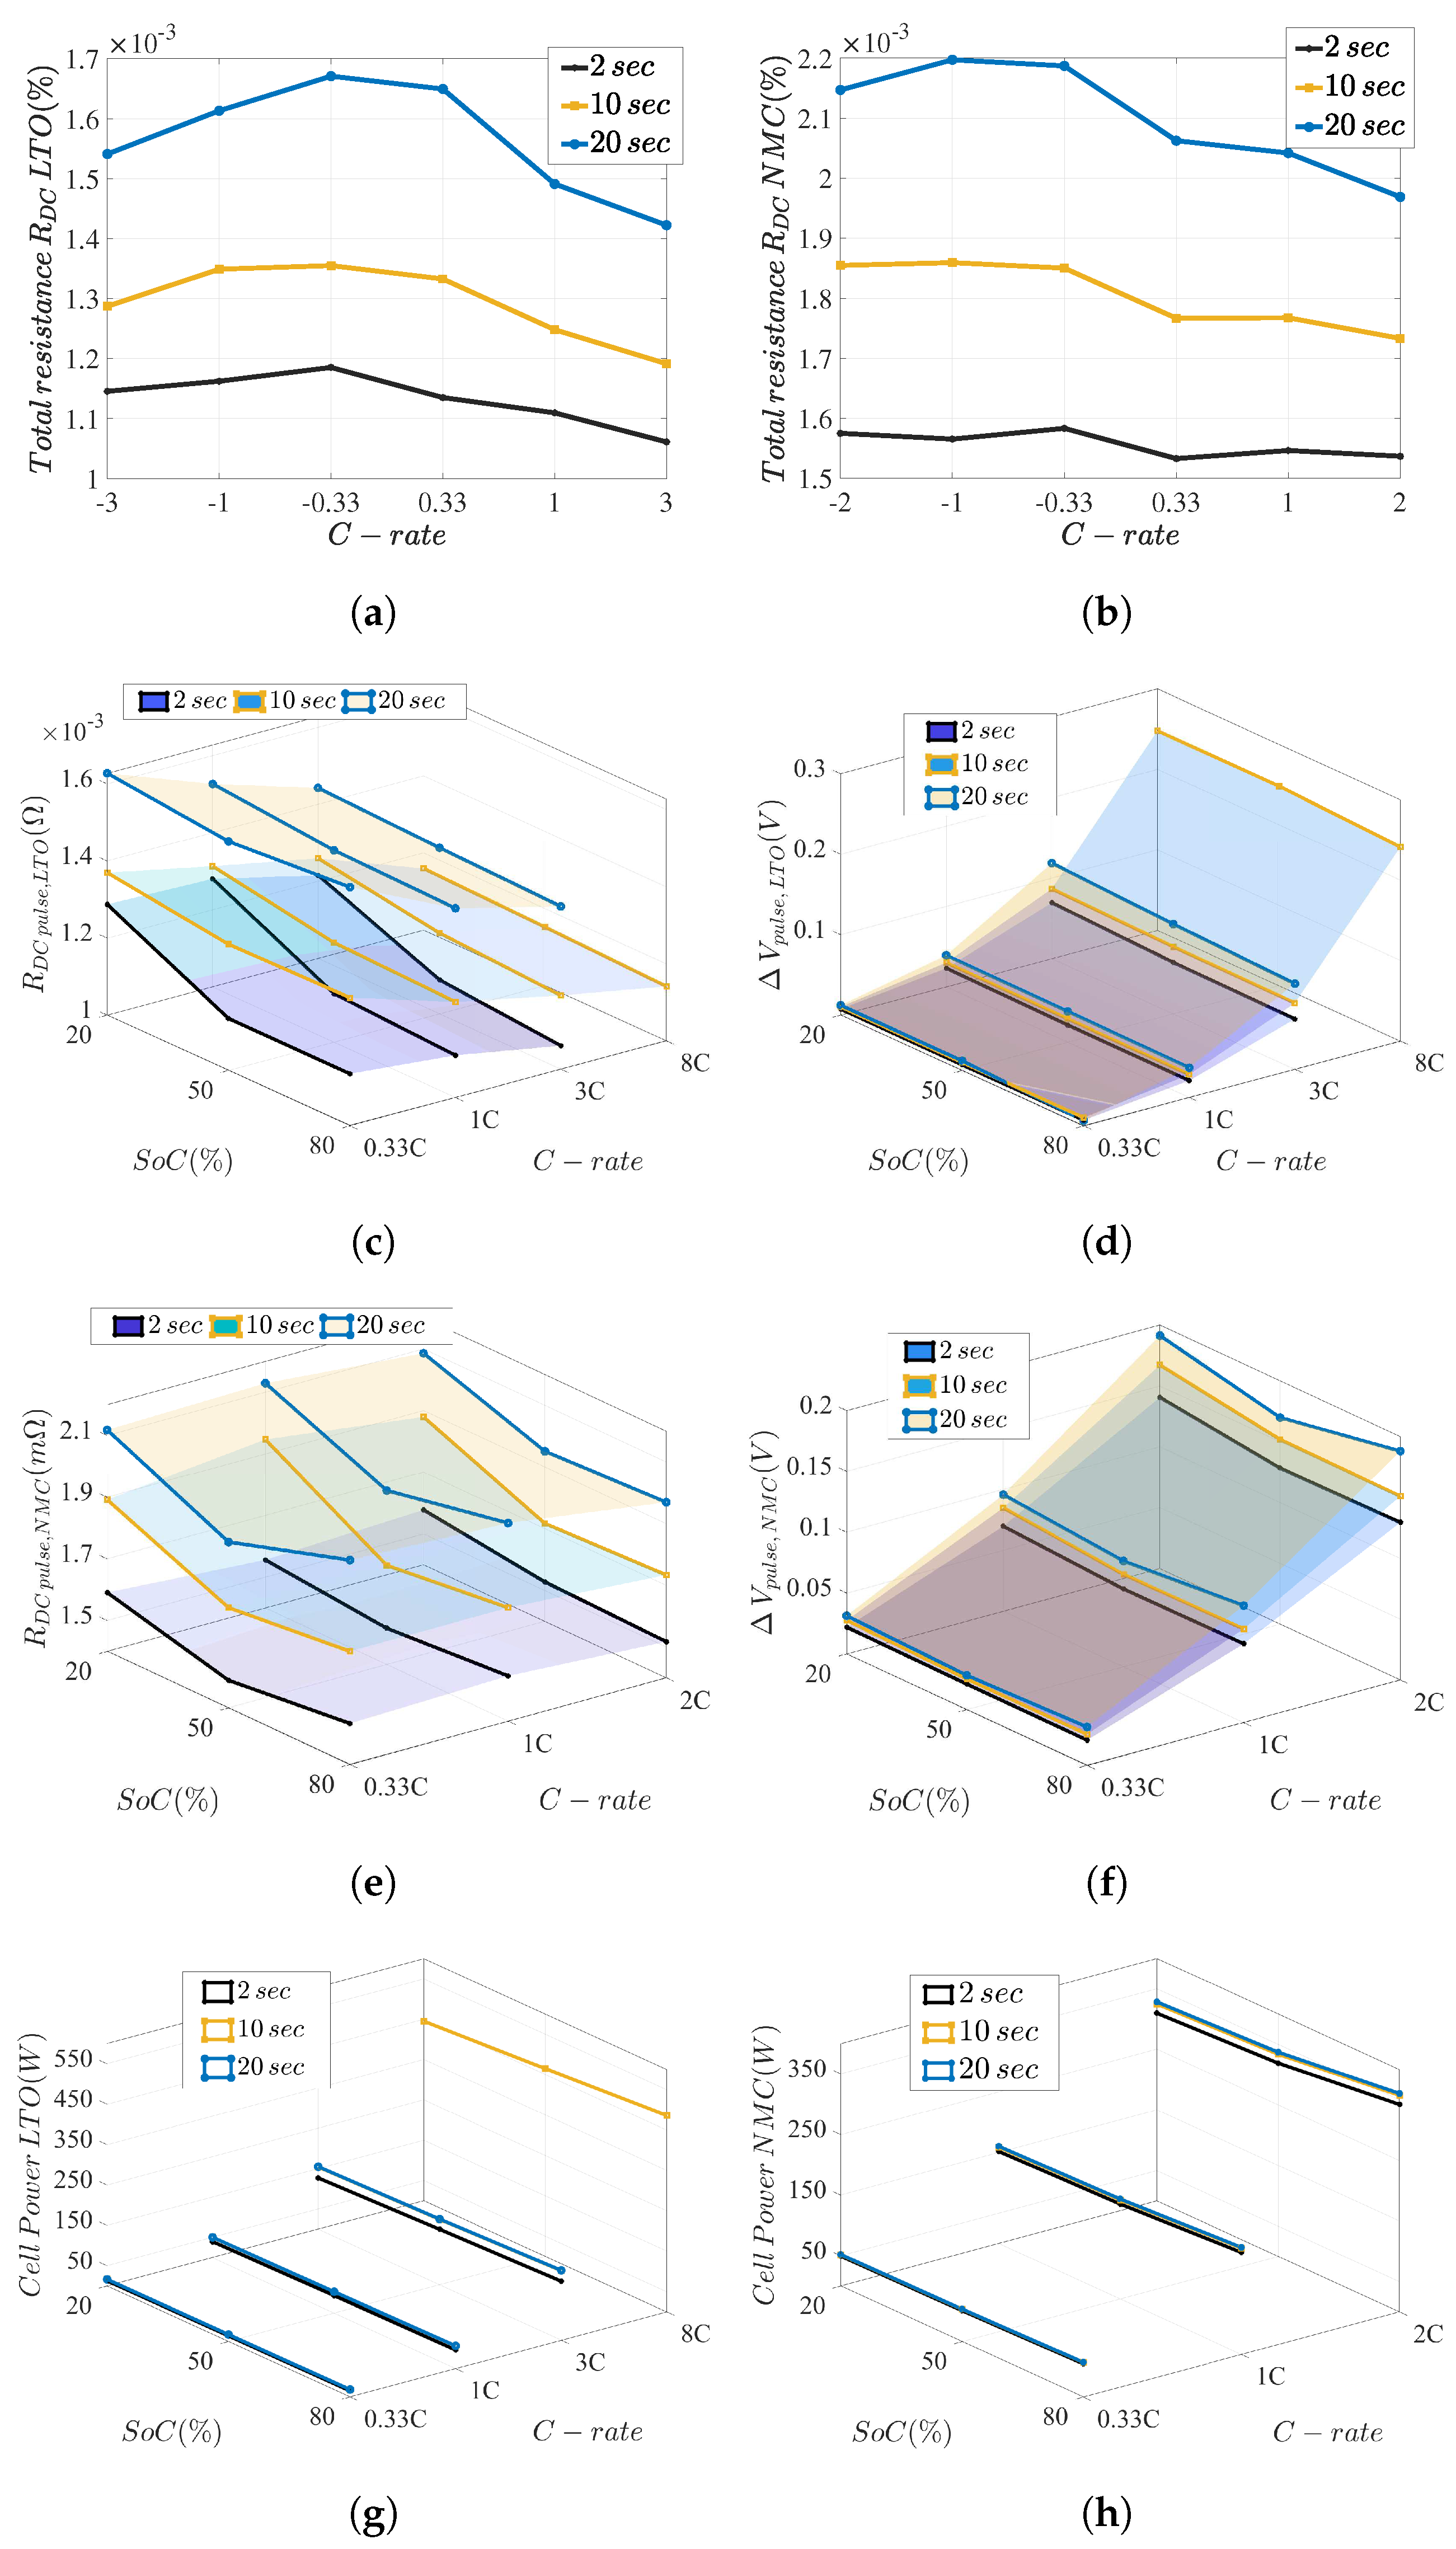
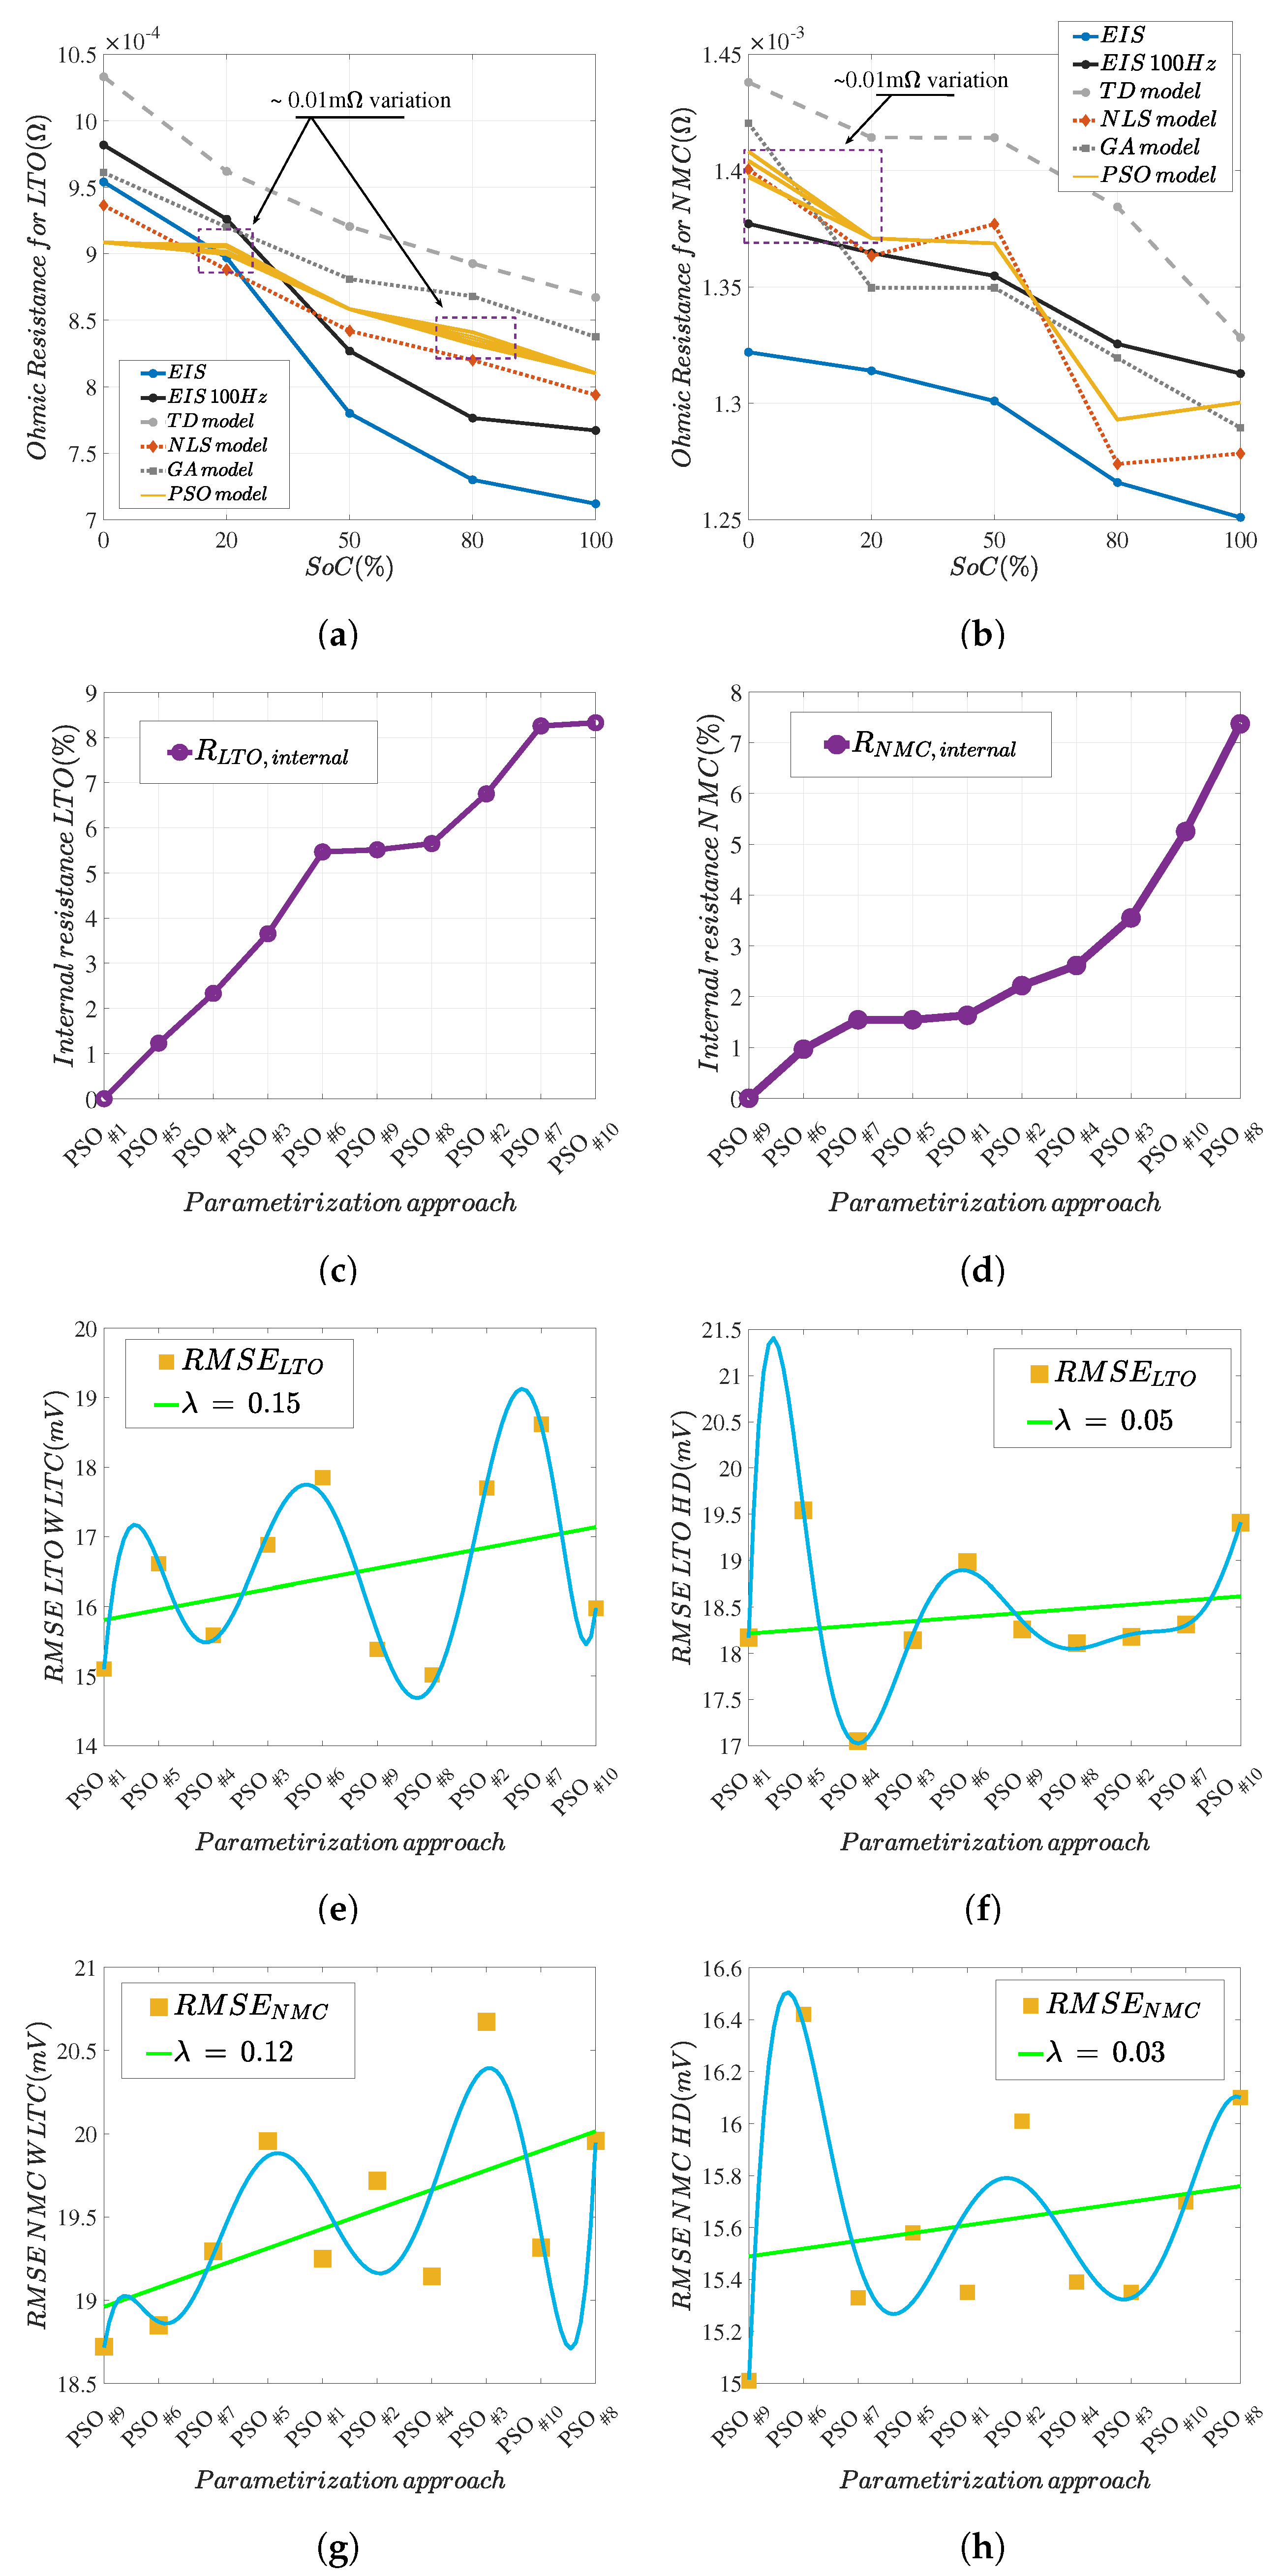
5.1. Resistance and Power Capability
5.1.1. Lower Time-Constant Resistances
5.1.2. Total Resistances
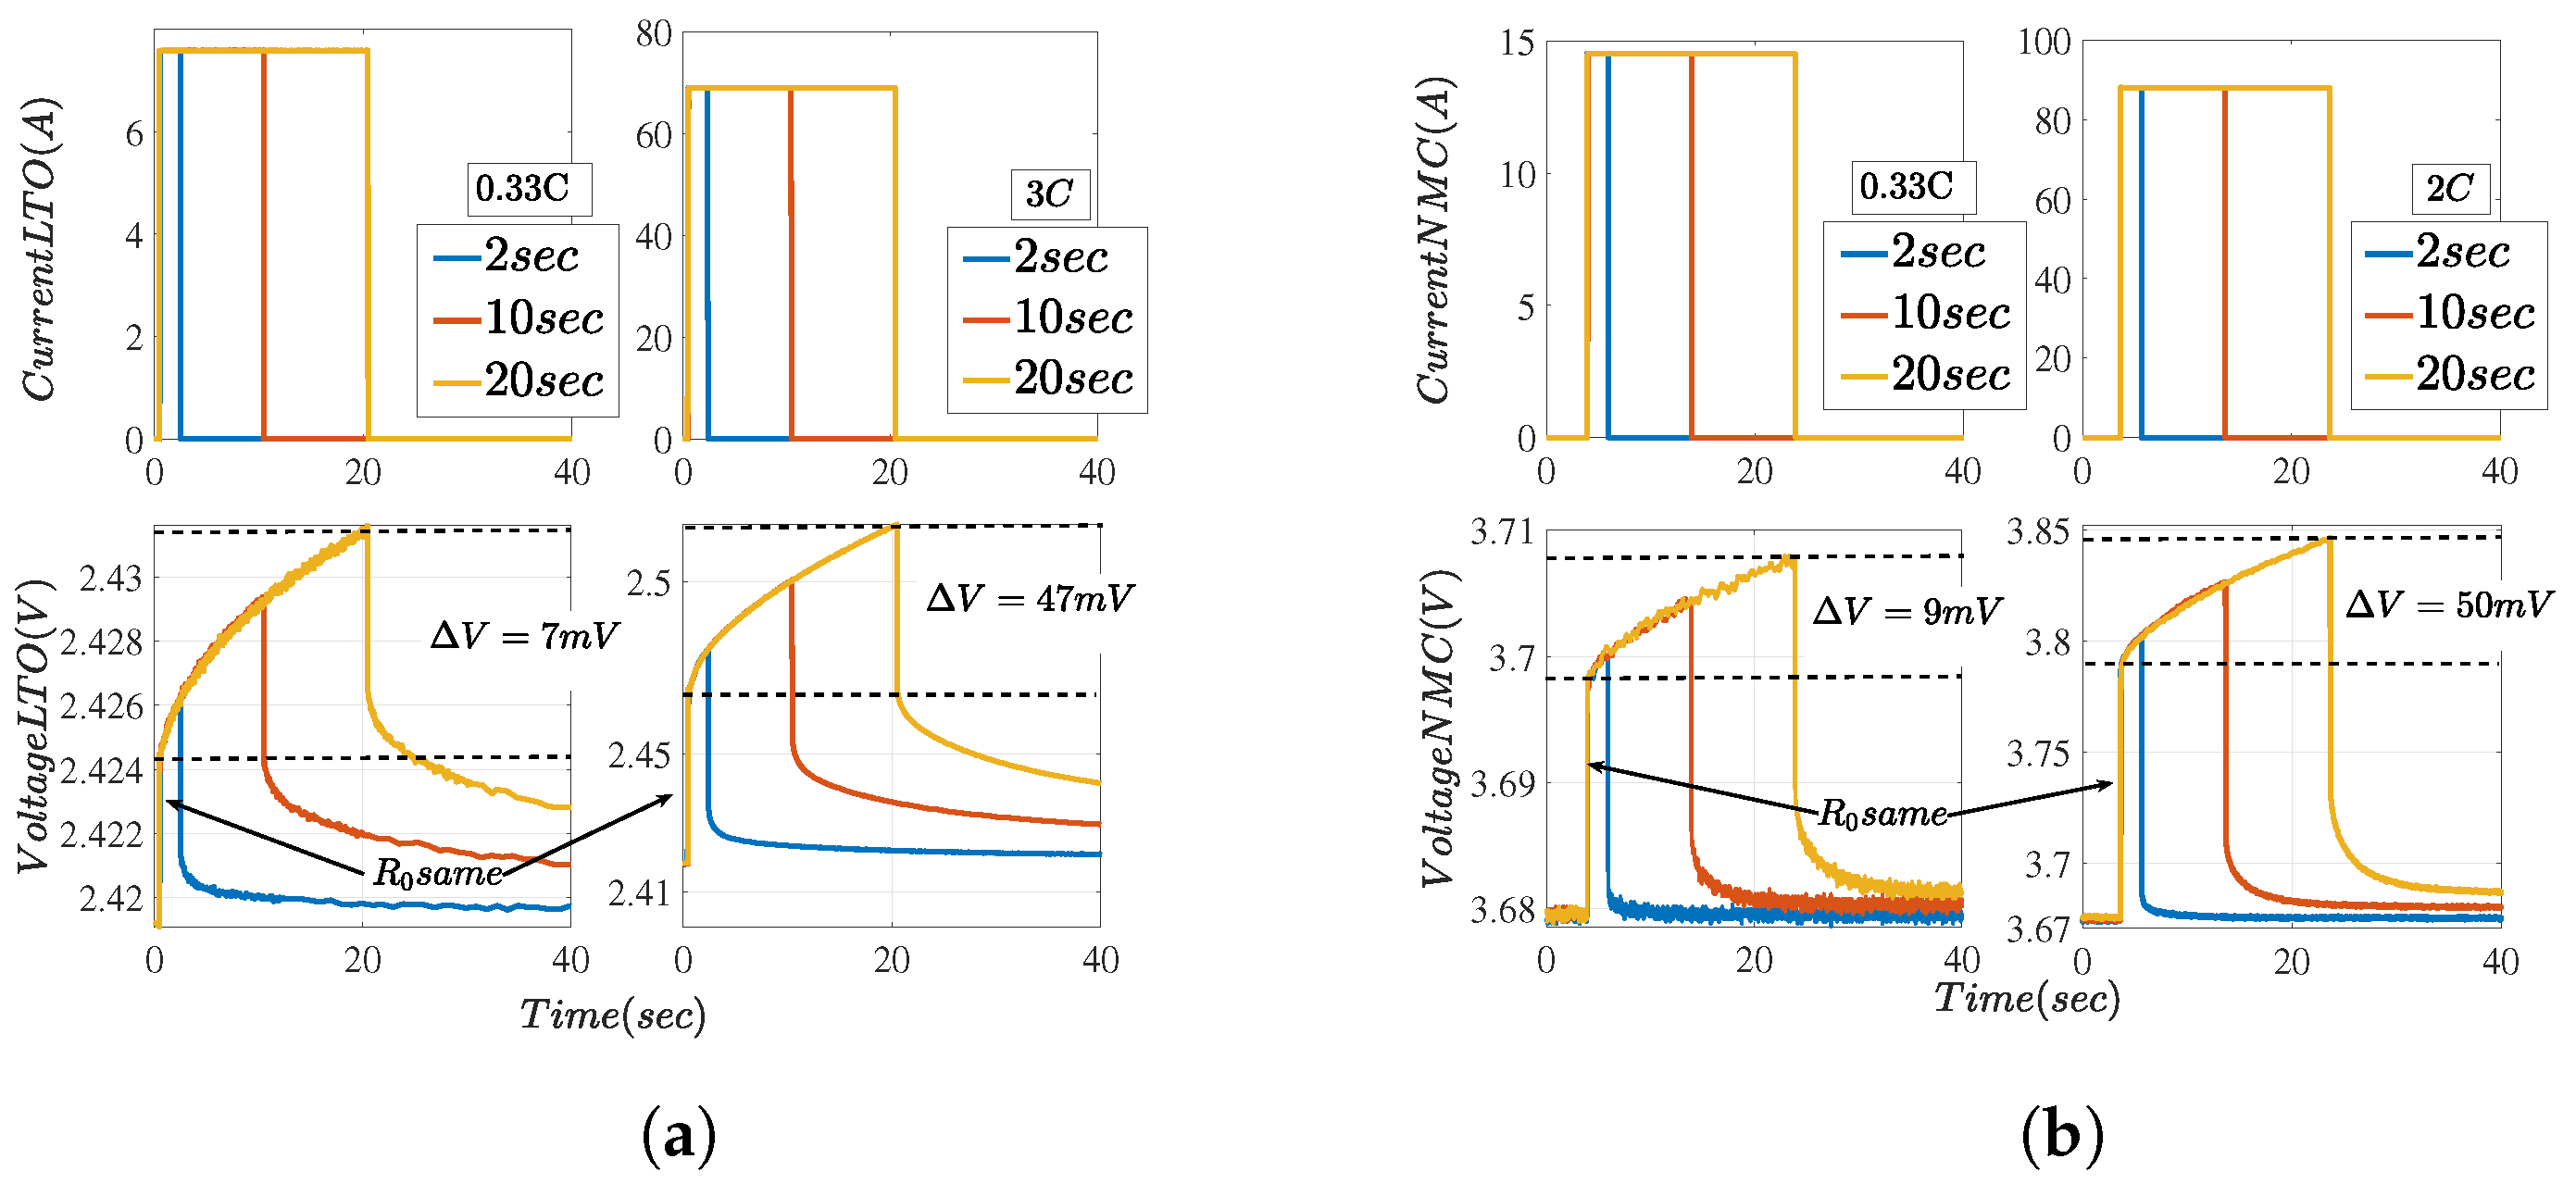
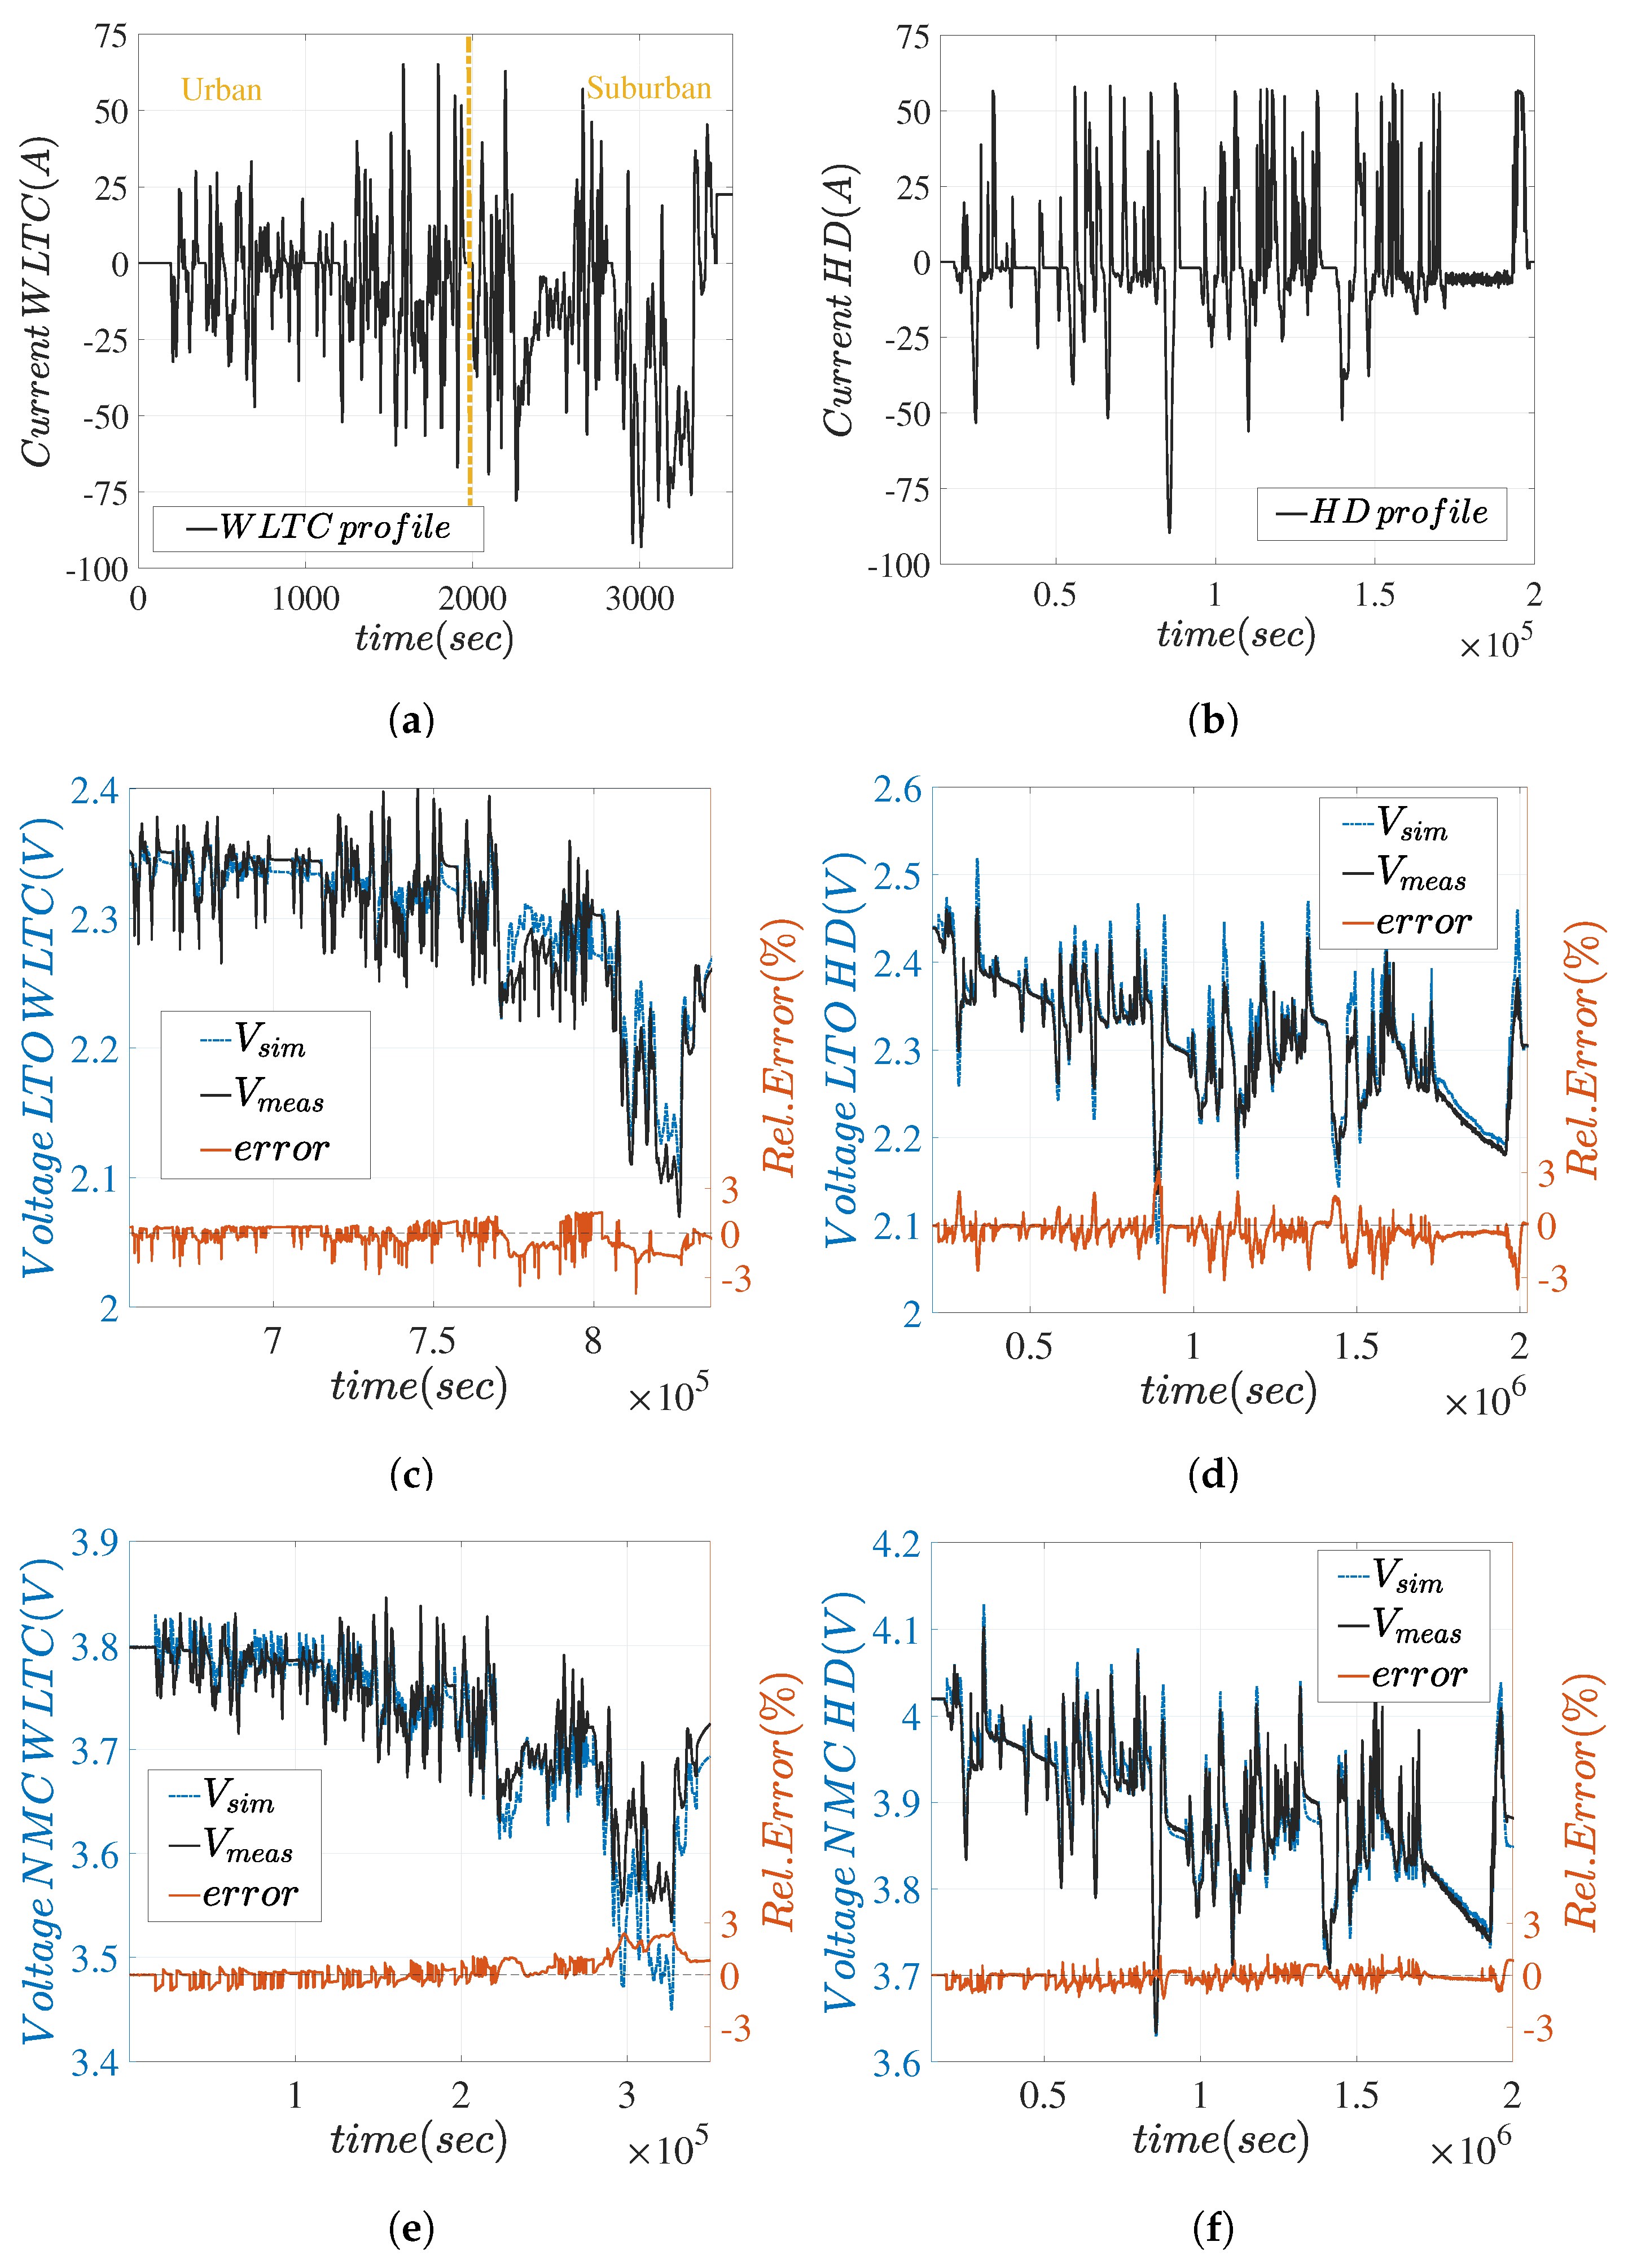
5.2. Current Profiles and Voltage Responses
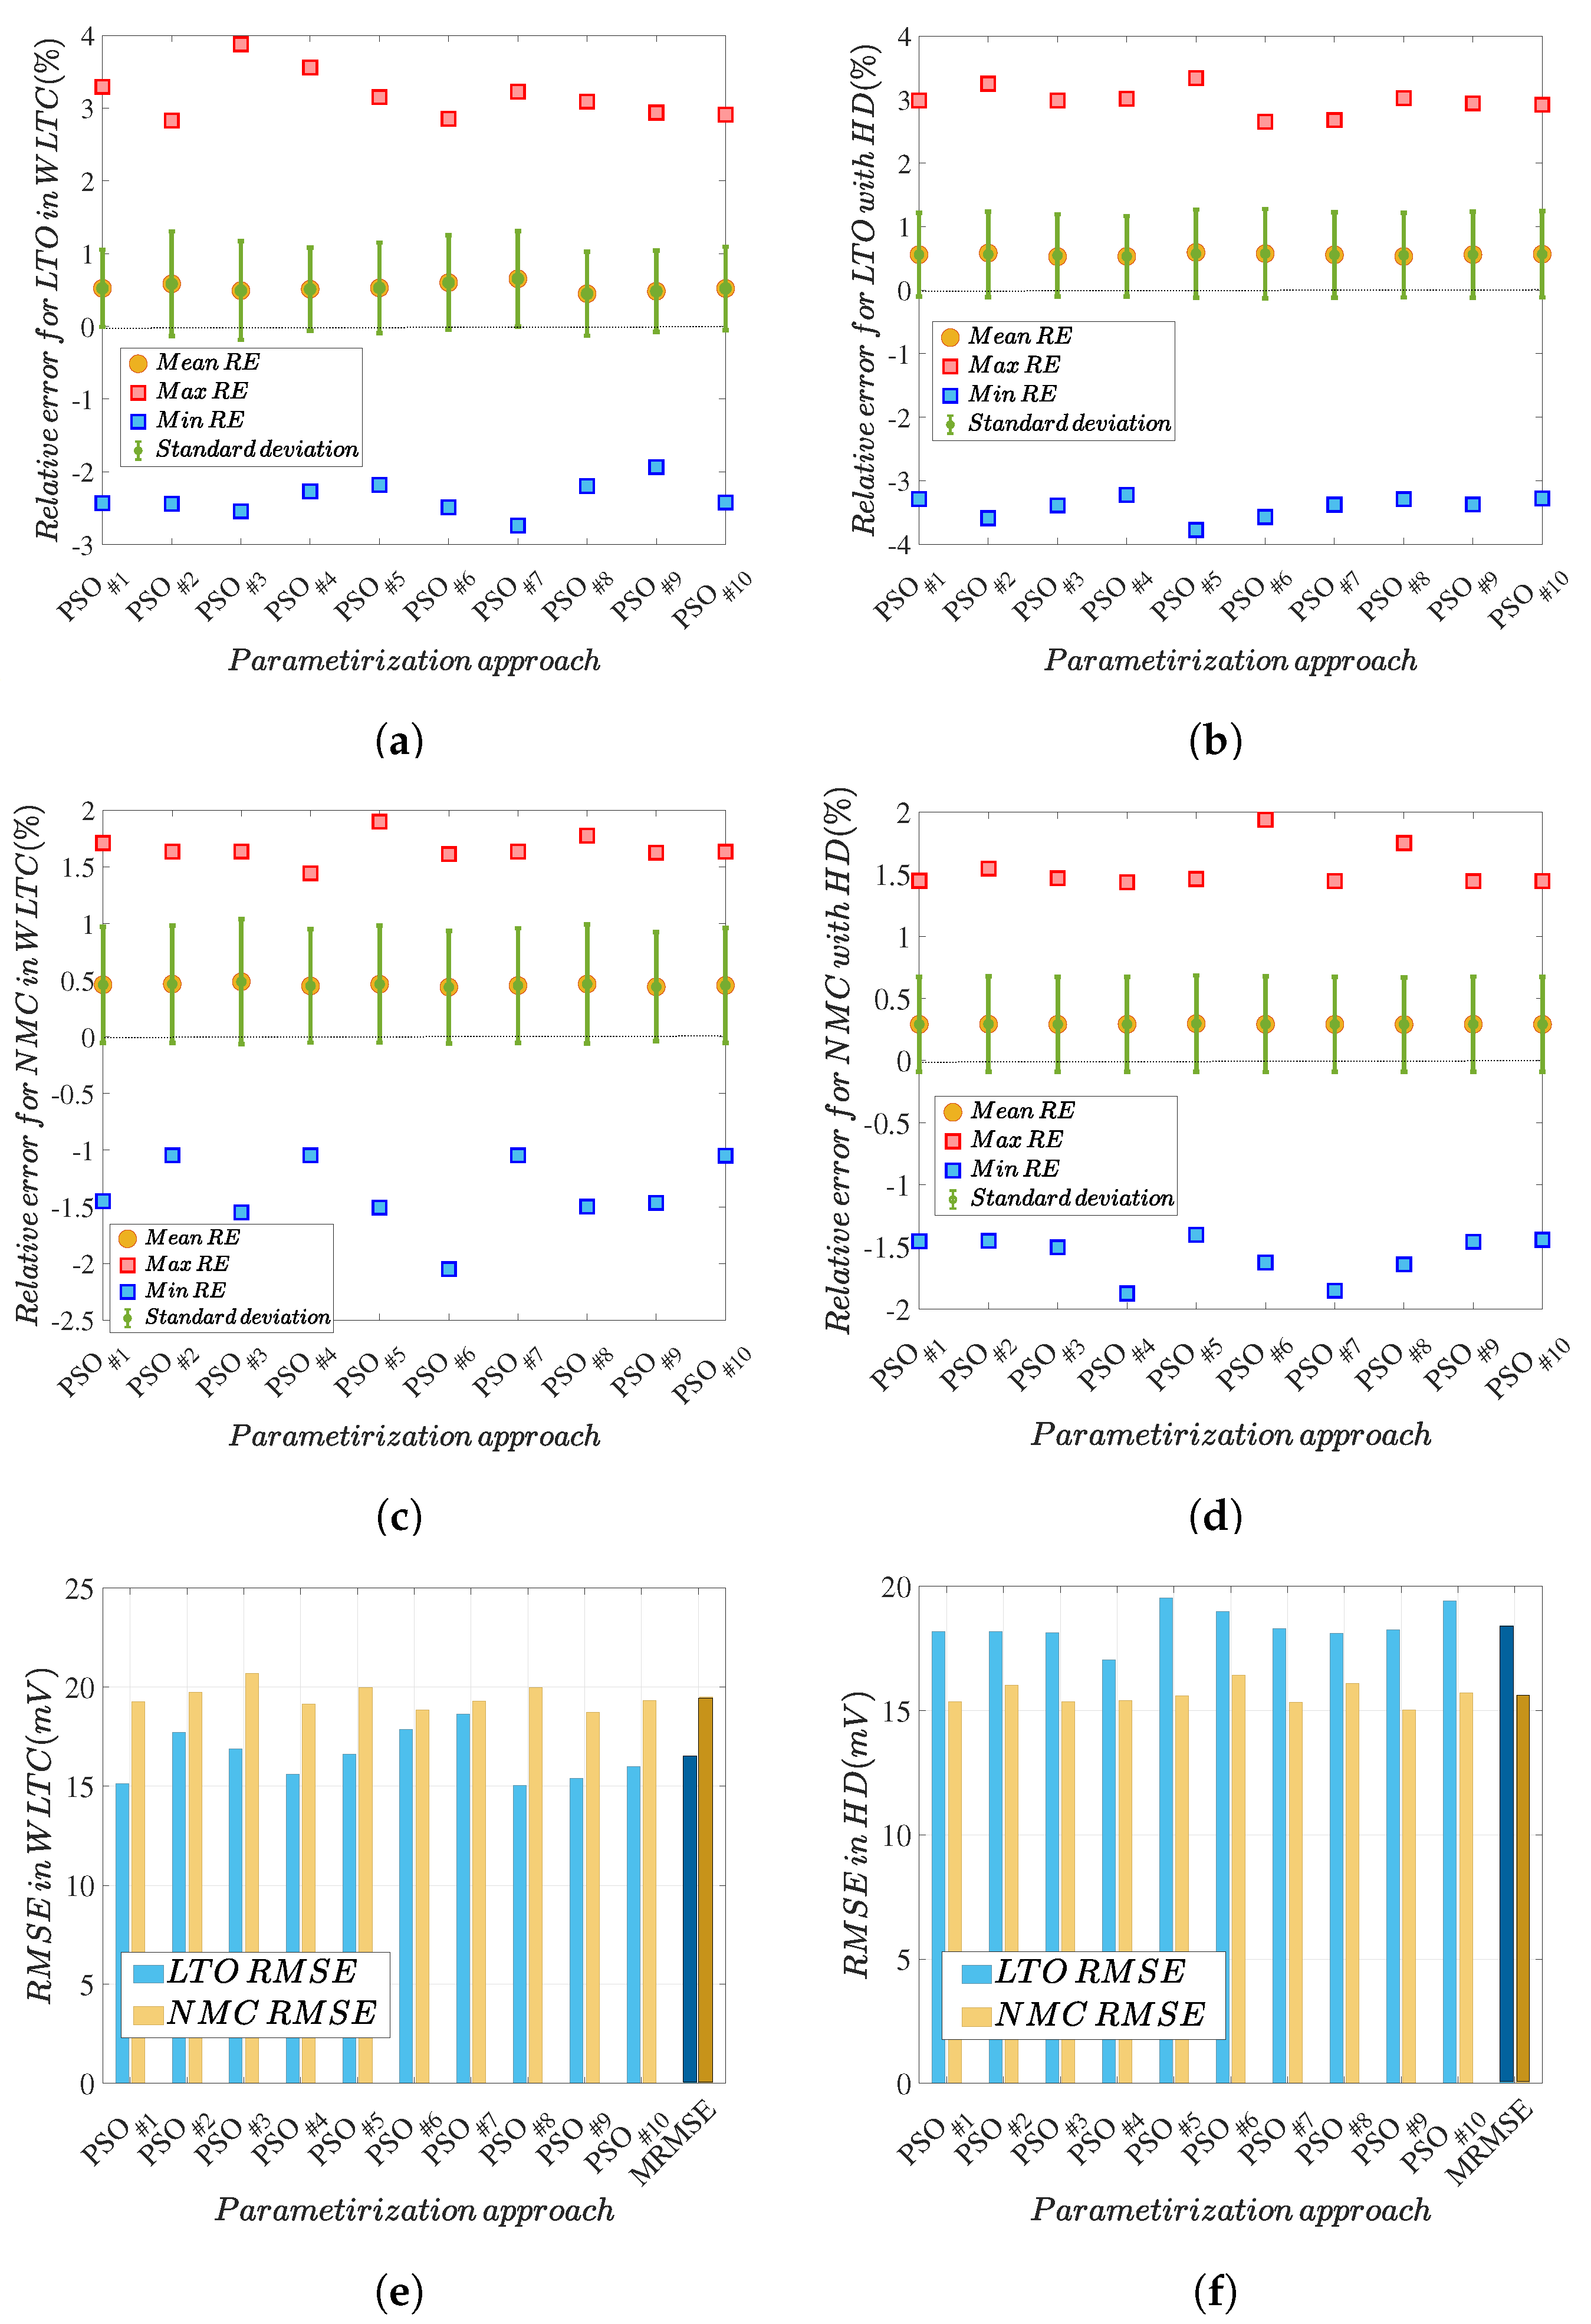
5.3. Discussion of Methodology Robustness
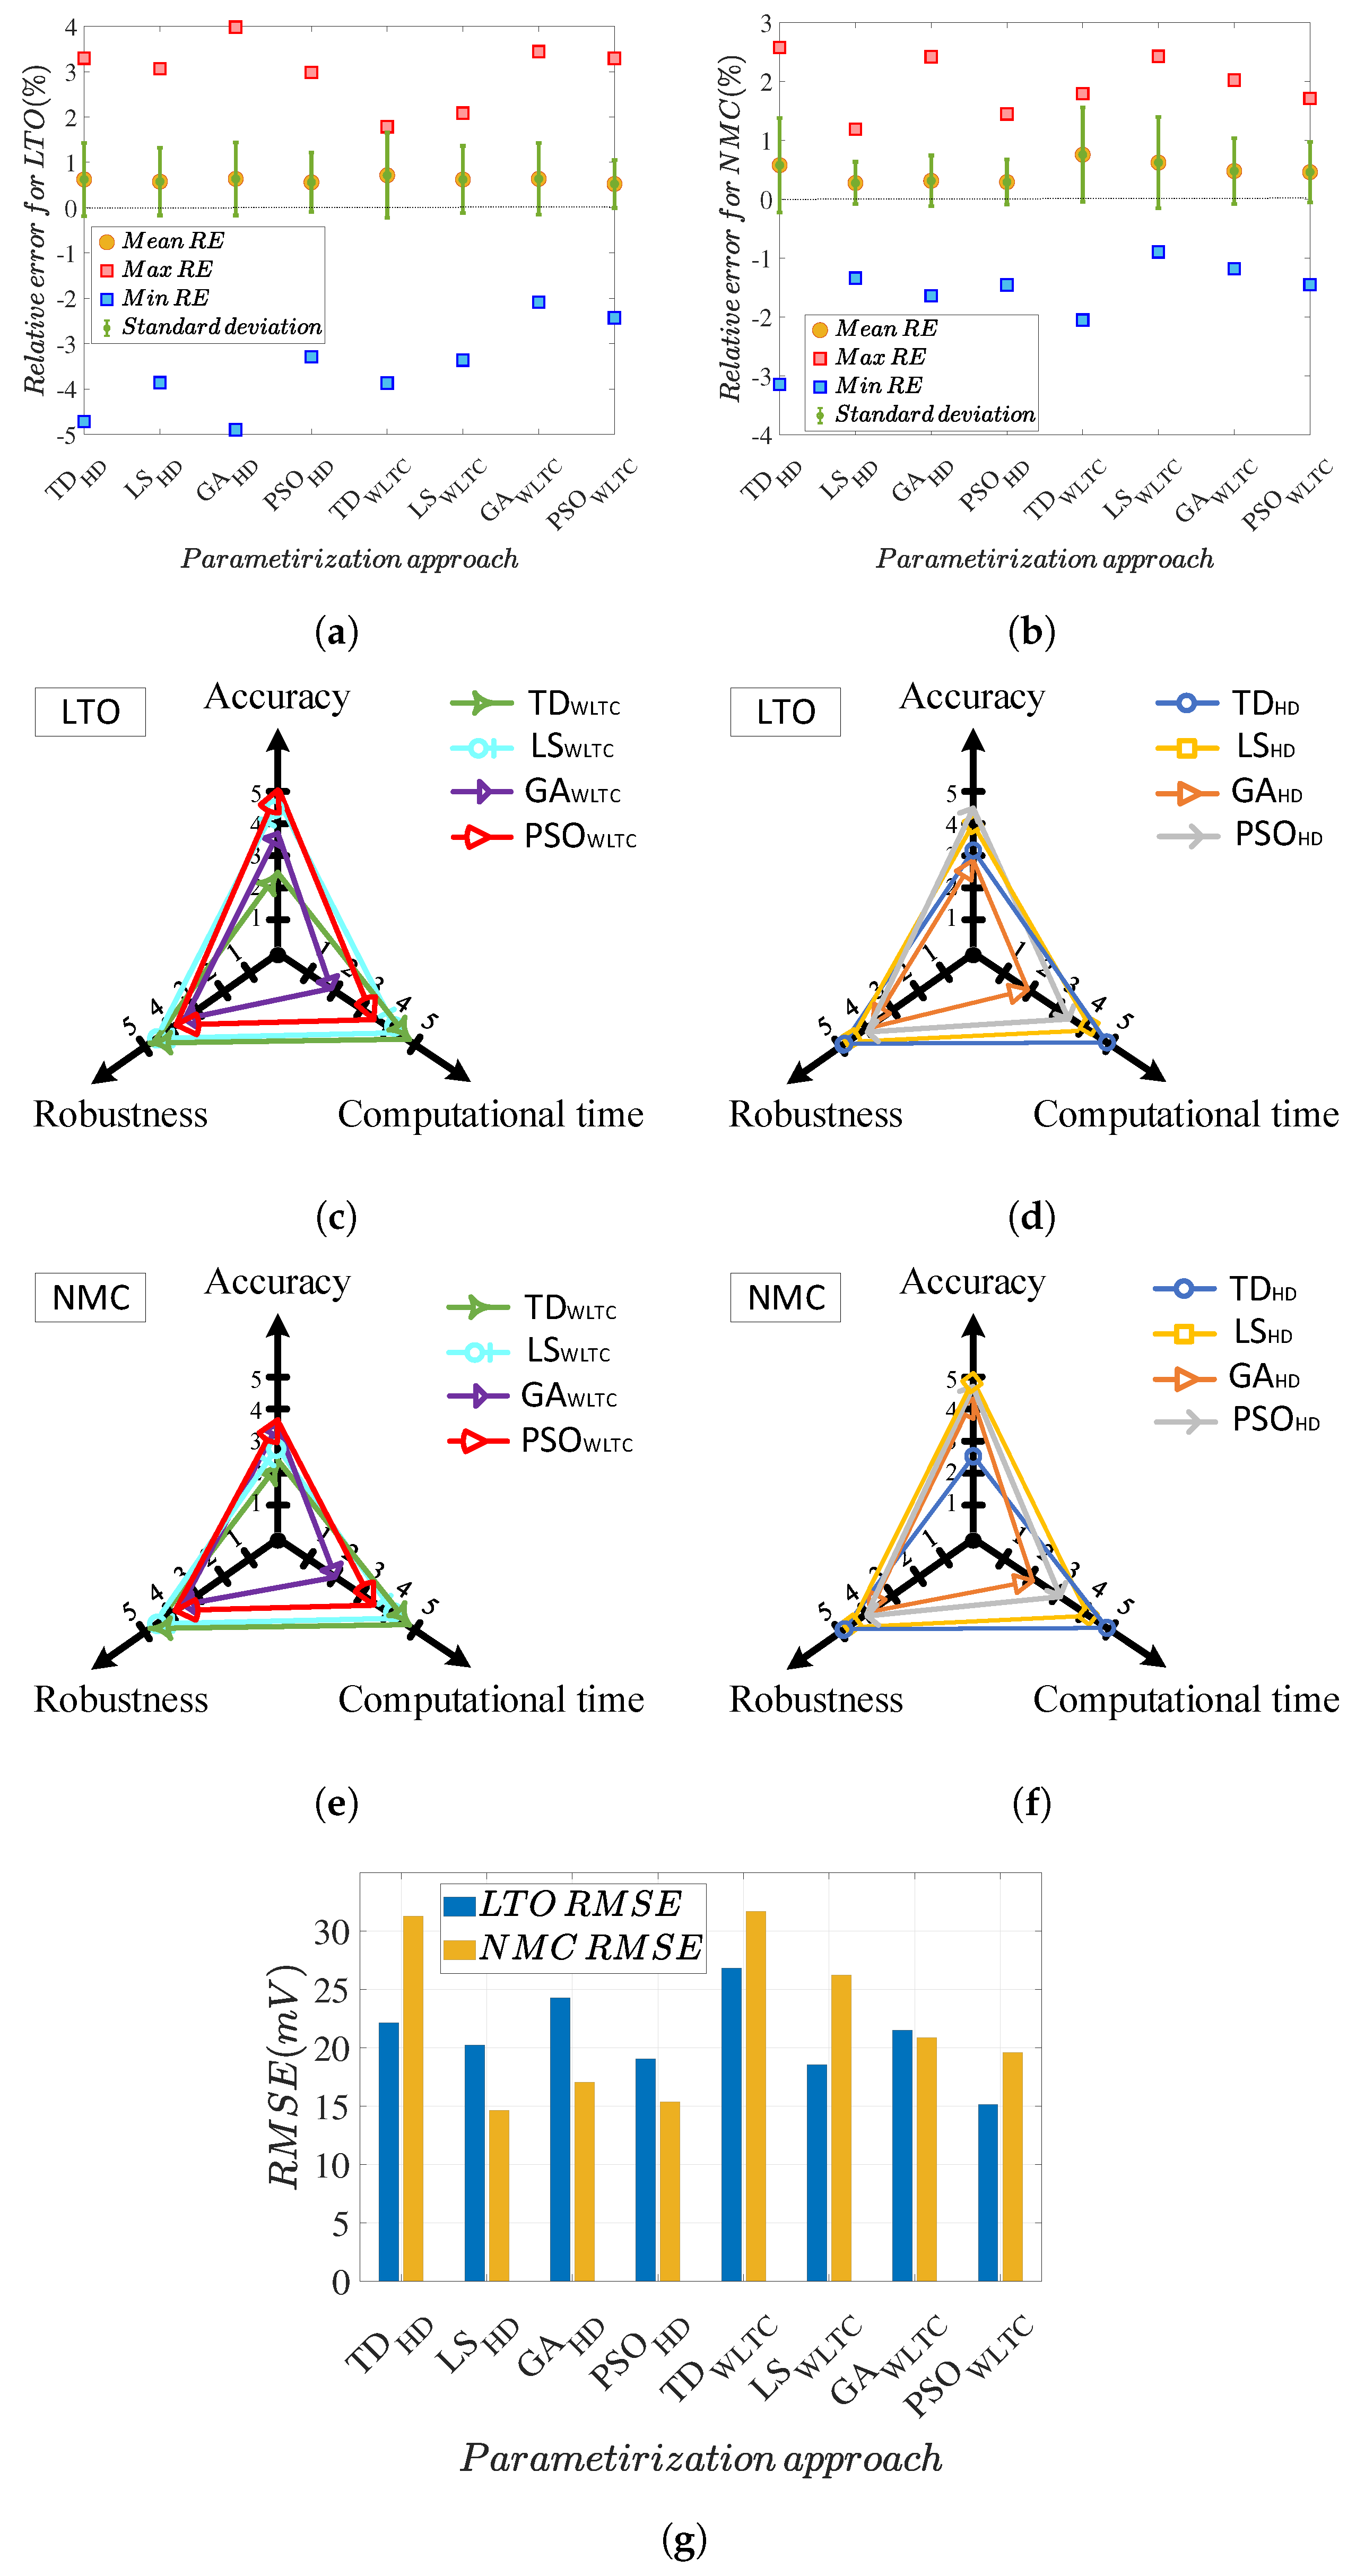
5.4. Parameter Identification Comprehensive Assessment
6. Conclusions
Author Contributions
Funding
Acknowledgments
Conflicts of Interest
References
- Nitta, N.; Wu, F.; Lee, J.T.; Yushin, G. Li-ion battery materials: Present and future. Mater. Today 2015, 18, 252–264. [Google Scholar] [CrossRef]
- Zubi, G.; Dufo-López, R.; Carvalho, M.; Pasaoglu, G. The lithium-ion battery: State of the art and future perspectives. Renew. Sustain. Energy Rev. 2018, 89, 292–308. [Google Scholar] [CrossRef]
- Omar, N.; Daowd, M.; van den Bossche, P.; Hegazy, O.; Smekens, J.; Coosemans, T.; van Mierlo, J. Rechargeable energy storage systems for plug-in hybrid electric vehicles-assessment of electrical characteristics. Energies 2012, 5, 2952–2988. [Google Scholar] [CrossRef]
- Berecibar, M.; Gandiaga, I.; Villarreal, I.; Omar, N.; Van Mierlo, J.; Van Den Bossche, P. Critical review of state of health estimation methods of Li-ion batteries for real applications. Renew. Sustain. Energy Rev. 2016, 56, 572–587. [Google Scholar] [CrossRef]
- Seaman, A.; Dao, T.S.; McPhee, J. A survey of mathematics-based equivalent-circuit and electrochemical battery models for hybrid and electric vehicle simulation. J. Power Sources 2014, 256, 410–423. [Google Scholar] [CrossRef]
- Mousavi G., S.M.; Nikdel, M. Various battery models for various simulation studies and applications. Renew. Sustain. Energy Rev. 2014, 32, 477–485. [Google Scholar] [CrossRef]
- Grandjean, T.R.; McGordon, A.; Jennings, P.A. Structural identifiability of equivalent circuit models for li-ion batteries. Energies 2017, 10, 90. [Google Scholar] [CrossRef]
- Huet, F. A review of impedance measurements for determination of the state-of-charge or state-of-health of secondary batteries. J. Power Sources 1998, 70, 59–69. [Google Scholar] [CrossRef]
- Buller, S.; Thele, M.; De doncker, R.; Karden, E. Supercapacitors and lithium-ion batteries for power electronic applications. IEEE Ind. Appl. Mag. 2005, 11, 62–67. [Google Scholar] [CrossRef]
- Juang, L.W.; Kollmeyer, P.J.; Jahns, T.M.; Lorenz, R.D. Improved modeling of lithium-based batteries using temperature-dependent resistance and overpotential. In Proceedings of the 2014 IEEE Transportation Electrification Conference and Expo (ITEC), Dearborn, MI, USA, 15–18 June 2014; pp. 1–8. [Google Scholar] [CrossRef]
- Lai, X.; Gao, W.; Zheng, Y.; Ouyang, M.; Li, J.; Han, X.; Zhou, L. A comparative study of global optimization methods for parameter identification of different equivalent circuit models for Li-ion batteries. Electrochim. Acta 2019, 295, 1057–1066. [Google Scholar] [CrossRef]
- Brand, M.J.; Kolp, E.I.; Bach, T.; Berg, P.; Schmidt, P.; Jossen, A. Electrical resistances of soldered battery cell connections. J. Energy Storage 2017, 12, 45–54. [Google Scholar] [CrossRef]
- Jaguemont, J.; Omar, N.; Abdel-Monem, M.; Van den Bossche, P.; Van Mierlo, J. Fast-charging investigation on high-power and high-energy density pouch cells with 3D-thermal model development. Appl. Therm. Eng. 2018, 128, 1282–1296. [Google Scholar] [CrossRef]
- Schweiger, H.G.; Obeidi, O.; Komesker, O.; Raschke, A.; Schiemann, M.; Zehner, C.; Gehnen, M.; Keller, M.; Birke, P. Comparison of several methods for determining the internal resistance of lithium ion cells. Sensors 2010, 10, 5604–5625. [Google Scholar] [CrossRef] [PubMed]
- Barai, A.; Chouchelamane, G.H.; Guo, Y.; McGordon, A.; Jennings, P. A study on the impact of lithium-ion cell relaxation on electrochemical impedance spectroscopy. J. Power Sources 2015, 280, 74–80. [Google Scholar] [CrossRef]
- Somakettarin, N.; Funaki, T. Study on Factors for Accurate Open Circuit Voltage Characterizations in Mn-Type Li-Ion Batteries. Batteries 2017, 3, 8. [Google Scholar] [CrossRef]
- Liu, C.; Neale, Z.G.; Cao, G. Understanding electrochemical potentials of cathode materials in rechargeable batteries. Mater. Today 2016, 19, 109–123. [Google Scholar] [CrossRef]
- Plett, G.L. Extended Kalman filtering for battery management systems of LiPB-based HEV battery packs—Part 2. Modeling and identification. J. Power Sources 2004, 134, 262–276. [Google Scholar] [CrossRef]
- Nejad, S.; Gladwin, D.T.; Stone, D.A. A systematic review of lumped-parameter equivalent circuit models for real-time estimation of lithium-ion battery states. J. Power Sources 2016, 316, 183–196. [Google Scholar] [CrossRef]
- Li, A.; Pelissier, S.; Venet, P.; Gyan, P. Fast Characterization Method for Modeling Battery Relaxation Voltage. Batteries 2016, 2, 7. [Google Scholar] [CrossRef]
- Vetter, J.; Novák, P.; Wagner, M.R.; Veit, C.; Möller, K.C.; Besenhard, J.O.; Winter, M.; Wohlfahrt-Mehrens, M.; Vogler, C.; Hammouche, A. Ageing mechanisms in lithium-ion batteries. J. Power Sources 2005, 147, 269–281. [Google Scholar] [CrossRef]
- Gopalakrishnan, R.; Li, Y.; Smekens, J.; Barhoum, A.; Van Assche, G.; Omar, N.; Van Mierlo, J. Electrochemical impedance spectroscopy characterization and parameterization of lithium nickel manganese cobalt oxide pouch cells: Dependency analysis of temperature and state of charge. Ionics 2019, 25, 111–123. [Google Scholar] [CrossRef]
- Stroe, D.I.; Swierczynski, M.; Stroe, A.I.; Kaer, S.K.; Teodorescu, R. Lithium-ion battery power degradation modelling by electrochemical impedance spectroscopy. IET Renew. Power Gener. 2017, 11, 1136–1141. [Google Scholar] [CrossRef]
- Maheshwari, A.; Heck, M.; Santarelli, M. Cycle aging studies of lithium nickel manganese cobalt oxide-based batteries using electrochemical impedance spectroscopy. Electrochim. Acta 2018, 273, 335–348. [Google Scholar] [CrossRef]
- Eddahech, A.; Briat, O.; Bertrand, N.; Delétage, J.Y.; Vinassa, J.M. Behavior and state-of-health monitoring of Li-ion batteries using impedance spectroscopy and recurrent neural networks. Int. J. Electr. Power Energy Syst. 2012, 42, 487–494. [Google Scholar] [CrossRef]
- Zhang, Q.; Cui, N.; Shang, Y.; Duan, B.; Zhang, C. An improved Peukert battery model of nonlinear capacity considering temperature effect. IFAC-PapersOnLine 2018, 51, 665–669. [Google Scholar] [CrossRef]
- Ma, S.; Jiang, M.; Tao, P.; Song, C.; Wu, J.; Wang, J.; Deng, T.; Shang, W. Temperature effect and thermal impact in lithium-ion batteries: A review. Prog. Nat. Sci. Mater. Int. 2018, 28, 653–666. [Google Scholar] [CrossRef]
- Sauer, D. BATTERIES | Charge-Discharge Curves. In Encyclopedia of Electrochemical Power Sources; Elsevier: Amsterdam, The Netherlands, 2009; pp. 443–451. [Google Scholar] [CrossRef]
- Xing, Y.; He, W.; Pecht, M.; Tsui, K.L. State of charge estimation of lithium-ion batteries using the open-circuit voltage at various ambient temperatures. Appl. Energy 2014, 113, 106–115. [Google Scholar] [CrossRef]
- Tong, S.; Klein, M.P.; Park, J.W. On-line optimization of battery open circuit voltage for improved state-of-charge and state-of-health estimation. J. Power Sources 2015, 293, 416–428. [Google Scholar] [CrossRef]
- Cuadras, A.; Kanoun, O. Soc li-ion battery monitoring with impedance spectroscopy. In Proceedings of the 2009 6th International Multi-Conference on Systems, Signals and Devices, SSD 2009, Djerba, Tunisia, 23–26 March 2009; pp. 1–5. [Google Scholar] [CrossRef]
- Wang, X.; Wei, X.; Dai, H.; Wu, Q. State Estimation of Lithium Ion Battery Based on Electrochemical Impedance Spectroscopy with On-Board Impedance Measurement System. In Proceedings of the 2015 IEEE Vehicle Power and Propulsion Conference, VPPC 2015, Montreal, QC, Canada, 19–22 October 2015; pp. 1–5. [Google Scholar] [CrossRef]
- Waag, W.; Fleischer, C.; Sauer, D.U. Critical review of the methods for monitoring of lithium-ion batteries in electric and hybrid vehicles. J. Power Sources 2014, 258, 321–339. [Google Scholar] [CrossRef]
- Lu, L.; Han, X.; Li, J.; Hua, J.; Ouyang, M. A review on the key issues for lithium-ion battery management in electric vehicles. J. Power Sources 2013, 226, 272–288. [Google Scholar] [CrossRef]
- Zheng, Y.; Ouyang, M.; Han, X.; Lu, L.; Li, J. Investigating the error sources of the online state of charge estimation methods for lithium-ion batteries in electric vehicles. J. Power Sources 2018, 377, 161–188. [Google Scholar] [CrossRef]
- Zhang, R.; Xia, B.; Li, B.; Cao, L.; Lai, Y.; Zheng, W.; Wang, H.; Wang, W. State of the art of lithium-ion battery SOC estimation for electrical vehicles. Energies 2018, 11, 1820. [Google Scholar] [CrossRef]
- Roscher, M.A.; Sauer, D.U. Dynamic electric behavior and open-circuit-voltage modeling of LiFePO 4 -based lithium ion secondary batteries. J. Power Sources 2011, 196, 331–336. [Google Scholar] [CrossRef]
- Dong, G.; Wei, J.; Zhang, C.; Chen, Z. Online state of charge estimation and open circuit voltage hysteresis modeling of LiFePO4 battery using invariant imbedding method. Appl. Energy 2016, 162, 163–171. [Google Scholar] [CrossRef]
- Meng, J.; Ricco, M.; Luo, G.; Swierczynski, M.; Stroe, D.I.; Stroe, A.I.; Teodorescu, R. An Overview and Comparison of Online Implementable SOC Estimation Methods for Lithium-Ion Battery. IEEE Trans. Ind. Appl. 2018, 54, 1583–1591. [Google Scholar] [CrossRef]
- Singh, P.; Reisner, D.E.; Atwater, T.; Salkind, A.J.; Fennie, C. Determination of state-of-charge and state-of-health of batteries by fuzzy logic methodology. J. Power Sources 1999, 80, 293–300. [Google Scholar] [CrossRef]
- Bhangu, B.S.; Bentley, P.; Stone, D.A.; Bingham, C.M. Observer techniques for estimating the state-of-charge and state-of-health of VRLABs for hybrid electric vehicles. In Proceedings of the 2005 IEEE Vehicle Power and Propulsion Conference, VPPC 2005, Chicaco, IL, USA, 7–9 September 2005; pp. 780–789. [Google Scholar] [CrossRef]
- Guo, L.; Li, J.; Fu, Z. Lithium-ion battery SOC estimation and hardware-in-the-loop simulation based on EKF. Energy Procedia 2019, 158, 2599–2604. [Google Scholar] [CrossRef]
- Chemali, E.; Kollmeyer, P.J.; Preindl, M.; Emadi, A. State-of-charge estimation of Li-ion batteries using deep neural networks: A machine learning approach. J. Power Sources 2018, 400, 242–255. [Google Scholar] [CrossRef]
- Wu, B.; Han, S.; Shin, K.G.; Lu, W. Application of artificial neural networks in design of lithium-ion batteries. J. Power Sources 2018, 395, 128–136. [Google Scholar] [CrossRef]
- Hansen, T.; Wang, C.J. Support vector based battery state of charge estimator. J. Power Sources 2005, 141, 351–358. [Google Scholar] [CrossRef]
- Ng, K.S.; Moo, C.S.; Chen, Y.P.; Hsieh, Y.C. Enhanced coulomb counting method for estimating state-of-charge and state-of-health of lithium-ion batteries. Appl. Energy 2009, 86, 1506–1511. [Google Scholar] [CrossRef]
- Zhang, Y.; Song, W.; Lin, S.; Feng, Z. A novel model of the initial state of charge estimation for LiFePO 4 batteries. J. Power Sources 2014, 248, 1028–1033. [Google Scholar] [CrossRef]
- Farmann, A.; Sauer, D.U. A comprehensive review of on-board State-of-Available-Power prediction techniques for lithium-ion batteries in electric vehicles. J. Power Sources 2016, 329, 123–137. [Google Scholar] [CrossRef]
- Schmidt, A.; Smith, A.; Ehrenberg, H. Power capability and cyclic aging of commercial, high power lithium ion battery cells with respect to different cell designs. J. Power Sources 2019, 425, 27–38. [Google Scholar] [CrossRef]
- Jossen, A. Fundamentals of battery dynamics. J. Power Sources 2006, 154, 530–538. [Google Scholar] [CrossRef]
- Zhu, J.G.; Sun, Z.C.; Wei, X.Z.; Dai, H.F. A new lithium-ion battery internal temperature on-line estimate method based on electrochemical impedance spectroscopy measurement. J. Power Sources 2015, 274, 990–1004. [Google Scholar] [CrossRef]
- Vyroubal, P.; Kazda, T. Equivalent circuit model parameters extraction for lithium ion batteries using electrochemical impedance spectroscopy. J. Energy Storage 2018, 15, 23–31. [Google Scholar] [CrossRef]
- Andre, D.; Meiler, M.; Steiner, K.; Walz, H.; Soczka-Guth, T.; Sauer, D.U. Characterization of high-power lithium-ion batteries by electrochemical impedance spectroscopy. I: Experimental investigation. J. Power Sources 2011, 196, 5334–5341. [Google Scholar] [CrossRef]
- Samadani, E.; Farhad, S.; Scott, W.; Mastali, M.; Gimenez, L.E.; Fowler, M.; Fraser, R.A. Empirical modeling of lithium-ion batteries based on electrochemical impedance spectroscopy tests. Electrochim. Acta 2015, 160, 169–177. [Google Scholar] [CrossRef]
- Schmitt, J.; Maheshwari, A.; Heck, M.; Lux, S.; Vetter, M. Impedance change and capacity fade of lithium nickel manganese cobalt oxide-based batteries during calendar aging. J. Power Sources 2017, 353, 183–194. [Google Scholar] [CrossRef]
- Momma, T.; Matsunaga, M.; Mukoyama, D.; Osaka, T. Ac impedance analysis of lithium ion battery under temperature control. J. Power Sources 2012, 216, 304–307. [Google Scholar] [CrossRef]
- Do, D.V.; Forgez, C.; El Kadri Benkara, K.; Friedrich, G. Impedance observer for a Li-ion battery using Kalman filter. IEEE Trans. Veh. Technol. 2009, 58, 3930–3937. [Google Scholar] [CrossRef]
- Liaw, B.Y.; Nagasubramanian, G.; Jungst, R.G.; Doughty, D.H. Modeling of lithium ion cells—A simple equivalent-circuit model approach. Solid State Ionics 2004, 175, 835–839. [Google Scholar] [CrossRef]
- Karden, E.; Buller, S.; De Doncker, R.W. A frequency-domain approach to dynamical modeling of electrochemical power sources. Electrochim. Acta 2002, 47, 2347–2356. [Google Scholar] [CrossRef]
- Valoen, L.O.; Reimers, J.N. Transport Properties of LiPF[sub 6]-Based Li-Ion Battery Electrolytes. J. Electrochem. Soc. 2005, 152, A882. [Google Scholar] [CrossRef]
- Park, M.; Zhang, X.; Chung, M.; Less, G.B.; Sastry, A.M. A review of conduction phenomena in Li-ion batteries. J. Power Sources 2010, 195, 7904–7929. [Google Scholar] [CrossRef]
- Mauracher, P.; Karden, E. Dynamic modelling of lead/acid batteries using impedance spectroscopy for parameter identification. J. Power Sources 1997, 67, 69–84. [Google Scholar] [CrossRef]
- Waag, W.; Käbitz, S.; Sauer, D.U. Experimental investigation of the lithium-ion battery impedance characteristic at various conditions and aging states and its influence on the application. Appl. Energy 2013, 102, 885–897. [Google Scholar] [CrossRef]
- Farmann, A.; Waag, W.; Sauer, D.U. Application-specific electrical characterization of high power batteries with lithium titanate anodes for electric vehicles. Energy 2016, 112, 294–306. [Google Scholar] [CrossRef]
- Waag, W.; Fleischer, C.; Sauer, D.U. On-line estimation of lithium-ion battery impedance parameters using a novel varied-parameters approach. J. Power Sources 2013, 237, 260–269. [Google Scholar] [CrossRef]
- Zhu, J.; Knapp, M.; Darma, M.S.D.; Fang, Q.; Wang, X.; Dai, H.; Wei, X.; Ehrenberg, H. An improved electro-thermal battery model complemented by current dependent parameters for vehicular low temperature application. Appl. Energy 2019, 248, 149–161. [Google Scholar] [CrossRef]
- Reddy, T.B.; Linden, D. Linden’s Handbook of Batteries; McGraw-Hill: New York, NY, USA, 2011; p. 2.1. [Google Scholar]
- Fleischer, C.; Waag, W.; Heyn, H.M.; Sauer, D.U. On-line adaptive battery impedance parameter and state estimation considering physical principles in reduced order equivalent circuit battery models part 2. Parameter and state estimation. J. Power Sources 2014, 262, 457–482. [Google Scholar] [CrossRef]
- Farmann, A.; Waag, W.; Sauer, D.U. Adaptive approach for on-board impedance parameters and voltage estimation of lithium-ion batteries in electric vehicles. J. Power Sources 2015, 299, 176–188. [Google Scholar] [CrossRef]
- Barai, A.; Uddin, K.; Dubarry, M.; Somerville, L.; McGordon, A.; Jennings, P.; Bloom, I. A comparison of methodologies for the non-invasive characterisation of commercial Li-ion cells. Prog. Energy Combust. Sci. 2019, 72, 1–31. [Google Scholar] [CrossRef]
- Wang, S.; Verbrugge, M.; Wang, J.S.; Liu, P. Power prediction from a battery state estimator that incorporates diffusion resistance. J. Power Sources 2012, 214, 399–406. [Google Scholar] [CrossRef]
- Gantenbein, S.; Weiss, M.; Ivers-Tiffée, E. Impedance based time-domain modeling of lithium-ion batteries: Part I. J. Power Sources 2018, 379, 317–327. [Google Scholar] [CrossRef]
- Fleischer, C.; Waag, W.; Heyn, H.M.; Sauer, D.U. On-line adaptive battery impedance parameter and state estimation considering physical principles in reduced order equivalent circuit battery models part 1. Requirements, critical review of methods and modeling. J. Power Sources 2014, 260, 276–291. [Google Scholar] [CrossRef]
- Murashko, K.; Pyrhonen, J.; Laurila, L. Three-dimensional thermal model of a lithium ion battery for hybrid mobile working machines: Determination of the model parameters in a pouch cell. IEEE Trans. Energy Convers. 2013, 28, 335–343. [Google Scholar] [CrossRef]
- Hentunen, A.; Lehmuspelto, T.; Suomela, J. Time-domain parameter extraction method for thévenin-equivalent circuit battery models. IEEE Trans. Energy Convers. 2014, 29, 558–566. [Google Scholar] [CrossRef]
- Knap, V.; Stroe, D.I.; Teodorescu, R.; Swierczynski, M.; Stanciu, T. Comparison of parametrization techniques for an electrical circuit model of Lithium-Sulfur batteries. In Proceedings of the 2015 IEEE International Conference on Industrial Informatics, INDIN 2015, Cambridge, UK, 22–24 July 2015; pp. 1278–1283. [Google Scholar] [CrossRef]
- Stroe, A.I.; Stroe, D.I.; Swierczynski, M.; Teodorescu, R.; Kær, S.K. Lithium-Ion battery dynamic model for wide range of operating conditions. In Proceedings of the 2017 International Conference on Optimization of Electrical and Electronic Equipment, OPTIM 2017 and 2017 Intl Aegean Conference on Electrical Machines and Power Electronics, ACEMP 2017, Brasov, Romania, 25–27 May 2017; pp. 660–666. [Google Scholar] [CrossRef]
- Wang, S.; Verbrugge, M.; Wang, J.S.; Liu, P. Multi-parameter battery state estimator based on the adaptive and direct solution of the governing differential equations. J. Power Sources 2011, 196, 8735–8741. [Google Scholar] [CrossRef]
- Xiong, R.; He, H.; Sun, F.; Zhao, K. Online estimation of peak power capability of Li-Ion batteries in electric vehicles by a hardware-in-loop approach. Energies 2012, 5, 1455–1469. [Google Scholar] [CrossRef]
- Duong, V.H.; Bastawrous, H.A.; Lim, K.C.; See, K.W.; Zhang, P.; Dou, S.X. Online state of charge and model parameters estimation of the LiFePO4 battery in electric vehicles using multiple adaptive forgetting factors recursive least-squares. J. Power Sources 2015, 296, 215–224. [Google Scholar] [CrossRef]
- Zhang, C.; Allafi, W.; Dinh, Q.; Ascencio, P.; Marco, J. Online estimation of battery equivalent circuit model parameters and state of charge using decoupled least squares technique. Energy 2018, 142, 678–688. [Google Scholar] [CrossRef]
- Xu, J.; Mi, C.C.; Cao, B.; Cao, J. A new method to estimate the state of charge of lithium-ion batteries based on the battery impedance model. J. Power Sources 2013, 233, 277–284. [Google Scholar] [CrossRef]
- De Sutter, L.; Firouz, Y.; De Hoog, J.; Omar, N.; Van Mierlo, J. Battery aging assessment and parametric study of lithium-ion batteries by means of a fractional differential model. Electrochim. Acta 2019, 305, 24–36. [Google Scholar] [CrossRef]
- Xia, B.; Chen, C.; Tian, Y.; Wang, M.; Sun, W.; Xu, Z. State of charge estimation of lithium-ion batteries based on an improved parameter identification method. Energy 2015, 90, 1426–1434. [Google Scholar] [CrossRef]
- He, H.; Xiong, R.; Fan, J. Evaluation of lithium-ion battery equivalent circuit models for state of charge estimation by an experimental approach. Energies 2011, 4, 582–598. [Google Scholar] [CrossRef]
- Wu, C.; Fu, R.; Xu, Z.; Chen, Y. Improved state of charge estimation for high power lithium ion batteries considering current dependence of internal resistance. Energies 2017, 10, 1486. [Google Scholar] [CrossRef]
- Wang, Q.; Wang, J.; Zhao, P.; Kang, J.; Yan, F.; Du, C. Correlation between the model accuracy and model-based SOC estimation. Electrochim. Acta 2017, 228, 146–159. [Google Scholar] [CrossRef]
- Zou, Y.; Hu, X.; Ma, H.; Li, S.E. Combined State of Charge and State of Health estimation over lithium-ion battery cell cycle lifespan for electric vehicles. J. Power Sources 2015, 273, 793–803. [Google Scholar] [CrossRef]
- He, H.; Xiong, R.; Guo, H.; Li, S. Comparison study on the battery models used for the energy management of batteries in electric vehicles. Energy Convers. Manag. 2012, 64, 113–121. [Google Scholar] [CrossRef]
- De Sutter, L.; Nikolian, A.; Timmermans, J.M.; Omar, N.; Van Mierlo, J. Online multi chemistry soc estimation technique using data driven battery model parameter estimation. World Electr. Veh. J. 2018, 9, 16. [Google Scholar] [CrossRef]
- Hu, Y.; Wang, Y.-Y. Two Time-Scaled Battery Model Identification with Application to Battery State Estimation. IEEE Trans. Control. Syst. Technol. 2015, 23, 1180–1188. [Google Scholar] [CrossRef]
- Roscher, M.A.; Bohlen, O.S.; Sauer, D.U. Reliable state estimation of multicell Lithium-ion battery systems. IEEE Trans. Energy Convers. 2011, 26, 737–743. [Google Scholar] [CrossRef]
- Elbeltagi, E.; Hegazy, T.; Grierson, D. Comparison among five evolutionary-based optimization algorithms. Adv. Eng. Inform. 2005, 19, 43–53. [Google Scholar] [CrossRef]
- Hu, X.; Li, S.; Peng, H. A comparative study of equivalent circuit models for Li-ion batteries. J. Power Sources 2012, 198, 359–367. [Google Scholar] [CrossRef]
- Wang, Y.; Cai, Z. A hybrid multi-swarm particle swarm optimization to solve constrained optimization problems. Front. Comput. Sci. China 2009, 3.1, 38–52. [Google Scholar] [CrossRef]
- Lai, X.; Zheng, Y.; Sun, T. A comparative study of different equivalent circuit models for estimating state-of-charge of lithium-ion batteries. Electrochim. Acta 2018, 259, 566–577. [Google Scholar] [CrossRef]
- Meng, J.; Luo, G.; Ricco, M.; Swierczynski, M.; Stroe, D.I.; Teodorescu, R. Overview of Lithium-Ion Battery Modeling Methods for State-of-Charge Estimation in Electrical Vehicles. Appl. Sci. 2018, 8, 659. [Google Scholar] [CrossRef]
- Thirugnanam, K.; Ezhil Reena Joy, T.P.; Singh, M.; Kumar, P. Mathematical modeling of li-ion battery using genetic algorithm approach for V2G applications. IEEE Trans. Energy Convers. 2014, 29, 332–343. [Google Scholar] [CrossRef]
- Blaifi, S.; Moulahoum, S.; Colak, I.; Merrouche, W. Monitoring and enhanced dynamic modeling of battery by genetic algorithm using LabVIEW applied in photovoltaic system. Electr. Eng. 2018, 100, 1021–1038. [Google Scholar] [CrossRef]
- Fotouhi, A.; Auger, D.J.; Propp, K.; Longo, S. Accuracy Versus Simplicity in Online Battery Model Identification. IEEE Trans. Syst. Man Cybern. Syst. 2018, 48, 195–206. [Google Scholar] [CrossRef]
- Hassan, R.; Cohanim, B.; Weck, O.D.; Venter, G. A Copmarison of Particle Swarm Optimization and the Genetic Algorithm. In Proceedings of the 1st AIAA Multidisciplinary Design Optimization Specialist Conference, Austin, TX, USA, 18–21 April 2005; pp. 1–13. [Google Scholar]
- Rahman, M.A.; Anwar, S.; Izadian, A. Electrochemical model parameter identification of a lithium-ion battery using particle swarm optimization method. J. Power Sources 2016, 307, 86–97. [Google Scholar] [CrossRef]
- Zhang, X.; Wang, Y.; Liu, C.; Chen, Z. A novel approach of battery pack state of health estimation using artificial intelligence optimization algorithm. J. Power Sources 2018, 376, 191–199. [Google Scholar] [CrossRef]
- Dvorak, D.; Bauml, T.; Holzinger, A.; Popp, H. A Comprehensive Algorithm for Estimating Lithium-Ion Battery Parameters from Measurements. IEEE Trans. Sustain. Energy 2018, 9, 771–779. [Google Scholar] [CrossRef]
- Yu, Z.; Xiao, L.; Li, H.; Zhu, X.; Huai, R. Model Parameter Identification for Lithium Batteries Using the Coevolutionary Particle Swarm Optimization Method. IEEE Trans. Ind. Electron. 2017, 64, 5690–5700. [Google Scholar] [CrossRef]
- Thomas, B.B.; Preuss, M.; Schmitt, K.; Schwefel, H.P. Challenges for Contemporary Evolutionary Algorithms. Algorithm Eng. Rep. 2010, 10, 1864–4503. [Google Scholar]
- Deb, K.; Pratap, A.; Agarwal, S.; Meyarivan, T. A fast and elitist multiobjective genetic algorithm: NSGA-II. IEEE Trans. Evol. Comput. 2002, 6, 182–197. [Google Scholar] [CrossRef]
- Hong, Y.; Lee, C.W. Pareto fronts for multiobjective optimal design of the lithium-ion battery cell. J. Energy Storage 2018, 17, 507–514. [Google Scholar] [CrossRef]
- Blaifi, S.; Moulahoum, S.; Colak, I.; Merrouche, W. An enhanced dynamic model of battery using genetic algorithm suitable for photovoltaic applications. Appl. Energy 2016, 169, 888–898. [Google Scholar] [CrossRef]
- Malik, A.; Zhang, Z.; Agarwal, R.K. Extraction of battery parameters using a multi-objective genetic algorithm with a non-linear circuit model. J. Power Sources 2014, 259, 76–86. [Google Scholar] [CrossRef]
- Wang, W.; Shu-Hung Chung, H.; Zhang, J. Near-Real-Time Parameter Estimation of an Electrical Battery Model With Multiple Time Constants and SOC-Dependent Capacitance. IEEE Trans. Power Electron. 2014, 29, 5905–5920. [Google Scholar] [CrossRef]
- Amano, F.; Kobayashi, N. Digital Signal Processor. J. Inst. Electr. Eng. Jpn. 1998, 118, 30–33. [Google Scholar] [CrossRef][Green Version]
- Stroe, D.I.; Swierczynski, M.; Stroe, A.I.; Knudsen Kær, S. Generalized Characterization Methodology for Performance Modelling of Lithium-Ion Batteries. Batteries 2016, 2, 37. [Google Scholar] [CrossRef]
- Andre, D.; Meiler, M.; Steiner, K.; Walz, H.; Soczka-Guth, T.; Sauer, D.U. Characterization of high-power lithium-ion batteries by electrochemical impedance spectroscopy. II: Modelling. J. Power Sources 2011, 196, 5349–5356. [Google Scholar] [CrossRef]
- Ekstrom, H.; Fridholm, B.; Lindbergh, G. Comparison of lumped diffusion models for voltage prediction of a lithium-ion battery cell during dynamic loads. J. Power Sources 2018, 402, 296–300. [Google Scholar] [CrossRef]
- Farmann, A.; Sauer, D.U. Comparative study of reduced order equivalent circuit models for on-board state-of-available-power prediction of lithium-ion batteries in electric vehicles. Appl. Energy 2018, 225, 1102–1122. [Google Scholar] [CrossRef]
- Juang, L.W.; Kollmeyer, P.J.; Jahns, T.M.; Lorenz, R.D. Improved nonlinear model for electrode voltage-current relationship for more consistent online battery system identification. IEEE Trans. Ind. Appl. 2013, 49, 1480–1488. [Google Scholar] [CrossRef]
- Chiang, Y.H.; Sean, W.Y.; Ke, J.C. Online estimation of internal resistance and open-circuit voltage of lithium-ion batteries in electric vehicles. J. Power Sources 2011, 196, 3921–3932. [Google Scholar] [CrossRef]
- Kim, J.; Lee, S.; Cho, B.H. Complementary cooperation algorithm based on DEKF combined with pattern recognition for SOC/capacity estimation and SOH prediction. IEEE Trans. Power Electron. 2012, 27, 436–451. [Google Scholar] [CrossRef]
- Andre, D.; Appel, C.; Soczka-Guth, T.; Sauer, D.U. Advanced mathematical methods of SOC and SOH estimation for lithium-ion batteries. J. Power Sources 2013, 224, 20–27. [Google Scholar] [CrossRef]
- Claude, F.; Becherif, M.; Ramadan, H.S. Experimental validation for Li-ion battery modeling using Extended Kalman Filters. Int. J. Hydrogen Energy 2017, 42, 25509–25517. [Google Scholar] [CrossRef]
- Dong, X.; Zhang, C.; Jiang, J. Evaluation of SOC estimation method based on EKF/AEKF under noise interference. Energy Procedia 2018, 152, 520–525. [Google Scholar] [CrossRef]
- Berg, H. The electrochemical cell. In Batteries for Electric Vehicles: Materials and Electrochemistry; Cambridge University Press: Cambridge, UK, 2015; pp. 7–46. [Google Scholar] [CrossRef]
- Stroe, A.I.; Swierczynski, M.; Stroe, D.I.; Teodorescu, R.; Kaer, S.K. Pulse Power Capability Estimation of Lithium Titanate Oxide-Based Batteries. ECS Trans. 2016, 74, 45–53. [Google Scholar] [CrossRef]
- Fridholm, B.; Wik, T.; Nilsson, M. Robust recursive impedance estimation for automotive lithium-ion batteries. J. Power Sources 2016, 304, 33–41. [Google Scholar] [CrossRef]


| Main Characteristics | Value | Unit | |
|---|---|---|---|
| Chemistry | LTO | NMC | [-] |
| Nominal voltage | 2.3 | 3.65 | [V] |
| Nominal capacity | 23 | 43 | [Ah] |
| End-of-charge maximum voltage | 2.7 | 4.2 | [V] |
| End-of-discharge cut-off voltage | 1.5 | 3 | [V] |
| Volumetric energy density | 202 | 424 | [Wh/L] |
| Specific energy density | 96.1 | 186.8 | [Wh/kg] |
| Specific power | >1200 | >1200 | [W/kg] |
| AC impedance (1 kHz) | 0.6 | 1 | [mOhms] |
| Recommended charge | 4 C | 1 C | [-] |
| current rate (continuous) | |||
| 10 s max charge C-rate | >8 C | 3 C | [-] |
| Height | 103 | 148 | [mm] |
| Width | 115 | 91 | [mm] |
| Thickness | 22 | 27.5 | [mm] |
| Weight | 0.550 | 0.840 | [kg] |
| Value | LTO | NMC | Unit | ||||||||
|---|---|---|---|---|---|---|---|---|---|---|---|
| C-rate | C/3 | C/2 | 1C | 2C | 4C | C/3 | C/2 | 1C | 1.5C | 2C | [-] |
| Charge Capacity | 23.2 | 23.1 | 23 | 23 | 22.9 | 44.9 | 44.9 | 44.8 | 44.7 | 44.7 | [Ah] |
| Discharge Capacity | 23.6 | 23.3 | 23.1 | 23 | 22.8 | 45.3 | 45.2 | 45 | 44.9 | 44.8 | |
| Parameter | LTO | NMC | Unit | ||||||||
|---|---|---|---|---|---|---|---|---|---|---|---|
| SoC | 100 | 80 | 50 | 20 | 0 | 100 | 80 | 50 | 20 | 0 | [%] |
| R0 | 0.709 | 0.714 | 0.782 | 0.883 | 0.953 | 1.25 | 1.26 | 1.306 | 1.31 | 1.33 | [m] |
| R1 | 0.175 | 0.136 | 0.122 | 0.123 | 0.179 | 0.359 | 0.35 | 0.358 | 0.434 | 0.963 | [m] |
| Q1 | 46.4 | 283 | 169.1 | 43.27 | 302.8 | 19.34 | 18.23 | 15.45 | 21.14 | 176.1 | [] |
| Q2 | 847.7 | 6987 | 8449 | 7209 | 883.3 | 9198 | 8822 | 10,970 | 10,726 | 3662 | [] |
| Refs. | Parameterization/SoC | Covering Aspects | Methodology | Conclusion |
|---|---|---|---|---|
| A. Analytical equations (TD) | ||||
| [75] | CC | Analytical time-domain characterization of the DP ECM. | A 40 Ah NMC cell is tested in a 7s1p module design. | The model is validated on a real-life heavy-duty application profile and found a voltage MAPE 1 < 0.2% |
| B. Least-square methods (LS) | ||||
| [89,90] | CC/KF | RLS with an optimal forgetting factor to characterize several ECMs. | The former compares 7 ECMs, assessed with DST 5 and FUDS 6 profiles and the latter work compares 2 ECMS for 3 chemistries with DDPT 7 and WLTC 8. | The DP models shows the best performance for both works with RMSE 2 < 25 mV, and MAE 3< 10 mV, respectively. |
| [86] | KF | An NLS technique is used to characterize the DP ECM of the battery cell. | A DST is performed for the 14 Ah LFP/C pouch cell. Discussion on the resistance behavior over high current profiles and SoC estimation with EKF. | An RMSE < 12 mV between the estimated and the measured voltage is observed. |
| [81] | CC | The DP EMC is characterized decoupled WRLS method and validated on a motorway-drive data. | A commercial 3 Ah 18650 cylindrical cell is tested in terms of SoC estimation accuracy. | An RMSE < 10 mV with the DWLS with better accuracy on both parameter and SoC identification. |
| C. Heuristic algorithms (GA/PSO) | ||||
| [94] | CC | MPSO method to parameterize the ECMs. | 12 different ECMS are compared for cylindrical NMC and LFP cells. | A maximum RMSE < 30 mV with a DST and FUDS validation profile is observed- lowest for one ECM with hysteresis (LFP) block. |
| [85] | CC/KF | GA method to parameterize the five proposed ECMs for an LMO battery module. | A DST is applied to assess the accuracy of the models with CC. A FUDS validation profile the KF. | A MAE < 50 mV for the DP model is obtained with CC. |
| [11] | CC | A comparative study based on various heuristic algorithms for nine different ECMs. | A pouch 32.5 Ah NMC battery cell is validated with NEDC profile. | A relationship on the model-to-algorithm complexity is proposed. PSO with an RMSE < 25 mV |
| [96] | KF | A comparative study based on GA of 11 different ECMs and a proposed SoC estimation. | A pouch 32.5 Ah NMC battery cell is validated with NEDC 9 profile. | The 2RC is the best among all in terms of accuracy with RMSE < 5 mV. |
| [97] | CC | SVM, DP, SPM and combined model are parameterized with GA. | An LFP 10 Ah cell is validated with NEDC to assess the complexity versus accuracy. | Dual-Polarization order ECM is found as a good modeling trade-off. |
| D. Impedance spectroscopy (EIS) | ||||
| [113] | CC | A hybrid procedure for 2nd order CPE circuit is developed from EIS and HPPC tests. | A pulse test and a frequency regulation validation profile is used on a prismatic LFP/C battery cell. | A max voltage relative error <5% is observed for both profiles. |
| [116] | 10% | Seven impedance-based ECMs with RC and CPE elements are characterized by current dependency based on BVE | NMC, LTO and LFP cells are tested in regards to state estimation. | The 3-CPE shows accurate result with an RMSE < 20 mV, but the accuracy of the models is highly dependent on the operating conditions and SoH. |
| E. Other methods (KF-based) | ||||
| [87] | KF | A three ECMs comparative study (Thevenin, PNGV, and DP) with an EKF-Ah SoC estimation algorithm. | NMC/G pouch 35 Ah cell is modeled and tested with a CCD 10 and DST to estimate the influence of each model’s accuracy with the selected SoC estimation. | Best case for RMSE < 20 mV and RMSE < 15 mV for the DP model under the CCD and DST respectively |
| [19] | KF | A comparative study on ten ECMs that are parameterized with the dual-EKF technique. | LFP and NMC cells are validated with the NEDC profile. Focus laid on the state estimation (SoC-SoP) with erroneous initial conditions. | The DP model is chosen for having the best performance with less complexity when the hysteresis of the cells can be neglected with RMSE < 10 mV. |
| Proposed paper | CC | A DP ECM is proposed and characterized by analytical equations (TD), LS and heuristic optimization techniques (GA and PSO). Impedance behavior is estimated and compared to EIS. | A WLTC urban/suburban and heavy-duty current profiles are performed for LTO and NMC battery cells. Discussion of the Ohmic, total and internal resistance behavior in time and frequency. | A max RE 4 < 4% for all techniques is observed. PSO and NLS are optimal identification methods. Trade-off between accuracy, robustness and computational time set PSO as the best approach. |
| Li-ion | Method | Mean RE (%) | Max. RE (%) | Min. RE (%) | Std. Deviation | Comp. Time (s) | Robustness (p.u) | RMSE (mV) | ||||||
|---|---|---|---|---|---|---|---|---|---|---|---|---|---|---|
| HD | WLTC | HD | WLTC | HD | WLTC | HD | WLTC | on HPPC Profile | HD | WLTC | HD | WLTC | ||
| LTO | TD | 0.622 | 0.714 | 3.295 | 1.787 | 4.717 | 3.871 | 0.808 | 0.939 | <10 | 1 | 1 | 22.12 | 26.79 |
| LS | 0.573 | 0.621 | 3.067 | 2.085 | 3.861 | 3.364 | 0.745 | 0.742 | <60 | 1 | 1 | 20.22 | 18.56 | |
| GA | 0.635 | 0.634 | 3.982 | 3.444 | 4.899 | 2.086 | 0.805 | 0.791 | <1200 | 0.90 | 0.87 | 24.27 * | 21.49 * | |
| PSO | 0.558 | 0.522 | 2.984 | 3.293 | 3.290 | 2.431 | 0.657 | 0.531 | <100 | 0.92 | 0.90 | 17.05 * | 15.02 * | |
| NMC | TD | 0.577 | 0.755 | 2.576 | 1.793 | 3.147 | 2.053 | 0.803 | 0.800 | <10 | 1 | 1 | 31.26 | 31.69 |
| LS | 0.275 | 0.621 | 1.188 | 2.425 | 1.341 | 0.895 | 0.358 | 0.777 | <60 | 1 | 1 | 14.61 | 26.2 | |
| GA | 0.312 | 0.477 | 2.418 | 2.023 | 1.640 | 1.180 | 0.430 | 0.557 | <900 | 0.94 | 0.94 | 17.02 * | 20.87 * | |
| PSO | 0.291 | 0.459 | 1.447 | 1.710 | 1.455 | 1.451 | 0.383 | 0.511 | <100 | 0.95 | 0.95 | 15.01 * | 18.72 * | |
© 2019 by the authors. Licensee MDPI, Basel, Switzerland. This article is an open access article distributed under the terms and conditions of the Creative Commons Attribution (CC BY) license (http://creativecommons.org/licenses/by/4.0/).
Share and Cite
Kalogiannis, T.; Hosen, M.S.; Sokkeh, M.A.; Goutam, S.; Jaguemont, J.; Jin, L.; Qiao, G.; Berecibar, M.; Van Mierlo, J. Comparative Study on Parameter Identification Methods for Dual-Polarization Lithium-Ion Equivalent Circuit Model. Energies 2019, 12, 4031. https://doi.org/10.3390/en12214031
Kalogiannis T, Hosen MS, Sokkeh MA, Goutam S, Jaguemont J, Jin L, Qiao G, Berecibar M, Van Mierlo J. Comparative Study on Parameter Identification Methods for Dual-Polarization Lithium-Ion Equivalent Circuit Model. Energies. 2019; 12(21):4031. https://doi.org/10.3390/en12214031
Chicago/Turabian StyleKalogiannis, Theodoros, Md Sazzad Hosen, Mohsen Akbarzadeh Sokkeh, Shovon Goutam, Joris Jaguemont, Lu Jin, Geng Qiao, Maitane Berecibar, and Joeri Van Mierlo. 2019. "Comparative Study on Parameter Identification Methods for Dual-Polarization Lithium-Ion Equivalent Circuit Model" Energies 12, no. 21: 4031. https://doi.org/10.3390/en12214031
APA StyleKalogiannis, T., Hosen, M. S., Sokkeh, M. A., Goutam, S., Jaguemont, J., Jin, L., Qiao, G., Berecibar, M., & Van Mierlo, J. (2019). Comparative Study on Parameter Identification Methods for Dual-Polarization Lithium-Ion Equivalent Circuit Model. Energies, 12(21), 4031. https://doi.org/10.3390/en12214031