Methanol Marker for the Detection of Insulating Paper Degradation in Transformer Insulating Oil
Abstract
1. Introduction
2. Methanol Fundamentals
2.1. Methanol Determination
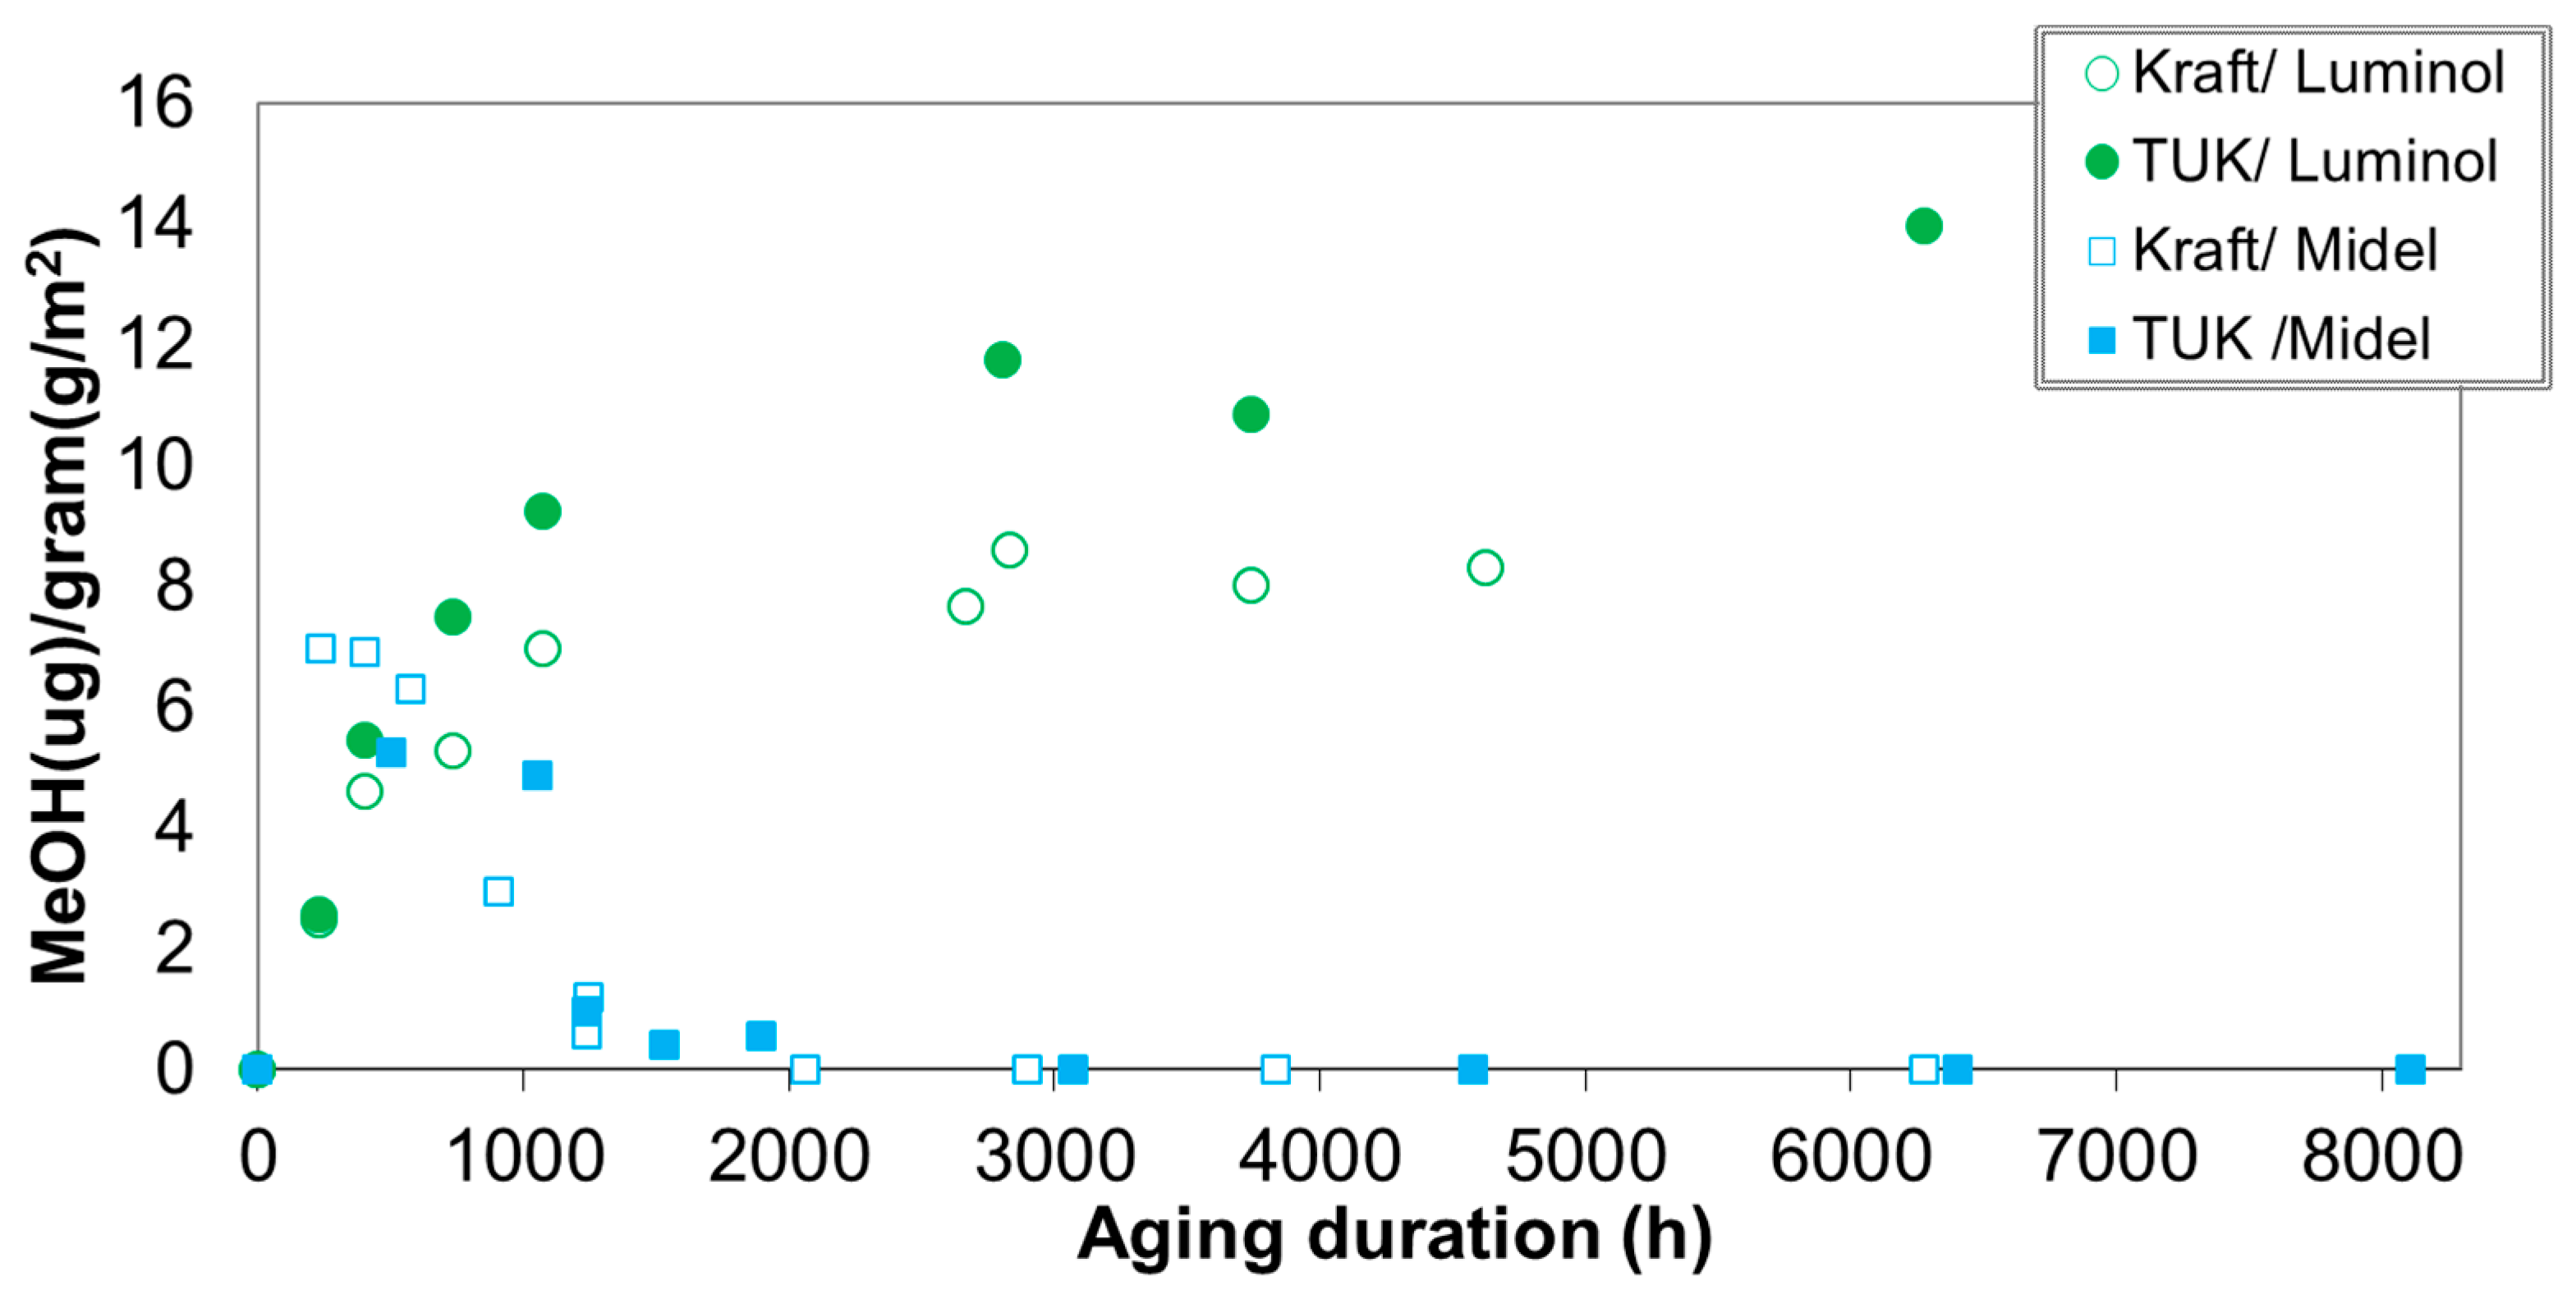
2.2. Laboratory Ageing and Methanol Generation
2.3. Kinetics of Cellulose Depolymerization and Methanol Formation
- internal coherence, tested through dimensional analysis;
- boundary conditions, tested through their limits at t = 0 and t = ∞;
- physical meaning.
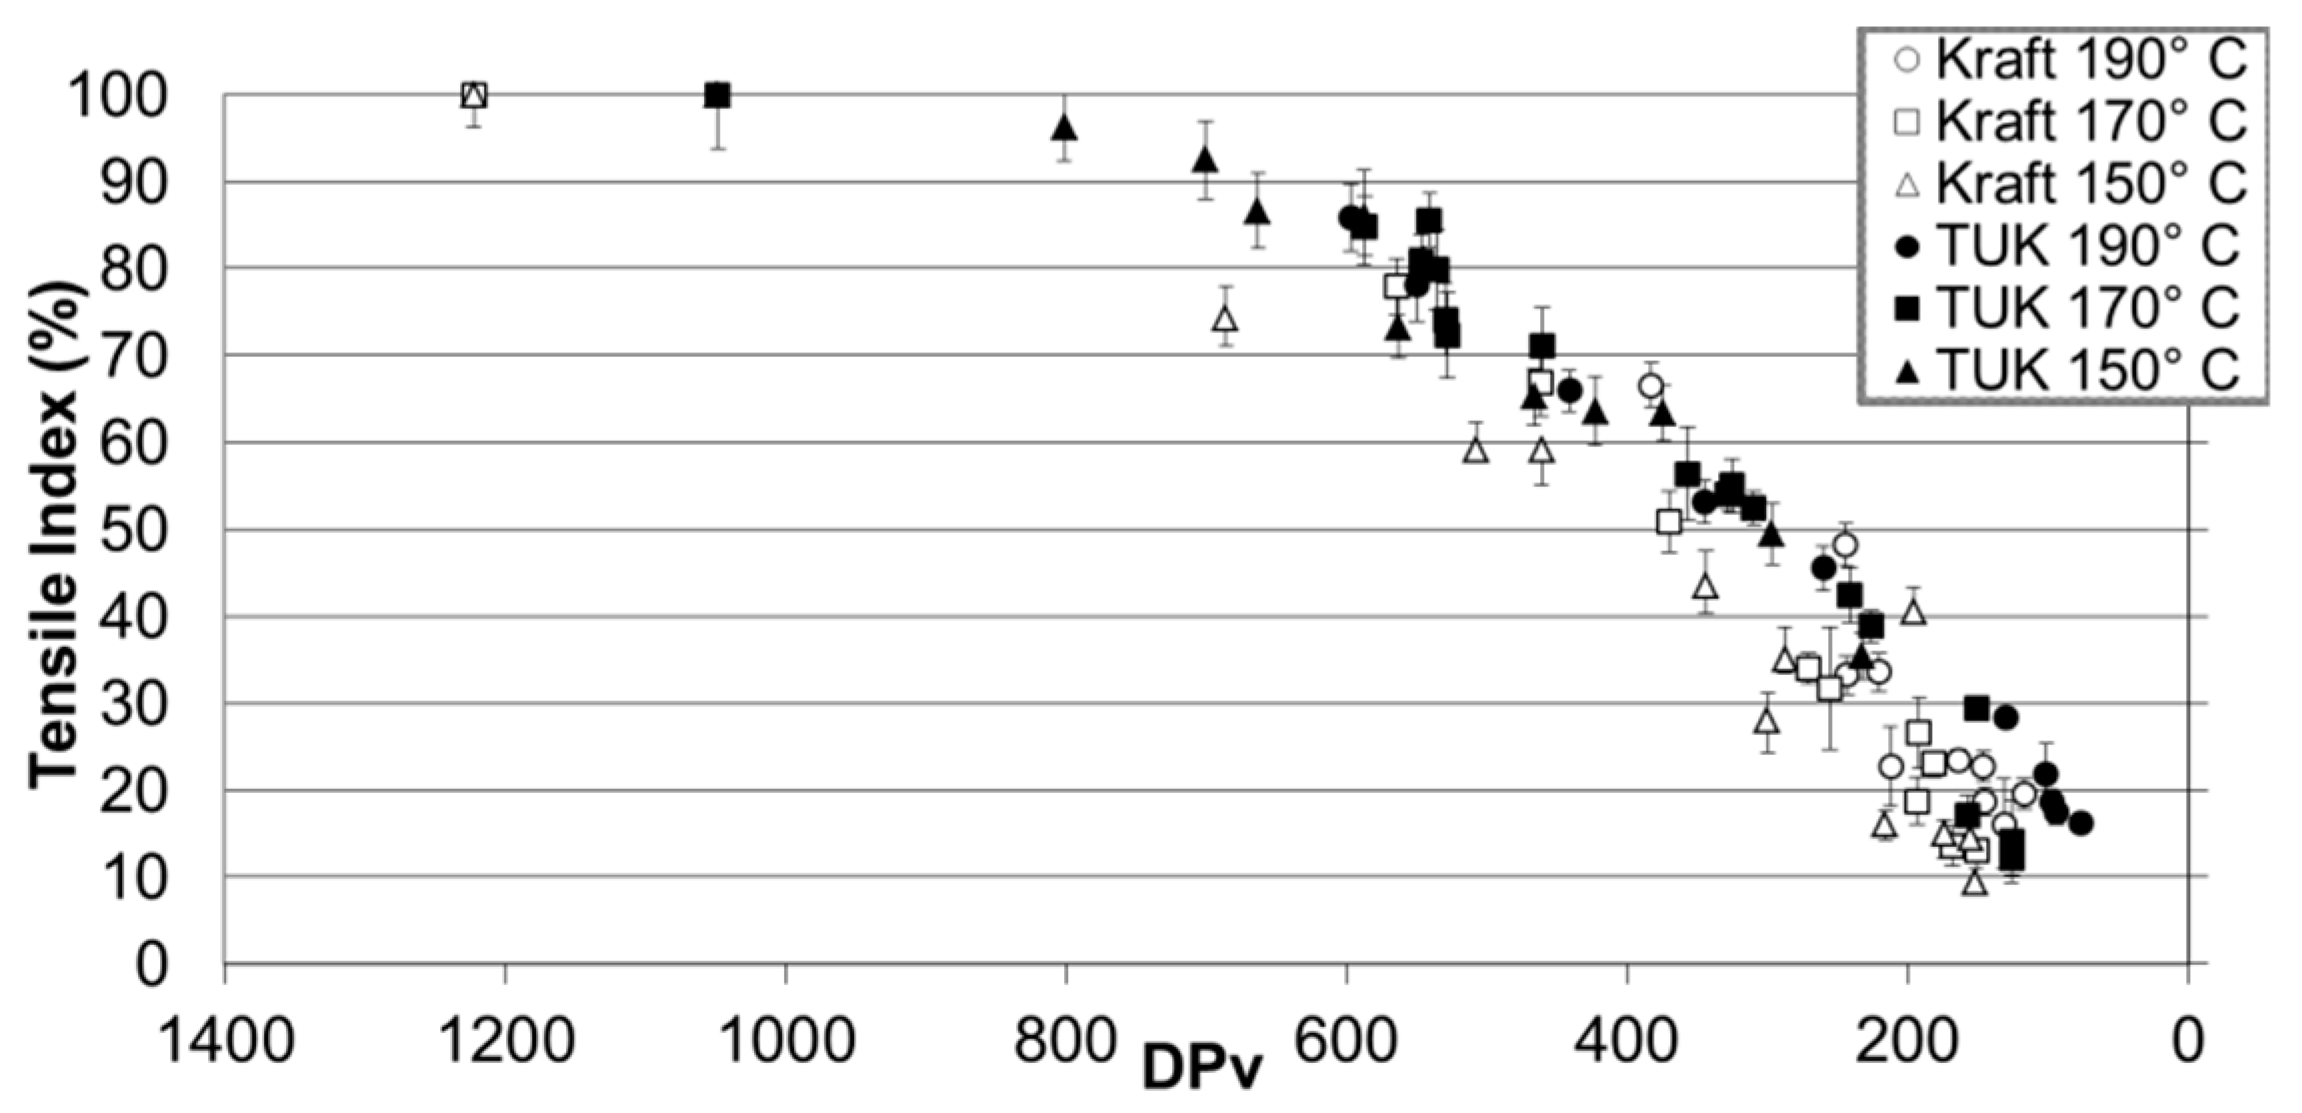
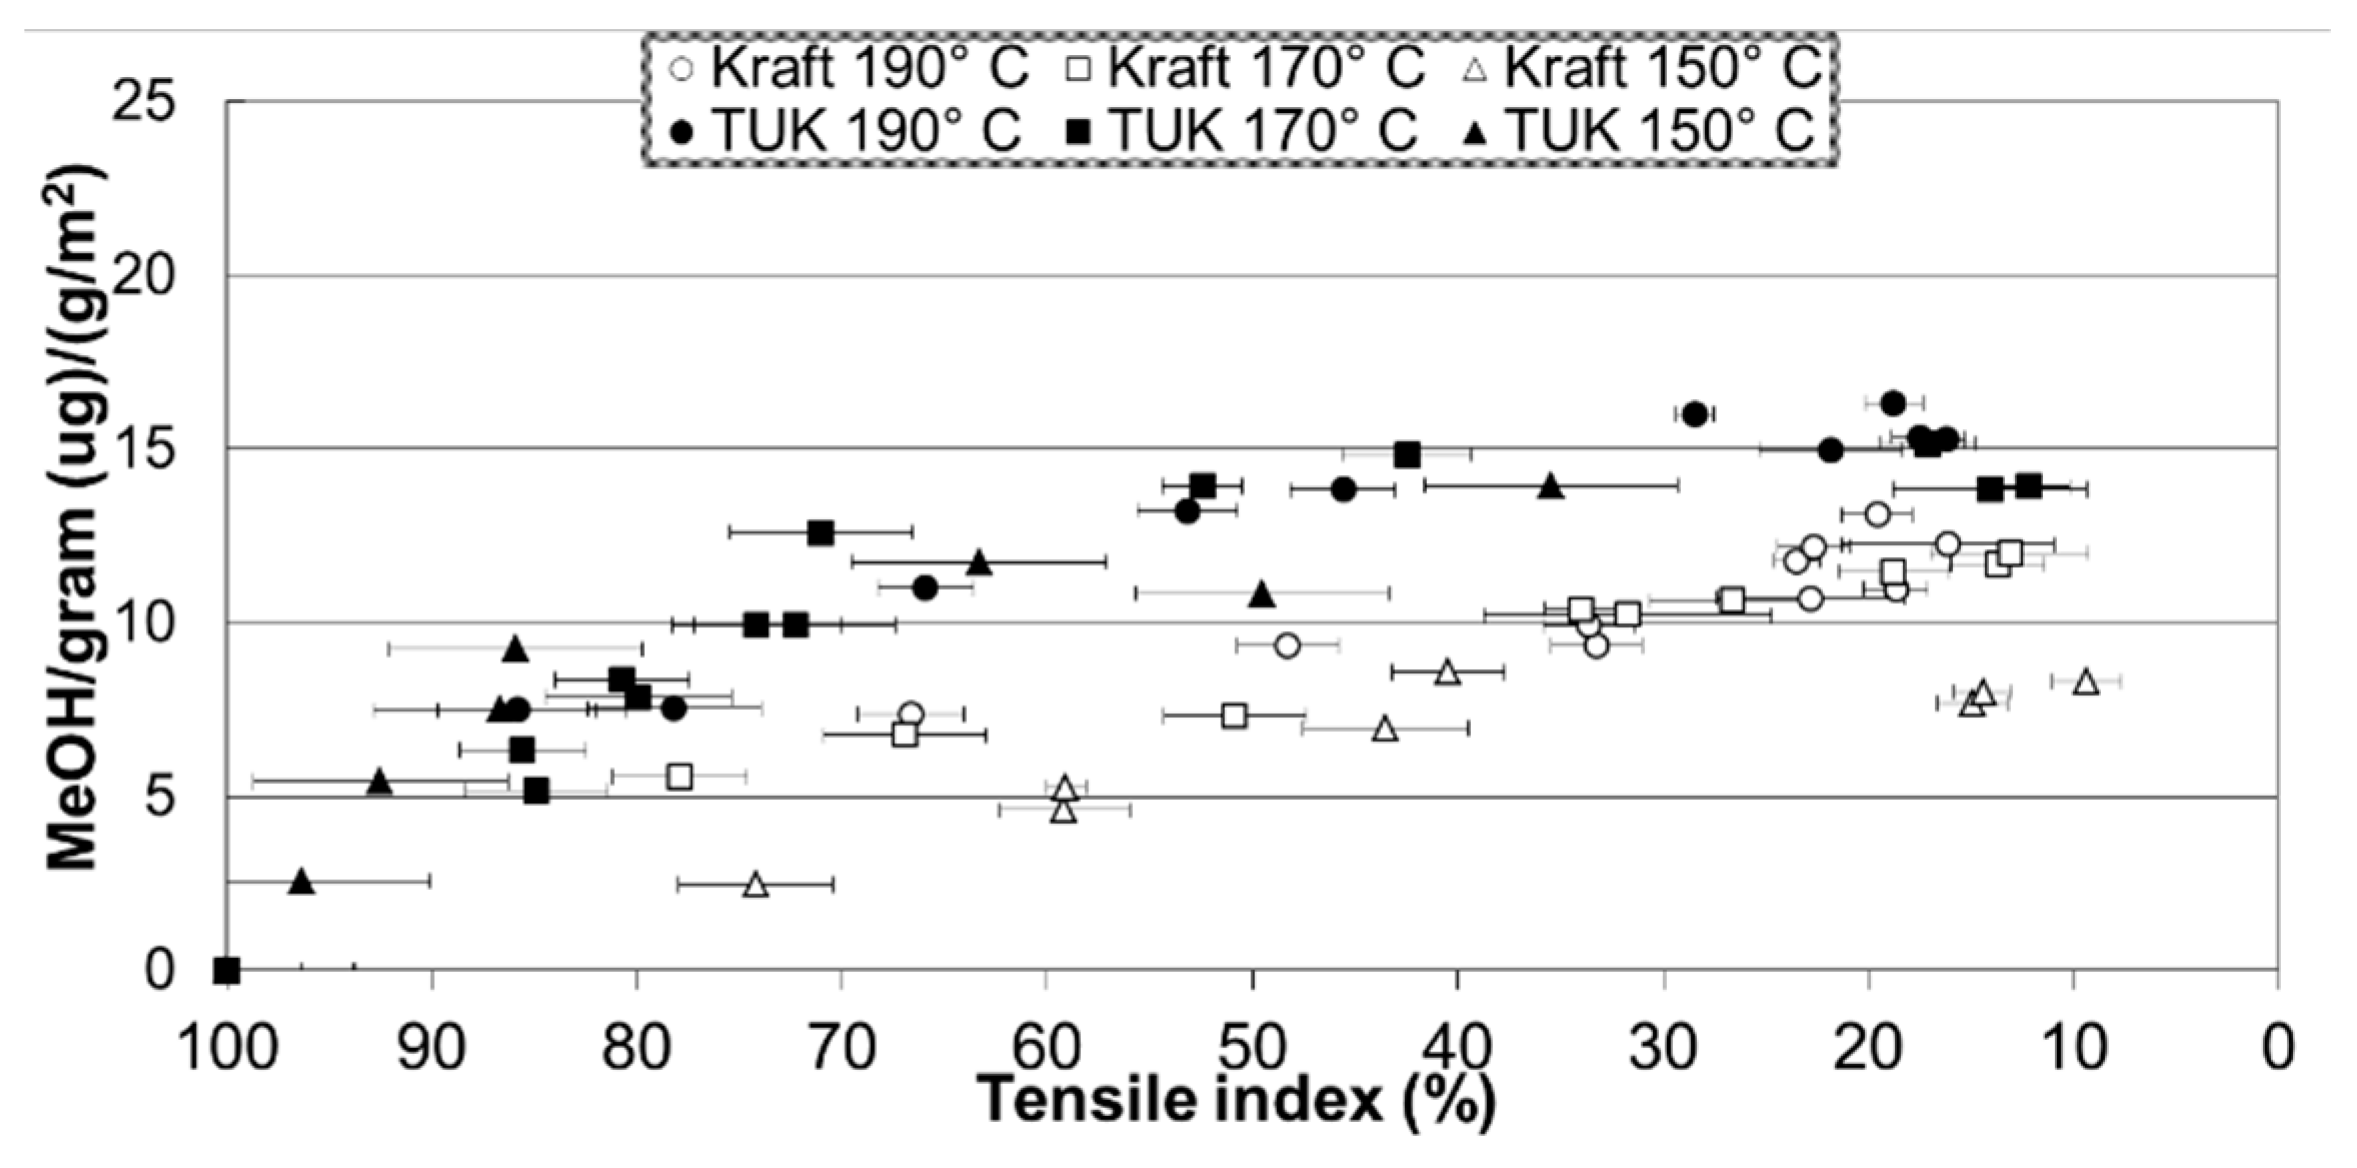
2.4. Paper’s Mechanical Properties and Methanol
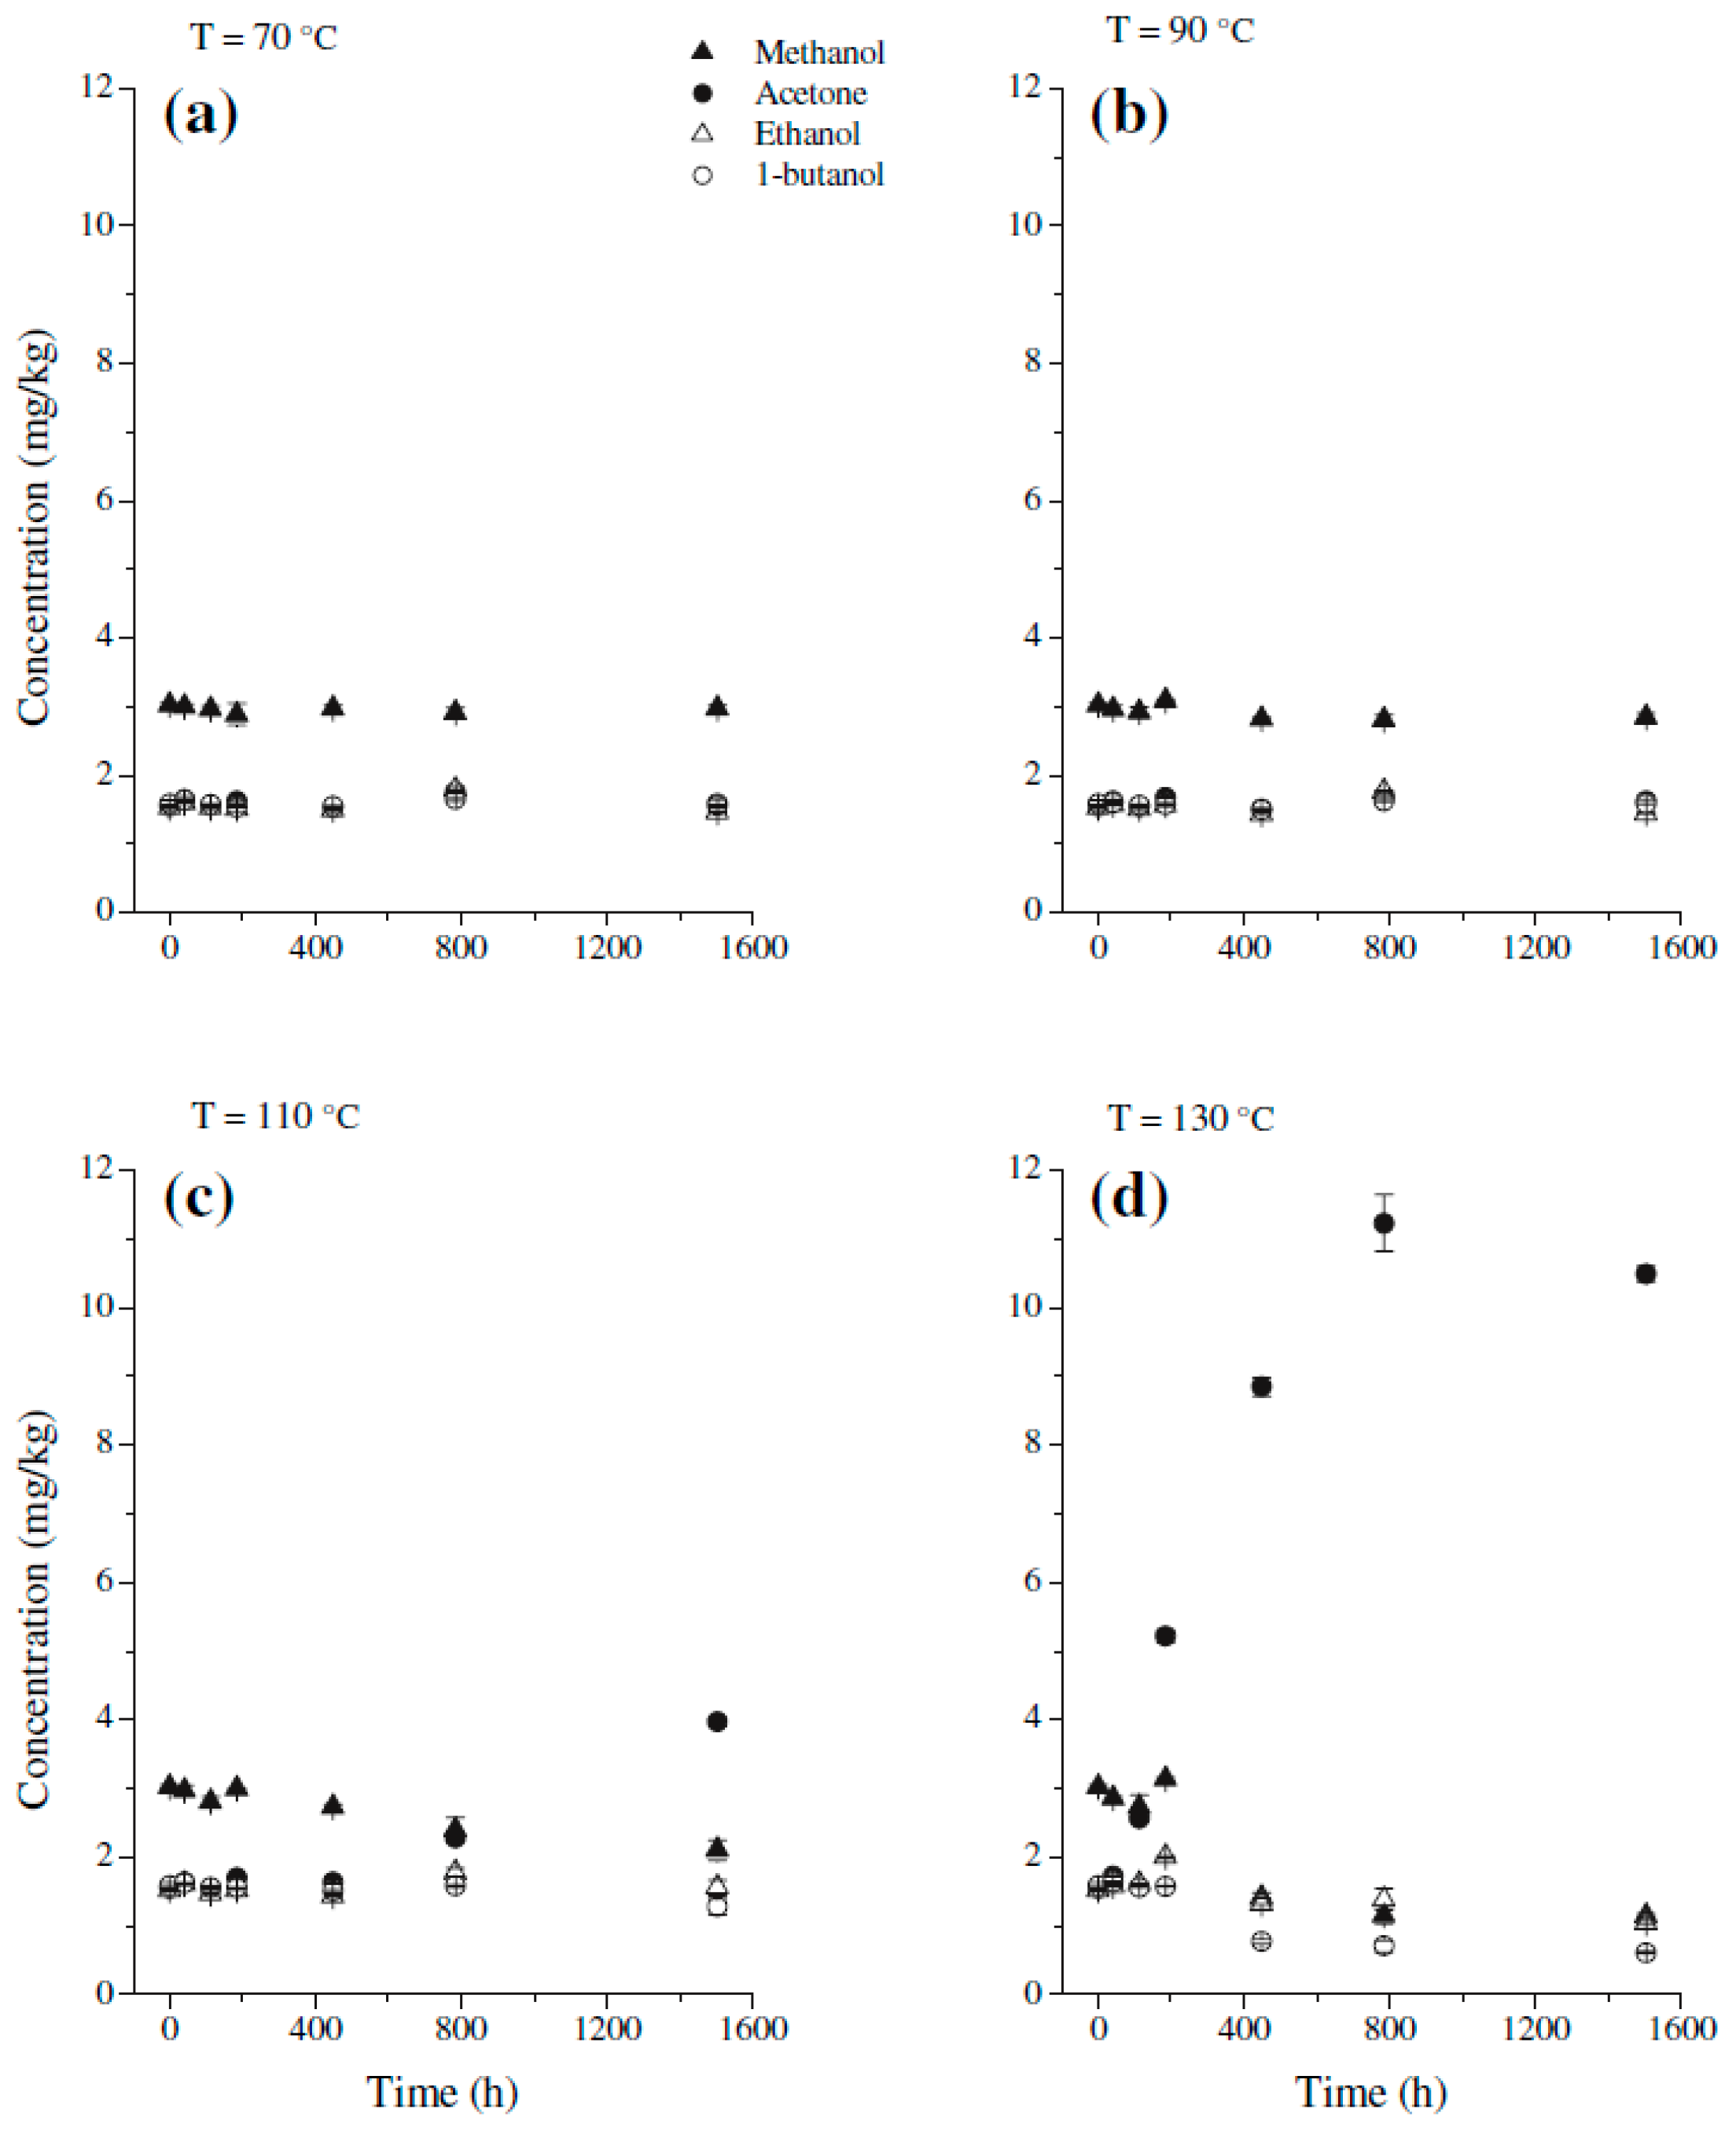
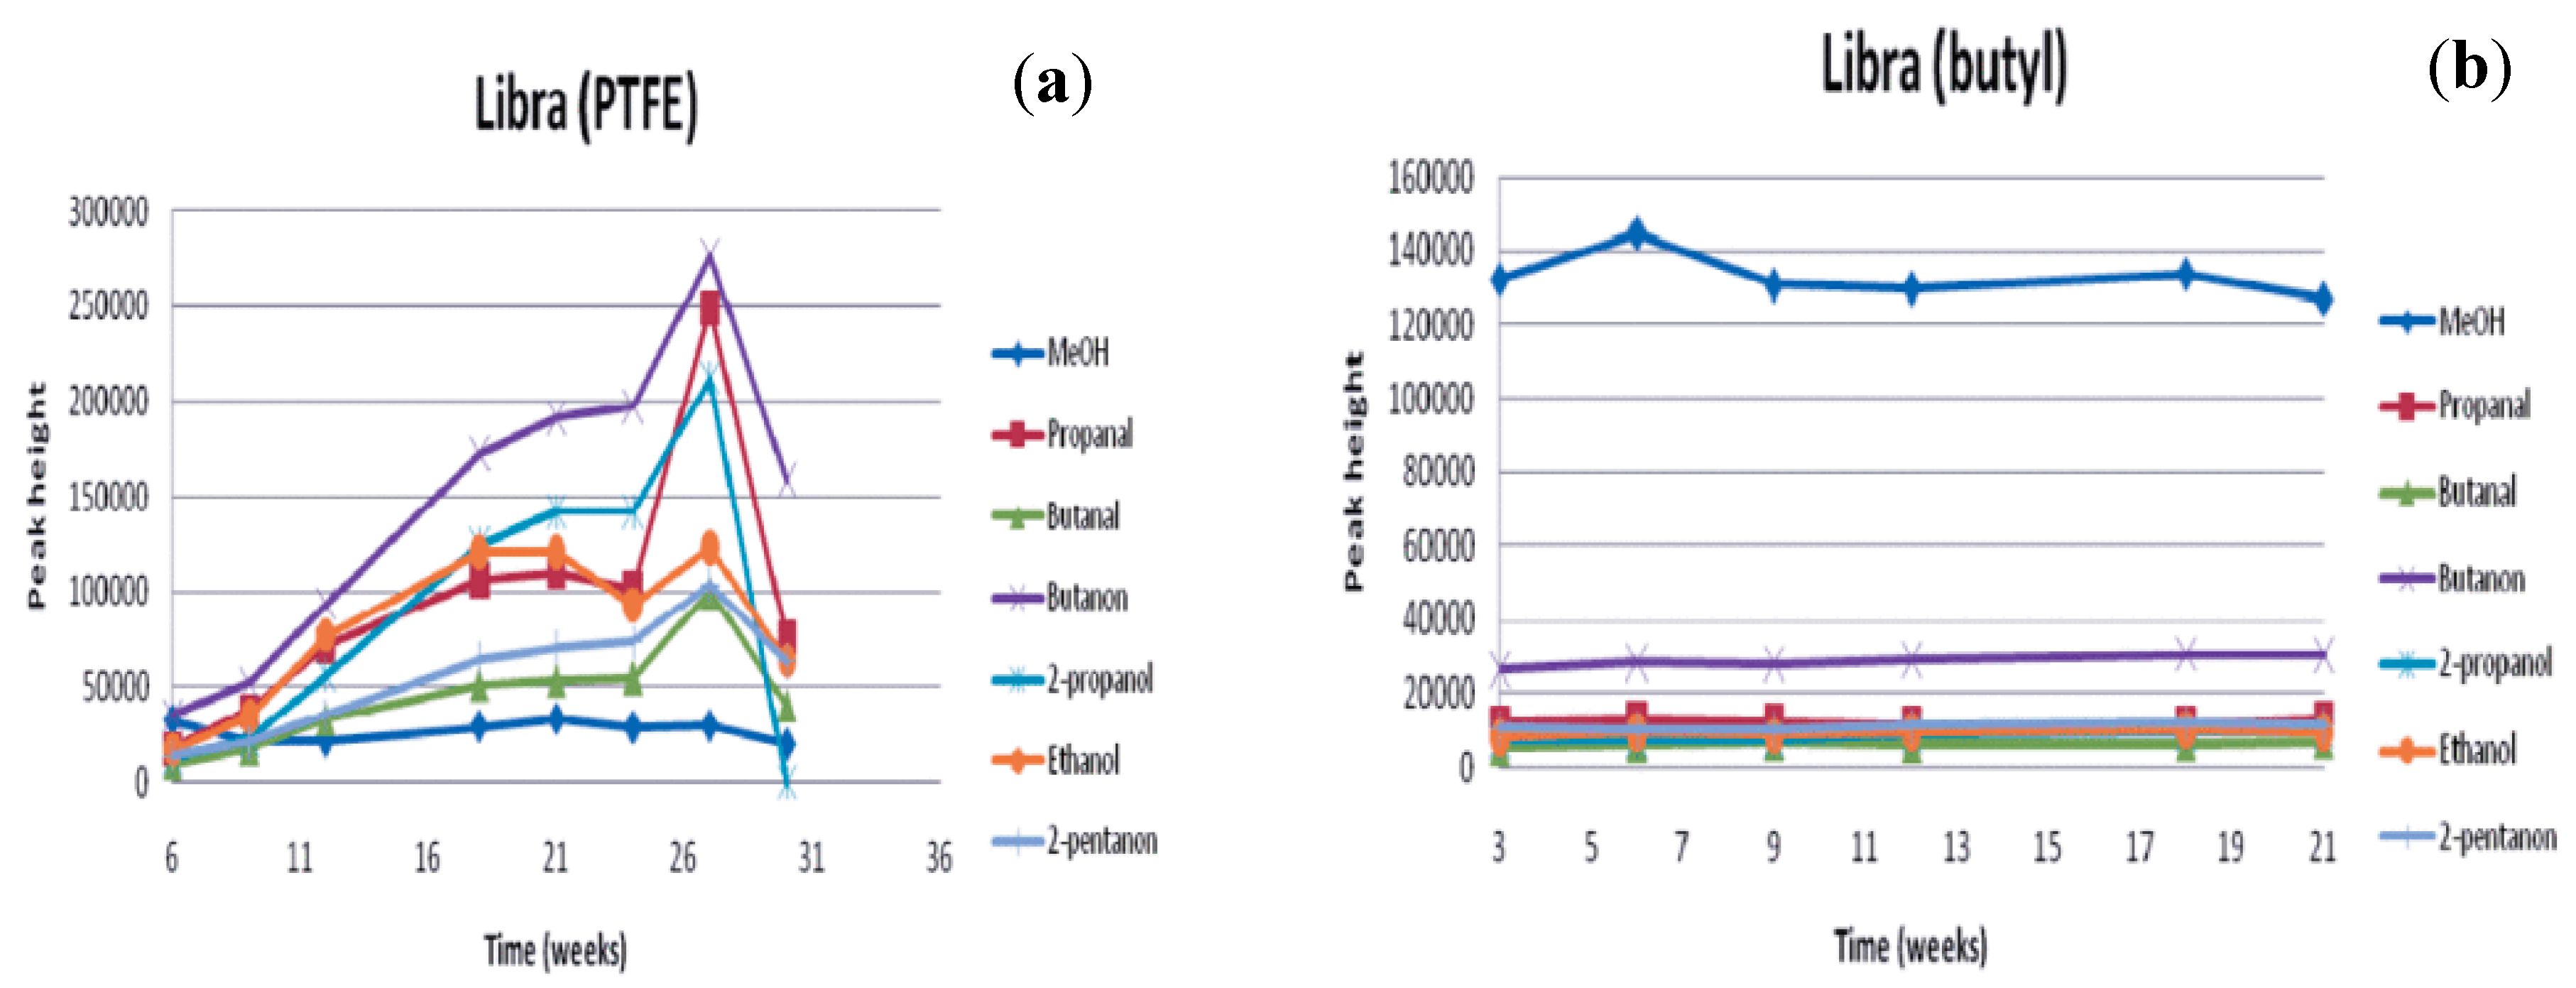
3. Methanol Stability
4. Field Measurements
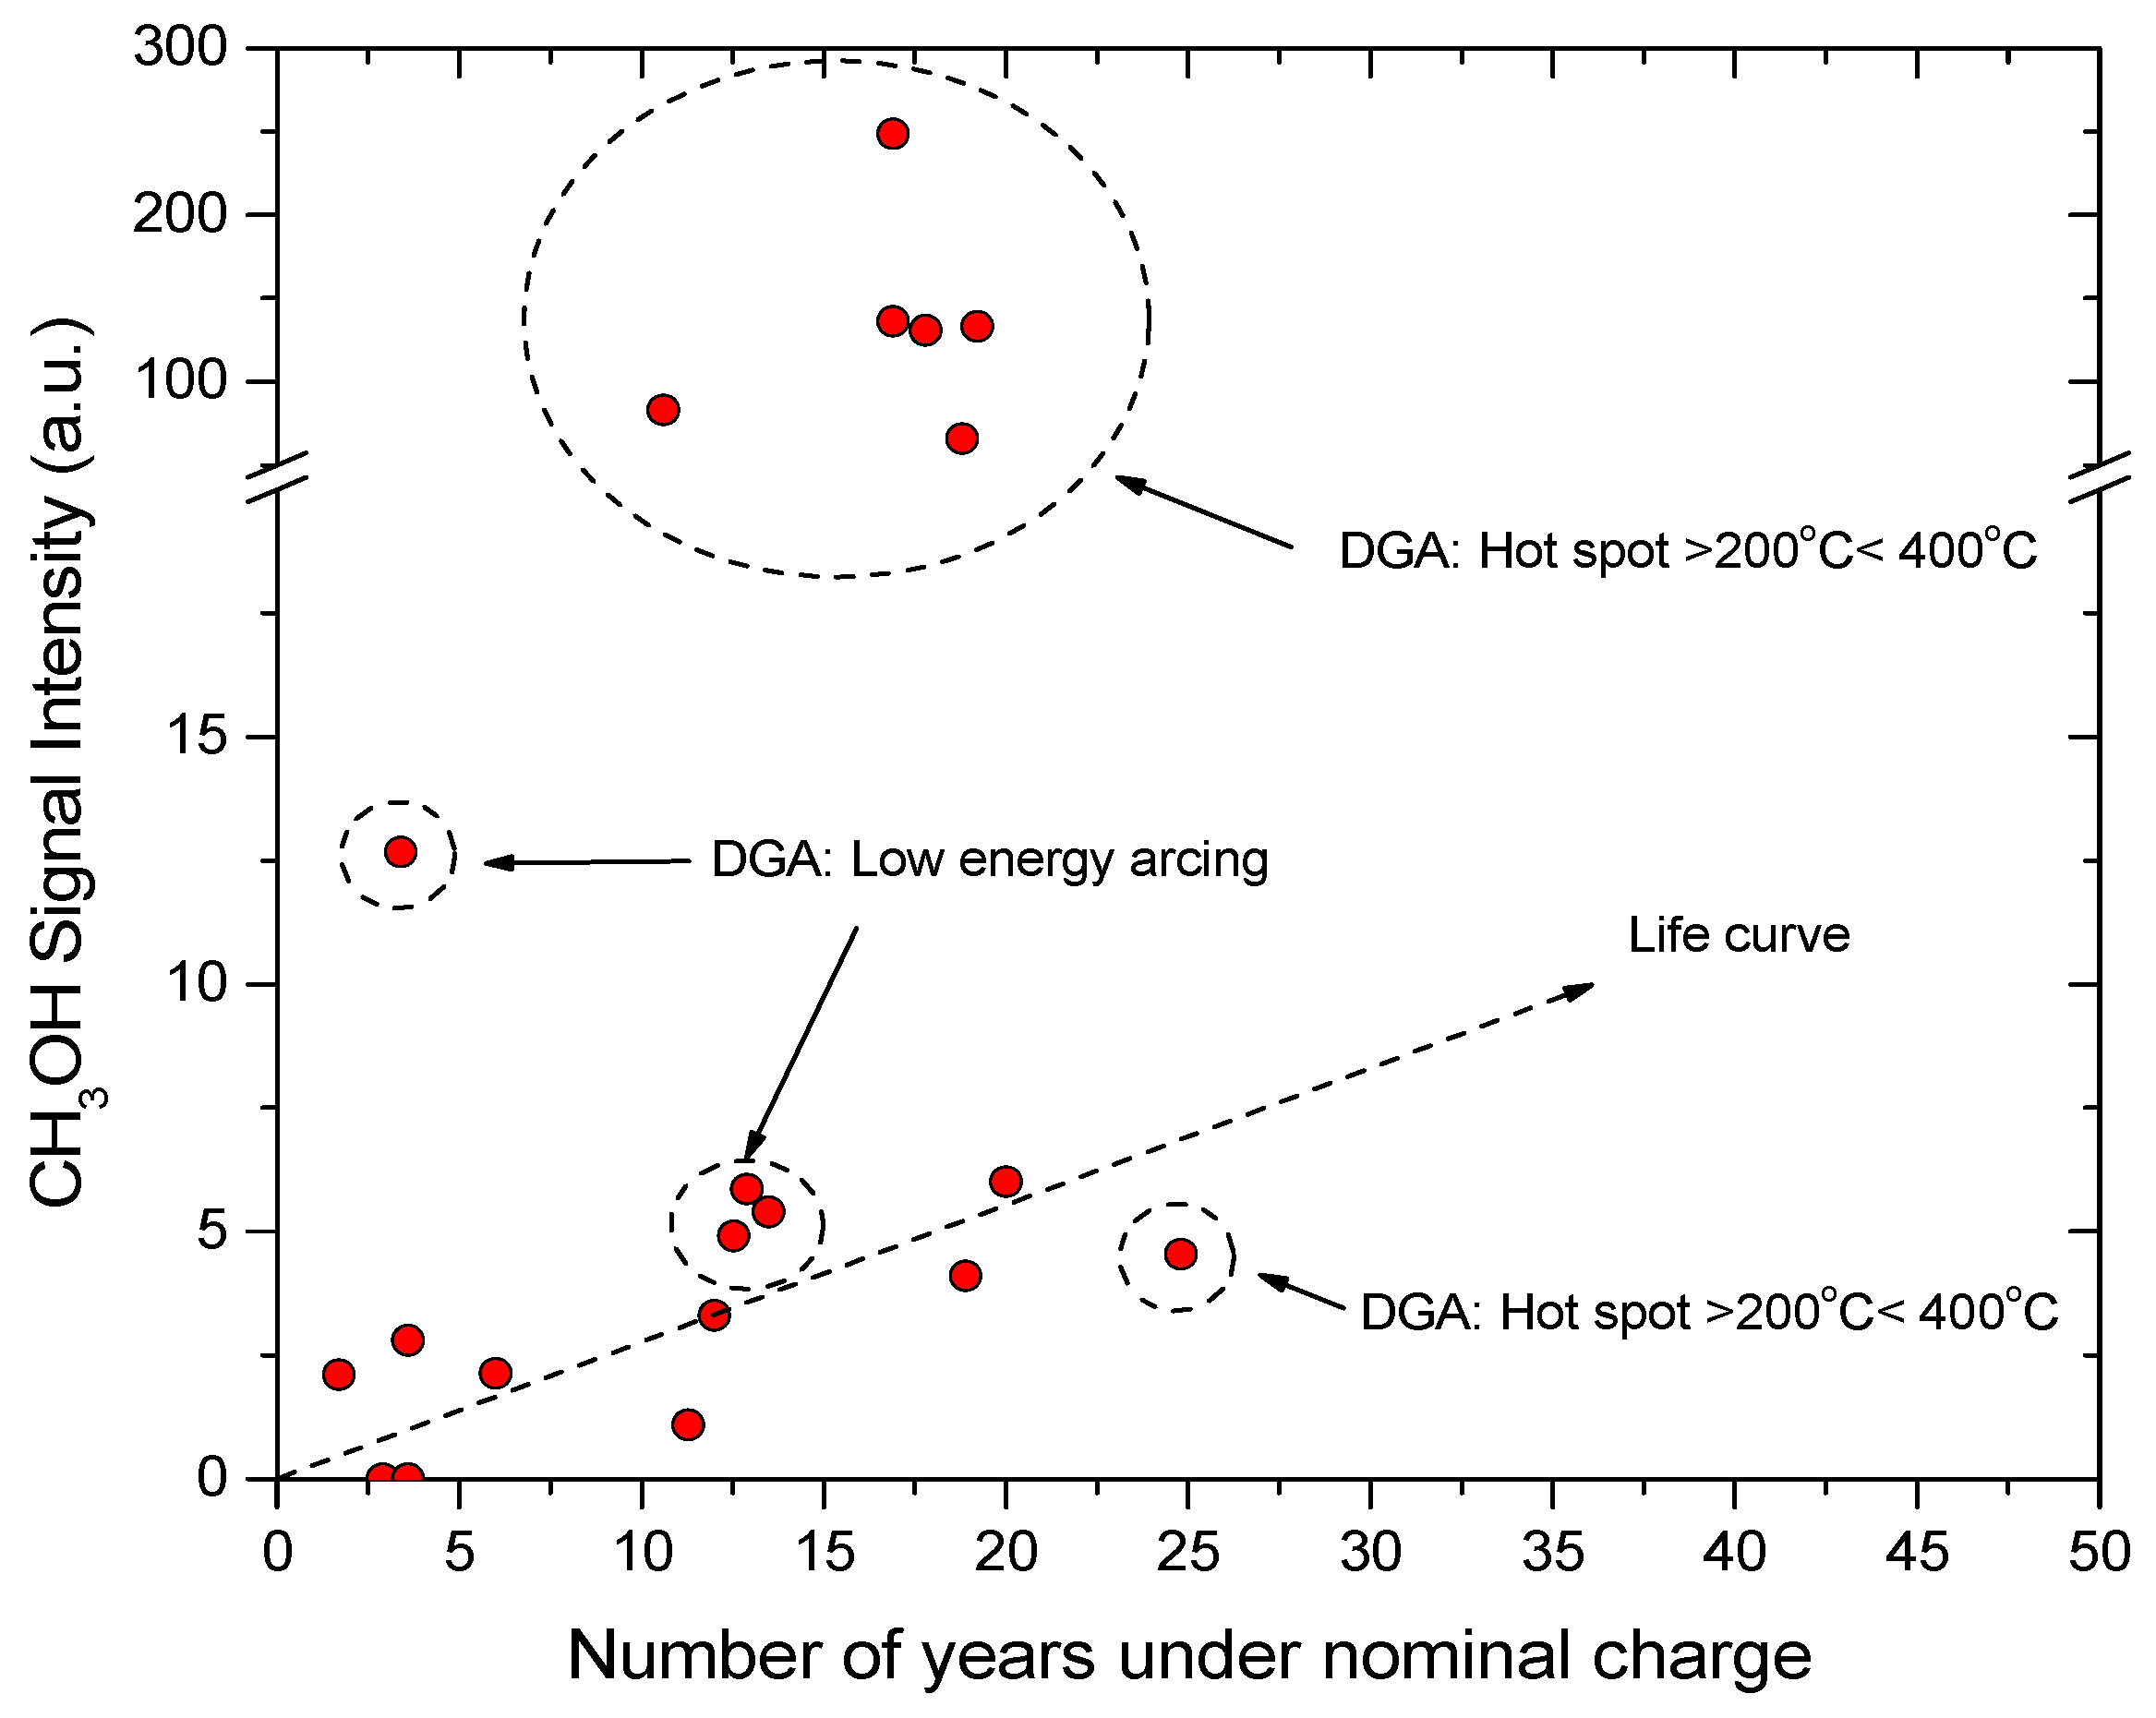
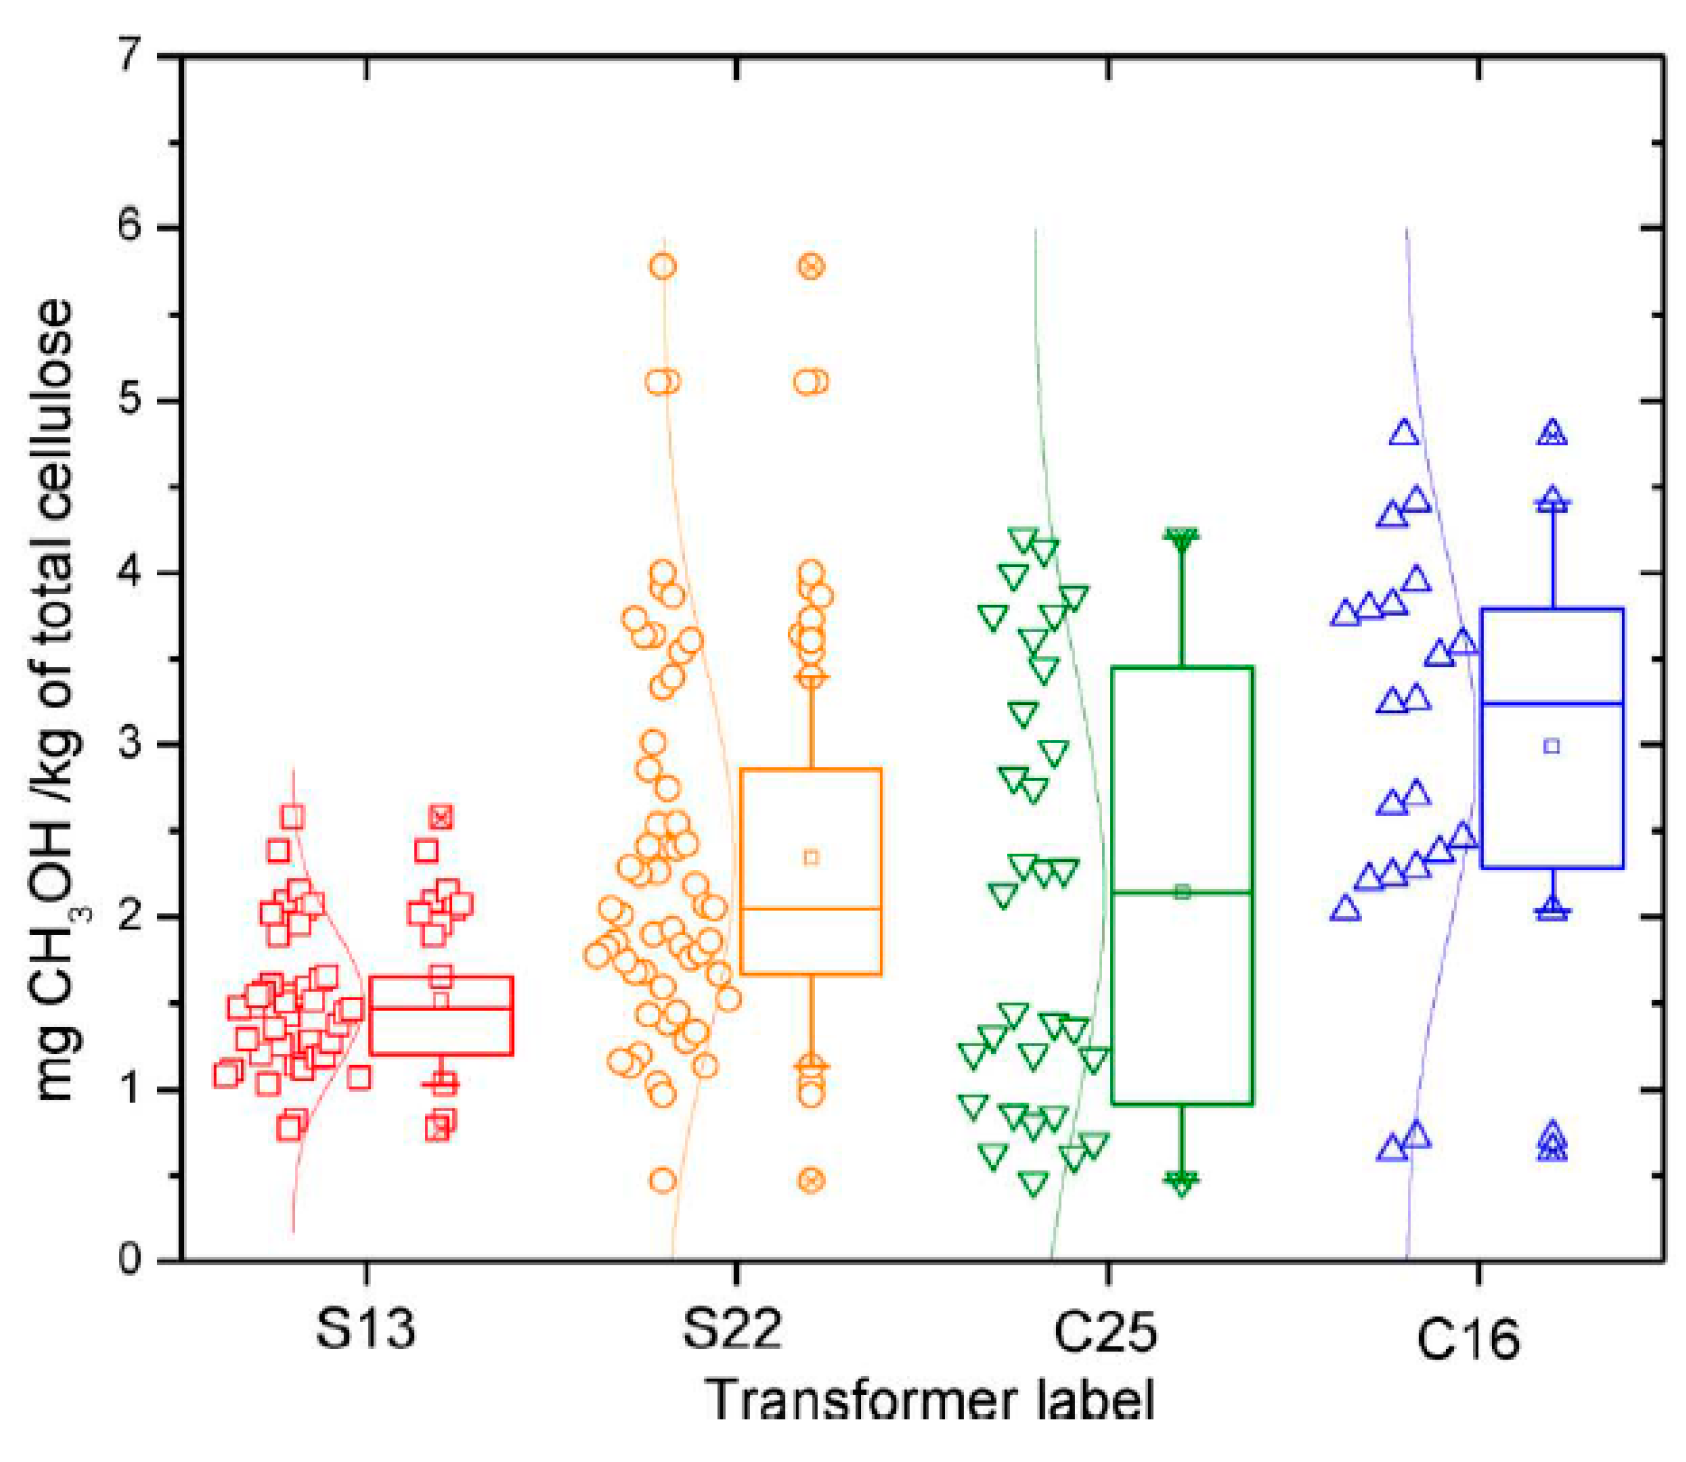
4.1. Power Transformers
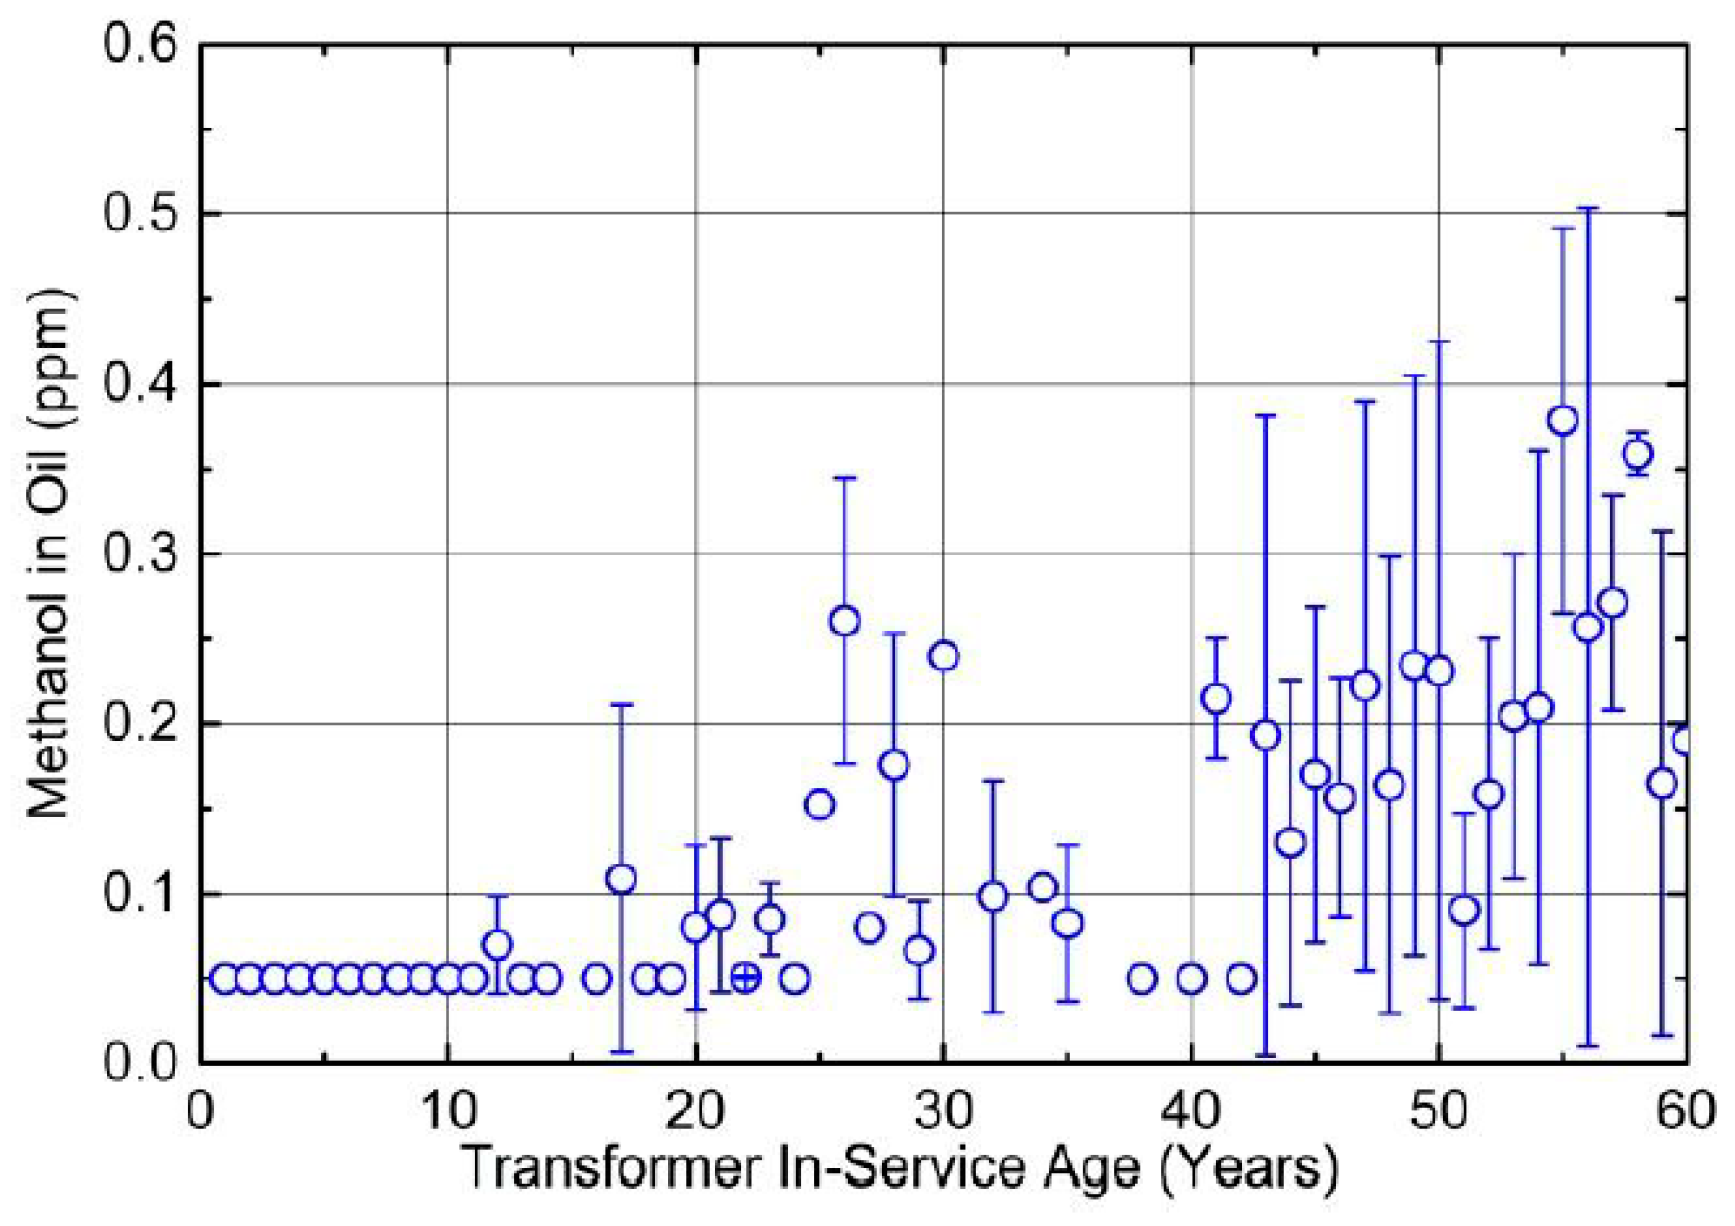
4.2. Distribution Transformers
5. Effect of Transformer Oil Parameters
5.1. Partitioning
5.2. Effect of Transformer Oil Interventions
6. Interpretation Model
7. Normalization
8. The Future of Methanol
Author Contributions
Funding
Conflicts of Interest
References
- Jalbert, J.; Gilbert, R.; Tetreault, P.; Morin, B.; Lessard-Deziel, D. Identification of a chemical indicator of the rupture of 1,4-B-glycosidic bonds of cellulose in an oil impregnated insulating paper system. Cellulose 2007, 14, 295–309. [Google Scholar] [CrossRef]
- Jalbert, J.; Gilbert, R.; Denos, Y.; Gervais, P. Methanol: A Novel Approach to Power Transformer Asset Management. IEEE Trans. Power Deliv. 2012, 27, 514–520. [Google Scholar] [CrossRef]
- Jalbert, J.; Besner, S. Methanol as a chemical indicator of insulating paper ageing in power transformers. In Advanced Monitoring and Modelling Methods for Power Transformer Asset Management. Eur. J. Electr. Eng. 2010, 13, 591–620. [Google Scholar]
- Schaut, A.; Autru, S.; Eeckhoudt, S. Applicability of methanol as new marker for paper degradation in power transformers. IEEE Trans. Dielectr. Electr. Insul. 2011, 18, 533–540. [Google Scholar] [CrossRef]
- Matharage, S.Y.; Liu, Q.; Wang, Z.D. Aging assessment of kraft paper insulation through methanol in oil measurement. IEEE Trans. Dielectr. Electr. Insul. 2016, 23, 1589–1596. [Google Scholar] [CrossRef]
- Matharage, S.Y.; Liu, Q.; Wang, Z.D.; Wilson, G.; Krause, C. Aging assessment of synthetic ester impregnated thermally non-upgraded kraft paper through chemical markers in oil. IEEE Trans. Dielectr. Electr. Insul. 2018, 25, 507–515. [Google Scholar] [CrossRef]
- Bertrand, Y.; Tran-Duy, C.; Murin, V.; Annelore, S.; Stijn, A.; Eeckhoudt, S. MV/LV distribution transformers: Research on paper ageing markers. In Proceedings of the CIGRE 2012, Paris, France, 26–31 August 2012. [Google Scholar]
- Perrier, C.; Molle-Epain, C.; Coulibaly, M.-L.; Vigneron, V.; Minniti, X.; Michellon, C. Methanol as promising tool for lifetime management of cellulosic insulation. In Proceedings of the MatPost, Lyon, France, 25 November 2015. [Google Scholar]
- Perrier, C.; Coulibaly, M.L.; Marugan, M. Methanol as new ageing marker of oil-filled transformer insulation. In Proceedings of the 23rd International Conference on Electricity Distribution, Lyon, France, 15–18 June 2015. [Google Scholar]
- Coulibaly, M.L.; Perrier, C.; Marugan, M. Assesment of Methanol as cellulose aging marker in mineral and ester oil. In Proceedings of the CIGRE, Paris, France, 21–26 August 2016. [Google Scholar]
- Matharage, S.Y.; Liu, Q.; Wang, Z.D.; Wilson, G.; Dyer, P.; Mavrommatis, P. Generation of methanol and ethanol from inhibited mineral oil. In Proceedings of the 2017 INSUCON-13th International Electrical Insulation Conference (INSUCON), Birmingham, UK, 16–18 May 2017; pp. 1–4. [Google Scholar]
- Rodriguez-Celis, E.; Jalbert, J.; Duchesne, S.; Noirhomme, B.; Lessard, M.; Ryadi, M. Chemical markers use for the diagnosis and life estimation of power transformers: A preliminary study of their origins. In Proceedings of the CIGRÉ Canada Conference, Montreal, QC, Canada, 24–26 September 2012. [Google Scholar]
- Mohamed Ryadi, A.T.; Jalbert, J.; Rajotte, C. Alcohols based ageing chemical markers for the diagnosis of transformer cellulosic insulation. In Proceedings of the Cigre SC A2 & D1 Joint Colloquium, Kyoto, Japan, 11–16 September 2011. [Google Scholar]
- Ryadi, M.; Jalbert, J.; Lessard, M.-C. Power Transformers Aging Diagnostic: Methanol from the Lab to the Field. In Proceedings of the TechCon North America 2017, Houston, TX, USA, 14–16 February 2017. [Google Scholar]
- On behalf of CIGRE JWG A2/D1.46. Field Experience with Transformer Solid Insulation Ageing Markers, CIGRE Technical Brochure. Accepted for publication. 2019.
- On behalf of IEC TC10 WG 63025. Quantitative Determination of Methanol and Other Light Alcohols in Insulating Liquids-Part 1: Method for Mineral Insulating Oils-Part 2: Method for Non Mineral Insulating Liquids International Electrotechnical Commission (IEC). to be published.
- On behalf of ASTM WG D27 WK30948. American Society for Testing and Materials, The Determination of Methanol and Ethanol in Electrical Insulating Liquids by Headspace (HS)-Gas Chromatography (GC) Using Mass Spectrometry (MS) or Flame Ionization Detection (FID). ASTM, Standard under ballot process.
- Bruzzoniti, M.C.; Maina, R.; De Carlo, R.M.; Sarzanini, C.; Tumiatti, V. GC methods for the determination of methanol and ethanol in insulating mineral oils as markers of cellulose degradation in power transformers. Chromatographia 2014, 77, 1081–1089. [Google Scholar] [CrossRef]
- Jalbert, J.; Duchesne, S.; Rodriguez-Celis, E.; Tétreault, P.; Collin, P. Robust and sensitive analysis of methanol and ethanol from cellulose degradation in mineral oils. J. Chromatogr. A 2012, 1256, 240–245. [Google Scholar] [CrossRef]
- Molavi, H.; Yousefpour, A.; Mirmostafa, A.; Sabzi, A.; Hamedi, S.; Narimani, M.; Abdi, N. Static Headspace GC/MS Method for Determination of Methanol and Ethanol Contents, as the Degradation Markers of Solid Insulation Systems of Power Transformers. Chromatographia 2017, 80, 1129–1135. [Google Scholar] [CrossRef]
- Matharage, S.Y.; Liu, Q.; Davenport, E.; Wilson, G.; Walker, D.; Wang, Z.D. Methanol detection in transformer oils using gas chromatography and ion trap mass spectrometer. In Proceedings of the 2014 IEEE 18th International Conference on Dielectric Liquids (ICDL), Manchester, UK, 29 June–3 July 2014; pp. 1–4. [Google Scholar]
- Skoog, D.A.; Holler, F.J.; Crouch, S.R. Principles of Instrumental Analysis; Cengage Learning: Boston, MA, USA, 2007. [Google Scholar]
- Arroyo-Fernández, O.H.; Fofana, I.; Jalbert, J.; Gagnon, S.; Rodriguez-Celis, E.; Duchesne, S.; Ryadi, M. Aging characterization of electrical insulation papers impregnated with synthetic ester and mineral oil: Correlations between mechanical properties, depolymerization and some chemical markers. IEEE Trans. Dielectr. Electr. Insul. 2018, 25, 217–227. [Google Scholar] [CrossRef]
- Schaut, A.; Autru, S.; Eeckhoudt, S. Applicability of methanol as early stage paper degradation marker. In Proceedings of the CIGRE, Kyoto, Japan, 11–16 September 2011. [Google Scholar]
- Jalbert, J.; Lacasse, R.; El Khakani, M.A.; Gilbert, R. Accelerated ageing of wood Kraft insulating paper by means of a pulsed KrF excimer laser radiation. Appl. Phys. A 2005, 81, 57–63. [Google Scholar] [CrossRef]
- Jalbert, J.; Lacasse, R.; El Khakani, M.A.; Gilbert, R. Pulsed KrF excimer laser induced degradation of cellulose based insulating paper. Cellulose 2009, 16, 863–876. [Google Scholar] [CrossRef]
- Gilbert, R.; Jalbert, J.; Tétreault, P.; Morin, B.; Denos, Y. Kinetics of the production of chain-end groups and methanol from the depolymerization of cellulose during the ageing of paper/oil systems. Part 1: Standard wood kraft insulation. Cellulose 2009, 16, 327–338. [Google Scholar] [CrossRef]
- Gilbert, R.; Jalbert, J.; Duchesne, S.; Tétreault, P.; Morin, B.; Denos, Y. Kinetics of the production of chain-end groups and methanol from the depolymerization of cellulose during the ageing of paper/oil systems. Part 2: Thermally-upgraded insulating papers. Cellulose 2010, 17, 253–269. [Google Scholar] [CrossRef]
- Jalbert, J.; Rodriguez-Celis, E.; Duchesne, S.; Morin, B.; Ryadi, M.; Gilbert, R. Kinetics of the production of chain-end groups and methanol from the depolymerization of cellulose during the ageing of paper/oil systems. Part 3: Extension of the study under temperature conditions over 120 °C. Cellulose 2015, 22, 829–848. [Google Scholar] [CrossRef]
- Arroyo, O.H.; Jalbert, J.; Fofana, I.; Ryadi, M. Temperature dependence of methanol and the tensile strength of insulation paper: Kinetics of the changes of mechanical properties during ageing. Cellulose 2017, 24, 1031–1039. [Google Scholar] [CrossRef]
- Ekenstam, A. Über das Verhalten der Cellulose in Mineralsäure-Lösungen, II. Mitteil.: Kinetisches Studium des Abbaus der Cellulose in Säure-Lösungen. Ber. Dtsch. Chem. Ges. 1936, 69, 553–559. [Google Scholar] [CrossRef]
- Calvini, P. The role of the Ekenstam equation on the kinetics of cellulose hydrolytic degradation. Cellulose 2012, 19, 313–318. [Google Scholar] [CrossRef]
- Calvini, P. On the meaning of the Emsley, Ding & Wang and Calvini equations applied to the degradation of cellulose. Cellulose 2014, 21, 1127–1134. [Google Scholar] [CrossRef]
- Emsley, A.M.; Heywood, R.J.; Ali, M.; Eley, C.M. On the kinetics of degradation of cellulose. Cellulose 1997, 4, 1–5. [Google Scholar] [CrossRef]
- Ding, H.Z.; Wang, Z.D. On the degradation evolution equations of cellulose. Cellulose 2008, 15, 205–224. [Google Scholar] [CrossRef]
- Calvini, P.; Gorassini, A.; Merlani, A.L. On the kinetics of cellulose degradation: Looking beyond the pseudo zero order rate equation. Cellulose 2008, 15, 193–203. [Google Scholar] [CrossRef]
- Calvini, P. Comments on the article “On the degradation evolution equations of cellulose” by Hongzhi Ding and Zhongdong Wang. Cellulose 2008, 15, 225–228. [Google Scholar] [CrossRef]
- Calvini, P.; Gorassini, A. On the Rate of Paper Degradation: Lessons from the Past. Restaurator 2006, 27, 275–290. [Google Scholar] [CrossRef]
- Calvini, P.; Gorassini, A. Surface and bulk reactions of cellulose oxidation by periodate. A simple kinetic model. Cellulose 2012, 19, 1107–1114. [Google Scholar] [CrossRef]
- De Pablo, A. Furfural and ageing: How are they related. In Proceedings of the IEE Colloquium on Insulating Liquids, Leatherhead, UK, 27 May 1999; p. 5. [Google Scholar]
- Hill, D.J.T.; Le, T.T.; Darveniza, M.; Saha, T. A study of degradation of cellulosic insulation materials in a power transformer. Part 2: Tensile strength of cellulose insulation paper. Polym. Degrad. Stab. 1995, 49, 429–435. [Google Scholar] [CrossRef]
- McNutt, W. Insulation thermal life considerations for transformer loading guides. IEEE Trans. Power Deliv. 1992, 7, 392–401. [Google Scholar] [CrossRef]
- Oommen, T.V.; Prevost, T.A. Cellulose insulation in oil-filled power transformers: Part II maintaining insulation integrity and life. IEEE Electr. Insul. Mag. 2006, 22, 5–14. [Google Scholar] [CrossRef]
- Duval, M.; Pablo, A.D.; Atanasova-Hoehlein, I.; Grisaru, M. Significance and detection of very low degree of polymerization of paper in transformers. IEEE Electr. Insul. Mag. 2017, 33, 31–38. [Google Scholar] [CrossRef]
- Shroff, D.H.; Stannett, A.W. A review of paper aging in power transformers. IEE Proc. C 1985, 132, 312–319. [Google Scholar] [CrossRef]
- Emsley, A.M.; Heywood, R.J.; Ali, M.; Xiao, X. Degradation of cellulosic insulation in power transformers 4. Effects of ageing on the tensile strength of paper. IEE Proc. Sci. Meas. Technol. 2000, 147, 285–290. [Google Scholar] [CrossRef]
- He, J. Quantitative Study of Paper Structure at the Fibre Level for Development of a Model for the Tensile Strength of Paper. Ph.D. Thesis, Monash University, Melbourne, Australia, 2005. [Google Scholar]
- Cox, H.L. The elasticity and strength of paper and other fibrous materials. Br. J. Appl. Phys. 1952, 3, 72. [Google Scholar] [CrossRef]
- Shen, B. Variation in the Local Structure and Properties of Paper. Ph.D. Thesis, University of Toronto, Toronto, ON, Canada, 2000. [Google Scholar]
- Kortschot, M. The role of the fiber in the structural hierarchy of paper. In Proceedings of the 11th Fundamentals of Papermaking Materials Transactions of the Fundamental Research Symposium, Cambridge, UK, 21–26 September 1997; pp. 351–399. [Google Scholar]
- Dodson, C.T.J. The nature of bonds in paper and the behaviour of paper under mechanical strain. Rep. Prog. Phys. 1970, 33, 1. [Google Scholar] [CrossRef]
- Lundgaard, L.E.; Hansen, W.; Linhjell, D.; Painter, T.J. Aging of oil-impregnated paper in power transformers. IEEE Trans. Power Deliv. 2004, 19, 230–239. [Google Scholar] [CrossRef]
- Kato, K.; Cameron, R. A review of the relationship between thermally-accelerated ageing of paper and hornification. Cellulose 1999, 6, 23–40. [Google Scholar] [CrossRef]
- Diniz, J.F.; Gil, M.; Castro, J. Hornification—Its origin and interpretation in wood pulps. Wood Sci. Technol. 2004, 37, 489–494. [Google Scholar] [CrossRef]
- Darveniza, M.; Saha, T.K.; Hill, D.J.T.; Le, T.T. Investigations into effective methods for assessing the condition of insulation in aged power transformers. IEEE Trans. Power Deliv. 1998, 13, 1214–1223. [Google Scholar] [CrossRef]
- ASTM. ASTM D202 Standard Test Methods for Sampling and Testing Untreated Paper Used for Electrical Insulation; ASTM: West Conshohocken, PA, USA, 2002. [Google Scholar]
- Zou, X.; Gurnagul, N.; Uesaka, T.; Bouchard, J. Accelerated aging of papers of pure cellulose: Mechanism of cellulose degradation and paper embrittlement. Polym. Degrad. Stab. 1994, 43, 393–402. [Google Scholar] [CrossRef]
- Lawson, W.G.; Simmons, M.A.; Gale, P.S. Thermal Ageing of Cellulose Paper Insulation. IEEE Trans. Electr. Insul. 1977, EI-12, 61–66. [Google Scholar] [CrossRef]
- Morrison, E.L. Evaluation of the Thermal Stability of Electrical Insulating Paper. IEEE Trans. Electr. Insul. 1968, EI-3, 76–82. [Google Scholar] [CrossRef]
- Arroyo-Fernández, O.H.; Fofana, I.; Jalbert, J.; Rodriguez, E.; Rodriguez, L.B.; Ryadi, M. Assessing changes in thermally upgraded papers with different nitrogen contents under accelerated aging. IEEE Trans. Dielectr. Electr. Insul. 2017, 24, 1829–1839. [Google Scholar] [CrossRef]
- Arroyo, O.H.; Fofana, I.; Jalbert, J.; Ryadi, M. Relationships between methanol marker and mechanical performance of electrical insulation papers for power transformers under accelerated thermal aging. IEEE Trans. Dielectr. Electr. Insul. 2015, 22, 3625–3632. [Google Scholar] [CrossRef]
- Arroyo, O.H.; Fofana, I.; Jalbert, J. Relationship between some chemical markers and the mechanical properties of the solid insulation used in power transformers. In Proceedings of the 2014 IEEE Electrical Insulation Conference (EIC), Philadelphia, PA, USA, 8–11 June 2014; pp. 348–352. [Google Scholar]
- Liu, Q.; Wang, Z.; Jarman, P.; Azis, N.; Sampson, W.; Heywood, R.J. Assessment of ageing conditions through paper tensile strength analysis of scrapped transformers. In Proceedings of the 16th International Symposium on High Voltage Engineering, Cape Town, South Africa, 24–28 August 2009. [Google Scholar]
- McShane, C.P.; Rapp, K.J.; Corkran, J.L.; Gauger, G.A.; Luksich, J. Aging of paper insulation in natural ester dielectric fluid. In Proceedings of the 2001 IEEE/PES Transmission and Distribution Conference and Exposition. Developing New Perspectives, Atlanta, GA, USA, 2 November 2001; Volume 672, pp. 675–679. [Google Scholar]
- Clark, F.M. Insulating Materials for Design and Engineering Practice; Wiley: New York, NY, USA, 1962. [Google Scholar]
- Unsworth, J.; Mitchell, F. Degradation of electrical insulating paper monitored with high performance liquid chromatography. IEEE Trans. Electr. Insul. 1990, 25, 737–746. [Google Scholar] [CrossRef]
- Azis, N.; Liu, Q.; Wang, Z. Ageing assessment of transformer paper insulation through post mortem analysis. IEEE Trans. Dielectr. Electr. Insul. 2014, 21, 845–853. [Google Scholar] [CrossRef]
- Youssouf, R.M.; Meghnefi, F.; Fofana, I. Frequency response analyses via rational function fitting. In Proceedings of the 2012 Annual Report Conference on Electrical Insulation and Dielectric Phenomena, Montreal, QC, Canada, 14–17 October 2012; pp. 230–233. [Google Scholar]
- Verma, P.; Chauhan, D.S.; Singh, P. Effects on tensile strength of transformer insulation paper under accelerated thermal and electrical stress. In Proceedings of the 2007 Annual Report—Conference on Electrical Insulation and Dielectric Phenomena, Vancouver, BC, Canada, 14–17 October 2007; pp. 619–622. [Google Scholar]
- TAPPI test method T494: Tensile Properties of Paper and Paperboard TAPPI, Ed. 2006. Available online: https://www.tappi.org/content/sarg/t494.pdf (accessed on 14 October 2019).
- Naranpanawe, W.; Bandara, K.; Saha, T.; Ekanayake, C.; Annamalai, P.K. Effect of pressboard ageing on power transformer mechanical vibration characteristics. In Proceedings of the Power and Energy Engineering Conference (APPEEC), Brisbane, Australia, 15–18 November 2015; pp. 1–5. [Google Scholar]
- Homagk, C.; Mossner, K.; Leibfried, T. Investigation on Degradation of Power Transformer Solid Insulation Material. In Proceedings of the 2008 Annual Report Conference on Electrical Insulation and Dielectric Phenomena, Quebec, QC, Canada, 26–29 October 2008; pp. 75–78. [Google Scholar]
- Prevost, T.A.; Oommen, T.V. Cellulose insulation in oil-filled power transformers: Part I-history and development. IEEE Electr. Insul. Mag. 2006, 22, 28–35. [Google Scholar] [CrossRef]
- Yamagata, N.; Miyagi, K.; Oe, E. Diagnosis of thermal degradation for thermally upgraded paper in mineral oil. In Proceedings of the International Conference on Condition Monitoring and Diagnosis, Beijing, China, 21–24 April 2008; pp. 1000–1004. [Google Scholar]
- Chendong, X. Monitoring paper insulation aging by measuring furfural contents in oil. In Proceedings of the 7th International Symposium on High Voltage Engineering, Dresden, Germany, 26–30 August 1991; p. 139. [Google Scholar]
- Arroyo Fernández, O.H. Étude des Corrélations Entre les Propriétés Mécaniques des Papiers et les Traceurs Chimiques Issus de Son Vieillissement Pour Surveiller L’état de L’isolation Solide des Transformateurs de Puissance. Ph.D. Thesis, Université du Québec à Chicoutimi, Chicoutimi, QC, Canada, 2017. [Google Scholar]
- Prux von Steinkirch Souza, E.M.; Mildemberger, L.; Akcelrud, L.; Andreoli, M.C.; Dos Santos, K.; Da Silva, C.; Nunes Da Motta, H.; Gulmine, J.V.; Munaro, M. Evaluation of the chemical stability of methanol generated during paper degradation in power transformers. IEEE Trans. Dielectr. Electr. Insul. 2016, 23, 3209–3214. [Google Scholar] [CrossRef]
- Schaut, A.; Eeckhoudt, S. Identification of early-stage paper degradation by methanol. In Proceedings of the CIGRÉ Conference 2012, Paris, France, 26–31 August 2012; Available online: https://e-cigre.org/publication/A2-107_2012-identification-of-early-stage-paper-degradation-by-methanol (accessed on 14 October 2019).
- Jalbert, J.; Lessard, M.C.; Ryadi, M. Cellulose chemical markers in transformer oil insulation Part 1: Temperature correction factors. IEEE Trans. Dielectr. Electr. Insul. 2013, 20, 2287–2291. [Google Scholar] [CrossRef]
- Ryadi, M.; Tanguy, A.; Jalbert, J. Methanol marker for the thermal performance qualification of power transformers. In Proceedings of the 2013 IEEE Electrical Insulation Conference (EIC), Ottawa, ON, Canada, 2–5 June 2013; pp. 387–391. [Google Scholar]
- Ryadi, M.; Jalbert, J. Assesment of field power transformers insulation using aging markers. In Proceedings of the 2014 IEEE Electrical Insulation Conference (EIC), Philadelphia, PA, USA, 8–11 June 2014; pp. 338–343. [Google Scholar]
- Wang, Z.D.; Jarman, P.; Wilson, G.; Hooton, R.; Walker, D.; Dyer, P.; Krause, C.; Smith, P.W.R.; Gyore, A.; Martin, R.; et al. Condition Monitoring and Diagnostic Assessment of Transformers. In Proceedings of the CIGRÉ Conference 2016, Paris, France, 21–26 August 2016. [Google Scholar]
- Rodriguez-Celis, E.M.; Duchesne, S.; Jalbert, J.; Ryadi, M. Understanding ethanol versus methanol formation from insulating paper in power transformers. Cellulose 2015, 22, 3225–3236. [Google Scholar] [CrossRef]
- Laurichesse, D.; Bertrand, Y.; Tran-Duy, C.; Murin, V. Ageing diagnosis of MV/LV distribution transformers via chemical indicators in oil. In Proceedings of the 2013 IEEE Electrical Insulation Conference (EIC), Ottawa, ON, Canada, 2–5 June 2013; pp. 464–468. [Google Scholar]
- Bare, C.E.; Merritt, S.Y. Methanol as an ageing marker for in service transformers. In Proceedings of the 2017 Annual Pulp, Paper and Forest Industries Technical Conference (PPFIC), Tacoma, WA, USA, 18–23 June 2017; pp. 1–7. [Google Scholar]
- Bare, C.E.; Merritt, S.Y. Methanol as an Ageing Marker for In Service Transformers. IEEE Trans. Ind. Appl. 2018, 54, 6598–6602. [Google Scholar] [CrossRef]
- Jocelyn Jalbert, C.R.; Lessard, M.-C.; Rodriguez-Celis, M. Methanol in Oil Interpretation Model Based on Transformer Post-Mortem Paper Analysis. IEEE Trans. Dielectr. Electr. Insul. 2018, 25, 6. [Google Scholar]
- Abu-Siada, A. Correlation of furan concentration and spectral response of transformer oil-using expert systems. IET Sci. Meas. Technol. 2011, 5, 5. [Google Scholar] [CrossRef]
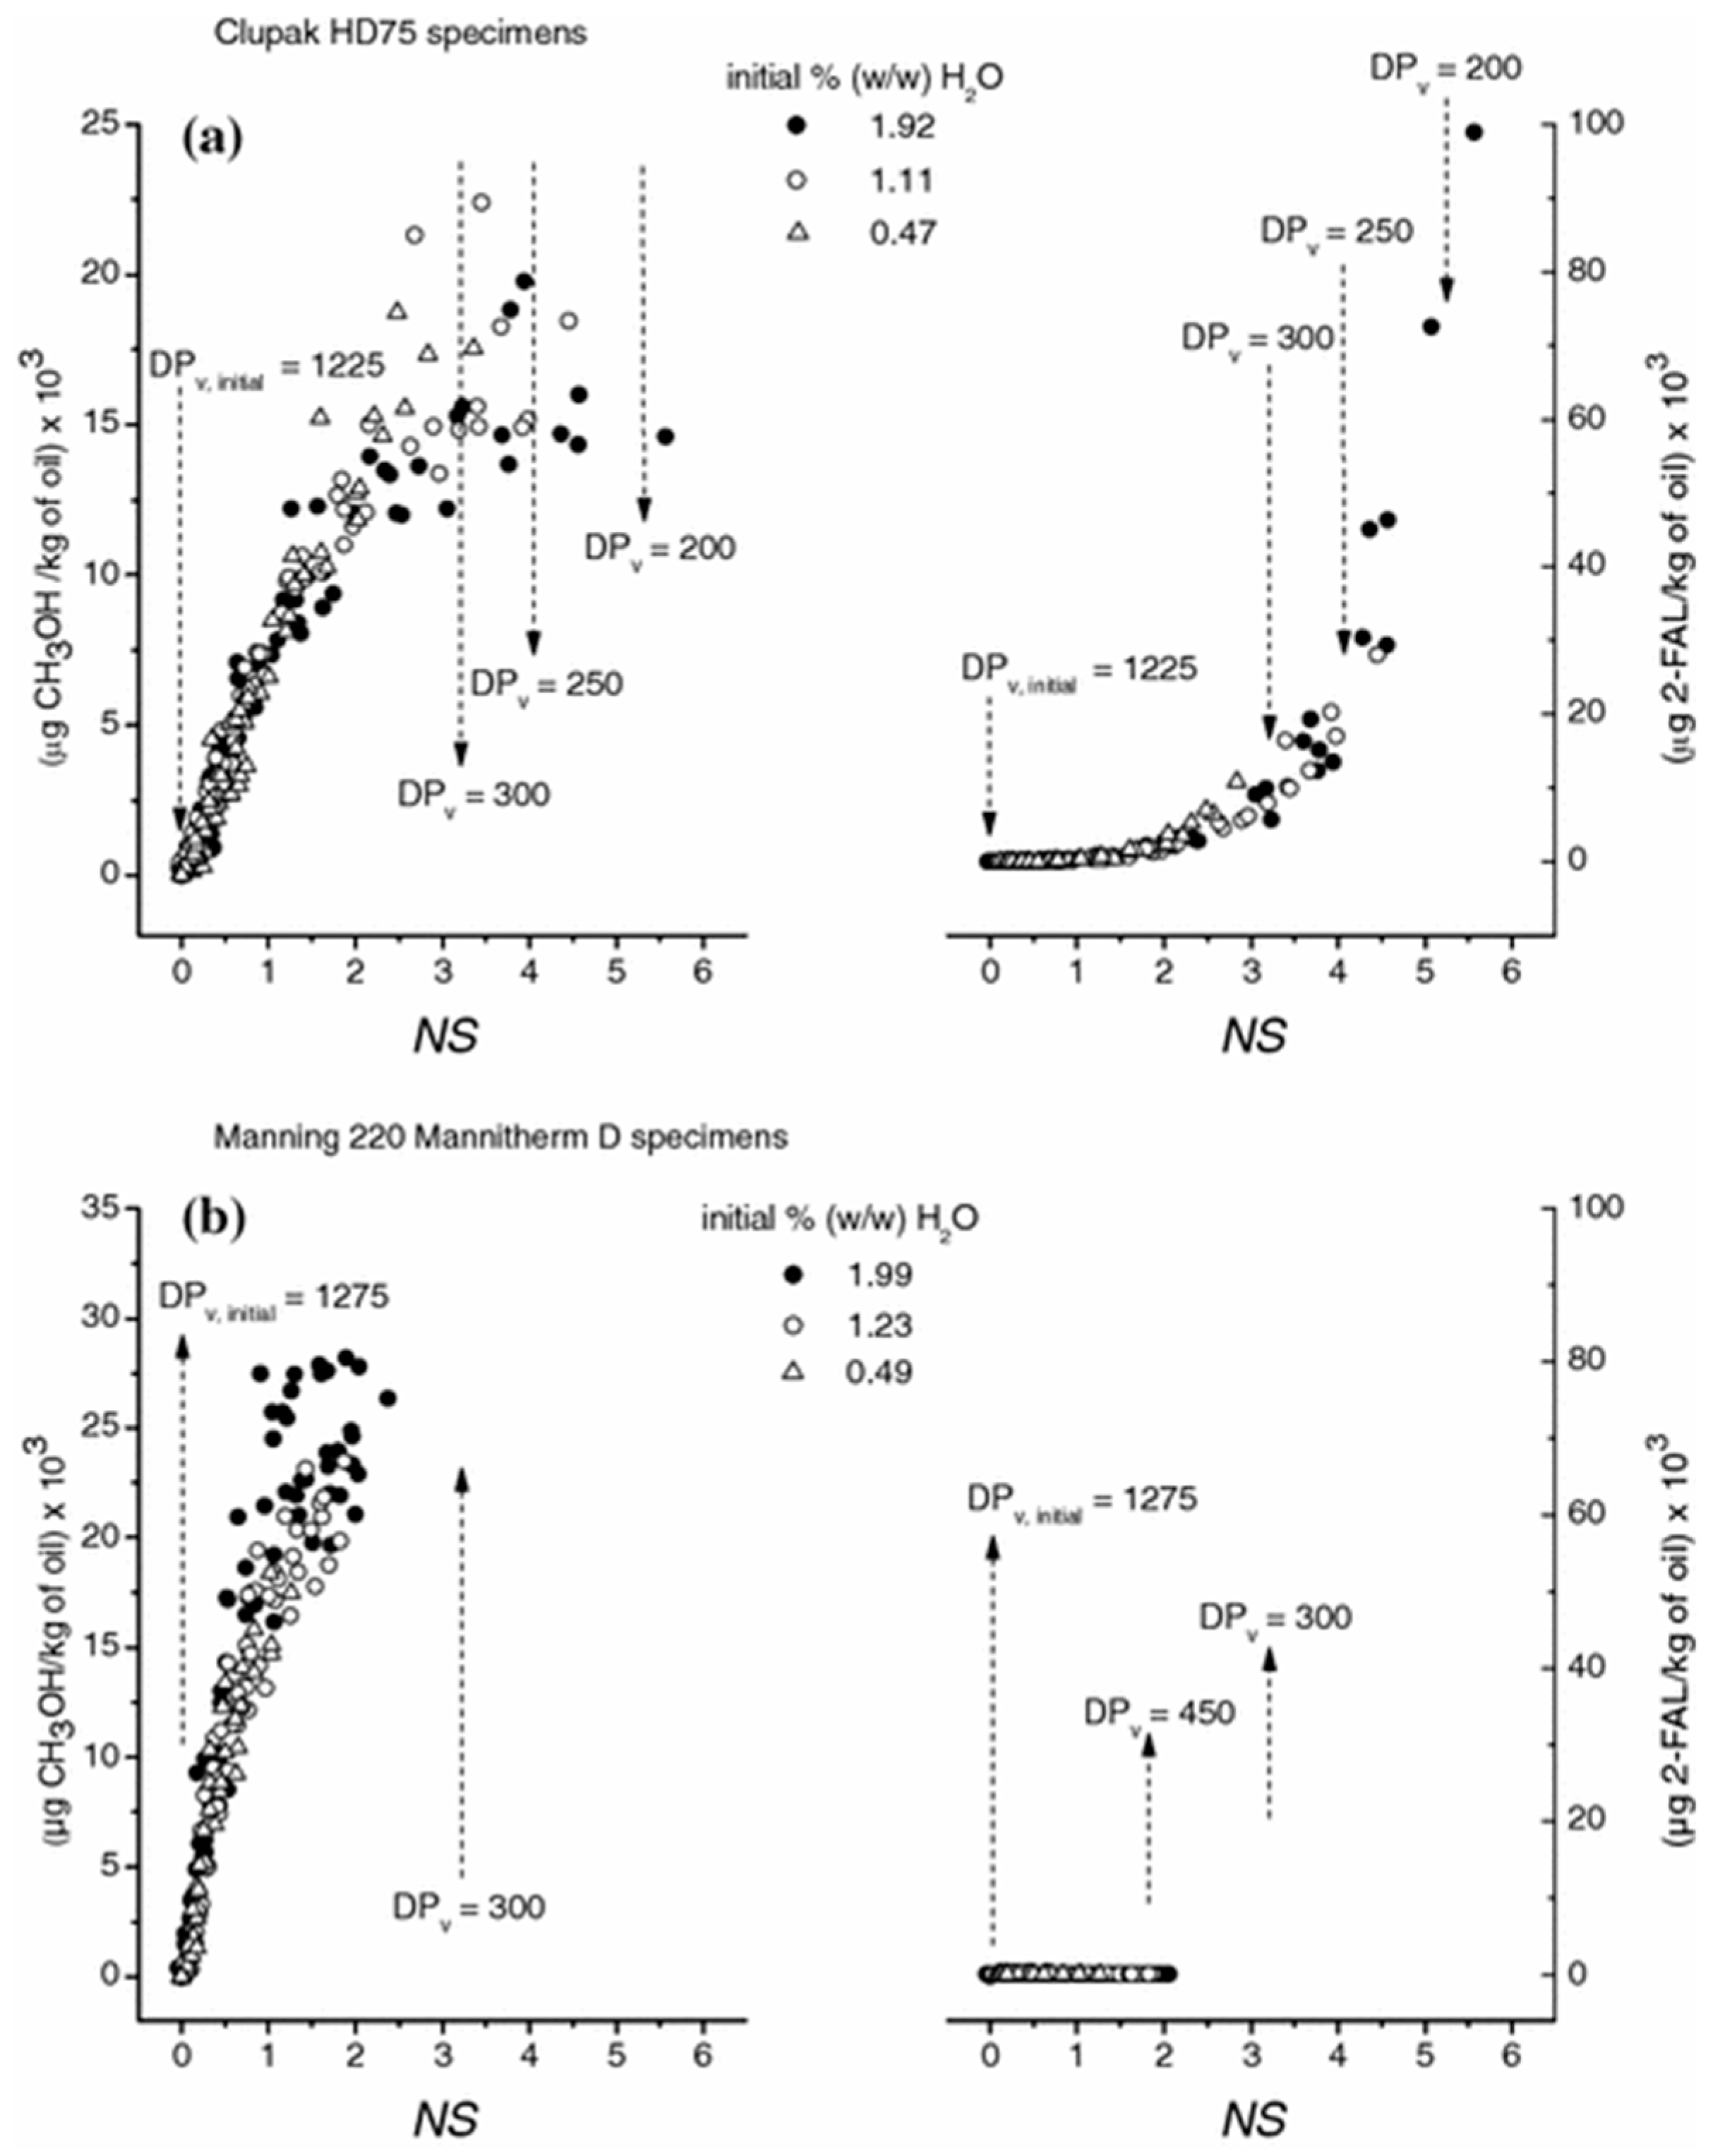
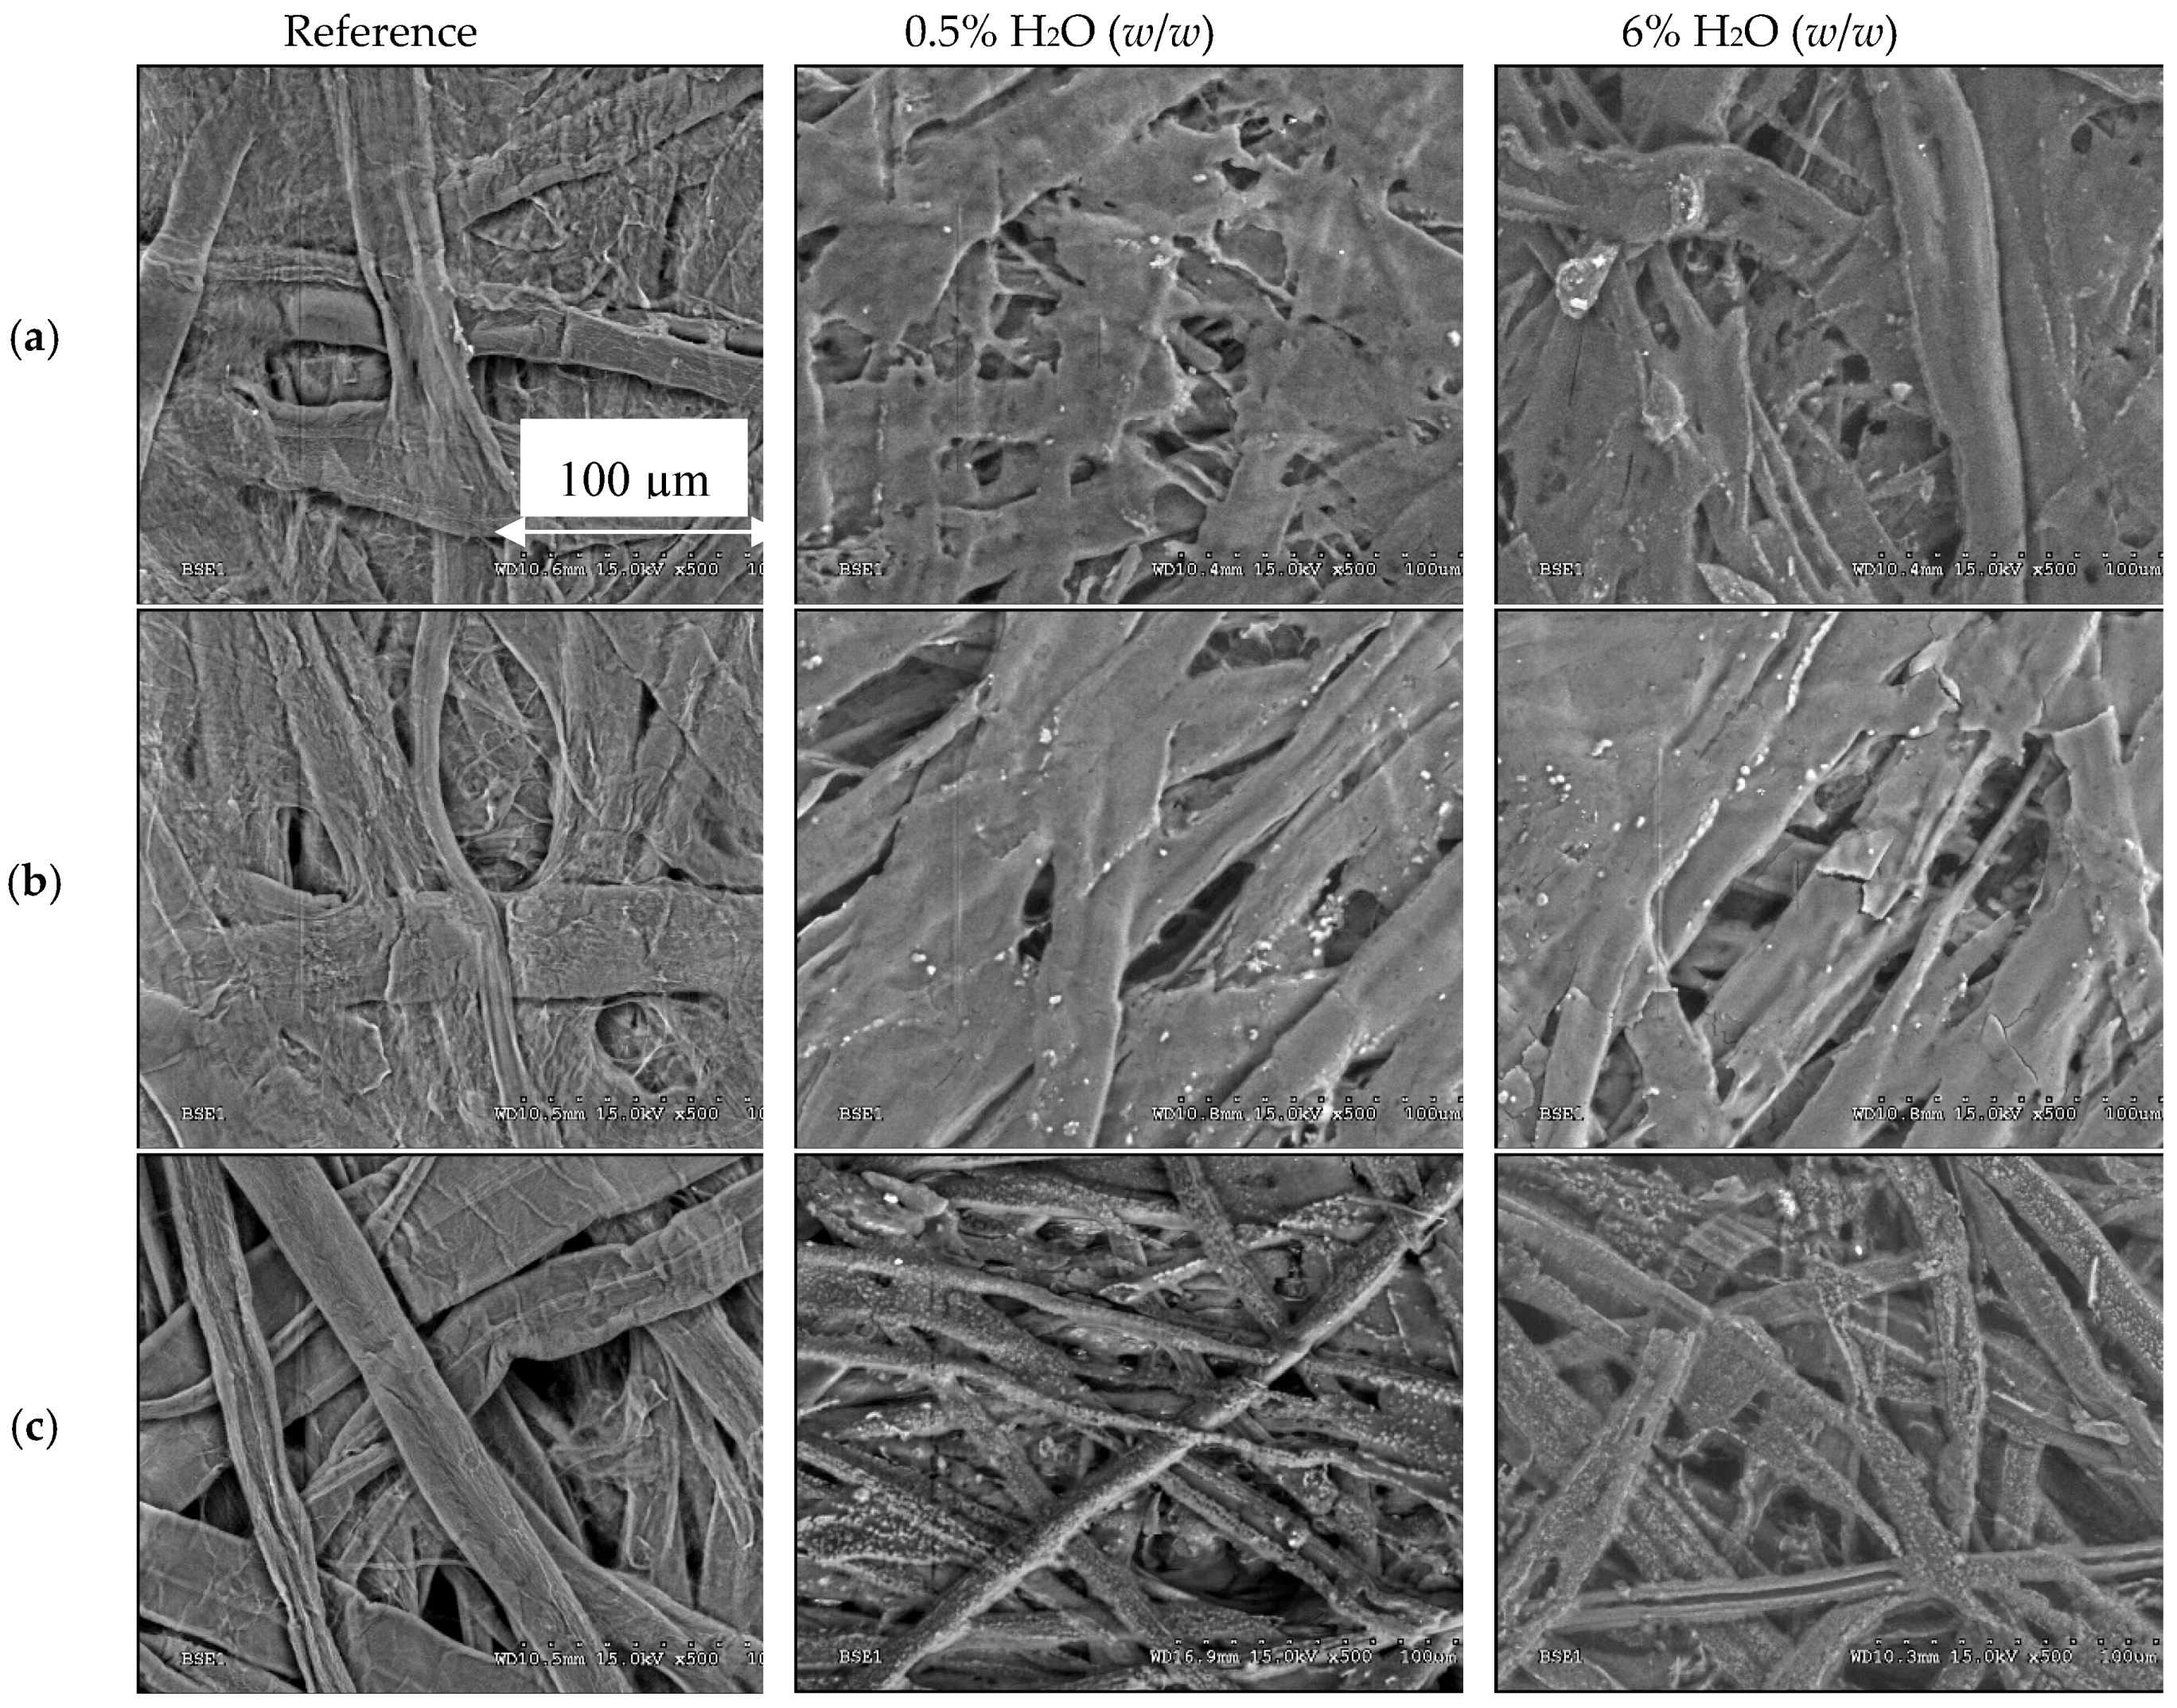
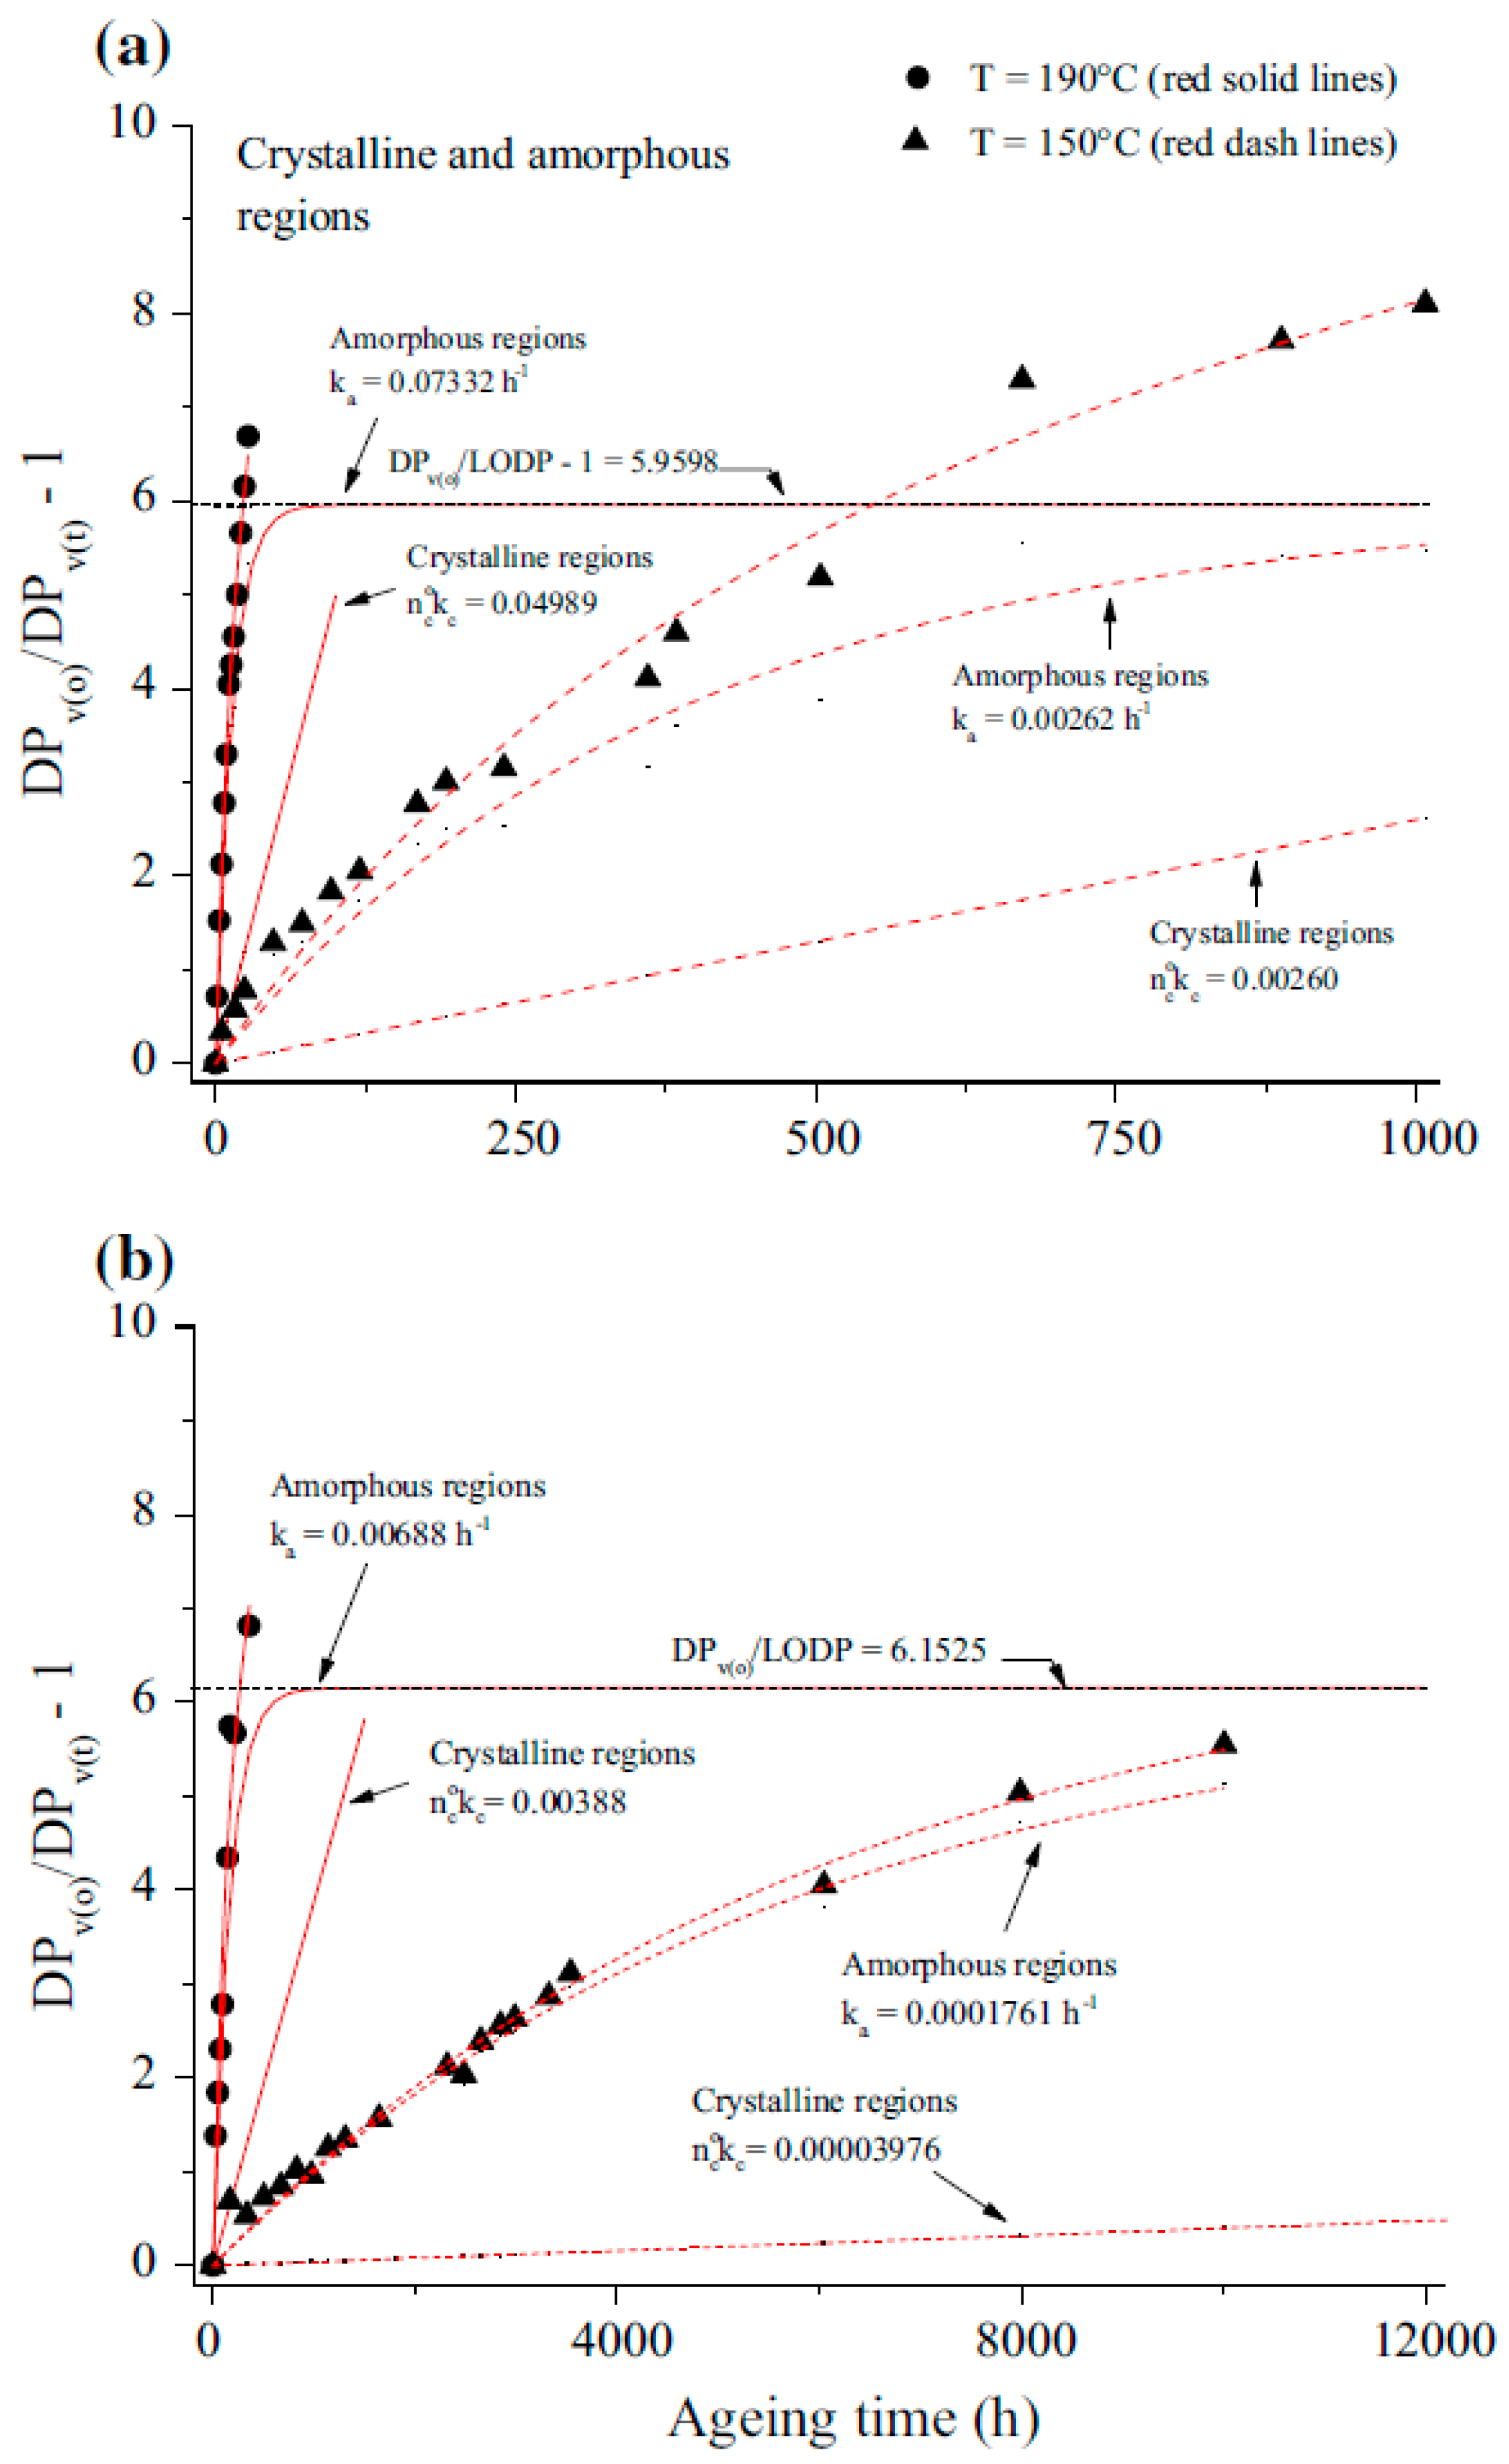
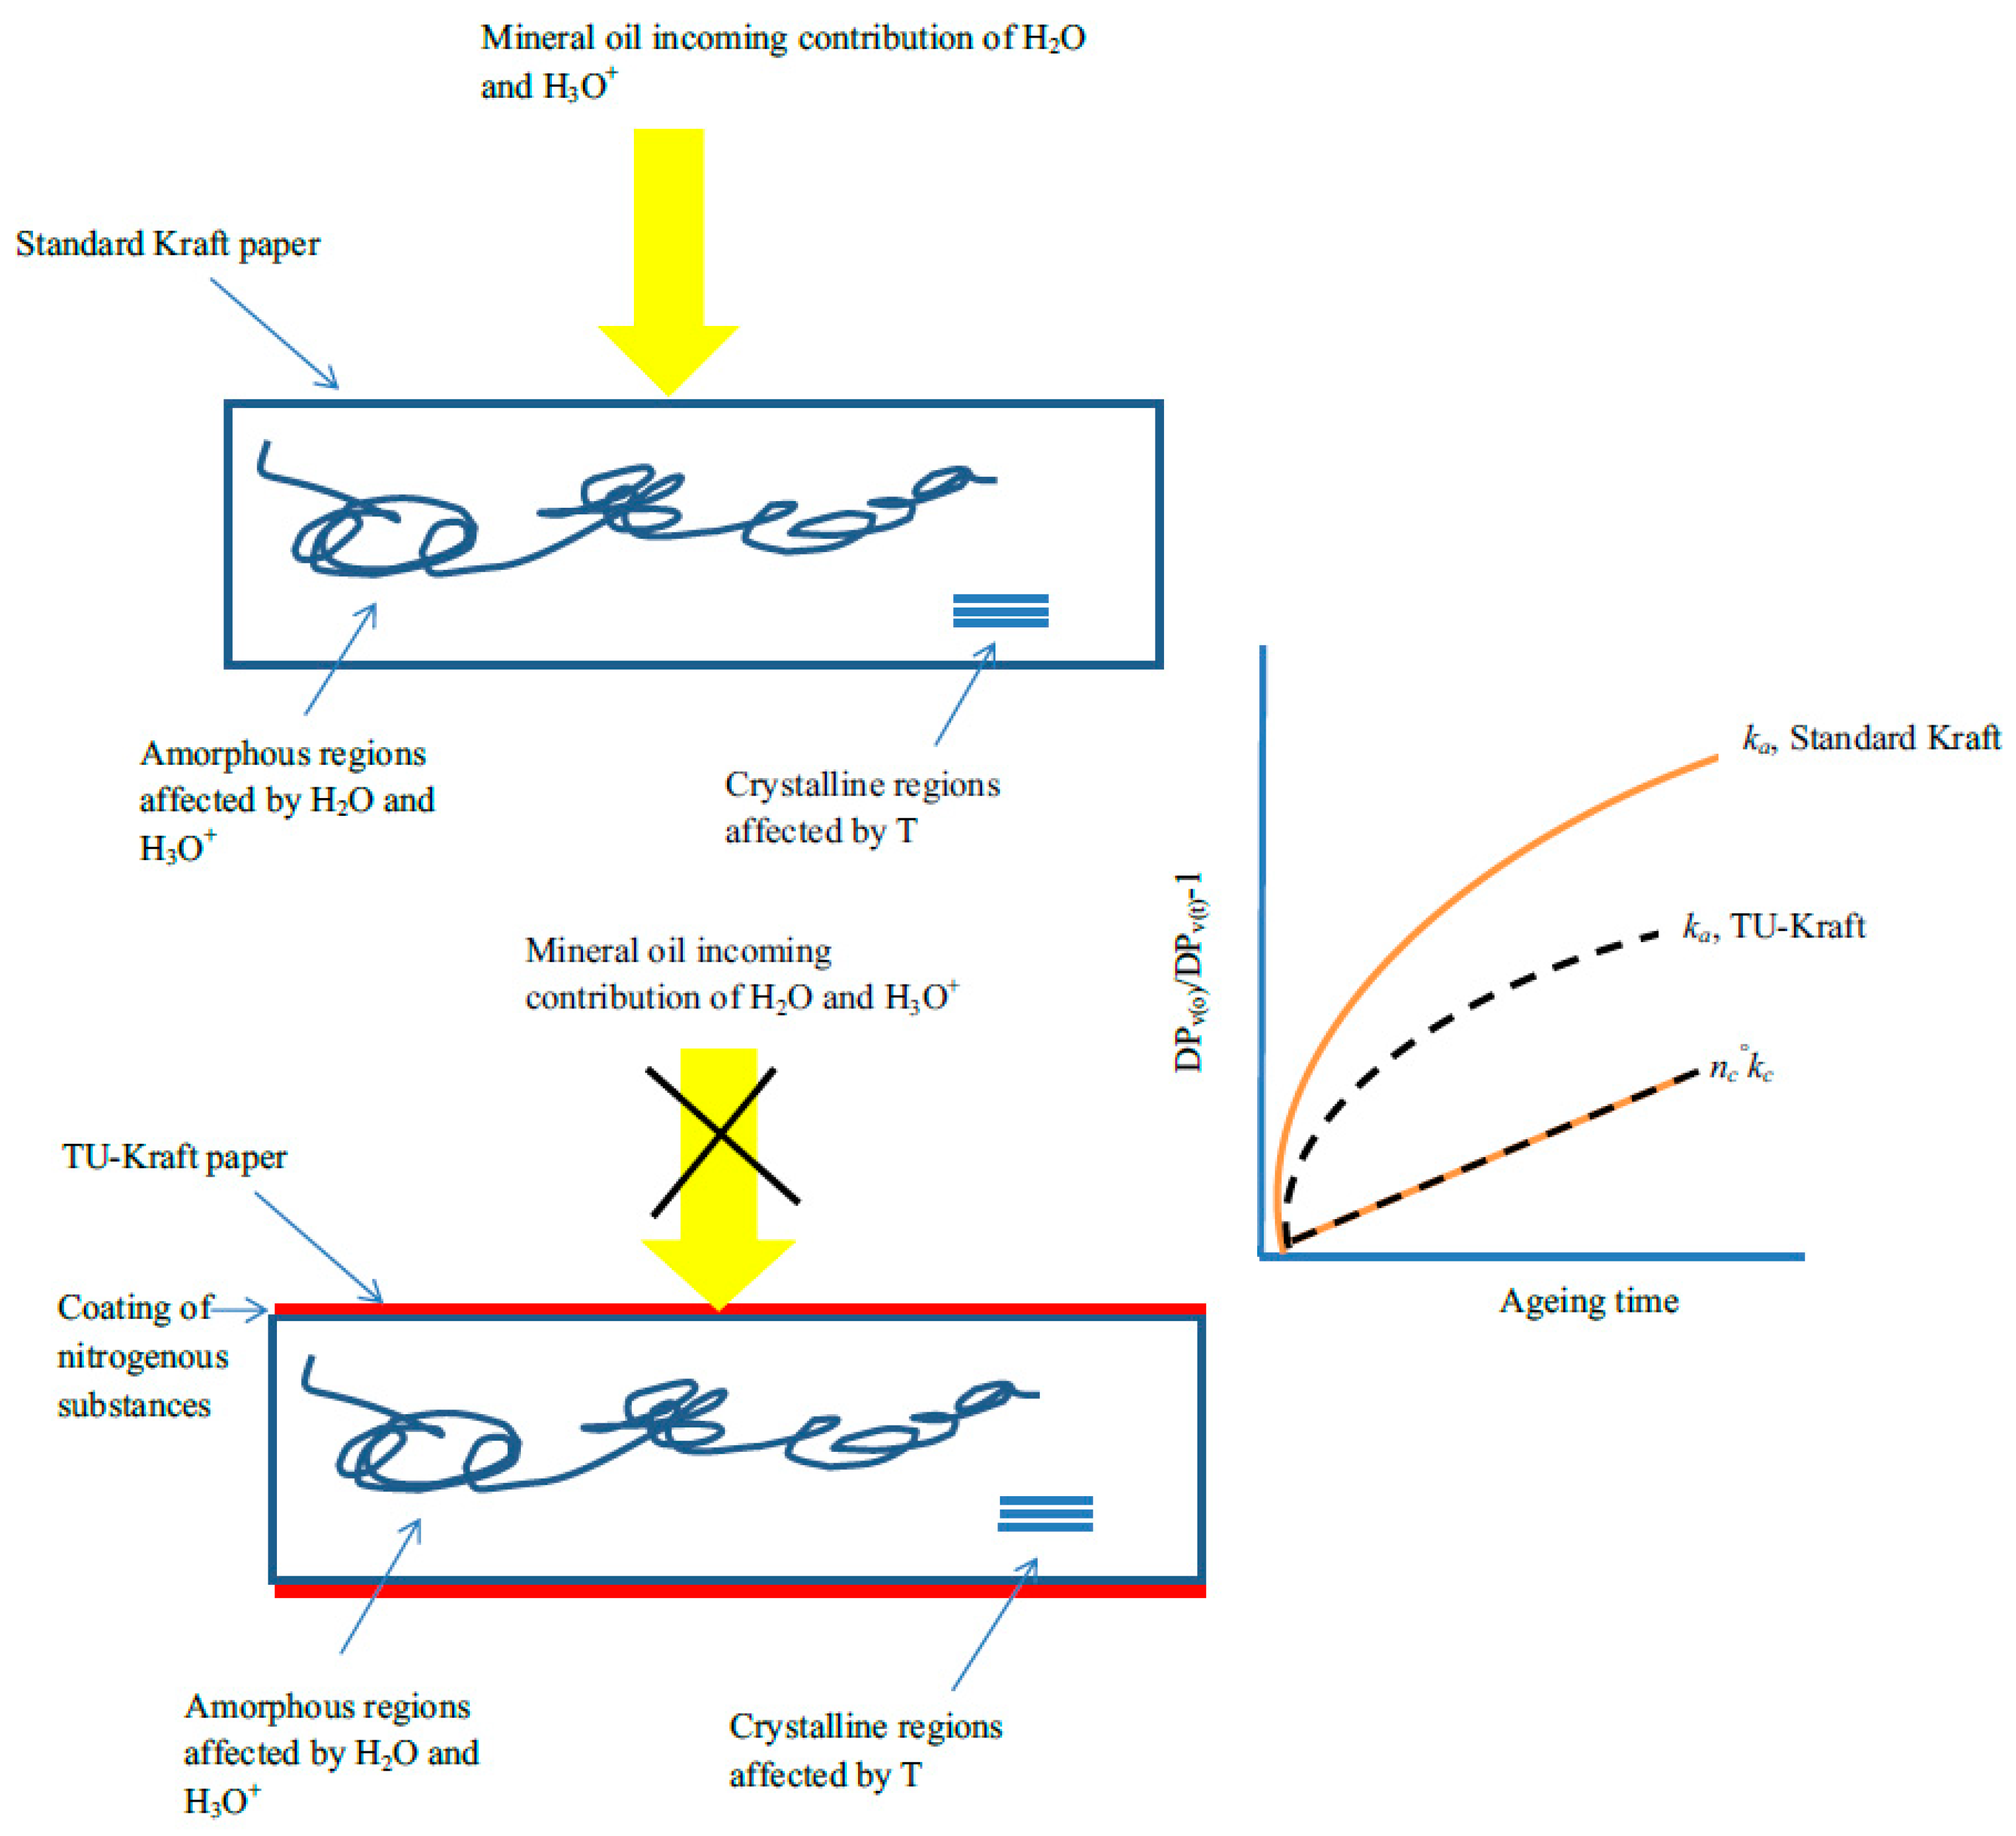

| Jalbert et al. 2007 | Schaut et al. 2011 | Jalbert et al. 2012 | Bruzzoniti et al. 2014 | Bruzzoniti et al. 2014 | Matharage et al. 2014 | Perrier et al. 2015 | Molavi et al. 2017 | |
|---|---|---|---|---|---|---|---|---|
| Oil sample | 10 mL | 7 mL | 10 mL | 7 g | 7 g | 10 g | N.R. | 10 mL |
| Instrumental setup | HS-GC-MS | HS-GC-MS | HS-GC-MS | HS-GC-FID | HS-GC-MS | HS-GC-MS | HS-GC-MS | HS-GC-MS |
| HS equilibration time (min) | 60 | 40 | 40 | N.R. | N.R. | 40 | N.R. | 20 |
| HS equilibration temperature (°C) | 60 | 100 | 90 | 90 | 90 | 90 | N.R. | 85 |
| GC column | Stabilwax | Stabilwax | VF-624ms | Ultra 2, Rxi-624 | Ultra 2, Rxi-624 | VF-624ms | N.R. | VF-Wax ms |
| Internal standard | N.A. | N.A. | Ethanol d-6 | N.A. | Ethanol d-6 | Ethanol d-6 | Ethanol d-6 | 2-propanol |
| LOD (ng/g) | 10 | 50 | 4 | 12 | 1.3 | N.R. | 4.8 | 144 |
| Linearity ng/g (r2) | N.R. | 100–1000 (>0.99) | 14–8000 (>0.999) | 36–3500 (0.9991) | 3.9–2500 (0.9993) | 50–1890 (>0.99) | 16–9750 (0.995) | 250–10,000 (0.996) |
| Precision (%RSD) | N.R. | 6% (100 ng/g, n = 5) | 0.8% (170 ng/g, n = 14) | 4.6% (79 ng/g, n = 20) | 12.1% (3.3 ng/g, n = 20) | 12.5% | 14.3% | 11% (n = 25) |
| 3% (10,000 ng/g, n = 5) | 2.5% (1700 ng/g, n = 14) | 2.6% (1985 ng/g, n = 20) | 2.2% (2196 ng/g, n = 20) | |||||
| Accuracy (%RE) | N.R. | N.R. | −3.6% (170 ng/g, n = 14) | 7.6% (353 ng/g, n = 7) | 8.8% (357 ng/g, n = 7) | N.R. | 8.8% (357 ng/g, n = 7) | N.R. |
| −6.3% (1700 ng/g, n = 14) | −1.2% (989 ng/g, n = 7) | 8.7% (1088 ng/g, n = 7) | 8.7% (1088 ng/g, n = 7) | |||||
| Validation to field samples | Yes | Yes | Yes | Yes | Yes | Yes | Yes | No |
| N.A.: Non Applicable | ||||||||
| LOD: Limit of Detection | ||||||||
| N.R.: Non Reported | ||||||||
| Type of Model | Range of T Covered by the Linear Regression (N) | r2 | Activation Energy (Ea) (kJ mol−1) | Frequency Factor (lnAa) |
|---|---|---|---|---|
| Depolymerization – standard Kraft paper (Clupak-HD75) | ||||
| ka from Equation (7) | 130–210 (5) | 0.9853 | 115.5 ± 8.2 | 27.0 ± 2.1 |
| kc from Equation (7) | 130–210 (5) | 0.9670 | 111.3 ± 11.9 | 25.6 ± 3.2 |
| CH3OH formation – standard Kraft paper (Clupak-HD75) | ||||
| ka from Equation (5) | 130–210 (5) | 0.9776 | 99.5 ± 8.7 | 26.3 ± 2.3 |
| k2 from Equation (5) | 130–210 (5) | 0.9764 | 100.5 ± 9.0 | 25.0 ± 2.4 |
| Depolymerization – thermally upgraded paper (Densiflex-22HCC) | ||||
| ka from Equation (7) | 150–210 (4) | 0.9835 | 148.1 ± 13.6 | 33.2 ± 3.5 |
| kc from Equation (7) | 150–210 (4) | 0.9668 | 195.3 ± 25.6 | 45.5 ± 6.8 |
| CH3OH formation – thermally upgraded paper (Densiflex-22HCC) | ||||
| ka from Equation (5) | 150–210 (4) | 0.9865 | 132.5 ± 10.9 | 33.1 ± 2.9 |
| k2 from Equation (5) | 150–210 (4) | 0.9636 | 121.3 ± 16.7 | 28.2 ± 4.5 |
| N: Number of data points | ||||
| Config. Type | Power (MWA) | Average Yc (years) | n 2 | Kraft paper 1 | Label |
|---|---|---|---|---|---|
| Shell | 550–70 | 13 ± 7 | 42 | 100% TU | S13 |
| Shell | 360 | 22 ± 4 | 67 | 100% Std | S22 |
| Core | 360 | 25 ± 3 | 31 | 10% TU; 90% Std | C25 |
| Core | 550 | 16 ± 3 | 29 | 10% TU; 90% Std | C16 |
| Test | Distribution Transformer | ||
|---|---|---|---|
| “A” | “B” | “C” | |
| DGA (ppm) * | |||
| H2 | 1046 | 2223 | 9976 |
| O2 | 18 | 9 | 1 |
| N2 | 72 | 54 | 35 |
| CO2 | 1602 | 20058 | 3132 |
| C2H2 | 4261 | 6559 | 10041 |
| C2H4 | 1960 | 4875 | 6391 |
| C2H6 | 140 | 753 | 3591 |
| CH4 | 692 | 2313 | 8472 |
| CO | 492 | 6683 | 3756 |
| Alcohols (ppb) | |||
| MeOH | 27 | 680 | 215 |
| EtOH | <LOD | 156 | 585 |
| Furanic (ppb) | |||
| 2-FAL | 48 | 2387 | <LOD |
| DPv | |||
| Winding | 1006-1166 | 988-1077 | 1035-1165 |
| Lead | 873 | 181 | 1109 |
| M | a | b (1/°C) | R |
|---|---|---|---|
| H2O | 2.59 | 0.04 | 0.998 |
| MeOH | 2.06 | 0.04 | 0.989 |
| EtOH | 1.65 | 0.03 | 0.983 |
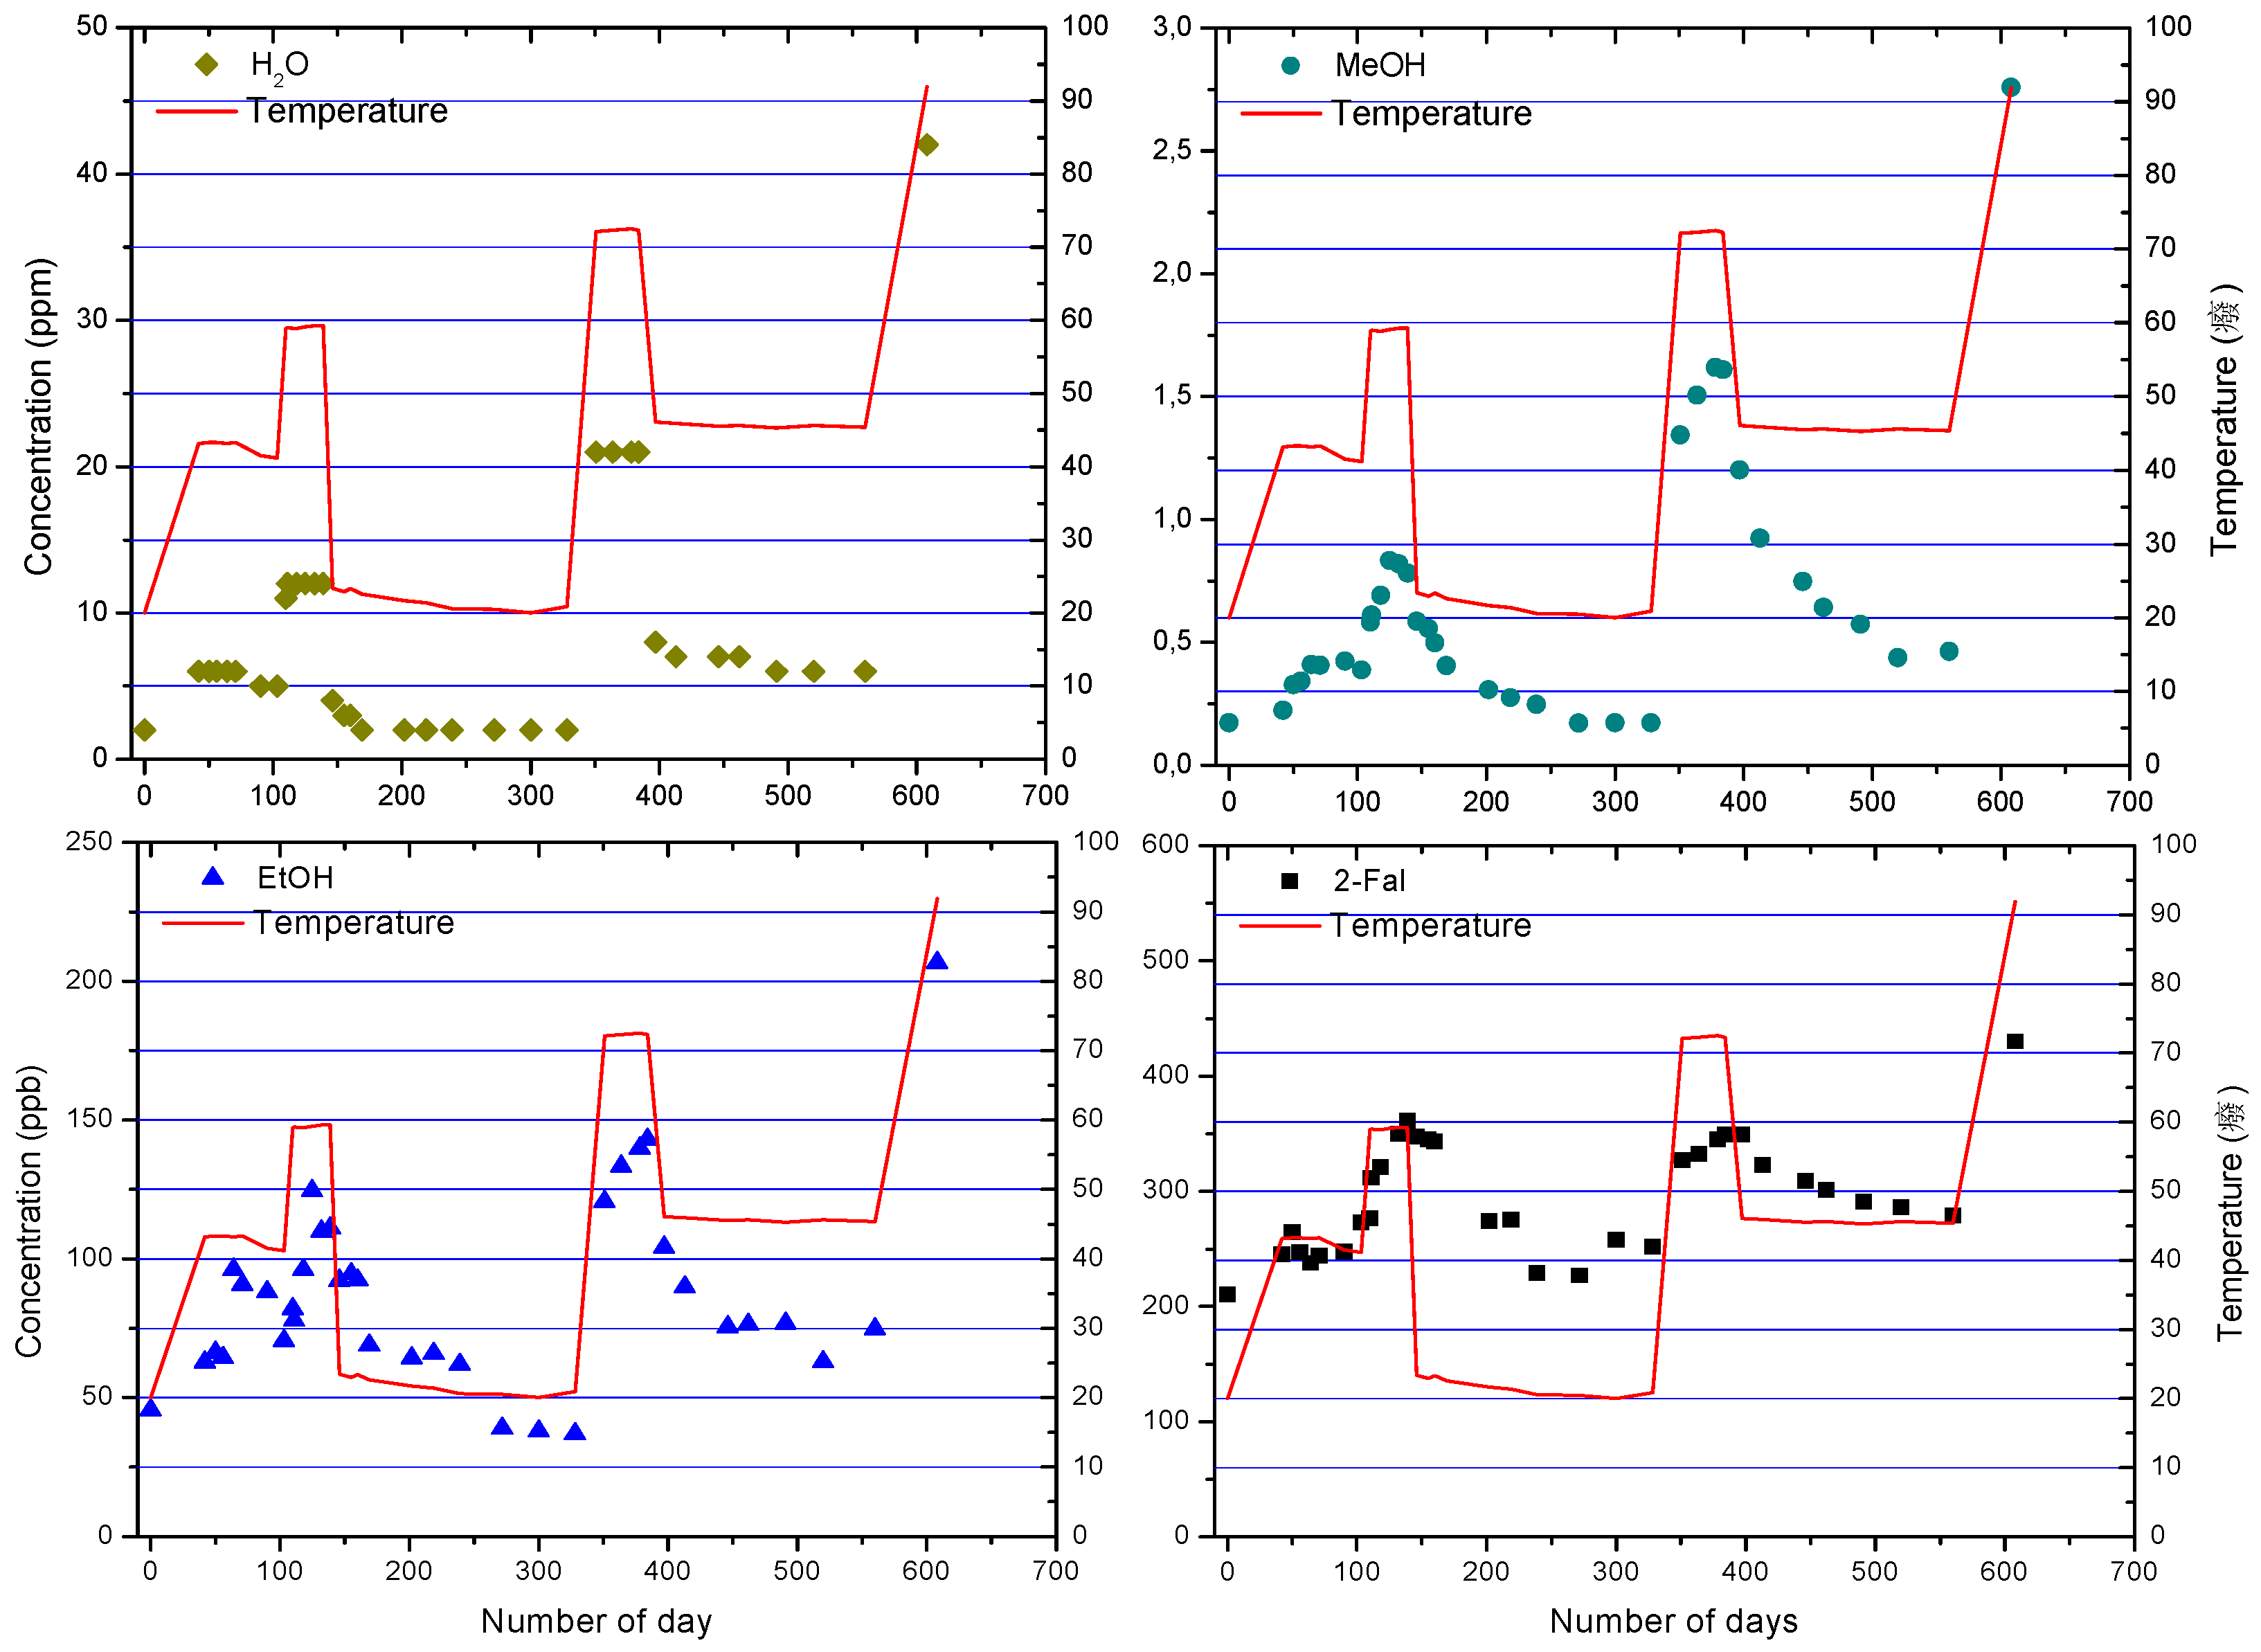
| 2-FAL | 1.23 | 0.01 | 0.980 |
© 2019 by the authors. Licensee MDPI, Basel, Switzerland. This article is an open access article distributed under the terms and conditions of the Creative Commons Attribution (CC BY) license (http://creativecommons.org/licenses/by/4.0/).
Share and Cite
Jalbert, J.; Rodriguez-Celis, E.M.; Arroyo-Fernández, O.H.; Duchesne, S.; Morin, B. Methanol Marker for the Detection of Insulating Paper Degradation in Transformer Insulating Oil. Energies 2019, 12, 3969. https://doi.org/10.3390/en12203969
Jalbert J, Rodriguez-Celis EM, Arroyo-Fernández OH, Duchesne S, Morin B. Methanol Marker for the Detection of Insulating Paper Degradation in Transformer Insulating Oil. Energies. 2019; 12(20):3969. https://doi.org/10.3390/en12203969
Chicago/Turabian StyleJalbert, Jocelyn, Esperanza M. Rodriguez-Celis, Oscar H. Arroyo-Fernández, Steve Duchesne, and Brigitte Morin. 2019. "Methanol Marker for the Detection of Insulating Paper Degradation in Transformer Insulating Oil" Energies 12, no. 20: 3969. https://doi.org/10.3390/en12203969
APA StyleJalbert, J., Rodriguez-Celis, E. M., Arroyo-Fernández, O. H., Duchesne, S., & Morin, B. (2019). Methanol Marker for the Detection of Insulating Paper Degradation in Transformer Insulating Oil. Energies, 12(20), 3969. https://doi.org/10.3390/en12203969


