1. Introduction
Nuclear science and technology play a pivotal role in bringing innovation, safety, and efficiency to industrial processes. Nuclear advances responding to global energy and environmental needs have contributed to the peaceful and sustainable development of the world. Today, there are 435 nuclear reactors in operation around the world [
1]. A number of nuclear reactors are operated within well-established nuclear countries with their own supply networks. With the rapid phasing out of fossil fuels, and climate change concerns, many countries are planning to expand existing nuclear power programs, meaning that their resources may be extended. Furthermore, 31 entrant countries are actively preparing for the establishment of a nuclear energy program, with six planning to commission by 2020 and half by 2030 [
2]. The domestic and global demand for nuclear decommissioning processes will significantly enhance in this phase, as directly operating nuclear reactors are brought off-line after their life spans end [
3].
Decontamination is defined as the removal of contamination from surfaces of facilities or equipment via cleaning out, heating, chemical or electrochemical methods, mechanical cleaning, or other techniques. Among them, chemical decontamination is one of the important technologies applied during the decommissioning and post-operational clean-out process of industrial nuclear facilities. This ensures the safety of the laborers and reduces or minimizes the quantity of radioactive waste. Chemical decontamination in nuclear facilities removes iron-rich oxides and radionuclides on the surface of contaminated metals. In addition, decontamination for nuclear facilities that are being decommissioned requires the removal of thickened corroded surfaces using more effective agents or specially designed equipment. The goals of decontamination are, first, to reduce the magnitude of the residual radioactive sources in the reactor, pipes, and vessels and, second, to restore and reuse the equipment and nuclear materials to reduce the volume of radioactive waste. Most importantly, it is necessary to remove iron-rich oxides, such as Fe3O4 or NiOFe2O3, that are liable to trap contaminants on the inner surfaces of piping, as well as in thin layers of the structural material. Chemical decontamination technology is applicable to the pipelines and internal loops of the nuclear facilities; it should have acceptable decontamination efficiency with a low amount of secondary waste. To obtain sound decontamination, a concentrated chemical solution is generally used. However, this produces a large volume of secondary waste. A dilute solution of organic ligands such as Ethylenediaminetetraacetic acid (EDTA), N-(2-Hydroxyethyl)ethylenediaminetriacetic acid (HEDTA), and nitrilotriacetic acid (NTA) has a positive effect on decontamination. The decontamination solution, however, is not easily decomposed by the conventional oxidation approach.
The decomposition of hydrogen peroxide and the simultaneous oxidation of hydrazine were investigated by Graham [
4]. Hydrazine and its derivatives are used extensively in many fields as chemicals, in agriculture, pesticides, insecticides, blowing agents for pharmaceuticals, plastic, photographic chemicals, textiles dyes, treatment of water for corrosion inhibitions, jets and rocket fuels, missile system, catalysts, emulsifiers, explosives, and reducing agents [
5,
6,
7]. Thus, there has been increasing demand for a highly sensitive method of determination of hydrazine in applications such as water treatment, industrial practices, and environmental materials. In particular, hydrazine is used as a scavenger for dissolved oxygen in boilers. It is used widely for chemical pre-treatment in high-pressure boilers. The reducing properties of hydrazine enable its wide application in energetics and metallurgy as a corrosion inhibitor and for reducing metal ions. It is also able to make a protective magnetite coating as an effect of its reaction with surface rust or iron. Individuals may be professionally exposed to hydrazine at work or by accidental discharges into water, soil and air, which may happen during handling, transport, or storage, or due to improper waste disposal. The hydrazine in this system is an important reducer and reagent for the determination of successful decontamination in nuclear facilities. Many analytical methods to detect hydrazine have been reported in the literature, such as spectrophotometric [
8,
9,
10], optical [
11], potentiometric [
12], spectrophotometric flow injection [
13], fluorimetric [
14,
15], and chemiluminescence [
16,
17], as well as the measurement of gases [
18]. Of these techniques, the colorimetric method is considered a simple, rapid and effective method for the detection of hydrazine at low concentrations. Rapid and convenient technologies for the identification of physical and analytical chemistry are of great significance in the environmental monitoring, multidisciplinary science, technology and engineering fields [
19].
In this study, we successfully demonstrated a simple and rapid colorimetric method for the sensitive detection of hydrazine decomposition for a chemical decontamination process. Furthermore, the colorimetric response was easy to monitor with the unaided eye, without any sophisticated instrumentation. This assay is therefore suitable for the on-site detection for adaptation in successful chemical decontamination. It is applicable to the pipelines and internal loops of nuclear facilities and should produce sound decontamination in the field. To the best of my knowledge, this is the first report to successfully demonstrate chemical decontamination technology applicable to pipelines and internal loops, with iron-rich oxides, of a nuclear power plant using a colorimetric response that is easy to monitor without any sophisticated instrumentation.
3. Results and Discussion
3.1. Chemical Decontamination Process in a Nuclear Power Plant and a Colorimetric Method for Hydrazine Detection
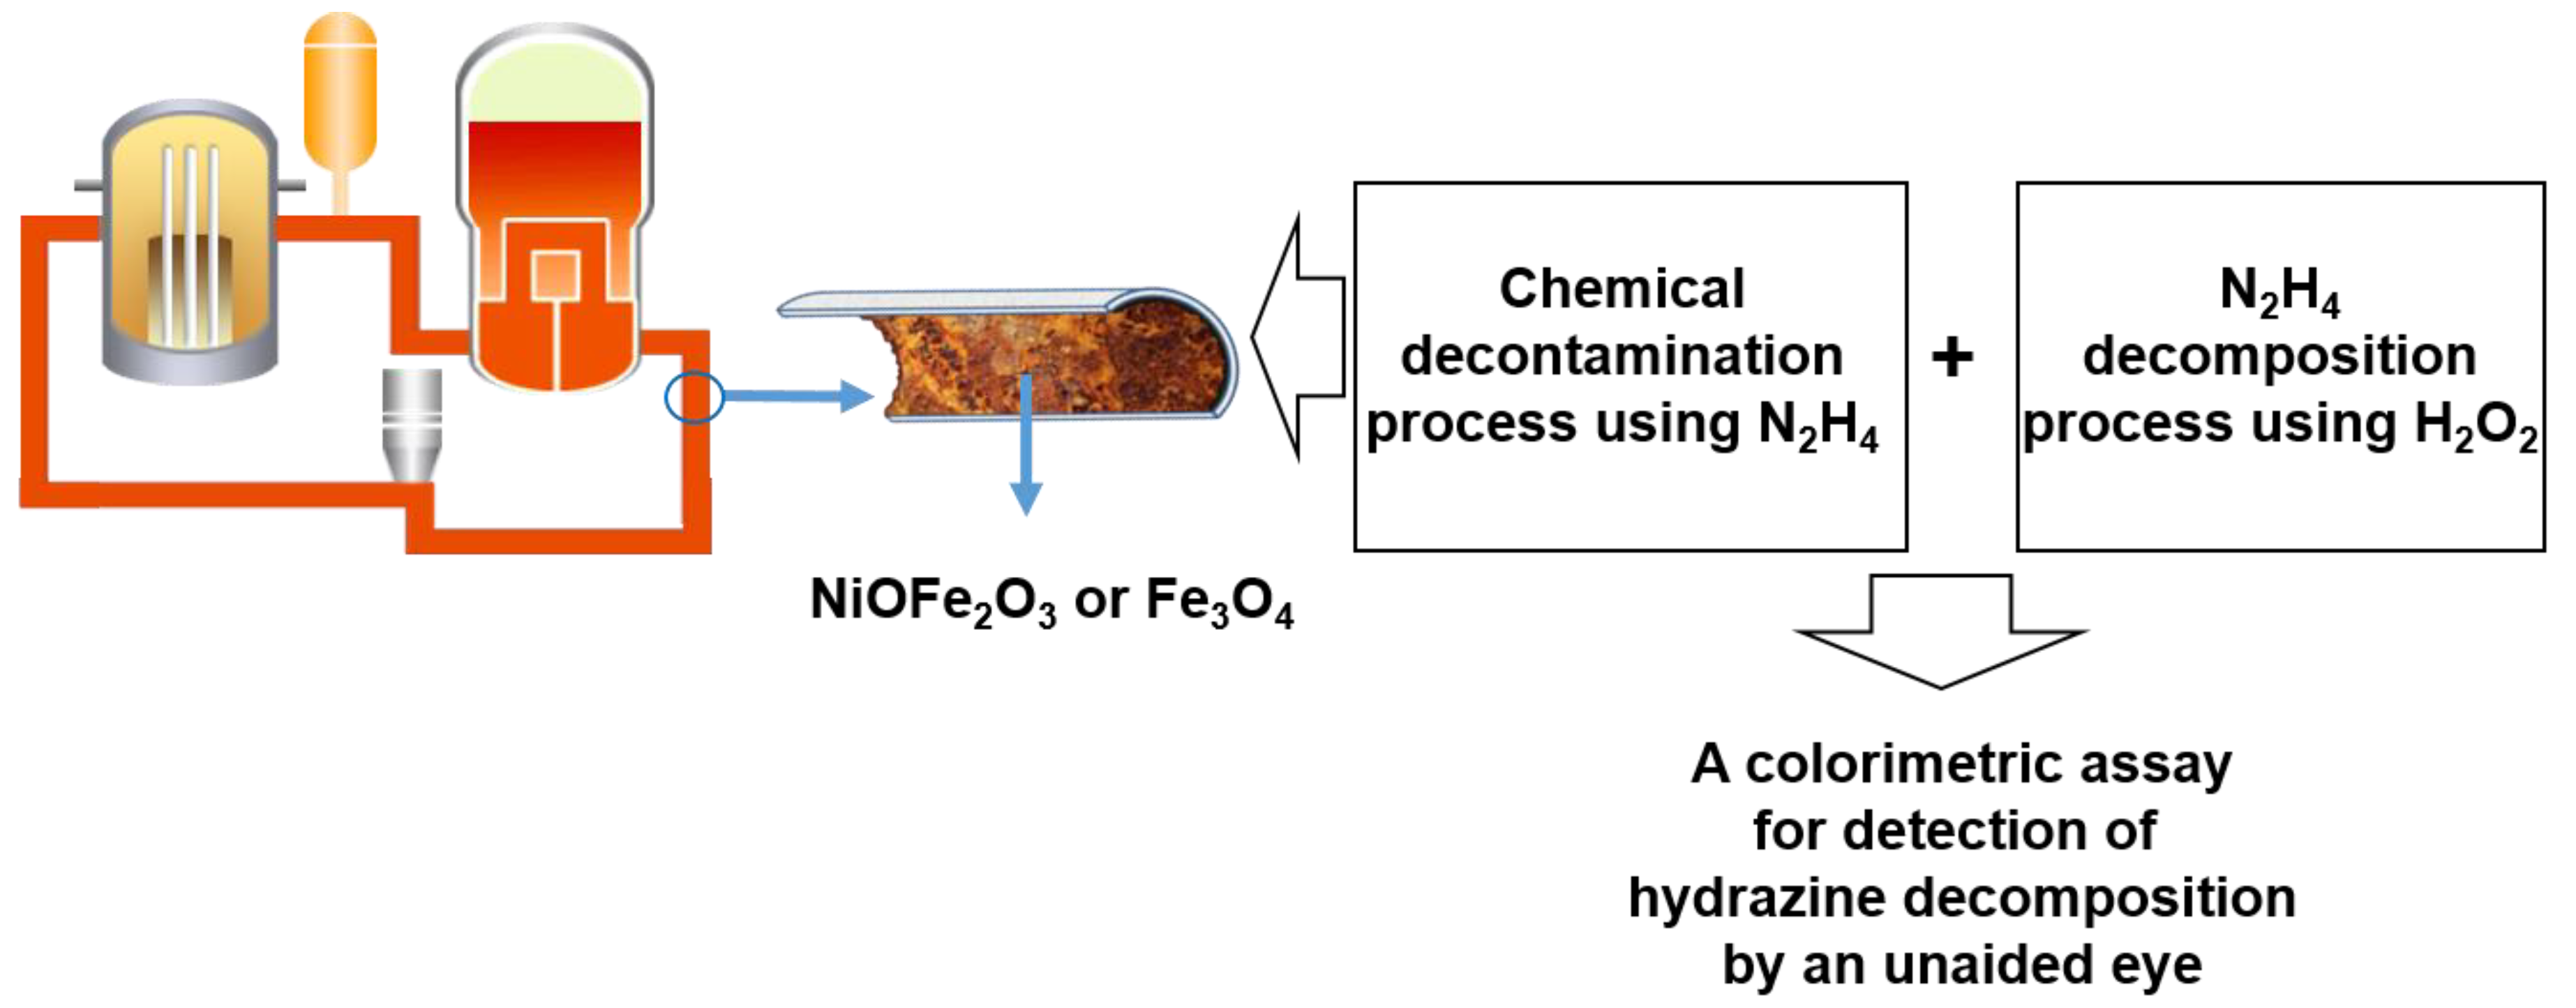
Many efforts have been made to understand the chemical decontamination using technology during the decommissioning and decontamination processes at nuclear facilities. A new concept in nuclear systems is the development of a chemical decontamination process without organic chelating reagents to decontaminate the reactor coolant system, loop, and pipelines with iron-rich oxides in nuclear facilities. Our group developed an effective in-situ system for chemical decontamination in which so-called hydrazine-based reductive metal ion decontamination was capable of dissolving metal oxides by protonation, surface complexation, or reduction. A solution containing hydrazine and an inorganic acid such as sulfuric acid made it possible for hydrogen to break the bonds between iron and oxygen via protonation, providing electrons for the reduction of insoluble ferric ions to soluble ferrous ions in an acidic condition [
21].
Currently, a hydrazine-based reductive metal ion decontamination process is being developed to demonstrate its decontamination performance and applicability to the corrosion occurring in the nuclear reactor coolant system and steam generators with iron-rich forms, which is one of the major problems faced in nuclear facilities. Traditionally, these processes were minimized by keeping metal surfaces clean by chemical removal using an acceptable scavenger such as hydrazine. Hydrazine decomposition using hydrogen peroxide will subsequently be triggered to produce nitrogen and water, responding to the volume reduction of secondary waste. Here, ferrous and ferric ion from iron-rich oxides in the pipelines and internal loop will enhance the hydrazine decomposition as oxidants of catalysts. The reaction between hydrazine and hydrogen peroxide is given by Equation (1).
We elucidate a total schematic diagram for a colorimetric assay for the detection of hydrazine decomposition of internal surfaces with an oxidation of vessels or pipelines in a nuclear power plant in
Figure 1.
3.2. Hydrazine
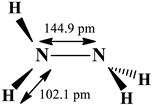
Hydrazine is an inorganic chemical reagent with the formula N
2H
4. There is a colorless liquid in which each H
2N–N subunit is pyramidal in shape. The N–N and N–H distances are 1.45 Å (144.9 pm) and 1.02 Å (102.1 pm), respectively. However, hydrazine has a relatively high toxicity and is dangerously unstable. For this reason, it is usually managed while in a solution, for safety.
Table 1 presents the properties and chemical structure of hydrazine. Hydrazine is widely used as a polymer foaming agent, including as a precursor to polymerization in pharmaceuticals and catalysts [
22,
23]. Hydrazine is used in processes including the production of spandex fibers, photographic developers, semiconductor manufacturing, and heat stabilizers. It is also widely used as an oxygen scavenger and corrosion protection in boiler water systems [
24]. Lately, hydrazine has been widely used to dissolve materials for solar cell applications [
25,
26].
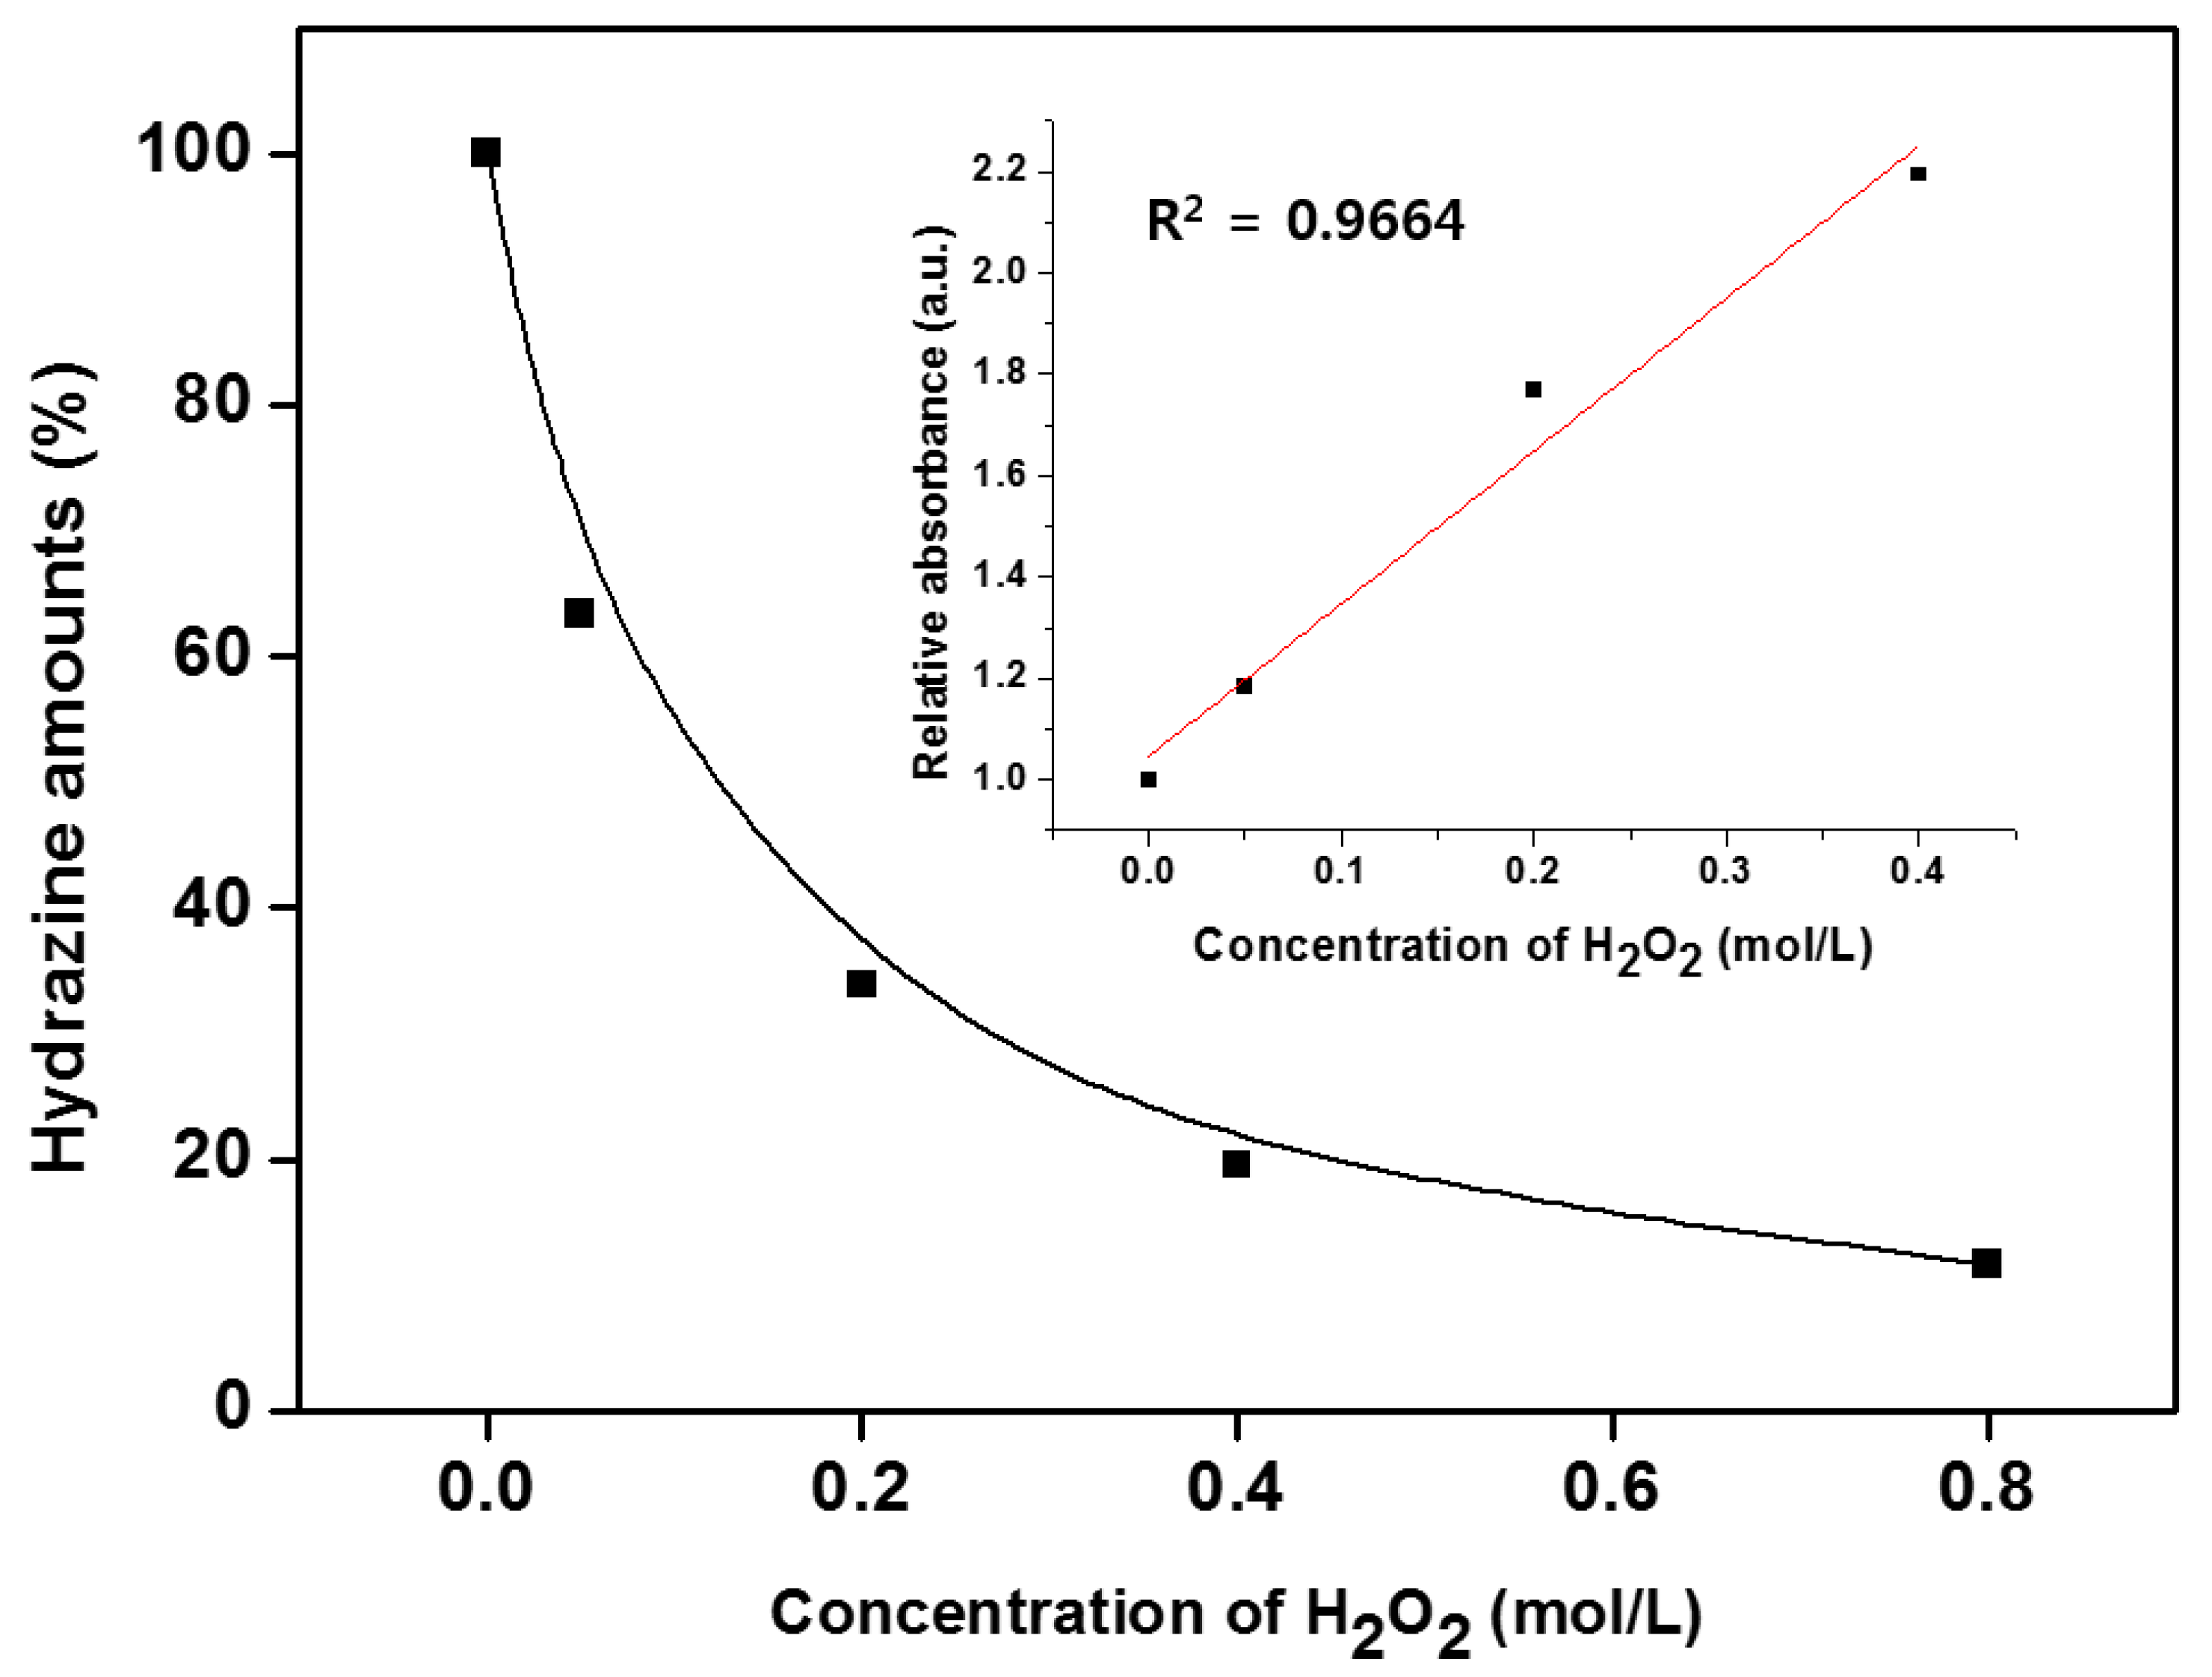
3.3. Effect of H2O2 Doses and Kinetics
As shown in
Figure 2, the decomposition of hydrazine caused by H
2O
2 was found to be significantly dependent on the H
2O
2 concentration manners. As the initial H
2O
2 concentration increased, the intensity of absorbance at 455 nm was reduced significantly due to increased amounts of hydroxyl radicals. For 0.025 M of hydrazine, the decrease in absorbance at 455 nm reached a maximum upon the addition of 0.8 M H
2O
2. The impact of the initial concentration of H
2O
2 on color change kinetics was investigated. As shown in the insert in
Figure 2, the dependence on H
2O
2 concentration was shown to be first order for low concentrations with a correlation coefficient up to 0.9664.
3.4. Colorimetric Method and Fenton/Fenton-Like Reaction
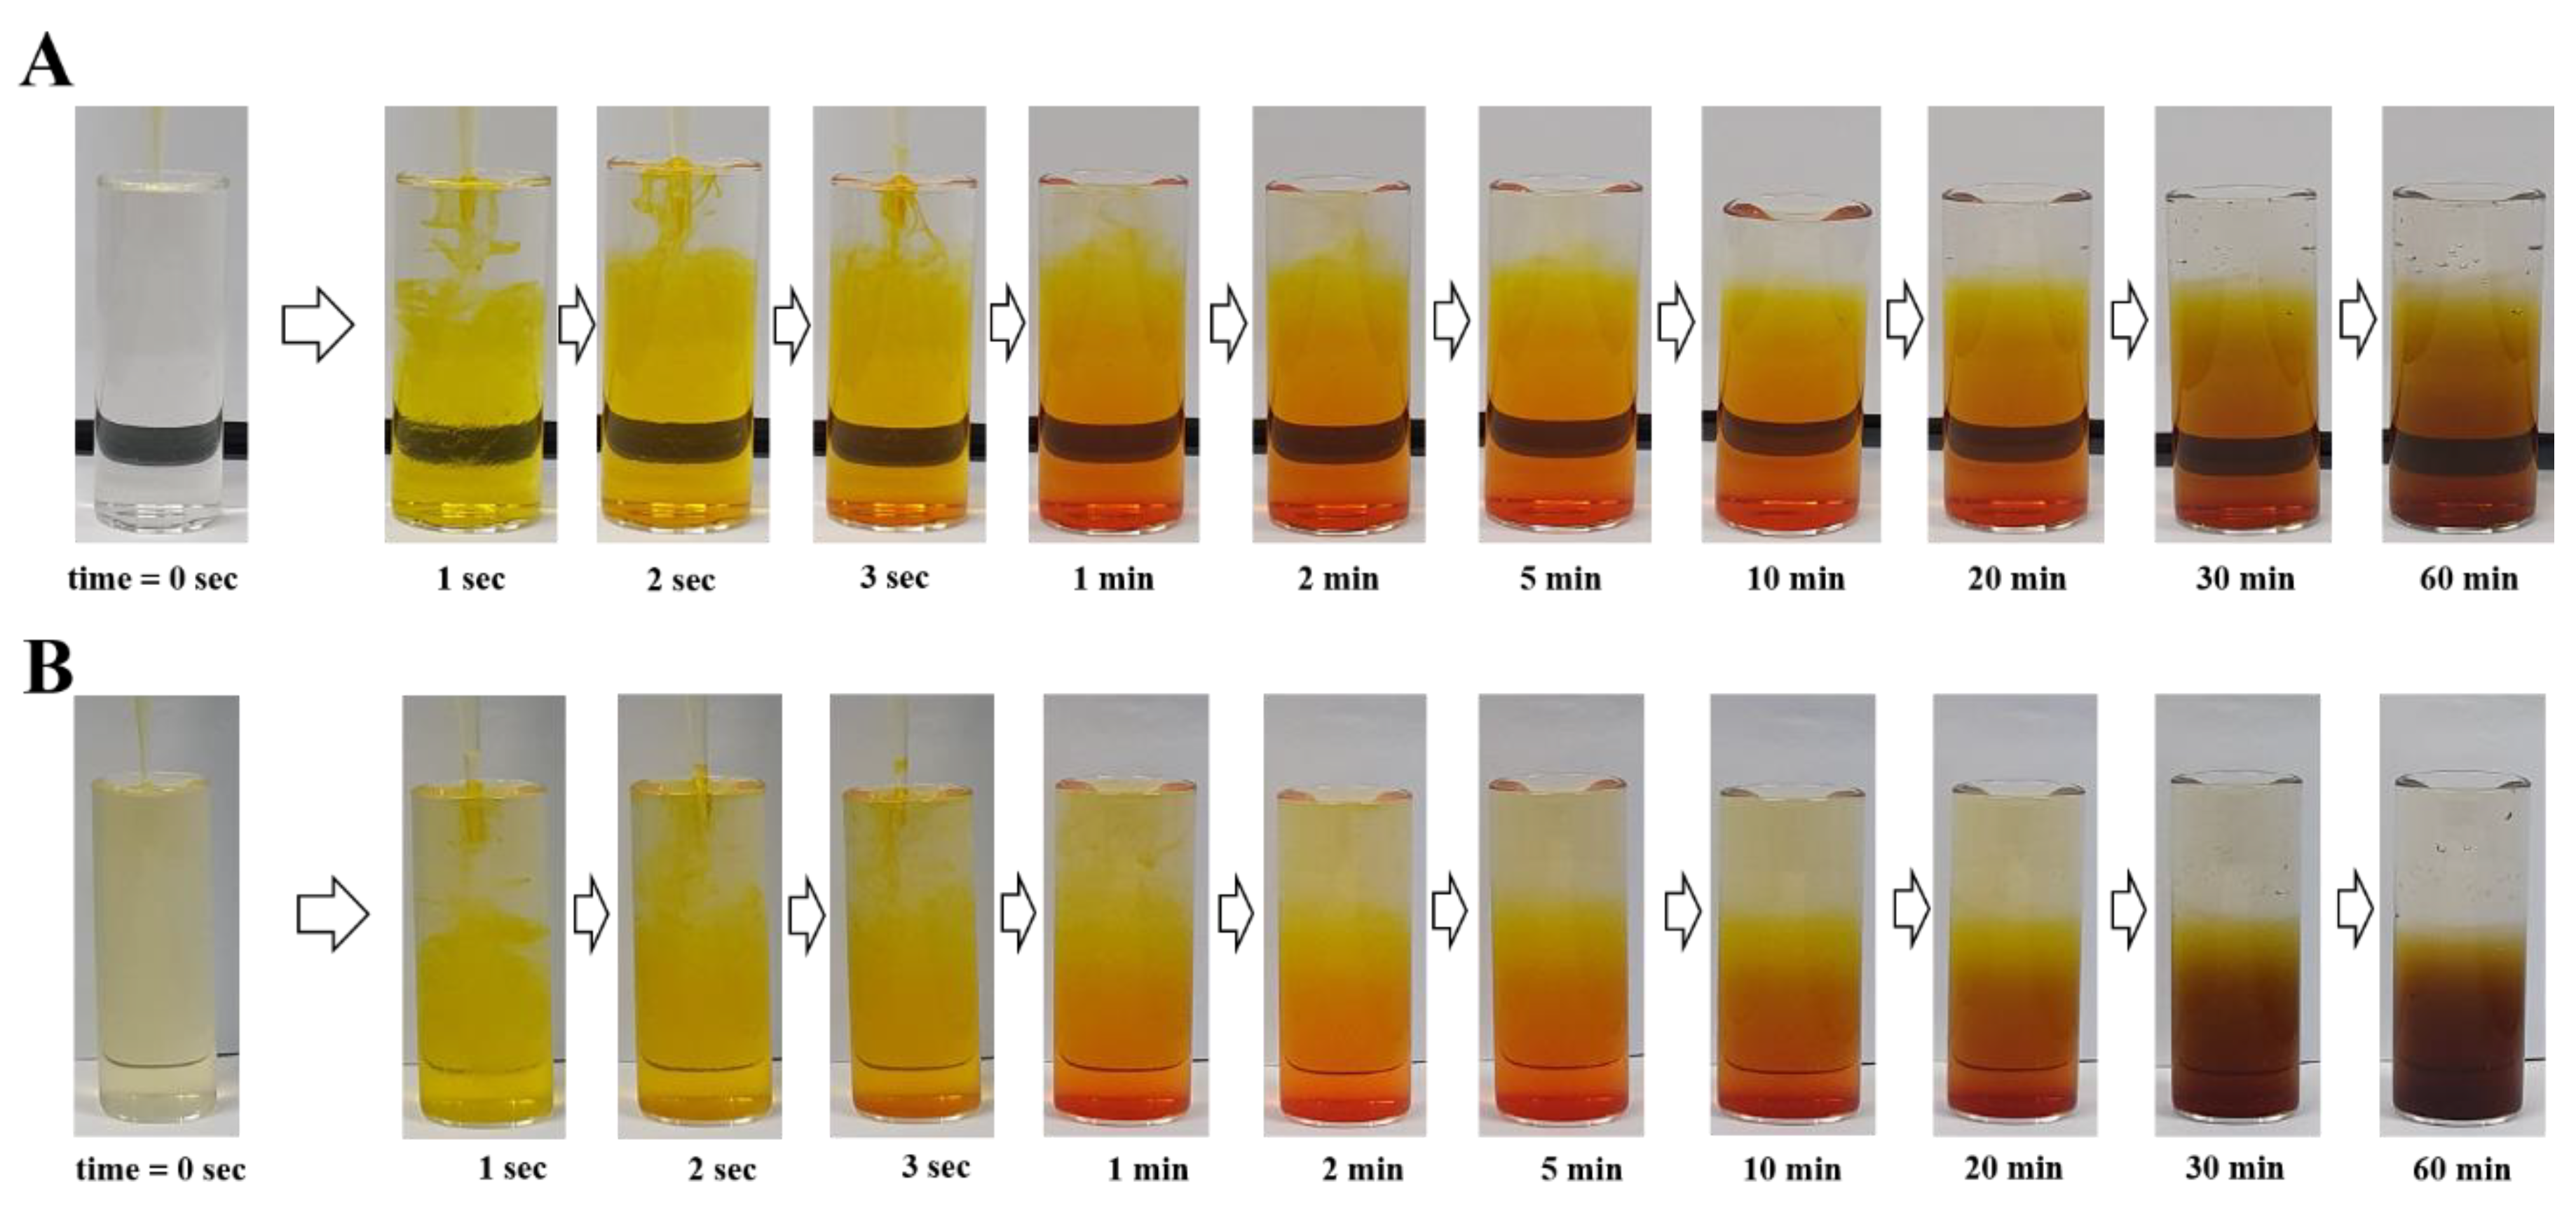
To understand the photo-physical properties, the color change of the azine complex aqueous chemo-indicator for the measurement of ferrous ions for hydrazine decomposition was investigated, as shown in
Figure 3A,B. In the presence of Fe
2+ or Fe
3+, the color changed from yellow to dark orange with increasing Fe
2+ or Fe
3+ concentrations, which could be monitored by the unaided eye within 30 min and finally changed to dark brown. A colorimetric sensor for hydrazine with high sensitivity to
p-dimethylaminobenzaldehyde within 30 min at ambient temperature is presented.
Notably, the decomposition of hydrazine using Fenton (Fe2+/H2O2) and Fenton-like (Fe3+/H2O2) reactions is demonstrated in Equations (2)–(8). The Fenton reaction uses ferrous ions to react to hydrogen peroxide, triggering hydroxyl radicals with dominant oxidizing capabilities to decompose hydrazine, as shown in Equations (2)–(9). Here, R represents N2H4.
During the reaction in this system, ferric ions were formed, which could be reacted to make ferrous ions. The reaction of hydrogen peroxide with ferric ions was referred to as a Fenton-like reaction, as shown in Equations (6)–(9).
Both Fenton and Fenton-like reactions should be effective, little work has been done on the Fenton-like reaction of hydrazine decomposition. This study suggested that the pipelines and internal loops of the Fenton/Fenton-like reaction for a colorimetric method could be used for the detection of hydrazine decomposition for chemical decontamination process with surface iron and rust in nuclear facilities.
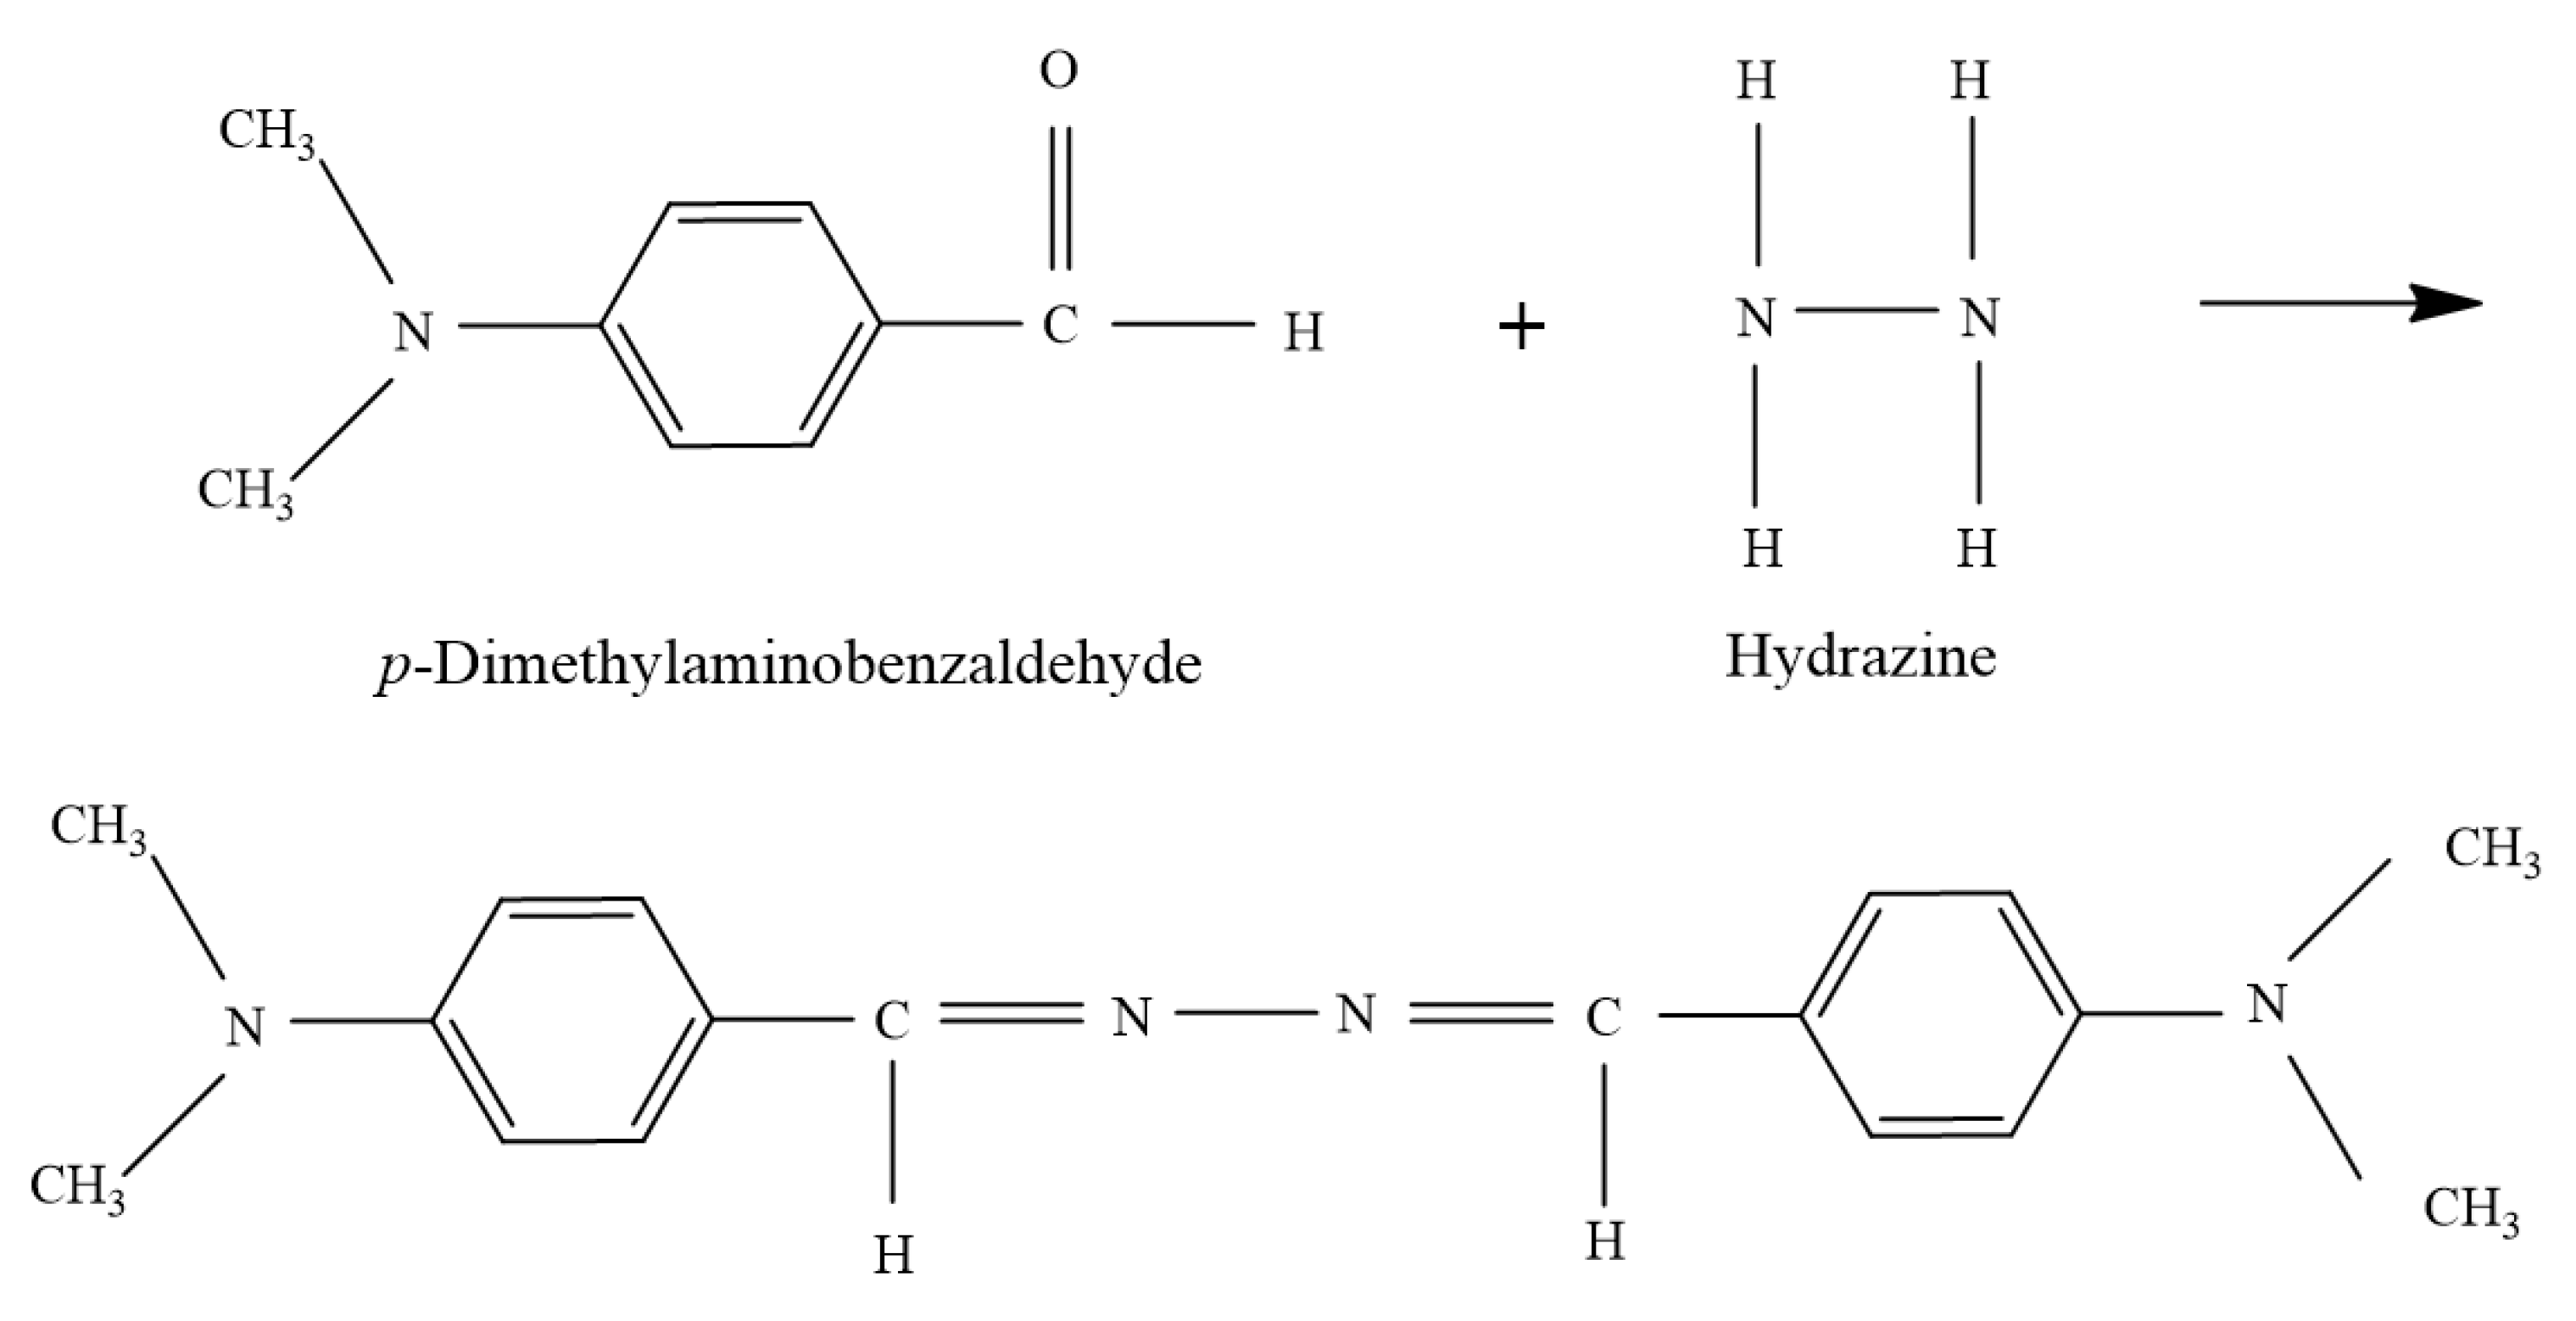
The proposed method is based on yellow color change by the reaction of hydrazine with
p-dimethylaminobenzaldehyde to form an azine complex such as
p-dimethylaminobenzaldazine with high selectivity and sensitivity. The yellow colored complex formed was stable and had a maximum absorption at 455 nm, which was detected by a UV-VIS detector with 1 cm optical path length. The presence of hydrogen peroxide and metal ions in the hydrazine solution did not interfere with the analysis (
Figure 4).
3.5. A Colorimetric Assay for Hydrazine Decomposition
The influence of different metal ions, such as Fe
2+, Fe
3+, Mn
2+, Cr
6+, and Ni
2+, on the degree of hydrazine decomposition in the presence of H
2O
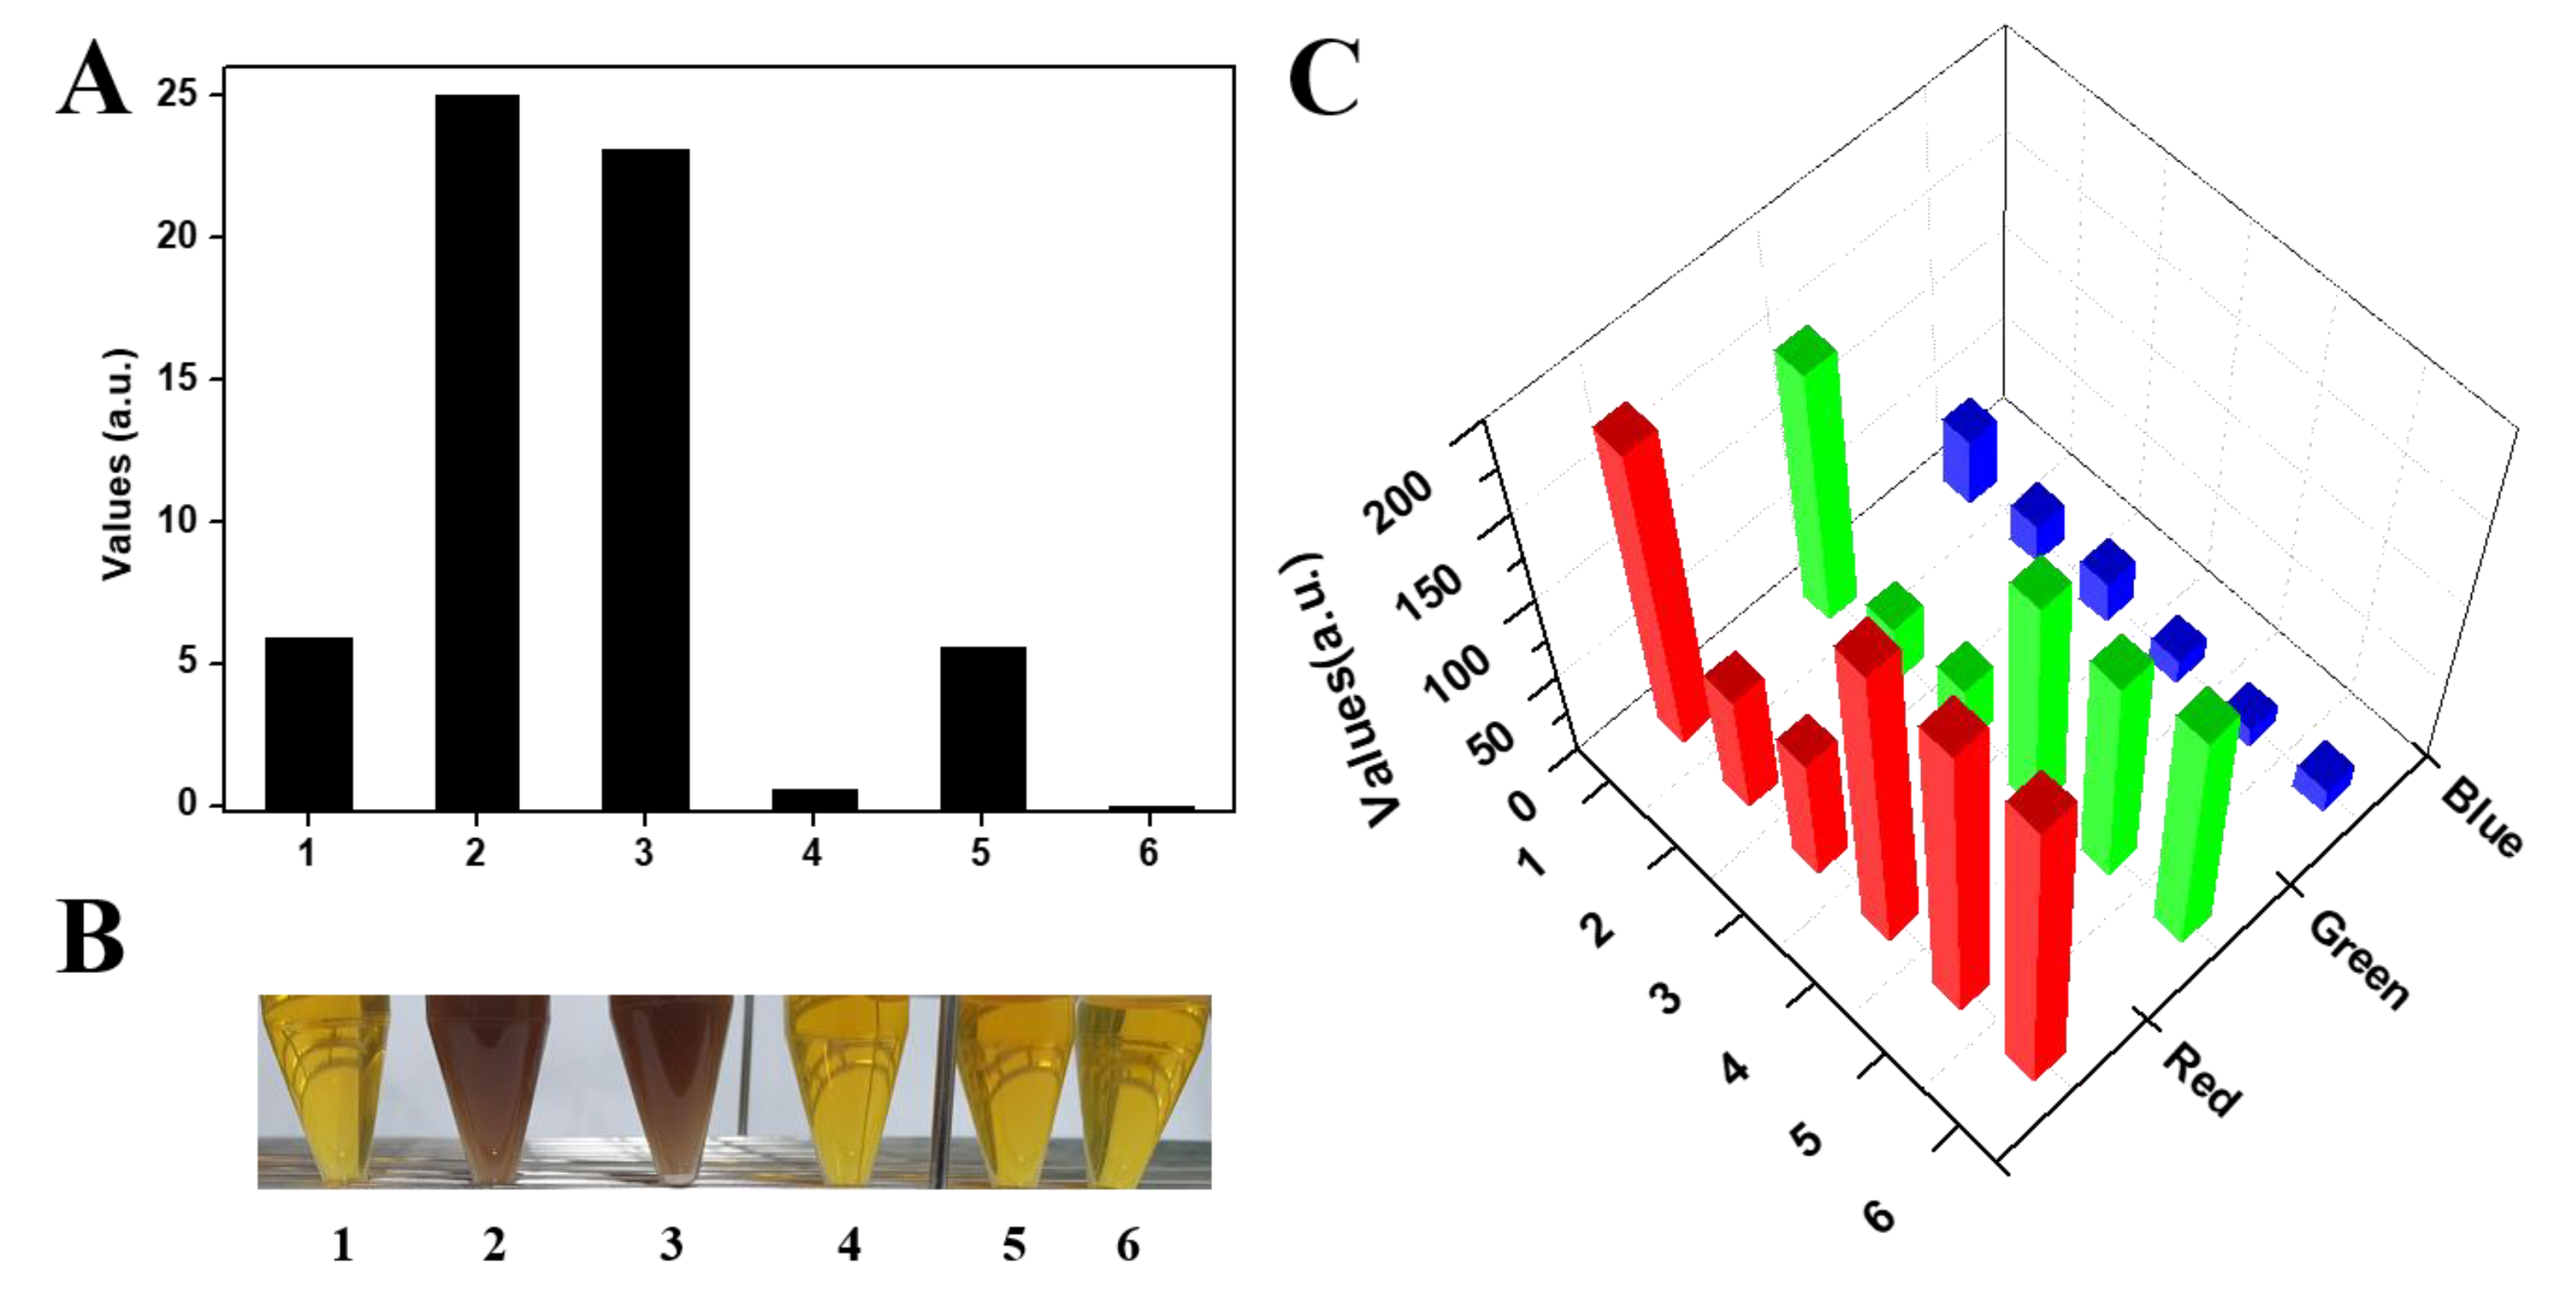
2 was elucidated. As shown in
Figure 5A, the decomposition of hydrazine was relatively high at Fe
2+ or Fe
3+, while Mn
2+, Cr
6+, and Ni
2+ were not changed compared to the control. It was important that the selective color change from dark orange to brown, induced by Fe
2+ or Fe
3+ sample solutions, be easily discernible by the unaided eye. Notably, no significant color change was observed upon the addition of cations other than Fe
2+ or Fe
3+. The presence of Fe
2+ or Fe
3+ could be readily distinguished by the unaided eye, as shown in
Figure 5B. These results indicated that the degree of hydrazine decomposition had a better relationship with Fe
2+ or Fe
3+ than other metal ions. As shown in
Figure 5C, each RGB value was measured at specific sample area and the corresponding digital image, using ImageJ software, was averaged to get the mean values in plot histograms. In addition, the values of the digital images were colorimetrically separated and converted into red (R), green (G), and blue (B). The RGB values formed a three-dimensional vector (ΔR, ΔG, and ΔB) and were analyzed from the RGB values before and after activity with different metal ions. Most importantly, the blue value (B) was unchanged in the presence of the Fe
2+ or Fe
3+ ion. However, the samples with Fe
2+ or Fe
3+ showed significant changes in terms of decreased values in red (R) and green (G) compared to the control. This result suggests that on-site detection and determination using a colorimetric assay can be easily confirmed by the unaided eye, even when Fe
2+ or Fe
3+, such as in case of magnetite, exists in unknown conditions.
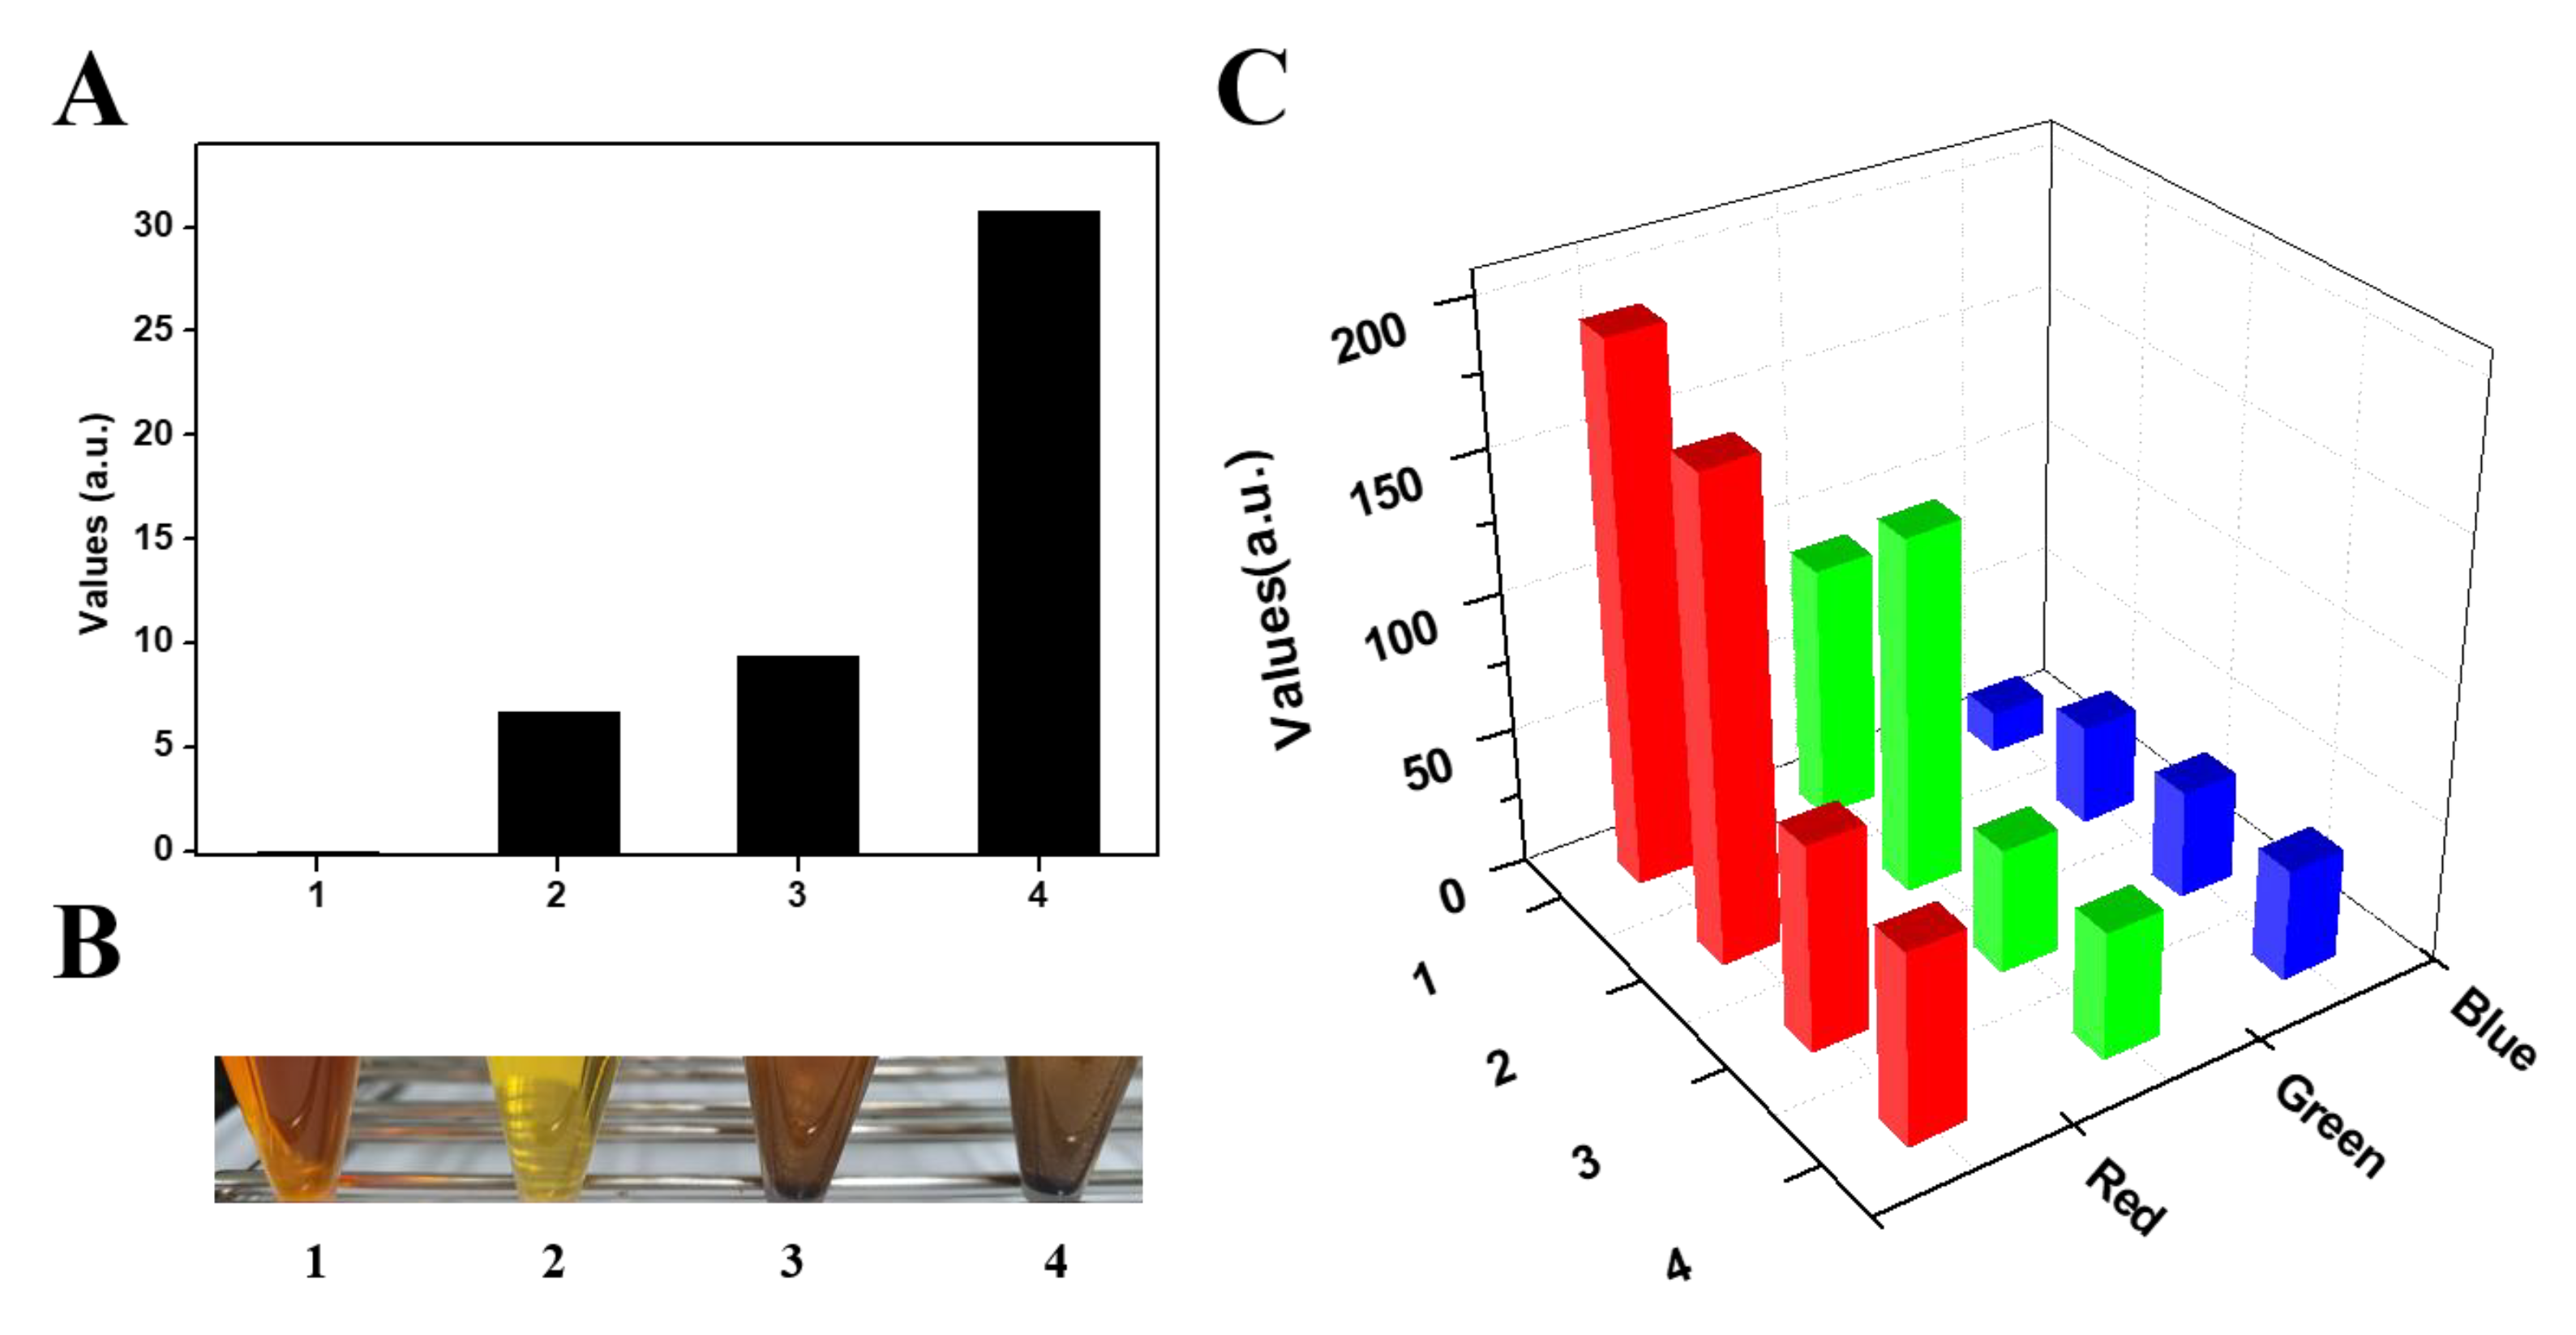
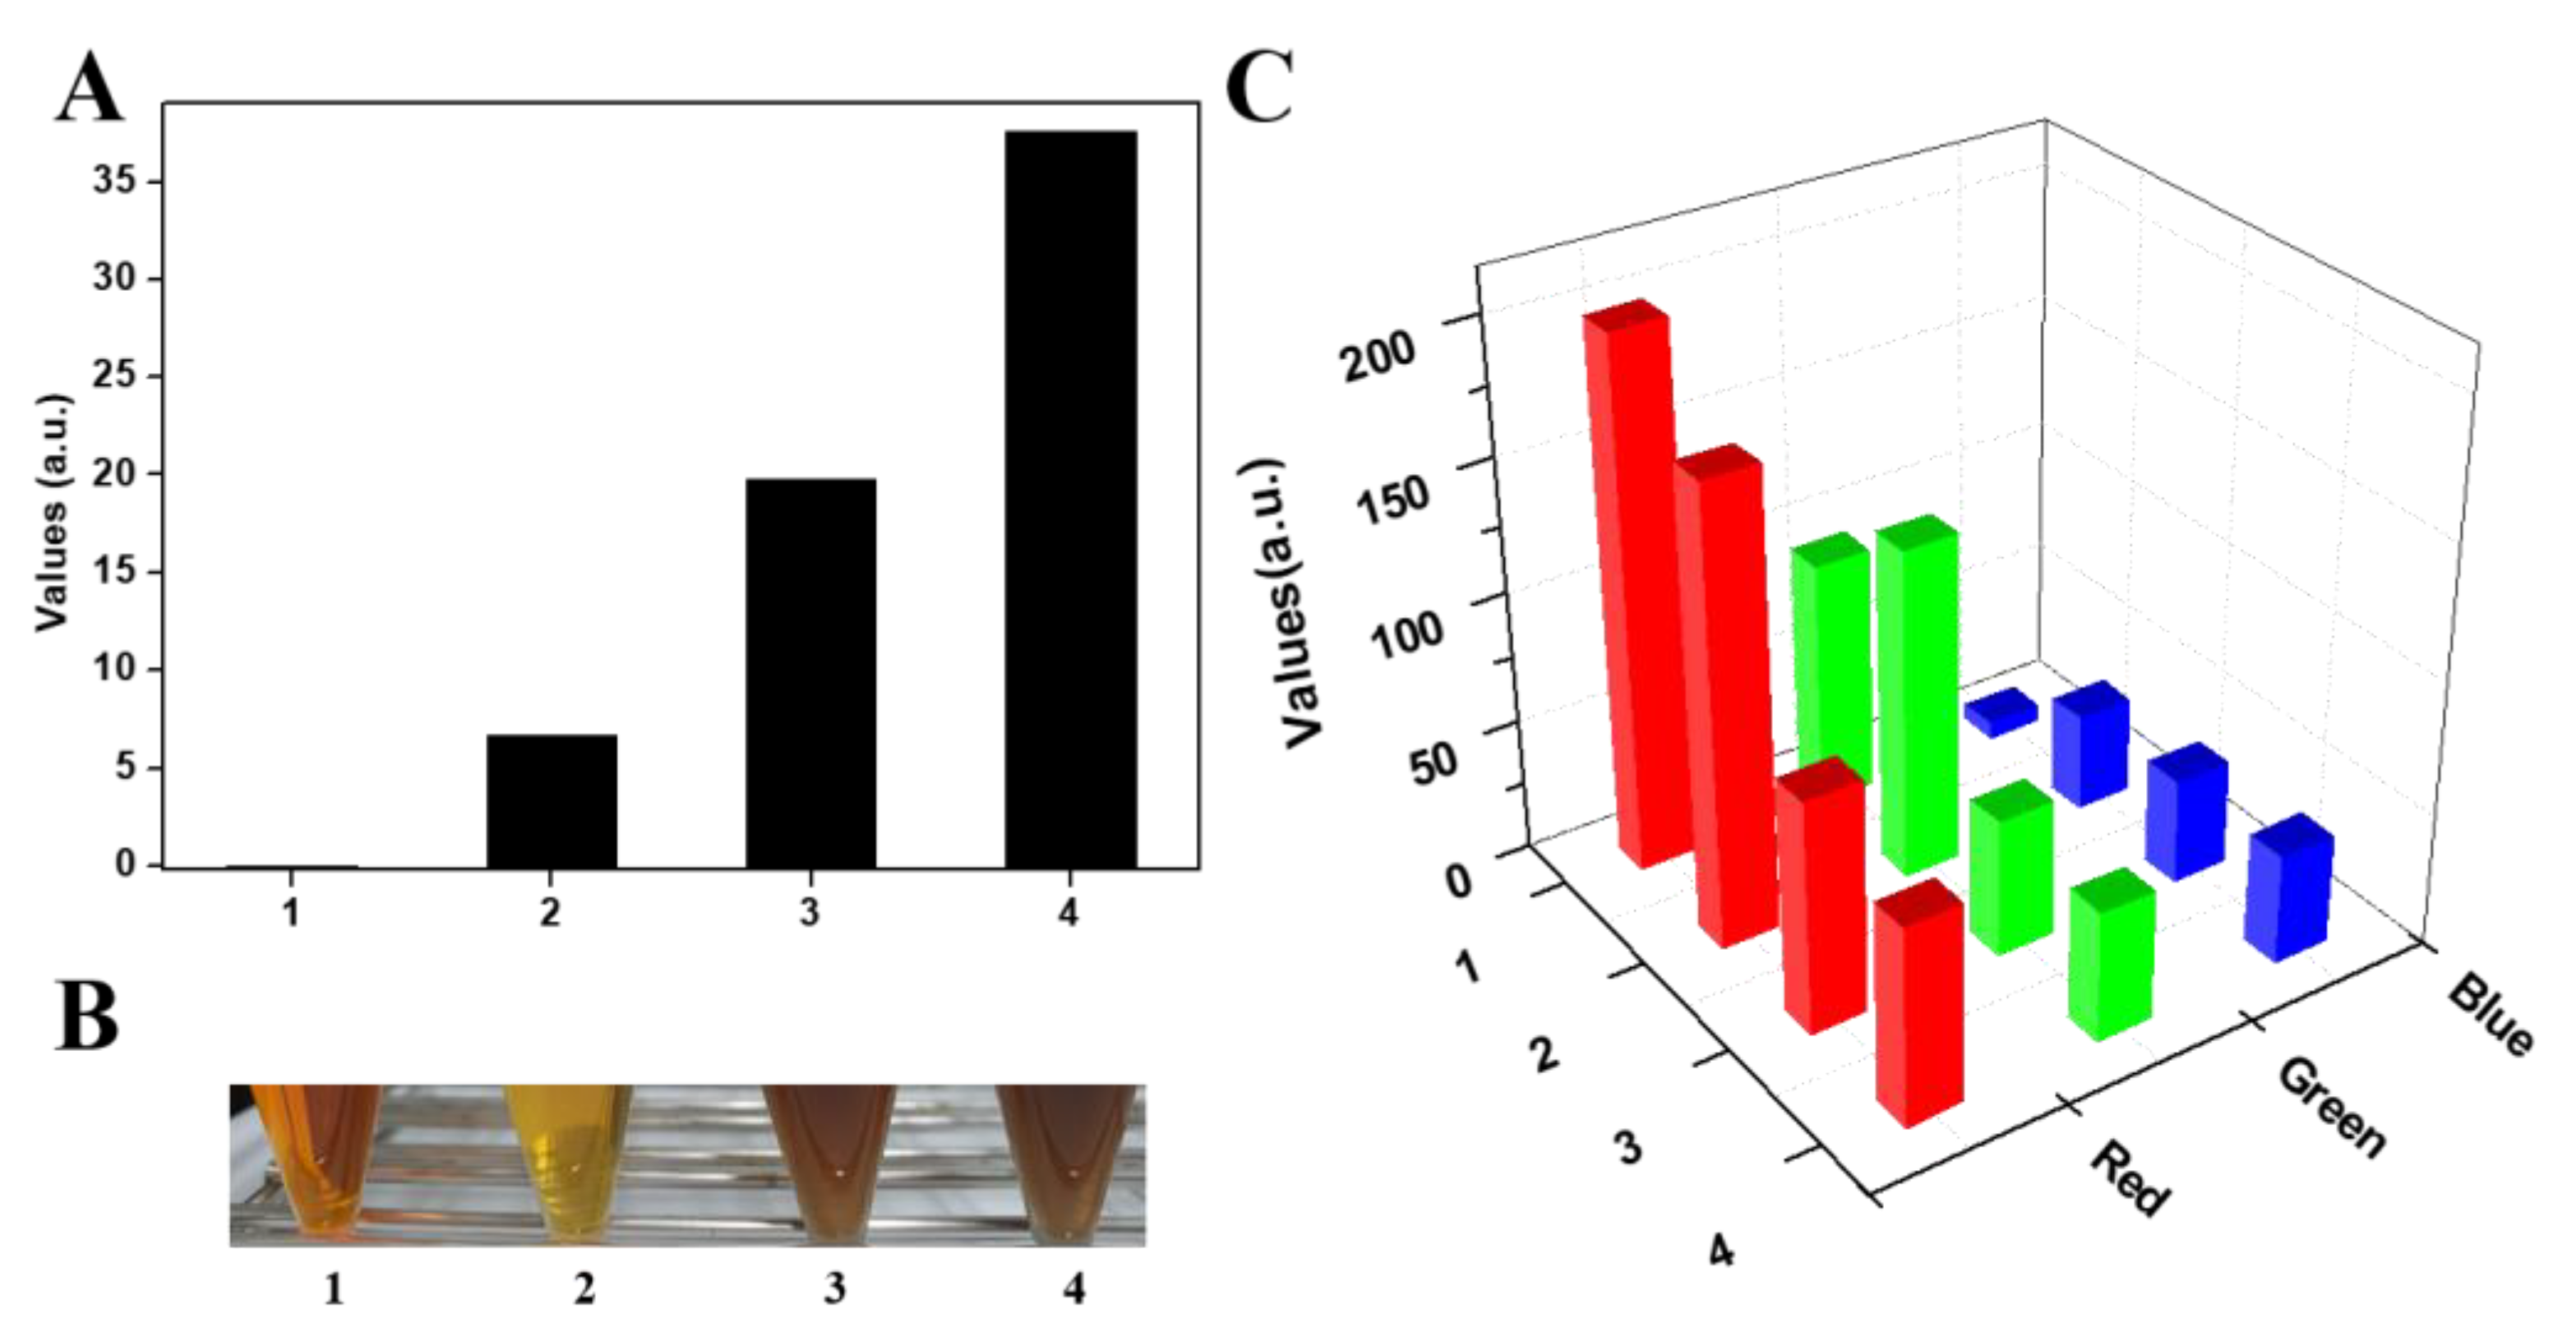
As shown in
Figure 6A and
Figure 7A, the decomposition of hydrazine was relatively high at concentrations of 32 ppm, compared to 2 ppm, in the presence of Fe
2+ or Fe
3+. This suggests that hydrazine decomposition could be triggered by hydroxyl radicals generated in the presence of both Fe
2+ or Fe
3+ and H
2O
2. As shown in
Figure 6B and
Figure 7B, the color changes of the samples in the presence of different Fe
2+ or Fe
3+ concentrations were investigated using RGB values. The red (R) and green (G) significantly increased in concentration-dependent manners in the presence of Fe
2+ or Fe
3+, while the blue (B) value was nearly unchanged compared to the control. Therefore we propose that a colorimetric assay for detection of hydrazine decomposition for a chemical decontamination process would be convenient and efficient for Fe
2+ or Fe
3+ detection. The time-sequential results of color change in the presence of Fe
2+ or Fe
3+ are presented in
Figures S1 and S2. In the presence of Fe
2+ or Fe
3+, the color changed from yellow to dark orange with increasing Fe
2+ or Fe
3+ concentration, which could be analyzed by the unaided eye within 30 min and before finally changing to dark brown. The reaction at 32 ppm of Fe
2+ or Fe
3+ concentration was faster than at 2 ppm.
4. Conclusions
We successfully developed a simple and rapid colorimetric method for the detection of hydrazine decomposition in chemical decontamination processes, applicable to the pipelines and internal loops in a nuclear power plant. Color changes were easily observed with the unaided eye when hydrazine was present in the decontamination process. This was directly related to the hydrazine concentration. We demonstrated that the hydrazine in this system is an important reducer and reagent for the determination of decontamination in a nuclear facility. Spectrophotometry evaluation of successful decontamination in a nuclear facility was one of the first analytical methods that enabled the determination of hydrazine decomposition. This method is an important tool due to its speed, availability, low-cost equipment, and simplicity—the analysis did not require highly-skilled manpower. The reaction between hydrazine and hydrogen peroxide was developed as a p-dimethylaminobenzaldehyde chemodosimetric system for the highly selective detection of iron-rich oxides such as Fe3O4 or NiOFe2O3 in the primary coolant system of a nuclear power plant. The spectral analysis gave rise to a solution color change from yellow to brown, which was visible to the unaided eye. In particular, the method presented here was simple and convenient, as well as being environmentally friendly and providing a very effective strategy for the assay of iron-rich oxide forms by using ‘off the shelf’ reagents. Note that the proposed p-dimethylaminobenzaldazine with a colorimetric assay revealed enhanced on-site and real-time determination performance compared to conventional methods. First, visual sensitivity was high as the unaided eye was the limit of detection of hydrazine decomposition; second, there was a reasonably rapid response time (<30 min); and, third, there was strong selectivity without any interference of other metal ions. We believe that the suggested strategy is a very simple, convenient, and fast method for the detection of hydrazine decomposition, and is a potential candidate for practical applications such as on-site investigation and real-time monitoring. Eventually, a colorimetric method will be able to demonstrate decontamination performance and applicability in actual in-situ system decontamination. This proposed colorimetric method paves the way for realizing effective decontamination performance for decommissioning nuclear facilities.


